ussec 2nd asian aquaculture feed formulation database … · 0900-0915 introduction and outline of...
TRANSCRIPT

USSEC 2nd Asian Aquaculture Feed Formulation
Database Workshop
Day 2:
Educational Modules
0900-0915 Introduction and Outline of Aquaculture Formulation Approach
0915-1015 Introduction to Formulation with Bestmix:Ingredients selectionNutritional specifications selectionLeast-cost formulation
1015-1030 Introduction to Feed Formulation Exercises
1045-1145 Feed Formulation Exercise: Formulating for a species
1145-1245 Educational Module #1: Ingredient Composition and Nutritive Value Adjusting the composition of ingredients on BestmixDevelopment of equations for predicting parametersVariability in the nutritive value of ingredients: Nutritional principles
1345-1445 Educational Module #2 Nutritional SpecificationsNutritional specifications – How they are developed, adjusted, updatedMeeting essential fatty acids and minor lipids requirements Effectively meeting phosphorus requirement
1445-1530 Feed Formulation Exercise (continued)
1545-1645 Presentation of feed formulations
1645-1715 Wrap-up, certificate presentation and group picture
Agenda

Educational Module #1: Ingredient Composition and Nutritive Value (1h)
• Adjusting the composition of ingredients on Bestmix
• Development of equations for predicting parameters
• Variability in the nutritive value of ingredients: Nutritional principles

Educational Module #2 Nutritional Specifications (1h)
Nutritional specifications – How they are developed, adjusted, updated
Meeting essential fatty acids and minor lipids requirements
Effectively meeting phosphorus requirement

Educational Module #3: Dietary Energy: Definitions and Requirements (30 min)
• Energy Partitioning Scheme
• Dietary Energy• Gross energy• Digestible energy• Metabolizable energy
• Bioenergetics Model • Energy Requirement Estimations• Theoretical feed requirement and feed conversion ratio

Educational Module #1: Ingredient Composition and Nutritive Value (1h)
• Adjusting the composition of ingredients on Bestmix
• Development of equations for predicting parameters
• Variability in the nutritive value of ingredients: Nutritional principles
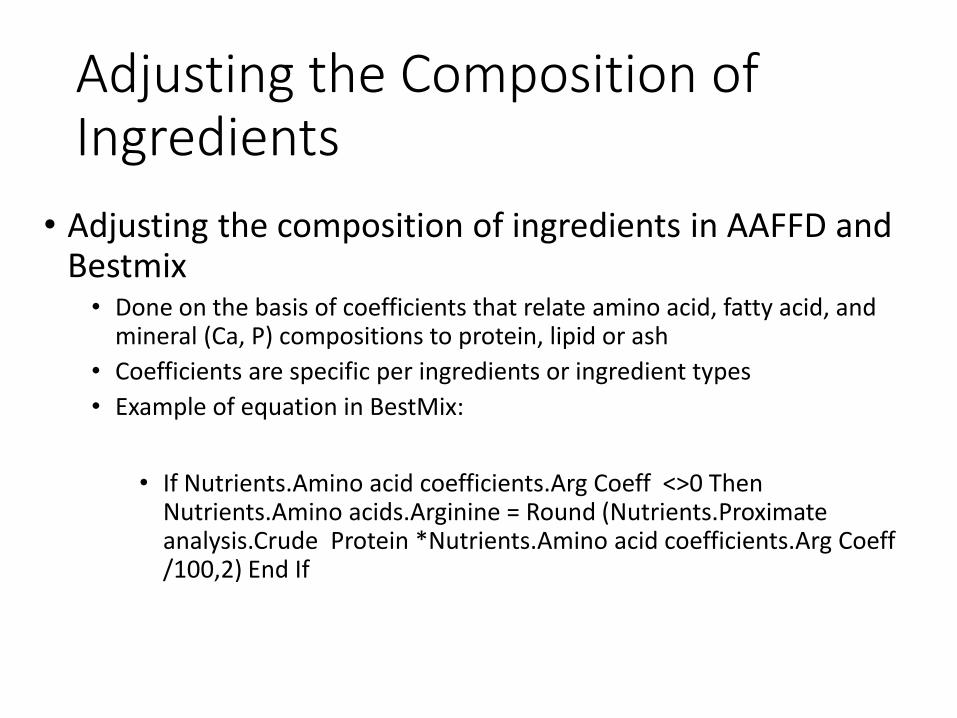
Adjusting the Composition of Ingredients
• Adjusting the composition of ingredients in AAFFD and Bestmix• Done on the basis of coefficients that relate amino acid, fatty acid, and
mineral (Ca, P) compositions to protein, lipid or ash
• Coefficients are specific per ingredients or ingredient types
• Example of equation in BestMix:
• If Nutrients.Amino acid coefficients.Arg Coeff <>0 Then Nutrients.Amino acids.Arginine = Round (Nutrients.Proximateanalysis.Crude Protein *Nutrients.Amino acid coefficients.Arg Coeff/100,2) End If

Variability of Lysine Concentration in Relation to Crude Protein
Content of US Soybean Meal Samples
Data courtesy of Paul Smolen and United Soybean Board

Gross Energy
Gross energy (GE) is the commonly used term for enthalpy (H) of combustion in nutrition. However, as opposed to enthalpy, GE is generally represented by a + sign. GE content of a substance is usually measured by its combustion in a heavily walled metal container (bomb) under an atmosphere of compressed oxygen. The method is referred to as bomb calorimetry.
The GE content of an ingredient or a compounded diet depends upon its chemical composition.
The mean values of GE of carbohydrates, proteins and lipids are 17.2, 23.6 and 39.5 kJ/g, respectively (Blaxter, 1989).
Minerals (ash) have no GE because these components are not combustible.

Bomb Calorimeter

Gross Energy (MJ/kg) =
Crude Protein (kg/kg) x 23.6 MJ/kg+ Lipids (kg/kg) x 39 MJ/kg+Total Carbohydrate (kg/kg) x 17 MJ/kg
Gross Energy (MJ/kg) = 0.32 * 23.6 + 0.06 * 39 + 0.4 * 17For a 32% CP, 6% fat and 40% total CHO feed
Gross energy (MJ/kg)*1000 / 4.184 = Gross energy (kcal/kg)

Digestible Energy (MJ/kg) =
Gross energy (MJ/kg) x ADC Gross Energy
or
Crude Protein (kg/kg) x 23.6 MJ/kg x ADC Crude Protein
+
Lipids (kg/kg) x 39 MJ/kg x ADC Lipids
+
Total Carbohydrate (kg/kg) x 17 MJ/kg x ADC Total CHO
Species specificCarnivorous vs. omnivorous vs. carp vs. shrimp?
Species specificCarnivorous vs. omnivorous vs. carp vs. shrimp?

Digestible Energy (MJ/kg) =
Crude Protein (kg/kg) x 23.6 MJ/kg x ADC Crude Protein
ADC crude protein: 0.85 to 0.9
+
Lipids (kg/kg) x 39 MJ/kg x ADC Lipids
ADC Lipids = 0.85-0.95
+
Total Carbohydrate (kg/kg) x 17 MJ/kg x ADC Total CHO
ADC total CHO = 0.4 to 0.7(depends on fiber level, heat processing, species)

Digestible Energy (MJ/kg) (Starch +sugars) =
Crude Protein (kg/kg) x 23.6 MJ/kg x ADC Crude Protein
+
Lipids (kg/kg) x 39 MJ/kg x ADC Lipids
+
Starch+ Sugars (kg/kg) x 17 MJ/kg x ADC Total Starch+Sugars
Species specificCarnivorous vs. omnivorous vs. carp vs. shrimp?

Digestible Energy (MJ/kg) =
Crude Protein (kg/kg) x 23.6 MJ/kg x ADC Crude Protein
ADC crude protein: 0.85 to 0.9
+
Lipids (kg/kg) x 39 MJ/kg x ADC Lipids
ADC Lipids = 0.85-0.95
+
Total Starch + Sugars (kg/kg) x 17 MJ/kg x ADC Total starch+sugars
ADC total starch+sugars = 0.6 to 0.95(depends on heat processing, species)

Equations in AAFFD and BestMix• 'Energy calculations
• Nutrients.Energy Aqua.Gross Energy -MJ = Round (23.6*Nutrients.Proximate analysis.Crude Protein /100+ 39*Nutrients.Proximate analysis.Crude Lipids /100 + 17*Nutrients.Proximate analysis.Total CHO /100 ,1)
• Nutrients.Energy Aqua.Gross energy -Kcal = Round (Nutrients.Energy Aqua.Gross Energy -MJ * 238.85,0)
• Nutrients.Energy Aqua.DE Carp = Round ((23.6*Nutrients.Proximate analysis.Crude Protein /100*Nutrients.App Diges Coeff ProxAqua.ADC DM -fish /100 + 39*Nutrients.Proximate analysis.Crude Lipids /100*Nutrients.App Diges Coeff Prox Aqua.ADC CP -fish /100 + 17*Nutrients.Proximate analysis.Total CHO /100*Nutrients.App Diges Coeff Prox Aqua.ADC GE - fish /100)* 238.85 ,0)
• Nutrients.Energy Aqua.DE Fish Carni = Round ((23.6*Nutrients.Proximate analysis.Crude Protein /100*Nutrients.App DigesCoeff Prox Aqua.ADC DM -fish /100 + 39*Nutrients.Proximate analysis.Crude Lipids /100*Nutrients.App Diges Coeff ProxAqua.ADC CP -fish /100 + 17*Nutrients.Proximate analysis.Total CHO /100*Nutrients.App Diges Coeff Prox Aqua.ADC GE - fish /100)* 238.85 ,0)
• Nutrients.Energy Aqua.DE Fish Omni = Round ((23.6*Nutrients.Proximate analysis.Crude Protein /100*Nutrients.App DigesCoeff Prox Aqua.ADC DM -fish /100 + 39*Nutrients.Proximate analysis.Crude Lipids /100*Nutrients.App Diges Coeff ProxAqua.ADC CP -fish /100 + 17*Nutrients.Proximate analysis.Total CHO /100*Nutrients.App Diges Coeff Prox Aqua.ADC GE - fish /100)* 238.85 ,0)
• Nutrients.Energy Aqua.DE Shrimp = Round ((23.6*Nutrients.Proximate analysis.Crude Protein /100*Nutrients.App Diges CoeffProx Aqua.ADC DM -fish /100 + 39*Nutrients.Proximate analysis.Crude Lipids /100*Nutrients.App Diges Coeff Prox Aqua.ADC CP -fish /100 + 17*Nutrients.Proximate analysis.Total CHO /100*Nutrients.App Diges Coeff Prox Aqua.ADC GE - fish /100)* 238.85 ,0)

Variability in the Nutritive Value of Ingredients: Nutritional Principles
• Most variability in nutritive value is associated with chemical damage/ degradation of proteins and lipids in the feed ingredients
• Damage can occur due to heat treatment, chemical reaction, oxidative rancidity and microbial action
• Some natural variability exists and mainly related to variability in raw material composition and seasonal variability, affecting nutrient levels (fatty acid, amino acids, minerals) and levels of anti-nutritional factors and contaminants
• Differences between species are probably minor, except for starch digestibility and fermentation of soluble fiber components and ability to use starch and sugars,

Feed Feces Digestibility
g/fish g/fish
Dry matter 100 25 100-25 75%
100
Protein 40 4 40-4 90%
40
Lipid 20 1 20-1 95%
20
Digestibility – Direct method (Total Collection Method)
Requires:
Very accurate estimate of feed consumption (e.g. over 24-72h)
Total collection of fecal material produced (e.g. over 24-72h)

Digestibility – Indirect method
Requires:
- Use of digestion indicator (marker) = 100% indigestible- Collection of representative samples fecal material produced
Apparent Digestibility Coefficient (ADC) = 1- (F/D x Di/Fi)
Feed Feces Digestibility %
% %
Dry matter 95 95 1-(95/95 x 1/4) 75
Protein 40 8 1-(8/40x 1/4) 95
.
Lipid 20 6 1-(6/20 x 1/4) 92.5
Marker 1 4 1-(4/1 x 1/4) 0
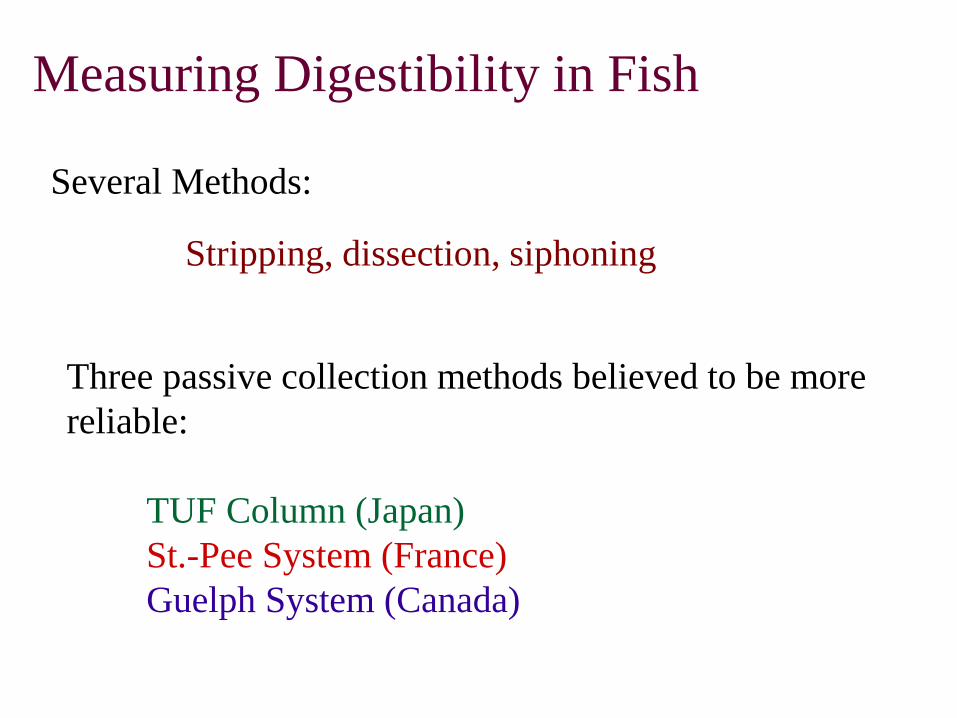
Measuring Digestibility in Fish
Several Methods:
Stripping, dissection, siphoning
Three passive collection methods believed to be more
reliable:
TUF Column (Japan)
St.-Pee System (France)
Guelph System (Canada)


St-Pée System (INRA, St-Pée-sur-Nivelle, France)
Choubert, Luquet, and de la Noue (1979)

Guelph System (Cho et al., 1982)

The Guelph System


Digestibility of Single Ingredients
Most ingredients cannot be fed alone
Test diet
70% Reference diet
30% Test ingredient
Acceptance (palatability)
Pelletability
Nutritional quality

Reference Diet %
Fish meal 30
Corn gluten meal 13
Soybean meal 17
Wheat middlings 27
Vitamin premix 1
Mineral premix 1
Fish oil 10
Digestion indicator 1
100

ADCingr= ADCtest + ((1-s)Dref/sDingr) (ADCtest-ADCref)
ADCingr= Apparent digestibility coefficient test diet
ADCref= Apparent digestibility coefficient reference diet
Dref= Nutrient content of reference diet
Dingr= Nutrient content of ingredient
s = Level of incorporation of ingredient in test diet
(e.g. 30%)
Equation - Digestibility

Apparent digestibility coefficients (%)
Ingredients Dry
Matter
Crude
Protein
Lipid Energy
Alfalfa meal 39 87 71 43
Blood meal
ring-dried 87 85 - 86
spray-dried 91 96 - 92
flame-dried 55 16 - 50
Brewer’s dried yeast 76 91 - 77
Corn yellow 23 95 - 39
Corn gluten feed 23 92 29
Corn gluten meal 80 96 - 83
Corn distiller dried soluble 46 85 71 51
Feather meal 77 77 - 77
Fish meal, herring 85 92 97 91
Meat and bone meal 70 85 - 80
Poultry by-products meal 76 89 - 82
Rapeseed meal 35 77 - 45
Soybean, full-fat, cook. 78 96 94 85
Soybean meal, dehulled 74 96 - 75
Wheat middlings 35 92 - 46
Whey, dehydrated 97 96 - 94
Fish protein concentrate 90 95 - 94
Soy protein concentrate 77 97 - 84

Feather Meal
Guelph System
ADC
Protein Energy
82-84% N/ASugiura et al. (1998)
58% 70%Cho et al. (1982)
Stripping
81-87% 76-80%Bureau (1999)
83% 81%Pfeffer et al. (1995)
HCl hydrolyzed feather meal

Poultry By-Products Meal
Guelph System
ADC
Protein Energy
68% 71%Cho et al. (1982)
Bureau et al. (1999) 87-91% 77-92%
74-85% 65-72%Hajen et al. (1993)
96% N/ASugiura et al. (1998)

1. Aquatic System – Fecal Collection System
2. Experimental Design – Experimental Dietary Design1. Focus on individual ingredient2. Focus on complete feed
3. Chemical Analyses1. Digestion indicator analysis2. Proximate, energy and chemical analysis
4. Digestibility Equations – Mathematical & statistical issues
5. Factors1. Batch variability for ingredients2. Environmental factors3. Species and lifestages differences
ISSUES (in order of importance)

Factors Affecting Digestibility of Nutrients?
Processing / Chemical Damage
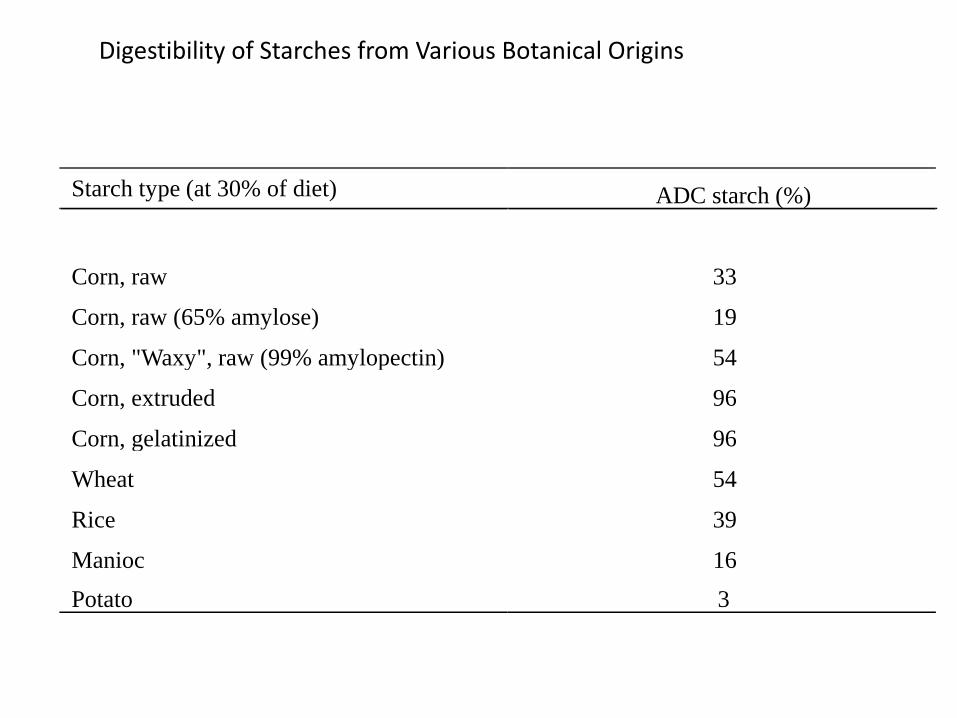
Digestibility of Starches from Various Botanical Origins
Starch type (at 30% of diet) ADC starch (%)
Corn, raw 33
Corn, raw (65% amylose) 19
Corn, "Waxy", raw (99% amylopectin) 54
Corn, extruded 96
Corn, gelatinized 96
Wheat 54
Rice 39
Manioc 16
Potato 3

http://www.jic.bbsrc.ac.uk/staff/cliff-hedley/Starch.htm
Starch Granule from a Pea Seed

Structure of Starch
http://www.jic.bbsrc.ac.uk/staff/cliff-hedley/Starch.htm


Blood Meal
Guelph System
ADC
Protein Energy
96-99% 92-99%Spray-dried
85-88% 86-88%Ring-dried
84% 79%Steam-tube dried
Bureau et al. (1999)
82% 82%Rotoplate dried
Different drying technique

Differences between Species?

Blood Meal
Guelph System
ADC
Protein Energy
96-99% 92-99%Spray-dried
85-88% 86-88%Ring-dried
84% 79%Steam-tube dried
Bureau et al. (1999)
82% 82%Rotoplate dried
Different drying technique

Feather Meal75-85% Crude Protein
Rich in:• Arginine (5.8%)• Cystine (3.8%)• Threonine (3.9%)
Poor in:• Lysine: (1.8%)• Histidine: (0.7%)• Tryptophan: (0.55%)
High variability in nutritional value!!!

Author ADC
DM CP GE
(%)
Cho et al. (1982) 75 58 70
Cho and Kaushik (1990) 81 77 77
Bureau et al. (1999) 79 81 76
Bureau et al. (1999) 80 81 80
Bureau et al. (1999) 82 81 83
Bureau et al. (1999) 84 87 80
Cheng et al. (2004) 80 77 77
Gaylord et al. (2008) - 87 88
Great Variability in Digestibility of Feather Meals from Various Origins by Rainbow Trout

Variability of raw materials
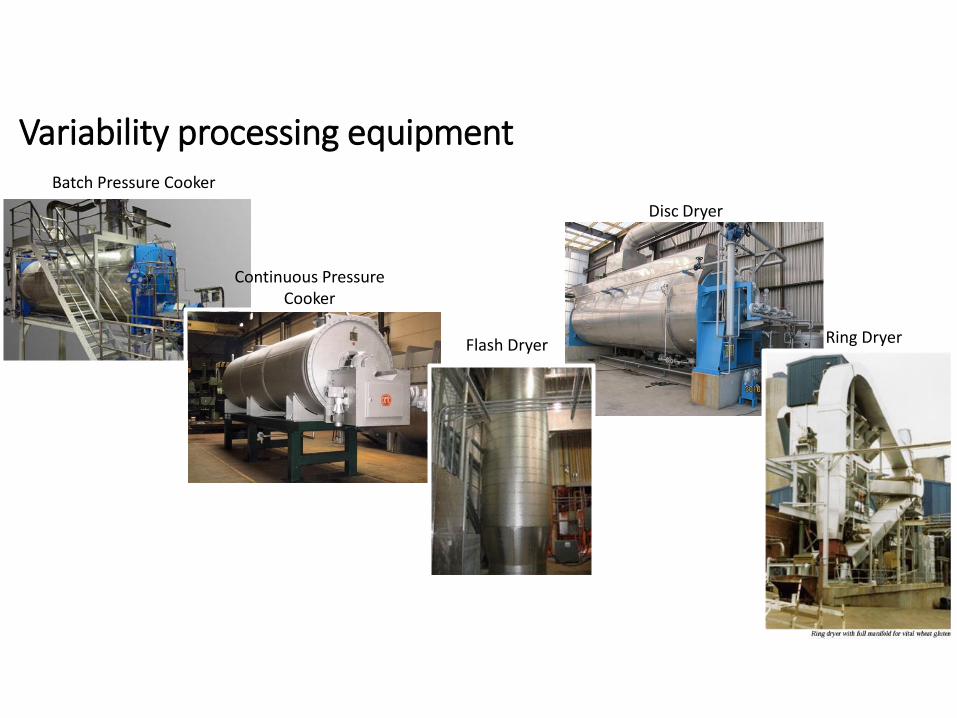
Continuous Pressure Cooker
Batch Pressure Cooker
Disc Dryer
Flash Dryer Ring Dryer
Variability processing equipment

Variability of the processing conditions affects available aminoacid content and level of cross-linked amino acid of no nutritivevalue.
Moritz and Latshaw (2001)

Formation of Cross-Linked Amino Acids

Disulfide Bonds
Cys-Cys(Cystine)Very stable (heat) & indigestible
Certain natural proteins, such as keratins and lysozymes, contain many disulfide bonds
Raw feather and hair (>90% keratins) Apparent digestibility coefficient = 0%Feather treated with heat + pressure Apparent digestibility coefficient > 70%
(Steam hydrolyzed, pressure cooked)Feather treated with keratinase Apparent digestibility coefficient > 70%
(enzyme-treated)
Moist heat + pressure break disulfide bonds
Overheated proteins (dried at high temperature) = creation of disulfide bonds
Flame-dried (drum) blood meal Apparent digestibility coefficient = 16%Spray-dried blood meal Apparent digestibility coefficient = 99%

Processing of two feather meals
• 2% sodium sulfite
• 0.05% bacterial enzyme
• 2:1 water:FeM ratio
• 24h incubation
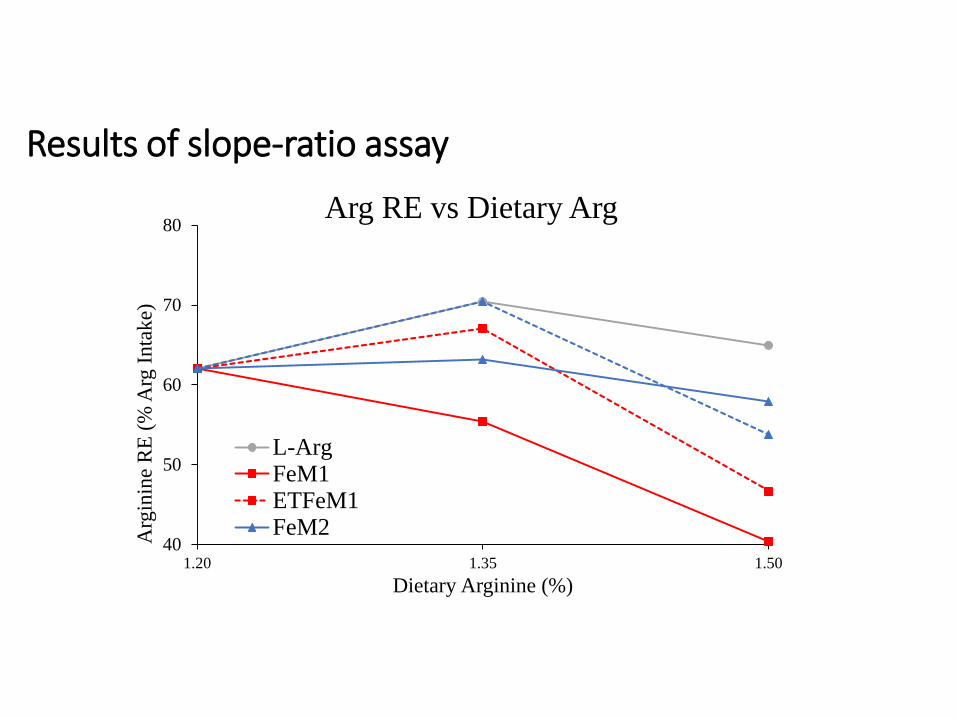
Slope-ratio assay carried out using the protocol of Poppi et al 2010.
• 12 diets
• 1 basal diet deficient in arginine (1.2%)
• 10 diets were formulated to contain 1.35% or 1.5% arginine by adding increasing amounts of L-Arg, FeMs, or PTFeMs
• 1 Control diet with fish meal (20%)
Slope-Ratio assay to assess the bioavailability of PTFEMs

50.0
60.0
70.0
80.0
90.0
100.0
110.0
1.20 1.35 1.50
Fee
d I
nta
ke
(g D
M/f
ish
)
Dietary Arginine (%)
Feed Intake vs. Dietary
Arginine
L-
Arg
FeM1
0.170
0.180
0.190
0.200
0.210
0.220
0.230
0.240
0.250
1.20 1.35 1.50
TG
C (
%)
Dietary Arginine (%)
TGC (Growth Rate) vs. Dietary
Arginine
L-Arg
FeM1
Results of slope-ratio assay
40
50
60
70
80
1.20 1.35 1.50
Arg
inin
e R
E (
% A
rg I
nta
ke)
Dietary Arginine (%)
Arg RE vs Dietary Arg
L-ArgFeM1ETFeM1FeM2
Results of slope-ratio assay

ADCingr= ADCtest + ((1-s)Dref/sDingr) (ADCtest-ADCref)
Assessing the apparent digestibility coefficient of the 12 diets

ADC of nutrients, gross energy and arginine
Source DM CP GE Arg
% % % %
1.2% Arginine
Diet 1 - 77.3 93.9 81.6 94.3
1.35% Arginine
Diet 2 L-Arg 77.3 93.7 81.7 95.1
Diet 4 FeM1 74.1 91.4 77.0 90.5
Diet 6 PTFeM1 78.5 94.6 82.1 94.8
Diet 8 FeM2 74.4 90.8 78.5 87.1
Diet 10 PTFeM2 78.8 94.6 82.7 93.3
1.5% Arginine
Diet 3 L-Arg 78.3 94.2 82.4 95.3
Diet 5 FeM1 74.4 89.6 77.9 83.7
Diet 7 PTFeM1 74.8 92.0 78.2 91.7
Diet 9 FeM2 75.2 88.2 78.5 80.9
Diet 11 PTFeM2 76.6 93.5 80.6 94.3
Diet 12 FM 69.1 86.9 75.4 85.2
Results of Digestibility Trial

Cross-linked amino acidsor Cys disulfide bonds
Native, undamaged protein Damaged protein

Educational Module #2 Nutritional Specifications (1h)
Nutritional specifications – How they are developed, adjusted, updated
Meeting essential fatty acids and minor lipids requirements
Effectively meeting phosphorus requirement

Nutritional Specifications
• Nutritional specifications are guidelines. The are defined carefully, reviewed occasionally, and generally quite strictly followed by feed formulators to ensure consistency of nutritional quality of feeds
• Nutrient restrictions are “practical” values taking into account :• Requirements of the animal
• Production objectives • Ex: Minimizing cost of formula while obtaining maximum performance
• Uncertainties • Ex: Uncertainties around estimate of nutritional composition,
nutritional requirements or potential losses of nutrients requiring use of certain safety margin

Ingredient Restrictions
• Generally driven by practical considerations and “gaps” in knowledge
• Considerations:
• Effect on processing (handling limitations, effect on pellet quality, etc.)
• Chemical and/or nutritional characteristics not easily or not adequately addressed through the current nutritional specifications
• Logistical, risk management and market issues (limited availability, contamination, variability, final product characteristics, customer concerns, export regulations, etc.)
• In general, the more we characterize the animals and the ingredients, the less important the ingredient specifications. However, some logistical considerations still always play a role
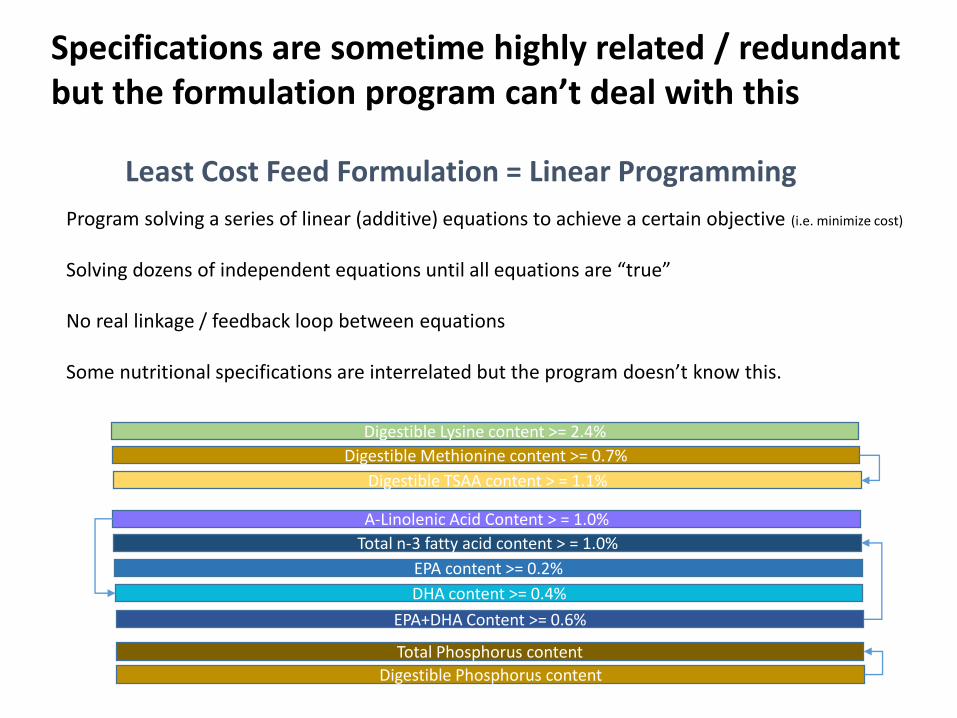
Least Cost Feed Formulation = Linear Programming
Program solving a series of linear (additive) equations to achieve a certain objective (i.e. minimize cost)
Solving dozens of independent equations until all equations are “true”
No real linkage / feedback loop between equations
Some nutritional specifications are interrelated but the program doesn’t know this.
Digestible Lysine content >= 2.4%
Digestible Methionine content >= 0.7%
Α-Linolenic Acid Content > = 1.0%
Total n-3 fatty acid content > = 1.0%
EPA content >= 0.2%
DHA content >= 0.4%
EPA+DHA Content >= 0.6%
Total Phosphorus content
Digestible Phosphorus content
Digestible TSAA content > = 1.1%
Specifications are sometime highly related / redundantbut the formulation program can’t deal with this
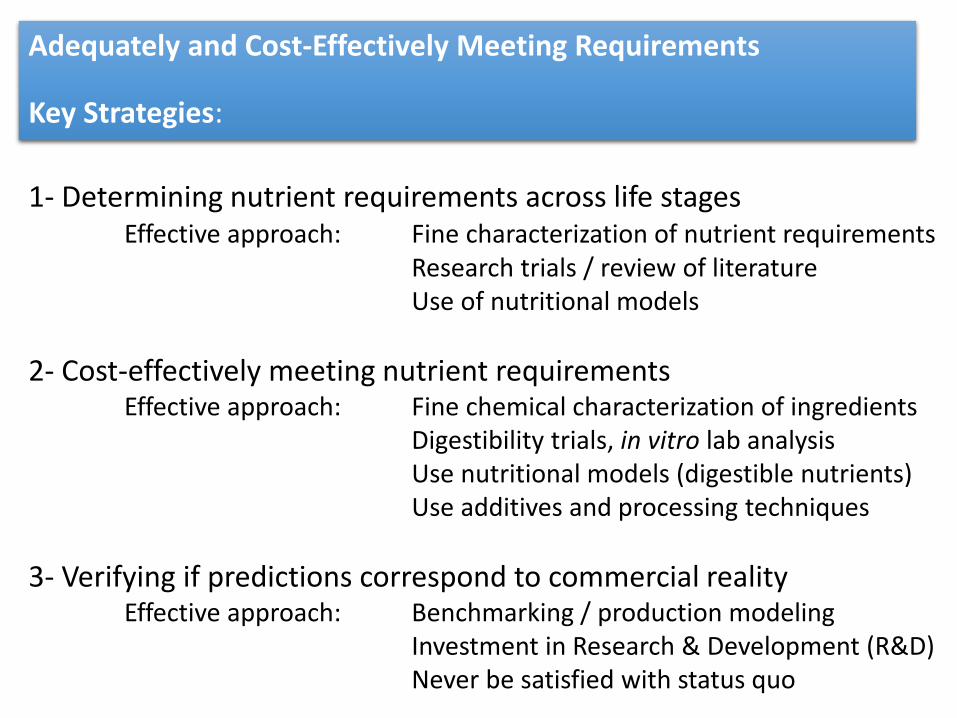
1- Determining nutrient requirements across life stagesEffective approach: Fine characterization of nutrient requirements
Research trials / review of literatureUse of nutritional models
2- Cost-effectively meeting nutrient requirementsEffective approach: Fine chemical characterization of ingredients
Digestibility trials, in vitro lab analysisUse nutritional models (digestible nutrients)Use additives and processing techniques
3- Verifying if predictions correspond to commercial realityEffective approach: Benchmarking / production modeling
Investment in Research & Development (R&D)Never be satisfied with status quo
Adequately and Cost-Effectively Meeting Requirements
Key Strategies:

EFFECTIVELY MEETING PHOSPHORUS REQUIREMENT

Challenge:
Predicting digestible nutrient (e.g. lipids, phosphorus) contents of balanced feeds formulated to widely different digestible nutrient levels and made with a great variety of ingredients?
Number of combinations/permutations too great to study experimentally.
How can we derive the estimates we need from the literature?
It is not sufficient to know different factors have effects.
You also need to be able to quantify the combined effects of these
different factors

0
20
40
60
80
100
0 10 20 30 40
Dietary P (g/kg)
P a
pp
rare
nt
dig
esti
bil
ity (
%)
No trend for meaningful
dietary range
Example: Dietary Phosphorus Digestibility
Decreasing P digestibility with increasing total P
level
No effect of P level on P digestibility
Dataset: 137 treatments from 22 studies with rainbow trout

Modelling can be a very effective way of achieving this.
Before After
The answer is organizing the information at hand in a sensible way!

P Content of Common Fish Feed Ingredients
Ingredients P content (%)
Fish meal 1.08 – 4.19
Meat and bone meal 2.49 – 7.08
Poultry by-product meal 1.65 – 3.45
Blood meal 0.08 – 1.71
Feather meal 0.54 – 1.26
Corn gluten meal 0.44 – 0.55
Soybean meal 0.64 – 0.85
Wheat middling 0.97 – 1.17
Summarized from various sources in literature

P Forms Present in Feed
1. Inorganic P
– Bone P: hydroxyapatite Ca10(OH)2(PO4)6
– Pi supplement:
• Monobasic: NaH2PO4, Ca(H2PO4)2
• Dibasic: CaHPO4

P Forms Present in Feed
2. Organic P
– Phospholipids, e.g. phosphatidyl choline
– Phosphoproteins, e.g. casein
– Phosphosugars, e.g. Glucose-6-P
– Phytate: account for 60 – 80% of total P in plant ingredients

Classification and Content of P Compounds
Phytase
Ingredient
/ feed
Pi SupplementPlant ingredients
Bone-P Phytate-PCa Mono/
Na/K PiCa-Di PiOrganic P
Animal ingredients
Contents
estimated by a
fractionation
protocol
Contents estimated from
various data in
literature

Results: Parameter Estimates From Multiple Regression
Bone-P2
-3%Bone-P*Mono-Pi
-14%
Dietary P
Bone-P
68%
Phytate-P
0%
Ca Mono/
Na/K Pi
89%
Ca-Di Pi
64%
Phytase
51%
Organic P
84%
Phytase2
-2%
Hua and Bureau (2006)

• The model explained 96% of the variance of the data and well described
the observations of the dataset
0
20
40
60
80
100
0 10 20 30 40
Dietary P (g/kg)
P a
pp
rare
nt
dig
esti
bil
ity (
%)
Observed values Model estimated values
P Digestibility Model
Hua and Bureau (2006)
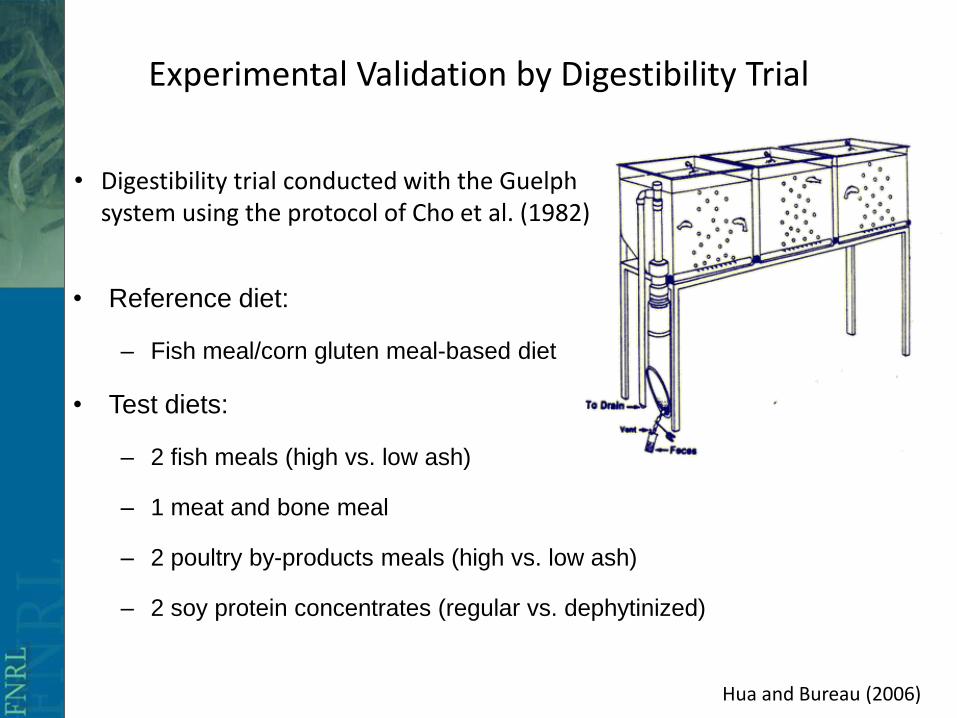
Experimental Validation by Digestibility Trial
• Digestibility trial conducted with the Guelph system using the protocol of Cho et al. (1982)
• Reference diet:
– Fish meal/corn gluten meal-based diet
• Test diets:
– 2 fish meals (high vs. low ash)
– 1 meat and bone meal
– 2 poultry by-products meals (high vs. low ash)
– 2 soy protein concentrates (regular vs. dephytinized)
Hua and Bureau (2006)
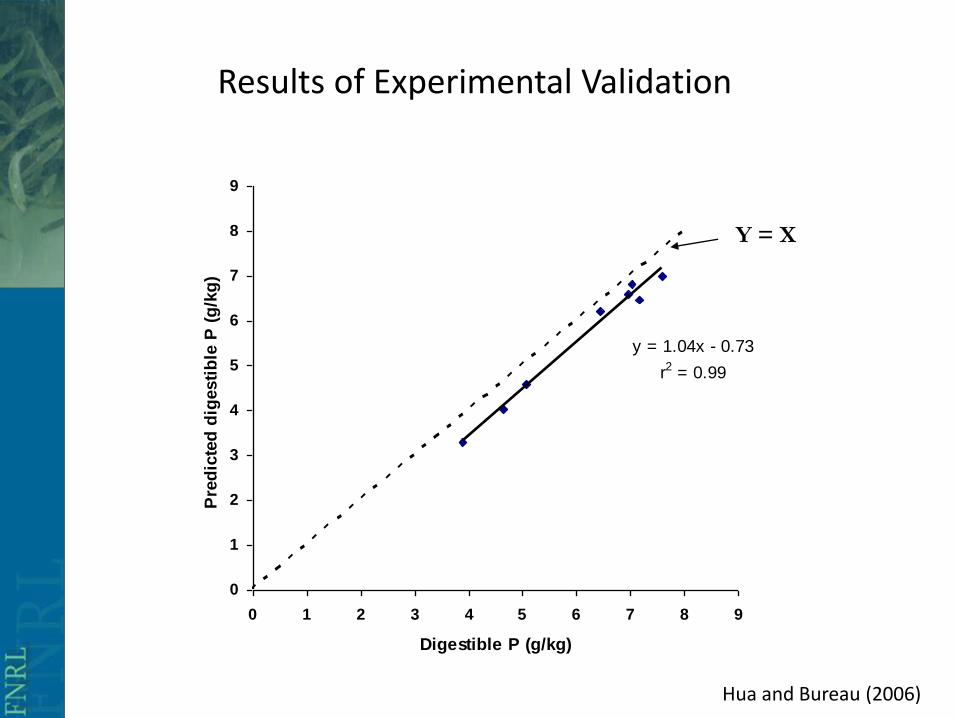
Results of Experimental Validation
y = 1.04x - 0.73
r2 = 0.99
0
1
2
3
4
5
6
7
8
9
0 1 2 3 4 5 6 7 8 9
Digestible P (g/kg)
Pre
dic
ted
dig
esti
ble
P (
g/k
g)
Y = X
Hua and Bureau (2006)

Differences between fish species in terms of mineral digestibility?
Effect of absence of true stomach?
Effect of very long and/or very acid GI tract?
Short GI tract
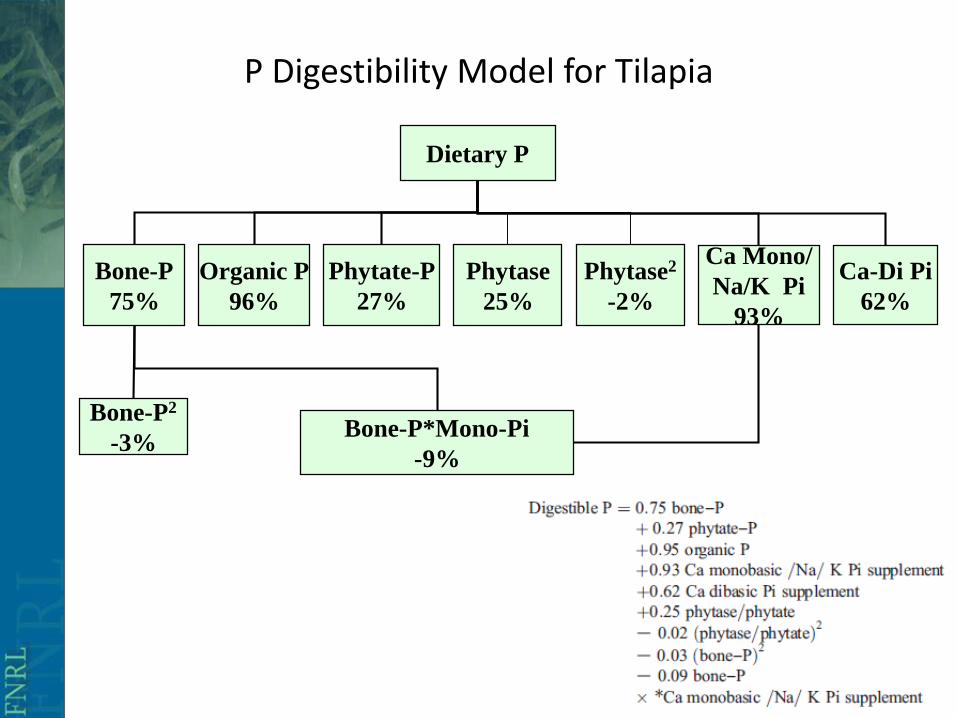
P Digestibility Model for Tilapia
Bone-P2
-3%Bone-P*Mono-Pi
-9%
Dietary P
Bone-P
75%
Phytate-P
27%
Ca Mono/
Na/K Pi
93%
Ca-Di Pi
62%
Phytase
25%
Organic P
96%
Phytase2
-2%
Hua and Bureau (2009)

P Digestibility Model for Common carp
Bone-P2
0%Bone-P*Mono-Pi
0%
Dietary P
Bone-P
0%
Phytate-P
0%
Ca Mono/
Na/K Pi
86%
Ca-Di Pi
30%
Phytase
48%
Organic P
72%
Phytase2
-4%

Forms of PhosphorusEstimates of Digestible P
Forms of Dietary P and Estimation of Digestible P

Equations in AAFFD and BestMix
• 'Digestible Phosphorus calculation, Aqua• Nutrients.Minerals.Dig P Carni = Nutrients.Minerals.Bone P * 68/100
+Nutrients.Minerals.Cellular P * 84/100 + Nutrients.Minerals.Monobasic P * 89/100 + Nutrients.Minerals.Dibasic P * 64/100
• Nutrients.Minerals.Dig P Omni = Nutrients.Minerals.Cellular P * 72/100 + Nutrients.Minerals.Monobasic P * 86/100 + Nutrients.Minerals.Dibasic P * 30/100
• Nutrients.Minerals.Dig P Carp = Nutrients.Minerals.Bone P * 75/100 +Nutrients.Minerals.Cellular P * 95/100 + Nutrients.Minerals.Monobasic P * 90/100 + Nutrients.Minerals.Dibasic P * 62/100
• Nutrients.Minerals.Dig P Shrimp = Nutrients.Minerals.Bone P * 70/100 +Nutrients.Minerals.Cellular P * 85/100 + Nutrients.Minerals.Monobasic P * 85/100 + Nutrients.Minerals.Dibasic P * 60/100

Educational Module #2 Nutritional Specifications (1h)
Nutritional specifications – How they are developed, adjusted, updated
Meeting essential fatty acids and minor lipids requirements
Effectively meeting phosphorus requirement

Least Cost Feed Formulation = Linear Programming
Program solving a series of linear (additive) equations to achieve a certain objective (i.e. minimize cost)
Solving dozens of independent equations until all equations are “true”
No real linkage / feedback loop between equations
Some nutritional specifications are interrelated but the program doesn’t know this.
Digestible Lysine content >= 2.4%
Digestible Methionine content >= 0.7%
Α-Linolenic Acid Content > = 1.0%
Total n-3 fatty acid content > = 1.0%
EPA content >= 0.2%
DHA content >= 0.4%
EPA+DHA Content >= 0.6%
Total Phosphorus content
Digestible Phosphorus content
Digestible TSAA content > = 1.1%
Outstanding Issue – Independent recommendations that are interrelated
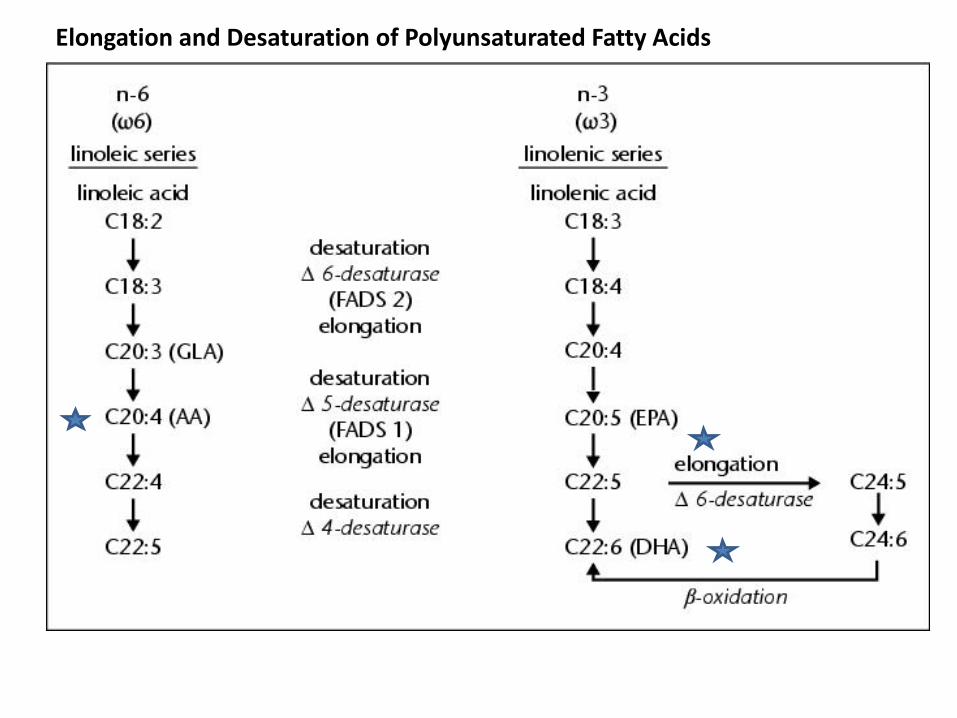
Elongation and Desaturation of Polyunsaturated Fatty Acids

Determining What Species Needs What and How Much?
• A little more complicated than for other nutrients
– Synthesis / bioconversion plays an important role but efficiency of conversion depends on species and life stages• ALA (18:3 n-3) = precursor of 20:5 n-3 and 22:6 n-3
• LA (18:2 n-6) = precursor of 20:4 n-6
– Substitution issues = “physically” and metabolically one fatty acid can partly replace another one• Deficiency is thus not always very overtly seen
–Metabolic needs can be very small (ng) and body reserve large (mg or g)


Α-Linolenic Acid Content > = 1.0%
Total n-3 fatty acid content > = 1.0%
EPA content >= 0.2%
DHA content >= 0.4%
EPA+DHA Content >= 0.6%

Takeuchi (2001)
Evidence that for some species DHA is the essential fatty acid and that EPA doesn’t have to same efficacy.
This is a lot more informative and accurate than “fish oil replacement value”

B. D. Glencross, D. M. Smith, M. R. Thomas and K. C. Williams. 2002. Optimising the essential
fatty acids in the diet for weight gain of the prawn, Penaeus monodon. Aquaculture 204, 85-99.
Combined Response of Shrimp to Dietary Lipid and Essential Fatty Acid Contents

GLENCROSS, D.M. SMITH, M.R. THOMAS & K.C. WILLIAMS. 2002. The effect of dietary n-3 and n-6 fatty acid balance on the growth of the prawn Penaeus monodon B. Aquaculture Nutrition 8, 43
Dietary n-3 and n-6 fatty acid balance


Source: Cooper, G.M. 2000.The Cell: A Molecular Approach. 2nd Ed.
Sinaeur Associate Inc., Sunderland, Mass.
http://www.ncbi.nlm.nih.gov/books/bv.fcgi?rid=cooper


Take Home Message
Freshwater fish:
Require either n-3 or n-6 fatty acids (probably all fish require both types)
Elongate & desaturate shorter chain fatty acids but requirement= 5 to 10x
Marine fish :
Generally require n-3 fatty acids and small amount of n-6 fatty acidsVery limited ability to elongate (and desaturate) shorter chain fatty acidsBasically require EPA, DHA and AA (20:4 n-6)
Marine crustaceans :
Generally require n-3 fatty acids and small amount of n-6 fatty acidsVery limited ability to elongate (and desaturate) shorter chain fatty acidsBasically require EPA, DHA and AA (20:4 n-6)Require phospholipidsRequire cholesterol (or sterols)

Educational Module #3: Dietary Energy: Definitions and Requirements (30 min)
• Energy Partitioning Scheme
• Dietary Energy
– Gross energy
– Digestible energy
– Metabolizable energy
• Bioenergetics Model
– Energy Requirement Estimations
– Theoretical feed requirement and feed conversion ratio

Intake of Energy (IE)
Fecal Energy (FE)
Digestible Energy (DE)
Urine Energy (UE)Branchial Energy (ZE)
Metabolizable Energy (ME)
Net Energy (NE)
Recovered Energy (RE)
Basal Metabolism (HeE)Voluntary Activity (HjE)
Heat increment (HiE)
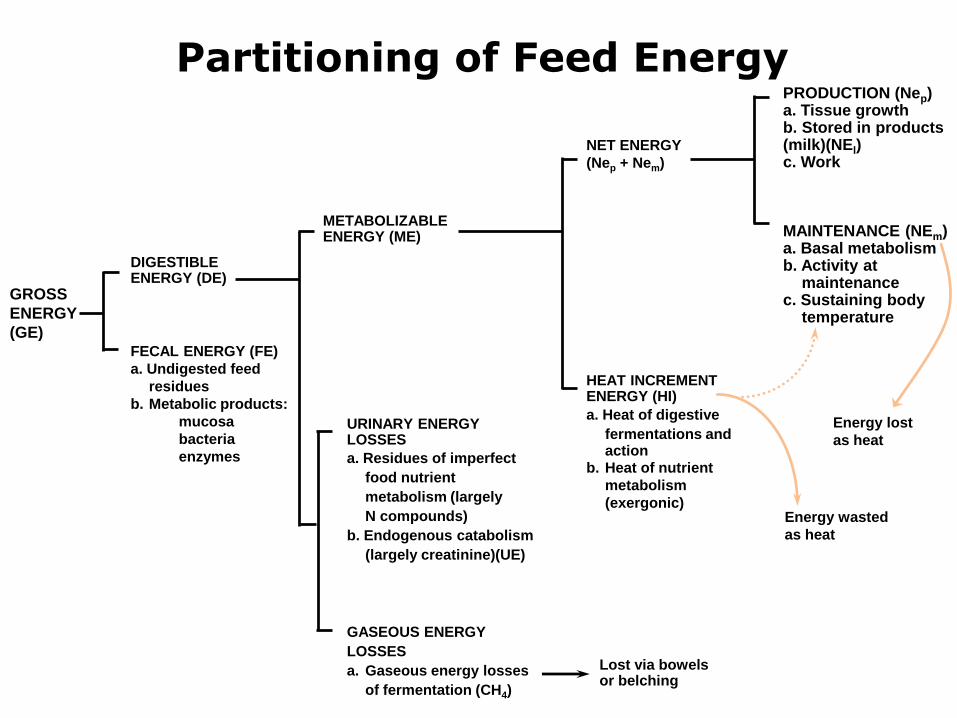
PRODUCTION (Nep)a. Tissue growthb. Stored in products (milk)(NEl)c. Work
MAINTENANCE (NEm)a. Basal metabolismb. Activity at
maintenancec. Sustaining body
temperature
NET ENERGY
(Nep + Nem)
HEAT INCREMENT ENERGY (HI)
a. Heat of digestive
fermentations and action
b. Heat of nutrient
metabolism
(exergonic)Energy wasted
as heat
METABOLIZABLE ENERGY (ME)
URINARY ENERGY LOSSES
a. Residues of imperfect
food nutrient
metabolism (largely
N compounds)
b. Endogenous catabolism
(largely creatinine)(UE)
GASEOUS ENERGY
LOSSES
a. Gaseous energy losses
of fermentation (CH4)
Lost via bowelsor belching
DIGESTIBLEENERGY (DE)
FECAL ENERGY (FE)
a. Undigested feed
residues
b. Metabolic products:
mucosa
bacteria
enzymes
Partitioning of Feed Energy
GROSS
ENERGY
(GE)
Energy lost
as heat

Growth Most important parameter in aquaculture
Affected by: Feed (quantity and quality)Temperature, environment Genetics Rearing practices
Nutrient deposition:Growth is the result of nutrients deposition(water, protein, lipid, minerals, etc.)
Energy deposited = “average nutrient deposition”
Energy deposited + cost of living and cost of depositing energy= Digestible energy requirement
= Feed requirement

Determining Energy and Feed Requirements
1- Predict or describe growth
2- Determine nutrient / energy gains
3- Estimate heat and metabolic losses
4- Digestible energy requirement = sum
Need appropriate growth model
Carcass composition x growth
Maintenance (HeE) + Heat increment (HiE) + Non-fecal losses (UE+ZE)
DE = RE + HeE + HiE + (UE+ZE)

CP = 0.1581x - 0.0911
R2 = 0.9982
P = 0.0036x + 0.0173
R2 = 0.9848
Lipid = 6E-05x2 + 0.0648x - 0.5972
R2 = 0.9771
0
20
40
60
80
100
120
140
160
180
200
0 500 1000 1500
Live weight (g/fish)
Co
mp
os
itio
n (
g/f
ish
)
CP %
Lipid %
P %

RE = 0.0039x2 + 5.5812x
R2 = 0.989
0
2000
4000
6000
8000
10000
12000
14000
16000
18000
20000
0 500 1000 1500 2000
Fish weight (g BW)
Carc
ass e
nerg
y (
kJ/f
ish
)

Rainbow trout:HeE = -0.01+3.26T-0.05T2 kJ kg-1 MBW d-1
where MBW =Metabolic body weight = live weight (kg) 0.82
Estimate of basal metabolism (HeE)
Rainbow trout: 36 kJ kg0.82 15oC
Homeotherms: 270 kJ kg0.75 at 37oC


0
200
400
600
800
1000
1200
0 500 1000 1500 2000
RE
(kJ/f
ish
)
ME (kJ/fish)
6oC
9oC
12oC
15oC
y= 0.55x + 37 R2=0.99Slope = efficiency of ME conversion into RE1 - slope = inefficiency (cost)
ME above maintenance = 0.55RE + 0.45HiE

ME above maintenance = 0.61RE + 0.39HiEor
HiE = 0.64 RE
ME above maintenance = 0.64RE + 0.36HiEor
HiE = 0.56 RE
Azevedo et al. (1998)
Bureau et al. (2006)
Efficiency of ME Utilization & Estimates of HiE
Results from various energy budget using regression RE as a function of MEI
ME above maintenance = 0.68RE + 0.32HiEor
HiE = 0.47 RE
Rodehutscord and Pfeffer (1999)
Efficiency of ME utilization not significantly affected by water temperature or feeding level. Nutrient composition (starch level) may affect ME utilization.

Digestible Energy Requirement/ Digestible Energy of Feed
Theoretical Feed Requirement/ kg weight gain
Theoretical Feed Conversion Ratio

Live Weight Growth Rate RE HeE HiE+(UE+ZE) DE Req
g/fish g/d MJ/kg gain
10 1.1 4.5 1.2 3.1 8.9
50 2.2 5.7 2.3 3.9 11.9
100 3.0 6.3 2.9 4.3 13.6
250 4.4 7.2 4.1 4.9 16.3
500 5.9 8.0 5.4 5.4 18.8
1000 8.0 8.8 7.0 6.0 21.8
2000 10.7 9.7 9.0 6.6 25.4
3000 12.7 10.3 10.5 7.0 27.8
Energy Requirements of Asian Sea Bass (Lates calcarifer).

Growth
Prediction
&
Feed
Requirement
Waste Outputs
Prediction
&
Oxygen
Requirements
Graphs
User
Informations
This is a fancy version of Task 5.2

0.00
0.20
0.40
0.60
0.80
1.00
1.20
1.40
21 42 56 77 98 119 140 161 182 203 224 245
FCR
Days
FCR (Observed) FCR (Predicted)
Observed and predicted evolution of feed conversion ratio (feed:gain) of Nile tilapia during a pilot-scale trial
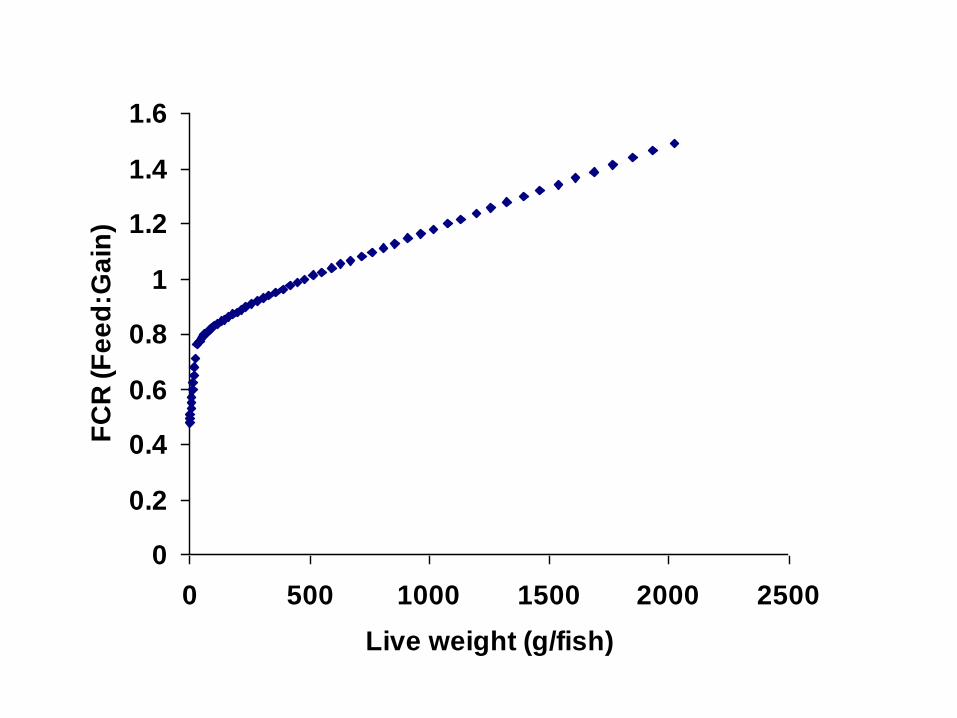
0
0.2
0.4
0.6
0.8
1
1.2
1.4
1.6
0 500 1000 1500 2000 2500
Live weight (g/fish)
FC
R (
Fe
ed
:Ga
in)
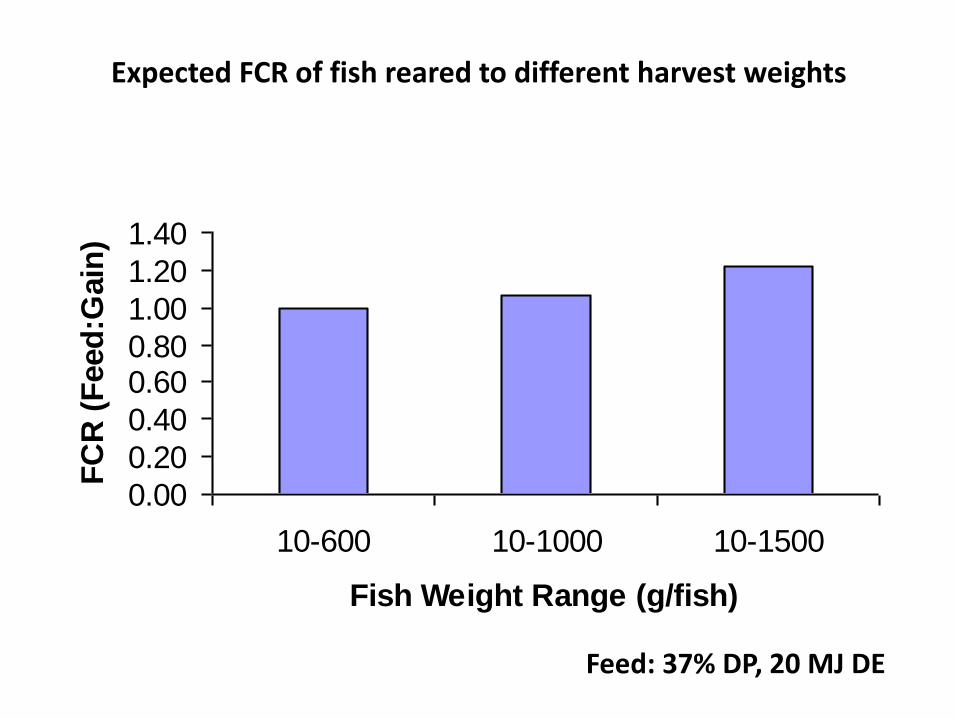
0.00
0.20
0.40
0.600.80
1.00
1.20
1.40
10-600 10-1000 10-1500
Fish Weight Range (g/fish)
FC
R (
Feed
:Gain
)Expected FCR of fish reared to different harvest weights
Feed: 37% DP, 20 MJ DE