inmed 2015 holland
TRANSCRIPT

Examining the relationships between attendance, online engagement and assessment outcomes in undergraduates; an observational prospective, multicentre study.
Jane Holland*, Eric Clarke*, Morag Monro , Evelyn Kelleher , Mark Glynn
*RCSI Dublin, DCU Dublin
Funded by 3U Partnership N-STEP Strand 1 Initiative

Non-attendance: Correlates with poor performance (1)
Non-anglophones (2)
Understanding & conceptualisation (3)
Identifying individual cause is essential (4,5)
Monitoring: Time-consuming & potential for recording
errors Software / biometrics –cost considerations
Reports & logs
Background & Literature
1. Massingham, 20062. Gatherer, 19983. Sharma, 20054. Dobkin, 20075. Rodgers, 2002
Funded by 3U Partnership N-STEP Strand 1 Initiative
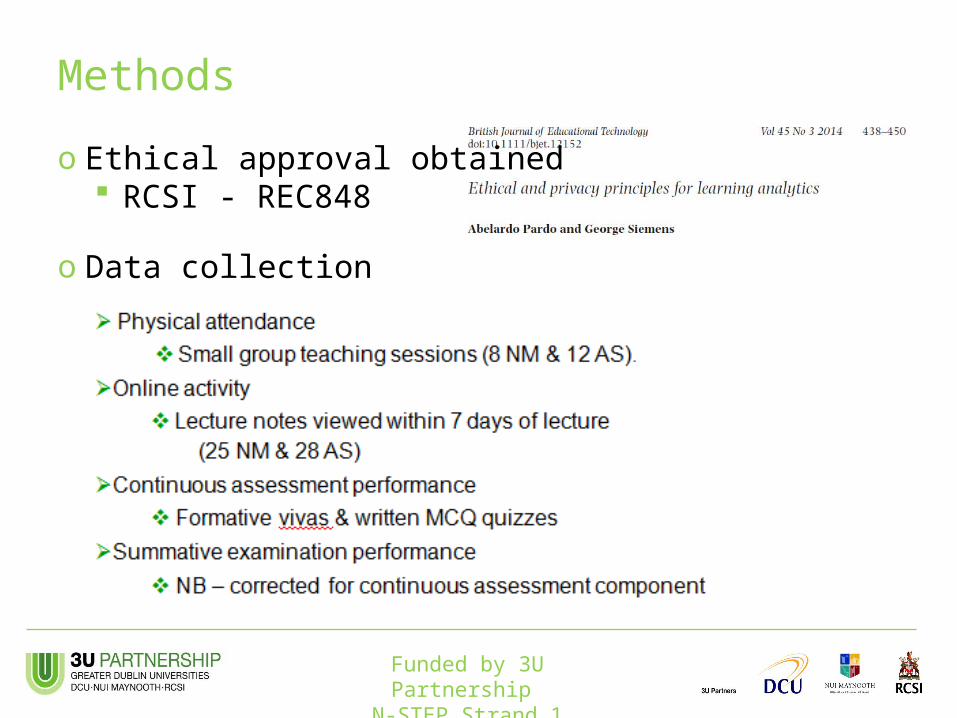
o Ethical approval obtained RCSI - REC848
o Data collection
Methods
Funded by 3U Partnership N-STEP Strand 1 Initiative

Physical attendance
Online activity
Continuous assessment
Summative examination
NMNew entrants (n=329) 8 24 2.9% 63.5 %
Repeat (n=29) 7 14 2.3% 54.4 %
ASNew entrants (n=329) 12 25 2.9% 66.3 %
Repeat (n=29) 8 15 2.3% 55.8 %
Results – Descriptive statistics (1)
Funded by 3U Partnership N-STEP Strand 1 Initiative
JC-NM
<20
21-24
25
0 10 20 30 40 50 60 70 80 90
New JC1 Repeating JC1

Results – Descriptive statistics (2)
Funded by 3U Partnership N-STEP Strand 1 Initiative
Physical attendance
Online activity
Continuous assessment
Summative examination
NMNew entrants (n=329) 8 24 2.9% 63.5 %
Repeat (n=29) 7 14 2.3% 54.4 %
ASNew entrants (n=329) 12 25 2.9% 66.3 %
Repeat (n=29) 8 15 2.3% 55.8 %
*
* p< 0.005 Mann-Whitney U
JC-AS
<20
21-25
26
0 10 20 30 40 50 60 70
New JC1 Repeating JC1

Physical attendance Online activity
Continuous assessment
NMNew entrants R2 < 0.1 R2 < 0.1 R2 = 0.54
Repeat No correlation No correlation R2 = 0.22
ASNew entrants R2 < 0.1 R2 = 0.12 R2 = 0.58
Repeat R2 = 0.17 R2 = 0.21 R2 = 0.15
Results – Regression analysis
Basic assumptions confirmedTests for tolerance & VIF- no evidence of multicollinearity
*? Late arrival due to appeals
*
Funded by 3U Partnership N-STEP Strand 1 Initiative
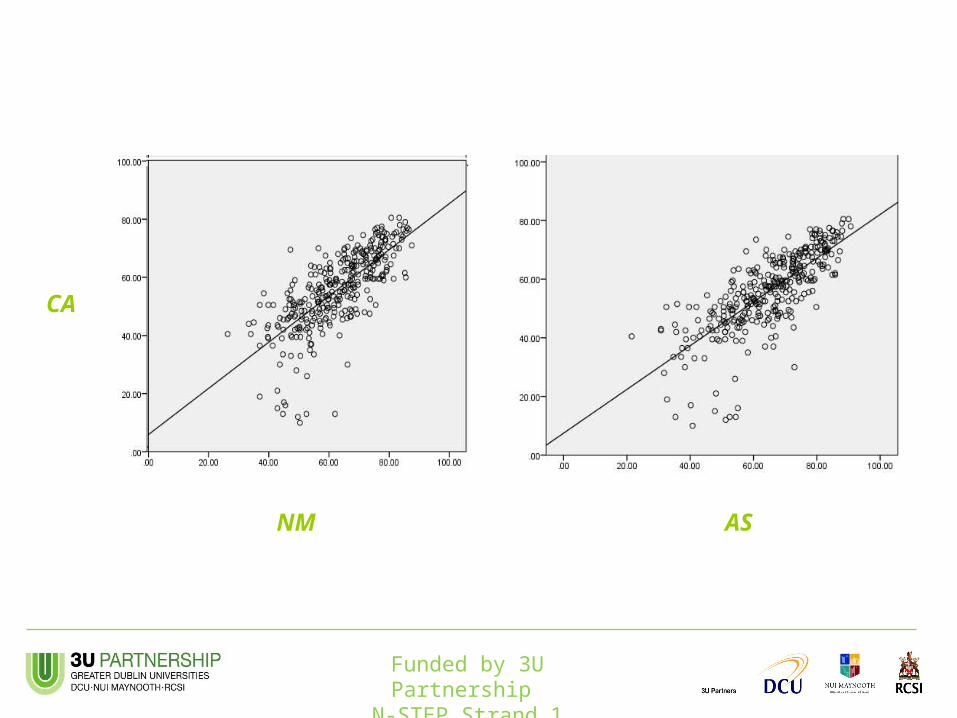
CA
NM AS
Funded by 3U Partnership N-STEP Strand 1 Initiative

New entrantso Continuous assessment most predictiveo Online activity – larger effect size than physical
attendance
Repeat studentso Outliers - High risk o Online activity most predictive
Summary of results
Funded by 3U Partnership N-STEP Strand 1 Initiative
Caveats & Conclusions... Caveat – correlation does not equal causationNon-attendance is a symptom – individual diagnosis &
management of underlying issues is essential... Developing a screening program for early identification allows
early intervention

1. Massingham P, Herrington T. Does attendance matter? An examination of student attitudes, participation, performance and attendance. Journal of university teaching & learning practice. 2006;3(2):3.
2. Gatherer, D., & Manning, F. C. (1998). Correlation of examination performance with lecture attendance: a comparative study of first-year biological sciences undergraduates. Biochemical Education, 26(2), 121-123.
3. Sharma, M. D., Mendez, A., & O’Byrne, J. W. (2005). The relationship between attendance in student‐centred physics tutorials and performance in university examinations. International Journal of Science Education, 27(11), 1375-1389.
4. Dobkin C, Gil R, Marion J. Causes and consequences of skipping class in college: Mimeo, UC Santa Cruz 2007.
5. Rodgers JR. Encouraging tutorial attendance at university did not improve performance. Australian Economic Papers. 2002;41(3):255-66.
References
Funded by 3U Partnership N-STEP Strand 1 Initiative