inland empire real estate market update | july 2015
DESCRIPTION
Inland Empire real estate market report including MLS data from Riverside and San Bernardino Counties.TRANSCRIPT

JULY 2015

Inland Empire Market Report JULY 2015
Riverside County San Bernardino County
Banning La Quinta Adelanto Ontario
Beaumont Lake Elsinore Apple Valley Rancho Cucamonga
Blythe Menifee Barstow Redlands
Calimesa Moreno Valley Chino Rialto
Canyon Lake Murrieta Chino Hills San Bernardino (city)
Cathedral City Norco Colton Upland
Coachella Palm Desert Fontana Victorville
Corona Palm Springs Grand Terrace Yucaipa
Desert Hot Springs Perris Hesperia Yucca Valley
Eastvale Rancho Mirage Highland
Hemet Riverside (city) Loma Linda
Indian Wells San Jacinto Montclair
Indio Temecula
Jurupa Valley Wildomar
TABLE OF CONTENTS
All reports presented within this document are based on data supplied by the CARETS (CLAW, CRISNet MLS, DAMLS, CRMLS, i-‐Tech MLS, and/or VCRDS) or their MLSs. Neither the AssociaGons nor their MLSs guarantee or are in anyway responsible for their accuracy. Data maintained by the AssociaGons or their MLSs may not reflect all real estate acGviGes in the market. InformaGon deemed reliable but not guaranteed.
Inland Empire Market Report | JULY 2015

BANNING Single Family Residence
Inland Empire Market Report | JULY 2015
BANNING
0
30
60
90
120
150
180
210
12 Months Ago 6 Months Ago 3 Months Ago Last Month
Active Inventory Pending Inventory
Sold Inventory Days on Market
Single Family Residence
12 Months Ago 6 Months Ago 3 Months Ago Last Month
Active Inventory 173 162 147 149
Pending Inventory 34 60 53 51
Sold Inventory 44 18 45 39
Average Sale Price $191,386 $186,320 $210,721 $234,887
Days on Market 74 77 99 66

BEAUMONT
View homes for sale in Aliso Viejo >>
Single Family Residence BEAUMONT
12 Months Ago 6 Months Ago 3 Months Ago Last Month
Active Inventory 266 220 237 245
Pending Inventory 79 116 111 95
Sold Inventory 60 39 67 75
Average Sale Price $270,937 $268,065 $268,191 $273,522
Days on Market 70 83 69 57
Inland Empire Market Report | JULY 2015
0
40
80
120
160
200
240
280
12 Months Ago 6 Months Ago 3 Months Ago Last Month
Active Inventory Pending Inventory
Sold Inventory Days on Market

BLYTHE
View homes for sale in Aliso Viejo >>
0
25
50
75
100
125
150
12 Months Ago 6 Months Ago 3 Months Ago Last Month
Active Inventory Pending Inventory
Sold Inventory Days on Market
BLYTHE Single Family Residence
12 Months Ago 6 Months Ago 3 Months Ago Last Month
Active Inventory 36 47 45 34
Pending Inventory 1 13 18 22
Sold Inventory 7 7 6 12
Average Sale Price $159,813 $133,914 $90,546 $161,143
Days on Market 59 100 141 102
Inland Empire Market Report | JULY 2015

CALIMESA CALIMESA Single Family Residence
12 Months Ago 6 Months Ago 3 Months Ago Last Month
Active Inventory 31 16 25 43
Pending Inventory 7 7 13 8
Sold Inventory 9 5 13 9
Average Sale Price $334,967 $264,780 $289,315 $262,122
Days on Market 103 76 85 49
Inland Empire Market Report | JULY 2015
0
20
40
60
80
100
120
12 Months Ago 6 Months Ago 3 Months Ago Last Month
Active Inventory Pending Inventory
Sold Inventory Days on Market

CANYON LAKE
0 25 50 75
100 125 150 175 200
12 Months Ago 6 Months Ago 3 Months Ago Last Month
Active Inventory Pending Inventory
Sold Inventory Days on Market
CANYON LAKE Single Family Residence
12 Months Ago 6 Months Ago 3 Months Ago Last Month
Active Inventory 171 124 161 179
Pending Inventory 25 39 34 20
Sold Inventory 26 19 23 20
Average Sale Price $478,773 $371,968 $428,278 $379,945
Days on Market 85 84 97 84
Inland Empire Market Report | JULY 2015

CATHEDRAL CITY
0
40
80
120
160
200
240
280
12 Months Ago 6 Months Ago 3 Months Ago Last Month
Active Inventory Pending Inventory
Sold Inventory Days on Market
Single Family Residence CATHEDRAL CITY Single Family Residence
12 Months Ago 6 Months Ago 3 Months Ago Last Month
Active Inventory 96 254 211 185
Pending Inventory 39 63 71 39
Sold Inventory 34 45 53 44
Average Sale Price $259,506 $253,154 $275,309 $282,639
Days on Market 74 122 92 91
Inland Empire Market Report | JULY 2015

COACHELLA
0
20
40
60
80
100
120
12 Months Ago 6 Months Ago 3 Months Ago Last Month
Active Inventory Pending Inventory
Sold Inventory Days on Market
Single Family Residence COACHELLA Single Family Residence
12 Months Ago 6 Months Ago 3 Months Ago Last Month
Active Inventory 25 63 64 89
Pending Inventory 10 17 27 25
Sold Inventory 17 11 11 16
Average Sale Price $165,100 $185,619 $185,726 $221,594
Days on Market 77 101 87 100
Inland Empire Market Report | JULY 2015
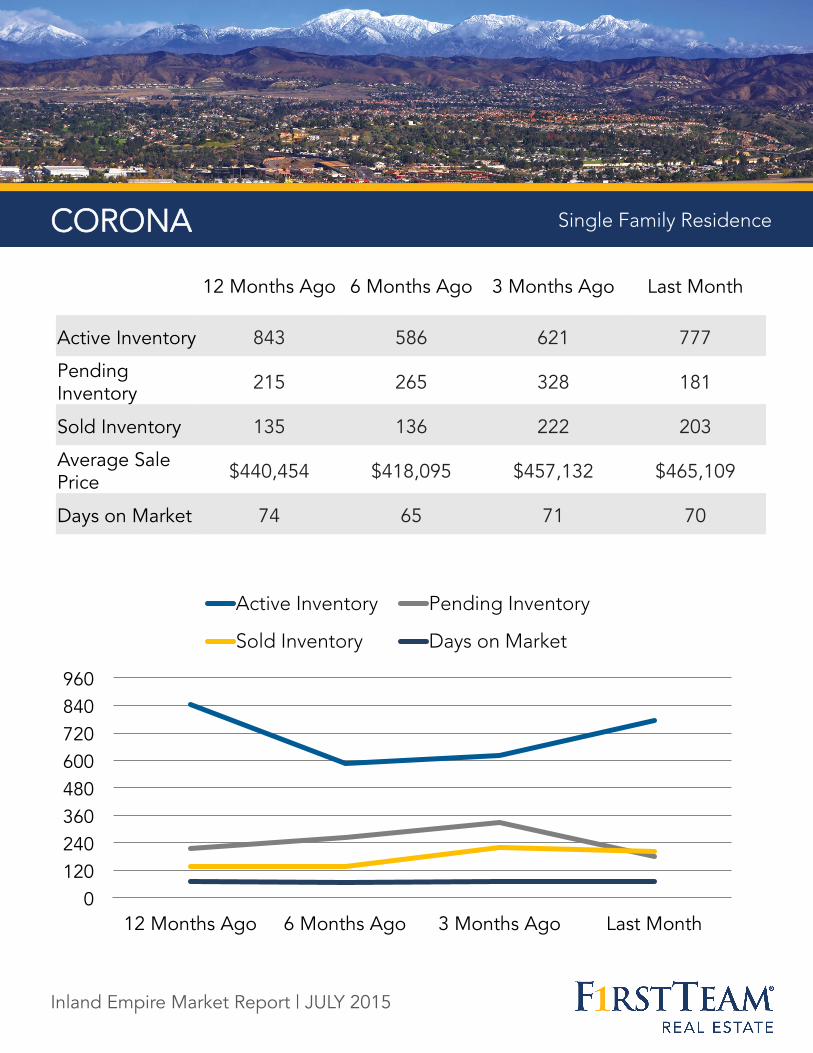
CORONA
0 120 240 360 480 600 720 840 960
12 Months Ago 6 Months Ago 3 Months Ago Last Month
Active Inventory Pending Inventory
Sold Inventory Days on Market
CORONA Single Family Residence
12 Months Ago 6 Months Ago 3 Months Ago Last Month
Active Inventory 843 586 621 777
Pending Inventory 215 265 328 181
Sold Inventory 135 136 222 203
Average Sale Price $440,454 $418,095 $457,132 $465,109
Days on Market 74 65 71 70
Inland Empire Market Report | JULY 2015

DESERT HOT SPRINGS
0
50
100
150
200
250
300
350
12 Months Ago 6 Months Ago 3 Months Ago Last Month
Active Inventory Pending Inventory
Sold Inventory Days on Market
DESERT HOT SPRINGS Single Family Residence
12 Months Ago 6 Months Ago 3 Months Ago Last Month
Active Inventory 168 304 293 223
Pending Inventory 35 48 59 75
Sold Inventory 35 30 41 52
Average Sale Price $147,298 $133,150 $160,871 $162,513
Days on Market 119 86 101 139
Inland Empire Market Report | JULY 2015

EASTVALE
0
40
80
120
160
200
240
280
12 Months Ago 6 Months Ago 3 Months Ago Last Month
Active Inventory Pending Inventory
Sold Inventory Days on Market
Single Family Residence EASTVALE Single Family Residence
12 Months Ago 6 Months Ago 3 Months Ago Last Month
Active Inventory 237 153 188 212
Pending Inventory 66 83 69 46
Sold Inventory 56 37 57 55
Average Sale Price $493,595 $472,471 $476,352 $506,271
Days on Market 67 67 55 66
Inland Empire Market Report | JULY 2015

HEMET
0
100
200
300
400
500
600
700
12 Months Ago 6 Months Ago 3 Months Ago Last Month
Active Inventory Pending Inventory
Sold Inventory Days on Market
Single Family Residence HEMET Single Family Residence
12 Months Ago 6 Months Ago 3 Months Ago Last Month
Active Inventory 610 555 468 537
Pending Inventory 172 226 258 208
Sold Inventory 152 113 181 163
Average Sale Price $190,351 $187,135 $196,932 $201,340
Days on Market 70 81 81 67
Inland Empire Market Report | JULY 2015

INDIAN WELLS Single Family Residence
INDIAN WELLS Single Family Residence
12 Months Ago 6 Months Ago 3 Months Ago Last Month
Active Inventory 47 262 221 131
Pending Inventory 2 8 13 7
Sold Inventory 12 14 21 14
Average Sale Price $869,333 $1,123,321 $889,090 $1,251,875
Days on Market 220 116 169 204
Inland Empire Market Report | JULY 2015
0
40
80
120
160
200
240
280
12 Months Ago 6 Months Ago 3 Months Ago Last Month
Active Inventory Pending Inventory
Sold Inventory Days on Market

INDIO
0 100 200 300 400 500 600 700 800
12 Months Ago 6 Months Ago 3 Months Ago Last Month
Active Inventory Pending Inventory
Sold Inventory Days on Market
Single Family Residence INDIO Single Family Residence
12 Months Ago 6 Months Ago 3 Months Ago Last Month
Active Inventory 165 677 565 499
Pending Inventory 23 103 83 79
Sold Inventory 50 75 116 82
Average Sale Price $266,987 $265,626 $301,893 $296,138
Days on Market 91 110 135 115
Inland Empire Market Report | JULY 2015

JURUPA VALLEY Single Family Residence
JURUPA VALLEY Single Family Residence
12 Months Ago 6 Months Ago 3 Months Ago Last Month
Active Inventory 88 101 84 117
Pending Inventory 23 38 51 49
Sold Inventory 16 17 34 20
Average Sale Price $308,688 $340,664 $330,755 $382,869
Days on Market 43 88 48 57
Inland Empire Market Report | JULY 2015
0
20
40
60
80
100
120
140
12 Months Ago 6 Months Ago 3 Months Ago Last Month
Active Inventory Pending Inventory
Sold Inventory Days on Market

LA QUINTA
0 100 200 300 400 500 600 700 800 900
1000
12 Months Ago 6 Months Ago 3 Months Ago Last Month
Active Inventory Pending Inventory
Sold Inventory Days on Market
Single Family Residence LA QUINTA Single Family Residence
12 Months Ago 6 Months Ago 3 Months Ago Last Month
Active Inventory 177 949 885 619
Pending Inventory 28 75 86 85
Sold Inventory 51 73 105 95
Average Sale Price $530,458 $789,242 $621,971 $477,159
Days on Market 119 179 132 141
Inland Empire Market Report | JULY 2015

LAKE ELSINORE
0 50
100 150 200 250 300 350 400 450
12 Months Ago 6 Months Ago 3 Months Ago Last Month
Active Inventory Pending Inventory
Sold Inventory Days on Market
Single Family Residence LAKE ELSINORE Single Family Residence
12 Months Ago 6 Months Ago 3 Months Ago Last Month
Active Inventory 433 332 317 385
Pending Inventory 122 161 174 127
Sold Inventory 103 67 89 97
Average Sale Price $283,184 $282,140 $288,186 $301,953
Days on Market 70 105 81 110
Inland Empire Market Report | JULY 2015

MENIFEE
0 50
100 150 200 250 300 350 400 450
12 Months Ago 6 Months Ago 3 Months Ago Last Month
Active Inventory Pending Inventory
Sold Inventory Days on Market
Single Family Residence MENIFEE Single Family Residence
12 Months Ago 6 Months Ago 3 Months Ago Last Month
Active Inventory 418 350 323 418
Pending Inventory 169 197 219 158
Sold Inventory 122 92 175 112
Average Sale Price $286,286 $290,052 $302,675 $306,940
Days on Market 62 68 62 65
Inland Empire Market Report | JULY 2015

MORENO VALLEY
0
100
200
300
400
500
600
700
12 Months Ago 6 Months Ago 3 Months Ago Last Month
Active Inventory Pending Inventory
Sold Inventory Days on Market
Single Family Residence MORENO VALLEY Single Family Residence
12 Months Ago 6 Months Ago 3 Months Ago Last Month
Active Inventory 636 533 458 511
Pending Inventory 219 271 370 285
Sold Inventory 167 119 186 188
Average Sale Price $250,060 $257,056 $261,059 $267,361
Days on Market 61 87 70 57
Inland Empire Market Report | JULY 2015

MURRIETA
0 100 200 300 400 500 600 700 800
12 Months Ago 6 Months Ago 3 Months Ago Last Month
Active Inventory Pending Inventory
Sold Inventory Days on Market
Single Family Residence MURRIETA Single Family Residence
12 Months Ago 6 Months Ago 3 Months Ago Last Month
Active Inventory 730 558 554 655
Pending Inventory 191 278 314 210
Sold Inventory 180 129 219 198
Average Sale Price $372,455 $359,624 $365,930 $394,273
Days on Market 62 114 68 71
Inland Empire Market Report | JULY 2015

NORCO
0
20
40
60
80
100
120
140
12 Months Ago 6 Months Ago 3 Months Ago Last Month
Active Inventory Pending Inventory
Sold Inventory Days on Market
Single Family Residence NORCO Single Family Residence
12 Months Ago 6 Months Ago 3 Months Ago Last Month
Active Inventory 115 99 113 132
Pending Inventory 31 36 41 27
Sold Inventory 12 18 30 27
Average Sale Price $442,583 $522,172 $491,260 $495,294
Days on Market 89 91 66 92
Inland Empire Market Report | JULY 2015

PALM DESERT
0 100 200 300 400 500 600 700 800
12 Months Ago 6 Months Ago 3 Months Ago Last Month
Active Inventory Pending Inventory
Sold Inventory Days on Market
Single Family Residence PALM DESERT Single Family Residence
12 Months Ago 6 Months Ago 3 Months Ago Last Month
Active Inventory 156 717 644 502
Pending Inventory 9 58 59 47
Sold Inventory 47 72 100 75
Average Sale Price $453,189 $466,076 $535,413 $506,264
Days on Market 90 113 131 145
Inland Empire Market Report | JULY 2015

PALM SPRINGS
0 75
150 225 300 375 450 525 600
12 Months Ago 6 Months Ago 3 Months Ago Last Month
Active Inventory Pending Inventory
Sold Inventory Days on Market
Single Family Residence PALM SPRINGS Single Family Residence
12 Months Ago 6 Months Ago 3 Months Ago Last Month
Active Inventory 227 543 462 394
Pending Inventory 50 120 105 73
Sold Inventory 67 53 101 68
Average Sale Price $606,821 $573,728 $667,721 $577,135
Days on Market 83 132 132 80
Inland Empire Market Report | JULY 2015

PERRIS
0 40 80
120 160 200 240 280 320
12 Months Ago 6 Months Ago 3 Months Ago Last Month
Active Inventory Pending Inventory
Sold Inventory Days on Market
Single Family Residence PERRIS Single Family Residence
12 Months Ago 6 Months Ago 3 Months Ago Last Month
Active Inventory 300 273 209 249
Pending Inventory 124 142 180 129
Sold Inventory 72 66 81 82
Average Sale Price $240,432 $253,580 $251,480 $249,531
Days on Market 70 87 64 90
Inland Empire Market Report | JULY 2015

RANCHO MIRAGE
0
75
150
225
300
375
450
525
12 Months Ago 6 Months Ago 3 Months Ago Last Month
Active Inventory Pending Inventory
Sold Inventory Days on Market
Single Family Residence RANCHO MIRAGE Single Family Residence
12 Months Ago 6 Months Ago 3 Months Ago Last Month
Active Inventory 113 468 407 294
Pending Inventory 11 30 38 27
Sold Inventory 29 27 36 22
Average Sale Price $751,778 $712,462 $1,009,512 $676,455
Days on Market 174 134 160 159
Inland Empire Market Report | JULY 2015

RIVERSIDE (city)
0 150 300 450 600 750 900
1050 1200
12 Months Ago 6 Months Ago 3 Months Ago Last Month
Active Inventory Pending Inventory
Sold Inventory Days on Market
Single Family Residence RIVERSIDE (city) Single Family Residence
12 Months Ago 6 Months Ago 3 Months Ago Last Month
Active Inventory 1046 849 870 1082
Pending Inventory 364 419 503 378
Sold Inventory 283 204 281 298
Average Sale Price $351,838 $335,356 $350,136 $363,746
Days on Market 66 85 92 72
Inland Empire Market Report | JULY 2015

SAN JACINTO
0
35
70
105
140
175
210
245
12 Months Ago 6 Months Ago 3 Months Ago Last Month
Active Inventory Pending Inventory
Sold Inventory Days on Market
Single Family Residence SAN JACINTO Single Family Residence
12 Months Ago 6 Months Ago 3 Months Ago Last Month
Active Inventory 223 223 191 220
Pending Inventory 81 90 107 94
Sold Inventory 59 39 61 60
Average Sale Price $193,775 $197,755 $188,369 $225,014
Days on Market 69 93 46 57
Inland Empire Market Report | JULY 2015

TEMECULA TEMECULA
0 100 200 300 400 500 600 700 800 900
12 Months Ago 6 Months Ago 3 Months Ago Last Month
Active Inventory Pending Inventory
Sold Inventory Days on Market
Single Family Residence
12 Months Ago 6 Months Ago 3 Months Ago Last Month
Active Inventory 780 576 618 752
Pending Inventory 246 302 319 205
Sold Inventory 173 120 218 219
Average Sale Price $442,430 $426,870 $452,933 $438,553
Days on Market 89 84 134 82
Inland Empire Market Report | JULY 2015

WILDOMAR WILDOMAR
0 20 40 60 80
100 120 140 160
12 Months Ago 6 Months Ago 3 Months Ago Last Month
Active Inventory Pending Inventory
Sold Inventory Days on Market
Single Family Residence
12 Months Ago 6 Months Ago 3 Months Ago Last Month
Active Inventory 141 122 113 138
Pending Inventory 56 51 72 51
Sold Inventory 51 36 47 52
Average Sale Price $303,015 $286,560 $326,897 $330,656
Days on Market 76 65 87 52
Inland Empire Market Report | JULY 2015

ADELANTO
0 20 40 60 80
100 120 140 160
12 Months Ago 6 Months Ago 3 Months Ago Last Month
Active Inventory Pending Inventory
Sold Inventory Days on Market
Single Family Residence ADELANTO Single Family Residence
12 Months Ago 6 Months Ago 3 Months Ago Last Month
Active Inventory 105 136 106 106
Pending Inventory 43 41 59 54
Sold Inventory 21 17 32 32
Average Sale Price $149,490 $149,135 $154,206 $155,509
Days on Market 47 56 88 65
Inland Empire Market Report | JULY 2015

APPLE VALLEY
0
50
100
150
200
250
300
350
12 Months Ago 6 Months Ago 3 Months Ago Last Month
Active Inventory Pending Inventory
Sold Inventory Days on Market
Single Family Residence APPLE VALLEY Single Family Residence
12 Months Ago 6 Months Ago 3 Months Ago Last Month
Active Inventory 288 281 296 331
Pending Inventory 73 83 100 97
Sold Inventory 50 41 57 65
Average Sale Price $191,312 $201,538 $213,975 $226,142
Days on Market 59 110 59 83
Inland Empire Market Report | JULY 2015

BARSTOW
0 30 60 90
120 150 180 210 240 270
12 Months Ago 6 Months Ago 3 Months Ago Last Month
Active Inventory Pending Inventory
Sold Inventory Days on Market
Single Family Residence BARSTOW Single Family Residence
12 Months Ago 6 Months Ago 3 Months Ago Last Month
Active Inventory 64 42 53 56
Pending Inventory 12 11 13 16
Sold Inventory 5 7 5 7
Average Sale Price $61,000 $82,643 $77,680 $77,641
Days on Market 118 67 240 91
Inland Empire Market Report | JULY 2015

CHINO Single Family Residence
CHINO Single Family Residence
12 Months Ago 6 Months Ago 3 Months Ago Last Month
Active Inventory 195 151 192 259
Pending Inventory 66 78 83 54
Sold Inventory 53 29 47 56
Average Sale Price $431,343 $435,529 $457,446 $441,542
Days on Market 56 110 73 68
Inland Empire Market Report | JULY 2015
0
40
80
120
160
200
240
280
12 Months Ago 6 Months Ago 3 Months Ago Last Month
Active Inventory Pending Inventory
Sold Inventory Days on Market

CHINO HILLS
0
50
100
150
200
250
300
350
12 Months Ago 6 Months Ago 3 Months Ago Last Month
Active Inventory Pending Inventory
Sold Inventory Days on Market
Single Family Residence CHINO HILLS Single Family Residence
12 Months Ago 6 Months Ago 3 Months Ago Last Month
Active Inventory 233 214 236 326
Pending Inventory 72 89 124 58
Sold Inventory 67 47 64 69
Average Sale Price $611,721 $703,226 $648,844 $676,958
Days on Market 60 76 57 73
Inland Empire Market Report | JULY 2015

COLTON
0 15 30 45 60 75 90
105 120
12 Months Ago 6 Months Ago 3 Months Ago Last Month
Active Inventory Pending Inventory
Sold Inventory Days on Market
Single Family Residence COLTON Single Family Residence
12 Months Ago 6 Months Ago 3 Months Ago Last Month
Active Inventory 112 99 85 93
Pending Inventory 47 53 86 59
Sold Inventory 29 26 33 40
Average Sale Price $215,621 $258,971 $248,436 $216,058
Days on Market 37 39 67 40
Inland Empire Market Report | JULY 2015

FONTANA
0
100
200
300
400
500
600
700
12 Months Ago 6 Months Ago 3 Months Ago Last Month
Active Inventory Pending Inventory
Sold Inventory Days on Market
Single Family Residence FONTANA Single Family Residence
12 Months Ago 6 Months Ago 3 Months Ago Last Month
Active Inventory 612 537 457 519
Pending Inventory 244 274 290 276
Sold Inventory 168 126 194 168
Average Sale Price $328,341 $327,312 $338,540 $344,456
Days on Market 57 52 50 56
Inland Empire Market Report | JULY 2015

GRAND TERRACE
0 10 20 30 40 50 60 70 80 90
12 Months Ago 6 Months Ago 3 Months Ago Last Month
Active Inventory Pending Inventory
Sold Inventory Days on Market
Single Family Residence GRAND TERRACE Single Family Residence
12 Months Ago 6 Months Ago 3 Months Ago Last Month
Active Inventory 26 24 21 26
Pending Inventory 6 12 20 8
Sold Inventory 4 12 11 12
Average Sale Price $290,300 $338,408 $328,241 $332,158
Days on Market 20 76 77 44
Inland Empire Market Report | JULY 2015

HESPERIA
0
40
80
120
160
200
240
280
12 Months Ago 6 Months Ago 3 Months Ago Last Month
Active Inventory Pending Inventory
Sold Inventory Days on Market
Single Family Residence HESPERIA Single Family Residence
12 Months Ago 6 Months Ago 3 Months Ago Last Month
Active Inventory 256 246 230 261
Pending Inventory 97 122 137 124
Sold Inventory 61 49 85 75
Average Sale Price $198,723 $187,801 $208,649 $216,940
Days on Market 49 49 66 50
Inland Empire Market Report | JULY 2015

HIGHLAND
0 20 40 60 80
100 120 140 160
12 Months Ago 6 Months Ago 3 Months Ago Last Month
Active Inventory Pending Inventory
Sold Inventory Days on Market
Single Family Residence HIGHLAND Single Family Residence
12 Months Ago 6 Months Ago 3 Months Ago Last Month
Active Inventory 141 133 104 132
Pending Inventory 63 95 83 55
Sold Inventory 49 30 59 38
Average Sale Price $281,048 $256,781 $291,994 $250,808
Days on Market 91 66 61 53
Inland Empire Market Report | JULY 2015

LOMA LINDA
0 10 20 30 40 50 60 70 80 90
12 Months Ago 6 Months Ago 3 Months Ago Last Month
Active Inventory Pending Inventory
Sold Inventory Days on Market
Single Family Residence LOMA LINDA Single Family Residence
12 Months Ago 6 Months Ago 3 Months Ago Last Month
Active Inventory 44 49 38 45
Pending Inventory 17 16 30 20
Sold Inventory 12 9 15 17
Average Sale Price $391,567 $310,833 $374,136 $371,847
Days on Market 63 81 71 82
Inland Empire Market Report | JULY 2015
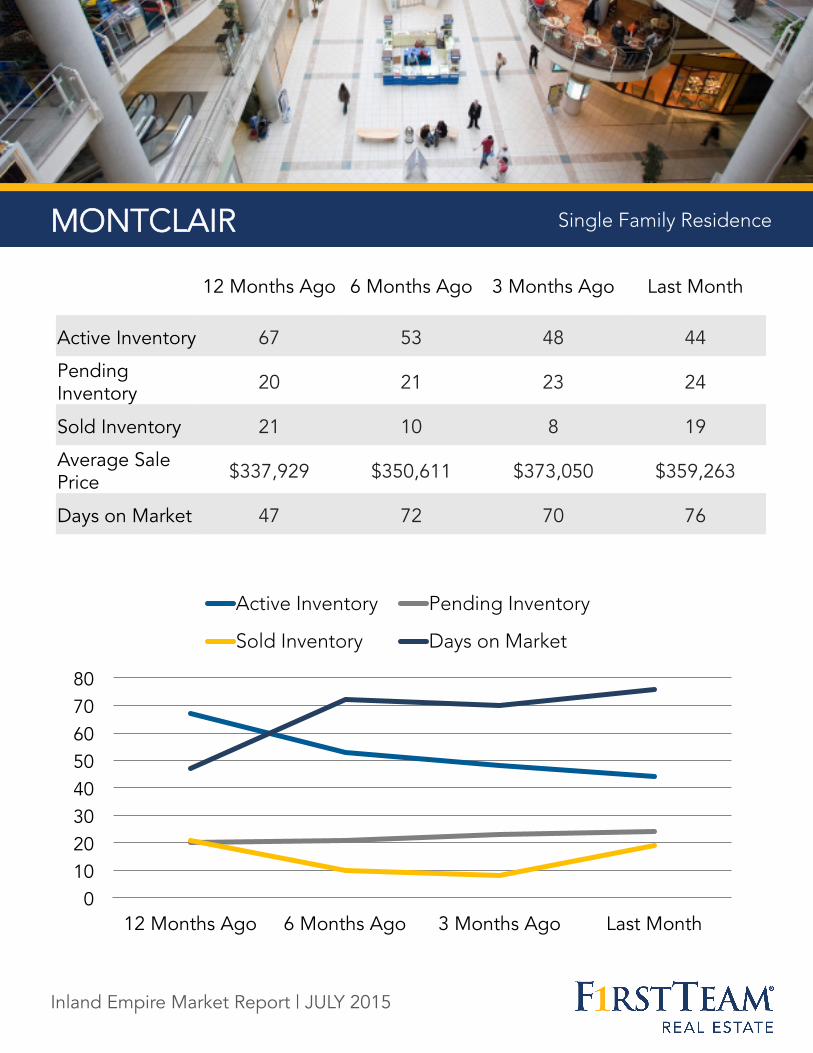
MONTCLAIR
0 10 20 30 40 50 60 70 80
12 Months Ago 6 Months Ago 3 Months Ago Last Month
Active Inventory Pending Inventory
Sold Inventory Days on Market
Single Family Residence MONTCLAIR Single Family Residence
12 Months Ago 6 Months Ago 3 Months Ago Last Month
Active Inventory 67 53 48 44
Pending Inventory 20 21 23 24
Sold Inventory 21 10 8 19
Average Sale Price $337,929 $350,611 $373,050 $359,263
Days on Market 47 72 70 76
Inland Empire Market Report | JULY 2015

ONTARIO
0 40 80
120 160 200 240 280 320
12 Months Ago 6 Months Ago 3 Months Ago Last Month
Active Inventory Pending Inventory
Sold Inventory Days on Market
Single Family Residence ONTARIO Single Family Residence
12 Months Ago 6 Months Ago 3 Months Ago Last Month
Active Inventory 274 246 247 298
Pending Inventory 113 126 158 111
Sold Inventory 85 56 76 88
Average Sale Price $351,875 $337,502 $357,909 $353,945
Days on Market 52 64 78 47
Inland Empire Market Report | JULY 2015

RANCHO CUCAMONGA
0
75
150
225
300
375
450
525
12 Months Ago 6 Months Ago 3 Months Ago Last Month
Active Inventory Pending Inventory
Sold Inventory Days on Market
Single Family Residence RANCHO CUCAMONGA Single Family Residence
12 Months Ago 6 Months Ago 3 Months Ago Last Month
Active Inventory 399 350 361 459
Pending Inventory 160 170 189 132
Sold Inventory 110 89 133 132
Average Sale Price $459,356 $497,148 $522,103 $525,486
Days on Market 62 88 63 57
Inland Empire Market Report | JULY 2015

REDLANDS
0 40 80
120 160 200 240 280 320
12 Months Ago 6 Months Ago 3 Months Ago Last Month
Active Inventory Pending Inventory
Sold Inventory Days on Market
Single Family Residence REDLANDS Single Family Residence
12 Months Ago 6 Months Ago 3 Months Ago Last Month
Active Inventory 226 179 229 275
Pending Inventory 79 103 107 78
Sold Inventory 61 44 57 72
Average Sale Price $346,217 $389,599 $363,772 $372,267
Days on Market 70 93 71 55
Inland Empire Market Report | JULY 2015

RIALTO
0 30 60 90
120 150 180 210 240
12 Months Ago 6 Months Ago 3 Months Ago Last Month
Active Inventory Pending Inventory
Sold Inventory Days on Market
Single Family Residence RIALTO Single Family Residence
12 Months Ago 6 Months Ago 3 Months Ago Last Month
Active Inventory 218 224 163 189
Pending Inventory 115 129 144 102
Sold Inventory 71 58 88 76
Average Sale Price $255,996 $267,022 $272,311 $288,759
Days on Market 40 59 54 41
Inland Empire Market Report | JULY 2015

SAN BERNARDINO (city)
0 75
150 225 300 375 450 525 600 675
12 Months Ago 6 Months Ago 3 Months Ago Last Month
Active Inventory Pending Inventory
Sold Inventory Days on Market
Single Family Residence SAN BERNARDINO (city) Single Family Residence
12 Months Ago 6 Months Ago 3 Months Ago Last Month
Active Inventory 578 519 475 542
Pending Inventory 269 290 349 279
Sold Inventory 178 96 191 161
Average Sale Price $205,791 $204,734 $225,814 $219,838
Days on Market 60 68 60 51
Inland Empire Market Report | JULY 2015

UPLAND
0
40
80
120
160
200
240
280
12 Months Ago 6 Months Ago 3 Months Ago Last Month
Active Inventory Pending Inventory
Sold Inventory Days on Market
Single Family Residence UPLAND Single Family Residence
12 Months Ago 6 Months Ago 3 Months Ago Last Month
Active Inventory 206 177 195 246
Pending Inventory 62 81 104 61
Sold Inventory 53 36 58 82
Average Sale Price $507,685 $495,799 $483,069 $561,156
Days on Market 70 82 81 75
Inland Empire Market Report | JULY 2015

VICTORVILLE
0
75
150
225
300
375
450
525
12 Months Ago 6 Months Ago 3 Months Ago Last Month
Active Inventory Pending Inventory
Sold Inventory Days on Market
Single Family Residence VICTORVILLE Single Family Residence
12 Months Ago 6 Months Ago 3 Months Ago Last Month
Active Inventory 447 464 431 483
Pending Inventory 172 159 220 193
Sold Inventory 100 88 127 104
Average Sale Price $181,967 $180,495 $195,744 $205,121
Days on Market 58 82 97 88
Inland Empire Market Report | JULY 2015

YUCAIPA
0 30 60 90
120 150 180 210 240
12 Months Ago 6 Months Ago 3 Months Ago Last Month
Active Inventory Pending Inventory
Sold Inventory Days on Market
Single Family Residence YUCAIPA Single Family Residence
12 Months Ago 6 Months Ago 3 Months Ago Last Month
Active Inventory 211 176 194 219
Pending Inventory 54 78 94 72
Sold Inventory 50 37 44 51
Average Sale Price $299,400 $317,449 $303,869 $348,413
Days on Market 66 109 81 120
Inland Empire Market Report | JULY 2015

YUCCA VALLEY
0 40 80
120 160 200 240 280 320
12 Months Ago 6 Months Ago 3 Months Ago Last Month
Active Inventory Pending Inventory
Sold Inventory Days on Market
Single Family Residence YUCCA VALLEY Single Family Residence
12 Months Ago 6 Months Ago 3 Months Ago Last Month
Active Inventory 252 296 236 249
Pending Inventory 40 59 55 40
Sold Inventory 35 36 34 40
Average Sale Price $141,347 $147,644 $133,400 $161,426
Days on Market 51 249 106 104
Inland Empire Market Report | JULY 2015

Contact one of our local neighborhood experts for more exclusive market data, or to help you get started with buying or selling your next home.
Email: [email protected]
Phone: 888-870-1142
Web: FirstTeam.com
Connect With Us!
WANT MORE INFO?
Inland Empire Market Report | JULY 2015