inland empire real estate market update | april 2015
DESCRIPTION
Riverside and San Bernardino Counties real estate market report.TRANSCRIPT

APRIL 2015
Inland Empire Market Report APRIL 2015
Riverside County San Bernardino County
Banning La Quinta Adelanto Ontario
Beaumont Lake Elsinore Apple Valley Rancho Cucamonga
Blythe Menifee Barstow Redlands
Calimesa Moreno Valley Chino Rialto
Canyon Lake Murrieta Chino Hills San Bernardino (city)
Cathedral City Norco Colton Upland
Corona Palm Desert Fontana Victorville
Coachella Palm Springs Grand Terrace Yucaipa
Desert Hot Springs Perris Hesperia Yucca Valley
Eastvale Rancho Mirage Highland
Hemet Riverside (city) Loma Linda
Indian Wells San Jacinto Montclair
Indio Temecula Needles
Jurupa Valley Wildomar
TABLE OF CONTENTS
All reports presented within this document are based on data supplied by the CARETS (CLAW, CRISNet MLS, DAMLS, CRMLS, i-‐Tech MLS, and/or VCRDS) or their MLSs. Neither the AssociaGons nor their MLSs guarantee or are in anyway responsible for their accuracy. Data maintained by the AssociaGons or their MLSs may not reflect all real estate acGviGes in the market. InformaGon deemed reliable but not guaranteed.
Inland Empire Market Report | APRIL 2015

BANNING Single Family Residence
BANNING
0 25 50 75
100 125 150 175 200
12 Months Ago 6 Months Ago 3 Months Ago Last Month
Active Inventory Pending Inventory
Sold Inventory Days on Market
Single Family Residence
12 Months Ago 6 Months Ago 3 Months Ago Last Month
Active Inventory 156 184 162 150
Pending Inventory 56 46 60 52
Sold Inventory 31 34 18 50
Average Sale Price $168,203 $163,048 $132,720 $182,272
Days on Market 87 103 77 95
Inland Empire Market Report | APRIL 2015

BEAUMONT
View homes for sale in Aliso Viejo >>
0
50
100
150
200
250
300
12 Months Ago 6 Months Ago 3 Months Ago Last Month
Active Inventory Pending Inventory
Sold Inventory Days on Market
Single Family Residence BEAUMONT
12 Months Ago 6 Months Ago 3 Months Ago Last Month
Active Inventory 248 256 220 250
Pending Inventory 105 91 116 106
Sold Inventory 74 53 39 66
Average Sale Price $211,799 $194,326 $213,677 $202,511
Days on Market 43 60 83 52
Inland Empire Market Report | APRIL 2015

BLYTHE
View homes for sale in Aliso Viejo >>
0
25
50
75
100
125
150
175
12 Months Ago 6 Months Ago 3 Months Ago Last Month
Active Inventory Pending Inventory
Sold Inventory Days on Market
BLYTHE Single Family Residence
12 Months Ago 6 Months Ago 3 Months Ago Last Month
Active Inventory 55 40 47 51
Pending Inventory 17 9 13 16
Sold Inventory 10 4 7 9
Average Sale Price $116,715 $110,888 $133,914 $139,333
Days on Market 54 147 100 111
Inland Empire Market Report | APRIL 2015

CALIMESA
0 20 40 60 80
100 120 140 160
12 Months Ago 6 Months Ago 3 Months Ago Last Month
Active Inventory Pending Inventory
Sold Inventory Days on Market
CALIMESA Single Family Residence
12 Months Ago 6 Months Ago 3 Months Ago Last Month
Active Inventory 27 22 16 20
Pending Inventory 11 21 7 17
Sold Inventory 6 2 5 5
Average Sale Price $226,159 $109,038 $264,780 $218,692
Days on Market 155 25 76 25
Inland Empire Market Report | APRIL 2015

CANYON LAKE
0
25
50
75
100
125
150
175
12 Months Ago 6 Months Ago 3 Months Ago Last Month
Active Inventory Pending Inventory
Sold Inventory Days on Market
CANYON LAKE Single Family Residence
12 Months Ago 6 Months Ago 3 Months Ago Last Month
Active Inventory 165 142 124 161
Pending Inventory 32 35 39 29
Sold Inventory 25 20 19 29
Average Sale Price $400,100 $293,031 $228,782 $316,062
Days on Market 85 105 84 103
Inland Empire Market Report | APRIL 2015

CATHEDRAL CITY Single Family Residence
CATHEDRAL CITY Single Family Residence
12 Months Ago 6 Months Ago 3 Months Ago Last Month
Active Inventory 231 276 254 245
Pending Inventory 56 47 63 43
Sold Inventory 57 32 45 50
Average Sale Price $234,669 $235,177 $215,167 $239,590
Days on Market 71 171 122 121
Inland Empire Market Report | APRIL 2015
0
45
90
135
180
225
270
315
12 Months Ago 6 Months Ago 3 Months Ago Last Month
Active Inventory Pending Inventory
Sold Inventory Days on Market

CORONA
0 100 200 300 400 500 600 700 800
12 Months Ago 6 Months Ago 3 Months Ago Last Month
Active Inventory Pending Inventory
Sold Inventory Days on Market
CORONA Single Family Residence
12 Months Ago 6 Months Ago 3 Months Ago Last Month
Active Inventory 651 714 586 731
Pending Inventory 259 248 265 242
Sold Inventory 178 126 136 187
Average Sale Price $316,387 $292,873 $298,333 $339,502
Days on Market 67 84 65 74
Inland Empire Market Report | APRIL 2015

COACHELLA
0 15 30 45 60 75 90
105 120
12 Months Ago 6 Months Ago 3 Months Ago Last Month
Active Inventory Pending Inventory
Sold Inventory Days on Market
Single Family Residence COACHELLA Single Family Residence
12 Months Ago 6 Months Ago 3 Months Ago Last Month
Active Inventory 58 61 63 59
Pending Inventory 20 18 17 22
Sold Inventory 13 12 11 15
Average Sale Price $169,383 $177,025 $157,293 $161,206
Days on Market 57 70 101 92
Inland Empire Market Report | APRIL 2015

DESERT HOT SPRINGS
0
50
100
150
200
250
300
350
12 Months Ago 6 Months Ago 3 Months Ago Last Month
Active Inventory Pending Inventory
Sold Inventory Days on Market
DESERT HOT SPRINGS Single Family Residence
12 Months Ago 6 Months Ago 3 Months Ago Last Month
Active Inventory 226 292 304 292
Pending Inventory 74 49 48 50
Sold Inventory 52 26 30 37
Average Sale Price $122,349 $111,398 $80,355 $123,548
Days on Market 108 82 86 83
Inland Empire Market Report | APRIL 2015

EASTVALE
0 25 50 75
100 125 150 175 200 225
12 Months Ago 6 Months Ago 3 Months Ago Last Month
Active Inventory Pending Inventory
Sold Inventory Days on Market
Single Family Residence EASTVALE Single Family Residence
12 Months Ago 6 Months Ago 3 Months Ago Last Month
Active Inventory 188 199 153 200
Pending Inventory 86 68 83 55
Sold Inventory 59 41 37 47
Average Sale Price $261,528 $270,661 $236,736 $268,516
Days on Market 66 79 67 54
Inland Empire Market Report | APRIL 2015

HEMET Single Family Residence
HEMET Single Family Residence
12 Months Ago 6 Months Ago 3 Months Ago Last Month
Active Inventory 538 648 555 534
Pending Inventory 226 217 226 247
Sold Inventory 153 125 113 157
Average Sale Price $170,765 $169,228 $135,030 $163,847
Days on Market 88 88 81 71
Inland Empire Market Report | APRIL 2015
0 75
150 225 300 375 450 525 600 675 750
12 Months Ago 6 Months Ago 3 Months Ago Last Month
Active Inventory Pending Inventory
Sold Inventory Days on Market

INDIAN WELLS
0
45
90
135
180
225
270
315
12 Months Ago 6 Months Ago 3 Months Ago Last Month
Active Inventory Pending Inventory
Sold Inventory Days on Market
Single Family Residence INDIAN WELLS Single Family Residence
12 Months Ago 6 Months Ago 3 Months Ago Last Month
Active Inventory 198 182 262 246
Pending Inventory 14 8 8 13
Sold Inventory 21 8 14 16
Average Sale Price $1,608,386 $947,364 $1,048,620 $701,814
Days on Market 167 65 116 134
Inland Empire Market Report | APRIL 2015

INDIO
0 75
150 225 300 375 450 525 600 675 750
12 Months Ago 6 Months Ago 3 Months Ago Last Month
Active Inventory Pending Inventory
Sold Inventory Days on Market
Single Family Residence INDIO Single Family Residence
12 Months Ago 6 Months Ago 3 Months Ago Last Month
Active Inventory 465 583 677 578
Pending Inventory 102 79 103 120
Sold Inventory 97 68 75 85
Average Sale Price $217,269 $256,285 $207,950 $229,040
Days on Market 74 78 110 120
Inland Empire Market Report | APRIL 2015

JURUPA VALLEY Single Family Residence
JURUPA VALLEY Single Family Residence
12 Months Ago 6 Months Ago 3 Months Ago Last Month
Active Inventory 62 87 101 102
Pending Inventory 45 40 38 43
Sold Inventory 14 18 17 22
Average Sale Price $270,413 $263,992 $321,788 $279,435
Days on Market 33 61 88 66
Inland Empire Market Report | APRIL 2015
0 15 30 45 60 75 90
105 120
12 Months Ago 6 Months Ago 3 Months Ago Last Month
Active Inventory Pending Inventory
Sold Inventory Days on Market

LA QUINTA
0 100 200 300 400 500 600 700 800 900
1000
12 Months Ago 6 Months Ago 3 Months Ago Last Month
Active Inventory Pending Inventory
Sold Inventory Days on Market
Single Family Residence LA QUINTA Single Family Residence
12 Months Ago 6 Months Ago 3 Months Ago Last Month
Active Inventory 760 764 949 902
Pending Inventory 74 62 75 95
Sold Inventory 109 53 73 106
Average Sale Price $589,421 $476,876 $613,447 $550,898
Days on Market 132 164 179 139
Inland Empire Market Report | APRIL 2015

LAKE ELSINORE
0 45 90
135 180 225 270 315 360 405
12 Months Ago 6 Months Ago 3 Months Ago Last Month
Active Inventory Pending Inventory
Sold Inventory Days on Market
Single Family Residence LAKE ELSINORE Single Family Residence
12 Months Ago 6 Months Ago 3 Months Ago Last Month
Active Inventory 373 359 332 375
Pending Inventory 172 149 161 131
Sold Inventory 96 73 67 96
Average Sale Price $200,485 $201,113 $220,171 $236,587
Days on Market 124 80 105 76
Inland Empire Market Report | APRIL 2015
MENIFEE
0 50
100 150 200 250 300 350 400 450
12 Months Ago 6 Months Ago 3 Months Ago Last Month
Active Inventory Pending Inventory
Sold Inventory Days on Market
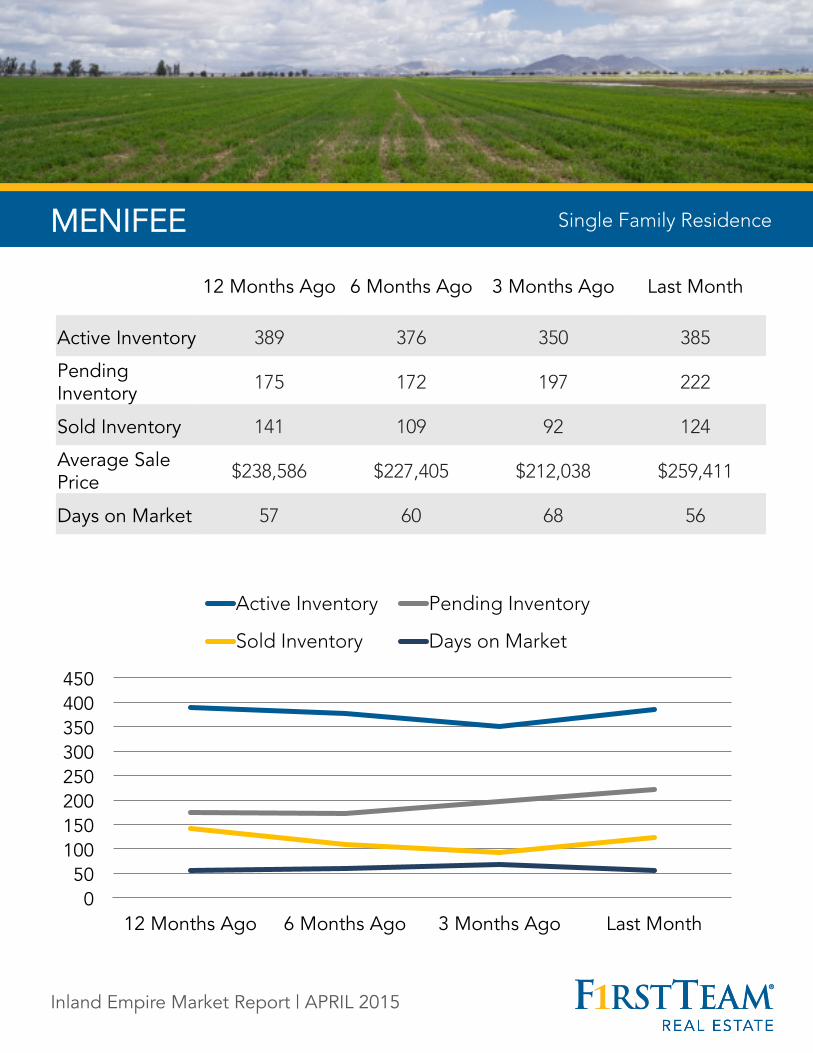
Single Family Residence MENIFEE Single Family Residence
12 Months Ago 6 Months Ago 3 Months Ago Last Month
Active Inventory 389 376 350 385
Pending Inventory 175 172 197 222
Sold Inventory 141 109 92 124
Average Sale Price $238,586 $227,405 $212,038 $259,411
Days on Market 57 60 68 56
Inland Empire Market Report | APRIL 2015

MORENO VALLEY
0 75
150 225 300 375 450 525 600 675
12 Months Ago 6 Months Ago 3 Months Ago Last Month
Active Inventory Pending Inventory
Sold Inventory Days on Market
Single Family Residence MORENO VALLEY Single Family Residence
12 Months Ago 6 Months Ago 3 Months Ago Last Month
Active Inventory 428 601 533 537
Pending Inventory 291 257 271 302
Sold Inventory 176 127 119 162
Average Sale Price $191,294 $198,089 $170,243 $201,309
Days on Market 52 79 87 66
Inland Empire Market Report | APRIL 2015

MURRIETA
0 75
150 225 300 375 450 525 600 675 750
12 Months Ago 6 Months Ago 3 Months Ago Last Month
Active Inventory Pending Inventory
Sold Inventory Days on Market
Single Family Residence MURRIETA Single Family Residence
12 Months Ago 6 Months Ago 3 Months Ago Last Month
Active Inventory 651 675 558 633
Pending Inventory 259 219 278 256
Sold Inventory 169 122 129 156
Average Sale Price $266,923 $244,768 $252,624 $304,741
Days on Market 102 114 114 83
Inland Empire Market Report | APRIL 2015
NORCO Single Family Residence
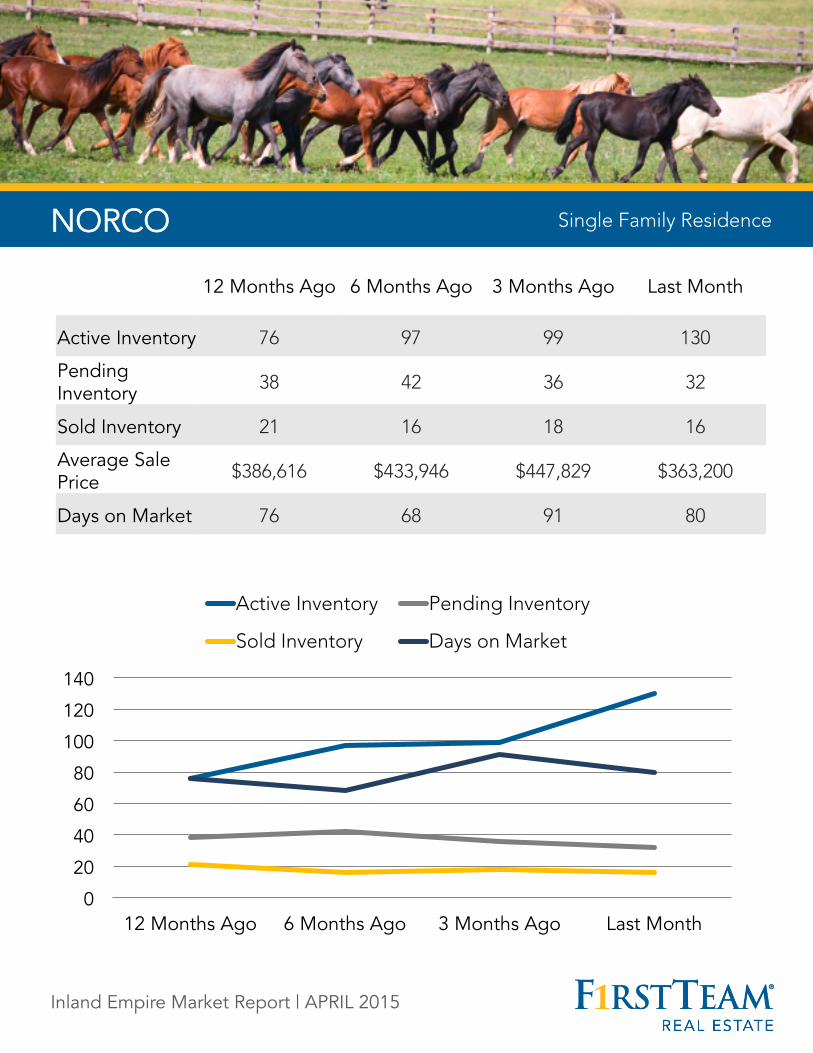
NORCO Single Family Residence
12 Months Ago 6 Months Ago 3 Months Ago Last Month
Active Inventory 76 97 99 130
Pending Inventory 38 42 36 32
Sold Inventory 21 16 18 16
Average Sale Price $386,616 $433,946 $447,829 $363,200
Days on Market 76 68 91 80
Inland Empire Market Report | APRIL 2015
0
20
40
60
80
100
120
140
12 Months Ago 6 Months Ago 3 Months Ago Last Month
Active Inventory Pending Inventory
Sold Inventory Days on Market

PALM DESERT
0 100 200 300 400 500 600 700 800
12 Months Ago 6 Months Ago 3 Months Ago Last Month
Active Inventory Pending Inventory
Sold Inventory Days on Market
Single Family Residence PALM DESERT Single Family Residence
12 Months Ago 6 Months Ago 3 Months Ago Last Month
Active Inventory 525 643 717 683
Pending Inventory 54 59 58 65
Sold Inventory 117 70 72 99
Average Sale Price $509,807 $292,572 $278,419 $354,140
Days on Market 110 110 113 110
Inland Empire Market Report | APRIL 2015
PALM SPRINGS
0 75
150 225 300 375 450 525 600
12 Months Ago 6 Months Ago 3 Months Ago Last Month
Active Inventory Pending Inventory
Sold Inventory Days on Market
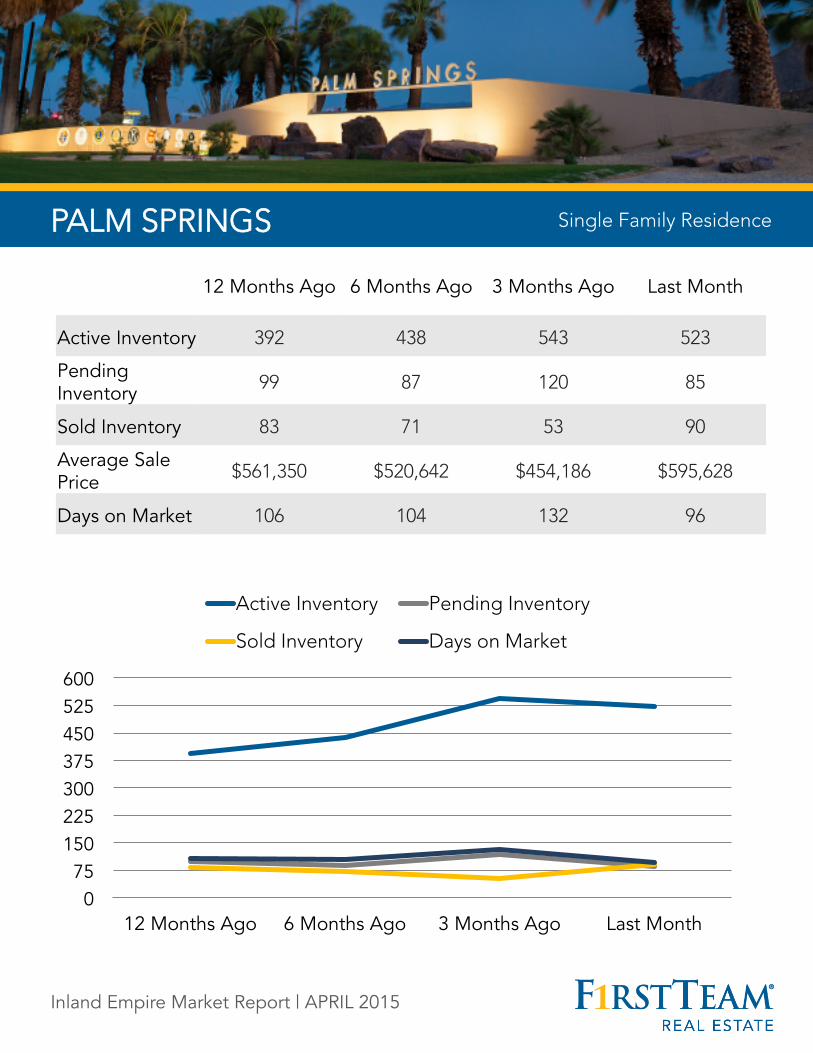
Single Family Residence PALM SPRINGS Single Family Residence
12 Months Ago 6 Months Ago 3 Months Ago Last Month
Active Inventory 392 438 543 523
Pending Inventory 99 87 120 85
Sold Inventory 83 71 53 90
Average Sale Price $561,350 $520,642 $454,186 $595,628
Days on Market 106 104 132 96
Inland Empire Market Report | APRIL 2015

PERRIS
0 40 80
120 160 200 240 280 320
12 Months Ago 6 Months Ago 3 Months Ago Last Month
Active Inventory Pending Inventory
Sold Inventory Days on Market
Single Family Residence PERRIS Single Family Residence
12 Months Ago 6 Months Ago 3 Months Ago Last Month
Active Inventory 254 292 273 277
Pending Inventory 157 131 142 153
Sold Inventory 76 63 66 89
Average Sale Price $198,962 $173,667 $193,494 $209,315
Days on Market 59 53 87 83
Inland Empire Market Report | APRIL 2015

RANCHO MIRAGE
0
75
150
225
300
375
450
525
12 Months Ago 6 Months Ago 3 Months Ago Last Month
Active Inventory Pending Inventory
Sold Inventory Days on Market
Single Family Residence RANCHO MIRAGE Single Family Residence
12 Months Ago 6 Months Ago 3 Months Ago Last Month
Active Inventory 358 358 468 429
Pending Inventory 27 34 30 34
Sold Inventory 54 18 27 46
Average Sale Price $738,030 $579,679 $676,596 $737,696
Days on Market 124 108 134 133
Inland Empire Market Report | APRIL 2015
RIVERSIDE (city)
0 100 200 300 400 500 600 700 800 900
1000 1100
12 Months Ago 6 Months Ago 3 Months Ago Last Month
Active Inventory Pending Inventory
Sold Inventory Days on Market
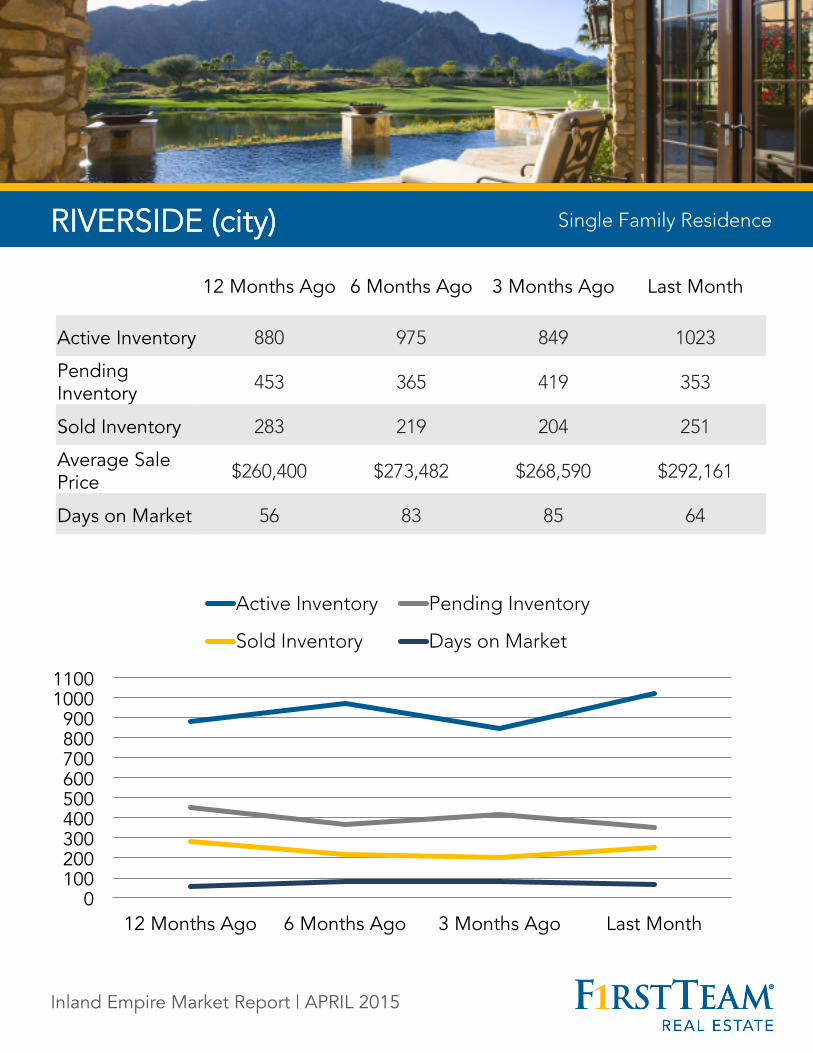
Single Family Residence RIVERSIDE (city) Single Family Residence
12 Months Ago 6 Months Ago 3 Months Ago Last Month
Active Inventory 880 975 849 1023
Pending Inventory 453 365 419 353
Sold Inventory 283 219 204 251
Average Sale Price $260,400 $273,482 $268,590 $292,161
Days on Market 56 83 85 64
Inland Empire Market Report | APRIL 2015
SAN JACINTO
0 35 70
105 140 175 210 245 280
12 Months Ago 6 Months Ago 3 Months Ago Last Month
Active Inventory Pending Inventory
Sold Inventory Days on Market
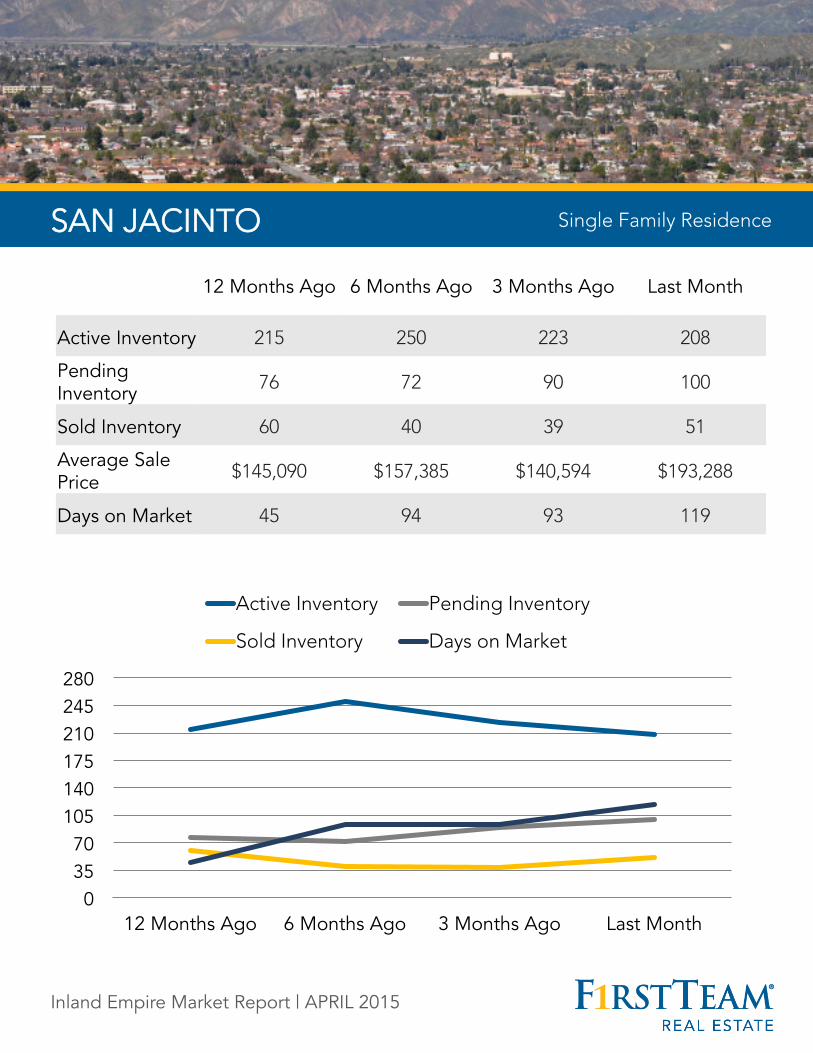
Single Family Residence SAN JACINTO Single Family Residence
12 Months Ago 6 Months Ago 3 Months Ago Last Month
Active Inventory 215 250 223 208
Pending Inventory 76 72 90 100
Sold Inventory 60 40 39 51
Average Sale Price $145,090 $157,385 $140,594 $193,288
Days on Market 45 94 93 119
Inland Empire Market Report | APRIL 2015

TEMECULA TEMECULA Single Family Residence
12 Months Ago 6 Months Ago 3 Months Ago Last Month
Active Inventory 721 658 576 681
Pending Inventory 269 232 302 251
Sold Inventory 190 128 120 186
Average Sale Price $354,339 $319,220 $282,068 $375,305
Days on Market 158 70 84 99
Inland Empire Market Report | APRIL 2015
0 100 200 300 400 500 600 700 800
12 Months Ago 6 Months Ago 3 Months Ago Last Month
Active Inventory Pending Inventory
Sold Inventory Days on Market

WILDOMAR WILDOMAR
0 20 40 60 80
100 120 140 160
12 Months Ago 6 Months Ago 3 Months Ago Last Month
Active Inventory Pending Inventory
Sold Inventory Days on Market
Single Family Residence
12 Months Ago 6 Months Ago 3 Months Ago Last Month
Active Inventory 127 141 122 128
Pending Inventory 65 47 51 64
Sold Inventory 38 36 36 31
Average Sale Price $221,089 $244,027 $229,613 $279,301
Days on Market 45 72 65 69
Inland Empire Market Report | APRIL 2015

ADELANTO
0 20 40 60 80
100 120 140 160
12 Months Ago 6 Months Ago 3 Months Ago Last Month
Active Inventory Pending Inventory
Sold Inventory Days on Market
Single Family Residence ADELANTO Single Family Residence
12 Months Ago 6 Months Ago 3 Months Ago Last Month
Active Inventory 84 119 136 121
Pending Inventory 49 38 41 50
Sold Inventory 33 18 17 31
Average Sale Price $99,293 $118,632 $105,930 $153,576
Days on Market 129 43 56 52
Inland Empire Market Report | APRIL 2015

APPLE VALLEY
0
50
100
150
200
250
300
350
12 Months Ago 6 Months Ago 3 Months Ago Last Month
Active Inventory Pending Inventory
Sold Inventory Days on Market
Single Family Residence APPLE VALLEY Single Family Residence
12 Months Ago 6 Months Ago 3 Months Ago Last Month
Active Inventory 256 314 281 267
Pending Inventory 84 81 83 110
Sold Inventory 59 36 41 55
Average Sale Price $180,098 $178,351 $192,215 $208,787
Days on Market 81 92 110 74
Inland Empire Market Report | APRIL 2015

BARSTOW
0 25 50 75
100 125 150 175 200
12 Months Ago 6 Months Ago 3 Months Ago Last Month
Active Inventory Pending Inventory
Sold Inventory Days on Market
Single Family Residence BARSTOW Single Family Residence
12 Months Ago 6 Months Ago 3 Months Ago Last Month
Active Inventory 57 60 42 44
Pending Inventory 12 9 11 6
Sold Inventory 3 9 7 7
Average Sale Price $130,333 $111,978 $82,643 $92,248
Days on Market 173 93 67 119
Inland Empire Market Report | APRIL 2015

CHINO Single Family Residence
CHINO Single Family Residence
12 Months Ago 6 Months Ago 3 Months Ago Last Month
Active Inventory 175 174 151 196
Pending Inventory 93 75 78 69
Sold Inventory 62 47 29 51
Average Sale Price $294,225 $302,800 $254,716 $332,275
Days on Market 55 64 110 77
Inland Empire Market Report | APRIL 2015
0 25 50 75
100 125 150 175 200 225
12 Months Ago 6 Months Ago 3 Months Ago Last Month
Active Inventory Pending Inventory
Sold Inventory Days on Market

CHINO HILLS
0
50
100
150
200
250
300
12 Months Ago 6 Months Ago 3 Months Ago Last Month
Active Inventory Pending Inventory
Sold Inventory Days on Market
Single Family Residence CHINO HILLS Single Family Residence
12 Months Ago 6 Months Ago 3 Months Ago Last Month
Active Inventory 230 231 214 268
Pending Inventory 90 69 89 75
Sold Inventory 75 47 47 58
Average Sale Price $392,961 $407,806 $409,099 $401,728
Days on Market 45 62 76 76
Inland Empire Market Report | APRIL 2015

COLTON
0 15 30 45 60 75 90
105 120
12 Months Ago 6 Months Ago 3 Months Ago Last Month
Active Inventory Pending Inventory
Sold Inventory Days on Market
Single Family Residence COLTON Single Family Residence
12 Months Ago 6 Months Ago 3 Months Ago Last Month
Active Inventory 79 103 99 106
Pending Inventory 64 60 53 71
Sold Inventory 25 29 26 28
Average Sale Price $181,807 $228,596 $249,430 $182,657
Days on Market 42 81 39 49
Inland Empire Market Report | APRIL 2015
FONTANA
0 75
150 225 300 375 450 525 600 675
12 Months Ago 6 Months Ago 3 Months Ago Last Month
Active Inventory Pending Inventory
Sold Inventory Days on Market
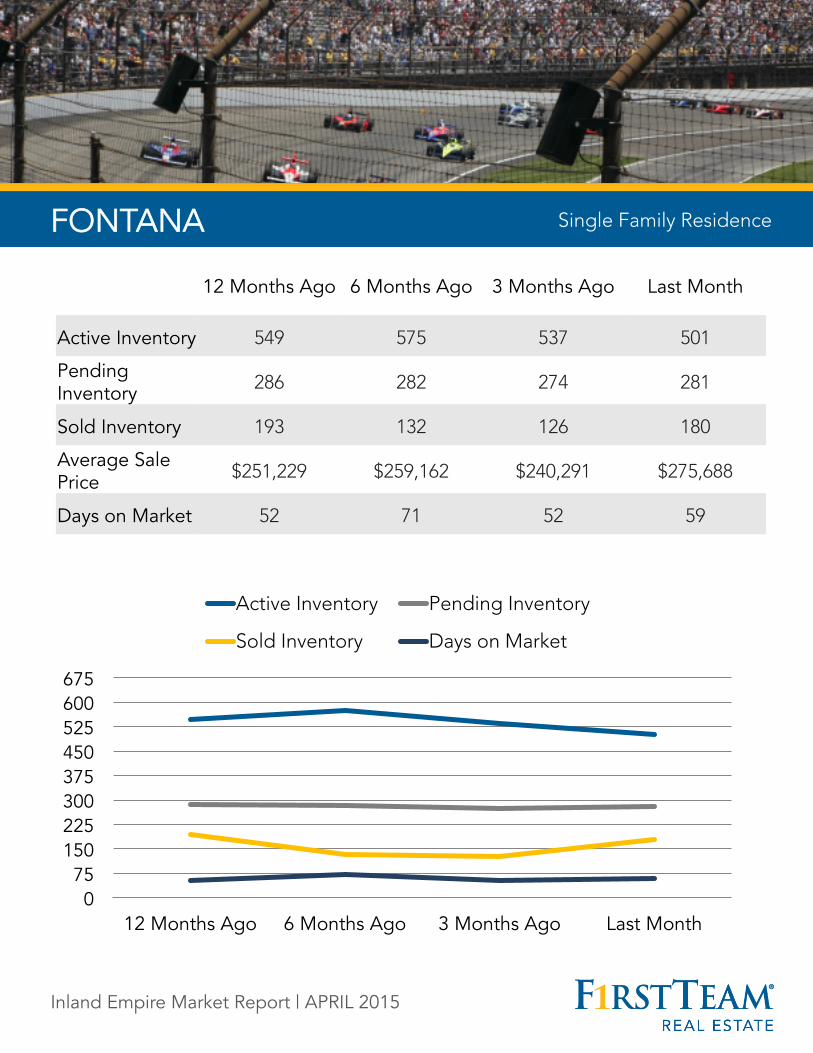
Single Family Residence FONTANA Single Family Residence
12 Months Ago 6 Months Ago 3 Months Ago Last Month
Active Inventory 549 575 537 501
Pending Inventory 286 282 274 281
Sold Inventory 193 132 126 180
Average Sale Price $251,229 $259,162 $240,291 $275,688
Days on Market 52 71 52 59
Inland Empire Market Report | APRIL 2015
GRAND TERRACE
0 10 20 30 40 50 60 70 80
12 Months Ago 6 Months Ago 3 Months Ago Last Month
Active Inventory Pending Inventory
Sold Inventory Days on Market
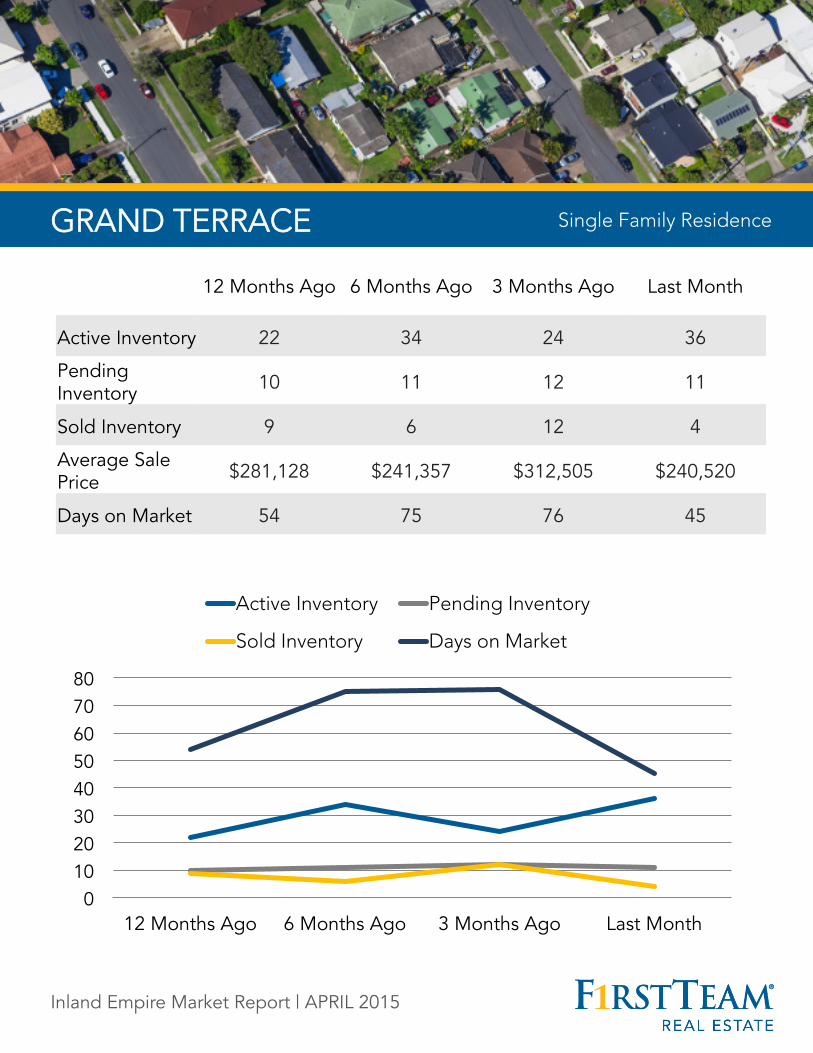
Single Family Residence GRAND TERRACE Single Family Residence
12 Months Ago 6 Months Ago 3 Months Ago Last Month
Active Inventory 22 34 24 36
Pending Inventory 10 11 12 11
Sold Inventory 9 6 12 4
Average Sale Price $281,128 $241,357 $312,505 $240,520
Days on Market 54 75 76 45
Inland Empire Market Report | APRIL 2015

HESPERIA
0
45
90
135
180
225
270
315
12 Months Ago 6 Months Ago 3 Months Ago Last Month
Active Inventory Pending Inventory
Sold Inventory Days on Market
Single Family Residence HESPERIA Single Family Residence
12 Months Ago 6 Months Ago 3 Months Ago Last Month
Active Inventory 214 284 246 251
Pending Inventory 105 109 122 140
Sold Inventory 49 43 49 67
Average Sale Price $176,918 $187,448 $158,872 $190,085
Days on Market 110 50 49 75
Inland Empire Market Report | APRIL 2015

HIGHLAND
0 20 40 60 80
100 120 140 160
12 Months Ago 6 Months Ago 3 Months Ago Last Month
Active Inventory Pending Inventory
Sold Inventory Days on Market
Single Family Residence HIGHLAND Single Family Residence
12 Months Ago 6 Months Ago 3 Months Ago Last Month
Active Inventory 122 142 133 142
Pending Inventory 74 59 95 68
Sold Inventory 69 37 30 67
Average Sale Price $227,124 $206,812 $214,276 $255,706
Days on Market 53 51 66 57
Inland Empire Market Report | APRIL 2015

LOMA LINDA
0 10 20 30 40 50 60 70 80 90
12 Months Ago 6 Months Ago 3 Months Ago Last Month
Active Inventory Pending Inventory
Sold Inventory Days on Market
Single Family Residence LOMA LINDA Single Family Residence
12 Months Ago 6 Months Ago 3 Months Ago Last Month
Active Inventory 37 48 49 54
Pending Inventory 26 10 16 16
Sold Inventory 14 6 9 14
Average Sale Price $232,832 $212,890 $187,228 $265,600
Days on Market 58 68 81 64
Inland Empire Market Report | APRIL 2015
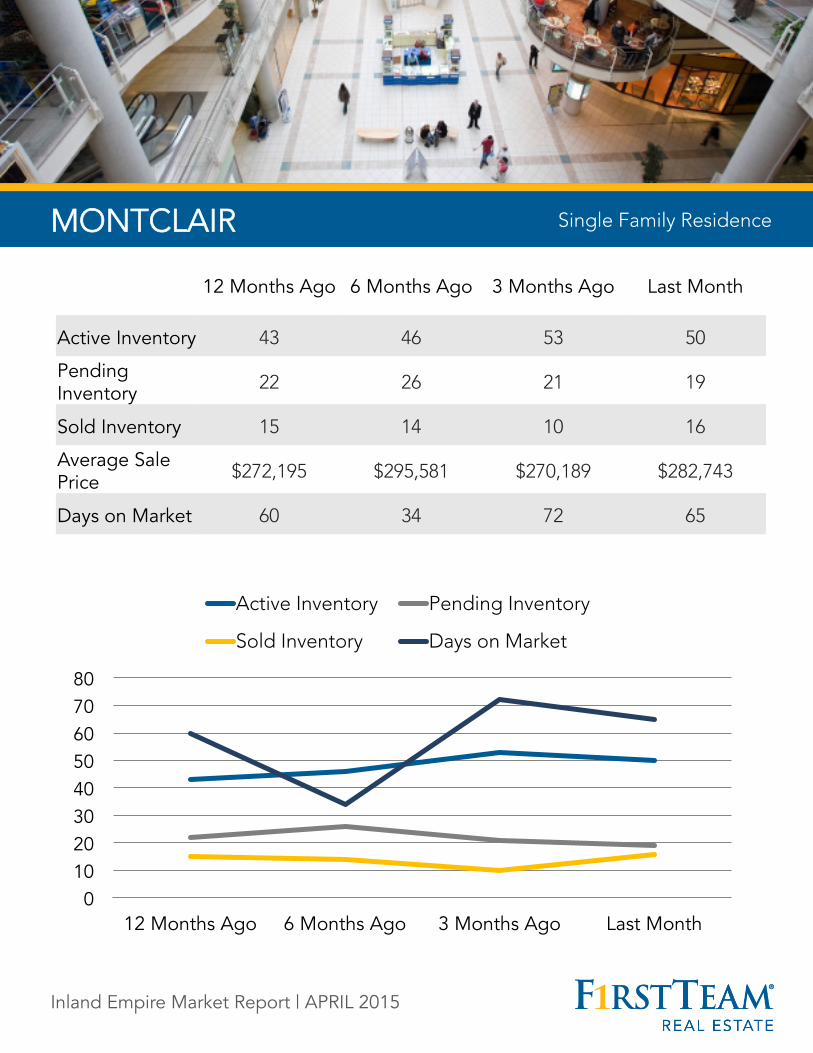
MONTCLAIR
0 10 20 30 40 50 60 70 80
12 Months Ago 6 Months Ago 3 Months Ago Last Month
Active Inventory Pending Inventory
Sold Inventory Days on Market
Single Family Residence MONTCLAIR Single Family Residence
12 Months Ago 6 Months Ago 3 Months Ago Last Month
Active Inventory 43 46 53 50
Pending Inventory 22 26 21 19
Sold Inventory 15 14 10 16
Average Sale Price $272,195 $295,581 $270,189 $282,743
Days on Market 60 34 72 65
Inland Empire Market Report | APRIL 2015

NEEDLES
0 15 30 45 60 75 90
105 120 135 150 165
12 Months Ago 6 Months Ago 3 Months Ago Last Month
Active Inventory Pending Inventory
Sold Inventory Days on Market
Single Family Residence NEEDLES Single Family Residence
12 Months Ago 6 Months Ago 3 Months Ago Last Month
Active Inventory 26 25 35 33
Pending Inventory 3 1 1 0
Sold Inventory 0 1 2 2
Average Sale Price $0 $54,200 $35,000 $115,250
Days on Market 0 127 69 152
Inland Empire Market Report | APRIL 2015

ONTARIO
0 35 70
105 140 175 210 245 280
12 Months Ago 6 Months Ago 3 Months Ago Last Month
Active Inventory Pending Inventory
Sold Inventory Days on Market
Single Family Residence ONTARIO Single Family Residence
12 Months Ago 6 Months Ago 3 Months Ago Last Month
Active Inventory 252 244 246 260
Pending Inventory 135 108 126 123
Sold Inventory 79 75 56 88
Average Sale Price $261,830 $271,141 $252,504 $303,108
Days on Market 63 59 64 85
Inland Empire Market Report | APRIL 2015
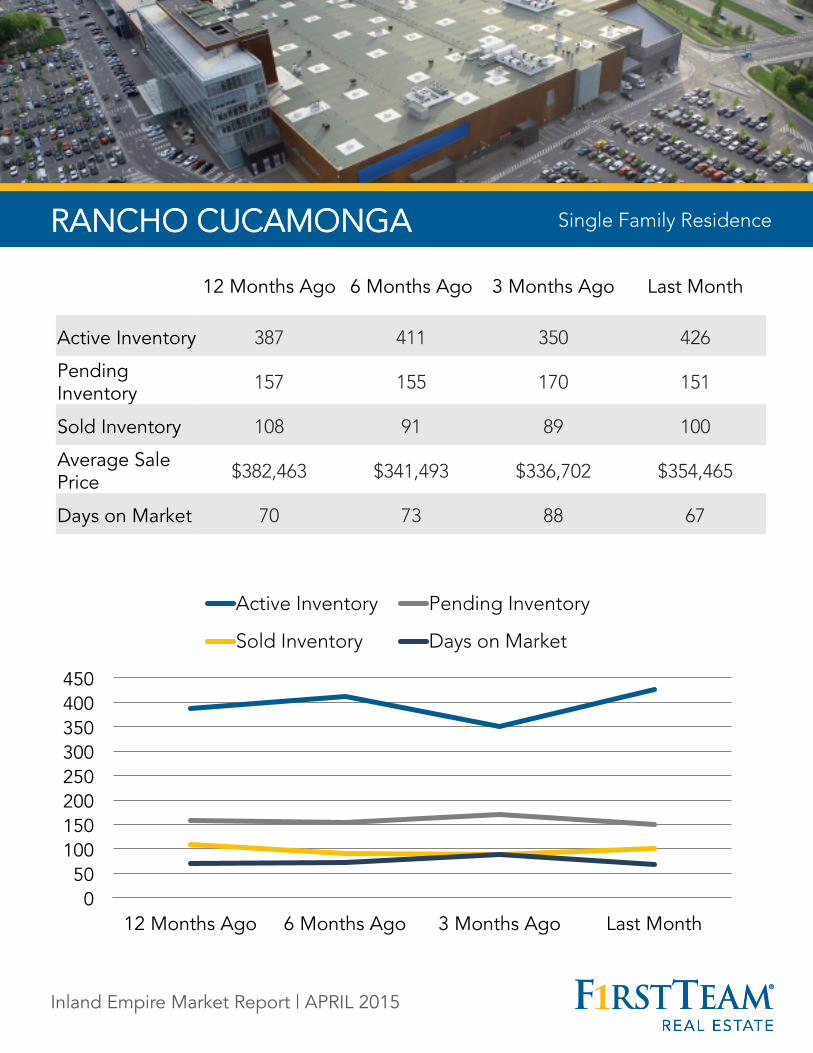
RANCHO CUCAMONGA
0 50
100 150 200 250 300 350 400 450
12 Months Ago 6 Months Ago 3 Months Ago Last Month
Active Inventory Pending Inventory
Sold Inventory Days on Market
Single Family Residence RANCHO CUCAMONGA Single Family Residence
12 Months Ago 6 Months Ago 3 Months Ago Last Month
Active Inventory 387 411 350 426
Pending Inventory 157 155 170 151
Sold Inventory 108 91 89 100
Average Sale Price $382,463 $341,493 $336,702 $354,465
Days on Market 70 73 88 67
Inland Empire Market Report | APRIL 2015

REDLANDS
0
35
70
105
140
175
210
245
12 Months Ago 6 Months Ago 3 Months Ago Last Month
Active Inventory Pending Inventory
Sold Inventory Days on Market
Single Family Residence REDLANDS Single Family Residence
12 Months Ago 6 Months Ago 3 Months Ago Last Month
Active Inventory 206 205 179 218
Pending Inventory 86 63 103 85
Sold Inventory 57 41 44 65
Average Sale Price $274,015 $284,428 $268,469 $320,619
Days on Market 79 104 93 50
Inland Empire Market Report | APRIL 2015

RIALTO
0 35 70
105 140 175 210 245 280
12 Months Ago 6 Months Ago 3 Months Ago Last Month
Active Inventory Pending Inventory
Sold Inventory Days on Market
Single Family Residence RIALTO Single Family Residence
12 Months Ago 6 Months Ago 3 Months Ago Last Month
Active Inventory 220 238 224 197
Pending Inventory 150 100 129 146
Sold Inventory 95 59 58 71
Average Sale Price $257,042 $218,785 $227,992 $241,203
Days on Market 53 38 59 59
Inland Empire Market Report | APRIL 2015

SAN BERNARDINO (city)
0 75
150 225 300 375 450 525 600 675
12 Months Ago 6 Months Ago 3 Months Ago Last Month
Active Inventory Pending Inventory
Sold Inventory Days on Market
Single Family Residence SAN BERNARDINO (city) Single Family Residence
12 Months Ago 6 Months Ago 3 Months Ago Last Month
Active Inventory 488 580 519 549
Pending Inventory 334 256 290 330
Sold Inventory 199 154 96 165
Average Sale Price $167,274 $172,924 $170,221 $185,840
Days on Market 50 47 68 56
Inland Empire Market Report | APRIL 2015

UPLAND
0
35
70
105
140
175
210
245
12 Months Ago 6 Months Ago 3 Months Ago Last Month
Active Inventory Pending Inventory
Sold Inventory Days on Market
Single Family Residence UPLAND Single Family Residence
12 Months Ago 6 Months Ago 3 Months Ago Last Month
Active Inventory 160 187 177 213
Pending Inventory 71 68 81 62
Sold Inventory 62 41 36 62
Average Sale Price $447,892 $446,674 $331,192 $464,796
Days on Market 64 81 82 44
Inland Empire Market Report | APRIL 2015

VICTORVILLE
0 75
150 225 300 375 450 525 600
12 Months Ago 6 Months Ago 3 Months Ago Last Month
Active Inventory Pending Inventory
Sold Inventory Days on Market
Single Family Residence VICTORVILLE Single Family Residence
12 Months Ago 6 Months Ago 3 Months Ago Last Month
Active Inventory 378 542 464 457
Pending Inventory 161 141 159 204
Sold Inventory 111 88 88 109
Average Sale Price $158,188 $147,390 $139,866 $170,705
Days on Market 89 79 82 71
Inland Empire Market Report | APRIL 2015

YUCAIPA
0
35
70
105
140
175
210
245
12 Months Ago 6 Months Ago 3 Months Ago Last Month
Active Inventory Pending Inventory
Sold Inventory Days on Market
Single Family Residence YUCAIPA Single Family Residence
12 Months Ago 6 Months Ago 3 Months Ago Last Month
Active Inventory 193 185 176 211
Pending Inventory 70 64 78 64
Sold Inventory 48 47 37 45
Average Sale Price $245,633 $283,053 $250,271 $276,588
Days on Market 82 85 109 81
Inland Empire Market Report | APRIL 2015
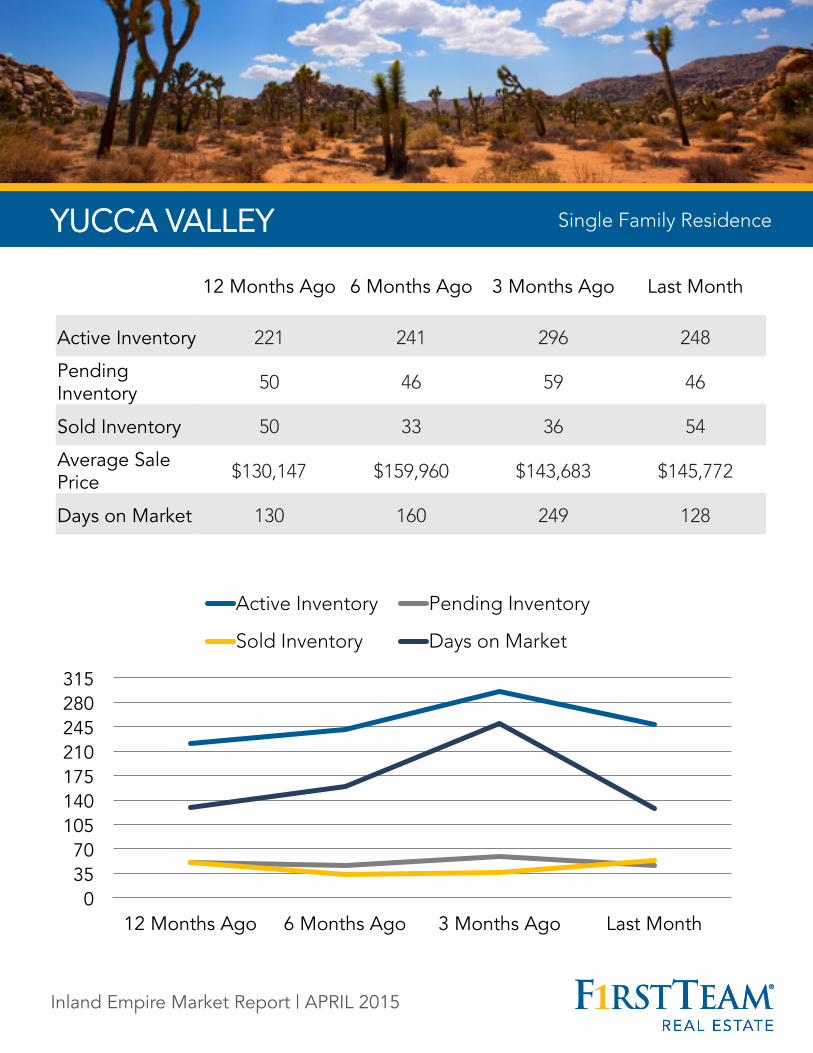
YUCCA VALLEY
0 35 70
105 140 175 210 245 280 315
12 Months Ago 6 Months Ago 3 Months Ago Last Month
Active Inventory Pending Inventory
Sold Inventory Days on Market
Single Family Residence YUCCA VALLEY Single Family Residence
12 Months Ago 6 Months Ago 3 Months Ago Last Month
Active Inventory 221 241 296 248
Pending Inventory 50 46 59 46
Sold Inventory 50 33 36 54
Average Sale Price $130,147 $159,960 $143,683 $145,772
Days on Market 130 160 249 128
Inland Empire Market Report | APRIL 2015

Contact one of our local neighborhood experts for more exclusive market data, or to help you get started with buying or selling your next home.
Email: [email protected]
Phone: 888-870-1142
Web: FirstTeam.com
Connect With Us!
WANT MORE INFO?
Inland Empire Market Report | APRIL 2015