ing. luisa frosio - mcm energylab ing. gabriele ... · pdf file1 technical and economical...
TRANSCRIPT
1
Technical and economical optimization of hybrid centrals for rural electrification
Ing. Luisa Frosio - MCM EnergyLab Ing. Gabriele Marchegiani - Elvi Group
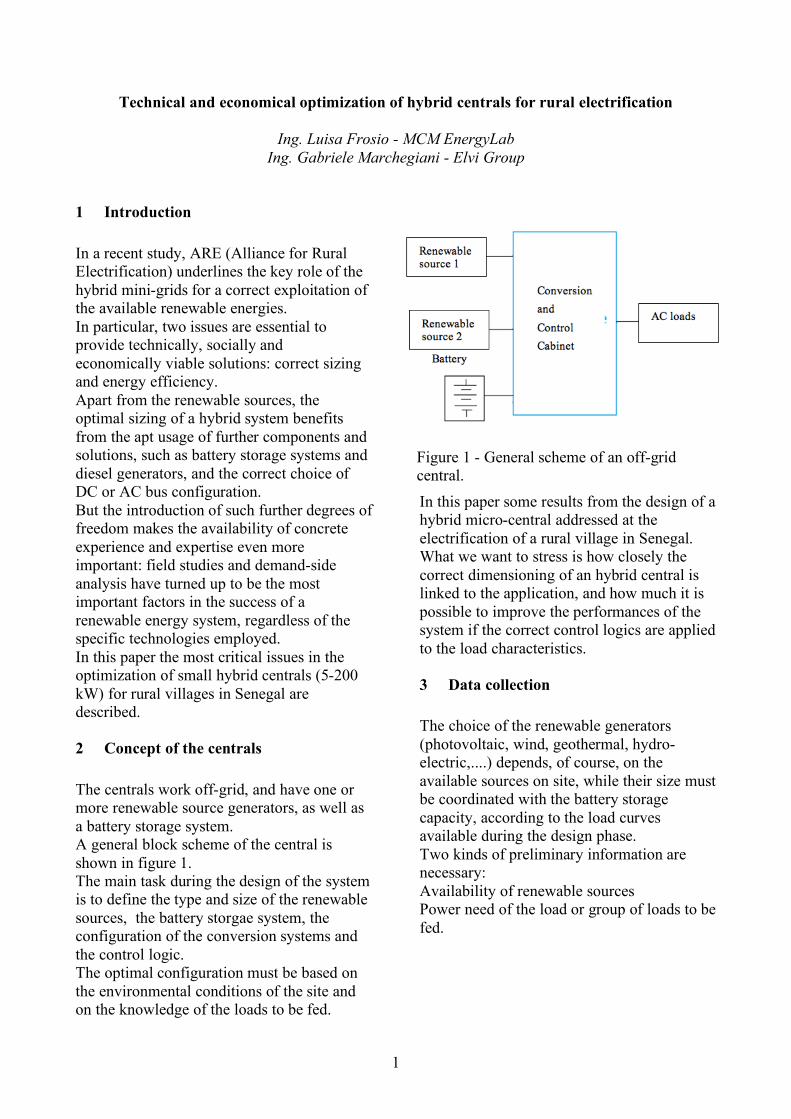
1 Introduction In a recent study, ARE (Alliance for Rural Electrification) underlines the key role of the hybrid mini-grids for a correct exploitation of the available renewable energies. In particular, two issues are essential to provide technically, socially and economically viable solutions: correct sizing and energy efficiency. Apart from the renewable sources, the optimal sizing of a hybrid system benefits from the apt usage of further components and solutions, such as battery storage systems and diesel generators, and the correct choice of DC or AC bus configuration. But the introduction of such further degrees of freedom makes the availability of concrete experience and expertise even more important: field studies and demand-side analysis have turned up to be the most important factors in the success of a renewable energy system, regardless of the specific technologies employed. In this paper the most critical issues in the optimization of small hybrid centrals (5-200 kW) for rural villages in Senegal are described. 2 Concept of the centrals The centrals work off-grid, and have one or more renewable source generators, as well as a battery storage system. A general block scheme of the central is shown in figure 1. The main task during the design of the system is to define the type and size of the renewable sources, the battery storgae system, the configuration of the conversion systems and the control logic. The optimal configuration must be based on the environmental conditions of the site and on the knowledge of the loads to be fed.
In this paper some results from the design of a hybrid micro-central addressed at the electrification of a rural village in Senegal. What we want to stress is how closely the correct dimensioning of an hybrid central is linked to the application, and how much it is possible to improve the performances of the system if the correct control logics are applied to the load characteristics. 3 Data collection The choice of the renewable generators (photovoltaic, wind, geothermal, hydro-electric,....) depends, of course, on the available sources on site, while their size must be coordinated with the battery storage capacity, according to the load curves available during the design phase. Two kinds of preliminary information are necessary: Availability of renewable sources Power need of the load or group of loads to be fed.
Figure 1 - General scheme of an off-grid central.
2
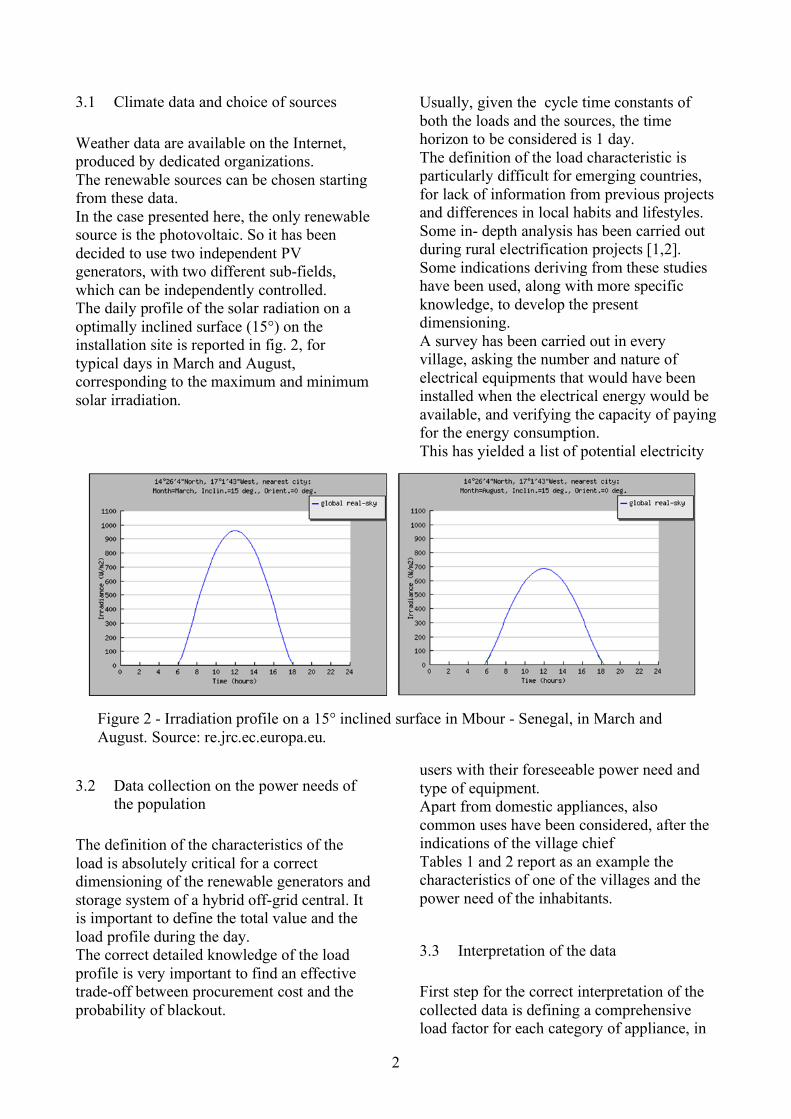
3.1 Climate data and choice of sources Weather data are available on the Internet, produced by dedicated organizations. The renewable sources can be chosen starting from these data. In the case presented here, the only renewable source is the photovoltaic. So it has been decided to use two independent PV generators, with two different sub-fields, which can be independently controlled. The daily profile of the solar radiation on a optimally inclined surface (15°) on the installation site is reported in fig. 2, for typical days in March and August, corresponding to the maximum and minimum solar irradiation.
3.2 Data collection on the power needs of the population
The definition of the characteristics of the load is absolutely critical for a correct dimensioning of the renewable generators and storage system of a hybrid off-grid central. It is important to define the total value and the load profile during the day. The correct detailed knowledge of the load profile is very important to find an effective trade-off between procurement cost and the probability of blackout.
Usually, given the cycle time constants of both the loads and the sources, the time horizon to be considered is 1 day. The definition of the load characteristic is particularly difficult for emerging countries, for lack of information from previous projects and differences in local habits and lifestyles. Some in- depth analysis has been carried out during rural electrification projects [1,2]. Some indications deriving from these studies have been used, along with more specific knowledge, to develop the present dimensioning. A survey has been carried out in every village, asking the number and nature of electrical equipments that would have been installed when the electrical energy would be available, and verifying the capacity of paying for the energy consumption. This has yielded a list of potential electricity
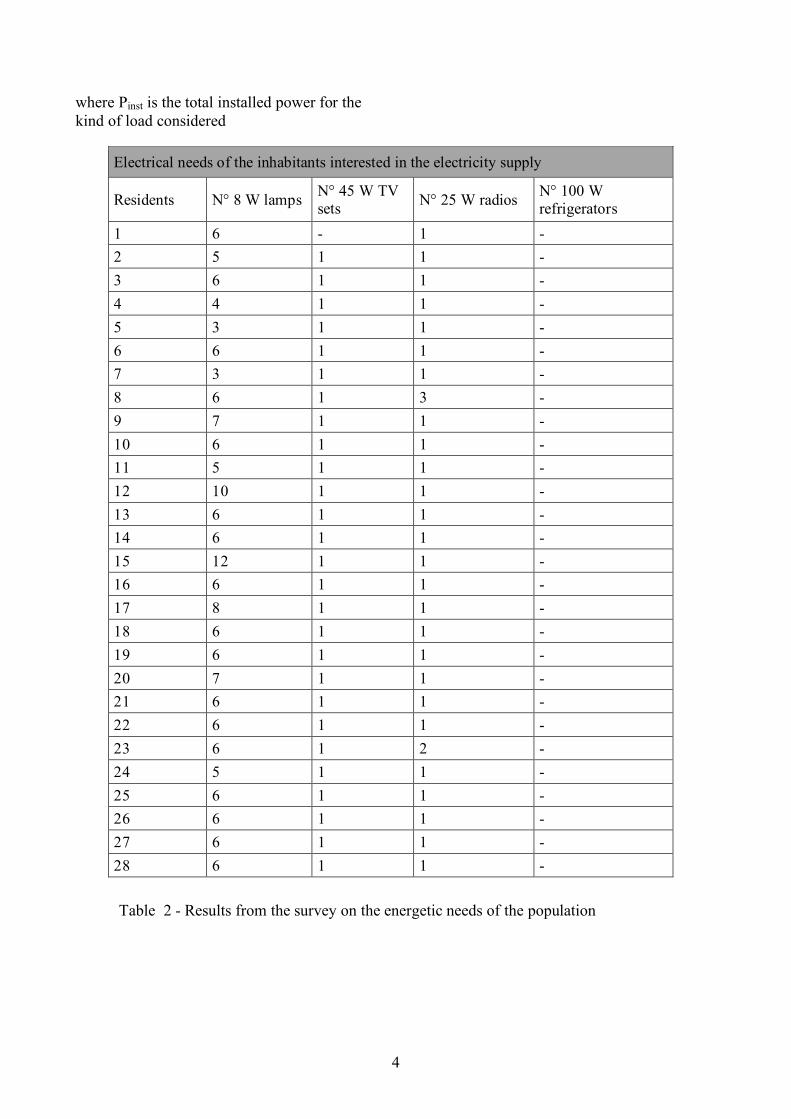
users with their foreseeable power need and type of equipment. Apart from domestic appliances, also common uses have been considered, after the indications of the village chief Tables 1 and 2 report as an example the characteristics of one of the villages and the power need of the inhabitants.
3.3 Interpretation of the data First step for the correct interpretation of the collected data is defining a comprehensive load factor for each category of appliance, in
Figure 2 - Irradiation profile on a 15° inclined surface in Mbour - Senegal, in March and August. Source: re.jrc.ec.europa.eu.

3
order to evaluate the total daily energy consumption of the village. The yearly energy need, calculated on such basis, must be covered completely by the yearly capacity of the renewable sources. On the other hand, the size of the battery storage system depends on the daily load profile and on the distribution of the availability of the sources along the day. The smaller the overlap of availability of sources and request from the load, the bigger the capacity of the storage system must be. As in this case the only source is the photovoltaic field, and the main load is lighting, the overlap is very small, and the batteries will have to provide a significant capacity. In our evaluation, the data obtained through the survey have been used to define the load profile of domestic usage; the other loads have been characterized using the indications contained in [1] and with information gained from other similar villages. Such information is summarized in table 3.
3.4 Evaluation of the overall contemporarity factor and of the energy need of the village
To evaluate the annual or daily energy consumption of the village it is necessary to asses the value of an overall load factor for every type of installed equipment. This evaluation entrains an in-depth knowledge of the local habits and life-style, which can be very far from those of the industrialized countries, where reference value are available. The present evaluation has been conducted starting from similar projects carried out in other rural areas [2]. So, the contemporarity/usage factor fcompl for lighting and refrigeration has been assumed 0,4, while all other loads have an overall factor equal to 0,1. Once this parameter is available, it is possible to evaluate the daily energy consumption Wcompl,day for every type of load, as:
complinstday,compl f24PW !!= 1)
Characteristics of the village
Number of residents 668
Distance from the national grid 8 km
Number of potential electricity users 28 (4 %)
Schools 1 arab; 1 french
Churchs 1
Mosques 1
Hospitals 1
Mills 1
Wells 1
Table 1- General characteristics of the village
4
where Pinst is the total installed power for the kind of load considered
Electrical needs of the inhabitants interested in the electricity supply
Residents N° 8 W lamps N° 45 W TV sets N° 25 W radios N° 100 W
refrigerators
1 6 - 1 - 2 5 1 1 - 3 6 1 1 - 4 4 1 1 - 5 3 1 1 - 6 6 1 1 - 7 3 1 1 - 8 6 1 3 - 9 7 1 1 - 10 6 1 1 - 11 5 1 1 - 12 10 1 1 - 13 6 1 1 - 14 6 1 1 - 15 12 1 1 - 16 6 1 1 - 17 8 1 1 - 18 6 1 1 - 19 6 1 1 - 20 7 1 1 - 21 6 1 1 - 22 6 1 1 - 23 6 1 2 - 24 5 1 1 - 25 6 1 1 - 26 6 1 1 - 27 6 1 1 - 28 6 1 1 -
Table 2 - Results from the survey on the energetic needs of the population
5
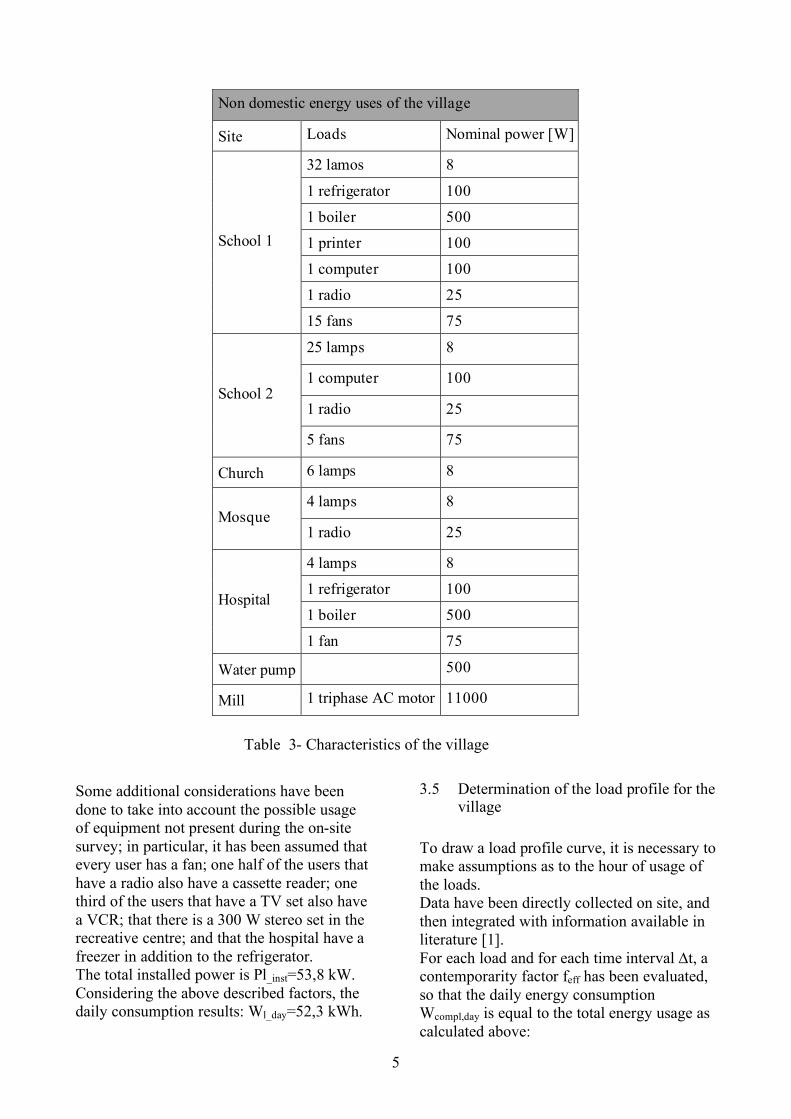
Some additional considerations have been done to take into account the possible usage of equipment not present during the on-site survey; in particular, it has been assumed that every user has a fan; one half of the users that have a radio also have a cassette reader; one third of the users that have a TV set also have a VCR; that there is a 300 W stereo set in the recreative centre; and that the hospital have a freezer in addition to the refrigerator. The total installed power is Pl_inst=53,8 kW. Considering the above described factors, the daily consumption results: Wl_day=52,3 kWh.
3.5 Determination of the load profile for the village
To draw a load profile curve, it is necessary to make assumptions as to the hour of usage of the loads. Data have been directly collected on site, and then integrated with information available in literature [1]. For each load and for each time interval ∆t, a contemporarity factor feff has been evaluated, so that the daily energy consumption Wcompl,day is equal to the total energy usage as calculated above:
Non domestic energy uses of the village
Site Loads Nominal power [W]
32 lamos 8
1 refrigerator 100
1 boiler 500
1 printer 100
1 computer 100
1 radio 25
School 1
15 fans 75
25 lamps 8
1 computer 100
1 radio 25 School 2
5 fans 75
Church 6 lamps 8
4 lamps 8 Mosque
1 radio 25
4 lamps 8
1 refrigerator 100
1 boiler 500 Hospital
1 fan 75
Water pump 500
Mill 1 triphase AC motor 11000
Table 3- Characteristics of the village

6
effinstday,compl ftPW !"!= 2)
where: fcompl is the total usage factor for the type of loads; ∆t is the time interval in which the loads are used during the day feff is the effective usage factor By substituting 1) in 2) we obtain:
t24ffftPf24P compleffeffinstcomplinst !"=#"!"=""
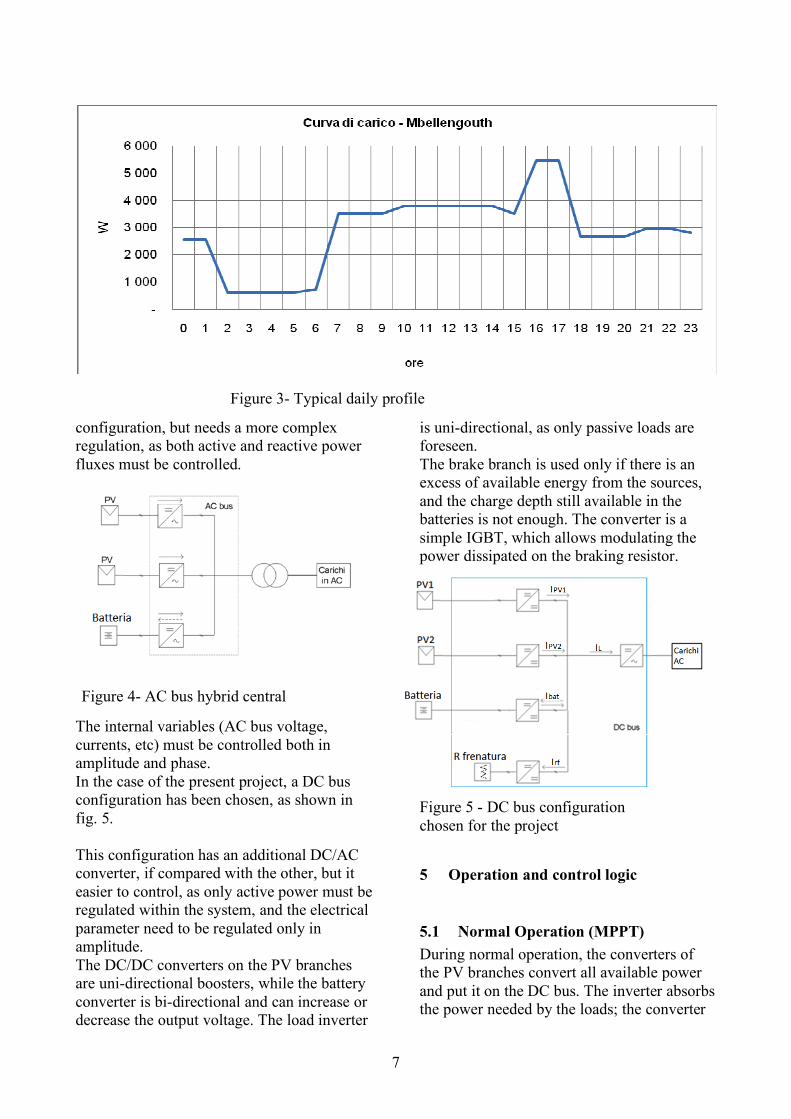
Load profile data and curve are reported in table 4 and fig. 3 4 Configuration of the conversion and
control cabinet The main configurations of a hybrid central are two: AC bus or DC bus. In the first case all renewable sources, the battery storage system and the loads are connected in parallel on a AC bus at industrial frequency. An example is given in fig. 4. The output transformer on the inverter can be
avoided if the AC bus voltage level is compatible with the loads. The AC bus configuration has a lower number of converters if compared with the DC bus
Load profile data
Loads Nominal power [W]
Quantity
Total power (Pinst) [W]
fcompl Daily energy [Wh/jour]
t [h]
Usage hours feff
Lamp 8 252 2 016 0.40 19 891 10 16-02 0.96
TV set 65 29 1 885 0.10 4 524 18 0-24 0.13
Refrigerators 130 2 260 0.40 3 744 24 0-24 0.40
VCR 30 10 290 0.10 696 11 7-18 0.22
Cassette recorder 25 11 275 0.10 660 17 6-23 0.14
Radio 15 35 525 0.10 1 260 17 6-23 0.14
Freezer 300 1 300 0.40 2 880 24 6-24 0.40
PC or printer 300 3 900 0.10 2 880 11 7-18 0.22
Stereo set 300 1 300 0.10 720 17 6-23 0.14
Boiler 500 2 1 000 0.10 3 600 24 0-24 0.10
Mill 11000 1 11 000 0.10 1 200 11 7-18 0.22
Water pump 500 1 500 0.10 10 195 11 7-18 0.22
Fan 72 35 2 520 0.1 6048 21 22-6 10-15 0.11
TOTAL 53 850 52 250
Table 4- characteristics of village loads.
7
configuration, but needs a more complex regulation, as both active and reactive power fluxes must be controlled.
The internal variables (AC bus voltage, currents, etc) must be controlled both in amplitude and phase. In the case of the present project, a DC bus configuration has been chosen, as shown in fig. 5. This configuration has an additional DC/AC converter, if compared with the other, but it easier to control, as only active power must be regulated within the system, and the electrical parameter need to be regulated only in amplitude. The DC/DC converters on the PV branches are uni-directional boosters, while the battery converter is bi-directional and can increase or decrease the output voltage. The load inverter
is uni-directional, as only passive loads are foreseen. The brake branch is used only if there is an excess of available energy from the sources, and the charge depth still available in the batteries is not enough. The converter is a simple IGBT, which allows modulating the power dissipated on the braking resistor.
5 Operation and control logic
5.1 Normal Operation (MPPT) During normal operation, the converters of the PV branches convert all available power and put it on the DC bus. The inverter absorbs the power needed by the loads; the converter
Figure 3- Typical daily profile
Figure 4- AC bus hybrid central
Figure 5 - DC bus configuration chosen for the project

8
of the storage system balances the DC bus by charging or discharging the batteries. * PV branches: The PV branches are controlled by an MPPT (Maximum Power Point Tracking), that allows extracting the maximum available power from the fields, according to temperature and solar radiation. The maximum power PMPP can be expressed in function of the no load voltage Voc , of the short circuit current Isc and of the filling factor FF:
)2FFIVP scocMPP !!=
The no-load voltage and short circuit current vary with the temperature and the irradiance:
!!"
#$$%
& +'
'''=
rs
rsphsoc I
IIln
qnATK
V
phpsc InI != Where: K is the Boltzmann constant (1,38 x 10⁻²³ J/K), T [K] is the temperature, q is the charge of the electron (1,6 x 10⁻¹⁹ C), A is a non-ideality factor for the p-n junction, and ranges from 1 to 5 (usually 2,15) ns is the number of panels in series np is the number of panel in parallel Iph is the current generated by the PV panels, and depends on irradiance and temperature,[6] Irs is the reverse saturation current, and depends on the temperature.[6] The Filling Factor is the ratio of the maximum available power to the result of no-load voltage x short circuit current:
!
FF =PMPPVoc " Isc
In 2) FF is assumed constant and equal to the nominal value. So, the current produced by the two PV branches can be expressed in function of the maximum available power and the DC voltage (Vdc):
dc
MPPPV V
PI =
Load branch: the inverter provides constant voltage and frequency to the loads. The active power depends on the number and nature of the connected loads. Negliging the internal losses of the inverter, the current absorbed from the DCbus (IL) is equal to the ratio of the active power (PL) and the DC bus voltage: Braking branch: In normal conditions this branch is not used Battery branch: The storage system must supply the active power (positive or negative) necessary to maintain the energetic balance on the DC bus. When the power balance is guaranteed, the DC bus voltage is constant and equal to the nominal value. When the power injected on the DC bus is more than the absorbed power, the exceeding power is stored in the capacitors connected on the bus, and the Vdc voltage rises. When the absorbed power is higher than the one injected, Vdc tends to decrease, as the missing power is supplied by the capacitors. The battery storage system keeps the DC bus voltage constant. In condition of balance, the following equations can be written:
rfL2PV1PVbat
dc
IIIII
tcosV
!!+=
=
5.2 Energy excess (WE) In some conditions, the available energy can be more than the need of the loads, but the batteries are completely charged, so they cannot absorb the exceeding energy. In this case this energy is dissipated on the braking resistor, and the battery is kept in the condition of float charge: it absorbs only the current Ict necessary to compensate its internal losses. The equations in ideal conditions (negliging the losses and the higher frequency components) are:

9
!!!!!!!
"
!!!!!!!
#
$
%%+=
=
=
=
=
batL2PV1PVrf
ctbat
dc
LL
dc
2MPP2PV
dc
1MPP1PV
IIIII
IIVPI
VPI
VPI
If Ppv1 and Ppv2 are the active power of the two PV fields Prf is the active power dissipated on the braking resistor; Pbat is the power supplied or absorbed by the storage system, the DC energetic balance is described by the following equations:
!!
"
!!
#
$
%%+=
&=
=
=
batL2PV1PVrf
ctbat
2MPP2PV
1MPP1PV
PPPPP
0PPPPPP
5.3 Lack of energy (LPS) In order to avoid early ageing of the batteries, the manufacturers prescribe a minimum admitted state of charge SOCm When the state of charge reaches this threshold, the loads are disconnected, so as to allow recharging the battery as soon as the sources are available. During this condition, the operation equations are:
!!!!!!
"
!!!!!!
#
$
=
+=
=
=
=
0IIII
0IVPI
VPI
rf
2PV1PVbat
L
dc
2MPP2PV
dc
1MPP1PV
!!!
"
!!!
#
$
=
+=
=
=
=
0PPPP
0PPPPP
rf
2MPP1MPPbat
L
2MPP2PV
1MPP1PV
6 Dimensioning Given the load profile and the availability curve of the renewable sources, it is possible to dimension the generators (in this case the PV fields) and the storage system. Many methods are suggested in literature, some through the solution in closed form of optimisation systems of one or more target functions [7,8] (reduction of overall cost, continuity of load alimentation, ...), or by means of iterative processes [9]. As these methods are rather complex, it has been preferred to define the dimensioning of the system based on the evaluation of some main indicators. The indicators have been evaluated for different sizes of the generators and batteries, till a satisfying performance has been found.
6.1 Definition of the indicators
6.1.1 Available power of PV generators The instantaneous power of each of the PV generators is equal to: ( ) ( ) PVtPVPV AtJtP !!"=
where: ηPV is the overall efficiency of the generator, and includes the efficiencies of the PV panels, losses in the cables, other losses; Jt(t) is the instantaneous solar irradiation on the panel surfaces (see fig. 1), [W/m2]; APV is the total area of the PV surface, [m2]. To dimension the PV generator power it is necessary to define the area of the surface of the PV panels.
6.1.2 Available battery energy The maximum stored energy in a battery is given by the product of the battery voltage (Vnbat) with the nominal capacity Cnbat. [Wh] In order to guarantee a lifetime of 5 years for the wet cells batteries chosen for this application, considering a 30°C ambient temperature and assuming to have one charge and one discharge cycle a day, the minimum

10
admitted state of charge is 70% (data supplied by the manufacturer). The battery must not be discharged more than 30%. Starting from the minimum state of charge (SOCm), it is possible to evaluatre the effective capacity of the battery Cavbat, which is related to the available energy E\\;
( )100/SOC100CC mnbatavbat !"= [Ah] ( ) 100/SOC100EVCE mnbatnbatavbatavbat !"="= [Wh]
To dimension the system it is necessary to define the nominal energy stored in the battery Enbat.
6.1.3 Loss of Power Supply Probability LPSP [3,4] or Loss of Load Probability LOLP [5]
The two indicators LPSP and LOLP are similar, and indicate the probability of loss of power for the load due to inadequate availability of power in the hybrid centrals. As the two indicators are logically equivalent, we refer to LPSP, which can be expressed as the ratio of the energy not supplied during blackouts to the yearly energy of the loads El_tot.
tot_l
K
1ii,NS_l E/ELPSP !=
= Where: K is the total number of black-outs in the interval El_NS,i is the energy not supplied during the i-th blackout With the load profile and the yearly irradiance curve it is possible to evaluate the LPSP on one year. The analysis is discretized on a one-hour basis; in each step the produced and consumed energy are considered constant. For each hour, the difference between the hourly available energy from sources and batteries and the energy requested by the loads is evaluated. If the difference is positive, there is no loss of power; if it is
negative, the energy loss is equal to the difference multiplied by the time interval. When the state of charge (SOC) is below the minimum value (SOCm), the instantaneous loss is equal to the whole required energy, as the batteries are disconnected to avoid an excessive discharge.
( ) ( ) ( )( ) ( ) ( )
( ) ( ) ( )m
nbatmgenL
nbatmgenL
batterie_in_disponbile_Energia
nbatm
fonti_Energia
gen
carichi_Energia
L
SOC)t(SOC%100per
0)t(LPS100/CSOC)t(SOCttPttPse
100/CSOC)t(SOCttPttP)t(LPS
100/CSOC)t(SOCttPttPse
>>
!!!
"
!!!
#
$
=%&'+(&)(&
&''(&'(&=%
&'+(&>(&44444 844444 764847648476
and
( ) )t(SOCSOCperttP)t(LPS mL <!"= The yearly value of LPSP is equal to the sum of the hourly loss of power during the year, divided by the total required energy:
!!"
#$$%
&'(!!
"
#$$%
&'(= ))
==
N
1iii,L
N
1iii t)t(P/t)t(LPSLPSP
Where N=8760 is the total number of intervals ∆t =1h.
6.1.4 Wasted Energy Percentage WEP The global indicator WEP indicates the percentage of available energy from the renewable sources which cannot be used by the hybrid central. The energy is lost when the batteries are completely charged (SOC=100) and cannot store energy available from the sources and exceeding the request from the loads. The hourly (or instantaneous) enetgy WE(t) of the hybrid central can be evaluated as:
The yearly indicator WEP is equal to the total hourly (or instantaneous) wasted energy during the year, divided by the total available energy from the sources.
!
se Pgen t( )" #t
Energia _ fonti6 7 4 8 4 > PL t( )" #t
Energia _ carichi6 7 4 8 4 + 100 $ SOC(t)( )" Cnbat /100
Energia _ accumulabile _ in _ batteria6 7 4 4 4 4 8 4 4 4 4 % WE( t) = Pgen t( )" #t $ PL t( )" #t $ 100 $ SOC( t)( )" Cnbat /100
se Pgen t( )" #t
Energia _ fonti6 7 4 8 4 & PL t( )" #t
Energia _ carichi6 7 4 8 4 + 100 $ SOC(t)( )" Cnbat /100
Energia _ accumulabile _ in _ batteria6 7 4 4 4 4 8 4 4 4 4 % WE( t) = 0
11
6.2 Preliminary consideration for the dimensioning
6.2.1 Minimum size of renewable generators
The size must be at least such that the total energy produced is bigger or equal to the total energy requried by the loads:
! "#$! "#==
N
1iii,L
N
1iii,gen t)t(Pt)t(P
In the present case the total yearly energy required by the loads is:
kWh25100t)t(PN
1iii,L =! "#
= Supposing the PV source operates for 6 equivalent daily hours, the energy from the renewable sources is bigger than the energy absorbed by the loads when the total size of the PV fields (nominal peak power, Pnpv,tot) is above 11.500 Wp:
W11500N
EP
year
year,Ltot,npv =!
Where Nyear= 6*365 is the equivalent yearly hours of the PV source. The minimum size of each PV field is then about 6000 Wp. If the size of the PV generators is below this minimum value, the renewable sources will not be able to supply the required energy, independently of the superposition between the availability of energy and the request of the loads.
6.2.2 Minimum size of the battery storage system
The storage system must be able to store and supply a quantity of energy equal to the energy requested by the loads when the renewable sources are not available. The cycle can be assumed to be daily. So the batteries must be able to store during daytime all the energy needed by the loads at night. In the specific case, from the knowledge of the time of day of dawns and sunsets during
the year, the "night load" can be defined as the energy requested by the loads between 6 pm and 7 am. In the case of the village, the result is: Eln=25000 Wh. The effective storage capacity of the batteries Eavbat, which takes into account the minimum admitted SOC, is 30% of the nominal capacity. So, in order to be able to feed the loads during night time, the minimum nominal energy Enbat must be 84000 Wh:
!
Eavbat " Eln # Enbat =Eavbat0,3
"Eln0,3
= 84000Wh
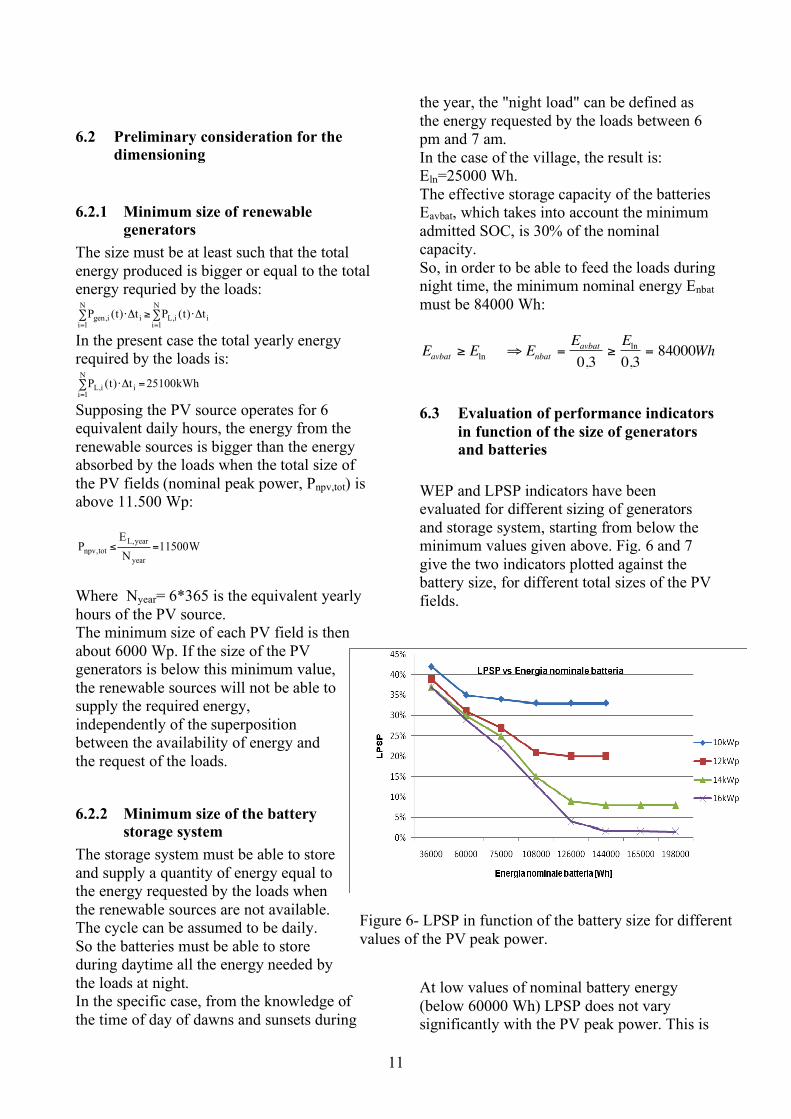
6.3 Evaluation of performance indicators in function of the size of generators and batteries
WEP and LPSP indicators have been evaluated for different sizing of generators and storage system, starting from below the minimum values given above. Fig. 6 and 7 give the two indicators plotted against the battery size, for different total sizes of the PV fields.
At low values of nominal battery energy (below 60000 Wh) LPSP does not vary significantly with the PV peak power. This is
Figure 6- LPSP in function of the battery size for different values of the PV peak power.

12
because with small storage systems the limit to the satisfaction of the load profile is given by the batteries, and not by the PV. For higher values of the PV power, the energy supplied by the sources is exploited with increasing efficiency as the battery capacity grows. Above a certain value, LPSP stops at a minimum stable value, which is the absolute minimum attainable at each PV size. From this point on, the limit of the performance of the system is given by the PV power, and not by the batteries. Interestingly, with the load profile of this system, zero LPSP cannot be reached even large sizes. Due to the variability of the solar irradiance during the year, in some seasons the available energy is higher than the need, while in other seasons it is not possible to supply continuously the loads. This can be also confirmed by the plot of WEP (lost energy) against the battery size: also this indicator reaches a limit value, after which it does not decrease even if the battery size increases.
The limit value grows with the size of the PV fields. To get a zero LPSP it would be necessary to increase the size of the generators beyond practical convenience.
The WEP indicator decreases when the battery size grows, and increases with the PV size. This happens because when the battery size increases, the capacity of the system to better exploit the available energy increases too. On the other hand, the smaller is the available energy from the sources, the smaller will be the lost energy. Above a critical value of the battery size (different for each PV size), WEP is constant with the size of the batteries. For smaller PV fields, WEP attains zero. For bigger PV fields the limit value is different from zero. This situation is complementary to what described about LPSP: while in some seasons there is not enough energy, in other seasons there is too much, and it has to be dissipated.
6.4 Choice of the sizes of generators and batteries
The sizes must be higher than the minimum
values evaluated as described above, and must guarantee acceptable values of LPSP and WEP, representing an acceptable trade-off between cost and performance of the system. 5% has been chosen as acceptable value of LPSP. This brings to a PV size of 16 kWp. The battery size is chosen as the minimum value that brings the system in the flat zones of the WEP and LPSP curves: 126 kWh. The resulting characteristics of the
renewable sources generators and battery storage systems are summarized in table 5.
Figure 7- WEP in function of the battery size for different values of the PV peak power
13
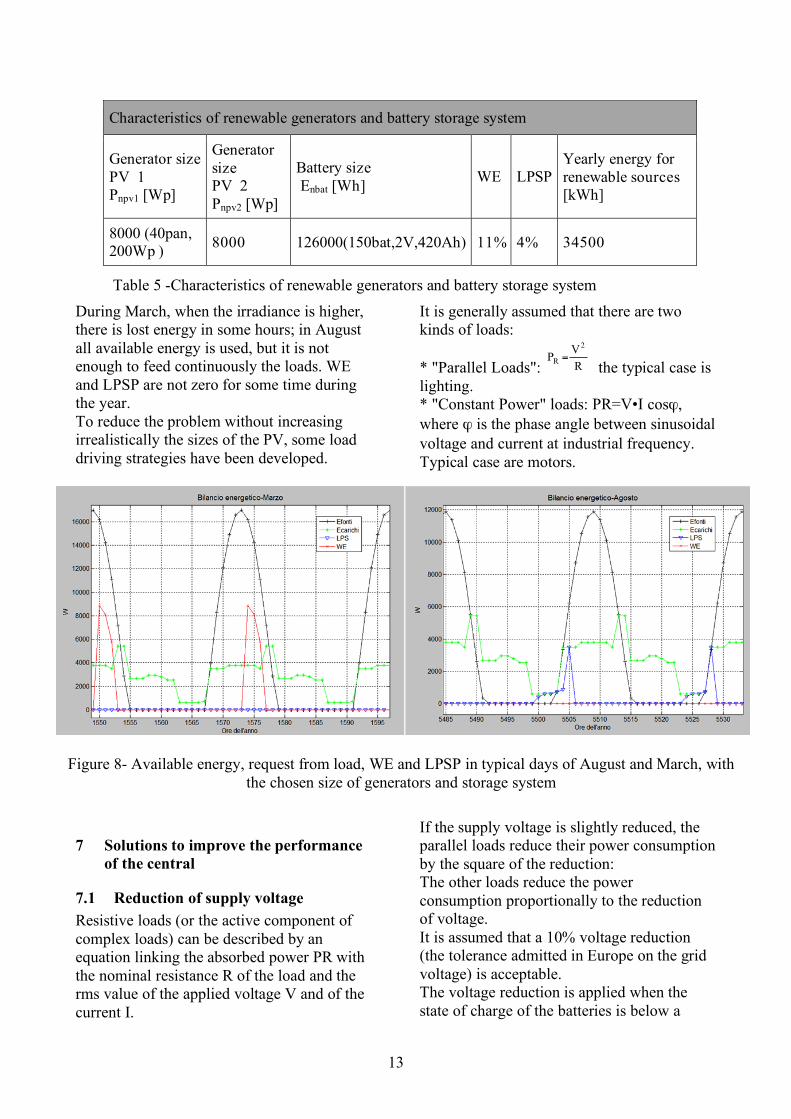
During March, when the irradiance is higher, there is lost energy in some hours; in August all available energy is used, but it is not enough to feed continuously the loads. WE and LPSP are not zero for some time during the year. To reduce the problem without increasing irrealistically the sizes of the PV, some load driving strategies have been developed.
7 Solutions to improve the performance
of the central
7.1 Reduction of supply voltage Resistive loads (or the active component of complex loads) can be described by an equation linking the absorbed power PR with the nominal resistance R of the load and the rms value of the applied voltage V and of the current I.
It is generally assumed that there are two kinds of loads:
* "Parallel Loads": RVP2
R = the typical case is lighting. * "Constant Power" loads: PR=V•I cosϕ, where ϕ is the phase angle between sinusoidal voltage and current at industrial frequency. Typical case are motors.
If the supply voltage is slightly reduced, the parallel loads reduce their power consumption by the square of the reduction: The other loads reduce the power consumption proportionally to the reduction of voltage. It is assumed that a 10% voltage reduction (the tolerance admitted in Europe on the grid voltage) is acceptable. The voltage reduction is applied when the state of charge of the batteries is below a
Characteristics of renewable generators and battery storage system
Generator size PV 1 Pnpv1 [Wp]
Generator size PV 2 Pnpv2 [Wp]
Battery size Enbat [Wh] WE LPSP
Yearly energy for renewable sources [kWh]
8000 (40pan, 200Wp ) 8000 126000(150bat,2V,420Ah) 11% 4% 34500
Table 5 -Characteristics of renewable generators and battery storage system
Figure 8- Available energy, request from load, WE and LPSP in typical days of August and March, with the chosen size of generators and storage system

14
certain threshold, to extend the availability of stored energy.
LPSP and WEP have been recalculated in the following hypotheses: * Half of the loads are "parallel", half "constant power" * Voltage reduction is applied when SOC of the battery is below 90% * Voltage is reduced by 10% The resulting indicators have strongly improved: LPSP= 2%; WEP = 14%. While LPSP has a very marked reduction, the lost power increases by 3%; but this has no effect on the efficiency or cost of the system. * Subdivision of loads in privileged and not-privileged
The loads can be subdivided in two categories, Privileged loads (PL), whose
continuity is prioritary, and not-privileged loads (NPL), which can be more freely interrupted. Two possible subdivisions have been considered, as shown in table 6. In the first case, many loads have been included in the PL; in the second one, only strictly critical loads have been included. NPL are disconnected when the SOC goes below 80%, and are re-connected only when SOC is above. Between 90% and 80% the voltage reduction is applied. When only PL are connected, the voltage is brought back to the nominal value. The WEP and LPSP value are reported in table 7
Possible PL – NPL subdivisions
PL NPL
1)
Domestic users Hospitals Schools Mill
Well Church Mosque
2)
Domestic users Hospitals Schools
Well Church Mosque Mill
Table 6- Possible PL - NPL subdivisions
Effects of the implemented strategies on the WEP and LPSP
Strategy PL NPL WEP LPSP(PL) LPSP(NPL) LPSP
Voltage reduction All 14% 2% 2%
Voltage reduction + PL-NPL subdivision
Domestic users Hospitals Schools Mill
Well Church Mosque
14% 0,4% 27% 1,2%
Voltage reduction + PL-NPL subdivision
Domestic users Hospitals Schools
Well Church Mosque Mill
22% 0,2% 25% 11%
Table 7- Effects of the implemented strategies on the WEP and LPSP

15
The voltage reduction reduces LPSP from 4% to 2%. The subdivision of the loads provides a further reduction (even almost to zero) but only for privileged loads (as the additional energy for PL is subtracted from the availabilty for the NPL). LPSP for NPL (LPSP(NPL)) decreases as the number of NPL increases, because the total energy absorbed by the CNP increases. The lost energy WEP in general increases, because the effect of the strategies is to reduce the energy absorbed by the loads. The best solution to increase LPSP on the privileged loads (but losing more energy) is to use the voltage reduction and subdivision 2 of the loads (only critical loads are PL).
Figures 9 to 11 report energy availability, load needs, WE and LPSP for PL and NPL in the two typical days of August and March, for all three strategies. In March, with high irradiance, some energy is lost, but loads are fed without interruption, as was without any improvement strategy. The lost energy is even higher, because of the lower consumption generated by the voltage reduction. In August no energy is lost, and there is some blackout time, but much lower than without improvement strategies. Using the load subdivision 1, the NPL have very small power need, as many of the loads are privileged. In March the NPL are
Figure 9- Available energy, energy request, LPSP and WE in March and August, with voltage reduction
Figure 10- Available energy, energy request, LPSP and WE in March and August, with voltage reduction and subdivision 1 of loads

16
disconnected in the first hours of the day, because the SOC goes below 80% (even if there would be no need, as the continuity would be guaranteed). There is no effect on the lost energy and on the continuity of the alimentation of the PL. In August the NPL are disconnected during the first hours of the day, and for some more hours during the day. The PL lose power sometimes, in the same amount as without the improvement strategy. The reason is that the energy needed by the NPL is so little that disconnecting them has no particular effect. With the second subdivision of the loads, NPL have a higher power (as the mill is included). So, the NPL are disconnected for the same amount of time, but the energy saved is higher. The strategy is more effective, and the PL are fed without interruptions for the whole year.
[1] H. Blennow, "Method for Rural Load Estimations - a case study in Tanzania". [2] P. Bailey, O. Chotimongkol, S. Isono, "Demand Analysis and Optimization of Renewable Energy: Sustainable Rural Electrification of Mbanayili, Ghana". [3] S. Diaf, D. Diaf, M. Belhamel, M. Haddadi, A. Louche, "A methodology for
optimal sizing of autonomous hybrid PV/wind system". [4] H.X. Yang, L. Lu, J. Burnett, "Weather data and probability analysis of hybridPV-Wind power generation systems in Hongkong". [5] M. Kolhe "Techno-Economic Optimum Sizing of a Stand-Alone solar Photovoltaic system", IEEE transactions on energy conversion, vol. 24, no. 2, june 2009. [6] I. Mazzucco, M. Retucci "Analisi di un dispositivo di generazione distribuita fotovoltaico con funzioni di power quality e realizzazione dell'interfaccia verso la rete". [7] Kellogg, W., Nehrir, M.H., Venkataramanan, G., Gerez., "Optimal unit sizing for a hybrid PV/wind generating system", Electric power system research 39, 35-38. [8] Yokoyama R, Ito K, Yuasa Y, "Multi-objective optimal unit sizing of hybrid power generation systems utilizing PV and wind energy.",J Solar Energy Eng. 116,167-173. [9] W.D. Kellogg", M.H. Nehrir, G.
Venkataramanan, and V. Gerez, "Generation unit sizing and cost analysis for stand-alone wind, photovoltaic, and hybrid wind-pv systems", IEEE Transactions on Energy Conversion, Vol. 13, No. 1, March 1998.
Figure 11 - Available energy, energy request, LPSP and WE in March and August, with voltage reduction and subdivision 2 of loads

17
1 Hybrid mini-grids for rural electrification - lessons learned. ARE, Simon Rolland, Guido Glania. March 2011