infrastructure and australia ïs food industry: preliminary...
TRANSCRIPT

Infrastructure and Australia’s food industry: Preliminary economic assessment Nga Nguyen, Lindsay Hogan, Kenton Lawson, Peter Gooday, Richard Green, Keely Harris-Adams and Thilak Mallawaarachchi
Research by the Australian Bureau of Agricultural
and Resource Economics and Sciences
Research Report 13.13 November 2013

Infrastructure and Australia’s food industry: Preliminary economic assessment
ii
© Commonwealth of Australia Ownership of intellectual property rights Unless otherwise noted, copyright (and any other intellectual property rights, if any) in this publication is owned by the Commonwealth of Australia (referred to as the Commonwealth). Creative Commons licence All material in this publication is licensed under a Creative Commons Attribution 3.0 Australia Licence, save for content supplied by third parties, logos and the Commonwealth Coat of Arms.
Creative Commons Attribution 3.0 Australia Licence is a standard form licence agreement that allows you to copy, distribute, transmit and adapt this publication provided you attribute the work. A summary of the licence terms is available from creativecommons.org/licenses/by/3.0/au/deed.en. The full licence terms are available from creativecommons.org/licenses/by/3.0/au/legalcode. This publication (and any material sourced from it) should be attributed as: Nguyen, N, Hogan, L, Lawson, K, Gooday, P, Green, R, Harris-Adams, K and Mallawaarachchi, T 2013, Infrastructure and Australia’s food industry: Preliminary economic assessment, ABARES research report 13.13, Canberra, November. CC BY 3.0. Cataloguing data Nguyen, N, Hogan, L, Lawson, K, Gooday, P, Green, R, Harris-Adams, K and Mallawaarachchi, T 2013, Infrastructure and Australia’s food industry: Preliminary economic assessment, ABARES research report 13.13, Canberra, November. ISSN: 1447-8358 ISBN; 978-1-74323-156-2 ABARES project: 43408 Internet Infrastructure and Australia’s food industry: Preliminary economic assessment is available at: daff.gov.au/abares/publications. Australian Bureau of Agricultural and Resource Economics and Sciences (ABARES) Postal address GPO Box 1563 Canberra ACT 2601 Switchboard +61 2 6272 2010| Facsimile +61 2 6272 2001 Email [email protected] Web daff.gov.au/abares Inquiries regarding the licence and any use of this document should be sent to: [email protected]. The Australian Government acting through the Department of Agriculture represented by the Australian Bureau of Agricultural and Resource Economics and Sciences, has exercised due care and skill in the preparation and compilation of the information and data in this publication. Notwithstanding, the Department of Agriculture, ABARES, its employees and advisers disclaim all liability, including liability for negligence, for any loss, damage, injury, expense or cost incurred by any person as a result of accessing, using or relying upon any of the information or data in this publication to the maximum extent permitted by law. Acknowledgements This report was prepared for the Agricultural Policy Division in the Australian Government Department of Agriculture. The authors thank Trysh Stone and Ryan Wilson from Agricultural Policy Division, and Dale Ashton, Max Foster, Teresa Foster, Trish Gleeson, Michael Harris, Edwina Heyhoe, Kris Morey, Paul Morris, Daniel Pambudi and Alasebu Yainshet from ABARES for helpful comments and information. The authors appreciate useful input from Gary Dolman and David Mitchell and others from the Bureau of Infrastructure, Transport and Regional Economics (BITRE), as well as several people from the Department of Infrastructure and Transport and the Department of Regional Australia, Local Government, Arts and Sport. The authors also thank several industry representatives, particularly in Tasmania and Victoria, for information on the case studies presented in this report.

Infrastructure and Australia’s food industry: Preliminary economic assessment
iii
Foreword In 2011–12, Australia’s food exports were $30 billion or 12 per cent of total merchandise exports. Preliminary ABARES projections indicate that world agrifood consumption and imports are likely to increase markedly to 2050, with relatively strong growth in food demand in the Asian region. ABARES is undertaking more detailed assessments on the outlook in the What Asia Wants project.
This study is a preliminary assessment of infrastructure and Australia’s food industry with a focus on:
identifying issues that may affect the pattern of agricultural production in Australia and the implications for infrastructure requirements
examining impediments to private provision of infrastructure that would support growth in Australia’s agrifood industry.
The focus in this study is on the role of economic infrastructure—transport, water, energy and telecommunications facilities—in the future development of Australia’s food industry. This study identifies key possible research directions for future work that would assess impediments to infrastructure and identify policy response options that would support growth in Australia’s food production and processing industry. ABARES, in collaboration with the CSIRO, is also undertaking more detailed assessments of supply chains in northern Australia in the Northern Australia Food and Fibre Supply Chains study.
Kim Ritman Acting Executive Director November 2013

Infrastructure and Australia’s food industry: Preliminary economic assessment
iv
Contents
Summary ............................................................................................................................................................ 1
1 Introduction .......................................................................................................................................... 4
2 Background............................................................................................................................................ 5
Key economic linkages in Australia’s food market ................................................................ 5
Global food demand to 2050 ........................................................................................................... 5
Australia’s food production and trade ........................................................................................ 7
Australia’s key food and infrastructure industries ............................................................. 10
3 Regional distribution of Australia’s food production......................................................... 13
Methodology and data .................................................................................................................... 13
Wheat .................................................................................................................................................... 14
Sugar...................................................................................................................................................... 18
Beef ........................................................................................................................................................ 21
Sheep meat .......................................................................................................................................... 25
Dairy ...................................................................................................................................................... 28
Crosscutting issues .......................................................................................................................... 32
4 Case studies—infrastructure’s role in expanding production ....................................... 36
Tasmania ............................................................................................................................................. 36
Victorian greenhouse protected cropping.............................................................................. 38
Australia’s airfreight exports of food ........................................................................................ 42
5 Economic issues in infrastructure investment and Australia’s food industry ......... 48
Economic rationale for government intervention............................................................... 48
Broad policy reform processes in Australia........................................................................... 49
Commercialisation options in infrastructure industries .................................................. 50
Private participation in infrastructure investment in Australia .................................... 52
Economic issues and infrastructure policy—previous studies ...................................... 55
6 Conclusion ........................................................................................................................................... 59
Appendix A Infrastructure data sources ............................................................................................ 61
Appendix B Case study for Tasmania—consultations and irrigation projects.................... 63
Appendix C Infrastructure and key food industries: ABS input-output data ....................... 67
Appendix D Production and exports of key food commodities to 2050, by jurisdiction . 70
Appendix E Public-private partnership arrangements ................................................................ 78
References ...................................................................................................................................................... 80
Tables
Table 1 Australia's gross value of production in agriculture, fisheries and forestry, food and non-food, 2011–12 ..................................................................................................................... 7
Table 2 Australia's food trade, by commodity, 2011–12 ................................................................ 9
Table 3 Output and employment in food and infrastructure industries in Australia, 2011–12 ............................................................................................................................................... 10

Infrastructure and Australia’s food industry: Preliminary economic assessment
v
Table 4 Average annual beef input, output and productivity growth, by region, 1977–78 to 2010–11 .......................................................................................................................................... 22
Table 5 Average annual productivity growth in Australia’s dairy industry, by jurisdiction, 1978-79 to 2010-11 ........................................................................................................................ 29
Table 6 Key indicators for Australia's airfreight food exports, 1996–97 and 2011–12 .. 43
Table 7 Airfreight and Australia's food trade, by commodity, 2011–12 ............................... 45
Table 8 Ownership and management aspects of key commercialisation options ............. 52
Table 9 Value of engineering construction work done in Australia, by sector, 2011–12 ............................................................................................................................................... 54
Table A1 Infrastructure data sources from key agencies ............................................................ 61
Table B1 Recently completed, existing and planned irrigation projects in Tasmania ..... 65
Table C1 Value of industry and final uses of intermediate inputs in Australia, 2008–09 ............................................................................................................................................... 67
Table C2 Distribution of intermediate inputs, by Industry and final use activity, Australia, 2008–09 .......................................................................................................................... 68
Table C3 Distribution of industry and final uses, by intermediate input, Australia, 2008–09 ............................................................................................................................................... 69
Table D1 Production and exports of wheat in 2050, average and trend approaches, by jurisdiction .......................................................................................................................................... 70
Table D2 Production and exports of sugar in 2050, average and trend approaches, by jurisdiction .......................................................................................................................................... 71
Table D3 Production and exports of beef and veal in 2050, average and trend approaches, by jurisdiction .......................................................................................................... 71
Table D4 Production and exports of sheep meat in 2050, average and trend approaches, by jurisdiction .................................................................................................................................... 72
Table D5 Production and exports of dairy in 2050, average and trend approaches, by jurisdiction .......................................................................................................................................... 72
Figures
Figure 1 Key economic linkages in Australia's food market .......................................................... 5
Figure 2 ABARES preliminary projections for world agrifood consumption and imports, 2007 and 2050 ..................................................................................................................................... 6
Figure 3 ABARES preliminary projections for Australia's major agricultural exports, by commodity, 2007 and 2050 ............................................................................................................ 6
Figure 4 Agriculture, fisheries and forestry—food and non-food commodities and uses. 7
Figure 5 Value of Australia's food exports, by commodity, 1996–97 to 2011–12 ................ 8
Figure 6 Leading countries in Australia's food trade, 2011–12 ................................................... 8
Figure 7 Distribution of uses of food products and services in Australia, 2008–09 ......... 11
Figure 8 Distribution of infrastructure input costs for key food industries in Australia, 2008–09 ............................................................................................................................................... 12
Infrastructure and Australia’s food industry: Preliminary economic assessment
vi
Figure 9 Bulk grain supply chain ........................................................................................................... 16
Figure 10 Wheat production and exports .......................................................................................... 17
Figure 11 Sugar supply chain ................................................................................................................. 19
Figure 12 Sugar production and exports ........................................................................................... 20
Figure 13 Beef supply chain .................................................................................................................... 23
Figure 14 Beef production and exports .............................................................................................. 24
Figure 15 Sheep meat supply chain ..................................................................................................... 27
Figure 16 Sheep production and exports ........................................................................................... 28
Figure 17 Dairy supply chain .................................................................................................................. 30
Figure 18 Dairy production and exports ............................................................................................ 31
Figure 19 Value of Australia's airfreight food exports, by commodity, 1996–97 to 2011–12 ............................................................................................................................................... 42
Figure 20 Key indicators for Australia's major food commodities exported by airfreight, 1996–97 to 2011–12....................................................................................................................... 44
Figure 21 Distribution of Australia's airfreight food exports, by destination, 2011–12 . 46
Figure 22 Distribution of Australia's airfreight food exports, by jurisdiction, 2011–12 . 46
Figure 23 Engineering construction activity in Australia, by sector, 1986–87 to 2011–12 ................................................................................................................................................................. 53
Figure 24 Value of engineering construction work done for the public sector in Australia, 2011–12 ............................................................................................................................................... 53
Maps
Map 1 Population trend, 2001 to 2011 ............................................................................................... 34
Map 2 National temperature change 2050 ........................................................................................ 35
Map 3 National rainfall change 2050 ................................................................................................... 35
Map B1 Tasmanian irrigation schemes overview—November 2012 ..................................... 66
Map D1 Wheat production, by ABS statistical division and exports, by state ..................... 73
Map D2 Sugar production by ABS statistical division and exports, by state ........................ 74
Map D3 Beef production, by statistical division and exports, by state ................................... 75
Map D4 Sheep meat production by ABS statistical division and exports, by state ............ 76
Map D5 Dairy production, by ABS statistical division and exports, by state ....................... 77
Boxes
Box 1 Regulation reform in Australia .................................................................................................. 50
Infrastructure and Australia’s food industry: Preliminary economic assessment
1
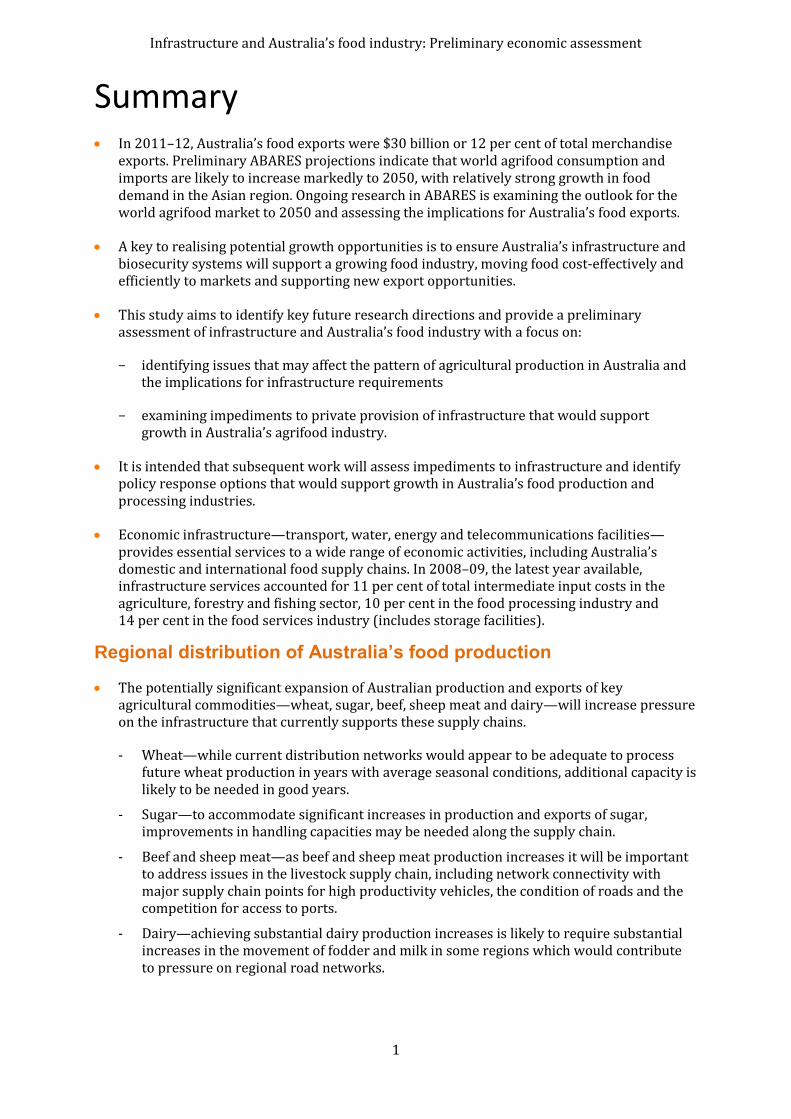
Summary In 2011–12, Australia’s food exports were $30 billion or 12 per cent of total merchandise
exports. Preliminary ABARES projections indicate that world agrifood consumption and imports are likely to increase markedly to 2050, with relatively strong growth in food demand in the Asian region. Ongoing research in ABARES is examining the outlook for the world agrifood market to 2050 and assessing the implications for Australia’s food exports.
A key to realising potential growth opportunities is to ensure Australia’s infrastructure and biosecurity systems will support a growing food industry, moving food cost-effectively and efficiently to markets and supporting new export opportunities.
This study aims to identify key future research directions and provide a preliminary assessment of infrastructure and Australia’s food industry with a focus on:
- identifying issues that may affect the pattern of agricultural production in Australia and the implications for infrastructure requirements
- examining impediments to private provision of infrastructure that would support growth in Australia’s agrifood industry.
It is intended that subsequent work will assess impediments to infrastructure and identify policy response options that would support growth in Australia’s food production and processing industries.
Economic infrastructure—transport, water, energy and telecommunications facilities—provides essential services to a wide range of economic activities, including Australia’s domestic and international food supply chains. In 2008–09, the latest year available, infrastructure services accounted for 11 per cent of total intermediate input costs in the agriculture, forestry and fishing sector, 10 per cent in the food processing industry and 14 per cent in the food services industry (includes storage facilities).
Regional distribution of Australia’s food production
The potentially significant expansion of Australian production and exports of key agricultural commodities—wheat, sugar, beef, sheep meat and dairy—will increase pressure on the infrastructure that currently supports these supply chains.
Wheat—while current distribution networks would appear to be adequate to process future wheat production in years with average seasonal conditions, additional capacity is likely to be needed in good years.
Sugar—to accommodate significant increases in production and exports of sugar, improvements in handling capacities may be needed along the supply chain.
Beef and sheep meat—as beef and sheep meat production increases it will be important to address issues in the livestock supply chain, including network connectivity with major supply chain points for high productivity vehicles, the condition of roads and the competition for access to ports.
Dairy—achieving substantial dairy production increases is likely to require substantial increases in the movement of fodder and milk in some regions which would contribute to pressure on regional road networks.

Infrastructure and Australia’s food industry: Preliminary economic assessment
2
Infrastructure that allows food to be moved cost-effectively and efficiently to markets will be important in making the most of opportunities presented by rapidly growing Asian markets.
The road network is of particular importance to food supply chains and as production and exports expand it will become increasingly important that issues affecting performance are addressed. These include connectivity across the road network and with other transport modes, road and rail pricing distortions, funding arrangements and the integration of planning and investment across modes.
- The potential expansion of production in areas currently without adequate infrastructure presents additional challenges. For example, a significant expansion of beef production in northern Australia would need to be supported by large infrastructure investments. Similarly, to achieve substantial increases in dairy production it is likely that additional investment in irrigation infrastructure will be needed, both on and off-farm.
Case studies
The case studies conducted in Tasmania and in the Victorian greenhouse protected cropping industry highlight the need to address issues related to multi-use infrastructure for production expansion. These issues include infrastructure access pricing and availability.
Further infrastructure investments in Tasmania are only viable if certain volume thresholds can be met and infrastructure use can be spread throughout the year. Even when viable infrastructure investments are available, making investments happen requires knowledge of production and consumption and the mechanisms to match this knowledge to funds.
The value of Australia’s airfreight food exports was $1.6 billion in 2011–12. International food supply chains based on air transport have increased in importance over the past several years for several food commodities. Australia’s airfreight exports of fruit and vegetables, livestock-based food and fisheries-based food accounted for 12.2 per cent of total food exports in 2011–12, compared with 9.4 per cent in 2004–05.
- Airfreight is a cost effective transport option for high value, low volume food products where food quality is dependent on timely delivery to the end-use market, and where the price premium received for the quality attributes of the food product is sufficient to justify the higher transport cost.
- Future growth in Australia’s airfreight food exports will be influenced by market access and biosecurity policy arrangements, investment in domestic high value food production and processing activities, and complementary infrastructure investment to support the further development of efficient international supply chains based on air transport.
Economic issues
The economic rationale for government intervention is mainly based on the natural monopoly characteristics of infrastructure industries (an important source of market failure). In a natural monopoly, industry costs tend to be lower if there is a single provider since this avoids costly duplication of infrastructure facilities (such as water storage, treatment and delivery infrastructure).
In recent decades, there has been a broad regulation reform process in Australia that emphasises the important role of reducing the regulatory burden on business and the community. For infrastructure industries, the main aim in policy reform has been to achieve efficient and sustainable pricing and provision of infrastructure services.

Infrastructure and Australia’s food industry: Preliminary economic assessment
3
Public provision of infrastructure services has been the traditional model used in Australia and other OECD countries, although there has been considerable interest in recent decades in reassessing the role of the private sector in infrastructure industries. Commercialisation options mainly represent alternative approaches to addressing the natural monopoly aspects of an infrastructure industry by increasing competitive pressures in the industry.
- Public-private partnerships (PPPs) are important commercialisation options that have the potential to increase competition. Such partnerships mainly refer to arrangements where the government enters into a contractual agreement with a private organisation to provide specified core functions. Public-private partnerships generally have an emphasis on private sector financing of infrastructure projects.
In Australia, private sector participation in infrastructure investment projects has increased in recent decades.
- The value of engineering construction work done for the public sector in all industries increased from $15 billion in 1986–87 to $32 billion in 2011–12 (in 2010–11 prices). Over this period, the private sector’s share of work done for the public sector increased from 34 per cent to 51 per cent.
- In 2011–12, the value of engineering construction work done in infrastructure industries (excluding gas) was $60 billion of which $28 billion (47 per cent) was private activity for the private sector, $16 billion (27 per cent) was private activity for the public sector, and $15 billion (26 per cent) was public activity for the public sector.
Future research directions
Key future research directions that may be considered include:
- Australia’s food production, processing and exports to 2050: implications for infrastructure—undertake a more comprehensive assessment of key supply-side factors influencing the pattern of food production, processing and exports to 2050 in regional and remote areas of Australia, and identify implications for infrastructure requirements. This research would be complementary to the ABARES research on What Asia Wants.
- Integrated modelling by BITRE and ABARES—in this collaborative research, ABARES would focus on integrating food production and processing activities into the BITRE model framework for infrastructure in Australia.
- Food supply chain analysis—a useful area for future research may be to undertake simulations of important aspects of Australia’s food supply chain with a focus on infrastructure requirements to support export growth of key food commodities to 2050. It is beyond the scope of subsequent work to examine specific infrastructure projects.
- Pricing and provision of key food infrastructure services in Australia—assess impediments to investment in infrastructure, including the private provision of infrastructure, and identify policy response options that would support growth in Australia’s domestic and international food supply chains.
There is likely to be an important role in future research to examine the experience in other OECD countries and assess the extent to which the overseas experience provides useful policy implications for Australia.

Infrastructure and Australia’s food industry: Preliminary economic assessment
4
1 Introduction After increasing strongly during the 1990s, the real value of Australia’s food exports fell overall
between 2001–02 and 2009–10 reflecting the impact of drought and increased domestic
demand (Hogan & Morris 2010). With the end of the drought and strong growth in world food
demand, Australia’s food exports have increased strongly over the past two years, from $24
billion in 2009–10 to $30 billion in 2011–12 (ABARES 2013; current prices). Food exports
accounted for 12 per cent of Australia’s total merchandise exports in 2011–12.
Ongoing research in ABARES is examining the outlook for the world agrifood market to 2050
and assessing the implications for Australia’s food exports. Preliminary ABARES projections
indicate that world agrifood consumption may increase by around 77 per cent between 2007
and 2050 (Linehan et al. 2012a, 2013). World food trade is also likely to become more important
in supplying people with their food requirements over this period. Given its geographic
proximity, Australia is well placed to supply additional food to the strongly growing Asian
market.
A key to realising potential growth opportunities is to ensure Australia’s infrastructure and
biosecurity systems will support a growing food industry, moving food cost-effectively and
efficiently to markets and supporting new export opportunities.
This study is a preliminary assessment of infrastructure and Australia’s food industry with a
focus on:
identifying issues that may affect the pattern of agricultural production in Australia and the implications for infrastructure requirements
examining impediments to private provision of infrastructure that would support growth in Australia’s agrifood industry.
It is intended that subsequent work will assess impediments to infrastructure and identify policy
response options that would support growth in Australia’s food production and processing
industry.
Infrastructure facilities provide basic services to industry and households. This study focuses on
key economic infrastructure including transport, water, energy and telecommunications
facilities (consistent with the coverage of Australian infrastructure statistics in BITRE 2012):
Economic infrastructure incorporates the physical structures from which goods and associated services are produced that enter as common inputs to many industries, and which play a large part in determining efficiency, industry costs and levels of production. (Chan et al. 2009, p. 3)
This report presents relevant information and examines key aspects relating to infrastructure in
Australia’s food supply chain including: background information (Chapter 2); the regional
pattern of Australia’s food production, processing and exports, including a comparison of
historical outcomes with 2050 preliminary projections (Chapter 3); case studies (Chapter 4);
economic issues relating to the pricing and provision of infrastructure in Australia’s food supply
chain (Chapter 5); and concluding comments, including identifying key future research
directions (Chapter 6). Major infrastructure data sources are listed in Appendix A and
background information on the case study for Tasmania is provided in Appendix B.

Infrastructure and Australia’s food industry: Preliminary economic assessment
5
2 Background This chapter provides background information on global food demand to 2050, Australia’s food
production and trade, and economic linkages between key food and infrastructure industries.
Key economic linkages in Australia’s food market
Australia’s food supply chain includes food producers, processors, distributors and service
providers (Figure 1). Australia is a net food exporter—between 2006–07 and 2008–09, around
60 per cent of Australia’s agricultural production was exported and around 54 per cent of food
production was exported (Penm et al. 2010). Consistent with other physical supply chains, the
food supply chain is highly dependent on a range of infrastructure for continuity of operation
(Bartos et al. 2011).
Figure 1 Key economic linkages in Australia's food market
Global food demand to 2050
The world’s long-term food requirements are likely to be substantial, particularly as the world
population is projected to increase from around 7 billion in 2011 to 9.3 billion in 2050 and
10.1 billion in 2100 (UN 2011; medium variant). By 2050, world agricultural production may
need to increase by 70 per cent to meet the food security demands of the growing world
population (HLPE 2011).
In ongoing research, ABARES is examining the outlook for the world agrifood market to 2050
and assessing the implications for Australia’s food exports. Preliminary ABARES projections
indicate that, between 2007 and 2050, world agrifood consumption may increase by 77 per cent
or 1.3 per cent a year on average (in 2007 US dollars) (Linehan et al. 2013, 2012,). Higher
demand in Asia accounts for over two-thirds of the projected increase in world food demand.
World consumption is projected to increase most strongly for fruit and vegetables (annual
average growth rate of 1.2 per cent), meat (1.7 per cent), dairy products (1.1 per cent), cereals
(1.8 per cent), fish (1.7 per cent) and vegetable oils (1.4 per cent) (Figure 2a).
Farmers & fishers
Key influences: prices, availability &
cost of inputs (e.g. land, water, labour,
energy), technologies, climate
& other risks
Agriculture & fishing
Food processors
Economies of scale by accessing farm
produce from different regions;
value adding (product branding, quality premium);
innovation
Manufacturing
Consumers
Key influences: food prices, population,
incomes, tastes and preferences
Food security: reliable access to affordable, safe &
nutritious food
Households
Key economic issues: global food security, trade and market access
Outlook to 2050: strong food demand growth in the Asian region
Exports
Food demand in Australia
Food supply in Australia
World food market
Imports
Distributors & service providers
Efficient & diversified distribution network
(e.g. transport & storage, wholesale &
retail trade); restaurants etc; food
tourism, R&D
Services

Infrastructure and Australia’s food industry: Preliminary economic assessment
6
International trade is likely to become more important in supplying people with food—
preliminary projections indicate the share of world consumption sourced from imports may
increase from around 10 per cent in 2007 to 15 per cent in 2050. World agrifood imports are
projected to increase by 2.4 per cent a year on average between 2007 and 2050 with significant
increases in world imports of fruit and vegetables (annual average growth rate of 1.5 per cent),
meat (4.2 per cent), dairy products (1.8 per cent), cereals (5.1 per cent), fish (2.1 per cent) and
vegetable oils (1.8 per cent) (Figure 2b).
Figure 2 ABARES preliminary projections for world agrifood consumption and imports, 2007 and 2050
Data source: Linehan et al. 2012a
Higher global agrifood demand is expected to provide significant export market opportunities
for the domestic food industry, particularly given Australia’s geographic proximity to the
strongly growing Asian market. ABARES preliminary projections indicate Australia’s agricultural
exports are likely to increase most strongly for beef, wheat, dairy products, sheep meat and
sugar (in 2007 US dollars) (Figure 3). Preliminary ABARES projections for the quantity of
Australia’s agrifood production and exports to 2050 are provided in Chapter 3.
Figure 3 ABARES preliminary projections for Australia's major agricultural exports, by commodity, 2007 and 2050
Data source: Linehan et al. 2012a
a) Consumption b) Imports
0 500 1000 1500 2000
Other food
Vegetable meal
Vegetable oils
Fish
Dairy products
Cereals
Meat
Fruit & vegetables
2007 US$b
2050
2007
0 100 200 300
Other food
Vegetable meal
Vegetable oils
Fish
Dairy products
Cereals
Meat
Fruit & vegetables
2007 US$b
2050
2007
0 5 10 15
Sheep meat
Sugar
Dairy products
Wheat
Beef
2007 US$b
2050
2007

Infrastructure and Australia’s food industry: Preliminary economic assessment
7
Australia’s food production and trade
Food production
The agricultural, fisheries and forestry sector produces both food and non-food commodities
(Figure 4). Food commodities may be produced for food use (human consumption, and animal
and fish feed) or non-food use (such as inputs to biofuel production).
Figure 4 Agriculture, fisheries and forestry—food and non-food commodities and uses
In 2011–12, the gross value of Australia’s agricultural, fisheries and forestry production was
$52 billion, comprising food commodity production of around $45 billion (86 per cent of the
total) and estimated non-food commodity production of around $7.5 billion (14 per cent) (Table
1). The gross value of food commodities produced, at least partly, for human consumption was
an estimated $43 billion or 82 per cent of total production in 2011–12 (DAFF 2013; see also
DAFF 2012b).
Table 1 Australia's gross value of production in agriculture, fisheries and forestry, food and non-food, 2011–12
Commodity Value Share of total
$b %
Food commodities
Crops a 24.0 46.1
Livestock and livestock products b 18.3 35.1
Fisheries products c 2.3 4.4
Total food commodity groups 44.5 85.6
Non-food commodity groups
Cotton lint and cottonseed 2.9 5.6
Wool 2.9 5.5
Pearls 0.1 0.2
Forestry products 1.6 3.2
Total non-food commodity groups 7.5 14.4
Agriculture, fisheries and forestry—total
Crops 26.9 51.6
Livestock and livestock products 21.1 40.6
Fisheries products 2.4 4.6
Forestry products 1.6 3.2
Total 52.0 100.0
Note: a Excludes cotton lint and cottonseed. b Excludes wool. c Excludes pearls.
Source: ABARES 2013
Agriculture, fisheries and
forestry
Food commodities
Food use
Human consumption
Animal and fish feed
Non-food use
e.g. biofuels
Non-food commodities
Non-food use
Infrastructure and Australia’s food industry: Preliminary economic assessment
8
Food trade
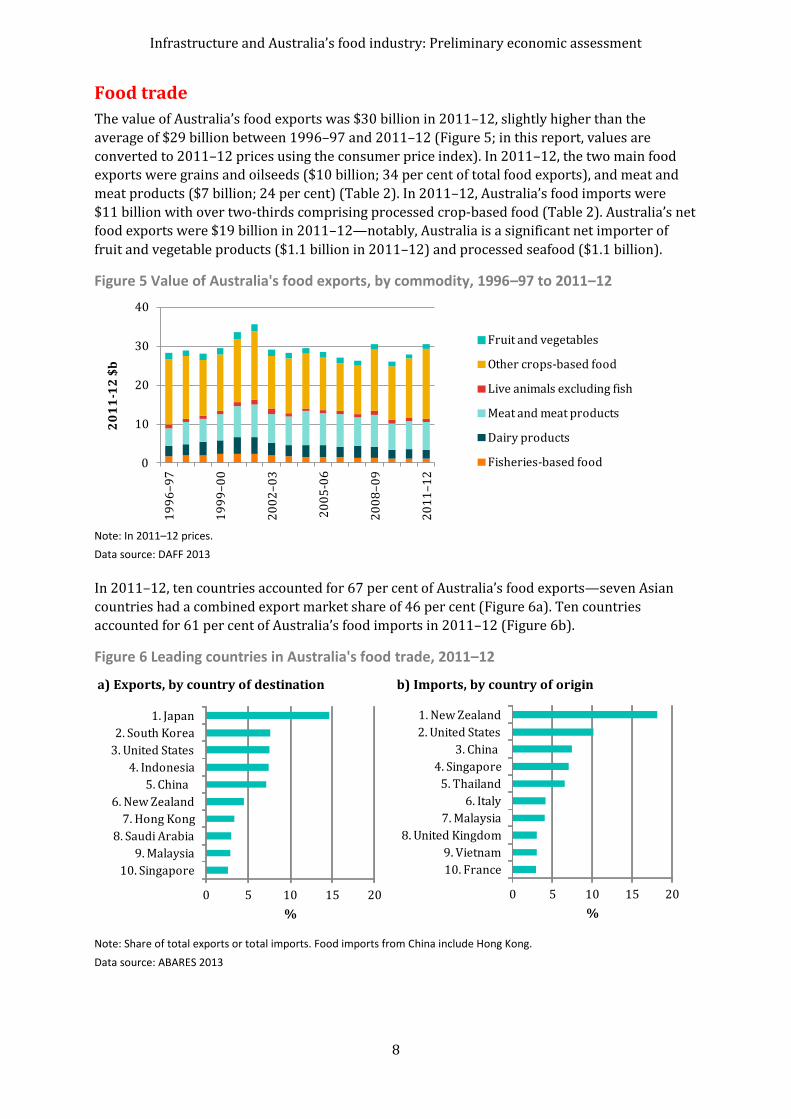
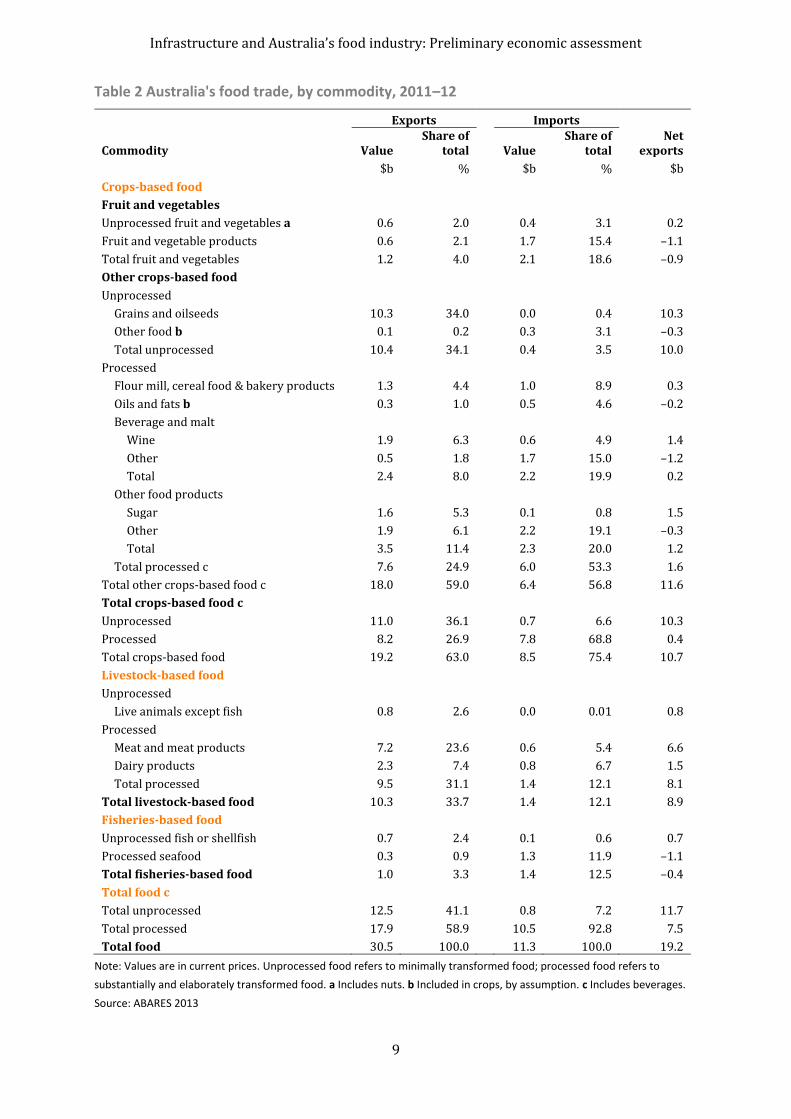
The value of Australia’s food exports was $30 billion in 2011–12, slightly higher than the
average of $29 billion between 1996–97 and 2011–12 (Figure 5; in this report, values are
converted to 2011–12 prices using the consumer price index). In 2011–12, the two main food
exports were grains and oilseeds ($10 billion; 34 per cent of total food exports), and meat and
meat products ($7 billion; 24 per cent) (Table 2). In 2011–12, Australia’s food imports were
$11 billion with over two-thirds comprising processed crop-based food (Table 2). Australia’s net
food exports were $19 billion in 2011–12—notably, Australia is a significant net importer of
fruit and vegetable products ($1.1 billion in 2011–12) and processed seafood ($1.1 billion).
Figure 5 Value of Australia's food exports, by commodity, 1996–97 to 2011–12
Note: In 2011–12 prices.
Data source: DAFF 2013
In 2011–12, ten countries accounted for 67 per cent of Australia’s food exports—seven Asian
countries had a combined export market share of 46 per cent (Figure 6a). Ten countries
accounted for 61 per cent of Australia’s food imports in 2011–12 (Figure 6b).
Figure 6 Leading countries in Australia's food trade, 2011–12
Note: Share of total exports or total imports. Food imports from China include Hong Kong.
Data source: ABARES 2013
0
10
20
30
40
19
96
–9
7
19
99
–0
0
20
02
–0
3
20
05
-06
20
08
–0
9
20
11
–1
2
20
11
-12
$b
Fruit and vegetables
Other crops-based food
Live animals excluding fish
Meat and meat products
Dairy products
Fisheries-based food
a) Exports, by country of destination b) Imports, by country of origin
0 5 10 15 20
10. Singapore
9. Malaysia
8. Saudi Arabia
7. Hong Kong
6. New Zealand
5. China
4. Indonesia
3. United States
2. South Korea
1. Japan
%
0 5 10 15 20
10. France
9. Vietnam
8. United Kingdom
7. Malaysia
6. Italy
5. Thailand
4. Singapore
3. China
2. United States
1. New Zealand
%
Infrastructure and Australia’s food industry: Preliminary economic assessment
9
Table 2 Australia's food trade, by commodity, 2011–12
Exports
Imports
Commodity Value
Share of total Value
Share of total
Net exports
$b % $b % $b
Crops-based food
Fruit and vegetables
Unprocessed fruit and vegetables a 0.6 2.0 0.4 3.1 0.2
Fruit and vegetable products 0.6 2.1 1.7 15.4 –1.1
Total fruit and vegetables 1.2 4.0 2.1 18.6 –0.9
Other crops-based food
Unprocessed
Grains and oilseeds 10.3 34.0 0.0 0.4 10.3
Other food b 0.1 0.2 0.3 3.1 –0.3
Total unprocessed 10.4 34.1 0.4 3.5 10.0
Processed
Flour mill, cereal food & bakery products 1.3 4.4 1.0 8.9 0.3
Oils and fats b 0.3 1.0 0.5 4.6 –0.2
Beverage and malt Wine 1.9 6.3 0.6 4.9 1.4
Other 0.5 1.8 1.7 15.0 –1.2
Total 2.4 8.0 2.2 19.9 0.2
Other food products Sugar 1.6 5.3 0.1 0.8 1.5
Other 1.9 6.1 2.2 19.1 –0.3
Total 3.5 11.4 2.3 20.0 1.2
Total processed c 7.6 24.9 6.0 53.3 1.6
Total other crops-based food c 18.0 59.0 6.4 56.8 11.6
Total crops-based food c
Unprocessed 11.0 36.1 0.7 6.6 10.3
Processed 8.2 26.9 7.8 68.8 0.4
Total crops-based food 19.2 63.0 8.5 75.4 10.7
Livestock-based food
Unprocessed
Live animals except fish 0.8 2.6 0.0 0.01 0.8
Processed
Meat and meat products 7.2 23.6 0.6 5.4 6.6
Dairy products 2.3 7.4 0.8 6.7 1.5
Total processed 9.5 31.1 1.4 12.1 8.1
Total livestock-based food 10.3 33.7 1.4 12.1 8.9
Fisheries-based food
Unprocessed fish or shellfish 0.7 2.4 0.1 0.6 0.7
Processed seafood 0.3 0.9 1.3 11.9 –1.1
Total fisheries-based food 1.0 3.3 1.4 12.5 –0.4
Total food c
Total unprocessed 12.5 41.1 0.8 7.2 11.7
Total processed 17.9 58.9 10.5 92.8 7.5
Total food 30.5 100.0 11.3 100.0 19.2
Note: Values are in current prices. Unprocessed food refers to minimally transformed food; processed food refers to
substantially and elaborately transformed food. a Includes nuts. b Included in crops, by assumption. c Includes beverages.
Source: ABARES 2013

Infrastructure and Australia’s food industry: Preliminary economic assessment
10
Australia’s key food and infrastructure industries
In this section, the key food industries are given by the agriculture, forestry and fishing sector
(includes food production), the food and beverage products industry (food processing) and the
food and beverage services industry (food services).
Output and employment
Output (based on gross value added) and employment data for the key food and infrastructure
industries in 2011–12 are given in Table 3. Gross value added is the value of output in an
industry or sector minus the value of goods and services consumed as inputs in the production
process (excluding the consumption of fixed capital) (ABS 2012a).
In 2011–12, the agriculture, forestry and fishing sector and food and beverage products industry
together accounted for 4.0 per cent of Australia’s gross domestic product and 4.9 per cent of
total employment. In the same year, infrastructure industries accounted for 10.0 per cent of
gross domestic product and 8.2 per cent of total employment—the transport, postal and
warehousing industry was the largest infrastructure industry (4.9 per cent of gross domestic
product), followed by information media and telecommunications (2.8 per cent), electricity and
gas (1.4 per cent) and water supply and waste services (0.9 per cent).
Table 3 Output and employment in food and infrastructure industries in Australia, 2011–12
Output
Employment
Industry/Aggregate Value Share of total Level Share of total
$b % 000 %
Agriculture, forestry and fishing 35 2.4 334 2.9
Food and beverage products 23 1.6 227 2.0
Accommodation and food services 34 2.3 763 6.7
Infrastructure
Transport, postal and warehousing
Road 20 1.4 – –
Rail, pipeline and other transport 11 0.8 – –
Air and space transport 8 0.5 – –
Transport, postal and storage services 32 2.2 – –
Total 71 4.9 565 5.0
Electricity, gas, water and waste services
Electricity and gas 21 1.4 – –
Water supply and waste services 13 0.9 – –
Total 33 2.3 153 1.3
Information media and telecommunications 41 2.8 216 1.9
Total infrastructure 146 10.0 935 8.2
Other industries 1117 76.9 9153 80.2
Gross value added at basic prices 1353 93.2 – –
Taxes less subsidies on products 94 6.5 – –
Statistical discrepancy 5 0.3 – –
Gross domestic product/total persons 1452 100.0 11413 100.0
Note: Output is industry gross value added (chain volume measures); other industries include ownership of dwellings.
Employment is thousands of persons; average of four quarters (based on original data). Food and beverage products
include alcohol and tobacco.
Sources: ABS 5206.0 (Australian National Accounts: National Income, Expenditure and Product) and 6291.0 (Labour Force)

Infrastructure and Australia’s food industry: Preliminary economic assessment
11
Food supply chain—main uses of food products and services in Australia
ABS input-output data describe the production and subsequent use of all goods and services in
the Australian economy (ABS 2012a). Input-output data for Australia in 2008–09, the latest year
available, are given in Appendix C. Intermediate inputs are domestic and imported products that
are used by industry (intermediate use) and/or in final use categories (domestic use and
exports).
The main uses of food products and services in 2008–09 are given in Figure 7 (based on share of
total supply; see Table C3). The main use of agriculture, forestry and fishing products was in the
food and beverage products industry (38 per cent) (Figure 7a). The main use of food and
beverage products was in the domestic market, particularly household consumption (40 per
cent) (Figure 7b). Food and beverage services were mainly used in the domestic market,
particularly household consumption (78 per cent) (Figure 7c).
The food supply chains for five major export commodities in Australia are discussed further in
Chapter 3.
Figure 7 Distribution of uses of food products and services in Australia, 2008–09
Note: Based on share of total supply in 2008–09; total supply is given in each subheading. Figure includes intermediate and
final uses of food products and services.
Data source: ABS, Australian National Accounts: Input-Output Tables – 2008–09, cat. no. 5209.1
a) Agriculture, forestry and fishing products ($67 billion)
b) Food and beverage products ($99 billion)
c) Food and beverage services ($55 billion)
0 20 40 60 80
Final use - export market
Final use - domestic market
Other industry uses
Food and beverage services
Food and beverage products
Agriculture, forestry and fishing
%
0 20 40 60 80
Final use - export market
Final use - domestic market
Other industry uses
Food and beverage services
Food and beverage products
Agriculture, forestry and fishing
%
0 20 40 60 80
Final use - export market
Final use - domestic market
Other industry uses
Food and beverage services
Food and beverage products
Agriculture, forestry and fishing
%

Infrastructure and Australia’s food industry: Preliminary economic assessment
12
Infrastructure inputs to key food industries
In 2008–09, infrastructure inputs were valued at $4.2 billion in the agricultural, forestry and
fishing sector (10.6 per cent of total intermediate inputs), $6.3 billion in the food and beverage
products industry (10.1 per cent) and $3.9 billion in the food and beverage services industry (14
per cent) (Table C1 and Table C2). Road transport and transport, postal and storage services
were the two main infrastructure costs in the food production and processing industries, while
information media and telecommunications was the main infrastructure cost in the food
services industry (Figure 8).
Notably, these food production, processing and services industries used around 5.1 per cent of
the total value of infrastructure services supplied in 2008–09 (Table C3).
Figure 8 Distribution of infrastructure input costs for key food industries in Australia, 2008–09
Note: Total infrastructure costs in 2008–09 are given in each subheading.
Data source: Based on ABS, Australian National Accounts: Input-Output Tables – 2008–09, cat. no. 5209.1
a) Agriculture, forestry and fishing sector ($4.2 billion)
b) Food and beverage products industry ($6.3 billion)
c) Food and beverage services industry ($3.9 billion)
0 10 20 30 40 50 60
Information media & telecommunications
Water supply & waste services
Electricity & gas
Transport, postal & storage services
Air & space transport
Rail, pipeline & other transport
Road transport
%
0 10 20 30 40 50 60
Information media & telecommunications
Water supply & waste services
Electricity & gas
Transport, postal & storage services
Air & space transport
Rail, pipeline & other transport
Road transport
%
0 10 20 30 40 50 60
Information media & telecommunications
Water supply & waste services
Electricity & gas
Transport, postal & storage services
Air & space transport
Rail, pipeline & other transport
Road transport
%

Infrastructure and Australia’s food industry: Preliminary economic assessment
13
3 Regional distribution of Australia’s food production
By 2050 it is likely that strong growth in global food demand will drive higher world agrifood
prices and production and lead to increases in Australian agricultural production and exports
(Linehan et al. 2012a). It will be important to understand the potential regional distribution of
this increased production, particularly in relation to the future capacity of infrastructure
supporting commodity supply chains. In this chapter the supply chains of five selected
commodities—wheat, sugar, beef, sheep meat and dairy products—are discussed and a simple
methodology is used to disaggregate preliminary projections of increases in production and
exports to 2050 to specific regions in order to facilitate a discussion of potential infrastructure
challenges.
Methodology and data
A discussion of potential future infrastructure challenges facing the agriculture sector would
ideally be informed by a set of long-term regional production projections for key commodities.
However, long-term projections at a regional level are not currently available. To facilitate a
discussion of potential infrastructure challenges, preliminary results from the ABARES agrifood
model of global agricultural supply, demand and trade (see Linehan et al. 2012b) are used.
At a national level, exports of beef, wheat, dairy products, sheep meat and sugar are projected to
have the largest increase in real value (Linehan et al. 2012a) with the real export value of beef
and dairy products projected to more than double by 2050 (Figure 3). Due to their large
potential increases in real value, these five commodities are the focus of the current scoping
study but it is worth noting that future growth in production of other commodities might also be
affected by infrastructure constraints; this may be explored in future research.
As Linehan et al. (2012a) highlighted, these projections are conditional on a set of assumptions
about likely trends, particularly in the global macro-economic environment and agricultural
technological change, together with assumptions about the sensitivity of agricultural demand
and supply to changes in incomes and prices. As such, Linehan et al. (2012a) suggest this
‘conditional baseline’ may serve as a starting point for scenario analysis. The ABARES agrifood
model is being further developed, so the projections of Linehan et al. (2012a) and those used in
this report should be viewed as preliminary.
As output from the ABARES agrifood model is only available at a national level, it is necessary to
‘downscale’ the results to explore implications at a regional level.
Long annual time series of historical production are available at the ABS Statistical Division (SD)
level. The preliminary projections for 2050 from the ABARES agrifood model have been
disaggregated across the 60 SDs that partition Australia, using two simple approaches.
The ‘average’ approach assumes that an SD’s share of Australia’s production in 2050 is equal to its average share of production from the past 10 years (2000–01 to 2010–11).
The ‘trend’ approach extrapolates the linear trend in an SD’s share of Australia’s production from 1993–94 to 2010–11 to 2050, but constrains it to within 75 to 125 per cent of the 10-year average share of production.

Infrastructure and Australia’s food industry: Preliminary economic assessment
14
Where historic trends in the share of Australian production accounted for by each region are
expected to continue, the trend approach would usually be preferred. However, the continuation
of historic trends may not be appropriate in all cases and the average approach may be more
suitable. Substantial differences in the results produced using each approach indicate significant
trends in historic data. Development of modelling capacity that produces results at a regional
level and incorporates information on constraints to production (such as availability of suitable
land and water resources) is required to improve on the simple approaches employed here.
The preliminary projections for export quantities in 2050 were also disaggregated across the six
states and the Northern Territory using the same approaches.
The ‘simple disaggregation’ is presented with annual time series of historical production and
exports from 1993–94 to 2010–11 in each commodity regional distribution map in Appendix
D—employment in the corresponding food processing industry in 2010–11 is indicated by the
shading of the SDs. Summary information on production and exports under the average and
trend approaches is also provided in Appendix D.
The approaches taken here to disaggregate preliminary national projections will not capture
future major new development areas or major shifts in the pattern of production (for example,
as a result of climate change), but may be considered a first approximation to how potential
production increases may be distributed and provide a way to explore potential future
infrastructure challenges.
The discussion of potential infrastructure issues associated with an expansion in production of
each commodity, as presented later in this chapter, draws on previous studies where possible.
Further analysis is needed to identify areas where additional investment in infrastructure may
be required. However, the availability of data needed for such analysis is currently limited. In
particular, data on freight movements (detailed data on the products being transported and
origin and destination of the products) is not comprehensive and limits the understanding of
transport requirements for the agriculture sector and the broader freight task (Tulloh & Pearce
2011).
Further research could undertake a more detailed analysis of potential infrastructure
constraints in agrifood supply chains, including consideration of potential scenarios for the
regional pattern of future growth in agricultural production and exports (such as the potential
impacts of climate change on the location of agricultural production).
Wheat
The wheat industry, its supply chain and the infrastructure linking each stage are outlined
below. The simple disaggregation of the preliminary projections of national wheat production
and exports to 2050 is then presented, followed by a brief discussion of potential infrastructure
issues associated with an expansion in production.
Wheat production and exports
Wheat is the most significant grain crop grown in Australia in terms of area sown, volume of
grain produced and value of the crop. In 2011–12 the total area of wheat sown in Australia was
13.9 million hectares, with 29.9 million tonnes of production. The estimated value of wheat
production in 2011–12 was $6.78 billion, accounting for 14.1 per cent of the gross value of total
farm production (ABARES 2013).

Infrastructure and Australia’s food industry: Preliminary economic assessment
15
Australia exported 23 million tonnes of wheat in 2011–12, accounting for nearly 77 per cent of
wheat production. The total value of wheat exports was $6.4 billion, equivalent to 16 per cent of
the total value of rural exports (ABARES 2013). Although most wheat produced in Australia is
exported in bulk, the composition of total exports by mode varies across states. Over the five
years to 2008–09, non-bulk exports accounted for about 35 per cent of Victoria’s exports, 30 per
cent of Queensland’s and 20 per cent of New South Wales’ exports. In the same period, non-bulk
exports accounted for only 6–7 per cent of exports from Western Australia and South Australia
(PC 2010).
The wheat industry has undergone significant changes in technology adoption, management
practices, structure and marketing arrangements.
Long-term productivity gains have been achieved through the adoption of new technologies and
management practices in the cropping industry (Hughes et al. 2011). This includes increased use
of fertilisers, seed and crop chemicals, causing materials’ share of all cropping inputs to more
than double since 1977–78. Increased yields have also come from the introduction of low-till
and no-till farming and the introduction of new crop varieties (Dunlop et al. 2004). A shift in the
1980s and 1990s toward much larger and more efficient sowing and harvesting equipment has
been another key contributor to higher productivity (Nossal et al. 2009).
The number of grain farms in Australia declined by 40 per cent between 1977–78 and 2003–04
and the average area operated per farm increased by 50 per cent (Alexander & Kokic 2005).
Increases in average farm size have facilitated productivity growth. The average area cropped
per farm more than doubled over the past two decades, with the highest growth in area
occurring in Western Australia. Larger cropping farms tend to be more productive because of
their greater capacity to adopt new technologies (Sheng et al. 2011), particularly advanced
cropping technologies that are often only suitable for use on farms above a minimum size.
The marketing arrangements for wheat have also undergone significant change. Between 1999
and 2008 the single desk marketing arrangements were dismantled, which has provided
growers with more choices to market grain and manage production and price risk (PC 2010).
Wheat supply chain and infrastructure
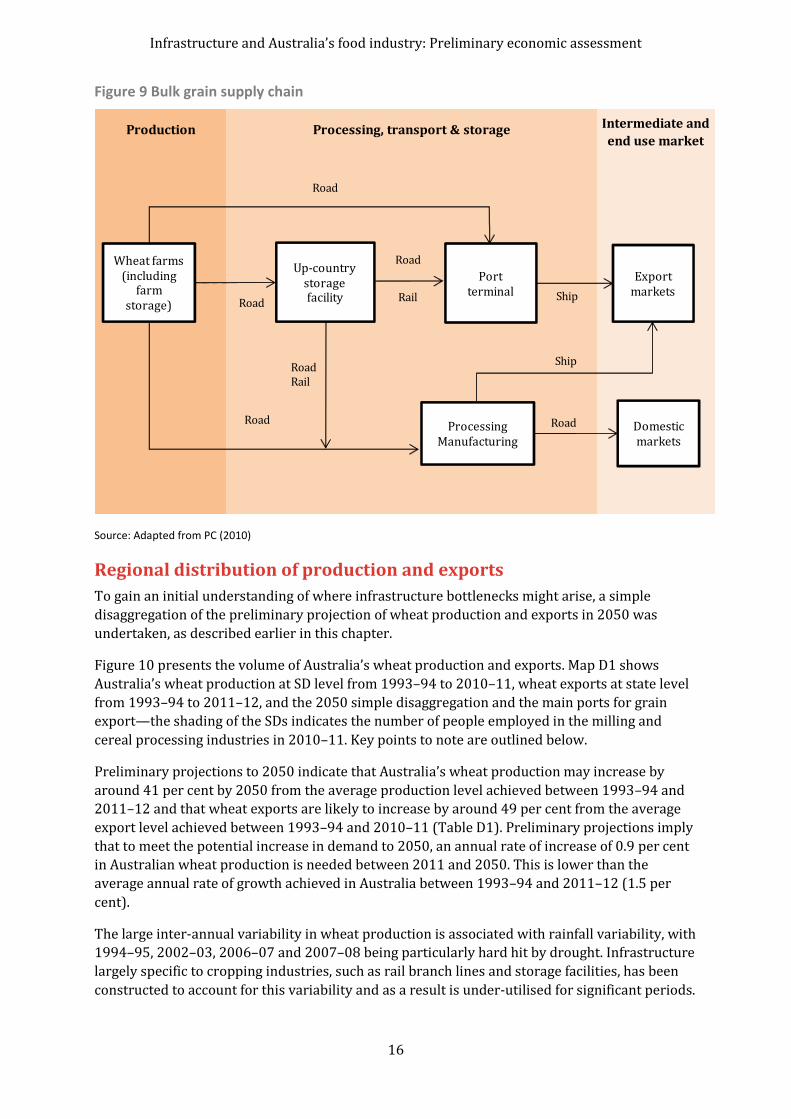
Most of Australia’s wheat is supplied through the bulk grain handling system (PC 2010). Figure 9
provides an overview of the bulk grain supply chain.
The supply system starts with farm production and on-farm storage, followed by a network of up-country storage facilities connected by road and rail transport links to manufacturers, processors, port facilities and intermediate and end use markets.
A portion of Australia’s wheat production is stored on-farm or transported directly from the farm gate to processing and manufacturing facilities or a non-bulk grain handler for packing and sale or export in containers and bags.
Export of wheat and processed wheat is mainly by sea freight from port terminals or directly from processing and manufacturing facilities.
Processed wheat products are transported to domestic markets using the road network. The domestic market is now the dominant market segment in New South Wales and Queensland and potentially Victoria (NTC 2009b).
Infrastructure and Australia’s food industry: Preliminary economic assessment
16
Figure 9 Bulk grain supply chain
Source: Adapted from PC (2010)
Regional distribution of production and exports
To gain an initial understanding of where infrastructure bottlenecks might arise, a simple
disaggregation of the preliminary projection of wheat production and exports in 2050 was
undertaken, as described earlier in this chapter.
Figure 10 presents the volume of Australia’s wheat production and exports. Map D1 shows
Australia’s wheat production at SD level from 1993–94 to 2010–11, wheat exports at state level
from 1993–94 to 2011–12, and the 2050 simple disaggregation and the main ports for grain
export—the shading of the SDs indicates the number of people employed in the milling and
cereal processing industries in 2010–11. Key points to note are outlined below.
Preliminary projections to 2050 indicate that Australia’s wheat production may increase by
around 41 per cent by 2050 from the average production level achieved between 1993–94 and
2011–12 and that wheat exports are likely to increase by around 49 per cent from the average
export level achieved between 1993–94 and 2010–11 (Table D1). Preliminary projections imply
that to meet the potential increase in demand to 2050, an annual rate of increase of 0.9 per cent
in Australian wheat production is needed between 2011 and 2050. This is lower than the
average annual rate of growth achieved in Australia between 1993–94 and 2011–12 (1.5 per
cent).
The large inter-annual variability in wheat production is associated with rainfall variability, with
1994–95, 2002–03, 2006–07 and 2007–08 being particularly hard hit by drought. Infrastructure
largely specific to cropping industries, such as rail branch lines and storage facilities, has been
constructed to account for this variability and as a result is under-utilised for significant periods.
Production Processing, transport & storage Intermediate and
end use market
Road
Ship
Up-country storagefacility
Port terminal
Export markets
Road Rail
Road
Road
Ship
Road
Domestic markets
Wheat farms (including
farm storage)
Rail
RoadProcessing
Manufacturing

Infrastructure and Australia’s food industry: Preliminary economic assessment
17
The simple disaggregation of the preliminary projections for wheat production and exports in
2050 is of a similar order of magnitude to the recent peak seasons. For example, in Western
Australia, it is projected that by 2050, average wheat production will be 10.8 million tonnes,
slightly lower than the highest production level of the past 10 years (11.4 million tonnes in
2004). However, as the 2050 volumes are an average level with significant inter-annual
variability, they do imply substantial increases in years with good seasonal conditions.
Figure 10 Wheat production and exports
Note: Exports include the grain equivalent of wheat flour. ABARES preliminary projection
Source: ABARES, ABS
Maintaining current distribution networks would appear to be adequate for processing future
production levels in years with average seasonal conditions. However, increased capacity may
be needed in years with good seasonal conditions. In addition, increased international
competition is likely to continue to drive efforts to increase the efficiency of grain handling.
The National Transport Commission identified a number of impediments to supply chain
performance in its Supply Chain Pilots Draft Position Paper (NTC 2009a) which are outlined
below. Wheat/grain production expansion to 2050 is likely to increase the importance of
addressing these issues.
Road and rail pricing distortion is a primary impediment to efficient modal decisions and appropriate capital investment by government and industry. Under current road and rail pricing structures, much of the rural transport network is provided on a subsidised basis. The provision of subsidies makes it difficult for governments to prioritise capital investment and major maintenance needs between individual regional routes, and between rural and urban routes. In addition, for grain transport, governments have to weigh up the need for rail track provision, particularly in lightly populated areas which are already serviced by roads.
Limited integration planning and investment exists across modes in the grain supply chain despite the interdependencies between road and rail investment and between land transport and port investments. For example, the closure of branch lines in the grain networks is not normally considered together with increased road maintenance costs.
Vertical separation between low-volume rail networks and above-rail services provides few benefits and incurs high costs. The rationale for vertical separation of below-rail infrastructure provision from above-rail operations is to promote above-rail competition.
0
5 000
10 000
15 000
20 000
25 000
30 000
1994 1998 2002 2006 2010 2050kt
Exports
Production

Infrastructure and Australia’s food industry: Preliminary economic assessment
18
However, for the grain industry, as there is limited scope for more than one above-rail operator due to low volumes, the costs of vertical separation might outweigh the benefits. The National Transport Commission (NTC 2009a) suggested that an investigation of vertical reintegration of grain networks be undertaken.
Around 90 per cent of wheat exports is handled in bulk and around 10 per cent are in bags and
containers (PC 2010). The use of containers for exports expanded significantly after the
marketing of Australian wheat was deregulated and reached more than one-quarter in 2007–08.
Using containers can provide some flexibility in peak years. However, in more recent times, the
use of containers has been consistently declining and it is not clear to what extent they will
continue to be used.
Sugar
The sugar industry, its supply chain and the infrastructure linking each stage are outlined below.
The simple disaggregation of the preliminary projections of national sugar production and
exports to 2050 are then presented, followed by a brief discussion of potential infrastructure
issues associated with an expansion in production.
Sugar production and exports
The Australian sugar industry produces raw and refined sugar from sugar cane. In 2011–12 the
gross value of sugar cane production was approximately $1.2 billion and total sugar production
was 3.7 million tonnes, roughly 2 per cent of world sugar production (ABARES 2013).
Queensland accounts for 95 per cent of Australian sugar production and the remainder is
produced in New South Wales.
Around 75 to 80 per cent of sugar produced in Australia is exported, making Australia one the
world’s largest exporters of raw sugar. In 2011–12, Australia exported 2.6 million tonnes of
sugar, which was about 5 per cent of world sugar exports and valued at nearly $1.6 billion
(ABARES 2013).
The previous decade has seen rationalisation of the number of cane growing farms. The
Australian sugar industry has 3765 cane farm businesses (ABS 2012b) and 24 sugar mills
(Australian Sugar Milling Council 2012). From 2005 to 2008 there was downward pressure on
the profitability of some canegrowers as world sugar supply increased (Hooper 2008). There
has been a trend toward fewer, larger cane growing farms as smaller growers have left the
industry. However, production has remained relatively stable and it is likely that some
economies of scale exist in sugar production (Hooper 2008). Higher prices, foreign investment
and a desire by processors to reduce spare capacity have also provided incentives to maintain
cane production area or return land to cane production (Rabobank 2013).
Sugar cane production is particularly important for some regional Queensland economies. In the
Townsville region, sugar cane production was 54 per cent ($344 million) of the region’s total
gross value of agricultural production and accounted for 58 per cent of the region’s farms
(Trestrail et al. 2013a). Sugar cane production was also important in the Mackay and Cairns
regions, contributing 27 per cent to the total gross value of agricultural production in both
regions or $240 million and $185 million, respectively (Trestrail et al. 2013b, c). The importance
of sugar cane to regional economies was less pronounced in New South Wales. Sugar cane
production contributed 11 per cent ($22 million) of the Coffs Harbour – Grafton region’s gross
value of agricultural production, the third most important agricultural output after fruit and beef
for the region (Binks et al. 2013).

Infrastructure and Australia’s food industry: Preliminary economic assessment
19
Sugar supply chain and infrastructure
Figure 11 provides an overview of Australia’s sugar supply chain.
Harvested sugar cane is transported to a miller, usually within 16 hours of harvest to avoid crop deterioration. To achieve this, most sugar production is organised around sugar mills.
In Queensland, transport from the farm to the miller is primarily by miller-owned cane railway, but also by road.
In New South Wales, transport from the farm to the miller is by road.
At the mill, the harvested sugar cane is milled into raw sugar and stored short-term in bulk bins at the mill.
Figure 11 Sugar supply chain
Source: Adapted from Woodhead et al 2006.
In Queensland, bulk raw sugar is transported by road or rail to bulk sugar terminals, where it is stored before being exported or sent to refineries. Queensland accounts for all Australian sugar exports.
Bulk raw sugar either from bulk terminals or container terminals is sea freighted to overseas markets.
In New South Wales, bulk raw sugar is primarily transported by road to refineries for refining and processing for domestic consumption.
Refined sugar and other manufactured sugar products are transported to the domestic markets through the road network and sea freight.
Apart from raw and refined sugar, the industry produces molasses, ethanol (using molasses as a feedstock); electricity for export to the grid, mulch, mull mud (fertiliser) and furfural.
Production Processing, transport & storage End use market
RoadRoad
RailRoad
Sugar farms Miller
Export markets
Domestic markets
Manufacturing(Refinery)
Bulkterminal
Ship
RailRoad
Containerterminal
Road
Ship
Road
Rail
Road

Infrastructure and Australia’s food industry: Preliminary economic assessment
20
Regional distribution of production and exports
To examine the potential regional distribution of sugar production and exports to 2050 the
approach described at the beginning of this chapter was used. Figure 12 presents Australia’s
sugar production and exports. Map D2 shows SD level historical sugar production from 1993–94
to 2010–11 and projected sugar production in 2050—the shading of the SDs in the map
indicates the number of people employed in sugar and confectionery manufacturing industries
in 2010–11. Key points to note are outlined below.
Figure 12 Sugar production and exports
Note: ABARES preliminary projection
Source: ABARES, ABS
Preliminary projections to 2050 indicate the potential for Australian sugar production and
exports to be significantly larger in 2050 than historical production and exports:
production is projected to increase by 58 per cent by 2050 from the average production achieved between 1993–94 and 2010–11 of 4.8 million tonnes (Table D2)
exports are projected to expand substantially, to 6.3 million tonnes by 2050 from the average achieved between 1993–94 and 2011–12 of more than 3.7 million tonnes (Table D2).
Preliminary projections of substantial increases in production and exports reflect, to a large
degree, expectations of increases in global demand. While Australian production would have to
increase by less than 1.2 per cent a year from 2011 to reach the 2050 projection, this would be a
considerable change from the average annual decline of 0.7 per cent realised between 1993–94
and 2011–12. The opportunities and constraints to increased sugar production in Australia
require further investigation.
Using the simple disaggregation methods described earlier, the largest projected increase in
sugar production is in northern and far northern Queensland, near the Cairns, Mourilyan,
Lucinda, Townsville and Mackay ports. Projected production in these regions in 2050 is greater
than the historical production average or trend. However, the existing sugar industry is largely
landlocked and the scope for expanding cane areas does not appear to be large so most of any
increase from these areas would need to come from improvements in yield.
0
1 000
2 000
3 000
4 000
5 000
6 000
7 000
8 000
1994 1998 2002 2006 2010 2050
kt
Exports
Production

Infrastructure and Australia’s food industry: Preliminary economic assessment
21
If significant increases from existing areas are realised, significant improvements in sugar
handling capacities may also be needed along the supply chain to move sugarcane from farms to
mills and ports, and onto ship for exports. Sugar specific infrastructure, including cane railways
and bulk sugar terminals, as well as supporting road infrastructure, will be important.
The simple disaggregation of projected increases does not consider potential production in new
regions, such as the Ord River irrigation area which produced sugar cane until the mill closure in
2007–08. Expansion of sugar cane production into new regions may be more likely than
significant expansion from existing regions but will require investment in sugar specific
infrastructure to move sugar cane to mills and then to refineries or to a port with bulk sugar
handling capacity.
Beef
The beef industry, its supply chain and the infrastructure linking each stage are described below.
The simple disaggregation of the preliminary projections of national beef production and
exports to 2050 is then presented, along with a discussion on potential infrastructure issues
associated with an expansion in production.
Beef and veal production and exports
The industry accounts for more than half of Australia’s total meat production in volume terms.
In 2011–12, the industry produced 2.1 million tonnes of beef and veal. The gross value of
Australian cattle and calf production (including live cattle exports) was around $7.5 billion in
2011–12, accounting for 16 per cent of the gross value of farm production (ABARES 2013).
Australia is one of the world’s largest exporters of commercial livestock and red meat. The value
of beef and veal exports in 2011–12 was $4.5 billion and the value of live cattle exports was
$412 million (ABARES 2013).
The Australian beef industry in northern Australia is markedly different to that in southern
Australia. Differences in climatic and pasture conditions have resulted in significant differences
in stocking rates, average herd size and the main cattle breeds (Thompson & Martin 2012).
The beef industry in northern Australia is characterised by lower cattle stocking rates, lower carrying capacity, larger herd size and larger area of land operated than in southern Australia.
The main breeds of cattle in northern Australia are Bos indicus varieties, particularly Brahman and Brahman crossbreeds, as they are better suited to tropical conditions. In southern Australia, British and European Bos taurus breeds, such as Angus and Hereford, remain dominant.
Variations in breed, the types of cattle turned off and proximity to live export markets has resulted in cattle from the two regions being directed to different markets. In northern Australia, around 85 per cent of beef slaughter is exported and around 66 per cent of Australian live cattle exports are sourced from northern Australia. By contrast, 47 per cent of southern beef processing is directed to domestic markets (Gleeson at al. 2012).
Long-term output growth in the beef industry has averaged 0.6 per cent a year, through productivity growth (0.9 per cent a year) offsetting moderate reductions in input use (0.3 per cent a year). As shown in Table 4, in the northern region output growth averaging 0.6 per cent a year has been achieved by growth in productivity of one per cent a year outpacing a decline in input use of 0.4 per cent a year (primarily declines in land and labour use). In contrast, higher

Infrastructure and Australia’s food industry: Preliminary economic assessment
22
output growth in the southern beef industry, has been due to a combination of moderate growth in input use (particularly land and materials, including seed, fertiliser and crop chemicals) and productivity growth (Dahl et al. 2013).
Table 4 Average annual beef input, output and productivity growth, by region, 1977–78 to 2010–11
Region Productivity growth Output growth Input growth
% % %
All beef 0.9 0.6 –0.3
Northern region 1.0 0.6 –0.4
Southern region 0.4 0.8 0.4
Note: Estimates for the beef industry exclude large feedlots.
Source: Dahl et al. 2013
The northern beef industry has expanded over the past 20 years, driven by growth in the live
cattle export trade. Since 1988–89 average herd size has increased at an average rate of 1.3 per
cent a year and stocking rates by 2 per cent a year on average (Dahl et al. 2013).
Increases in the average size of northern beef operations have increased the capacity of
producers to invest in improved pastures, sophisticated cattle management systems and on-
farm infrastructure, facilitating productivity growth. In addition, the shift to a higher proportion
of Bos indicus breeds and the eradication of brucellosis and tuberculosis from the Australian beef
cattle herd have led to improvements in animal health, increasing branding rates (calves marked
as a percentage of cows mated) and reducing mortalities (Gleeson et al. 2012).
Productivity growth in the southern beef industry has been slower than in the northern
industry. Output growth has been highly variable, largely because of climate factors. Southern
beef producers tend to be smaller, more intensive operations that rely on improved pastures
(reflected by higher average stocking rates), and are more diversified than northern producers
(Nossal et al. 2008). As a result, productivity growth in the southern region is more sensitive to
drought conditions that increase use of purchased feed, adversely affect crop yields, and drive
significant destocking and restocking activities that hamper output growth.
Similar to the northern beef industry, advances in animal genetics and herd, disease and fodder
management have contributed to higher branding rates and reduced mortalities, increasing
productivity. However, the rate of improvement has been less significant in the south than in the
north, partly because of the better rates already achieved by southern beef producers. This may
be one factor explaining the lower productivity growth of southern producers. Another factor
may be the prevalence of small farms with less capacity to invest in and benefit from improved
technology and farm systems (Nossal et al. 2008).
Beef supply chain and infrastructure
The livestock supply chain includes production of beef cattle from breeding (on farm) through to
fattening (either on farm or in feedlots) before processing within Australia or exporting as live
animals (NTC 2009a).The focus of the beef supply chain in Figure 13 is to illustrate the type of
transport infrastructure used at each stage.
Beef producers, including lot feeders, send their cattle directly to abattoirs or to saleyards using the regional road network. Queensland is the only state still using rail to move cattle livestock (NTC 2009a).

Infrastructure and Australia’s food industry: Preliminary economic assessment
23
Beef cattle from farms and feedlots are transported to saleyards though major road networks and transported to abattoirs using the road network. Around 60 per cent of southern and 40 per cent of northern Australian cattle turn-off is marketed through saleyards (Thompson & Martin 2012).
Cattle is sold directly to exporters or their agents and transported through the road network from farms to holding facilities near live export ports before loading onto ship.
Most abattoirs carry out boning, packing and chilling/freezing activities in on-site processing facilities. Some abattoirs without on-site processing will transport chilled carcasses through the road network to processing and manufacturing facilities.
Frozen and chilled beef and veal are mostly exported using sea freight, although some high value beef and veal products are exported by airfreight (see Chapter 4 for details of Australia’s airfreight food exports).
Processed and manufactured beef and veal products are transported to domestic markets through the road network.
Figure 13 Beef supply chain
Source: Adapted from Vic DPI (2013)
Regional distribution of production and exports
Using the approach described above, simple disaggregation of beef and veal production and
exports to 2050 was obtained. Figure 14 presents Australia’s beef and veal production and
exports. Map D3 shows Australia’s cattle turn-off at SD level from 1993–94 to 2010–11, beef and
veal exports at state level from 1993–94 to 2011–12, the 2050 simple disaggregation and major
ports for beef and veal exports. The shading of the SDs indicates the number of people employed
in the meat manufacturing industries (includes all meats—beef, sheep, goats and pigs) in 2010–
11.
End use marketProduction Processing, transport & storage
Road
Road
RoadRoad
Saleyards
AbattoirsProcessing
Manufacturing
Export markets
Domestic markets
Live exports
Road
Ship
Ship/Air
Live exports ports
Road
Beef producers(feedlots & farmers)

Infrastructure and Australia’s food industry: Preliminary economic assessment
24
The preliminary projections indicate that total production and exports have the potential to
more than double by 2050 (Figure 14). Australia’s beef and veal production is projected to
increase by about 128 per cent by 2050 from the average production level achieved between
1993–94 and 2010–11 and exports are expected to increase by 222 per cent from the average
export level achieved between 1993–94 and 2011–12 (Table D3). These estimated totals include
live exports of slaughter and breeding cattle as carcass weight equivalents.
Figure 14 Beef production and exports
Note: Exports include carcass weight equivalent of live beef cattle exports. ABARES preliminary projection
Source: ABARES, ABS
These projections, to a large extent, reflect expected increases in global demand for red meat,
particularly from Asia. To reach the preliminary projection for 2050, Australian production of
beef and veal would need to increase at an average annual rate of around 2.1 per cent from
2011–12, significantly more than the average annual rate of 1.1 per cent realised between 1993–
94 and 2011–12. The way in which Australian production could expand in existing and newly
developed areas to meet this demand needs further investigation.
The largest beef cattle areas are mainly in eastern Australia, with some production in Western
Australia and the Northern Territory. Due to the approach used in constructing the simple
disaggregation, future beef and veal production is assumed to expand in those regions (Map D3).
The largest increase for beef is expected to occur in Queensland where beef production is
projected to increase by 138 per cent from the average production achieved between 1993–94
and 2010–11 (using the average approach, Table D3).
An increase in beef production is likely to result in higher pressure on road infrastructure as
cattle and beef transportation will compete with other industries for the use of road networks.
Urban encroachment and competition from the minerals and energy sector for port loading
capacity is a growing concern for live animal exports as gaining access to ports will likely
become more difficult (NTC 2009b). In addition, achieving the increase in supply of beef and veal
may involve the increased use of feedlots to finish cattle before slaughter and exports. This
would also involve an increase in the volume of cattle being moved by road, the transport of
fodder and refrigerated transport of meat products.
The National Transport Commission (NTC 2009a) identified a number of impediments to the
meat and livestock supply chain performance. As beef and veal production increases, it is
important that these issues be addressed to enable efficiency improvements in the livestock
0
1 000
2 000
3 000
4 000
5 000
1994 1998 2002 2006 2010
kt
Exports
Production
2050

Infrastructure and Australia’s food industry: Preliminary economic assessment
25
supply chain. The main issues identified in National Transport Commission (2009a) are outlined
below.
The lack of road network connectivity with major supply chain points for high productivity vehicles means that more efficient and higher capacity trucks must either detour or split the freight into smaller units. Often termed the ‘last mile’ problem, this situation occurs when routes approved for high-capacity trucks are not fully integrated with local networks.
On Queensland, Northern Territory and northern Western Australia ‘beef roads’, while wet seasonal conditions cause severe access problems for road transporters, funding from governments to maintain and upgrade these roads has been limited. Competition from mining and tourism in northern Australia contributes to the deterioration of these roads.
The minerals and energy sector is increasingly competing with the live cattle export industry for port loading capacity. As demand for Australia’s live cattle exports increases, this concern will continue to grow.
Capacity constraints in existing beef producing areas might suggest development in other parts
of Australia where the beef industry is not currently present. Beef industry expansion in the
northern parts of Australia (northern Queensland, Northern Territory and northern Western
Australia) is a possibility but would require large infrastructure investment. For example,
expansion of the beef industry will likely require investments in processing facilities (such as
abattoirs and manufacturing facilities) in northern Australia and in upgrading road transport
infrastructure to facilitate year-round access. ABARES in collaboration with the CSIRO is
undertaking a study investigating medium and longer term opportunities for irrigated
agriculture across northern Australia and critical supply chain and infrastructure investment
issues that may help foster those opportunities.
Sheep meat
The sheep meat industry, its supply chain and the infrastructure linking each stage are described
here. The simple disaggregation of the preliminary projections of national sheep meat
production and exports to 2050 is then presented, along with a discussion on potential
infrastructure issues associated with an expansion in production.
Sheep meat production and exports
Sheep meat, comprising lamb and mutton, is a major agricultural commodity in Australia. In
2011–12, 5.2 million sheep and 18.9 million lambs were slaughtered in Australia realising gross
value of production of $383 million and $1.95 billion, respectively.
Most sheep grazing for meat production occurs in grain growing areas and competes for land
used for wool production, which has declined significantly in recent decades. A fall in wool
prices, combined with stronger slaughter lamb prices over the past two decades led many wool
producers to diversify into sheep meat (ABARE 2007), although this trend softened slightly in
2012–13 (Caboche & Thompson 2013).
While lamb has traditionally been produced by diversified broadacre farms, non-traditional
regions such as South Australia have seen a marked increase in the number and share of
production of specialist sheep meat farms. Improved flock and pasture management practices
allowed specialist farms to produce significantly more lambs from flocks that were only slightly
larger, which contributed to superior financial performance by specialist producers relative to
non-specialist producers (ABARE 2007).

Infrastructure and Australia’s food industry: Preliminary economic assessment
26
The growth of specialist producers of lambs and sheep for slaughter has led to changed supply
chain practices, with an increased proportion of meat bypassing saleyards and being sold
directly to processors; however, traditional methods such as auctions and on-paddock sales are
still predominant (Caboche & Thompson 2013).
Production of lamb and mutton differ slightly in their regional distribution. Meat and Livestock
Australia (MLA 2012) Note that the prime lamb industry is mainly in the southern Murray–
Darling Basin, the wheat–sheep region of New South Wales and in high rainfall areas of Victoria
and South Australia. Mutton production is primarily located in southwest Western Australia,
southwest Victoria and southern New South Wales. The production of mutton is far less
concentrated in the southeast than the production of lamb.
The industry is highly export focused. In 2011–12, mutton exports were 74 per cent of the
volume of mutton produced and lamb exports were 38 per cent of the volume of lamb produced.
This was in addition to the live export of 2.6 million sheep with a value of $345 million (ABARES
2013). Around 60 per cent of Australian sheep meat exports (by volume) in 2011–12 were to the
Middle East, the United States and North Asia. While most sheep meat exported to the Middle
East is mutton, the United States and North Asia import considerably more lamb than mutton
(DAFF 2012a). Almost all (97 per cent) of the live sheep trade in 2011–12 was exported to the
Middle East; in particular, the gulf states of Bahrain, Kuwait and Qatar received more than two-
thirds of Australian live sheep exports (ABARES 2013).
Sheep meat supply chain and infrastructure
Sheep meat is processed for domestic consumption and export; a significant number of sheep
are exported. Figure 15 provides an overview of the sheep meat supply chain and indicates the
type of infrastructure used at different points in the supply chain.
All sheep are produced on farms and are transported by road. The capacity and distance of this transportation is limited by concerns to maintain acceptable standards of animal welfare and to minimise the effects maltreatment can have on quality.
Where a farmer has established contracts, or is vertically integrated into the supply chain (that is, all stages in the supply chain belong to the same owner), sheep can be sent directly to an abattoir for slaughter. Otherwise sheep are usually transported to saleyards where they are sold to buyers from the next stage of the production process for slaughter or live export. The proportion of lamb and sheep sold directly to processors increased from less than 5 per cent in 2001–02 to more than 30 per cent in 2006–07 but has since contracted to less than 20 per cent (Caboche & Thompson 2013).
After slaughter at the abattoir, the meat is processed into prepared cuts (chilled or frozen) or other foodstuffs. This can occur at large facilities (frequently co-located with abattoirs) or at retail outlets in the case of domestic consumption. Abattoirs are most frequently located in the south of the country near the bulk of the Australian population (NTC 2009b).
Transportation to domestic markets is conducted mainly by road and requires refrigerated transport and frequently cold storage at the wholesale level.
Both live and processed exports are conducted largely by ship, but where processed exports require refrigerated containers, live exports require specialised transport ships and export facilities (including regulated biosecurity elements), most of which are located in northern Australia (NTC 2009b).
Some high quality meat is exported by air freight, which requires cold storage at airports.

Infrastructure and Australia’s food industry: Preliminary economic assessment
27
Because export destinations for lamb and mutton differ, it is possible that their export infrastructure needs will differ, and the regional distribution of this infrastructure would have implications that further research would need to investigate.
Figure 15 Sheep meat supply chain
Source: Adapted from VIC DPI (2013) beef supply chain
Regional distribution of production and exports
Using the approach described above, simple disaggregation of sheep and sheep meat production
and exports to 2050 were obtained. These are shown in Map D4 with SD level historical
Australian sheep and sheep meat production and state level exports—SDs are shaded to
represent the number of people working in meat manufacturing, regardless of the type of meat.
Figure 16 shows Australia’s sheep meat production and exports.
Preliminary projections to 2050 indicate the potential for Australia’s sheep meat production to
increase by 55 per cent by 2050 from the average annual production achieved between 1993–94
and 2010–11. Preliminary projections also indicate that Australia’s sheep meat exports may
increase by almost 67 per cent by 2050 from the average export level achieved between 1993–
94 and 2011–12 (Table D4).
Achieving an increase in production consistent with the preliminary projections to 2050 would
require an average annual increase in production of around 1.1 per cent from 2011–12. This is
in contrast to the average annual growth rate of minus 0.4 per cent achieved between 1993–94
and 2011–12. Inter-annual variation is not large compared with other commodities, such as
wheat, and is more prominent in exports than in production.
Current production is primarily in southeast and southwest Australia in areas often shared with
wheat production. Using the simple disaggregation methodology, the largest increases are
projected in the southern states including a 60 per cent increase in South Australia, 62 per cent
Production End use marketProcessing, transport & storage
Road
Road
RoadRoad
Saleyards
AbattoirsProcessing
Manufacturing
Export markets
Domestic markets
Live exports
Road
Ship
Sheep Producers
Ship/Ai
Live exports ports
Road

Infrastructure and Australia’s food industry: Preliminary economic assessment
28
in Victoria and a 66 per cent increase in Tasmania from the average production level of 1993–94
to 2010–11 (using the average approach, Table D4).
It is not clear to what extent the increase in sheep meat production will require increased meat
processing capacity beyond that required to enable significant increases expected in beef
production.
Figure 16 Sheep production and exports
Note: Exports include carcass weight equivalent of live sheep exports. ABARES preliminary projection
Source: ABARES, ABS
Some increase in road freight will be needed, but it is not clear the extent to which this will place
strain on existing road infrastructure. Similar to the beef industry, the transportation of sheep
meat will face road network connectivity issues in which high productivity vehicles cannot
access some points and will need to either take a detour route or divide the freight into smaller
units (NTC 2009b).
Most of the projected increase in production is likely to be exported, and relies on export
facilities for the cold transport of processed cuts and live exports. These will likely be shared
with beef production. In addition, similar to the beef industry, live sheep exports may also face
increasing competition for access to some ports from the minerals and energy sector.
Dairy
The Australian dairy industry, its supply chain and the transport infrastructure used to link each
stage are outlined below. The simple regional disaggregation of the preliminary projections of
national dairy production and exports to 2050 is then presented, followed by a brief discussion
of potential infrastructure issues associated with an expansion in production.
Dairy production and exports
Dairy is one of Australia’s major rural industries with a $4 billion farm-gate value of production
in 2011–12, which puts it third behind the grains and beef industries and accounts for around
8 per cent of the gross value of total farm production. Most milk produced in Australia is used for
‘manufacturing’ dairy products (such as cheese, butter, milk powder) and the remainder is sold
as liquid milk on the domestic market. In 2011–12 total Australian milk production was
9480 ML, of which about 75 per cent was used to manufacture dairy products (ABARES 2013).
0
200
400
600
800
1 000
1994 1998 2002 2006 2010
kt
Exports
Production
2050

Infrastructure and Australia’s food industry: Preliminary economic assessment
29
Although Australia is a relatively small producer by international standards, it is the world’s
third largest milk exporter (PWC 2011). The value of dairy exports in 2011–12 was $2.3 billion,
consisting primarily of cheese (32 per cent), skim milk powder (21 per cent), whole milk
powder (17 per cent) and butter (9 per cent).
In recent decades dairy farming has undergone significant changes in structure and on-farm
technology, spurred by deregulation of the milk market in July 2000 and by ongoing market and
climate pressures (much of which pre-dated deregulation). Average farm size (in hectares)
increased by 45 per cent between 1988–89 and 2010–11, although growth has slowed in the
past decade. At the same time, many smaller producers have exited the industry and the
production share of small operations remaining in the industry has gradually declined (Dahl et
al. 2013).
Since deregulation, dairy production has become more concentrated in the south-eastern states.
Victoria’s share of Australia’s milk production has increased from 57 per cent in the 1980s to
around 65 per cent in recent years. Tasmania has also increased its share of milk production,
while the production shares of Queensland and New South Wales have both fallen (ABARES
2012). Overall, there has been a small decline in milk production in Australia over the past
decade.
All milk producing states have experienced positive average productivity growth over the past
three decades, ranging from 1.2 per cent a year in Victoria to 1.9 per cent a year in Tasmania
(Table 5).
Table 5 Average annual productivity growth in Australia’s dairy industry, by jurisdiction, 1978-79 to 2010-11
Jurisdiction Productivity growth Output growth Input growth
% % %
New South Wales 1.6 0.2 -1.4
Victoria 1.2 1.8 0.6
Queensland 1.8 -0.6 -2.4
South Australia 1.6 1.3 -0.3
Western Australia 1.9 1.1 -0.8
Tasmania 1.9 2.1 0.1
Australia 1.6 1.4 -0.2
Source: Dahl et al. 2013
Improvements in production practices, new technologies and greater automation of milk
production, in particular on larger farms, have facilitated productivity growth in the dairy
industry (Dharma et al. 2012). Advances in herd genetics, soil testing and pasture management
have also contributed to productivity growth (Ashton & Mackinnon 2008).
Pasture improvement and more intensive feeding practices, along with adoption of dairy shed
technologies that increase milking capacity, have allowed producers to increase stocking rates
and helped boost average milk yields per cow, from 3811 litres per cow in the early 1990s to
about 5630 litres per cow in 2010–11 (Dharma at al. 2012).

Infrastructure and Australia’s food industry: Preliminary economic assessment
30
Dairy supply chain and infrastructure
Figure 17 provides a simple representation of Australia’s dairy supply chain, from farm gate to
processing and end use markets.
Milk produced on farm is stored in refrigerated silos before being transported in refrigerated tankers by road to processing facilities.
At processing facilities, milk is pasteurised and homogenised and stored in refrigerated silos before and after processing. Milk at this stage of the supply chain can either be transported directly to the domestic markets in packaged form or be shipped or air freighted to overseas markets (the amount of milk exported in this form is relatively limited).
A portion of processed milk is transported to manufacturing facilities by road. For vertically integrated operations, processing and manufacturing facilities are combined. Manufacturers produce dairy and other products from milk such as cheese, skim milk powder, whole milk powder and butter. These products reach domestic markets by road and export markets by sea or airfreight.
Figure 17 Dairy supply chain
Source: Adapted from Dairy Australia 2010
Regional distribution of production and exports
Using the approach described earlier, simple regional disaggregation of dairy production and
exports to 2050 were obtained. These are shown in Map D5 with SD level historical dairy
production and state-level exports from 1993–94 to 2010–11. In Map D5, the shading of the SDs
indicates the number of people employed in dairy processing in 2010–11. Figure 18 presents
Australia’s dairy production and exports by volume.
Preliminary projections indicate that Australia’s dairy production has the potential to almost
double by 2050 with the simple regional disaggregation methodology indicating that most of the
Production Processing, transport & storage End use market
Road
Ship/Air
Ship/Air
Road
RoadDairy
farms
Export markets
Domestic markets
Processing Manufacturing
Road
Dairy farms
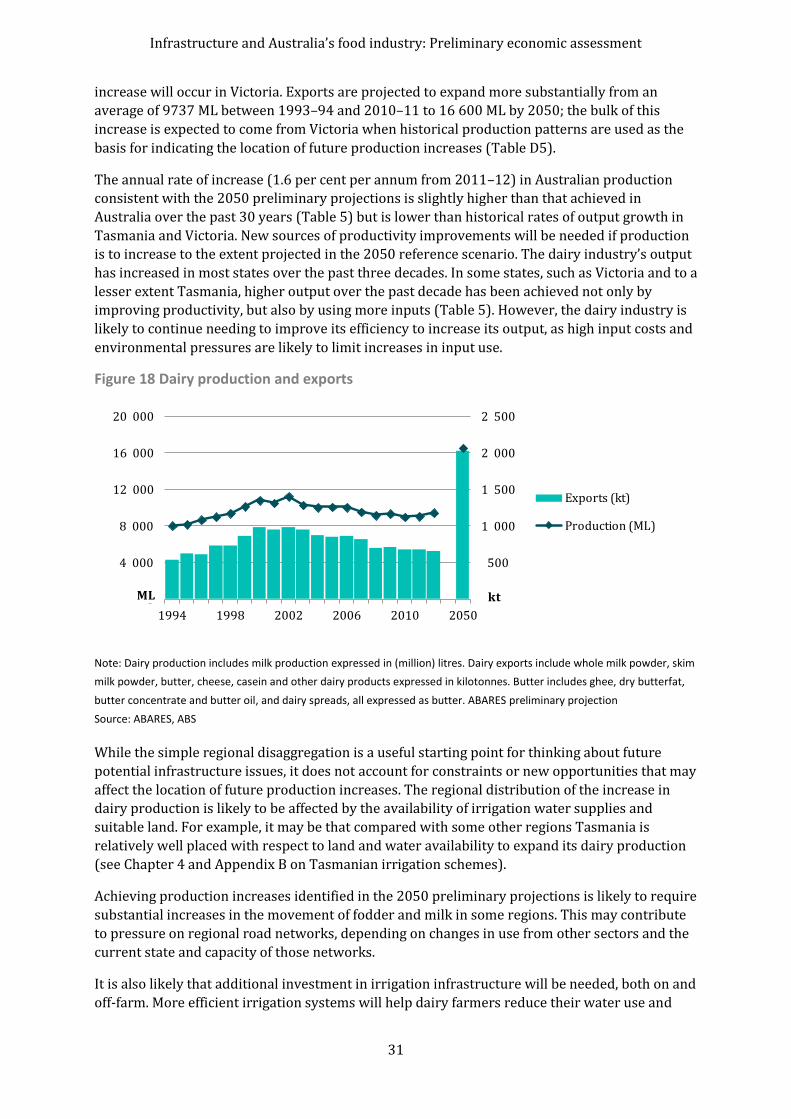
Infrastructure and Australia’s food industry: Preliminary economic assessment
31
increase will occur in Victoria. Exports are projected to expand more substantially from an
average of 9737 ML between 1993–94 and 2010–11 to 16 600 ML by 2050; the bulk of this
increase is expected to come from Victoria when historical production patterns are used as the
basis for indicating the location of future production increases (Table D5).
The annual rate of increase (1.6 per cent per annum from 2011–12) in Australian production
consistent with the 2050 preliminary projections is slightly higher than that achieved in
Australia over the past 30 years (Table 5) but is lower than historical rates of output growth in
Tasmania and Victoria. New sources of productivity improvements will be needed if production
is to increase to the extent projected in the 2050 reference scenario. The dairy industry’s output
has increased in most states over the past three decades. In some states, such as Victoria and to a
lesser extent Tasmania, higher output over the past decade has been achieved not only by
improving productivity, but also by using more inputs (Table 5). However, the dairy industry is
likely to continue needing to improve its efficiency to increase its output, as high input costs and
environmental pressures are likely to limit increases in input use.
Figure 18 Dairy production and exports
Note: Dairy production includes milk production expressed in (million) litres. Dairy exports include whole milk powder, skim
milk powder, butter, cheese, casein and other dairy products expressed in kilotonnes. Butter includes ghee, dry butterfat,
butter concentrate and butter oil, and dairy spreads, all expressed as butter. ABARES preliminary projection
Source: ABARES, ABS
While the simple regional disaggregation is a useful starting point for thinking about future
potential infrastructure issues, it does not account for constraints or new opportunities that may
affect the location of future production increases. The regional distribution of the increase in
dairy production is likely to be affected by the availability of irrigation water supplies and
suitable land. For example, it may be that compared with some other regions Tasmania is
relatively well placed with respect to land and water availability to expand its dairy production
(see Chapter 4 and Appendix B on Tasmanian irrigation schemes).
Achieving production increases identified in the 2050 preliminary projections is likely to require
substantial increases in the movement of fodder and milk in some regions. This may contribute
to pressure on regional road networks, depending on changes in use from other sectors and the
current state and capacity of those networks.
It is also likely that additional investment in irrigation infrastructure will be needed, both on and
off-farm. More efficient irrigation systems will help dairy farmers reduce their water use and
0
500
1 000
1 500
2 000
2 500
0
4 000
8 000
12 000
16 000
20 000
1994 1998 2002 2006 2010 2050
ktML
Exports (kt)
Production (ML)

Infrastructure and Australia’s food industry: Preliminary economic assessment
32
contribute to lowering production costs. Access and pricing regimes will need to be designed to
encourage the efficient long-term use of land, water and other inputs.
Most dairy exports take the form of powder or cheese with smaller volumes of butter and other
products. Thus, exports do not generally require specialised facilities and can use refrigerated
and non-refrigerated containers. However, lack of an export port in Tasmania may constrain the
potential for expansion in that state (see Chapter 4).
Crosscutting issues
Much of the infrastructure that is important for agricultural production is not specific to a
particular agricultural industry or to agriculture. In addition, future infrastructure requirements
will be influenced by any long-term changes in governance arrangements related to
infrastructure asset management and climate conditions.
Demand for multi-use infrastructure
As noted above much of the infrastructure agriculture uses is also used by many others. The
road and rail networks, ports, energy, water and telecommunications infrastructure are used
extensively by all sectors of the economy and the community. Increases in use by one sector
have the potential to affect the access of others through increased congestion and its impacts on
system performance and/or the cost of access.
The road network is the major supporting link in most agricultural supply chains. While it is
likely that much of the rural road network has excess capacity and that in many areas an
increase in traffic associated with increased production may be accommodated without
significant detrimental impact to other users, there is potential for congestion at peak periods in
specific locations and for maintenance costs to increase. Many regions support a number of
agricultural industries with potential for expansion and it would be useful to gain a deeper
understanding of the potential implications for the cost of maintaining existing infrastructure
and the need for increased capacity.
Adequately understanding future infrastructure needs requires an understanding of potential
changes in activity across sectors vying for access to multi-use infrastructure. For example,
changes in energy and minerals production would be a major driver of demand for road, rail and
port services in some regions. Activity in the manufacturing sector would be important in others.
An assessment of the current capacity of road, rail and port infrastructure and potential changes
in demand across major users would highlight regions where additional investment may be
needed. As there are inherent interdependencies between road and rail investments, and
between land transport and port investments, an examination of the cost savings of integrating
planning and investment decisions across these modes would guide the process of prioritising
capital investment and maintenance. While not possible as part of this project, this type of
consolidated assessment is likely to offer valuable insights into where the capacity of existing
infrastructure may need to be expanded and where new infrastructure may be needed.
Similarly, an expansion of the agriculture sector may involve the establishment of processing
facilities in new regions (such as abattoirs in northern Australia) and would require access to
transport, energy, water and telecommunications infrastructure. Maximising the potential
benefits of providing this type of infrastructure would involve consideration of other potential
uses.

Infrastructure and Australia’s food industry: Preliminary economic assessment
33
Road network issues
The road network is a key link in agricultural supply chains and must function effectively if
Australia is to make the most of opportunities presented by increased global demand for food. A
number of issues that affect the performance of the road network have been identified. Of
particular relevance to agriculture are some issues identified for local roads. The Allen
Consulting Group (2009) identified:
difficulty for some heavy vehicle operators negotiating a desired level of access to the local network (the ‘last mile’ problem)
in some cases the standard of the local road network is suboptimal relative to industry demands
the local road network is not always well-integrated with other modes of transport (rail, ports and airports) and land uses
some parts of the local road network have not been adequately maintained. Engineers Australia (2010) rated the overall quality of Australia’s local roads as ‘poor’.
As food production expands, pressure on the road network will increase and it is likely these
issues will be exacerbated if not adequately addressed.
As much road maintenance is carried out at the local government area (LGA) level there is a
concern that the resources available for maintenance may fall in regions with a less diverse
industrial base and a declining population. The capacity of these LGA councils to invest in road
infrastructure is constrained by the council’s resources which, in part, rely on its population
base.
Map 1 shows the trend in population since 2001 at the Statistical Local Area (SLA) level. These
regions correspond to most LGAs. The map shows that concerns of a declining population are
valid in some regions, particularly those located away from major urban centres and less remote
coastal areas and areas with major mineral resource developments. In all states and territories
non-urban populations are increasing, but at a lower rate than urban area populations. This is
consistent with declines in many rural areas as most non-urban increases occur in peri-urban,
coastal and mining areas (ABS 2013a).
The funding base for road network maintenance in some rural areas could be falling as use of the
network increases. The extent to which this is happening and possible solutions needs further
exploration.
Climate change
To the extent that climate change will alter the spatial and seasonal patterns of agricultural
production through changes in rainfall and temperature, more frequent extreme events and
higher variability in temperature and rainfall, infrastructure to support agriculture will be
indirectly and directly affected. First, additional infrastructure might be needed if production
shifts to new areas. Second, extreme events, such as droughts and floods, may affect construction
specifications and costs of new projects and of maintaining existing infrastructure.
Best estimates (50th percentile) of the global climate model projections for the medium
emissions scenario are that by 2050 the average annual temperature in Australia will increase
by up to 2.2 °C (Map 2). Temperature increases in this scenario are likely to be greatest in
Australian inland areas and least in coastal areas, with north-western Australia predicted to

Infrastructure and Australia’s food industry: Preliminary economic assessment
34
experience the most significant warming. In terms of rainfall, Map 3 shows that for the medium
emissions scenario, annual average rainfall is predicted to decline in most of Australia by about
10 per cent by 2050. Rainfall declines are likely to be the greatest in south-eastern and south-
western Australia in all the emissions scenarios (CSIRO & BoM 2007).
Map 1 Population trend, 2001 to 2011
Note: Linear trend in population over 2001, 2006 and 2011.
Source: ABS Census of Population and Housing, Time series profile data pack, 2012.
Long-term changes in temperature and rainfall will affect the profitability of alternative
agricultural activities differently. The analysis undertaken in this project has not considered the
potential effects of climate change on future production patterns or infrastructure requirements.
Scenario analysis may be useful in exploring the potential implications in future work. In
particular, it may be useful to examine the extent to which climate change scenarios, including
extreme events, rainfall and temperature variability, affect expectations of future infrastructure
requirements and what this implies for investment decisions. Similarly, the extent to which
production increases due to agricultural productivity could compensate for losses associated
with climate change is unknown and needs further investigation.

Infrastructure and Australia’s food industry: Preliminary economic assessment
35
Map 2 National temperature change 2050
Map 3 National rainfall change 2050
Note: Projections are given relative to the period 1980 to 1999 (referred to as the 1990 baseline for convenience). The
projections give an estimate of the average climate around 2030, 2050 and 2070, taking into account consistency among
climate models. Individual years will show variation from this average. The 50th percentile (the mid-point of the spread of
model results) provides a best estimate result. Emissions scenarios are from the IPCC Special Report on Emission Scenarios.
Source: CSIRO, BoM & DCCEE 2013

Infrastructure and Australia’s food industry: Preliminary economic assessment
36
4 Case studies—infrastructure’s role in expanding production
Three case studies are undertaken to highlight the role infrastructure can play in allowing the
Australian food industry to adapt to changes in the coming decades, notably the potential for a
large increase in expected Asian food demand. These case studies are complementary to the
preliminary assessment, in Chapter 3, of infrastructure issues and the regional distribution of
production, processing and exports for five major export commodities.
Two case studies are based on interviews with stakeholders; in each case study infrastructure
has played a significant role in farm business decisions. The first examines how various
interrelated industries in Tasmania are adapting to changing international demand. The second
examines the development of a single infrastructure-intensive industry—greenhouse protected
cropping in Victoria—in response to increased domestic demand and technological
development. The third case study examines the importance of air transport for Australia’s food
exports.
Tasmania
Open format interviews were conducted in 2013 with several stakeholders in Tasmania,
including farmers/producers, processors, industry leaders and infrastructure providers.
Exploring how Australian businesses can sustainably increase or maintain production and
exports of food to meet changing demand provides information on likely infrastructure needs
and related issues. The experiences of the four businesses interviewed and Tasmanian Irrigation
are described in Appendix B. Common themes emerging from the interviews with stakeholders
(producers, processors, Tasmanian Irrigation and the Tasmanian Farmers and Graziers
Association (TFGA)) are discussed here. The themes are grouped under the headings of
‘perceived opportunities’, ‘funding viable infrastructure investments’ and ‘making investment
happen’.
Perceived opportunities
Australian producers can compete on quality by providing a better or more reliable product
than their competitors, or they can capture greater market share by outcompeting rivals through
lower priced commodities. As markets become more sophisticated both options could become
feasible. Stakeholders interviewed were mostly sceptical about their capacity to profitably
compete on quality alone. They thought consumers would generally choose a product largely on
price, and that only limited niche markets for higher-quality higher-price goods are available.
The fruit grower and representatives of the TFGA voiced this opinion, and the dairy farmer had
considered options to produce high-value products when reconfiguring his business, but
rejected them in favour of a bulk commodity. Price competition was paramount even where
opportunities for quality exports had been identified and taken, an example of which is the beef
feedlot’s ‘premium economy’ product.
One possible conclusion from the information obtained from the stakeholder interviews would
be that future infrastructure needs will derive primarily from providing competitively priced
food products, while providing assurance of a safe product meeting specific quality standards.
Stakeholders interviewed indicated two broad strategies for competing on price. The first was to
lower the costs of production from existing systems. Using this strategy, farmers would try to
produce profitably, but at lower prices by lowering costs without fundamental change. This
Infrastructure and Australia’s food industry: Preliminary economic assessment
37
strategy was pursued by the fruit grower. Constraints stakeholders raised to this strategy
included the high value of the Australian dollar, compliance costs with the regulatory
environment, the high cost of freight to Melbourne, high input costs including labour, and an
inability to maintain a level of production that provided sufficient economies of scale. The
second strategy involved transforming production systems and more fundamental change to
production systems and industries. The dairy farmer is an example of such a transformed
business.
Funding viable infrastructure investments
As with any investment, attracting private or public funding requires an expectation of adequate
returns. Interviewees raised a number of issues relevant to the viability of Tasmania’s food
infrastructure.
Economies of scale
Scale is critical for the viability of many investments, with some investments only viable if
certain volume thresholds can be met. This is true in terms of total production or volume of
trade, but also for how that production is spread over time. Threshold issues apply to private
and single use infrastructure, such as a dairy shed, but also to multi-user investments, such as
roads or utilities. The fruit grower interviewed said the significant decline in the number of fruit
farms in the region meant that dedicated fruit boats no longer serve Tasmania; hence growers
had to rely on other more expensive freight options. This rendered fruit growing unprofitable
for some, further reducing the number of growers and the prospects for regaining the numbers
needed to support a dedicated freight service.
The necessary production threshold issue was also noted when discussing the most commonly
cited impediment to low cost production in Tasmania—a freight leg to Melbourne necessary for
export—that all interviewees claimed was more expensive than subsequent freight legs to Asian
destinations. However, most also noted that to support a direct export facility, export volumes
would need to be much greater than Tasmanian food producers currently supply.
The expansion of Tasmania’s irrigation schemes needs recruitment of sufficient users. Although
state government managed, these irrigation schemes rely on private and public finance. Private
capital has overwhelmingly been sourced from landholders who intend to use the scheme, as
sufficient buyers must sign binding contracts for the use of irrigation water before construction
of each project can begin. These infrastructure investments share a problem of coordination.
Producers must increase production in order to make an infrastructure investment viable, but
this greater production is only viable if the infrastructure investment is undertaken.
Stabilising use
Agricultural produce is often characterised by seasonality, and prospective users may only be
willing to use or invest in infrastructure if it has the capacity to meet periods of peak demand.
However, significant downtime at off-peak periods may make the venture uneconomical. Being
able to spread production more evenly throughout the year can reduce the costs of
infrastructure investment if it means a lower throughput capacity is required. In some cases
marketing advantages can be realised from being able to reduce the variability of supply.
The dairy processor noted the problem with supply variability and that the industry had taken
steps to minimise variation in the milk supply over the year. The solutions they and their
suppliers had adopted involved locating pastures on sandy soils that could be grazed without
damage even during the wet winter, and the use of irrigation to stabilise pasture supply. The
dairy farmer noted that irrigation allowed ‘spring pastures year round’ and thus a steady milk

Infrastructure and Australia’s food industry: Preliminary economic assessment
38
supply. A TFGA representative noted that irrigation schemes could provide water year round,
but demand peaked in summer. They therefore encouraged irrigators buy cheaper winter water
to store in newly built farm storages for use in summer, allowing more even use over the year.
Making investment happen
For the adoption of a viable opportunity, it must be recognised and supported with sufficient
capital. This requires knowledge of production and consumption, and mechanisms to match this
knowledge to funds. The businesses consulted said recognition of an investment opportunity
often required particular knowledge of production possibilities in Tasmania and of consumer
demand in Asia that was not readily available. They feared that in the absence of this knowledge
there was potential for investment in unsuitable infrastructure.
Local producers have good knowledge of what their land is suitable for and what prices make
viable business propositions. This is evident in the case studies. For example, the dairy farming
business was able to benchmark its production system against New Zealand dairy and its
operators made a decision based on relative input and milk prices. The development of
expanded irrigation schemes was contingent on enough prospective irrigators signing contracts.
Knowledge of consumers in foreign markets can come from foreign investors. For example, the
Tasmanian Feedlot was initiated 40 years ago by a Japanese firm that saw an opportunity to
meet increasing demand for beef in Japan. They encouraged Tasmanian farmers to raise
appropriate breeds to meet an opportunity they would not otherwise have been aware of.
Foreign knowledge can be combined with local knowledge to engender confidence in the
endeavour; the initial investor in the dairy processor knew it could divest part of its investment
to Asian firms wishing to secure supply lines to serve expanding markets. In these instances,
foreign investment was a way of obtaining information as well as capital.
Investment opportunities may be supported by debt finance if investors are able to convince
others of the opportunity. The dairy farming business operator said they could only access
finance to exploit their irrigation opportunity because they were able to translate their
knowledge into a business plan and financial projections.
An apparent collective action problem can sometimes be overcome by a single investor, as in the
case of the dairy processor. Initially the founding investor hoped to form a cooperative to bring
together dairy farmers who would make use of the facility. Such cooperatives had been formed
on the mainland and elsewhere, but this proved difficult in Tasmania. However, the founding
investor was able to use private capital and their own reputation to support the venture until
the viability of the project was apparent to external investors who could support it with equity
finance.
The Tasmanian Irrigation schemes demonstrate a role for government as a broker for private
capital. Although these schemes are funded by both public and private capital, including grants
from the Australian and state governments, Tasmanian Irrigation was essential in coordinating
individuals who could not have funded the scheme in isolation. Government involvement was
both as an investor and a broker to bring together private investors.
Victorian greenhouse protected cropping
The businesses interviewed include one leafy green and three tomato hydroponic farms. The
tomato farms ranged from a small-scale business to an industry leader currently undergoing
business expansion. One of the tomato hydroponic farms is part of a vertically integrated fruit
and vegetable business.

Infrastructure and Australia’s food industry: Preliminary economic assessment
39
Protected cropping is an industry adapting new technology to take advantage of growing
demand for fresh vegetables and to manage climate variability. The industry is capital intensive
and often located in peri-urban areas, and these features contribute to distinct challenges and
opportunities. This case study focuses on protected cropping in Victoria using hydroponics,
especially tomato production. Victoria is notable for its high tomato yields. It produces 23 per
cent of Australia’s undercover tomatoes; although the land used is only 11 per cent of that
devoted to undercover tomatoes nationwide, it yields double the national average (ABS 2010).
While protected cropping has long been present in the Australian food industry, strong demand
for vegetables from the domestic market has led many in the sector to increase investments in
their growing infrastructure, both by expanding operations and by adopting new technology.
Much of this technology is adopted from world leading industries in New Zealand and the
Netherlands. Stakeholders reported no difficulty gaining access to this foreign technology.
Notable among these technologies is the use of hydroponics and the adoption of large rigid
glasshouses in place of older polyethylene structures. These technologies allow farmers to
reduce the use of water and fertiliser and pesticides compared with field cropping and older
styles of undercover cropping, and allow greater control of production. The technology is
expected to become more energy efficient and may in the future incorporate renewable power
sources, such as solar photovoltaic.
The intention of protected cropping has always been to produce throughout the year. Improved
climate control technology has improved this ability to manage climate, but Victoria still
maintains some comparative advantages over other locations (such as Queensland) where
climate control is either more expensive or not technically feasible. The interviews with
protected cropping businesses in Victoria highlighted some issues specific to the industry.
Although not as prominent as concerns about the availability and cost of suitable labour,
infrastructure issues were viewed as important to the industry’s capacity to expand.
Domestic focus
The protected cropping sector’s investment in new infrastructure is only intended to meet
Australian domestic needs where increased production has been met, and sometimes exceeded,
by increased domestic consumption of vegetables. In particular, several interviewed businesses
had expanded into hydroponic tomatoes to supply metropolitan markets in Victoria which were
increasingly seeking high quality produce outside the traditional growing season.
The producers did not describe the vegetable trade between Australia and other countries
(whether from protected or field cropping) as having established trading relationships such as
those found in other commodities. Instead they thought trade only occurred to meet temporary
shortfalls or dispose of surplus domestic production. The importance of domestic demand
relative to export opportunities for the tomato industry in particular is illustrated by the later
part of the past decade. Although the value of Australian domestic production from 2008 to
2011 increased from $405 million to $418 million (following much greater gains in previous
years), the value of exports fell from $12 million to $6 million, and that of imports increased
from $2 million to $8 million over the same period (AusVeg 2013).
The businesses interviewed saw potential for increased Australian food exports, but they
thought any opportunities compared unfavourably with domestic markets. Domestic demand
was strong enough that the businesses had no difficulty selling their product profitably in
Australia and did not consider this likely to change in the near future. Domestic demand also
offered long-term contracts with customers such as supermarkets which allowed long-term
planning. Such contracts were not available in the export market. Before exploring export

Infrastructure and Australia’s food industry: Preliminary economic assessment
40
relations and associated infrastructure (such as airfreight) they would need to have strong
expectations of considerable increases in Australian production and that this production could
be sold consistently in export markets. They also felt their product would need a higher value-
to-weight ratio to meet the costs of airfreight. One business operator said the current ratio was
no longer high enough to support interstate road freight, an option they had used in the past.
Multi-use infrastructure
Protected cropping relies heavily on infrastructure shared with other industries and land uses.
This infrastructure includes urban utilities such as high-quality water, electricity and natural gas
and road infrastructure. It also shares regulatory environments designed for urban and peri-
urban land uses. Greenhouse horticulture has adapted to infrastructure initially developed for
urban uses. As hydroponics requires access to a reliable and high-quality water supply, several
businesses had at times taken advantage of town water as it was easily available to complement
the relatively costly option of bore or irrigation water with reverse osmosis. Likewise, the
heating requirements of greenhouses were met by natural gas from existing distribution
networks, and power supplies were linked to urban grids.
Despite the adaptability of existing utility infrastructure, it was sometimes difficult to access it.
Two operations bore the entire costs of extensions to gas pipelines to their properties. However,
in each case the extended pipeline would remain the property of the utility, and interviewees
said any subsequent farms accessing the pipeline would do so at a far lower marginal cost.
Another business was considering whether it could bear the cost of an extension of electricity
lines to the property and faced a similar dilemma. The businesses were concerned that beneficial
utility infrastructure may not be provided when those who bear the cost cannot recoup the
benefits that accrue to other users.
While the businesses still evidently felt returns from investing in the gas pipelines were
worthwhile, it is plausible that potentially beneficial expansion may not occur in some areas—
perhaps the electricity example. This scenario could occur if the benefit an individual business
receives from an extension of utilities does not exceed the cost, although the aggregate benefit to
all prospective users of the extension does. In this instance the actions of prospective
beneficiaries would need to be coordinated, as in irrigation expansion in Tasmania. As with the
Tasmanian case study, local roads have to date been flexible enough to accommodate expansion.
Local regulatory environment
As well as sharing utilities, the industry shares a regulatory environment with urban uses such
as manufacturing and residences, which can complicate the development of protected cropping
infrastructure. The newly adopted greenhouse infrastructure that differs from older
polyethylene structures can present difficulties for existing planning regulations. Businesses
interviewed noted that local governments sometimes classify greenhouses as factories because
existing regulation only accounts for polyethylene structures. This classification in turn imposed
requirements for accessibility and fire safety that interviewees felt were not intended for
agricultural business. In one instance, a business also had difficulty complying with council
codes for visual amenity in a region with a strong tourism industry.
Local regulators may not have the resources to effectively adapt regulation to rapidly changing
industries, particularly when the primary sources of information are interested parties. This
suggests a possible role for state governments or the Australian Government to develop
information resources for local regulators.
Infrastructure and Australia’s food industry: Preliminary economic assessment
41
Financing investment in protected cropping infrastructure
The recent rapid adoption of imported technology also presented difficulties when accessing
finance for investment. Lenders were not very familiar with protected cropping and hence were
hesitant to fund projects. This lack of knowledge also made it difficult to value the assets of a
protected cropping business as easily as they did the land of a field cropping business. The
businesses interviewed believed they secured loans only because they had been established in
protected cropping for some time and because they had established contracts with
supermarkets. This unfamiliarity could inhibit new entrants and slow expansion of the sector.
However, interviewees thought lenders would soon gain more knowledge of the industry.
In contrast to the meat and dairy sectors in Tasmania interviewees showed little interest in
foreign investors seeking to secure supply lines to their domestic market. One business had
divested a large part of its equity to foreign investors, but did not feel the investors wanted to
use the business to export to their home market. The interviewed manager felt that, apart from
direct financial returns, the investors intended to use their investment to gain knowledge that
could be applied to domestic cropping in their own country—particularly knowledge of supply
chain management between growers and supermarkets.
Biosecurity
Australia’s biosecurity regime is part of the soft infrastructure environment within which the
Australian food industry operates. The businesses interviewed recognised that a biosecurity
system covering the entire industry (and indeed country) was necessary to reduce negative
effects on yields from biological pests and diseases, and to maintain or regain access to foreign
markets by Australian producers. They also recognised the benefits of an adaptive system; for
instance, they were permitted to use parasitic wasps to combat white fly as part of integrated
pest management, allowing them to meet their customers’ wishes for less insecticide.
Biosecurity regulations can also impose costs. Australian producers are not allowed to use
bumblebees to pollinate tomatoes and other crops. This means businesses must use manual
pollination with an ‘electric bee’—a labour intensive and expensive process—to achieve
comparable results. The Australian Government (2008) has determined that the risks to the
environment are too great to permit bumblebees on the Australian mainland. This is an example
of the kind of difficult tradeoffs involved in managing biosecurity risks.
Product differentiation
Some businesses had invested in, or had considered developing, on-site packaging
infrastructure. One business had done this in order to distinguish its product and exploit
growing preferences from consumers for greater tomato variety and quality. The business
manager felt their own packaging would allow them to build a brand that would support a price
premium. It also allowed the development of specialty products (such as collections of various
tomato varieties) that appealed to emerging niches of supermarket customers. The ability to
develop this infrastructure was limited by their customers’ willingness to accept. One farmer
was bound by the terms of their contract to lease supermarket crates, which did not allow them
to either control their own costs of packaging or differentiate their product. In this case, the
development was hampered by existing logistics systems.

Infrastructure and Australia’s food industry: Preliminary economic assessment
42
Australia’s airfreight exports of food
This case study briefly examines the role of airfreight in Australia’s food exports. Air transport is
typically used to export relatively high value food products to Asia and other markets. Airfreight
is a cost effective transport option where food quality depends on timely delivery to the end-use
market, and where the price premium received for the quality attributes of the food product is
sufficient to justify higher transport costs.
Recent developments
In 2011–12, the value of Australia’s airfreight food exports was $1.6 billion, accounting for 5.3
per cent of the value of total food exports (Table 6). The real value of Australia’s airfreight food
exports has been relatively steady over the past decade, but below the peak of $2.2 billion in
2001–02 (2011–12 prices; Figure 19). The four main airfreight food exports in 2011–12 were
unprocessed fish and shellfish ($644 million or 40 per cent of total airfreight food exports), meat
and meat products ($559 million or 35 per cent), unprocessed fruit and vegetables ($144 million
or 9 per cent), and live animals excluding fish (includes goats, day-old chicks and dairy breeding
cows; $135 million or 8 per cent).
In 2011–12, the food commodities most reliant on air transport were unprocessed fish and
shellfish (89 per cent of total unprocessed fish and shellfish exports were by airfreight),
unprocessed fruit and vegetables (24 per cent), live animals excluding fish (17 per cent), and
meat and meat products (8 per cent) (Table 6). Airfreight accounts for a relatively low share of
total exports for other food commodities, including dairy (1.5 per cent in 2011–12), fruit and
vegetable products (0.8 per cent) and other crop-based food (0.5 per cent).
Over the past several years, airfreight has become a more important international transport
option for several food commodities with the major exception of other crop-based food (Figure
20). Excluding other crops-based food, the share of Australia’s food exports transported by
airfreight has increased from 9.4 per cent in 2004–05 to 12.2 per cent in 2011–12 (Figure 19).
Future research may examine key economic and policy factors underpinning market
developments in these commodities and, in particular, the demand for airfreight transport.
Figure 19 Value of Australia's airfreight food exports, by commodity, 1996–97 to 2011–12
Note: Values are in 2011–12 prices. The dashed line is airfreight exports (excluding other crops-based food) as a percentage
of total food exports (also excluding other crops-based food).
Data source: DAFF 2013
0
5
10
15
0.0
1.0
2.0
3.0
19
96
–97
19
99
–00
20
02
–03
20
05
-06
20
08
–09
20
11
–12
%
20
11
-12
$b
Fruit and vegetables
Other crops-based food
Live animals excluding fish
Meat and meat products
Dairy products
Fisheries-based food
% of total food exports (excludes other crops-based food; right axis)

Infrastructure and Australia’s food industry: Preliminary economic assessment
43
Table 6 Key indicators for Australia's airfreight food exports, 1996–97 and 2011–12
Airfreight Share of total airfreight Share of
Commodity food exports
food exports
total exports a
1996-97 2011-12 1996-97 2011-12 1996-97 2011-12
$m $m % % % %
Crops-based food
Fruit and vegetables b
Unprocessed fruit & vegetables 275 144 16.7 8.9 34.7 24.0
Fruit and vegetable products 11 5 0.7 0.3 1.4 0.8
Total fruit and vegetables 286 149 17.3 9.2 18.5 12.1
Other crops-based food
Unprocessed
Grains and oilseeds 2 2 0.1 0.1 0.03 0.02
Other food c 0 0 0.0 0.0 0.0 0.0
Total unprocessed 2 2 0.1 0.1 0.03 0.02
Processed
Oil and fat c 1 7 0.0 0.5 0.5 2.4
Other food and beverages c 69 82 4.2 5.1 0.8 1.1
Total processed 69 90 4.2 5.6 0.8 1.2
Total other crops-based food d 72 92 4.3 5.7 0.4 0.5
Total crops-based food d
Unprocessed 277 146 16.8 9.0 3.1 1.3
Processed 80 95 4.9 5.9 0.9 1.2
Total crops-based food 357 241 21.7 14.9 1.9 1.3
Livestock-based food
Unprocessed
Live animals excluding fish 114 135 6.9 8.3 12.2 17.1
Processed
Meat and meat products
Beef 99 240 6.0 14.9 – –
Other meat and offal 190 318 11.5 19.7 – –
Total meat & meat products 290 559 17.6 34.6 6.4 7.8
Dairy products
Milk, cream & milk products e 18 19 1.1 1.2 – –
Butter and other milk fat 1 1 0.1 0.0 – –
Cheese and curd 7 14 0.4 0.9 – –
Total dairy products 26 34 1.6 2.1 1.0 1.5
Total processed 316 593 19.2 36.7 4.4 6.3
Total livestock-based food 430 727 26.1 45.0 5.2 7.1
Fisheries-based food
Unprocessed fish & shellfish 838 644 50.8 39.8 – 89.2
Processed seafood 24 5 1.4 0.3 – 1.8
Total fisheries-based food 862 649 52.3 40.1 52.9 64.7
Total food c
Total unprocessed 1229 924 74.5 57.2 11.6 7.4
Total processed 420 692 25.5 42.8 2.4 3.9
Total food 1649 1616 100.0 100.0 5.9 5.3
Note: Values are in 2011–12 prices. Unprocessed is minimally transformed food; processed is substantially and elaborately
transformed food. a Airfreight exports as a percentage of total exports of the same commodity. b Includes nuts. c Included
in crops, by assumption. d Includes beverages. e Excluding butter and cheese.
Source: Based on DAFF 2013
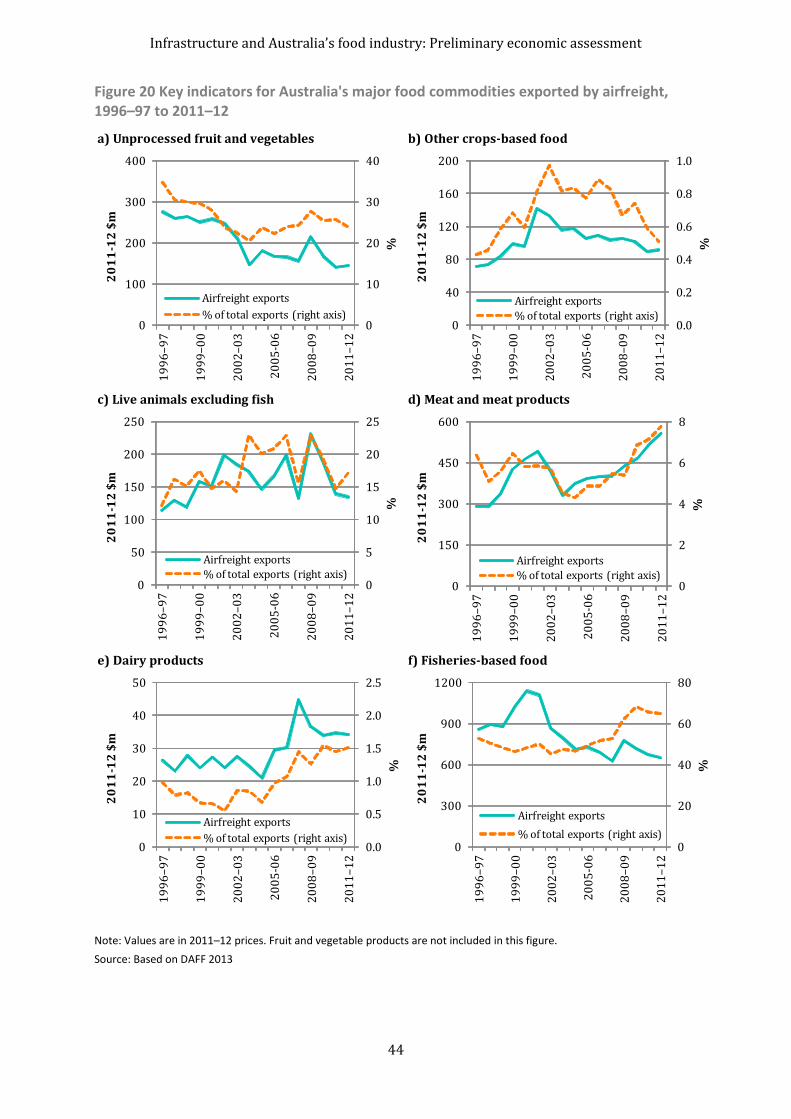
Infrastructure and Australia’s food industry: Preliminary economic assessment
44
Figure 20 Key indicators for Australia's major food commodities exported by airfreight, 1996–97 to 2011–12
Note: Values are in 2011–12 prices. Fruit and vegetable products are not included in this figure.
Source: Based on DAFF 2013
a) Unprocessed fruit and vegetables b) Other crops-based food
c) Live animals excluding fish d) Meat and meat products
e) Dairy products f) Fisheries-based food
0
10
20
30
40
0
100
200
300
4001
99
6–9
7
19
99
–00
20
02
–03
20
05
-06
20
08
–0
9
20
11
–1
2
%
20
11
-12
$m
Airfreight exports
% of total exports (right axis)
0
20
40
60
80
0
300
600
900
1200
19
96
–9
7
19
99
–00
20
02
–0
3
20
05
-06
20
08
–09
20
11
–1
2
%
20
11
-12
$m
Airfreight exports
% of total exports (right axis)
0
5
10
15
20
25
0
50
100
150
200
250
19
96
–9
7
19
99
–0
0
20
02
–0
3
20
05
-06
20
08
–0
9
20
11
–1
2
%
20
11
-12
$m
Airfreight exports
% of total exports (right axis)
0.0
0.5
1.0
1.5
2.0
2.5
0
10
20
30
40
50
19
96
–97
19
99
–00
20
02
–03
20
05
-06
20
08
–0
9
20
11
–1
2
%
20
11
-12
$m
Airfreight exports
% of total exports (right axis)
0
2
4
6
8
0
150
300
450
600
19
96
–9
7
19
99
–00
20
02
–03
20
05
-06
20
08
–0
9
20
11
–1
2
%
20
11
-12
$m
Airfreight exports
% of total exports (right axis)
0.0
0.2
0.4
0.6
0.8
1.0
0
40
80
120
160
200
19
96
–9
7
19
99
–0
0
20
02
–0
3
20
05
-06
20
08
–09
20
11
–12
%
20
11
-12
$m
Airfreight exports
% of total exports (right axis)

Infrastructure and Australia’s food industry: Preliminary economic assessment
45
Economic and policy issues
In 2011–12, airfreight food exports made a significant contribution to Australia’s net trade
position for unprocessed fish and shellfish, unprocessed fruit and vegetables, live animals
excluding fish, and meat and meat products (Table 7). A key issue in the outlook for the food
industry is the extent to which Australia can maintain or enhance its competitive advantage in
these airfreight food exports. Some key economic and policy issues relating to demand-side and
supply-side aspects of airfreight food exports are briefly discussed below. The role of
government in facilitating efficient supply chains, with a focus on infrastructure provision, is
examined further in Chapter 5.
Table 7 Airfreight and Australia's food trade, by commodity, 2011–12
Share of food
Value of food trade
exports by
Food exports Food Net food
Commodity airfreight Airfreight Other Total imports exports
% $m $m $m $m $m
Crops-based food
Fruit and vegetables
Unprocessed fruit & vegetables a 24.0 144 458 602 354 248
Fruit and vegetable products 0.8 5 620 625 1742 –1117
Total fruit and vegetables 12.1 149 1078 1227 2096 –869
Other crops-based food b 0.5 92 17885 17977 6415 11562
Total crops-based food b 1.3 241 18963 19204 8511 10693
Livestock-based food
Live animals excluding fish 17.1 135 652 787 1 785
Meat and meat products 7.8 559 6643 7201 606 6595
Dairy products 1.5 34 2230 2264 755 1509
Total livestock-based food 7.1 727 9525 10252 1363 8890
Fisheries-based food
Unprocessed fish & shellfish 89.2 644 78 721 67 654
Processed seafood 1.8 5 276 281 1348 –1066
Total fisheries 64.7 649 354 1002 1415 –412
Total food b 5.3 1616 28842 30458 11288 19170
Note: Values are in current prices. a Includes nuts. b Includes beverages.
Sources: ABARES 2013, DAFF 2013
Demand-side aspects of airfreight food exports
In 2011–12, five of the six leading countries for Australia’s airfreight food exports were located
in the Asian region (Figure 21). These five leading Asian countries accounted for $953 million or
59 per cent of Australia’s airfreight food exports in 2011–12. Hong Kong is the most important
destination for Australia’s airfreight food exports ($549 million, 34 per cent of the total). Export
market shares for other countries are below 10 per cent.
Income is a key determinant of demand for high value food products. People on relatively high
incomes tend to be willing to pay more for the quality attributes of food products compared with
other income groups (all else constant). An important aspect of this market is to provide
consumers with a relatively high degree of confidence in food quality. Any significant
uncertainty about the quality of a food product will result in a lower price premium (that is, a
risk-averse consumer will demand a risk premium in the purchase price to compensate for the
risks associated with food quality, all else constant). Product labelling is an option for food
producers and processors to provide consumers with information about the quality attributes of
a food product (see, for example, Hogan and Thorpe 2009).

Infrastructure and Australia’s food industry: Preliminary economic assessment
46
Figure 21 Distribution of Australia's airfreight food exports, by destination, 2011–12
Note: Based on value of exports.
Source: DAFF 2013
Demand for high value, low volume food products is likely to increase significantly over the
medium to longer term, particularly in the Asian region where economic growth is projected to
be relatively strong. ABARES preliminary projections for global food demand to 2050 are
outlined in Chapter 2 based on assessments in Linehan (2012a, b and 2013). ABARES is also
undertaking more detailed assessments on the outlook in the What Asia Wants project.
Supply-side aspects of airfreight food exports
In 2011–12, Victoria was the main state of departure for airfreight food exports, accounting for
$682 million or 42 per cent of the total (Figure 22). Other jurisdictions with international food
supply chains based on air transport included Queensland ($328 million, 20 per cent of the
total), Western Australia ($262 million, 16 per cent), New South Wales ($261 million, 16 per
cent) and South Australia ($83 million, 5 per cent).
Nearly all airfreight food exports of Tasmanian origin are recorded as exports from mainland
Australian airports. The economies of scale that would justify infrastructure investment to
support airfreight food exports directly from Tasmania is a potential issue for future research.
Figure 22 Distribution of Australia's airfreight food exports, by jurisdiction, 2011–12
Note: Based on state of departure. Virtually all airfreight exports of Tasmanian origin are recorded as exports from
mainland Australian airports.
Source: DAFF 2013
0 10 20 30 40 50
Other
Switzerland
Vietnam
China
United Arab Emirates
Japan
Singapore
Hong Kong
%
0 10 20 30 40 50
Northern Territory
Tasmania
South Australia
New South Wales
Western Australia
Queensland
Victoria
%

Infrastructure and Australia’s food industry: Preliminary economic assessment
47
In 2011–12, airfreight exports from the Northern Territory were very small (with a value of
around $78 000). ABARES, in collaboration with the CSIRO, is undertaking more detailed
assessments of supply chains in northern Australia in the Northern Australia Food and Fibre
Supply Chains study. During consultations undertaken for this study, one farmer indicated that
food produced in the Ord River Irrigation Area (ORIA) Stage 1 is trucked from Kununurra to
Perth for distribution to end-use markets, including some food exported by airfreight.
Future growth in Australia’s airfreight food exports will be influenced by market access and
biosecurity arrangements, investment in domestic high value food production and processing
activities, and complementary infrastructure investment to support the further development of
efficient international supply chains based on air transport.
An important potential advantage of airfreight is that food can be transported directly to inland
destinations in overseas markets. Sea freight, the alternative transport option in international
supply chains, requires food to be shipped to a seaport before distribution for use in the
domestic market. Similarly, airfreight is a relatively flexible transport option for moving food
within Australia.
A further potential advantage of airfreight is that it increases contestability in international
supply chains, at least for high value, low volume food products. Increased contestability raises
competitive pressures in the market and places downward pressure on transport costs
(contestability issues are discussed, for example, in Port Jackson Partners 2012).
Future research will examine infrastructure issues in Australia’s airfreight food exports in more
detail.

Infrastructure and Australia’s food industry: Preliminary economic assessment
48
5 Economic issues in infrastructure investment and Australia’s food industry
This chapter provides a brief overview of economic issues in infrastructure and Australia’s food
industry, including the economic rationale for government intervention, commercialisation
options, and private sector participation in Australia’s infrastructure industries.
Economic rationale for government intervention
Economic infrastructure services provided by the transport, water, energy and
telecommunications industries are essential inputs to a wide range of economic activities,
including Australia’s domestic and international food supply chains. From an economic
perspective, it is assumed that policymakers aim to ensure the adequate and reliable provision
of infrastructure services at least cost over time given budgetary and other constraints, and
taking into account economic and other risks in the outlook.
Sources of market failure
Government has an important role in addressing market failures and achieving distributional
goals. Market failures, which occur when private markets do not produce a socially optimal level
of goods and services, provide an economic rationale for considering government intervention.
Market failures may arise, for example, when:
markets are not highly competitive (imperfect competition)
markets do not provide certain goods or services (public goods)
by-products in production or consumption have a significant impact on third parties, resulting in suboptimal outcomes (including negative externalities or spillover effects such as environmental damage from farming activities)
producers or consumers have inadequate market information (imperfect information).
The main market failure in infrastructure supply and use is the natural monopoly characteristics
of infrastructure industries (at least within particular regions). In a natural monopoly, industry
costs tend to be lower if there is a single provider since this avoids costly duplication of
infrastructure facilities (such as water storage, treatment and delivery infrastructure).
A natural monopoly occurs when a single firm can produce a good at lower cost than any
alternative market structure. In a natural monopoly, the initial infrastructure investment costs
are large relative to the variable costs incurred in producing the good or service. As a
consequence, average costs decline as production increases. The main concern is that, without
policy intervention, a private producer in a natural monopoly would extract monopoly rent
resulting in a higher price and lower output than would be socially optimal.
Criteria to assess policy response options
The presence of market failure is not always a sufficient reason for governments to intervene in
the market. Governments should also ensure policy interventions are assessed to be cost
effective; for example, ideally, government policies should not have significant unintended
negative consequences or cause further distortions in the market. Given the importance of
infrastructure in food supply chains, the government may consider the food security
implications of the policy response.

Infrastructure and Australia’s food industry: Preliminary economic assessment
49
Criteria that may be used to assess policy options include:
efficiency—maximising long-term net social benefits, including by assessing infrastructure network requirements over time, and ensuring specific infrastructure projects are both consistent with broader network planning and delivered at least cost
equity—ensure low income people have adequate access to infrastructure services
resilience—reduce the probability of major supply disruptions occurring and reduce the cost of supply disruptions when they do occur
administrative simplicity—take into account administration and compliance costs to government, industry and others
Other criteria may include, for example, flexibility to adapt to changing economic and other
circumstances.
Ideally, to provide an economic assessment of the role of government, policy options that
address significant sources of market failure need to be identified and ranked, where feasible,
according to the assessed net economic benefits, including implementation costs. Only policy
options that are assessed to result in positive net economic benefits should be considered for
implementation. From an economic perspective, the policy option that is assessed to achieve the
highest net economic benefits is the preferred policy option, although some aspects of an
economic assessment, such as equity (distributional) and risk assessment issues, rely on the
subjective judgment of policy makers.
Broad policy reform processes in Australia
In recent decades, there has been a broad regulation reform process in Australia that
emphasises the important role of reducing the regulatory burden on business and the
community. An overview of broad regulation reform processes in Australia since the 1980s is
provided in Box 5.1.
For infrastructure industries, the main aim in policy reform in Australia has been to achieve
efficient and sustainable pricing and provision of infrastructure services. The traditional
approach has been the public provision of essential goods and services, such as water, at low
prices to support economic development and household use. Since at least the 1990s, there has
been increasing recognition of alternative policy options to address market failures such as
natural monopolies (commercialisation options are briefly discussed in the next section).
There has been an important process of competition regulation of Australia’s essential
infrastructure (Banks 2002). Competition in infrastructure markets is based on regulation:
Competition has not been achieved just through deregulation, but also through the construction of elaborate regulatory machinery that oversees access to essential services, arbitrates disputes, and sets prices and other terms and conditions. So the nature of competition in these services is a creature of regulation. (Banks 2002, p. 2)
Banks (2002, p. 15) concluded that ‘the introduction of competition regulation to infrastructure
and the dismantling of the old statutory monopolies has produced large dividends for Australia’,
although there may be scope for significant efficiency payoffs by refining the regulatory
frameworks.

Infrastructure and Australia’s food industry: Preliminary economic assessment
50
Box 1 Regulation reform in Australia
There have been three broad regulation reform processes in Australia since the 1980s (PC 2011a).
Deregulation of trade, financial and foreign exchange markets in the 1980s—opened the Australian economy to international markets.
Competition policy reform—included major reforms to public monopolies in key infrastructure service areas and other government businesses, culminating in implementation of the National Competition Policy from 1995 to 2005 (PC 2005).
Reducing regulatory burden on the Australian economy—in recent years the Council of Australian Governments (COAG) has sought to reduce costs to business, and the community, that arise from differences in regulation across jurisdictions in Australia. The Seamless National Economy initiative seeks to improve the national coherence of regulation and reduce its costs while maintaining or enhancing its effectiveness.
Australia’s National Reform Agenda is the successor program to the National Competition Policy. The regulatory
stream of COAG’s National Reform Agenda focuses on reducing the regulatory burden imposed by the three
levels of government (PC 2009a, p. xiii):
COAG agreed that effective regulation is essential to ensure markets operate efficiently and fairly, to
protect consumers and the environment and to enforce corporate governance standards. However,
the benefits from regulation must not be outweighed by the costs imposed and there should be no
unnecessary compliance costs.
Commercialisation options in infrastructure industries
Public provision of infrastructure services has been the traditional model used in Australia and
other OECD countries, although there has been considerable interest since at least the 1990s in
reassessing the role of the private sector in the industry. Commercialisation options mainly
represent alternative approaches to addressing the natural monopoly aspects of an
infrastructure industry by increasing competitive pressures in the industry.
Government ownership models
There are three main options for government ownership of infrastructure facilities.
Traditional public utility with marginal cost pricing (less than full cost recovery)—public provision of infrastructure services with a government subsidy to support a marginal cost pricing policy.
Public utility with average cost pricing (full cost recovery)—public provision of infrastructure services with average cost pricing or full cost recovery (with an appropriate rate of return to the public investment in infrastructure assets).
Corporatisation model with competitive neutrality features (full cost recovery)—this model includes full cost recovery pricing and other features that aim to achieve competitive neutrality between public and private infrastructure service providers (the rate of return to the public investment in infrastructure assets includes an estimate of the private sector’s risk premium).
The traditional public utility with marginal cost pricing provides a benchmark against which
various commercialisation options, including alternative government ownership models, may be
assessed. The traditional public utility is a government ownership model whereby a government
department, local government or statutory authority is responsible for the management of

Infrastructure and Australia’s food industry: Preliminary economic assessment
51
infrastructure services in a given location, and the government subsidises the activity to support
a marginal cost pricing policy.
Two other government ownership models are based on average cost pricing (or full cost
recovery), but differ in the extent to which the commercial disciplines operating in private
markets are replicated. The public utility with full cost recovery may be interpreted as a
government ownership where there is a limited role for private ownership of infrastructure
assets, while the corporatisation model aims to achieve competitive neutrality between the
public and private sectors. That is, the public utility with full cost recovery (option 2) falls
between the traditional model with marginal cost pricing (option 1) and the corporatisation
model with competitive neutrality (option 3).
Options to increase competitive pressures and facilitate private participation
In most cases, commercialisation options that aim to increase competition in infrastructure
industries and facilitate private participation are complementary to government ownership
models. It is only in the case of full privatisation of infrastructure facilities that the government
ownership models would no longer apply, although governments would continue to have an
important regulatory role. These commercialisation options differ according to the type of
competition that is introduced in the infrastructure industry.
Yardstick competition (benchmarking)—benchmarking involves the comparison of the overall performance of an infrastructure business, or particular aspects of the business, with the performance of similar businesses; benchmarking may also be used by regulators to determine appropriate regulated prices (OECD 2004). Yardstick competition is particularly important for geographically separated utilities where alternative commercialisation options, or options for increasing competitive pressures, may be limited (Dosi and Easter 2003).
Competition for inputs (outsourcing)—outsourcing refers to an infrastructure business entering into a contractual agreement with another organisation to provide specified non-core services; functions that may be considered for outsourcing include, for example, meter reading, laboratory services, billing and revenue collection, accounting services, design, construction, specialised maintenance, emergency repairs and training (Dosi and Easter 2003; Jacobs and Howe 2005). Providing there is sufficient competition between input suppliers, outsourcing may reduce costs and enhance the performance of the infrastructure business.
Competition for the market (public-private partnership, PPP, arrangements)—public-private partnerships mainly refer to arrangements whereby the government enters into a contractual agreement with a private organisation to provide specified core functions; includes delegated management options, and a range of other options that generally have an emphasis on private sector financing of infrastructure projects (Appendix E).
Product market competition (market structure aspects and private provision)—this refers to a range of options that increase the opportunities for transactions between a larger number of infrastructure service providers and users including, most importantly: unbundling services to isolate the natural monopoly elements in the industry; common carriage competition (or third party access) to allow shared access of existing delivery networks through some form of access pricing arrangements; options to increase competition between regions (such as investment to increase water pipeline linkages between regions, and reducing or removing impediments to water trading within and

Infrastructure and Australia’s food industry: Preliminary economic assessment
52
between regions); and private provision of infrastructure services (private cooperatives or profit maximising private firms).
Some key features of these commercialisation options are presented in Table 8.
Table 8 Ownership and management aspects of key commercialisation options
Option Asset
ownership Capital
investment Operations/
management Commercial
risk Government ownership models G G G G
Yardstick competition
Benchmarking G G G G
Competition for inputs
Outsourcing G G P/G G
Competition for the market—public-private partnership arrangements
Delegated management options
Management contract G G P G
Franchise Operating concession G G P G
Concession G G P P/G
Other public-private partnership arrangements
DBFO (Design, Build, Finance, Operate) or DBO (Design, Build, Operate) G P G P/G
BOT (Build, Operate, Transfer) G P P P/G
BOOT (Build, Own, Operate, Transfer) P/G P P/G P/G
BOM (Build, Own, Maintain) P P G P
BOO (Build, Own, Operate) P P P P
Product market competition
Private ownership model
Private cooperative Users Users Users Users
Private firm P P P P
Note: G=government, P=public. Commercial risk needs to be interpreted with some caution. Further information on public-
private partnership arrangements is provided in appendix E.
Private participation in infrastructure investment in Australia
In this section, the value of engineering construction work done is used to provide an indicator
of investment expenditure in Australia (this information excludes the building components of
projects). In Australia, private sector participation in infrastructure investment projects has
increased in recent decades. The value of private engineering construction work done for the
private sector increased from $5 billion in 1986–87 to $85 billion in 2011–12, largely as a result
of the mining boom (in 2010–11 prices) (Figure 23a). The value of private and public
engineering construction work done for the public sector in Australia increased from $15 billion
in 1986–87 to $32 billion in 2011–12—over this period, the private sector’s share of work done
for the public sector increased from 34 per cent to 51 per cent (Figure 23b).

Infrastructure and Australia’s food industry: Preliminary economic assessment
53
Figure 23 Engineering construction activity in Australia, by sector, 1986–87 to 2011–12
Note: Based on the value of work done in 2010–11 prices (chain volume measure).
Source: Based on ABS 8762.0, Engineering Construction Activity, Australia (table 1)
In 2011–12, the value of engineering construction work done for the public sector was the major
share of total work done for roads, bridges, railways, electricity and water (Figure 24a). Private
participation in these infrastructure investment projects was important for all construction
types with the major exception of the electricity sector (Figure 24b).
Figure 24 Value of engineering construction work done for the public sector in Australia, 2011–12
Note: a Includes roads, highways and subdivisions. b Includes electricity generation transmission and distribution.
c Includes oil, gas, coal and other minerals.
Source: Based on ABS 8762.0, Engineering Construction Activity, Australia (tables 8 and 10)
a) Shareof total work done b) Share undertaken by the private sector
0 25 50 75 100
Total
Other
Other heavy industry
Mining sector c
Recreation
Telecommunications
Sewerage & drainage
Water storage & supply
Electricity sector b
Pipelines
Harbours
Railways
Bridges
Roads a
%
0 25 50 75 100
Total
Other
Other heavy industry
Mining sector c
Recreation
Telecommunications
Sewerage & drainage
Water storage & supply
Electricity sector b
Pipelines
Harbours
Railways
Bridges
Roads a
%
a) Value of work done, by sector b) Private sector's share of work done
for the public sector
0
25
50
75
100
1251
98
6-8
7
19
91
-92
19
96
-97
20
01
-02
20
06
-07
20
11
-12
20
10
-11
$b
Private activity for the private sector
Private activity for the public sector
Public activity for the public sector
0
10
20
30
40
50
60
19
86
-87
19
91
-92
19
96
-97
20
01
-02
20
06
-07
20
11
-12
%

Infrastructure and Australia’s food industry: Preliminary economic assessment
54
In 2011–12, the value of engineering construction work done in infrastructure industries
(excluding gas) was around $60 billion of which 53 per cent ($32 billion) was work undertaken
for the public sector and the remaining 47 per cent ($28 billion) was work undertaken by the
private sector for the private sector (current prices; Table 9). The value of work done by the
private sector for the public sector was $16 billion in 2011–12—private activity was most
important for work done on construction projects for roads ($8.6 billion or 51 per cent of total
private activity for the public sector), water ($2.6 billion or 15 per cent) and railways
($2.4 billion or 15 per cent).
Table 9 Value of engineering construction work done in Australia, by sector, 2011–12
By and for the
For the public sector
private sector
Total
Total activity
Type of % of Private Public % of % of
construction Value total activity activity Value total Value total
$b % $b $b $b % $b %
Infrastructure (excludes gas)
Transport
Roads a 5.4 6.3 8.6 4.5 13.1 39.8 18.5 15.5
Bridges 0.1 0.2 0.6 0.2 0.8 2.4 1.0 0.8
Railways 4.1 4.7 2.4 2.0 4.5 13.6 8.5 7.2
Harbours 4.6 5.4 0.3 0.0 0.4 1.1 5.0 4.2
Pipelines 2.5 2.9 0.1 0.0 0.1 0.3 2.6 2.2
Total 16.7 19.4 12.0 6.8 18.8 57.2 35.5 29.9
Electricity sector b 4.6 5.4 1.2 5.9 7.1 21.7 11.8 9.9
Water
Water storage & supply 2.0 2.4 1.4 1.4 2.8 8.5 4.8 4.1
Sewerage & drainage 0.7 0.8 1.2 1.2 2.4 7.3 3.1 2.6
Total 2.7 3.1 2.6 2.6 5.2 15.8 7.9 6.6
Telecommunications 4.4 5.1 0.5 0.0 0.5 1.6 4.9 4.1
Total infrastructure 28.4 33.0 16.3 15.4 31.7 96.3 60.1 50.5
Other industries
Recreation 1.9 2.2 0.4 0.7 1.1 3.3 3.0 2.5
Mining sector c 53.4 62.0 0.01 0.02 0.03 0.1 53.4 44.9
Other heavy industry 0.9 1.0 0.0 0.0 0.0 0.0 0.9 0.8
Other 1.5 1.7 0.1 0.0 0.1 0.3 1.6 1.3
Total 57.6 67.0 0.5 0.7 1.2 3.7 58.8 49.5
Total 86.0 100.0 16.8 16.1 32.9 100.0 118.9 100.0
Note: a Includes roads, highways and subdivisions. b Includes electricity generation transmission and distribution. c Includes
oil, gas, coal and other minerals.
Source: ABS 8762.0, Engineering Construction Activity, Australia (tables 8 and 10)

Infrastructure and Australia’s food industry: Preliminary economic assessment
55
Economic issues and infrastructure policy—previous studies
In preliminary consultations, various issues relating to infrastructure in Australia’s food supply
chain were identified (see also the case studies in Chapter 4); key issues include:
Road freight—road freight is a more flexible and reliable transport option compared with rail freight, although there are congestion issues in urban areas; there are significant financing issues for road infrastructure investment in rural areas (such as upgrading roads to allow increased access to road freight) because lower rural populations have reduced the revenue base for local governments.
Rail freight—issues relate to congestion, time delays and uncertainty: food commodities are at a competitive disadvantage with mineral resource commodities for access to rail freight; rail freight tends to have a lower priority to passenger rail.
Ports—a key concern is limited capacity to support refrigerated containers (such as provision of electricity outlets).
Energy—issues relate to the cost of accessing electricity and gas networks; costs and risks tend to be higher for the first user (subsequent users gain network access at lower cost).
International supply chains—a key issue is the need for complementary infrastructure investment in Australia and export markets (such as China).
Issues have also been raised with respect to the need for more effective coordination across
transport types (road, rail and port infrastructure), activities (agriculture and other
infrastructure users) and jurisdictions. For example, there may be potential to more effectively
identify infrastructure investment ideas originating in the regions and facilitate project
assessments (including through to project feasibility stage).
This section identifies some key previous studies that have examined economic issues in the use
and supply of infrastructure in Australia.
National infrastructure plan (Infrastructure Australia 2013)
Infrastructure Australia was established in 2008 to support a national focus on long term
strategic investment in economic infrastructure, planning and delivery, and to progress
infrastructure reforms. The National Ports Strategy (endorsed by COAG in July 2012) and the
National Land Freight Strategy aim to improve the development of Australia’s transport
infrastructure.
Proposed reforms
The latest national infrastructure plan proposes seven reforms to address the infrastructure
funding challenge (Infrastructure Australia 2013, excerpts from pp. 18–26).
Reform 1: Establish a single national infrastructure fund—Commonwealth funds and investment sources have overlapping purposes, different assessment frameworks, and different decision making mandates. A single assessment and prioritisation framework—Infrastructure Australia’s reform and investment framework—will ensure all major projects are informed decisions, supported by a sound economic case, and tested with a robust, independently assessed cost-benefit analysis.
Reform 2: Using government balance sheets more innovatively to spread available funding—the Australian Government could leverage more private investment in
Infrastructure and Australia’s food industry: Preliminary economic assessment
56
infrastructure by structuring its contributions and funding conditions to state and territory projects differently.
Reform 3: Recycle capital—more than $100 billion of commercially suitable infrastructure assets sit within Australian Governments’ infrastructure investment portfolios. Recycled assets could include airports, roads, water services, ports, freight rail and electricity generation, transmission and distribution. Together, their value is large enough to fund a significant proportion of our most critical infrastructure priorities.
Reform 4: User pays–user says—while there are different ways to finance projects, infrastructure is ultimately funded or paid for by user charges or taxpayers, or some combination of both. To date, most of Australia’s public infrastructure has been largely funded by Government subsidies, with insufficient or no cost recovery at all from direct users. This needs to change: when all taxpayers pay for infrastructure, it reduces the accountability of Governments to provide infrastructure that meets the needs of direct users.
Reform 5: Reduce layers of Government involvement in infrastructure—Australia has nearly 600 different local, state and territory Governments that, together with the Australian Government, fund and plan infrastructure. Through this multitude of players, our infrastructure development is slow and delivery risks are high, which constrains our productivity and makes our projects less attractive for potential investors. Australia’s transport, water and energy infrastructure form complex webs of connected services. Projects are too often considered in isolation without proper analysis of the potential impact on wider infrastructure networks. Australia needs integrated infrastructure planning across Governments that clarifies which level of Government funds and delivers which projects. Efficiencies can be driven by clear accountability between the layers of government. This would reduce costs and attract further investment.
Reform 6: Be world leaders in project governance—the delivery of major projects is challenging, with long planning horizons and complex interfaces, multiple stakeholders and the potential for significant scope changes to occur over time. A study of 23 major resource projects in Australia found that strong performance management of major capital projects, best practice management from concept and design through to contracting, and a project team with superior execution skills, could yield cost savings between 20 and 50 per cent.
Reform 7: Smarter, leaner infrastructure procurement—Australian Governments must improve their project procurement processes to manage rising cost structures, support project viability and attract private sector investment.
Regional Australia
Infrastructure Australia (2013) highlights the importance of increased investment in regional
infrastructure to address the growing needs of regional export-oriented industries. In particular,
investment in road, rail and port infrastructure is required to ensure increased food exports to
2050 are transported from farm to export market in a cost competitive way. To increase the
efficiency and resilience of Australia’s regional supply chains, Infrastructure Australia (2013,
excerpts from pp. 77–81) recommends:
Action 20: Coordinated, short and long term infrastructure plans in our regions—there is poor coordination and integration between different planning bodies, and disconnect between regions. A 2012 report found the full potential of regional planning was not harnessed because individual regions have limited powers and mandates to move from planning and advocacy to funding, financing and delivering infrastructure. Regional infrastructure plans fail to adequately respond to the long term freight challenge, with limited focus on regional freight systems and supply chain coordination. Greater integration
Infrastructure and Australia’s food industry: Preliminary economic assessment
57
and coordination is needed between Government entities and the private sector (resources, transport and agricultural industries). Such coordination would enable scale, support economic development, improve planning outcomes and maximise opportunities for funding through sources such as the regional infrastructure fund. As our regions grow, our ability to plan and fund regional infrastructure must also grow. A working group, comprising of members from the Commonwealth, state and territory jurisdictions and the Australian Local Government Association, is currently developing the draft regional infrastructure investment strategy. The strategy will be a guide for identifying, prioritising, financing and funding decisions for regional infrastructure projects, complementary to the work of Infrastructure Australia.
Action 21: Consolidate regional local governments—half of Australia’s local government entities look after less than 7,300 residents with correspondingly low, unsustainable revenue bases. Options to strengthen local and regional infrastructure planning and delivery include consolidation of local governments, regional infrastructure delivery models or formal agreements between bodies with infrastructure responsibilities.
Action 22: Make better use of scarce water resources to provide certainty to communities and invest in a thriving food sector—Australia’s agricultural practices and systems continue to evolve to make the best use of our precious water resources. Water use efficiency on irrigation farms has on average increased by 300 per cent since 2000 through the adoption of advanced water delivery, such as in-ground pipes replacing open channels, and new crop varieties. The merits of innovative infrastructure solutions deserve further consideration.
Action 24: Recycling capital from regional assets to much-needed regional infrastructure—governments currently own regional airport assets that could be transferred to the private sector to drive productivity in our regions and unlock funding for much-needed regional infrastructure. State Governments also own plantation forests suitable for sale to the private sector. Many of these plantations are commercial and, with the right approach to public policy issues, could be easily transferred to the private sector.
Implementing the national ports strategy and national land freight strategy are essential for
planning and delivering the transport infrastructure needed to provide reliable, efficient and
flexible food supply chains.
Other studies
The role of infrastructure in Australia’s food supply chain has been examined in several studies.
Chapter 3 briefly discussed infrastructure issues in specific commodity markets referring to, for
example, Tulloh and Pearce (2011), Allen Consulting Group (2009) and various reports by the
National Transport Commission. Other studies that have examined infrastructure issues in
Australia’s food supply chain include:
Blueprint for Australian agriculture 2013–2020 (National Farmers Federation 2013)—the report argued that ageing and inadequate infrastructure in Australian agriculture and its supply chain is a high priority issue. Strategies to improve and upgrade critical infrastructure include: establish an agriculture infrastructure taskforce to engage with government/Infrastructure Australia on prioritising critical infrastructure to remove productivity bottlenecks, and identifying sources of future investment/capital (both domestic and international); consider alternative methods to raise capital for infrastructure, including supply chain investment and public-private partnerships; focus on provision and uptake of telecommunications in rural and regional centres to ensure equal, or at least comparable, access to new technologies for all Australians; and investigate innovative

Infrastructure and Australia’s food industry: Preliminary economic assessment
58
investment arrangements including policy and law changes to attract investment (National Farmers Federation 2013, p. 31).
Resilience in the Australian food supply chain (Bartos et al. 2011, 2012)—the research found that Australia’s food supply chain has demonstrated a high degree of resilience when localised or regional crises have disrupted key parts of the supporting infrastructure. However, the food supply chain is potentially vulnerable in large-scale events (such as a human or animal pandemic, or a national fuel shortage), or combinations of events that affect multiple links of the food supply chain at the same time (such as widespread electricity outages combined with floods or fires). The study noted that a major part of the Australian Government’s approach to critical infrastructure is the Trusted Information Sharing Network (TISN), a forum for governments and industry to assess and mitigate risks, and build resilience capacity within organisations.
Agriculture and Food Policy Reference Group (2006; ‘the Corish report’)—the report argued that a competitive, efficient and cost effective transport system is fundamental to the future of Australia’s agriculture and food sector and recommended: the interdependence of road and rail transport must be better reflected in decisions affecting the building and maintaining of networks in regional areas; the AusLink cooperative agreements between the Australian and state and territory governments must be completed and implemented quickly, and include funding for ports as part of more comprehensive export logistics planning (AusLink was replaced with the National Land Transport Network in 2009); and the National Transport Commission should be given powers to enforce uniform and nationally consistent standards, pricing mechanisms and legislative requirements across transport modes, with the aim of minimising regulatory costs to businesses (Agriculture and Food Policy Reference Group 2006, p. 18).
The review of Australia’s Future Tax System (AFTS) examined Australia’s road transport taxes
and provided a number of recommendations to achieve more efficient use and supply of roads
(see Henry et al. 2009, pp. 53–54 for discussion, and p. 92 for recommendations). The
Productivity Commission (PC) has released several major reports on infrastructure issues and
policy in Australia.
Efficiency of infrastructure policy—PC (2008) provides a summary of key findings from its previous and current research; notably, PC (2006) examined road and rail freight infrastructure pricing in Australia, and Chan et al. (2009) examined public infrastructure pricing. PC (2013) provides the draft report for the latest assessment on Australia’s national access regime. PC (2011b) examined the economic regulation of airport services.
Regulatory burdens on business— PC (2009b) provides a review of regulatory burdens on business in social and economic infrastructure; see also Banks (2002).
The Bureau of Infrastructure, Transport and Regional Economics (BITRE) and the National
Transport Commission (NTC) have released several studies on Australia’s transport
infrastructure; see, for example, BITRE (2006, 2011) and NTC (2008, 2009a, b, c). Ernst and
Young (2012) examined issues relating to the planning, financing and delivery of local
infrastructure with a focus on identifying ways in which local governments can achieve more
infrastructure facilities from existing funding sources. Local government issues are also
examined in Allen Consulting Group (2009).
Future research will draw on previous economic assessments, and identify key implications for
infrastructure in Australia’s domestic and international food supply chains.

Infrastructure and Australia’s food industry: Preliminary economic assessment
59
6 Conclusion A key to realising potential growth opportunities is to ensure Australia’s infrastructure and
biosecurity systems will support a growing food industry, moving food cost-effectively and
efficiently to markets and supporting new export opportunities. This report has provided
preliminary information and analysis relevant to economic infrastructure and Australia’s food
industry to 2050. Several key points are noted.
The potentially significant expansion of Australian production and exports of key agricultural commodities—wheat, sugar, beef, sheep meat and dairy—will increase pressure on the infrastructure that currently supports these supply chains.
To make the most of opportunities presented by rapidly growing Asian markets, infrastructure that allows food to be moved cost-effectively and efficiently through supply chains will be important.
- The road network is of particular importance to food supply chains and as production and exports expand, it will become increasingly important that issues affecting performance be addressed. These include connectivity across the road network and with other transport modes, road and rail pricing distortions, funding arrangements and the integration of planning and investment across modes.
- The potential expansion of production in areas currently without adequate infrastructure presents additional challenges. For example, a significant expansion of beef production in northern Australia would need to be supported by large infrastructure investments. Similarly, to achieve substantial increases in dairy production it is likely that additional investment in irrigation infrastructure will be required, both on and off-farm.
Further research could build on the approach taken here to present a more sophisticated
analysis of potential infrastructure constraints in agrifood supply chains. This could include a
more detailed examination of potential scenarios for the likely location of any growth in
agricultural production and exports (including the potential impacts of climate change on the
location of production). Importantly, given the multi-use nature of most infrastructure,
understanding future infrastructure requirements will necessitate an understanding of changes
in both agricultural and non-agricultural demand for infrastructure. A regional analysis of the
expected growth in total demand for infrastructure is likely to be required to identify potential
issues effectively.
It is intended that subsequent work will assess impediments to infrastructure and identify policy
response options that would support growth in Australia’s food production and processing
industries. Key future research directions that may be considered include:
Australia’s food production, processing and exports to 2050: implications for infrastructure—undertake a more comprehensive assessment of key supply-side factors influencing the pattern of food production, processing and exports to 2050 in regional and remote areas of Australia, and identify implications for infrastructure requirements. This research would be complementary to the ABARES research on What Asia Wants.
Integrated modelling by BITRE and ABARES—in this collaborative research, ABARES would focus on integrating food production and processing activities into the BITRE model framework for infrastructure in Australia.

Infrastructure and Australia’s food industry: Preliminary economic assessment
60
Food supply chain analysis—a useful area for future research may be to undertake simulations of important aspects of Australia’s food supply chain with a focus on infrastructure requirements to support export growth of key food commodities to 2050. It is beyond the scope of subsequent work to examine specific infrastructure projects.
Pricing and provision of key food infrastructure services in Australia—assess impediments to investment in infrastructure, including the private provision of infrastructure, and identify policy response options that would support growth in Australia’s domestic and international food supply chains.
There is likely to be an important role in future research to examine the experience in other
OECD countries and assess the extent to which the overseas experience provides useful policy
implications for Australia.
A further important aspect of future research will be to assess the availability of infrastructure
data relevant to the analysis of Australia’s food supply chain, and consider the potential role in
providing a coordinated list of significant food infrastructure projects at various stages of
development (this may include, for example, initial project ideas proposed at the local or
regional level, through to completed projects).

Infrastructure and Australia’s food industry: Preliminary economic assessment
61
Appendix A Infrastructure data sources Table A1 Infrastructure data sources from key agencies
Organisation, series and website
ABARES
Agricultural commodity statistics daff.gov.au/abares/publications_remote_content/publication_series/australian_commodity_statistics Agricultural survey daff.gov.au/abares
Irrigation survey daff.gov.au/abares
Rail spatial data daff.gov.au/abares
Trade statistics daff.gov.au/abares
Australian Bureau of Statistics (ABS)
Input–Output Tables abs.gov.au/AusStats/[email protected]/MF/5209.0.55.001
International cargo statistics abs.gov.au/AUSSTATS/[email protected]/0/BD1A0DE67EF08A95CA2571C40018E087?opendocument Austroads
National Performance Indicators - asset management algin.net/austroads/site/Index.asp?id=5
Bureau of Infrastructure, Transport and Regional Economics (BITRE)
Australia’s Bulk Ports bitre.gov.au/publications/2013/report_135.aspx
Aviation statistics (air freight) bitre.gov.au/statistics/aviation/index.aspx
Industry structure database bitre.gov.au/databases/files/databases_FOR1.xls
Infrastructure statistics bitre.gov.au/statistics/infrastructure/index.aspx
Infrastructure yearbook bitre.gov.au/publications/2012/stats_002.aspx
Maritime statistics (sea freight) bitre.gov.au/statistics/maritime/index.aspx
Rail statistics bitre.gov.au/statistics/rail/index.aspx
Road statistics bitre.gov.au/statistics/road/index.aspx
Bureau of Meteorology
Storage capacity water.bom.gov.au/waterstorage/awris/
Water data bom.gov.au/water/
Bureau of Resource and Energy Economics (BREE)
Australian energy statistics bree.gov.au/publications/aes.html
Major electricity generation projects bree.gov.au/publications/megp.html
Resource and energy major projects bree.gov.au/publications/remp.html

Infrastructure and Australia’s food industry: Preliminary economic assessment
62
Resource and energy statistics bree.gov.au/publications/res.html
Resources and energy quarterly bree.gov.au/publications/req.html
Department of Agriculture, Fisheries & Forestry (DAFF)
Food statistics daff.gov.au/agriculture-food/food/publications/afs
Red meat statistics daff.gov.au/agriculture-food/meat-wool-dairy/quota/red-meat/statistics
Geoscience Australia
Rail network map ga.gov.au/products/servlet/controller?event=GEOCAT_DETAILS&catno=60690
Road network map ga.gov.au/geomet-datasetreport/report.jsp?datasetno=2391
Topographic data ga.gov.au/topographic-mapping/digital-topographic-data.html
Maritrade
Trade statistics maritrade.com.au/trade.html
Murray–Darling Basin Authority (MDBA)
River data and information mdba.gov.au/river-data
Spatial data mdba.gov.au/river-data/spatial-data-services/spatial-information
OECD
Transport, including freight and passenger transport tasks stats.oecd.org/
Ports Australia
Trade statistics (domestic and international) portsaustralia.com.au/tradestats
Rural Research & Development Corporation
Agriculture–specific transport data ruralrdc.com.au/Page/Home.aspx
Transmet
Transport metadata nss.gov.au/transportmetadata/index.jsp
World Bank
Quality of infrastructure (country comparison of air, port, road, rail) data.worldbank.org/indicator/IQ.WEF.PORT.XQ

Infrastructure and Australia’s food industry: Preliminary economic assessment
63
Appendix B Case study for Tasmania—consultations and irrigation projects This appendix provides information on the stakeholder consultations for the case study on
Tasmania. Information is also provided on Tasmania’s irrigation infrastructure projects.
Consulted stakeholders in Tasmania
The consulted primary producers include a former mixed farming business which had recently
converted to an intensive dairy business and a fruit grower consolidating their production
system in response to the current economic climate. Also interviewed were processors with
significant infrastructure investments, including a dairy processing business providing milk
powder for export and the Tasmanian Feedlot Company producing beef for the Japanese market.
Tasmanian Irrigation, which is managing a rapidly expanding irrigation infrastructure, was also
interviewed. Finally representatives of the Tasmanian Farmers and Graziers Association (TFGA)
were interviewed.
Dairy Farmer
The dairy farming business was recently converted from a mixed enterprise to dairy production.
The business is located in the Northern Midlands and is owned and operated by an extended
family. The previous business had involved horticulture, grain, sheep and cattle, but for financial
and quality of life reasons the family believed this model to be untenable.
After researching several alternatives (including high value products such as truffles), and
visiting New Zealand to observe “the best in the world”, they decided that the returns to dairy
were the most attractive, although it involved changing the entire operation and entering an
industry with which they had no experience. The key to this transition was access to reliable
irrigation water supply which permitted year round intensive pasture production. The farm
business is now converting another nearby farm to intensive dairy.
The business was aware of the positive reputation of Australian products in the wake of a
tainted milk powder incident in China, but they saw their opportunity primarily as producing a
reliable and competitively priced bulk commodity. Their milk is sold to an established
multinational processor.
Fruit grower
The fruit grower interviewed runs an established apple and cherry business in the Tamar Valley
in Northern Tasmania and was consolidating their business to reduce costs. The primary cost
reduction strategy involved removing a number of trees and cultivating the remainder more
intensely, and with less labour. Alternative layouts such as a “2D” system where fruit bearing
branches were cultivated in frames and shorter trees that required less safety precautions (and
costs) to harvest were also being considered.
The fruit grower claimed that an inability to compete with low cost producers such as those in
South America meant that Tasmania did not export apples this year for the first time in 140
years. The firm did not anticipate this would change unless the currency depreciated and other
costs fell, including freight and labour. Prominent among these costs was the necessary freight
leg to Melbourne before export.

Infrastructure and Australia’s food industry: Preliminary economic assessment
64
The firm had previously investigated and exported to Asian markets. They had exported Fuji
apples to Taiwan until Taiwanese authorities impounded a shipment after detecting aphids. This
led to a large financial loss and convinced the firm that continued exports to Taiwan were too
large a financial risk.
Dairy Processor
North West Tasmania is highly suitable for dairy production because of its high rainfall and
sandy soils. Tasmanian Dairy Products has recently built and begun operating its first processing
facility in Smithton in North West Tasmania. The facility processes milk from the region into
milk powder for export to markets in Asia and the Middle East. The operators are also hoping to
export to the expanding Indian market.
To minimise the transport costs of raw milk, which is heavy and perishable, before it is
processed into lighter and less perishable milk powder, it is natural to locate processing facilities
within dairy regions. In this case, this was complicated as the nearest natural gas pipeline
(energy is required to dry the milk) did not reach the region. After considering various options,
it was decided to truck liquid natural gas from the end of the pipeline, rather than to either
extend the existing pipeline or transport the raw milk further. Tradeoffs of this type highlight
the importance of ensuring that infrastructure access and pricing regulations are efficient.
The dairy processing firm was initially established by a single investor and has now received
active investment from Murray Goulburn Cooperative Co Ltd and investment from other firms
with interests in food manufacturing who do not actively participate in management.
Tasmanian Feedlot Company
The Tasmanian Feedlot is located in Powranna in the Northern Midlands of Tasmania and began
producing beef for the Japanese market in 1972. The company began as a joint venture between
the Japanese firm Jusco and local producers following Jusco’s desire for quality, but
competitively priced beef for their own stores.
The Feedlot’s beef is marketed in Japan as Tasmanian Beef and is distinguished as a “premium
economy” product that competes with domestic Japanese beef rather than American beef or
“Aussiebeef” from the mainland. This became apparent when findings of BSE in the United States
caused the withdrawal of American beef from the Japanese market. This had no appreciable
effect on the demand for Tasmanian beef; yet a previous scare in Japanese domestic production
has resulted in an increase in demand. Despite competing in the “high end” of the market, the
feedlot considered the Tasmanian product to be “premium economy”, whose competitiveness
was reliant on a lower price than Japanese beef.
Although vertically integrated with a retail company, the cattle from the facility are slaughtered
and processed into chilled primal cuts and frozen offcuts by Tasmanian facilities owned by other
businesses.
Tasmanian Irrigation
Tasmanian Irrigation is overseeing an expansion of irrigation schemes in Tasmania funded in
part by private capital. As of April 2013 the schemes operating, under construction or planned
have a total annual capacity of 74GL and expect to attract $90 million of private capital. More
detail is provided in the next section of this appendix (Table B1 and Map B1).

Infrastructure and Australia’s food industry: Preliminary economic assessment
65
After Tasmanian Irrigation conducts a feasibility study to assess whether a given scheme is
likely to attract investors and be environmentally sustainable, they sell water entitlements
under binding contracts. Only when sufficient water entitlements to support the project have
been sold does construction on the scheme begin. Priority is given to landholders, but
Tasmanian Irrigation is also prepared to sell to other investors if needed to reach the required
sales threshold.
Before a water user is permitted to buy water, they must prepare a water use plan to ensure that
their intended water use does not cause environmental problems such as runoff or salinity. It is
intended that this and other measures, along with reliable Tasmanian rainfall, will help prevent
the kind of problems experienced in the Murray Darling Basin. Intended uses have included food
uses such as irrigated dairy and horticulture alongside non-food uses such as pyrethrum and
poppies.
The irrigation expansion is also supported by the Water Infrastructure Fund, to which the
Australian and Tasmanian Governments have contributed $140 million and $80 million,
respectively.
Tasmania’s irrigation projects
Table B1 Recently completed, existing and planned irrigation projects in Tasmania
Project Status a Volume b Irrigable area Start year c ML ha
Caveside Dairy Plains Operational 4 570 na na
Coal River (Stage 1) Operational 2 605 na na
Cressy Longford Operational Private na 1974
Great Forester Operational 1 980 1 800 2011
Hagley Operational na na 2007
Meander Valley Operational 36 000 na 2007
Quamby Osmaston Operational 2 850 na 2010
Rubicon Operational 5 685 na 2012
Sassafras Wesley Vale Operational 5 460 10 650 2011
South East (Stage 2) Operational 1 975 na na
Whitemore Operational 5 500 12 000 2011
Winnaleah Operational 6 924 4 500 1987
South East Expansion (Stage 3) Water Sales 3 000 10 948 2015
Kindred North Motton Construction 2 500 8 483 2013
Lower South Esk Construction 5 298 15 421 2013
Midlands Construction 38 500 55 484 2015
Upper Ringarooma Tendering 5 700 10 177 2015
Dial Blythe Feasibility 2 500 8 630 na
Scottsdale Feasibility 8 600 17 366 post-2014
Southern Highlands Feasibility 6 500 8 000 na
Circular Head Pre-feasibility c. 20 000 na post-2013
North Esk Pre-feasibility c. 3 000 na na
Swan River Pre-feasibility na na na
Note: a After a scheme is deemed feasible, sufficient water sales are required before constructed is commenced.
b Totals are not presented as some schemes overlap or are part of larger schemes. c Actual or expected year of
commencement. na not available.
Source: Tasmanian Irrigation; Australian Government Department of Sustainability, Environment, Water, Population and
Communities
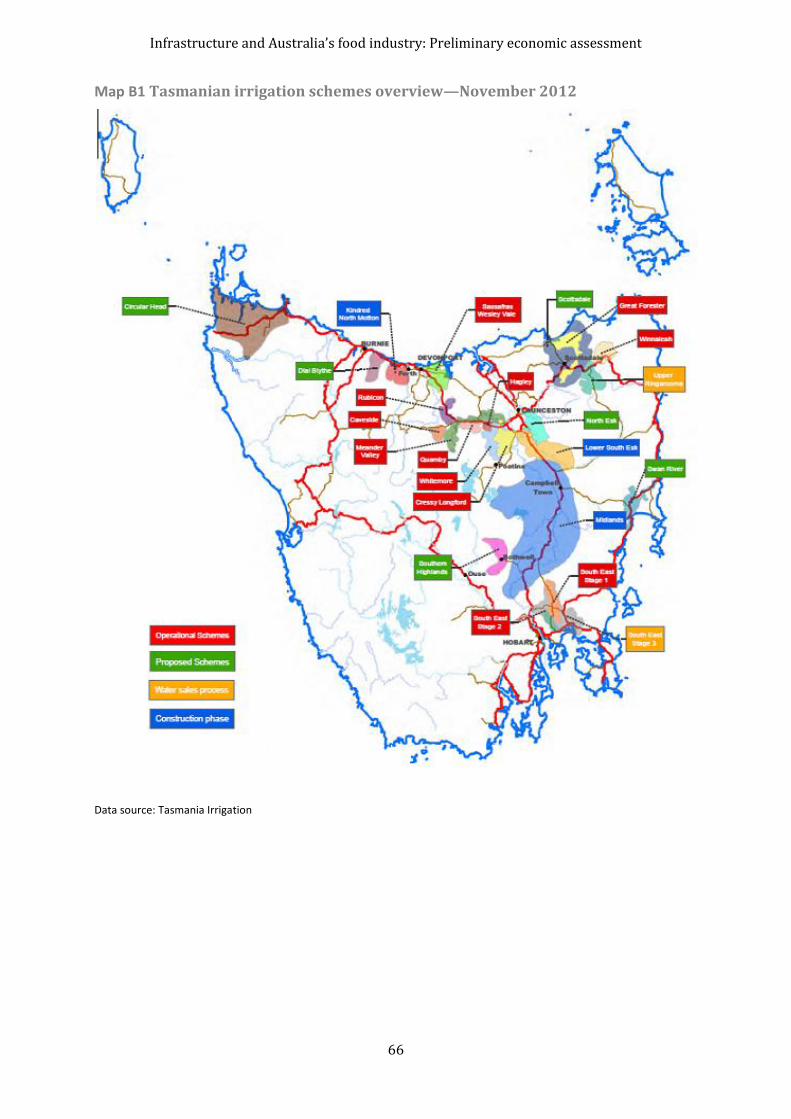
Infrastructure and Australia’s food industry: Preliminary economic assessment
66
Map B1 Tasmanian irrigation schemes overview—November 2012
Data source: Tasmania Irrigation

Infrastructure and Australia’s food industry: Preliminary economic assessment
67
Appendix C Infrastructure and key food industries: ABS input-output data Table C1 shows the value of intermediate and primary inputs used by industry (intermediate
use) and in final use categories (domestic use or for export). Inputs include domestic and
imported products. Primary inputs include wages and profit (see ABS 2012a for further
information). Table C2 and Table C3 are derived from Table C1.
Table C1 Value of industry and final uses of intermediate inputs in Australia, 2008–09
Intermediate use
Agriculture, Food & Food & Other forestry beverage beverage industry
Final use Total
Supply of inputs & fishing products services uses Domestic Exports supply
$b $b $b $b $b $b $b
Intermediate inputs
Agriculture, forestry and fishing 12.8 25.6 1.2 7.7 9.5 10.4 67.2
Food and beverage products 1.5 12.4 11.5 14.6 39.8 19.6 99.4
Food and beverage services 0.2 0.9 0.1 8.2 42.8 2.7 54.9
Infrastructure
Transport, postal and warehousing
Road 1.5 3.6 0.7 20.0 12.2 8.1 46.0
Rail, pipeline and other transport Rail transport 0.1 0.1 0.0 3.1 2.6 6.0 11.9
Water, pipeline & other transport 0.0 0.1 0.0 3.9 1.8 1.6 7.4
Total 0.1 0.2 0.0 7.0 4.4 7.7 19.3
Air, transport, postal and storage services Air and space transport 0.1 0.1 0.0 5.8 np np 27.8
Transport, postal, storage services 1.4 1.4 0.3 37.0 np np 55.2
Total 1.5 1.5 0.4 42.8 22.7 14.1 83.0
Total 3.0 5.2 1.1 69.9 39.3 29.8 148.3
Electricity, gas, water and waste services
Electricity and gas 0.3 0.5 0.8 27.0 9.3 0.1 37.9
Water supply and waste services 0.6 0.2 0.2 7.7 7.0 0.0 15.7
Total 1.0 0.7 1.0 34.7 16.3 0.1 53.7
Information media and telecommunications
Telecommunication services 0.1 0.2 0.4 19.2 13.3 0.7 34.0
Other 0.1 0.1 1.4 29.3 17.1 1.6 49.7
Total 0.2 0.4 1.8 48.6 30.4 2.3 83.7
Total infrastructure 4.2 6.3 3.9 153.1 86.0 32.1 285.6
Other industries 21.1 17.1 11.0 942.6 992.4 215.2 2199.4
Total intermediate inputs 39.8 62.3 27.6 1126.2 1173.3 277.3 2706.5
Other input-output data
Primary inputs 30.8 36.8 25.7 1357.3 71.6 7.2 1529.4
Total uses 70.6 99.0 53.3 2483.5 1244.9 284.6 4235.9
Gross value added at basic prices 29.0 22.9 21.8 1095.1 – – –
Gross domestic product – – – – – – 1252.2
Note: Refers to 2008–09 input-output data. Supply of inputs includes domestic and imported products. np Not published.
Food and beverage products include alcohol and tobacco. Total uses are intermediate inputs plus primary inputs. For
example, $25.6 billion of domestic and imported agriculture, forestry and fishing products (first row of intermediate inputs)
were inputs to the food and beverage products industry in 2008–09.
Source: ABS, Australian National Accounts: Input-Output Tables – 2008–09, cat. no. 5209.0

Infrastructure and Australia’s food industry: Preliminary economic assessment
68
Table C2 Distribution of intermediate inputs, by Industry and final use activity, Australia, 2008–09
Intermediate use
Agriculture, Food & Food & Other Supply of forestry beverage beverage industry
Final use Total
intermediate inputs & fishing products services uses Domestic Exports supply
% % % % % % %
Agriculture, forestry and fishing 32.2 41.1 4.2 0.7 0.8 3.7 2.5
Food and beverage products 3.8 19.9 41.8 1.3 3.4 7.1 3.7
Food and beverage services 0.5 1.4 0.3 0.7 3.7 1.0 2.0
Infrastructure
Transport, postal and warehousing
Road 3.7 5.7 2.6 1.8 1.0 2.9 1.7
Rail, pipeline and other transport Rail transport 0.2 0.2 0.0 0.3 0.2 2.2 0.4
Water, pipeline & other transport 0.0 0.1 0.1 0.3 0.2 0.6 0.3
Total 0.2 0.3 0.1 0.6 0.4 2.8 0.7
Air, transport, postal and storage services Air and space transport 0.2 0.2 0.2 0.5 np np 1.0
Transport, postal, storage services 3.5 2.2 1.2 3.3 np np 2.0
Total 3.7 2.4 1.4 3.8 1.9 5.1 3.1
Total 7.6 8.4 4.1 6.2 3.3 10.7 5.5
Electricity, gas, water and waste services
Electricity and gas 0.8 0.8 2.7 2.4 0.8 0.0 1.4
Water supply and waste services 1.6 0.3 0.7 0.7 0.6 0.0 0.6
Total 2.4 1.1 3.5 3.1 1.4 0.0 2.0
Information media and telecommunications Telecommunication services 0.3 0.4 1.5 1.7 1.1 0.2 1.3
Other 0.2 0.2 4.9 2.6 1.5 0.6 1.8
Total 0.5 0.6 6.4 4.3 2.6 0.8 3.1
Total infrastructure 10.6 10.1 14.0 13.6 7.3 11.6 10.6
Other industries 53.0 27.5 39.7 83.7 84.6 77.6 81.3
Total intermediate inputs 100.0 100.0 100.0 100.0 100.0 100.0 100.0
Note: Refers to 2008–09 input-output data. Supply of inputs includes domestic and imported products. np Not published.
Food and beverage products include alcohol and tobacco.
Source: Based on ABS, Australian National Accounts: Input-Output Tables – 2008–09, cat. no. 5209.0
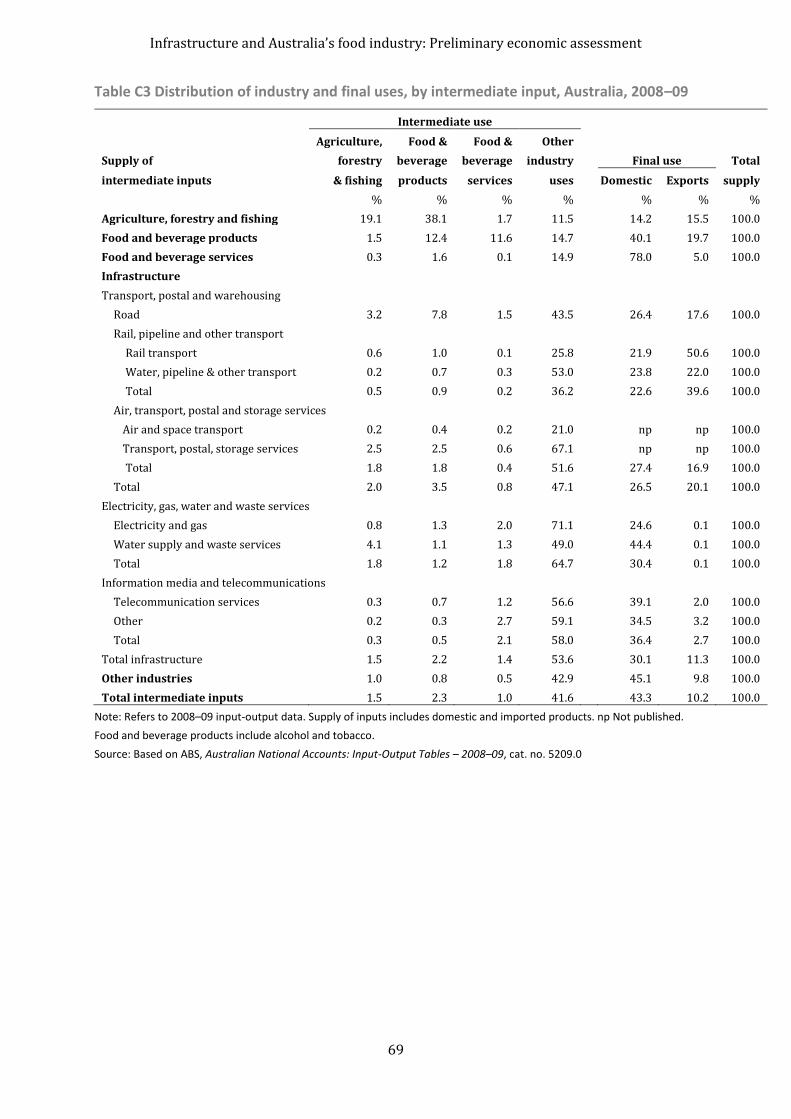
Infrastructure and Australia’s food industry: Preliminary economic assessment
69
Table C3 Distribution of industry and final uses, by intermediate input, Australia, 2008–09
Intermediate use
Agriculture, Food & Food & Other Supply of forestry beverage beverage industry
Final use Total
intermediate inputs & fishing products services uses Domestic Exports supply
% % % % % % %
Agriculture, forestry and fishing 19.1 38.1 1.7 11.5 14.2 15.5 100.0
Food and beverage products 1.5 12.4 11.6 14.7 40.1 19.7 100.0
Food and beverage services 0.3 1.6 0.1 14.9 78.0 5.0 100.0
Infrastructure
Transport, postal and warehousing
Road 3.2 7.8 1.5 43.5 26.4 17.6 100.0
Rail, pipeline and other transport Rail transport 0.6 1.0 0.1 25.8 21.9 50.6 100.0
Water, pipeline & other transport 0.2 0.7 0.3 53.0 23.8 22.0 100.0
Total 0.5 0.9 0.2 36.2 22.6 39.6 100.0
Air, transport, postal and storage services Air and space transport 0.2 0.4 0.2 21.0 np np 100.0
Transport, postal, storage services 2.5 2.5 0.6 67.1 np np 100.0
Total 1.8 1.8 0.4 51.6 27.4 16.9 100.0
Total 2.0 3.5 0.8 47.1 26.5 20.1 100.0
Electricity, gas, water and waste services
Electricity and gas 0.8 1.3 2.0 71.1 24.6 0.1 100.0
Water supply and waste services 4.1 1.1 1.3 49.0 44.4 0.1 100.0
Total 1.8 1.2 1.8 64.7 30.4 0.1 100.0
Information media and telecommunications Telecommunication services 0.3 0.7 1.2 56.6 39.1 2.0 100.0
Other 0.2 0.3 2.7 59.1 34.5 3.2 100.0
Total 0.3 0.5 2.1 58.0 36.4 2.7 100.0
Total infrastructure 1.5 2.2 1.4 53.6 30.1 11.3 100.0
Other industries 1.0 0.8 0.5 42.9 45.1 9.8 100.0
Total intermediate inputs 1.5 2.3 1.0 41.6 43.3 10.2 100.0
Note: Refers to 2008–09 input-output data. Supply of inputs includes domestic and imported products. np Not published.
Food and beverage products include alcohol and tobacco.
Source: Based on ABS, Australian National Accounts: Input-Output Tables – 2008–09, cat. no. 5209.0

Infrastructure and Australia’s food industry: Preliminary economic assessment
70
Appendix D Production and exports of key food commodities to 2050, by jurisdiction In this appendix, two sets of information are included.
Table D1 to Table D5 inclusive present the simple disaggregation of production and exports using the two approaches outlined in chapter 3. Substantial differences in the results produced by each approach indicate trends in the historic data.
Map D1 to Map D5 inclusive illustrate the SD level disaggregation of preliminary projected production and exports to 2050 alongside annual time series of historical production and exports from 1993–94 to 2010–11. These maps indicate existing growing regions. As assumed by the two simple approaches, increases in production to meet potential increases in global demand for Australian food exports would occur in the same regions as shown on the maps.
Table D1 Production and exports of wheat in 2050, average and trend approaches, by jurisdiction
Jurisdiction Annual
average 1993-94 to 2011-12 a
2050 estimates
Average approach
Trend approach
Assumed share Quantity Change
Assumed share Quantity Change
Mt % Mt % % Mt %
Production
New South Wales 5.7 27.4 7.6 34.2 29.8 8.3 46.0
Victoria 2.2 11.1 3.1 40.8 11.7 3.2 48.1
Queensland 1.2 5.9 1.6 39.3 6.1 1.7 45.6
South Australia 3.1 16.6 4.6 46.5 19.0 5.3 68.4
Western Australia 7.5 38.9 10.8 43.8 33.2 9.2 22.6
Australia 19.7 100.0 27.8 40.9 100.0 27.8 40.9
Exports
Australia 14.6 100.0 21.7 48.6 100.0 21.7 48.6
Note: Jurisdictions with less than 0.5% of national production have been excluded.
a Export annual averages only extend to 2010-11
Source: ABS, ABARES estimates

Infrastructure and Australia’s food industry: Preliminary economic assessment
71
Table D2 Production and exports of sugar in 2050, average and trend approaches, by jurisdiction
Jurisdiction
Annual average
1993-94 to 2010-11 a
2050 estimates
Average approach
Trend approach
Assumed share Quantity Change
Assumed share Quantity Change
Mt % Mt % % Mt %
Production
New South Wales 0.3 7 0.5 66 7 0.6 81
Queensland 4.5 93 7.2 57 93 7.1 57
Western Australia 0.02 0 0.03 56 0 0.02 15
Australia 4.9 100 7.7 58 100 7.7 58
Exports
Australia 3.8 NA 6.3 67 NA 6.3 67
Note: Jurisdictions with less than 0.5% of national production have been excluded
a Export annual averages include 2011-12
Source: ABS, ABARES estimates
Table D3 Production and exports of beef and veal in 2050, average and trend approaches, by jurisdiction
Jurisdiction
Annual average
1993-94 to 2010-11 a
2050 estimates
Average approach
Trend approach
Assumed share Quantity Change
Assumed share Quantity Change
Mt % Mt % % Mt %
Production
New South Wales 0.4 22 1.0 119 17 0.8 82
Victoria 0.4 18 0.8 119 16 0.8 113
Queensland 0.9 44 2.1 138 50 2.3 162
South Australia 0.1 4 0.2 123 3 0.2 111
Western Australia 0.1 7 0.3 127 7 0.3 132
Tasmania 0.0 2 0.1 129 2 0.1 138
Northern Territory 0.1 4 0.2 109 3 0.1 65
Australia 2.0 100 4.6 128 100 4.6 128
Exports b
Australia 0.0 0 0.0 0 0 0.0 0
Note: Jurisdictions with less than 0.5% of national production have been excluded
a Export annual averages include 2011-12 b Meat export figures are carcass equivalent
Source: ABS, ABARES estimates

Infrastructure and Australia’s food industry: Preliminary economic assessment
72
Table D4 Production and exports of sheep meat in 2050, average and trend approaches, by jurisdiction
Jurisdiction Annual
average 1993-94 to
2010-11 a
2050 estimates
Average approach
Trend approach
Assumed share Quantity Change
Assumed share Quantity Change
Mt % Mt % % Mt %
Production
New South Wales 0.1 24 0.2 53 20 0.2 28
Victoria 0.2 34 0.3 62 40 0.4 84
Queensland 0.0 3 0.0 21 2 0.0 -9
South Australia 0.1 15 0.2 61 18 0.2 83
Western Australia 0.1 21 0.2 46 17 0.2 25
Tasmania 0.0 2 0.0 66 2 0.0 90
Australia 0.6 100 1.0 55 100 1.0 55
Exports b
Australia 0.4 100 0.6 66 100 0.6 66
Note: Jurisdictions with less than 0.5% of national production have been excluded
a Export annual averages include 2011-12 b Meat export figures are carcass equivalent
Source: ABS, ABARES estimates
Table D5 Production and exports of dairy in 2050, average and trend approaches, by jurisdiction
Jurisdiction
Annual average
1993-94 to 2010-11 a
2050 estimates
Average approach
Trend approach
Assumed share Quantity Change
Assumed share Quantity Change
GL % GL % % GL %
Production
New South Wales 1.4 13 2.2 54 12 1.9 37
Victoria 5.9 63 10.4 78 66 10.9 86
Queensland 0.9 7 1.2 38 6 1.0 16
South Australia 0.6 7 1.1 74 6 1.0 60
Western Australia 0.4 4 0.6 49 3 0.5 15
Tasmania 0.6 7 1.1 94 8 1.3 130
Australia 9.7 100 16.6 70 100 16.6 70
Exports
Australia 0.8 100 2.0 161 100 2.0 161
Note: Jurisdictions with less than 0.5% of national production have been excluded
a Export annual averages include 2011-12
Source: ABS, ABARES estimates
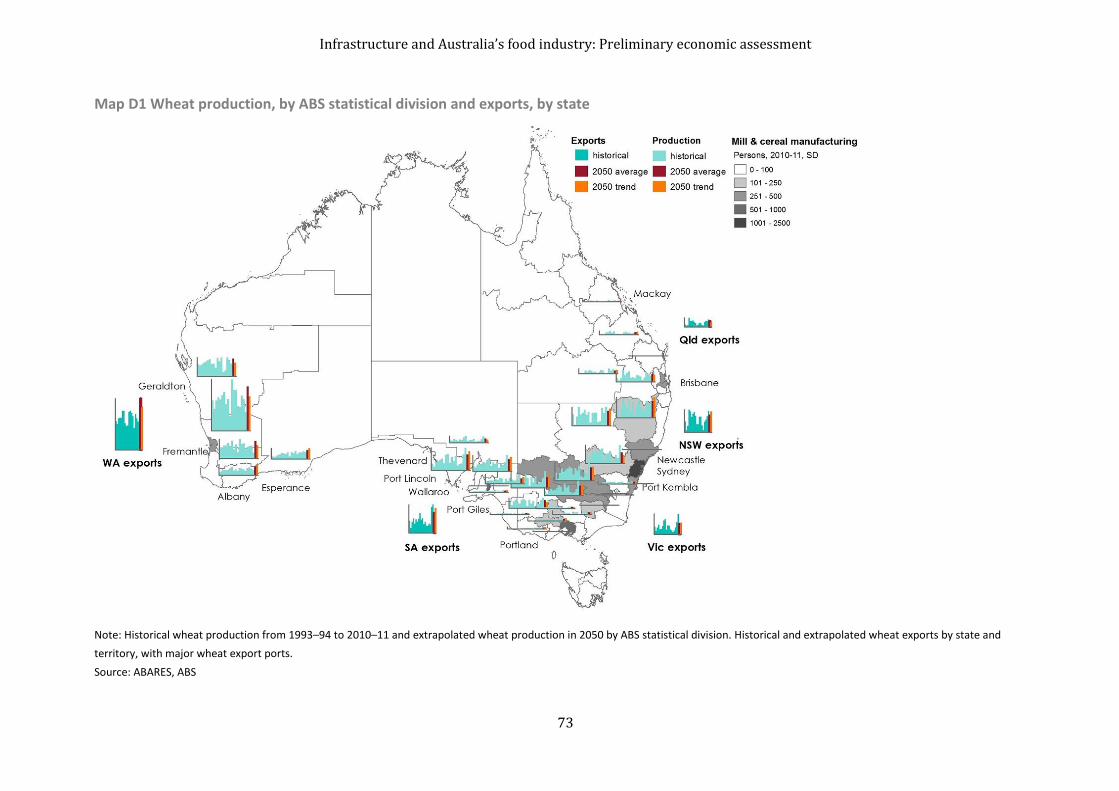
Infrastructure and Australia’s food industry: Preliminary economic assessment
73
Map D1 Wheat production, by ABS statistical division and exports, by state
Note: Historical wheat production from 1993–94 to 2010–11 and extrapolated wheat production in 2050 by ABS statistical division. Historical and extrapolated wheat exports by state and
territory, with major wheat export ports.
Source: ABARES, ABS

Infrastructure and Australia’s food industry: Preliminary economic assessment
74
Map D2 Sugar production by ABS statistical division and exports, by state
Note: Historical sugar production from 1993–94 to 2010–11 and extrapolated sugar production in 2050 by ABS statistical division.
Source: ABARES, ABS

Infrastructure and Australia’s food industry: Preliminary economic assessment
75
Map D3 Beef production, by statistical division and exports, by state
Note: Historical beef cattle turn-off from 1993–94 to 2010–11 and extrapolated production in 2050 by ABS statistical division. Historical and extrapolated beef and veal exports by state and
territory, with major export ports. Exports include carcass weight equivalent of live beef cattle exports. Meat manufacturing employment which covers manufacturing of all meats – beef, sheep,
goats and pigs overstates employment in beef and veal processing.
Source: ABARES, ABS

Infrastructure and Australia’s food industry: Preliminary economic assessment
76
Map D4 Sheep meat production by ABS statistical division and exports, by state
Note: Historical sheep meat production from 1993–94 to 2010–11 and extrapolated production in 2050 by ABS statistical division. Historical and extrapolated sheep meat exports by state and
territory, with major export ports. Exports include carcass weight equivalent of live sheep exports.
Source: ABARES, ABS
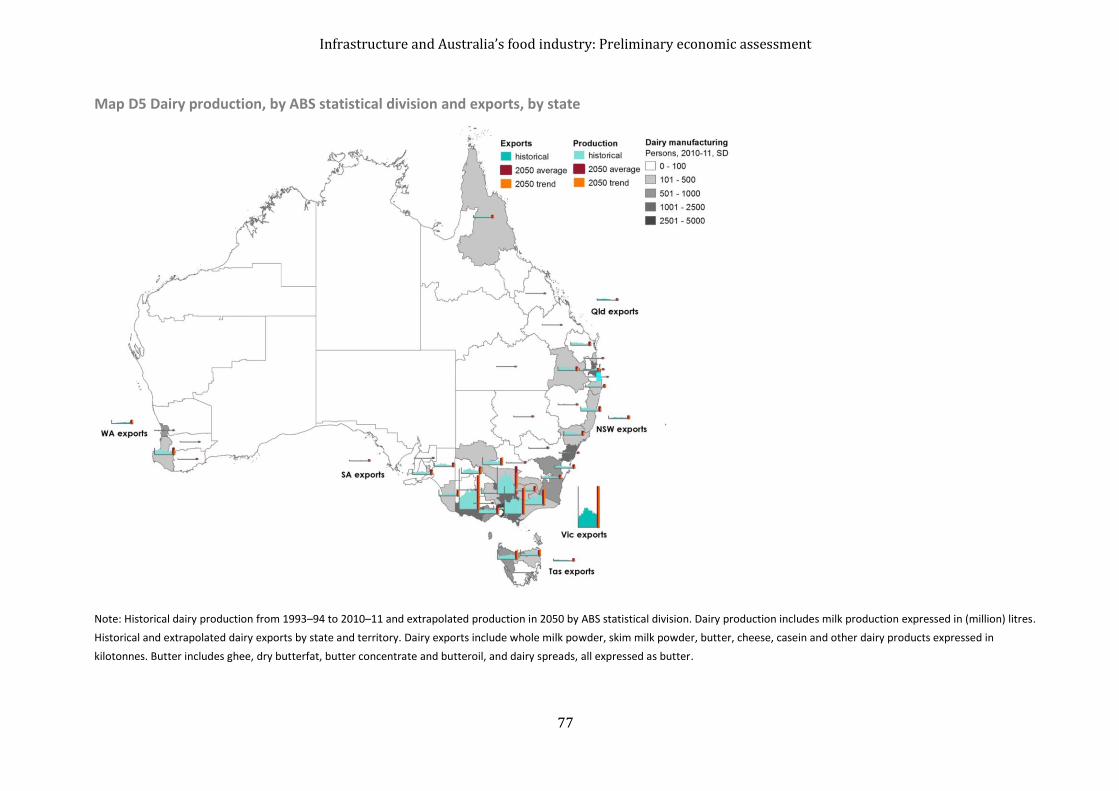
Infrastructure and Australia’s food industry: Preliminary economic assessment
77
Map D5 Dairy production, by ABS statistical division and exports, by state
Note: Historical dairy production from 1993–94 to 2010–11 and extrapolated production in 2050 by ABS statistical division. Dairy production includes milk production expressed in (million) litres.
Historical and extrapolated dairy exports by state and territory. Dairy exports include whole milk powder, skim milk powder, butter, cheese, casein and other dairy products expressed in
kilotonnes. Butter includes ghee, dry butterfat, butter concentrate and butteroil, and dairy spreads, all expressed as butter.

Infrastructure and Australia’s food industry: Preliminary economic assessment
78
Appendix E Public-private partnership arrangements Competitive pressures may be increased in infrastructure businesses, and hence industry costs
reduced, through various public-private partnership arrangements. Public-private partnerships
refer to arrangements where there is a mix in the roles of the public and private sectors. There
are several options that may be considered by governments to improve the efficiency of
infrastructure industries.
Delegated management options
Delegated management refers to the outsourcing of core activities whereby the government
maintains ownership of the infrastructure assets but management responsibilities (including
operations and maintenance) are delegated to private operators. Delegated management
options may be distinguished according to whether the government pays the private firm a set
fee (management contract) or the private firm pays the government a set fee (franchise).
Delegated management options may also be referred to broadly as concessions, although the
term concession is also used to refer to a specific type of franchise.
Management contract
Under a management contract, the owner of the infrastructure assets delegates the
responsibility for operations and maintenance to a private firm for a limited period (Dosi and
Easter 2003; Svendsen et al. 2003). The owner pays the private firm a set fee for providing these
services, and the standards of service quality and maintenance that must be achieved are
specified in the contract. An important feature of the management contract is that the private
firm does not bear any of the commercial risk associated with the activity, including system
operation and revenue collection.
Private firms compete to be awarded the management contract at which time there is a single
service provider for the duration of the contract.
Franchise
There are two main types of franchise—the operating concession and the concession. Under a
franchise arrangement, the owner of the infrastructure assets delegates management
responsibilities (including operations and maintenance) for a set period. Unlike the management
contract, the private firm pays the owner a set fee for the use of the facilities. The private firm
bears the commercial risks of service provision and revenue collection (OECD 2004; Dosi and
Easter 2003; Svendsen et al. 2003).
A franchise arrangement may also include additional obligations to invest in upgrading the
infrastructure with private financing (Svendsen et al. 2003; Bakker 2003). When the owner
maintains responsibility for capital investment, the arrangement may be referred to as an
operating concession (or ‘affirmage’). When the private firm is responsible for the financing and
risks of investment in infrastructure, the arrangement may be referred to as a concession.
Other public-private partnership arrangements
Several other public-private partnership options have emerged, particularly since the 1980s
when governments became increasingly concerned about reducing public sector debt levels. A

Infrastructure and Australia’s food industry: Preliminary economic assessment
79
major focus in these options is to undertake infrastructure projects with private sector
financing.
The key objective in most public-private partnership arrangements has been to ensure that
infrastructure projects are completed with private sector financing and ownership control for a
period of time (Malone 2005). These public-private partnerships typically include government
support through contributions such as land, and capital and operating costs may be paid for by
either a government payment stream or user charges, or some combination of both.
Infrastructure projects under public-private partnership arrangements generally involve high
capital costs, long contract periods and risk sharing between the public and private sectors.
Public-private partnership arrangements are named to reflect private sector responsibilities
and, as given in Malone (2005), include the following:
DBFO (Design, Build, Finance, Operate) or DBO (Design, Build, Operate)—the government purchases the facility from the developer for a price that is agreed to prior to (or immediately after) commissioning, and the government takes all ownership risks from that time.
BOT (Build, Operate, Transfer)—the government owns the facility that is constructed, financed, operated and maintained by the private sector party who receives a fee for the service from the users (similar to a concession, but applies to greenfield projects).
BOOT (Build, Own, Operate, Transfer)—the service provider returns the facility to the government at the end of a specified period.
BOM (Build, Own, Maintain)—the government leases the facility from a private owner (for example, buildings owned in the private sector may be leased for use by the public sector).
BOO (Build, Own, Operate)—the service provider maintains ownership of the facility in perpetuity, while the government agrees to purchase the services for a fixed period.
An important issue regarding public-private partnership arrangements is the need for
governments to assess carefully the potential costs and, in particular, the risk exposure of
governments. The experience in various infrastructure markets is relevant in any economic
assessment of this commercialisation option. For example, the development of public-private
partnerships for the provision of road infrastructure in Australia is examined in Brown (2005).

Infrastructure and Australia’s food industry: Preliminary economic assessment
80
References ABARE 2007, Benefits of adjustment in Australia's sheep industry, Australian Lamb 07.1,
Canberra, April.
ABARES 2013, Agricultural commodities, vol. 3, no. 2, June quarter, Canberra.
——2012, Agricultural commodity statistics 2012, Canberra, December.
ABS (Australian Bureau of Statistics) 2013a, Regional Population Growth, Australia, 2011–12,
Canberra, April, available at abs.gov.au/ausstats/[email protected]/mf/3218.0/.
——2013b, Engineering Construction Activity, Australia, March 2013, Canberra, July, available at
abs.gov.au/ausstats/[email protected]/mf/8762.0.
——2012a, Australian System of National Accounts Concepts, Sources and Methods Australia
2012, Canberra, available at
abs.gov.au/AUSSTATS/[email protected]/DetailsPage/5216.0Edition%203?OpenDocument.
——2012b, Agricultural Census 2011, Canberra, available at
abs.gov.au/websitedbs/c311215.nsf/web/agriculture+-+agricultural+census.
——2010, Australian Commodities, Australia, 2008– 09, Canberra, available at
abs.gov.au/AUSSTATS/[email protected]/allprimarymainfeatures/AB329C57FBDF7C8CCA25786C0015
889C?opendocument.
Agriculture and Food Policy Reference Group 2006, Creating our future: Agriculture and food
policy for the next generation, Report to the Minister for Agriculture, Fisheries and Forestry,
Canberra, February.
Alexander, F & Kokic, P 2005, Productivity in the Australian Grains Industry, ABARE report for
Grains Research and Development Corporation, Canberra.
Allen Consulting Group 2009, Options for improving the integration of road governance in
Australia, report to Infrastructure Australia, August, available at
infrastructureaustralia.gov.au/publications/files/Roads_governance_report.pdf.
Ashton, D & Mackinnon, D 2008, Australian dairy industry: Use of technology and management
practices on dairy farms, ABARE research report 08.12, Canberra, December.
Australian Government 2008, Bumblebees rejected for live export, media release 2008-10-26,
available at environment.gov.au/minister/archive/env/2008/mr20081026.html.
Australian Sugar Milling Council 2012, Annual review 2012, Australian Sugar Milling Council,
Brisbane available at
asmc.com.au/attachments/35808%20ASMC%20Annual%20Review%20Final_lowres.pdf.
AusVeg, 2013 Industry statistics, AusVeg, Camberwell Victoria, available at
ausveg.com.au/resources/industrystatistics.htm.
Bakker, K 2003, Good governance in restructuring water supply: A handbook, Federation of
Canadian Municipalities, Ontario, available at
ww7b.org/userfile/file/good_governance_WaterSupply.pdf.

Infrastructure and Australia’s food industry: Preliminary economic assessment
81
Banks, G 2002, Regulating Australia’s infrastructure: looking forward, Chairman, Productivity
Commission presentation to the Financial Review and the Australian Council for Infrastructure
Development, National Infrastructure Summit, Melbourne, 14–15 August.
Bartos, S, Balmford, M, Karolis, A, Swansson, J & Davey, A 2011, Resilience in the Australian food
supply chai’, summary of a report by Sapere Research Group, Australian food statistics 2010–11,
Canberra.
——2012, Resilience in the Australian food supply chain, report by the Sapere Research Group for
Department of Agriculture, Fisheries and Forestry, Canberra, February available at
daff.gov.au/__data/assets/pdf_file/0009/1915290/resilience-food-supply.pdf.
Binks, B, Martin, P, Corrie, K, Franks, I & Mazur, K 2013, Agriculture, Fisheries and Forestry in the
Coffs Harbour–Grafton region of New South Wales 2013, ABARES About my region, 13.4,
Canberra, May.
BITRE 2012, Yearbook 2012: Australian Infrastructure Statistics, Statistical Report, Bureau of
Infrastructure, Transport and Regional Economics, Canberra available at
bitre.gov.au/publications/2012/files/stats_002.pdf.
——2011, Truck productivity: sources, trends and future prospects, BITRE report 123, Bureau of
Infrastructure, Transport and Regional Economics, Canberra, March available at
bitre.gov.au/publications/2011/files/report_123.pdf.
——2006, Optimising harmonisation in the Australian railway industry, BITRE Report 114,
Bureau of Infrastructure, Transport and Regional Economics, Canberra, September available at
bitre.gov.au/publications/2006/files/report_114.pdf.
Brown, C 2005, Financing transport infrastructure: for whom the road tolls, Australian Economic
Review, vol. 38, no. 4, pp. 431–8.
Caboche, T & Thompson, T 2013, Australian lamb: Financial performance of slaughter lamb
producing farms 2010–11 to 2012–13, ABARES research report 13.7, Canberra, June.
Chan, C, Forwood, D, Roper, H, & Sayers, C 2009, Public Infrastructure Financing — An
International Perspective, Productivity Commission Staff Working Paper, March 2009 available
at pc.gov.au/research/staff-working/public-infrastructure-financing.
CSIRO & BoM 2007, Climate change in Australia: technical report 2007, Commonwealth Science
and Industrial Research Organisation and Bureau of Meteorology, Melbourne available at
climatechangeinaustralia.gov.au/technical_report.php.
CSIRO, BoM & DCCEE 2013, Australia’s future climate: National temperature change 2050 annual,
Commonwealth Science and Industrial Research Organisation, Bureau of Meteorology and
Department of Climate Change and Energy Efficiency, Canberra, available at
climatechangeinaustralia.gov.au/nattemp10.php.
DAFF (Australian Government Department of Agriculture, Fisheries and Forestry) 2013,
Australian food statistics 2011–12, Canberra available at daff.gov.au/agriculture-
food/food/publications/afs/australian-food-statistics-2011-12.
——2012a, Red meat statistics, Canberra, July, available at daff.gov.au/agriculture-food/meat-
wool-dairy/quota/red-meat/statistics.

Infrastructure and Australia’s food industry: Preliminary economic assessment
82
——2012b, FOODmap: An analysis of the Australian food supply chain, Canberra, July available at
daff.gov.au/agriculture-food/food/publications/foodmap-a-comparative-analysis.
Dahl, A, Leith, R & Grey, E 2013, Productivity in the broadacre and dairy industries, Australian
Commodities, vol. 3, no.1, ABARES, Canberra, March.
Dairy Australia 2010, Annual report 2010–11, Dairy Australia, Melbourne, October available at
dairyaustralia.com.au/Industry-overview/About-Dairy-
Australia/~/media/Documents/Industry%20overview/About%20Dairy%20Australia/Annual
%20report/2011/DA%20Annual%20Report%202010-2011.pdf.
Dharma, S, Shafron, W & Oliver, M 2012, Australian dairy: Farm technology and management
practices 2010–11, ABARES research report, Canberra, August.
Dosi, C & Easter, KW 2003, Market failure and role of markets and privatization in alleviating
water scarcity, International Journal of Public Administration, vol. 26, no. 3, pp. 265–90.
Dunlop M, Turner GM & Howden, SM 2004, Future sustainability of the Australian grains industry,
CSIRO Sustainable Ecosystems, Canberra.
Engineering Australia 2010, Australia infrastructure report card 2010, available at
engineersaustralia.org.au/infrastructure-report-card.
Ernst & Young 2012, Strong foundations for sustainable local infrastructure: Connecting
communities, projects, finance and funds, Melbourne, available at
regional.gov.au/local/lgifr/files/20120622-strong-foundations.pdf.
Gleeson, T, Martin, P & Mifsud, C 2012, Northern Australia beef industry: Assessment of risks and
opportunities, ABARES report to client prepared for the Northern Australia Ministerial Forum,
Canberra, May.
Henry, K, Harmer, J, Piggott, J, Ridout, H & Smith, G 2009, Australia’s Future Tax System: Report to
the Treasurer, Canberra, December, available at
taxreview.treasury.gov.au/Content/Content.aspx?doc=html/home.htm.
HLPE 2011, Price Volatility and Food Security, a report by the High Level Panel of Experts on
Food Security and Nutrition of the Committee on World Food Security, Rome, available at
fao.org/cfs/cfs-hlpe/en/.
Hogan, L & Morris, P 2010, Agricultural and food policy choices in Australia, ABARE-BRS
Conference Paper 10.15, presented at Sustainable Agriculture and Food Policy in the 21st
Century: Challenges and Solutions conference convened by the Australian National University,
26–27 October 2010, Brussels, Belgium.
Hogan, L & Thorpe, S 2009, Issues in food miles and carbon labelling, ABARE research report
09.18, Canberra, December.
Hooper, S 2008, Financial performance of Australian cane sugar producers 2005–06 to 2007–08,
ABARE research report 0.8.8, ABARE, Canberra.
Hughes, N, Lawson, K, Davidson, A, Jackson, T & Sheng, Y 2011, Productivity pathways: climate
adjusted production frontiers for the Australian broadacre cropping industry, ABARES research
report 11.5, Canberra.

Infrastructure and Australia’s food industry: Preliminary economic assessment
83
Infrastructure Australia 2013, National infrastructure plan June 2013, Canberra available at
infrastructureaustralia.gov.au/coag/.
Jacobs, JW & Howe, CW 2005, Key issues and experience in US water services privatization, Water
Resources Development, vol. 21, no. 1, pp. 89–98.
Linehan, V, Thorpe, S, Andrews, N, Kim, Y & Beaini, F 2012a, Food demand to 2050: Opportunities
for Australian agriculture, ABARES conference paper 12.4, Canberra, March.
Linehan, V, Thorpe, S, Andrews, N & Beaini, F 2012b, Food demand to 2050: opportunities for
Australian agriculture—algebraic description of agrifood model, technical annex to ABARES
Outlook conference paper, Canberra, May.
Linehan, V, Thorpe, S, Gunning-Trant, C, Heyhoe, E, Harle, K, Hormis, M & Harris-Adams, K 2013,
Global food production and prices to 2050: scenario analysis under policy assumptions, ABARES
conference paper 13.6, Canberra, March.
Malone, N 2005, The evolution of private financing of government infrastructure in Australia –
2005 and beyond, Australian Economic Review, vol. 38, no. 4, pp. 420–30.
MLA 2012, Australia’s sheepmeat industry, fast facts 2012, Meat and Livestock Australia, Sydney
available at mla.com.au/files/a3a51ee9-e819-4a8f-8056-a111010381c2/.
National Farmers Federation (NFF) 2013, Blueprint for Australian Agriculture 2013–2020,
National Farmers Federation and Sefton & Associates, Canberra, available at
nff.org.au/blueprint.html.
NTC (National Transport Commission) 2009a, Supply chain pilots: draft position paper,
Melbourne, March available at ntc.gov.au/DocView.aspx?DocumentId=1830.
——2009b, Pilot supply chain studies – grain & livestock: Stage two – final report, Melbourne,
February available at ntc.gov.au/DocView.aspx?DocumentId=1836.
——2009c, Capacity constraints & supply chain performance – intermodal: Final report – towards
co-modalism, Melbourne, January available at ntc.gov.au/DocView.aspx?DocumentId=1837.
——2008, Livestock & meat supply chain pilot study. Stage one final report, Melbourne, December
available at ntc.gov.au/DocView.aspx?DocumentId=1835.
Nossal, K, Sheng, Y, & Zhao, S 2008, Productivity in the beef cattle and slaughter lamb industries,
ABARE research report 08.13 for Meat and Livestock Australia, Canberra, December.
Nossal, K, Zhao, S, Sheng, EY & Gunasekera, D 2009, Productivity movements in Australian
agriculture, Australian commodities, vol. 16, no. 1, pp.206–16.
OECD 2004, Competition and regulation in the water sector, Organisation for Economic Co-
operation and Development, Paris, August available at
oecd.org/regreform/sectors/33691325.pdf.
Port Jackson Partners 2012, Greener pastures: The global soft commodity opportunity for
Australia and New Zealand, ANZ Insight, Issue 3, October available at media.corporate-
ir.net/media_files/IROL/24/248677/ANZ_insight_3_Greener_Pastures.pdf.
Penm, J, Rees, G & Moir, B 2010, Proportion of agricultural and food production exported,
Australian commodities, vol. 17, no. 4, December quarter, pp. 646–49.

Infrastructure and Australia’s food industry: Preliminary economic assessment
84
PC (Productivity Commission) 2013, National access regime, Draft report, Canberra, May,
available at www.pc.gov.au/projects/inquiry/access-regime/draft.
——2011a, Annual review of regulatory burdens on business: identifying and evaluating
regulation reforms, Issues paper, Melbourne, available at pc.gov.au/projects/study/regulation-
reforms.
——2011b, Economic regulation of airport services, Inquiry report no. 57, Melbourne, December.
——2010, Wheat export marketing arrangements, report no. 51, Canberra, available at
pc.gov.au/projects/inquiry/wheat-export.
——2009a, Performance benchmarking of Australian and New Zealand business regulation: food
safety, Research report, Melbourne, available at pc.gov.au/projects/study/regulation-
benchmarking/food-safety.
——2009b, Annual review of regulatory burdens on business: social and economic infrastructure
services, Research report, Canberra, available at pc.gov.au/projects/study/regulatory-
burdens/social-economic-infrastructure.
——2008, Submission to Infrastructure Australia’s National Infrastructure Audit, Submission,
Canberra, September, available at
pc.gov.au/__data/assets/pdf_file/0006/89520/infrastructure.pdf.
——2006, Road and rail freight infrastructure pricing, Inquiry Report, Canberra, September,
available at pc.gov.au/projects/inquiry/freight/docs/finalreport.
——2005, Review of National Competition Policy reforms, Inquiry report no. 33, Melbourne,
available at pc.gov.au/projects/inquiry/national-competition-policy/docs/finalreport.
PwC 2011, The Australian dairy industry: the basics, available at
pwc.com.au/industry/agribusiness/assets/Australian-Dairy-Industry-Nov11.pdf (pdf 1.53mb).
Rabobank 2013, Global sugar to 2021– Rabobank identifies long-term prospects for industry
production, consumption and trade, press release, Sydney, June, available at
rabobank.com.au/News-and-Events/Media-Releases/2013-NewsArchive/Pages/media-release-
20130617.aspx.
Sheng, Y, Zhao, S & Nossal, K 2011, Productivity and farm size in Australian agriculture:
reinvestigating the returns to scale, ABARES conference paper 11.06, Canberra, February.
Svendsen, M, Gonzalez, F & Johnson, S 2003, Privatizing canal irrigation, Irrigation and Drainage,
vol, 52, pp. 95–108.
Thompson, T & Martin, P 2012, Australian beef: Financial performance of beef cattle producing
farms, 2009–10 to 2011–12, ABARES, Canberra.
Trestrail, C, Martin, P, Corrie, K, Franks, I & Mazur, K 2013a, Agriculture, Fisheries and Forestry in
the Townsville region of Queensland 2013, ABARES About my region, 13.33, Canberra, May.
——2013b, Agriculture, fisheries and forestry in the Mackay region of Queensland 2013, ABARES
About my region, 13.29, Canberra, May.
——2013c, Agriculture, fisheries and forestry in the Cairns region of Queensland 2013, ABARES
About my region, 13.25, Canberra, May.

Infrastructure and Australia’s food industry: Preliminary economic assessment
85
Tulloh, C & Pearce, D 2011, Transport infrastructure for Australia’s agricultural needs, RIRDC,
Canberra, November, available at rirdc.infoservices.com.au/items/11-096.
UN (United Nationa) 2011, World population prospects, the 2010 revision, New York, April,
available at un.org/en/development/desa/publications/world-population-prospects-the-2010-
revision.html.
Vic. DPI 2013, Victoria’s beef cattle industry, Department of Environment and Primary Industries,
Victoria, Melbourne, January, available at dpi.vic.gov.au/agriculture/beef-and-sheep/beef/beef-
cattle-industry.
Woodhead, A, Quirk, R, Cunningham, D, Malcolm, G & Lamb, B 2006, Sugar link: towards a
sustainable sugar supply chain, Bureau of Rural Sciences, Canberra, available at
linkstrategy.com.au/uploads/file/sugerlink.pdf.