information incorporated by reference to the listing ... · nokia corporation interim report...
TRANSCRIPT

Information incorporated by reference
to the Listing Prospectus dated October 23, 2015,
as supplemented on November 16, 2015,
on February 2, 2016 and on February 12, 2016
The unaudited interim report of Nokia for the year ended December 31, 2015...............1–52

Nokia Corporation Interim Report February 11, 2016 1
No
kia
N
etw
ork
s O
utl
oo
k
Ye
ar
to d
ate
C
ash
& C
ash
flo
w
Te
ch
no
log
ies
Fin
an
cia
l ta
ble
s
Report for Q4 and Full Year 2015 Continuation of strong operational performance in Nokia
Networks and solid growth in Nokia Technologies
Financial highlights for Nokia’s continuing operations ● Net sales of EUR 3.6 billion in Q4 2015 (EUR 3.5 billion in Q4 2014) and EUR 12.5 billion in full year 2015 (EUR 11.8 billion
in full year 2014).
● Q4 2015 non-IFRS diluted EPS of EUR 0.15 (EUR 0.09 in Q4 2014), an increase of 67% year-on-year. Q4 2015 diluted
EPS of EUR 0.13 (EUR 0.08 in Q4 2014).
● Full year 2015 non-IFRS diluted EPS of EUR 0.36 (EUR 0.27 in full year 2014), an increase of 33% year-on-year. Full year
2015 diluted EPS of EUR 0.31 (EUR 0.67 in full year 2014, benefitting from the recognition of a deferred tax asset).
● Nokia’s Board of Directors will propose a dividend of EUR 0.16 per share for 2015 and a special dividend of EUR 0.10 per
share (dividend of EUR 0.14 per share for 2014). Proposed dividend is estimated to result in a maximum payout of
approximately EUR 960 million in dividend and EUR 600 million in special dividend1.
Nokia Networks
● 5% year-on-year net sales decrease in Q4 2015 and 3% net sales growth in full year 2015. On a reported basis, Greater
China and Middle East & Africa were the strongest regions. On a constant currency basis, 12% year-on-year net sales
decrease in Q4 2015 and 6% net sales decrease in full year 2015.
● Strong non-IFRS gross margin of 39.6% in Q4 2015 primarily due to elevated levels of software in Mobile Broadband,
partially offset by the absence of non-recurring intellectual property rights net sales which benefitted Q4 2014. ● Strong non-IFRS operating margin of 14.6% in Q4 2015. Nokia Networks delivered full year financial results towards the
high end of its original 2015 targets, with a non-IFRS operating margin of 10.9% in full year 2015, through strong
operational performance and continued focus on execution excellence.
Nokia Technologies
● 170% year-on-year net sales growth in Q4 2015 and 77% net sales growth in full year 2015. On a year-on-year basis,
non-IFRS operating profit grew 318% in Q4 2015 and 102% in full year 2015, primarily related to the growth in net
sales resulting from a settled arbitration. This was partially offset by higher non-IFRS operating expenses.
Reported fourth quarter 2015 results2 Reported January-December
2015 results2
EUR million (except for EPS in EUR) Q4'15 Q4'14 YoY
change Q3'15
QoQ
change
Q1-
Q4'15
Q1-
Q4'14
YoY
change
Continuing operations
Net sales – constant currency (3)% 18% (2)%
Net sales 3 609 3 510 3% 3 036 19% 12 499 11 763 6%
Nokia Networks 3 210 3 365 (5)% 2 877 12% 11 490 11 198 3%
Nokia Technologies 403 149 170% 162 149% 1 024 578 77%
Gross margin % (non-IFRS) 46.4% 40.8% 560bps 42.7% 370bps 43.3% 41.7% 160bps
Operating profit (non-IFRS) 734 503 46% 475 55% 1 949 1 600 22%
Nokia Networks 468 470 0% 391 20% 1 257 1 364 (8)%
Nokia Technologies 322 77 318% 94 243% 720 357 102%
Group Common Functions (56) (43) (10) (28) (120)
Operating margin % (non-IFRS) 20.3% 14.3% 600bps 15.6% 470bps 15.6% 13.6% 200bps
Profit (non-IFRS) 575 331 74% 297 94% 1 392 1 058 32%
Profit 499 325 54% 188 165% 1 194 2 718 (56)%
EPS, EUR diluted (non-IFRS) 0.15 0.09 67% 0.08 87% 0.36 0.27 33%
EPS, EUR diluted 0.13 0.08 63% 0.05 160% 0.31 0.67 (54)%

Nokia Corporation Interim Report February 11, 2016 2
No
kia
N
etw
ork
s O
utl
oo
k
Ye
ar
to d
ate
C
ash
& C
ash
flo
w
Te
ch
no
log
ies
Fin
an
cia
l ta
ble
s
EUR million (except for EPS in EUR) Q4'15 Q4'14 YoY
change Q3'15
QoQ
change
Q1-
Q4'15
Q1-
Q4'14
YoY
change
Discontinued operations2
Net sales 242 298 (19)% 283 (14)% 1 075 3 427 (69)%
Profit 1 292 120 977% (37) (3 592)% 1 274 758 68%
EPS, EUR diluted 0.33 0.03 1 000% (0.01) (3 400)% 0.32 0.18 78%
1 Estimated total dividend amounts of EUR 960 million payable as dividend and EUR 600 million payable as special dividend are calculated assuming full
ownership of all Alcatel-Lucent outstanding shares and conversion of all Alcatel-Lucent convertible bonds, resulting in a total of approximately 6 billion Nokia
shares.
2 Results are as reported unless otherwise specified. The results information in this report is unaudited. Nokia reports HERE as part of discontinued operations
from the third quarter 2015 until completion of the sale on December 4, 2015. Non-IFRS results exclude the gains from both the sale of substantially all of
Nokia’s Devices & Services business to Microsoft (“Sale of the D&S Business”), as well as the sale of the HERE business net of transaction and other related
costs resulting from these transactions. In addition, non-IFRS results exclude costs related to the Alcatel-Lucent transaction. Furthermore, non-IFRS results
exclude goodwill impairment charges, intangible asset amortization and purchase price related items, restructuring related costs, and certain other items that
may not be indicative of Nokia’s underlying business performance. For details, please refer to the year to date discussion and the non-IFRS to reported
reconciliation note to the financial statements. A reconciliation of the Q3 2015 non-IFRS results to the reported results can be found on page 31 in the
complete Q3 2015 interim report with tables published on October 29, 2015. A reconciliation of the Q4 2014 non-IFRS results to the reported results can be
found on pages 20-25 in the complete report for Q4 2014 and full year 2014 with tables published on January 29, 2015.
Nokia completes the sale of its HERE business in Q4 2015
Nokia completed on December 4, 2015 the sale of its HERE digital mapping and location services business to a consortium
of leading automotive companies, comprising AUDI AG, BMW Group and Daimler AG.
The transaction, which was originally announced on August 3, 2015, valued HERE at an enterprise value of EUR 2.8 billion,
subject to certain purchase price adjustments. Nokia received net proceeds of approximately EUR 2.55 billion from the
transaction, which is consistent with Nokia's earlier estimated net proceeds of slightly above EUR 2.5 billion. In Q4 2015
Nokia booked a gain on the sale and a related release of cumulative foreign exchange translation differences totaling
approximately EUR 1.1 billion as a result of the transaction. The gain was reported as part of discontinued operations.
Subsequent event
On February 10, 2016, Nokia announced the results of its successful reopened public exchange offer for Alcatel-Lucent
securities. Nokia will hold 91.25% of the share capital of Alcatel-Lucent, following the settlement of the securities
tendered into the reopened offer, which is expected to occur on February 12, 2016. This equates to Nokia holding
88.07% of the share capital of Alcatel-Lucent on a fully diluted basis.
Nokia confirmed that it will issue approximately 321 million new shares as consideration for the Alcatel-Lucent securities
that have been tendered into the reopened public exchange offer. Nokia expects to register these new shares with the
Finnish Trade Register on February 12, 2016. After the registration, the total number of Nokia shares will equal
approximately 5 769 million shares.
Assuming the conversion of all remaining outstanding Alcatel-Lucent shares and convertible bonds into Nokia shares at
the exchange ratio offered in the public exchange offers, the total number of Nokia shares would equal approximately 6
billion shares.
As of the first quarter 2016, we expect to align our financial reporting under two areas: the Networks business and Nokia
Technologies. The Networks business will be comprised of four business groups: Mobile Networks, Fixed Networks,
Applications & Analytics and IP/Optical Networks. Nokia Technologies will continue to operate as a separate business
group, with a clear focus on licensing and the incubation of new technologies, and will include the licensing and intellectual
property portfolio management operations from Alcatel-Lucent. In addition, Nokia expects to operate the undersea
cables business, Alcatel-Lucent Submarine Networks (ASN), and the antenna systems business, Radio Frequency Systems
(RFS), as separate entities and plans to report ASN and RFS as part of Group Common Functions.

Nokia Corporation Interim Report February 11, 2016 3
No
kia
N
etw
ork
s O
utl
oo
k
Ye
ar
to d
ate
C
ash
& C
ash
flo
w
Te
ch
no
log
ies
Fin
an
cia
l ta
ble
s
CEO statement 2015 was another year of dramatic transformation for Nokia and I am pleased that in the midst of all this
change we were able to close the year with solid performances at both Nokia Networks and Nokia
Technologies.
Nokia Networks delivered on its commitments for the full year, with a non-IFRS operating margin at the high
end of the original guidance range and net sales up three percent on a reported currency basis. Pleasingly,
both Mobile Networks and Global Services capped off the year with good fourth quarter results.
Nokia Technologies saw its net sales and operating profit grow considerably, based on strong licensing
growth including a contribution from the arbitration award related to our licensing agreement with Samsung.
We have said consistently that we believe that our portfolio of innovation and intellectual property is second
to none in the industry and that it has significant value that can be monetized. We expect to have further
discussions with Samsung related to intellectual property and technology assets that were not covered by the
arbitration process and will continue to pursue new licensing opportunities in a variety of sectors over the
course of 2016 and beyond.
I was particularly pleased with our progress towards completing the Alcatel-Lucent transaction in the fourth
quarter, culminating with the start of combined operations in early January. Our work as a combined company
has gotten off to a strong start. Teams are preparing joint bids, we are working closely with our customers to
ensure we can make fast and effective decisions about overlapping areas of our portfolio, and we are on
target to deliver on our previously announced synergy savings.
While the competitive environment in Networks remained generally stable in the fourth quarter, we do expect
some market headwinds in 2016 as 4G/LTE rollouts in China and some other markets start to slow. The first
quarter, in particular, looks quite challenging as customers assess their CAPEX plans in light of increasing
macro-economic uncertainty. In this environment, we will continue our sharp focus on operational and
commercial discipline, ensure we deliver synergies as quickly as possible, and focus our energy on targeting
the growth segments within the overall telecom market.
Rajeev Suri
President and CEO
Net sales Operating profit (non-IFRS)
0%
5%
10%
15%
20%
25%
30%
35%
40%
45%
50%
0M
€ 500M
€1 000M
€1 500M
€2 000M
€2 500M
€3 000M
€3 500M
€4 000M
Q4'14 Q1'15 Q2'15 Q3'15 Q4'15
€0
€0.02
€0.04
€0.06
€0.08
€0.10
€0.12
€0.14
€0.16
€(100)M
0M
€100M
€200M
€300M
€400M
€500M
€600M
€700M
€800M
€900M
Q4'14 Q1'15 Q2'15 Q3'15 Q4'15
Margin EPS
Nokia Technologies
Nokia Networks Operating margin % (non-IFRS)
Gross margin % (non-IFRS) Nokia Technologies
Nokia Networks Group Common Functions
EPS diluted (non-IFRS)

Nokia Corporation Interim Report February 11, 2016 4
No
kia
N
etw
ork
s O
utl
oo
k
Ye
ar
to d
ate
C
ash
& C
ash
flo
w
Te
ch
no
log
ies
Fin
an
cia
l ta
ble
s
Nokia’s continuing operations in Q4 2015 Financial discussion The following discussion is of Nokia's continuing operations reported results for the fourth quarter 2015, which comprise
the results of Nokia’s two continuing businesses – Nokia Networks and Nokia Technologies, as well as Group Common
Functions. Comparisons are given to the fourth quarter 2014 and third quarter 2015 results, unless otherwise indicated.
Net sales
Nokia’s continuing operations net sales increased 3% year-on-year and increased 19% sequentially. On a constant
currency basis, Nokia’s continuing operations net sales would have decreased 3% year-on-year and would have increased
18% sequentially.
Year-on-year discussion
The year-on-year increase in Nokia’s continuing operations net sales in the fourth quarter 2015 was primarily due to
growth in Nokia Technologies, partially offset by lower net sales in Nokia Networks.
Sequential discussion
The sequential increase in Nokia’s continuing operations net sales in the fourth quarter 2015 was primarily due to growth
in both Nokia Networks and Nokia Technologies.
Non-IFRS Operating profit
Year-on-year discussion
Nokia’s continuing operations non-IFRS operating profit increased 46% year-on-year in the fourth quarter 2015, primarily
due to higher non-IFRS operating profit in Nokia Technologies, partially offset by higher non-IFRS operating loss in Group
Common Functions. Please see the Nokia Networks and Nokia Technologies sections for the non-IFRS operating profit
discussions. The higher non-IFRS operating loss in Group Common Functions was primarily due to a net negative
fluctuation in other income and expenses, partially offset by lower operating expenses.
On a year-on-year basis Group Common Functions non-IFRS other income and expenses was an expense of EUR 21 million
in fourth quarter 2015, compared to an expense of EUR 8 million in the fourth quarter 2014. Within Group Common
Functions, Nokia recorded a loss of approximately EUR 20 million in fourth quarter 2015 related to the sale of certain of
Nokia’s investments made through its venture funds.
On a year-on-year basis, foreign exchange fluctuations had a positive impact on non-IFRS gross profit, and a negative
impact on non-IFRS operating expenses, resulting in a slightly positive net impact on non-IFRS operating profit in the
fourth quarter 2015.
Sequential discussion
Nokia’s continuing operations non-IFRS operating profit increased 55% sequentially in the fourth quarter 2015, primarily
due to higher non-IFRS operating profit in Nokia Technologies and Nokia Networks, partially offset by higher non-IFRS
operating loss in Group Common Functions. Please see the Nokia Networks and Nokia Technologies sections for the non-
IFRS operating profit discussions. The higher non-IFRS operating loss in Group Common Functions was primarily due to a
net negative fluctuation in other income and expenses and, to a lesser extent, higher operating expenses.
On a sequential basis Group Common Functions non-IFRS other income and expenses was an expense of EUR 21 million in
the fourth quarter 2015, compared to income of EUR 17 million in the third quarter 2015. Within Group Common
Functions, Nokia recorded a loss of approximately EUR 20 million in the fourth quarter 2015 related to the sale of certain
of Nokia’s investments made through its venture funds. This compares to a gain of approximately EUR 10 million in the
third quarter 2015.
On a sequential basis, foreign exchange fluctuations had a slightly positive impact on non-IFRS gross profit, and a slightly
negative impact on non-IFRS operating expenses, resulting in a slightly negative net impact on non-IFRS operating profit
in the fourth quarter 2015.
Non-IFRS Profit Year-on-year discussion
Nokia’s continuing operations non-IFRS profit increased 74% on a year-on-year basis in the fourth quarter 2015, primarily
due to higher non-IFRS operating profit.

Nokia Corporation Interim Report February 11, 2016 5
No
kia
N
etw
ork
s O
utl
oo
k
Ye
ar
to d
ate
C
ash
& C
ash
flo
w
Te
ch
no
log
ies
Fin
an
cia
l ta
ble
s
Nokia’s continuing operations non-IFRS tax rate in the fourth quarter 2015 was approximately 19%, compared to a rate of
approximately 27% in the fourth quarter 2014. In the fourth quarter 2015, non-IFRS tax expense benefitted from the
utilization of unrecognized deferred tax assets on previous losses related to Nokia’s ownership interests in certain
unlisted technology-related funds.
Sequential discussion
Sequentially, Nokia’s continuing operations non-IFRS profit increased 94% in the fourth quarter 2015, primarily due to
higher non-IFRS operating profit and a net positive fluctuation in non-IFRS financial income and expenses.
The net positive fluctuation in non-IFRS financial income and expenses was primarily due to lower foreign exchange
related losses, receipt of higher distributions from third party venture funds and lower net interest expenses.
Nokia’s continuing operations non-IFRS tax rate in the fourth quarter 2015 was approximately 19%, compared to a rate of
approximately 24% in the third quarter 2015. In the fourth quarter 2015, non-IFRS tax expense benefitted from the
utilization of unrecognized deferred tax assets on previous losses related to Nokia’s ownership interests in certain
unlisted technology-related funds.

Nokia Corporation Interim Report February 11, 2016 6
No
kia
N
etw
ork
s O
utl
oo
k
Ye
ar
to d
ate
C
ash
& C
ash
flo
w
Te
ch
no
log
ies
Fin
an
cia
l ta
ble
s
Outlook for the combined company Metric Guidance Commentary
Nokia Annual operating cost
synergies
Approximately EUR 900
million of net operating
cost synergies to be
achieved in full year
2018
Compared to the combined non-IFRS operating costs of
Nokia and Alcatel-Lucent for full year 2015.
Expected to be derived from a wide range of initiatives
related to operating expenses and cost of sales,
including:
Streamlining of overlapping products and services,
particularly within the Mobile Networks business
group;
Rationalization of regional and sales organizations;
Rationalization of overhead, particularly within
manufacturing, supply-chain, real estate and
information technology;
Reduction of central function and public company
costs; and
Procurement efficiencies, given the combined
company's expanded purchasing power.
Annual interest
expense reduction
Approximately EUR 200
million of reductions in
interest expenses to be
achieved on a full year
basis in 2016 (update)
Compared to the cost of debt run rate for the combined
entity at year end 2014.
This is an update to the earlier annual interest expense
reduction target of approximately EUR 200 million of
reductions in interest expenses to be achieved on a full
year basis in 2017.
Networks FY16 Net sales
FY16 Non-IFRS
operating margin
Not provided Due to the very recent acquisition of Alcatel-Lucent,
Nokia believes it is not appropriate to provide an annual
outlook for the new combined Networks business at the
present time, and intends to provide its full year outlook
in conjunction with its Q1 results announcement. Q1
2016 net sales and non-IFRS operating margin are
expected to be influenced by factors including:
A flattish capex environment in 2016 for our overall
addressable market;
A declining wireless infrastructure market in 2016,
with a greater than normal seasonal decline in Q1
2016;
Competitive industry dynamics;
Product and regional mix;
The timing of major network deployments; and
Execution of integration and synergy plans.
Nokia
Technologies
FY16 Net sales
Not provided Due to risks and uncertainties in determining the timing
and value of significant licensing agreements, Nokia
believes it is not appropriate to provide an annual
outlook.

Nokia Corporation Interim Report February 11, 2016 7
No
kia
N
etw
ork
s O
utl
oo
k
Ye
ar
to d
ate
C
ash
& C
ash
flo
w
Te
ch
no
log
ies
Fin
an
cia
l ta
ble
s
Nokia Networks Technology partner for telecom operators of the future
Operational highlights
Radio
Nokia Networks has maintained strong operational and
deal momentum.
Nokia Networks and China Mobile Research Institute
announced a Memorandum of Understanding on their
strategic cooperation in 5G. SK Telecom and Nokia
Networks achieved 19.1 Gbps in a joint 5G trial.
Telco Cloud & Software Defined Networking
Nokia Networks established the OpenFastPath Foundation
with ARM and Enea for accelerating the performance of
SDN-ready applications.
Nokia Networks joined the Open Compute Project to
advance its AirFrame Data Center Solution.
Global Services
Nokia Networks won the Customer Experience
Management Innovation of the Year award at Telecom
Asia.
Services played a significant role in generating new
business during Q4 with TIM Brazil, Wind Mobile Canada
and StarHub Singapore.
Analytics and Internet of Things
Nokia Networks and SK Telecom demonstrated LTE low
power communication technology for IoT in Korea.
Nokia Networks and Oi Brasil announced an agreement to
accelerate the development of the IoT ecosystem and to
set up an LTE IoT lab in Brazil.
Nokia Networks - Net sales
0%
10%
20%
30%
40%
50%
€0M
€1 000M
€2 000M
€3 000M
€4 000M
Q4'14 Q1'15 Q2'15 Q3'15 Q4'15
Mobile Broadband – Net sales
0%
5%
10%
15%
20%
€0M
€500M
€1 000M
€1 500M
€2 000M
Q4'14 Q1'15 Q2'15 Q3'15 Q4'15
Net Sales Operating margin % (non-IFRS)
Global Services – Net sales
0%
5%
10%
15%
20%
€0M
€500M
€1 000M
€1 500M
€2 000M
Q4'14 Q1'15 Q2'15 Q3'15 Q4'15
Net Sales Operating margin % (non-IFRS)
Global Services
Mobile Broadband
Other
Operating margin % (non-IFRS)
Gross margin % (non-IFRS)
Margin Margin
Margin

Nokia Corporation Interim Report February 11, 2016 8
No
kia
N
etw
ork
s O
utl
oo
k
Ye
ar
to d
ate
C
ash
& C
ash
flo
w
Te
ch
no
log
ies
Fin
an
cia
l ta
ble
s
Financial highlights 1
EUR million Q4'15 Q4'14 YoY change Q3'15 QoQ change
Net sales - constant currency (12)% 10%
Net sales 3 210 3 365 (5)% 2 877 12%
Mobile Broadband 1 723 1 760 (2)% 1 569 10%
Global Services 1 487 1 579 (6)% 1 307 14%
Gross profit (non-IFRS) 1 272 1 287 (1)% 1 137 12%
Gross margin % (non-IFRS) 39.6% 38.2% 140bps 39.5% 10bps
R&D (non-IFRS) (487) (487) 0% (444) 10%
SG&A (non-IFRS) (343) (336) 2% (304) 13%
Other income and expenses (non-IFRS) 26 6 3
Operating profit (non-IFRS) 468 470 0% 391 20%
Mobile Broadband 267 220 21% 217 23%
Global Services 202 230 (12)% 173 17%
Operating margin % (non-IFRS) 14.6% 14.0% 60bps 13.6% 100bps
Mobile Broadband 15.5% 12.5% 300bps 13.8% 170bps
Global Services 13.6% 14.6% (100)bps 13.2% 40bps 1Results are reported unless otherwise specified.
Financial discussion
Net sales by segment
In the fourth quarter 2015, Mobile Broadband represented 54% of Nokia Networks net sales, compared to 52% in the
fourth quarter 2014 and 55% in the third quarter 2015. In the fourth quarter 2015, Global Services represented 46% of
Nokia Networks net sales, compared to 47% in the fourth quarter 2014 and 45% in the third quarter 2015.
Year-on-year discussion
The year-on-year decrease of 5% in Nokia Networks net sales in the fourth quarter 2015 was due to lower net sales in both
Global Services and Mobile Broadband, as well as the absence of non-recurring intellectual property rights (“IPR”) net sales
which benefitted the year-ago quarter.
Global Services net sales decreased 6% year-on-year in the fourth quarter 2015, primarily due to lower net sales across all
business lines except for care, which increased very slightly.
Mobile Broadband net sales decreased 2% year-on-year in the fourth quarter 2015, primarily due to lower net sales in core
networking technologies and lower resale of third party equipment, partially offset by growth in overall radio technologies.
Within overall radio technologies, the growth was primarily due to LTE. In addition, small cells grew strongly in percentage
terms on a year-on-year basis.
On a constant currency basis, Nokia Networks net sales would have decreased 12% year-on-year.
Sequential discussion
The sequential increase of 12% in Nokia Networks net sales in the fourth quarter 2015 was due to growth in both Global
Services and Mobile Broadband.
Global Services net sales increased 14% sequentially in the fourth quarter 2015, primarily due to growth across all business
lines except for managed services, which declined very slightly.
Mobile Broadband net sales increased 10% sequentially in the fourth quarter 2015, primarily due to growth in core
networking technologies and overall radio technologies. Within overall radio technologies, the growth was primarily due to
LTE, as well as legacy radio technologies.
On a constant currency basis, Nokia Networks net sales would have increased 10% sequentially.

Nokia Corporation Interim Report February 11, 2016 9
No
kia
N
etw
ork
s O
utl
oo
k
Ye
ar
to d
ate
C
ash
& C
ash
flo
w
Te
ch
no
log
ies
Fin
an
cia
l ta
ble
s
Net sales by region – Q4’15 Net sales – Q4’14-Q4’15
25 %
11 %
15 %
25 %
15 %
9 %
Europe Middle East & Africa
Greater China Asia-Pacific
North America Latin America
€0M
€200M
€400M
€600M
€800M
€1 000M
EUR million Q4'15 Q4'14 YoY change Q3'15 QoQ change
Europe 801 865 (7)% 681 18%
Middle East & Africa 356 350 2% 298 19%
Greater China 482 413 17% 489 (1)%
Asia-Pacific 806 915 (12)% 782 3%
North America 484 514 (6)% 371 30%
Latin America 281 308 (9)% 256 10%
Total 3 210 3 365 (5)% 2 877 12%
Net sales by region
Year-on-year discussion
On a regional basis, compared to the fourth quarter 2014, Nokia Networks net sales in Asia-Pacific decreased 12%, driven
by lower net sales in both Mobile Broadband and Global Services. Overall in Asia-Pacific, net sales decreased in Japan,
Vietnam, and Australia, while net sales grew in India and the Philippines.
In Europe, net sales decreased 7%, driven by lower net sales in both Mobile Broadband and Global Services. The overall
decrease in Europe was primarily due to lower net sales in Russia and Italy, partially offset by growth in the United Kingdom
and Ukraine.
In North America, net sales decreased 6%, driven by the absence of non-recurring IPR net sales which benefitted the year-
ago quarter and lower net sales in Global Services, partially offset by growth in Mobile Broadband. The decline in Global
Services was primarily due to lower net sales in the network implementation and systems integration business lines. The
higher net sales in Mobile Broadband was primarily due to overall radio technologies, particularly LTE.
In Latin America, net sales decreased 9%, driven by lower net sales in both Global Services and Mobile Broadband. The
overall decrease in Latin America was primarily due to lower net sales in Colombia, partially offset by growth in Chile.
In Greater China, net sales increased 17% primarily driven by higher net sales in Mobile Broadband. The higher net sales in
Mobile Broadband was primarily due to growth in LTE and core networking technologies, partially offset by lower net sales in
other radio technologies.
In Middle East and Africa, net sales increased 2% primarily due to higher net sales in Global Services. The overall increase in
Middle East and Africa was primarily due to growth in Saudi Arabia.
Sequential discussion
On a regional basis, compared to the third quarter 2015, Nokia Networks net sales in Europe increased 18%, driven by
higher net sales in both Global Services and Mobile Broadband. The overall increase in Europe was primarily due to higher
net sales in Germany, Ukraine, and Turkey.
Europe Middle
East &
Africa
Latin
America
Greater
China
Asia-
Pacific
North
America

Nokia Corporation Interim Report February 11, 2016 10
No
kia
N
etw
ork
s O
utl
oo
k
Ye
ar
to d
ate
C
ash
& C
ash
flo
w
Te
ch
no
log
ies
Fin
an
cia
l ta
ble
s
In North America, net sales increased 30%, driven by higher net sales in both Mobile Broadband and Global Services. The
higher net sales in Mobile Broadband was primarily due to overall radio technologies, particularly LTE. The higher net sales in
Global Services was primarily due to growth in the network implementation business line, partially offset by lower net sales
in the systems integration business line.
In Middle East and Africa, net sales increased 19%, driven by higher net sales in both Global Services and Mobile Broadband.
The overall increase in Middle East and Africa was primarily due to growth in Saudi Arabia.
In Latin America, net sales increased 10%, driven by higher net sales in both Mobile Broadband and Global Services. The
overall increase in Latin America was primarily driven by growth in Chile, partially offset by lower net sales in Argentina.
In Asia-Pacific, net sales increased 3%, primarily driven by higher net sales in Global Services, partially offset by lower net
sales in Mobile Broadband. The overall increase in Asia-Pacific was primarily due to growth in Indonesia, Japan, and Thailand,
partially offset by lower net sales in India and Vietnam.
In Greater China, net sales decreased 1%, primarily driven by lower net sales in Mobile Broadband. The lower net sales in
Mobile Broadband was primarily due to a decrease in LTE, partially offset by growth in core networking technologies and in
other radio technologies.
Non-IFRS Operating profit
Year-on-year discussion
On a year-on-year basis, Nokia Networks non-IFRS operating profit decreased slightly, primarily due to lower non-IFRS
operating profit in Global Services and Nokia Networks Other, partially offset by higher non-IFRS operating profit in Mobile
Broadband. The decrease in non-IFRS operating profit in Global Services was primarily due to lower non-IFRS gross profit,
partially offset by lower non-IFRS operating expenses. The decrease in non-IFRS operating profit in Nokia Networks Other
was primarily due to lower non-IFRS gross profit and higher non-IFRS operating expenses. The increase in Mobile Broadband
non-IFRS operating profit was primarily due to higher non-IFRS gross profit and lower non-IFRS operating expenses.
Nokia Networks non-IFRS gross margin increased, primarily due to improvements in non-IFRS gross margin in Mobile
Broadband, partially offset by the absence of non-recurring IPR net sales in Nokia Networks Other. The non-IFRS gross
margin increase in Mobile Broadband was primarily due to elevated levels of software. The proportion of high margin
software sales in the Nokia Networks sales mix was approximately 4 percentage points higher in the fourth quarter 2015
compared to the year-ago quarter.
The non-IFRS gross profit decrease in Global Services was primarily driven by the network implementation and systems
integration business lines, partially offset by the care business line. The non-IFRS gross profit decrease in Nokia Networks
Other was primarily due to the absence of non-recurring IPR net sales which benefitted the year-ago quarter. The non-IFRS
gross profit increase in Mobile Broadband was primarily driven by elevated levels of software, partially offset by more
challenging market conditions.
Nokia Networks non-IFRS research and development expenses were flat on a year-on-year basis, primarily due to increased
investments in LTE and 5G, offset by continued operational improvement. The slight increase in Nokia Networks non-IFRS
selling, general and administrative expenses was primarily due to higher personnel expenses and investments in IT
infrastructure, partially offset by continued operational improvement. On a constant currency basis, non-IFRS research and
development and selling, general and administrative expenses decreased year-on-year in the fourth quarter 2015.
Nokia Networks non-IFRS other income and expenses was an income of EUR 26 million in the fourth quarter 2015,
compared to an income of EUR 6 million in the year-ago quarter. On a year-on-year basis, the change in Nokia Networks
non-IFRS other income and expenses was primarily due to the release of certain doubtful account allowances, lower costs
related to the sale of receivables, partially offset by higher net indirect tax expenses.
On a year-on-year basis, foreign exchange fluctuations had a significantly positive impact on non-IFRS gross profit, and a
slightly negative impact on non-IFRS operating expenses, resulting in a positive net impact on non-IFRS operating profit in
the fourth quarter 2015.
Sequential discussion
On a sequential basis, Nokia Networks non-IFRS operating profit increased due to higher non-IFRS operating profit in both
Mobile Broadband and Global Services. The increase in both Mobile Broadband and Global Services non-IFRS operating
profit was primarily due to higher non-IFRS gross profit, partially offset by higher non-IFRS operating expenses.
Nokia Networks non-IFRS gross margin increased slightly, primarily due to improvements in non-IFRS gross margin in Mobile
Broadband. The non-IFRS gross margin performance in Mobile Broadband was primarily due to a positive mix shift with a

Nokia Corporation Interim Report February 11, 2016 11
No
kia
N
etw
ork
s O
utl
oo
k
Ye
ar
to d
ate
C
ash
& C
ash
flo
w
Te
ch
no
log
ies
Fin
an
cia
l ta
ble
s
higher proportion of core networking technologies net sales and a lower proportion of overall radio technologies net sales,
as well as higher software mix in core networking technologies. The proportion of high margin software sales in the Nokia
Networks sales mix was approximately 2 percentage points higher in the fourth quarter 2015 compared to the third quarter
2015.
The non-IFRS gross profit increase in Mobile Broadband was primarily driven by elevated levels of software, as well as an
increase in non-IFRS gross profit in overall radio technologies. The non-IFRS gross profit increase in Global Services was
primarily driven by a higher non-IFRS gross profit in the care business line.
The increase in Nokia Networks non-IFRS research and development expenses was primarily due to higher personnel
expenses, partially offset by a continued focus on cost efficiency. The increase in Nokia Networks non-IFRS selling, general
and administrative expenses was primarily due to higher personnel expenses and investments in IT infrastructure, partially
offset by continued operational improvement.
Nokia Networks non-IFRS other income and expenses was an income of EUR 26 million in the fourth quarter 2015,
compared to an income of EUR 3 million in the third quarter 2015. On a sequential basis, the change in Nokia Networks non-
IFRS other income and expenses was primarily due to the release of certain doubtful account allowances.
On a sequential basis, foreign exchange fluctuations had a slightly positive impact on non-IFRS gross profit, and a slightly
negative impact on non-IFRS operating expenses, resulting in a slightly positive net impact on non-IFRS operating profit in
the fourth quarter 2015.

Nokia Corporation Interim Report February 11, 2016 12
No
kia
N
etw
ork
s O
utl
oo
k
Ye
ar
to d
ate
C
ash
& C
ash
flo
w
Te
chn
olo
gie
s
Fin
an
cia
l ta
ble
s
Nokia Technologies Leveraging existing assets and continuing innovation for renewal and growth
Operational highlights
Licensing
The decision in the patent license arbitration with
Samsung was received. This resulted in additional
compensation payable to Nokia for the extension of the
license agreement for the period beginning on January 1,
2014. The award covers part of the Nokia Technologies
patent portfolio through the end of 2018. Nokia will
continue to discuss its other relevant intellectual property
portfolios with Samsung.
Digital Media and Digital Health
Nokia Technologies reached a significant milestone in
Digital Media, with the North American sales start of OZO,
the virtual reality camera for professional use.
Additionally, Nokia Technologies’ Digital Media lab
demonstrated new Spatial Audio Mixing technology for
distributed spatial audio capture at the OZO launch event
in Los Angeles, with enthusiastic feedback from the
professional content industry.
Net sales
0%
20%
40%
60%
80%
100%
€0M
€50M
€100M
€150M
€200M
€250M
€300M
€350M
€400M
€450M
Q4'14 Q1'15 Q2'15 Q3'15 Q4'15
Net Sales
Gross margin % (non-IFRS)
Operating margin % (non-IFRS)
Financial highlights 1
EUR million Q4'15 Q4'14 YoY change Q3'15 QoQ change
Net sales - constant currency 181% 154%
Net sales 403 149 170% 162 149%
Gross profit (non-IFRS) 401 147 173% 160 151%
Gross margin % (non-IFRS) 99.5% 98.7% 80bps 98.8% 70bps
R&D (non-IFRS) (54) (45) 20% (40) 35%
SG&A (non-IFRS) (33) (24) 38% (27) 22%
Other income and expenses (non-IFRS) 7 (1) 0
Operating profit (non-IFRS) 322 77 318% 94 243%
Operating margin % (non-IFRS) 79.9% 51.7% 2 820bps 58.0% 2 190bps 1Results are reported unless otherwise specified.
Margin

Nokia Corporation Interim Report February 11, 2016 13
No
kia
N
etw
ork
s O
utl
oo
k
Ye
ar
to d
ate
C
ash
& C
ash
flo
w
Te
chn
olo
gie
s
Fin
an
cia
l ta
ble
s
Financial discussion
Net sales
Year-on-year discussion
In the fourth quarter 2015, Nokia Technologies net sales increased 170%, or EUR 254 million, primarily due to two
factors. First, approximately 80% of the year-on-year growth, or approximately EUR 200 million, related to non-recurring
adjustments from an existing agreement. Second, approximately 20% of the year-on-year growth, or approximately EUR
50 million, related to higher intellectual property licensing income from existing and new licensees, related to settled and
ongoing arbitrations. This was partially offset by lower licensing income from certain existing licensees that experienced
decreases in handset sales.
On a constant currency basis, Nokia Technologies net sales would have increased 181% year-on-year.
Nokia Technologies fourth quarter 2015 net sales includes revenue from all licensing agreements, including those under
arbitration. It is not a forecast of the future outcome of ongoing licensing projects.
Sequential discussion
In the fourth quarter 2015, Nokia Technologies net sales increased 149%, or EUR 239 million, primarily due to two
factors. First, approximately 85% of the sequential growth, or approximately EUR 200 million, related to non-recurring
adjustments from an existing agreement. Second, approximately 15% of the sequential growth, or approximately EUR 35
million, related to higher intellectual property licensing income from an existing licensee, related to a settled arbitration.
This was partially offset by lower licensing income from certain existing licensees that experienced decreases in handset
sales.
On a constant currency basis, Nokia Technologies net sales would have increased 154% sequentially.
Nokia Technologies fourth quarter 2015 net sales includes revenue from all licensing agreements, including those under
arbitration. It is not a forecast of the future outcome of ongoing licensing projects.
Non-IFRS Operating profit
Year-on-year discussion
The year-on-year increase in Nokia Technologies non-IFRS operating profit was primarily due to higher non-IFRS gross
profit, partially offset by higher non-IFRS operating expenses.
The increase in Nokia Technologies non-IFRS research and development expenses was primarily due to higher
investments in digital media, digital health, and technology incubation, all of which target long-term growth opportunities.
The increase in Nokia Technologies non-IFRS selling, general and administrative expenses was primarily due to increased
licensing activities, the ramp-up of new businesses, and higher business support costs.
On a year-on-year basis, foreign exchange fluctuations had a negative impact on non-IFRS gross profit, and a slightly
negative impact on non-IFRS operating expenses, resulting in a negative net impact on non-IFRS operating profit in the
fourth quarter 2015.
Sequential discussion
The sequential increase in Nokia Technologies non-IFRS operating profit was primarily due to higher non-IFRS gross profit,
partially offset by higher non-IFRS operating expenses.
The increase in Nokia Technologies non-IFRS research and development expenses was primarily due to higher
investments in digital media, digital health, and technology incubation, all of which target long-term growth opportunities.
The increase in Nokia Technologies non-IFRS selling, general and administrative expenses was primarily due to the ramp-
up of new businesses as well as increased licensing activities.
Sequentially, foreign exchange fluctuations had a slightly negative impact on non-IFRS gross profit, and a slightly negative
impact on non-IFRS operating expenses, resulting in a slightly negative net impact on non-IFRS operating profit in the
fourth quarter 2015.

Nokia Corporation Interim Report February 11, 2016 14
No
kia
N
etw
ork
s O
utl
oo
k
Ye
ar
to d
ate
C
as
h &
Ca
sh
flo
w
Te
ch
no
log
ies
Fin
an
cia
l ta
ble
s
Cash and cash flow Nokia, including discontinued operations, change in net cash and other liquid assets (EUR billion)
EUR million, at end of period Q4'15 Q4'14 YoY
change Q3'15
QoQ
change
Total cash and other liquid assets 9 849 7 715 28% 6 886 43%
Net cash and other liquid assets1 7 775 5 023 55% 4 120 89%
1Total cash and other liquid assets less interest-bearing liabilities.
In the fourth quarter 2015, Nokia’s total cash and other liquid assets increased by EUR 2 963 million and Nokia’s net cash
and other liquid assets increased by EUR 3 655 million. The sequential increase in Nokia’s net cash and other liquid assets
in the fourth quarter 2015 was primarily due to approximately EUR 2.54 billion of net cash inflows from the sale of the
HERE business, an increase in net cash of EUR 827 million related to Nokia’s adjusted net profit and an increase in net
cash of EUR 712 million resulting from the conversion of the Nokia EUR 750 million convertible bond into shares.
Foreign exchange rates had an approximately EUR 30 million positive impact on the translation of gross cash and
approximately EUR 10 million positive impact on net cash.
On a sequential basis, including discontinued operations, net cash and other liquid assets were affected by the following
factors:
In the fourth quarter 2015, Nokia’s net cash from operating activities was EUR 460 million. Nokia’s continuing operations
adjusted net profit before changes in net working capital was approximately EUR 780 million in the fourth quarter 2015.
Nokia’s continuing operations had approximately EUR 60 million of restructuring-related cash outflows in the fourth
quarter 2015, related to Nokia Networks. Excluding this, Nokia’s continuing operations net working capital generated a
decrease in net cash of approximately EUR 60 million, primarily due to an increase in receivables, partially offset by an
increase in short-term liabilities and decrease in inventories. In addition, Nokia’s continuing operations had cash outflows
of approximately EUR 140 million related to other financial income and expenses, cash outflows of approximately EUR 40
million related to income taxes and cash outflows of approximately EUR 40 million related to net interest expenses.
Additionally, Nokia’s discontinued operations had cash inflows of approximately EUR 20 million in the fourth quarter 2015,
primarily due to adjusted net profit, partially offset by a net working capital generated decrease in net cash.
In the fourth quarter 2015, Nokia’s continuing operations net cash outflows from investing activities primarily related to
approximately EUR 90 million of capital expenditures and cash inflows of approximately EUR 30 million related to the
foreign exchange impact on short-term loans receivable. Additionally, Nokia’s discontinued operations had net cash
inflows of approximately EUR 2.54 billion in the fourth quarter 2015 related to the sale of the HERE business.

Nokia Corporation Interim Report February 11, 2016 15
No
kia
N
etw
ork
s O
utl
oo
k
Ye
ar
to d
ate
C
as
h &
Ca
sh
flo
w
Te
ch
no
log
ies
Fin
an
cia
l ta
ble
s
In the fourth quarter 2015, Nokia’s continuing operations net cash from financing activities increased primarily due to an
increase in net cash of EUR 712 million resulting from the conversion of the Nokia EUR 750 million convertible bond into
shares, partially offset by net cash outflows related to EUR 30 million of purchases of subsidiary shares.
Nokia Corporation Interim Report February 11, 2016 16
No
kia
N
etw
ork
s O
utl
oo
k
Ye
ar
to d
ate
C
ash
& C
ash
flo
w
Te
ch
no
log
ies
Fin
an
cia
l ta
ble
s
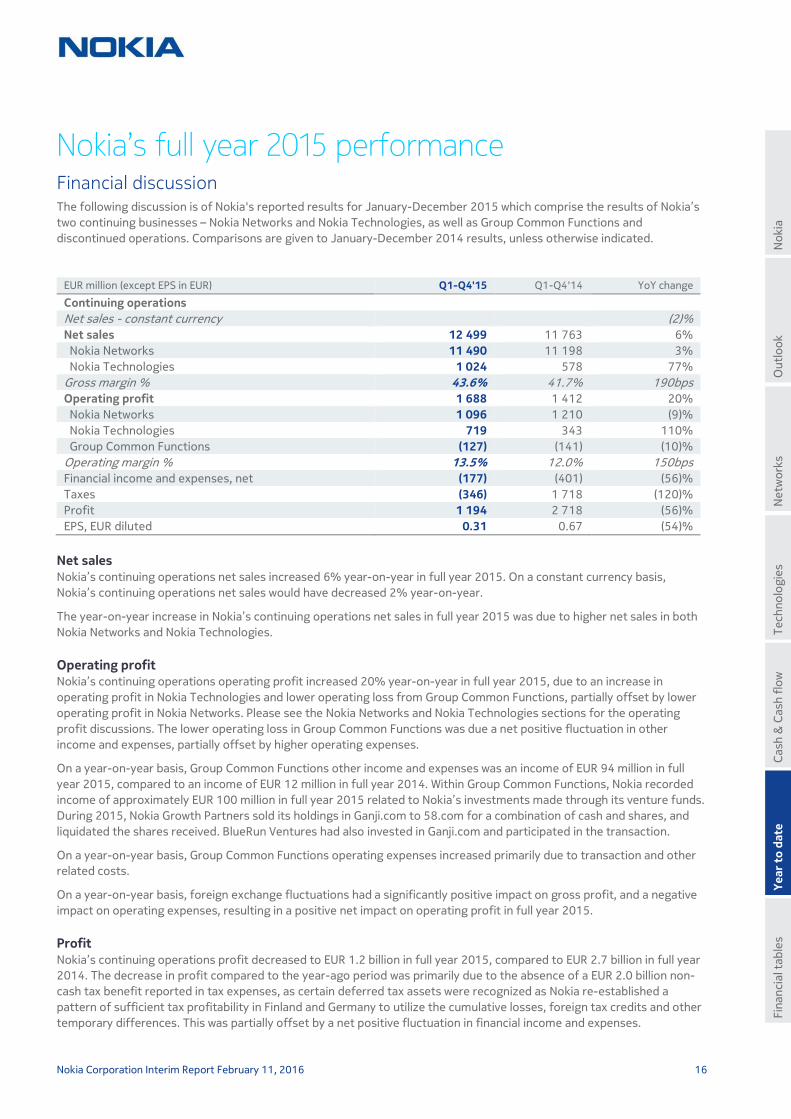
Nokia’s full year 2015 performance Financial discussion The following discussion is of Nokia's reported results for January-December 2015 which comprise the results of Nokia’s
two continuing businesses – Nokia Networks and Nokia Technologies, as well as Group Common Functions and
discontinued operations. Comparisons are given to January-December 2014 results, unless otherwise indicated.
EUR million (except EPS in EUR) Q1-Q4'15 Q1-Q4'14 YoY change
Continuing operations
Net sales - constant currency (2)%
Net sales 12 499 11 763 6%
Nokia Networks 11 490 11 198 3%
Nokia Technologies 1 024 578 77%
Gross margin % 43.6% 41.7% 190bps
Operating profit 1 688 1 412 20%
Nokia Networks 1 096 1 210 (9)%
Nokia Technologies 719 343 110%
Group Common Functions (127) (141) (10)%
Operating margin % 13.5% 12.0% 150bps
Financial income and expenses, net (177) (401) (56)%
Taxes (346) 1 718 (120)%
Profit 1 194 2 718 (56)%
EPS, EUR diluted 0.31 0.67 (54)%
Net sales Nokia’s continuing operations net sales increased 6% year-on-year in full year 2015. On a constant currency basis,
Nokia’s continuing operations net sales would have decreased 2% year-on-year.
The year-on-year increase in Nokia’s continuing operations net sales in full year 2015 was due to higher net sales in both
Nokia Networks and Nokia Technologies.
Operating profit Nokia’s continuing operations operating profit increased 20% year-on-year in full year 2015, due to an increase in
operating profit in Nokia Technologies and lower operating loss from Group Common Functions, partially offset by lower
operating profit in Nokia Networks. Please see the Nokia Networks and Nokia Technologies sections for the operating
profit discussions. The lower operating loss in Group Common Functions was due a net positive fluctuation in other
income and expenses, partially offset by higher operating expenses.
On a year-on-year basis, Group Common Functions other income and expenses was an income of EUR 94 million in full
year 2015, compared to an income of EUR 12 million in full year 2014. Within Group Common Functions, Nokia recorded
income of approximately EUR 100 million in full year 2015 related to Nokia’s investments made through its venture funds.
During 2015, Nokia Growth Partners sold its holdings in Ganji.com to 58.com for a combination of cash and shares, and
liquidated the shares received. BlueRun Ventures had also invested in Ganji.com and participated in the transaction.
On a year-on-year basis, Group Common Functions operating expenses increased primarily due to transaction and other
related costs.
On a year-on-year basis, foreign exchange fluctuations had a significantly positive impact on gross profit, and a negative
impact on operating expenses, resulting in a positive net impact on operating profit in full year 2015.
Profit
Nokia’s continuing operations profit decreased to EUR 1.2 billion in full year 2015, compared to EUR 2.7 billion in full year
2014. The decrease in profit compared to the year-ago period was primarily due to the absence of a EUR 2.0 billion non-
cash tax benefit reported in tax expenses, as certain deferred tax assets were recognized as Nokia re-established a
pattern of sufficient tax profitability in Finland and Germany to utilize the cumulative losses, foreign tax credits and other
temporary differences. This was partially offset by a net positive fluctuation in financial income and expenses.

Nokia Corporation Interim Report February 11, 2016 17
No
kia
N
etw
ork
s O
utl
oo
k
Ye
ar
to d
ate
C
ash
& C
ash
flo
w
Te
ch
no
log
ies
Fin
an
cia
l ta
ble
s
The net positive fluctuation in financial income and expenses was primarily due to lower net interest expenses, including
the absence of a EUR 123 million one-time expense related to the redemption of materially all of Nokia Networks’
borrowings in full year 2014 and the absence of a EUR 57 million accounting charge related to the repayment of EUR 1.5
billion convertible bonds issued to Microsoft in full year 2014.
The share of results of associated companies and joint ventures in full year 2015 includes an out of period adjustment of
approximately EUR 25 million. Nokia has historically accounted for the results of a certain joint venture in arrears, as the
results have not been material. Primarily due to an increase in the entity’s earnings, a portion of the amounts reflected in
full year 2015 should have been recorded in the fourth quarter 2014.

Nokia Corporation Interim Report February 11, 2016 18
No
kia
N
etw
ork
s O
utl
oo
k
Ye
ar
to d
ate
C
ash
& C
ash
flo
w
Te
ch
no
log
ies
Fin
an
cia
l ta
ble
s
Nokia Networks
EUR million Q1-Q4'15 Q1-Q4'14 YoY change
Net sales - constant currency (6)%
Net sales 11 490 11 198 3%
Mobile Broadband 6 064 6 039 0%
Global Services 5 422 5 105 6%
Gross profit 4 437 4 336 2%
Gross margin % 38.6% 38.7% (10)bps
R&D (1 928) (1 786) 8%
SG&A (1 321) (1 236) 7%
Other income and expenses (92) (104)
Operating profit 1 096 1 210 (9)%
Mobile Broadband 604 683 (12)%
Global Services 654 653 0%
Operating margin % 9.5% 10.8% (130)bps
Mobile Broadband 10.0% 11.3% (130)bps
Global Services 12.1% 12.8% (70)bps
Net sales by segment
In full year 2015, Mobile Broadband represented 53% of Nokia Networks net sales, compared to 54% in full year 2014. In
full year 2015, Global Services represented 47% of Nokia Networks net sales, compared to 46% in full year 2014.
The year-on-year increase of 3% in Nokia Networks net sales in full year 2015 was primarily due to an increase in net sales
in Global Services, partially offset by the absence of non-recurring IPR net sales which benefitted full year 2014.
Global Services net sales increased 6% year-on-year in full year 2015, primarily due to growth across all business lines
except for managed services.
On a constant currency basis, Nokia Networks net sales would have decreased 6% year-on-year.
Net sales by region
EUR million Q1-Q4'15 Q1-Q4'14 YoY change
Europe 2 804 2 929 (4)%
Middle East & Africa 1 177 1 053 12%
Greater China 1 712 1 380 24%
Asia-Pacific 3 230 3 289 (2)%
North America 1 594 1 538 4%
Latin America 973 1 009 (4)%
Total 11 490 11 198 3%
On a regional basis, compared to full year 2014, Nokia Networks net sales in Greater China increased 24% driven by
higher net sales in both Mobile Broadband and Global Services. The higher net sales in Mobile Broadband was primarily due
to growth in LTE and core networking technologies, partially offset by lower net sales in other radio technologies. The
higher net sales in Global Services was driven by growth across all business lines.
In Middle East and Africa, net sales increased 12% driven by higher net sales in both Global Services and Mobile
Broadband. The overall increase in Middle East and Africa was primarily due to growth in several countries in the Middle
East.
In North America, net sales increased 4%, driven by higher net sales in Global Services, partially offset by lower net sales
in Mobile Broadband, as well as the absence of non-recurring IPR net sales which benefitted full year 2014. The higher net

Nokia Corporation Interim Report February 11, 2016 19
No
kia
N
etw
ork
s O
utl
oo
k
Ye
ar
to d
ate
C
ash
& C
ash
flo
w
Te
ch
no
log
ies
Fin
an
cia
l ta
ble
s
sales in Global Services was primarily due to strength in the network implementation business line, including the benefit
from the acquisition of SAC Wireless. The lower net sales in Mobile Broadband was primarily due to lower net sales in
overall radio technologies.
In Europe, net sales decreased 4%, primarily driven by lower net sales in Global Services. The overall decrease in Europe
was primarily due to lower net sales in Germany and Russia, partially offset by growth in the United Kingdom.
In Asia-Pacific, net sales decreased 2%, driven by lower net sales in both Global Services and Mobile Broadband. The
overall decrease in Asia-Pacific was primarily due to lower net sales in Japan and South Korea, partially offset by growth in
India and Myanmar.
In Latin America, net sales decreased 4%, driven by lower net sales in both Mobile Broadband and Global Services. The
overall decrease in Latin America was primarily due to lower net sales in Brazil, partially offset by growth in Argentina.
Operating profit The year-on-year decrease in Nokia Networks operating profit in full year 2015 was primarily due to lower operating profit
in Mobile Broadband and Nokia Networks Other. The decrease in Mobile Broadband operating profit in full year 2015 was
primarily due to higher operating expenses, partially offset by higher gross profit. The decrease in operating profit in
Nokia Networks Other was primarily due to lower gross profit and higher operating expenses. The approximately flat
Global Services operating profit in full year 2015 was primarily due to higher operating expenses, offset by higher gross
profit.
On a year-on-year basis, the slight decrease in Nokia Networks gross margin in full year 2015 was primarily due to a lower
gross margin in Global Services, a negative mix shift due to a higher proportion of Global Services net sales and a lower
proportion of Mobile Broadband net sales and the absence of non-recurring IPR net sales in Nokia Networks Other,
partially offset by a higher gross margin in Mobile Broadband. The year-on-year decrease in gross margin in Global
Services was primarily due to lower gross margin in the network implementation and network planning and optimization
business lines, partially offset by higher gross margin in the care business line. The year-on-year increase in gross margin
in Mobile Broadband was primarily due to higher gross margin in overall radio technologies. In addition, Nokia Networks
gross margin was negatively impacted by higher costs related to the short-term impact of strategic entry deals, and
challenging market conditions. The proportion of high margin software sales in the Nokia Networks sales mix was
approximately flat in full year 2015, compared to full year 2014.
The year-on-year increase in gross profit in Mobile Broadband in full year 2015 was primarily due to higher gross profit in
overall radio technologies, partially offset by higher costs related to the short-term impact of strategic entry deals, and
challenging market conditions. The year-on-year increase in Global Services gross profit in full year 2015 was primarily
due to higher gross profit in the care business line, partially offset by lower gross profit in the network implementation
business line.
During full year 2015, Nokia Networks recorded amounts in order to correct items previously reported in 2014 and 2013
as cost of sales and reductions to accounts receivable. The impact of this correction was to reduce cost of sales in full
year 2015 by EUR 37 million, of which EUR 7 million related to 2014 and EUR 30 million to 2013. The error related to
businesses divested in 2013 where Nokia Networks continued to operate certain accounting functions under a transitional
arrangement and erroneously recorded pass through costs of the disposed businesses as costs of Nokia Networks.
The year-on-year increase in Nokia Networks research and development expenses in full year 2015 was primarily due to
higher personnel expenses and increased investments in LTE, 5G, small cells, and cloud core, partially offset by continued
operational improvements. On a year-on-year basis, Nokia Networks selling, general and administrative expenses
increased primarily due to higher personnel expenses, partially offset by a continued focus on cost efficiency.
Nokia Networks other income and expenses was an expense of EUR 92 million in full year 2015, compared to an expense
of EUR 104 million in full year 2014. On a year-on-year basis, the change in Nokia Networks other income and expenses
was primarily due to the absence of a EUR 31 million charge in the year-ago period for anticipated contractual remediation
costs related to a technical issue with a third party component, lower costs related to the sale of receivables, lower net
indirect tax expenses and the release of certain doubtful account allowances, partially offset by higher restructuring and
associated charges.
In full year 2015, Nokia Networks other income and expenses included EUR 121 million of restructuring and associated
charges, compared to EUR 57 million of restructuring and associated charges in full year 2014. During full year 2015,
Nokia Networks recorded costs of EUR 85 million, related to certain cost reduction and efficiency improvement initiatives.
The related annual cost savings are expected to be approximately EUR 70 million in 2016. The costs related to the
reduction and efficiency improvement initiatives consist of personnel severance charges in Germany, the United States,

Nokia Corporation Interim Report February 11, 2016 20
No
kia
N
etw
ork
s O
utl
oo
k
Ye
ar
to d
ate
C
ash
& C
ash
flo
w
Te
ch
no
log
ies
Fin
an
cia
l ta
ble
s
China and Japan, and are expected to result in cash outflows of approximately EUR 80 million. In addition, Nokia Networks
recorded EUR 37 million of costs following changes in estimates for the Brazil and Germany provisions, related to the
Global Restructuring Program announced in 2011.
On a year-on-year basis, foreign exchange fluctuations had a significantly positive impact on gross profit, and a negative
impact on operating expenses, resulting in a positive net impact on operating profit in full year 2015.

Nokia Corporation Interim Report February 11, 2016 21
No
kia
N
etw
ork
s O
utl
oo
k
Ye
ar
to d
ate
C
ash
& C
ash
flo
w
Te
ch
no
log
ies
Fin
an
cia
l ta
ble
s
Nokia Technologies
EUR million Q1-Q4'15 Q1-Q4'14 YoY change
Net sales - constant currency 75%
Net sales 1 024 578 77%
Gross profit 1 016 571 78%
Gross margin % 99.2% 98.8% 40bps
R&D (199) (161) 24%
SG&A (109) (65) 68%
Other income and expenses 10 (1)
Operating profit 719 343 110%
Operating margin % 70.2% 59.3% 1 090bps
Net sales
In full year 2015, Nokia Technologies net sales increased 77%, or EUR 446 million, year-on-year, primarily due to two
factors. First, approximately 70% of the year-on-year growth, or approximately EUR 310 million, of Nokia Technologies
net sales in full year 2015 related to non-recurring net sales from existing and new agreements, revenue share related to
previously divested IPR, and IPR divestments. Second, approximately 30% of the year-on-year growth, or approximately
EUR 130 million, of Nokia Technologies net sales in full year 2015 related to higher IPR licensing income from existing and
new licensees, related to settled and ongoing arbitrations, as well as Microsoft becoming a more significant intellectual
property licensee in conjunction with the Sale of the D&S Business. This was partially offset by lower licensing income
from certain existing licensees that experienced decreases in handset sales.
On a constant currency basis, Nokia Technologies net sales would have increased 75% year-on-year.
Nokia Technologies full year 2015 net sales includes revenue from all licensing agreements, including those under
arbitration. It is not a forecast of the future outcome of ongoing licensing projects.
Operating profit The year-on-year increase in Nokia Technologies operating profit for full year 2015 was primarily due to higher gross
profit, partially offset by higher operating expenses.
The increase in Nokia Technologies research and development expenses was primarily due to higher investments in digital
media and technology incubation, higher patent portfolio costs, and higher investments in digital health. On a year-on-
year basis, Nokia Technologies selling, general and administrative expenses increased primarily due to the ramp up of new
businesses, increased licensing activities, and higher business support costs.
On a year-on-year basis, foreign exchange fluctuations had a slightly positive impact on gross profit, and a slightly
negative impact on operating expenses, resulting in a slightly negative net impact on operating profit for full year 2015.

Nokia Corporation Interim Report February 11, 2016 22
No
kia
N
etw
ork
s O
utl
oo
k
Ye
ar
to d
ate
C
ash
& C
ash
flo
w
Te
ch
no
log
ies
Fin
an
cia
l ta
ble
s
Discontinued operations The following discussion is of Nokia's discontinued operations results for January-December 2015, which comprise the
results of Nokia’s discontinued HERE and D&S businesses. Comparisons are given to January-December 2014, unless
otherwise indicated.
Full year 2015 primarily includes the results of the HERE business until the sale on December 4th, 2015. Full year 2014
primarily includes the results of the HERE business for the full year and the results for the D&S business until the sale on
April 25th 2014.
EUR million (except EPS in EUR) Q1-Q4'15 Q1-Q4'14 YoY change
Net sales 1 075 3 427 (69)%
Gross profit 831 1 102 (25)%
R&D (498) (899) (45)%
SG&A (212) (628) (66)%
Other income and expenses (23) (1 352) (98)%
Operating profit 98 (1 777)
Financial income and expenses (9) 10
Profit/(loss) before taxes 89 (1 767)
Income taxes, excluding the tax effects from disposals 7 (277)
Profit/(loss) for the period, ordinary activities 96 (2 045)
Gain from the Sale of HERE and D&S Businesses, net of tax 1 178 2 803
Profit 1 274 758 68%
EPS, EUR diluted 0.32 0.18 77%
Net sales In full year 2015, discontinued operations net sales decreased 69%, primarily due to the absence of net sales related to
the D&S business.
Operating profit The year-on-year change in operating profit in discontinued operations was primarily due to the absence of a EUR 1.2
billion impairment charge related to HERE which negatively affected full year 2014 and lower selling, general and
administrative and research and development expenses primarily due to the Sale of the D&S Business, partially offset by
lower gross profit.
Profit The year-on-year increase in profit in discontinued operations was primarily due to an improvement in operating profit
and, to a lesser extent, the absence of tax expenses related to the de-recognition of deferred tax assets related to HERE’s
historical Dutch tax losses, which negatively affected full year 2014. This was partially offset by lower gain on the sale of
businesses, net of tax.
The gain on the sale of businesses included a positive foreign exchange difference reclassified from other comprehensive
income to profit related to the sale of HERE in the full year 2015. Excluding the positive foreign exchange difference
reclassified from other comprehensive income to profit, the sale of HERE would have generated a loss of EUR 116 million.
In 2014, the gain on the sale of businesses included a negative foreign exchange difference reclassified from other
comprehensive income to profit related to the Sale of the D&S Business.

Nokia Corporation Interim Report February 11, 2016 23
No
kia
N
etw
ork
s O
utl
oo
k
Ye
ar
to d
ate
C
ash
& C
ash
flo
w
Te
ch
no
log
ies
Fin
an
cia
l ta
ble
s
Cash and cash flow Nokia, including discontinued operations, change in net cash and other liquid assets
EUR million, at end of period1 Q4'15 Q4'14 YTD change
Total cash and other liquid assets 9 849 7 715 28%
Net cash and other liquid assets 7 775 5 023 55% 1 Total cash and other liquid assets consist of the following line items from our consolidated statement of financial position: Cash and cash equivalents (bank and cash as well as
available-for-sale investments, cash equivalents), available-for sale investments, liquid assets and investments at fair value through profit and loss, liquid assets. Net cash and other
liquid assets equals total cash and other liquid assets less long-term interest-bearing liabilities (including the current portion thereof) and less short-term borrowings.
In full year 2015, Nokia’s total cash and other liquid assets increased by EUR 2 134 million and Nokia’s net cash and other
liquid assets increased by EUR 2 752 million.
Foreign exchange rates had an approximately EUR 60 million positive impact on the translation of gross cash and
approximately EUR 100 million positive impact on net cash.
In full year 2015, including discontinued operations, net cash and other liquid assets were affected by the following
factors:
In full year 2015, Nokia’s net cash from operating activities was EUR 507 million. Nokia’s continuing operations adjusted
net profit before changes in net working capital was approximately EUR 2 070 million in full year 2015. Nokia’s continuing
operations had approximately EUR 160 million of restructuring-related cash outflows in full year 2015, related to Nokia
Networks. Excluding this, Nokia’s continuing operations net working capital generated a decrease in net cash of
approximately EUR 810 million, primarily due to an increase in receivables and decrease in short-term liabilities, partially
offset by a decrease in inventories. The decrease in short-term liabilities was primarily due to a decrease in accounts
payable. In addition, Nokia’s continuing operations had cash outflows of approximately EUR 40 million related to net
interest expenses, cash outflows of approximately EUR 370 million related to other financial income and expenses, and
cash outflows of approximately EUR 260 million related to income taxes. Additionally, Nokia’s discontinued operations had
cash inflows of approximately EUR 80 million in full year 2015, primarily due to adjusted net profit.
In full year 2015, Nokia’s continuing operations had net cash outflows from investing activities primarily related to cash
outflows of approximately EUR 100 million related to acquisitions completed in full year 2015, cash outflows of
approximately EUR 20 million related to the foreign exchange impact on short-term loans receivable and approximately
EUR 290 million of capital expenditures. Additionally, Nokia discontinued operations had net cash inflows of approximately
EUR 2.59 billion primarily related to the sale of businesses in full year 2015.
In full year 2015, Nokia’s continuing operations had net cash outflows from financing activities primarily related to the
payment of the dividend of approximately EUR 510 million, cash outflows of approximately EUR 170 million related to
share repurchases and cash outflows of approximately EUR 50 million related to purchases of subsidiary shares. This was
partially offset by an increase in net cash of EUR 712 million resulting from the conversion of the Nokia EUR 750 million
convertible bond into shares.
Shares
The total number of Nokia shares on December 31, 2015, equaled 3 992 863 716. On December 31, 2015, Nokia and its
subsidiary companies owned 53 668 695 Nokia shares, representing approximately 1.3% of the total number of Nokia
shares and voting rights.
Dividend
Nokia’s Board of Directors will propose a dividend of EUR 0.16 per share for 2015 and a special dividend of EUR 0.10 per
share. The distributable funds on the balance sheet of the parent company as of December 31, 2015 amounted to EUR 9
456 million. The planned proposal by Nokia’s Board of Directors is estimated to result in a maximum payout of
approximately EUR 960 million in dividends and EUR 600 million in special dividends. These estimated amounts have been
calculated assuming the conversion of all remaining outstanding Alcatel-Lucent shares and convertible bonds into Nokia
shares at the exchange ratio offered in the public exchange offers, resulting in a total of approximately 6 billion Nokia
shares.

Nokia Networks Outlook Year to date Cash & Cash flow Technologies Financial tables
Financial statements

Nokia Corporation Interim Report February 11, 2016 25
Consolidated income statement (condensed, unaudited)
EUR million Reported Reported Reported Reported Non-IFRS Non-IFRS Non-IFRS Non-IFRS
Q4'15 Q4'14 Q1-Q4'15 Q1-Q4'14 Q4'15 Q4'14 Q1-Q4'15 Q1-Q4'14
Net sales (notes 3, 4, 5) 3 609 3 510 12 499 11 763 3 609 3 510 12 499 11 763
Cost of sales (1 936) (2 077) (7 045) (6 855) (1 936) (2 077) (7 081) (6 855)
Gross profit (notes 3, 4) 1 673 1 433 5 453 4 907 1 673 1 433 5 418 4 907
Research and development expenses (550) (547) (2 126) (1 948) (541) (532) (2 088) (1 902)
Selling, general and administrative expenses (479) (410) (1 651) (1 453) (410) (396) (1 507) (1 388)
Other income and expenses (note 9) (2) (7) 12 (95) 11 (2) 126 (16)
Operating profit (notes 2, 3, 4) 641 468 1 688 1 412 734 503 1 949 1 600
Share of results of associated companies and joint ventures 17 (3) 29 (12) 17 (3) 29 (12)
Financial income and expenses (note 9) (43) (44) (177) (401) (43) (44) (177) (221)
Profit before tax (note 3) 615 421 1 540 999 707 456 1 800 1 368
Income tax (expense)/benefit (115) (96) (346) 1 718 (132) (125) (409) (309)
Profit from continuing operations (notes 2, 3) 499 325 1 194 2 718 575 331 1 392 1 058
Equity holders of the parent 498 324 1 192 2 710 574 330 1 390 1 050
Non-controlling interests 1 1 2 8 1 1 2 8
Profit/(loss) from discontinued operations 1 292 120 1 274 758 59 25 127 (389)
Equity holders of the parent 1 292 120 1 274 752 59 25 127 (395)
Non-controlling interests 0 0 0 6 0 0 0 6
Profit (note 8) 1 791 445 2 468 3 476 634 356 1 518 670
Profit attributable to equity holders of the parent 1 790 443 2 466 3 462 633 355 1 516 656
Non-controlling interests 1 1 2 14 1 1 2 14
Earnings per share, EUR (for profit/(loss) attributable to the equity holders of
the parent)
Basic earnings per share
Continuing operations 0.13 0.09 0.32 0.73 0.15 0.09 0.38 0.28
Discontinued operations 0.34 0.03 0.35 0.20 0.02 0.01 0.03 (0.11)
Nokia Group 0.47 0.12 0.67 0.94 0.17 0.10 0.41 0.18
Diluted earnings per share
Continuing operations 0.13 0.08 0.31 0.67 0.15 0.09 0.36 0.27
Discontinued operations 0.33 0.03 0.32 0.18 0.01 0.01 0.03 (0.11)
Nokia Group 0.45 0.11 0.63 0.85 0.16 0.09 0.39 0.17
Average number of shares ('000 shares)
Basic
Continuing operations 3 793 985 3 667 023 3 670 934 3 698 723 3 793 985 3 667 023 3 670 934 3 698 723
Discontinued operations 3 793 985 3 667 023 3 670 934 3 698 723 3 793 985 3 667 023 3 670 934 3 698 723
Nokia Group 3 793 985 3 667 023 3 670 934 3 698 723 3 793 985 3 667 023 3 670 934 3 698 723
Diluted
Continuing operations 3 947 477 3 986 613 3 949 312 4 131 602 3 947 477 3 986 613 3 949 312 4 131 602
Discontinued operations 3 947 477 3 986 613 3 949 312 4 131 602 3 947 477 3 986 613 3 949 312 3 698 723
Nokia Group 3 947 477 3 986 613 3 949 312 4 131 602 3 947 477 3 986 613 3 949 312 4 131 602
Interest expense, net of tax, on convertible bonds (3) (12) (36) (60) (3) (12) (36) (60)
From continuing operations:
Depreciation and amortization (notes 3, 4) (75) (68) (286) (240) (54) (51) (207) (173)
Share-based payment (note 3) 20 12 67 53 20 12 67 53
The notes are an integral part of these consolidated financial statements.

Nokia Corporation Interim Report February 11, 2016 26
Consolidated statement of comprehensive income (condensed, unaudited)
EUR million Reported Reported Reported Reported
Q4'15 Q4'14 Q1-Q4'15 Q1-Q4'14
1 791 445 2 468 3 476
Profit
Other comprehensive income/(expense)
Items that will not be reclassified to profit or loss:
Remeasurements on defined benefit pensions 17 (87) 112 (275)
Income tax related to items that will not be reclassified to profit or loss (7) 39 (28) 96
Items that may be reclassified subsequently to profit or loss:
Translation differences (1 497) 189 (1 054) 820
Net investment hedges 474 (56) 323 (167)
Cash flow hedges (23) 23 (5) (30)
Available-for-sale investments (note 9) 35 40 57 106
Other (decrease)/increase, net (1) 1 1 40
Income tax related to items that may be reclassified subsequently to profit or loss (111) 6 (88) 16
Other comprehensive (expense)/income, net of tax (1 113) 155 (682) 606
Total comprehensive income 678 600 1 786 4 082
Attributable to:
Equity holders of the parent 676 594 1 781 4 061
Non-controlling interests 2 6 5 21
678 600 1 786 4 082
Attributable to equity holders of the parent:
Continuing operations 528 324 1 457 2 350
Discontinued operations (note 8) 148 270 324 1 711
676 594 1 781 4 061
Attributable to non-controlling interest:
Continuing operations 2 4 5 16
Discontinued operations (note 8) 0 2 0 5
2 6 5 21
The notes are an integral part of these consolidated financial statements.

Nokia Corporation Interim Report February 11, 2016 27
Consolidated statement of financial position, reported (condensed, unaudited)
EUR million December
31, 2015
December
31, 2014
December
31, 2015
December
31, 2014
ASSETS SHAREHOLDERS' EQUITY AND LIABILITIES
Goodwill 237 2 563 Share capital 246 246 Other intangible assets 323 350 Share issue premium 380 439 Property, plant and equipment 695 716 Treasury shares at cost (718) (988) Investments in associated companies and joint ventures 84 51 Translation differences 292 1 099 Available-for-sale investments (note 9) 948 828 Fair value and other reserves 148 22 Deferred tax assets 2 634 2 720 Reserve for invested non-restricted equity 3 820 3 083 Long-term loans receivable (note 9) 49 34 Retained earnings 6 279 4 710
Prepaid pension costs 25 31 Capital and reserves attributable to equity holders of the parent 10 446 8 611
Other non-current assets 51 47 Non-controlling interests 21 58
Non-current assets 5 046 7 339 Total equity 10 468 8 669
Inventories 1 014 1 275 Long-term interest-bearing liabilities (notes 9, 13) 2 023 2 576
Accounts receivable, net of allowances for doubtful accounts (note 9) 3 913 3 429 Deferred tax liabilities 62 32 Prepaid expenses and accrued income 749 913 Deferred revenue and other long-term liabilities 1 677 2 197
Social security, VAT and other indirect taxes 258 362 Advance payments and deferred revenue 1 235 1 632 Divestment related receivables 160 206 Defined benefit pension 423 530 Other 331 344 Other (note 9) 20 35
Current income tax assets 171 124 Provisions (note 10) 250 301
Current portion of long-term loans receivable (note 9) 21 1 Non-current liabilities 4 011 5 107
Other financial assets (note 9) 107 266 Current portion of interest-bearing liabilities (notes 9, 13) 1 1 Investments at fair value through profit and loss, liquid assets (note 9) 687 418 Short-term borrowing (note 9) 50 115 Available-for-sale investments, liquid assets (note 9) 2 167 2 127 Other financial liabilities (note 9) 113 174 Cash and cash equivalents (note 9) 6 995 5 170 Current income tax liabilities 446 481
Current assets 15 824 13 724 Accounts payable (note 9) 1 910 2 313
Total assets 20 870 21 063 Accrued expenses, deferred revenue and other liabilities 3 395 3 632
Advance payments 695 869 Deferred revenue 1 162 960 The notes are an integral part of these consolidated financial statements. Salaries and wages 741 807 Other 797 996 Provisions (note 10) 476 572
Current liabilities 6 391 7 288
Total shareholders' equity and liabilities 20 870 21 063
Interest-bearing liabilities, EUR million 2 074 2 692 Shareholders' equity per share, EUR 2.65 2.36
Number of shares (1 000 shares, shares owned by Group companies
are excluded) 3 939 195 3 648 143
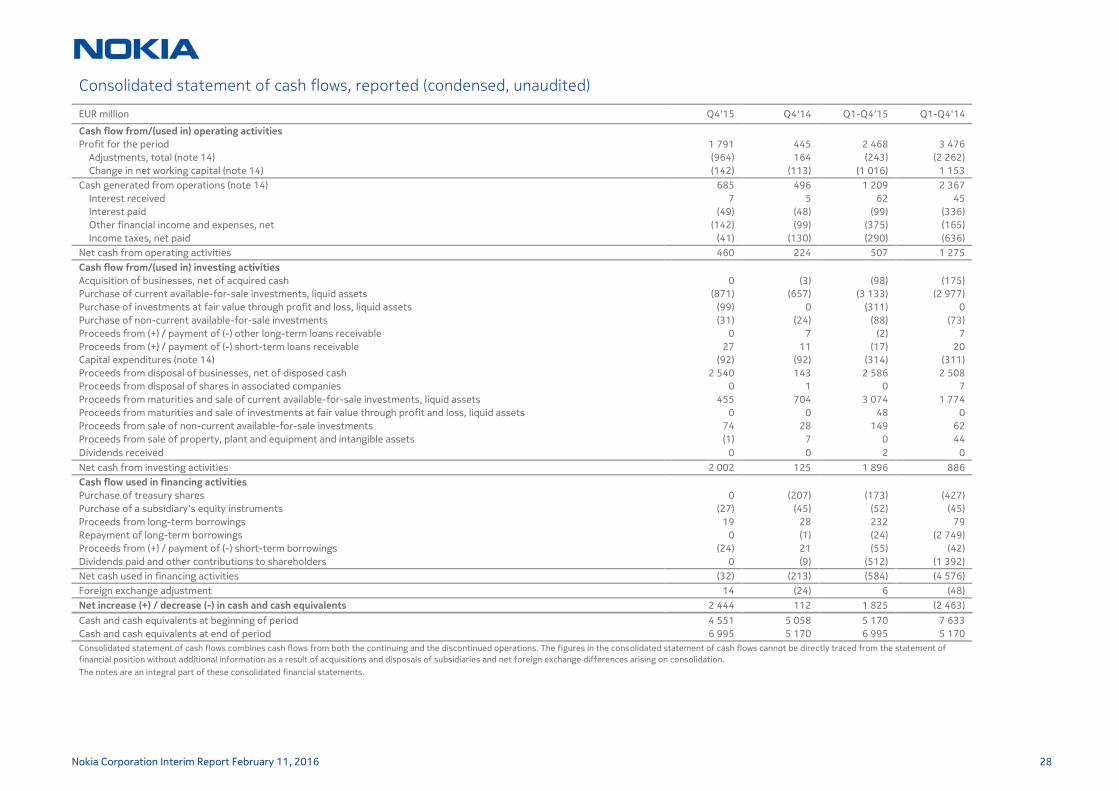
Nokia Corporation Interim Report February 11, 2016 28
Consolidated statement of cash flows, reported (condensed, unaudited)
EUR million Q4'15 Q4'14 Q1-Q4'15 Q1-Q4'14
Cash flow from/(used in) operating activities
Profit for the period 1 791 445 2 468 3 476
Adjustments, total (note 14) (964) 164 (243) (2 262)
Change in net working capital (note 14) (142) (113) (1 016) 1 153
Cash generated from operations (note 14) 685 496 1 209 2 367
Interest received 7 5 62 45
Interest paid (49) (48) (99) (336)
Other financial income and expenses, net (142) (99) (375) (165)
Income taxes, net paid (41) (130) (290) (636)
Net cash from operating activities 460 224 507 1 275
Cash flow from/(used in) investing activities
Acquisition of businesses, net of acquired cash 0 (3) (98) (175)
Purchase of current available-for-sale investments, liquid assets (871) (657) (3 133) (2 977)
Purchase of investments at fair value through profit and loss, liquid assets (99) 0 (311) 0
Purchase of non-current available-for-sale investments (31) (24) (88) (73)
Proceeds from (+) / payment of (-) other long-term loans receivable 0 7 (2) 7
Proceeds from (+) / payment of (-) short-term loans receivable 27 11 (17) 20
Capital expenditures (note 14) (92) (92) (314) (311)
Proceeds from disposal of businesses, net of disposed cash 2 540 143 2 586 2 508
Proceeds from disposal of shares in associated companies 0 1 0 7
Proceeds from maturities and sale of current available-for-sale investments, liquid assets 455 704 3 074 1 774
Proceeds from maturities and sale of investments at fair value through profit and loss, liquid assets 0 0 48 0
Proceeds from sale of non-current available-for-sale investments 74 28 149 62
Proceeds from sale of property, plant and equipment and intangible assets (1) 7 0 44
Dividends received 0 0 2 0
Net cash from investing activities 2 002 125 1 896 886
Cash flow used in financing activities
Purchase of treasury shares 0 (207) (173) (427)
Purchase of a subsidiary's equity instruments (27) (45) (52) (45)
Proceeds from long-term borrowings 19 28 232 79
Repayment of long-term borrowings 0 (1) (24) (2 749)
Proceeds from (+) / payment of (-) short-term borrowings (24) 21 (55) (42)
Dividends paid and other contributions to shareholders 0 (9) (512) (1 392)
Net cash used in financing activities (32) (213) (584) (4 576)
Foreign exchange adjustment 14 (24) 6 (48)
Net increase (+) / decrease (-) in cash and cash equivalents 2 444 112 1 825 (2 463)
Cash and cash equivalents at beginning of period 4 551 5 058 5 170 7 633
Cash and cash equivalents at end of period 6 995 5 170 6 995 5 170
Consolidated statement of cash flows combines cash flows from both the continuing and the discontinued operations. The figures in the consolidated statement of cash flows cannot be directly traced from the statement of
financial position without additional information as a result of acquisitions and disposals of subsidiaries and net foreign exchange differences arising on consolidation.
The notes are an integral part of these consolidated financial statements.

Nokia Corporation Interim Report February 11, 2016 29
Consolidated statement of changes in shareholders' equity, reported (condensed, unaudited)
EUR million Share capital Share issue
premium
Treasury
shares
Translation
difference
Fair value
and other
reserves
Reserve for
invested non-
restricted equity
Retained
earnings
Equity
holders of
the parent
Non-
controlling
interest
Total equity
January 1, 2014 246 614 (603) 434 80 3 115 2 580 6 466 193 6 659
Remeasurements on defined benefit pension plans, net of tax 0 0 0 0 (142) 0 (46) (188) 0 (188)
Translation differences 0 0 0 814 0 0 0 814 7 820
Net investment hedges, net of tax 0 0 0 (148) 0 0 0 (148) 0 (148)
Cash flow hedges, net of tax 0 0 0 0 (30) 0 0 (30) 0 (30)
Available-for-sale investments, net of tax (note 9) 0 0 0 0 103 0 0 103 0 103
Other increase, net 0 0 0 0 10 0 39 49 0 49
Profit 0 0 0 0 0 0 3 462 3 462 14 3 476
Total comprehensive income/(expense) 0 0 0 666 (59) 0 3 455 4 062 21 4 082
Share-based payment 0 4 0 0 0 0 0 4 0 4
Excess tax benefit on share-based payment 0 10 0 0 0 0 0 10 0 10
Settlement of performance and restricted shares 0 (25) 47 0 0 (32) 0 (10) 0 (10)
Acquisition of treasury shares 0 0 (427) 0 0 0 0 (427) 0 (427)
Dividends 0 0 0 0 0 0 (1 374) (1 374) (9) (1 383)
Disposal of subsidiaries 0 0 0 0 0 0 0 0 (109) (109)
Acquisition of non-controlling interests 0 0 0 0 0 0 (7) (7) (38) (45)
Convertible bond - equity component 0 (114) 0 0 0 0 0 (114) 0 (114)
Other movements 0 (51) (5) 0 0 0 56 0 0 0
Total of other equity movements 0 (175) (385) 0 0 (32) (1 325) (1 917) (156) (2 073)
December 31, 2014 246 439 (988) 1 099 22 3 083 4 710 8 611 58 8 669
January 1, 2015 246 439 (988) 1 099 22 3 083 4 710 8 611 58 8 669
Remeasurements on defined benefit pension plans, net of tax 0 0 0 0 85 0 (8) 78 0 78
Translation differences 0 0 0 (1 057) 0 0 0 (1 057) 4 (1 053)
Net investment hedges, net of tax 0 0 0 252 0 0 0 252 0 252
Cash flow hedges, net of tax 0 0 0 0 (4) 0 0 (4) 0 (4)
Available-for-sale investments, net of tax (note 9) 0 0 0 0 39 0 0 39 0 39
Other increase/(decrease), net 0 0 0 0 6 0 1 7 (1) 7
Profit 0 0 0 0 0 0 2 466 2 466 2 2 468
Total comprehensive income 0 0 0 (805) 126 0 2 460 1 781 5 1 786
Share-based payment 0 34 0 0 0 0 0 34 0 34
Excess tax benefit on share-based payment 0 (2) 0 0 0 0 0 (2) 0 (2)
Settlement of performance and restricted shares 0 (13) 24 0 0 (16) 0 (5) 0 (5)
Acquisition of treasury shares 0 0 (173) 0 0 0 0 (173) 0 (173)
Cancellation of treasury shares 0 0 427 0 0 0 (427) 0 0 0
Stock options exercise 0 0 0 0 0 4 0 4 0 4
Dividends 0 0 0 0 0 0 (507) (507) (5) (512)
Acquisition of non-controlling interests 0 0 0 0 0 0 (15) (15) (37) (52)
Convertible bond - equity component 0 (57) 0 0 0 0 57 0 0 0
Convertible bond conversion 0 (30) 0 0 0 750 0 720 0 720
Other movements 0 8 (7) (3) 0 0 2 0 0 0
Total of other equity movements 0 (59) 270 (3) 0 738 (890) 55 (42) 13
December 31, 2015 246 380 (718) 292 148 3 820 6 279 10 446 21 10 468
The notes are an integral part of these consolidated financial statements.

Nokia Corporation Interim Report February 11, 2016 30
Notes to Financial statements 1. Basis of preparation
The unaudited, consolidated, condensed interim financial statements of Nokia have been prepared in accordance with International Accounting Standard 34 (“IAS 34, Interim Financial Reporting"). The
condensed interim financial statements should be read in conjunction with the annual financial statements for 2014, which have been prepared in accordance with IFRS as published by the IASB. The same
accounting policies, methods of computation and applications of judgment are followed in these interim financial statements as were followed in the consolidated financial statements of Nokia for 2014.
These interim financial statements were authorized for issue by management on February 10, 2016.
Non-IFRS measures presented in this document exclude certain non-recurring items (special items) for all periods. In addition, non-IFRS results exclude intangible asset amortization and other purchase price
accounting-related items arising from business acquisitions. Non-IFRS financial measures should not be considered in isolation from, or as a substitute for, financial information presented in compliance with
IFRS, and non-IFRS financial measures as used by Nokia may not be comparable to similarly titled amounts used by other companies or persons.
Percentages and figures presented herein may include rounding differences and therefore may not add up precisely to the totals presented and may vary from previously published financial information.
We have two businesses: Nokia Networks and Nokia Technologies, and three operating and reportable segments for financial reporting purposes: Mobile Broadband and Global Services within Nokia Networks,
and Nokia Technologies. We also present certain segment data for discontinued operations. Numbers are always presented for the continuing operations of Nokia, unless otherwise indicated. Below is a
description of our three reportable segments.
Mobile Broadband provides mobile operators with radio and core network software together with the hardware needed to deliver mobile voice and data services. Global Services provides mobile operators with
a broad range of services, including network implementation, care, managed services, network planning and optimization as well as systems integration. Nokia Technologies is built on Nokia’s Intellectual
Property Rights (IPR) and brand and related licensing. Nokia Networks also contains Nokia Networks Other, which includes net sales and related cost of sales and operating expenses of non-core businesses,
IPR net sales and related costs. It also includes restructuring and associated charges for Nokia Networks business.
Additionally, as a result of the sale of the HERE business announced on August 3, 2015, where Nokia sold its HERE business to a consortium of leading automotive companies on December 4, 2015, and of the
transaction announced on September 3, 2013, where Nokia sold substantially all of its Devices & Services business to Microsoft on April 25, 2014 (the “Sale of the D&S Business”), the HERE and the Devices &
Services businesses have been presented as discontinued operations on which we report certain separate information.
In full year 2015, the Group acquired two businesses. The combined purchase consideration amounts to EUR 96 million.
Company/business Description
The wireless network business from
Panasonic in Japan 1
The business transfer included Panasonic’s LTE/3G wireless base station system business, related wireless equipment system business, fixed assets and business
contracts with Panasonic’s customers as well as more than 300 Panasonic employees. The Group acquired the business on January 1, 2015.
Eden Rock Communications, LCC Eden Rock Communications is pioneer in SON and creator of Eden-NET, an industry leading multivendor centralized SON solution. The Group acquired 100%
ownership interest in Eden Rock Communications, LLC on July 10, 2015.
1 Asset deal
On April 15, 2015 Nokia and Alcatel-Lucent announced their intention to combine to create an innovation leader in next generation technology and services for an IP connected world. Nokia obtained control
over Alcatel-Lucent on January 4, 2016 through a public exchange offer in France and in the United States, on the basis of 0.55 of a new Nokia share for every Alcatel-Lucent share. The acquisition is presented
as a non-adjusting subsequent event in these interim financial statements (Note 15, Subsequent events).

Nokia Corporation Interim Report February 11, 2016 31
During the second quarter 2015, the Group recorded amounts in order to correct items previously reported in 2014 and 2013 as cost of sales and reductions to accounts receivable. The impact of this
correction was to reduce cost of sales in the current period by EUR 37 million, of which EUR 7 million related to 2014 and EUR 30 million to 2013. The error related to businesses divested in 2013 where the
Group continued to operate certain accounting functions under a transitional arrangement and erroneously recorded pass through costs of the disposed businesses as costs of the Group. During the first
quarter 2015 the Group recorded a correction which resulted in an increase of the results of associated companies and joint ventures by EUR 25 million in the current period. This correction related to the
result of a joint venture for the fourth quarter 2014. Nokia had historically accounted for the results of the joint venture in arrears as the results have not been material for the Group. The Group evaluated
these items in relation to the current period as well as the periods in which they originated and determined that the corrections are immaterial to the consolidated financial statements in all periods.
Improvements to IFRS 2010-2012 and 2011-2013 cycles
On January 1, 2015, the Group adopted amendments to multiple IFRS standards, which resulted from the IASB's annual improvement projects for the 2010-2012 and 2011-2013 cycles. They comprise
amendments that result in accounting changes for presentation, recognition or measurement purposes as well as terminology or editorial amendments related to a variety of individual IFRS standards. The
amendments did not have a material impact on the Group's consolidated financial statements.
Currency exposures, NOKIA GROUP, Continuing Operations, approximately (unaudited)
Q4'15 Q4'14 Q3'15
Net sales Total costs Net sales Total costs Net sales Total costs
EUR ~35% ~30% ~30% ~35% ~25% ~30%
USD ~35% ~35% ~35% ~30% ~40% ~30%
JPY ~5% ~5% ~10% ~5% ~5% ~5%
CNY ~10% ~10% ~10% ~10% ~15% ~10%
Other ~15% ~20% ~15% ~20% ~15% ~25%
Total 100% 100% 100% 100% 100% 100%
End of Q4'15 balance sheet rate 1 EUR = 1.09 USD End of Q3'15 balance sheet rate 1 EUR = 1.12 USD End of Q4'14 balance sheet rate 1 EUR = 1.21 USD

Nokia Corporation Interim Report February 11, 2016 32
2. Non-IFRS to reported reconciliation, Continuing Operations (unaudited)
In addition to information on our reported IFRS results, we provide certain information on a non-IFRS, or underlying business performance, basis. Non-IFRS results exclude certain non-
recurring items (special items) for all periods. In addition, non-IFRS results exclude intangible asset amortization and other purchase price accounting related items arising from business
acquisitions. We believe that our non-IFRS results provide meaningful supplemental information to both management and investors regarding Nokia’s underlying business performance by
excluding the above-described items that may not be indicative of Nokia’s business operating results. These non-IFRS financial measures should not be viewed in isolation or as substitutes to
the equivalent IFRS measure(s), but should be used in conjunction with the most directly comparable IFRS measure(s) in the reported results.
EUR million
Nokia
Networks
Nokia
Technologies
Group Common
Functions
Nokia continuing
operations
Q4'15 Q4'15 Q4'15 Q4'15
Non-IFRS Operating Profit/(Loss) 468 322 (56) 734
Restructuring, cost reduction & associated charges 1 (17) 0 1 (16)
Amortization of acquired intangible assets 2 (21) 0 0 (21)
Transaction and related costs, including integration costs related to Alcatel-Lucent 3 0 0 (59) (59)
Contractual remediation charges and project losses 4 1 0 0 1
Transfer of businesses (4) 4 0 0
Divestment of businesses 5 2 0 0 2
Reported Operating Profit/(Loss) 429 326 (114) 641
Non-IFRS Profit 575
Total non-IFRS exclusions from Operating Profit (93)
Tax 6 17
Reported Profit 499 1 Includes other expenses of EUR 17 million and reversal of EUR 1 million of other expenses. 2 Includes research and development expenses of EUR 10 million and selling, general and administrative expenses of EUR 11 million.
3 Includes general and administrative expenses of EUR 58 million.
4 Includes EUR 1 million partial release of the provision for anticipated contractual remediation charges recorded in Q3'14.
5 Includes other income of EUR 2 million.
6 Includes tax impacts of the above non-IFRS exclusions.

Nokia Corporation Interim Report February 11, 2016 33
EUR million Nokia Networks
Nokia
Technologies
Group Common
Functions
Nokia
continuing
operations
Q1-Q4'15 Q1-Q4'15 Q1-Q4'15 Q1-Q4'15
Non-IFRS Operating Profit/(Loss) 1 257 720 (28) 1 949
Restructuring, cost reduction & associated charges 1 (121) (3) 1 (123)
Amortization of acquired intangible assets 2 (81) 0 0 (81)
Transaction and related costs, including integration costs related to Alcatel-Lucent 3 0 0 (100) (100)
Transaction and other related costs from the Sale of the D&S Business 4 0 (1) 1 0
Divestment related cost of sales correction 5 37 0 0 37
Contractual remediation charges and project losses 6 5 0 0 5
Transfer of businesses (4) 4 0 0
Divestment of businesses 7 2 0 0 2
Reported Operating Profit/(Loss) 1 096 719 (127) 1 688
Non-IFRS Profit 1 392
Total non-IFRS exclusions from Operating Profit (260)
Tax 8 63
Reported Profit 1 194
1 Includes other expenses of EUR 120 million and research and development expenses of EUR 3 million and reversal of EUR 1 million of other expenses.
2 Includes cost of sales of EUR 2 million, research and development expenses of EUR 35 million and selling, general and administrative expenses of EUR 44 million relating to amortization of
acquired intangible assets and adjustments to inventory valuation.
3 Includes general and administrative expenses of EUR 100 million. 4 Includes research and development expenses of EUR 1 million and selling, general and administrative cost reversals of EUR 1 million. 5 Includes divestment related cost of sales correction of EUR 37 million related to businesses divested in 2013 (refer to Note 1, Basis of
preparation).
6 Includes EUR 5 million partial release of the provision for anticipated contractual remediation charges recorded in Q3'14. 7 Includes other income of EUR 2 million. 8 Includes tax impacts of the above non-IFRS exclusions.

Nokia Corporation Interim Report February 11, 2016 34
3. Consolidated income statement (unaudited)
NOKIA GROUP, Continuing operations
EUR million
Non-IFRS Non-IFRS
Exclusions
Reported Non-IFRS Non-IFRS
Exclusions
Reported Non-IFRS Non-IFRS
Exclusions
Reported Non-IFRS Non-IFRS
Exclusions
Reported
Q4'15 Q4'15 Q4'15 Q4'14 Q4'14 Q4'14 Q1-Q4'15 Q1-Q4'15 Q1-Q4'15 Q1-Q4'14 Q1-Q4'14 Q1-Q4'14
Net sales 3 609 0 3 609 3 510 0 3 510 12 499 0 12 499 11 763 0 11 763
Cost of sales 1 (1 936) 0 (1 936) (2 077) 0 (2 077) (7 081) 36 (7 045) (6 855) 0 (6 855)
Gross profit 1 673 0 1 673 1 433 0 1 433 5 418 35 5 453 4 907 0 4 907
% of net sales 46.4% 46.4% 40.8% 40.8% 43.3% 43.6% 41.7% 41.7%
Research and development expenses 2 (541) (9) (550) (532) (15) (547) (2 088) (38) (2 126) (1 902) (46) (1 948)
% of net sales 15% 15% 15% 16% 17% 17% 16% 17%
Selling, general and administrative expenses 3 (410) (69) (479) (396) (14) (410) (1 507) (144) (1 651) (1 388) (65) (1 453)
% of net sales 11% 13% 11% 12% 12% 13% 12% 12%
Other income and expenses 4 11 (13) (2) (2) (5) (7) 126 (114) 12 (16) (79) (95)
Operating profit 734 (93) 641 503 (35) 468 1 949 (261) 1 688 1 600 (188) 1 412
% of net sales 20.3% 17.8% 14.3% 13.3% 15.6% 13.5% 13.6% 12.0%
Share of results of associated companies and joint
ventures 17 0 17 (3) 0 (3)
29 0 29 (12) 0 (12)
Financial income and expenses 5 (43) 0 (43) (44) 0 (44) (177) 0 (177) (221) (180) (401)
Profit before tax 707 (92) 615 456 (35) 421 1 800 (260) 1 540 1 368 (369) 999
Income tax (expense)/benefit 6 (132) 17 (115) (125) 29 (96) (409) 63 (346) (309) 2 027 1 718
Profit from continuing operations 575 (76) 499 331 (6) 325 1 392 (198) 1 194 1 058 1 660 2 718
Equity holders of the parent 574 (76) 498 330 (6) 324 1 390 (198) 1 192 1 050 1 660 2 710
Non-controlling interests 1 0 1 1 0 1 2 0 2 8 0 8
Depreciation and amortization (54) (21) (75) (51) (17) (68) (207) (79) (286) (173) (67) (240)
EBITDA 805 (72) 733 551 (19) 532 2 185 (182) 2 003 1 762 (122) 1 640
Share-based payment 20 0 20 12 0 12 67 0 67 53 0 53
1 Divestment related cost of sales correction of EUR 37 million and adjustments to inventory valuation of EUR 2 million in 2015.
2 Amortization of acquired intangible assets and other purchase price accounting related items of EUR 9 million in Q4'15 and EUR 35 million in 2015 and EUR 7 million in Q4'14 and EUR 32 million in 2014. Restructuring,
cost reduction and associated costs of EUR 3 million in 2015. Transaction and other related costs of EUR 1 million in 2015 and EUR 9 million in Q4'14 and EUR 13 million in 2014.
3 Amortization of acquired intangible asset of EUR 11 million in Q4'15 and EUR 44 million in 2015 and EUR 9 million in Q4'14 and EUR 34 million in 2014. Transaction and other related costs of EUR 58 million in Q4'15 and
EUR 99 million in 2015 and EUR 5 million in Q4'14 and EUR 30 million in 2014.
4 Restructuring, cost reduction and associated charges of EUR 17 million in Q4'15 and EUR 121 million in 2015 and EUR 5 million in Q4'14 and EUR 57 million in 2014. Partial release of the provision for anticipated
contractual remediation charges recorded in Q3'14 of EUR 1 million in Q4'15 and EUR 5 million 2015. Income related to divestment of businesses of EUR 2 million in Q4'15 and 2015. Anticipated contractual remediation
charges of EUR 31 million in 2014. Gain on sale of fixed assets of EUR 6 million in 2014. Transaction and other related cost reversals of EUR 4 million in 2014.
5 Includes EUR 57 million accounting charge related to the repayment of EUR 1 500 million convertible bonds issued to Microsoft and EUR 123 million financial expense related to the redemption of all material Nokia
Networks' borrowings in 2014.
6 Includes tax impacts of the above special items in Q4'15 and 2015. Includes EUR 1 999 million reversal of valuation allowances on deferred tax assets in 2014. Includes tax impacts of the above special items of EUR 7
million and tax special item of EUR 22 million in Q4'14 and in 2014.

Nokia Corporation Interim Report February 11, 2016 35
NOKIA NETWORKS
EUR million
Non-IFRS Non-IFRS Reported Non-IFRS Non-IFRS Reported
Non-IFRS Non-IFRS Reported Non-IFRS Non-IFRS Reported
Exclusions Exclusions Exclusions Exclusions
Q4'15 Q4'15 Q4'15 Q4'14 Q4'14 Q4'14 Q1-Q4'15 Q1-Q4'15 Q1-Q4'15 Q1-Q4'14 Q1-Q4'14 Q1-Q4'14
Net sales 3 210 0 3 210 3 365 0 3 365 11 490 0 11 490 11 198 0 11 198
Cost of sales 1 (1 938) 0 (1 938) (2 078) 0 (2 078) (7 088) 35 (7 053) (6 862) 0 (6 862)
Gross profit 1 272 0 1 272 1 287 0 1 287 4 401 36 4 437 4 336 0 4 336
% of net sales 39.6% 39.6% 38.2% 38.2% 38.3% 38.6% 38.7% 38.7%
Research and development expenses 2 (487) (10) (497) (487) (7) (494) (1 893) (35) (1 928) (1 754) (32) (1 786)
% of net sales 15% 15% 14% 15% 16% 17% 16% 16%
Selling, general and administrative expenses 3 (343) (11) (354) (336) (9) (345) (1 277) (44) (1 321) (1 202) (34) (1 236)
% of net sales 11% 11% 10% 10% 11% 11% 11% 11%
Other income and expenses 4 26 (17) 9 6 (6) 0 25 (117) (92) (17) (87) (104)
Operating profit 468 (39) 429 470 (22) 448 1 257 (161) 1 096 1 364 (154) 1 210
% of net sales 14.6% 13.4% 14.0% 13.3% 10.9% 9.5% 12.2% 10.8%
Depreciation and amortization (51) (21) (72) (44) (16) (60) (194) (80) (274) (166) (67) (233)
Share of results of associated companies and joint
ventures 17 0 17 (2) 0 (2) 43 0 43 (9) 0 (9)
EBITDA 536 (18) 518 512 (6) 506 1 494 (81) 1 413 1 521 (88) 1 433
1 Divestment related cost of sales correction of EUR 37 million and adjustments to inventory valuation of EUR 2 million in 2015. 2 Amortization of acquired intangible assets and other purchase price accounting related items of EUR 10 million in Q4'15 and EUR 35 million in 2015 and EUR 7 million in Q4'14 and EUR 32 million in 2014. 3 Amortization of acquired intangible assets of EUR 11 million in Q4'15 and EUR 44 million in 2015 and EUR 9 million in Q4'14 and EUR 34 million in 2014.
4 Restructuring, cost reduction and associated charges of EUR 17 million in Q4'15 and EUR 121 million in 2015 and EUR 6 million in Q4'14 and EUR 57 million in 2014. Partial release of the provision for anticipated
contractual remediation charges recorded in Q3'14 of EUR 1 million in Q4'15 and EUR 5 million 2015. Income related to divestment of businesses of EUR 2 million in Q4'15 and in 2015. Expense related to transfers of
businesses of EUR 4 million in Q4'15 and in 2015. Anticipated contractual remediation charges of EUR 31 million in 2014.

Nokia Corporation Interim Report February 11, 2016 36
NOKIA TECHNOLOGIES
EUR million
Non-IFRS Non-IFRS Reported Non-IFRS Non-IFRS Reported Non-IFRS Non-IFRS Reported Non-IFRS Non-IFRS Reported
Exclusions Exclusions Exclusions Exclusions
Q4'15 Q4'15 Q4'15 Q4'14 Q4'14 Q4'14 Q1-Q4'15 Q1-Q4'15 Q1-Q4'15 Q1-Q4'14 Q1-Q4'14 Q1-Q4'14
Net sales 403 0 403 149 0 149 1 024 0 1 024 578 0 578
Cost of sales (2) 0 (2) (2) 0 (2) (7) 0 (7) (8) 0 (8)
Gross profit 401 0 401 147 0 147 1 016 0 1 016 571 0 571
% of net sales 99.5% 99.5% 98.7% 98.7% 99.2% 99.2% 98.8% 98.8%
Research and development expenses 1 (54) 1 (53) (45) (9) (54) (195) (4) (199) (148) (13) (161)
% of net sales 13% 13% 30% 36% 19% 19% 26% 28%
Selling, general and administrative expenses 2 (33) 0 (33) (24) 0 (24) (108) (1) (109) (64) (1) (65)
% of net sales 8% 8% 16% 16% 11% 11% 11% 11%
Other income and expenses 3 7 3 10 (1) 0 (1) 7 3 10 (1) 0 (1)
Operating profit 322 4 326 77 (9) 68 720 (1) 719 357 (14) 343
% of net sales 79.9% 80.9% 51.7% 45.6% 70.3% 70.2% 61.8% 59.3%
Depreciation and amortization (1) 0 (1) (1) 0 (1) (6) 0 (6) (1) 0 (1)
Share of results of associated companies and joint
ventures 0 0 0 0 0 0
0 0 0 0 0 0
EBITDA 323 4 327 78 (8) 70 726 (1) 725 358 (14) 344
1 Restructuring, cost reduction and associated cost reversals of EUR 3 million in 2015. Transaction and other related costs of EUR 1 million in 2015 and EUR 9 million in Q4'14 and EUR 13 million in 2014.
2 Transaction and other related costs of EUR 1 million in 2015 and EUR 1 million in 2014.
3 Income related to transfers of businesses of EUR 4 million in Q4'15 and in 2015.

Nokia Corporation Interim Report February 11, 2016 37
GROUP COMMON FUNCTIONS
EUR million
Non-IFRS Non-IFRS Reported Non-IFRS Non-IFRS Reported
Non-IFRS Non-IFRS Reported Non-IFRS Non-IFRS Reported
Exclusions Exclusions Exclusions Exclusions
Q4'15 Q4'15 Q4'15 Q4'14 Q4'14 Q4'14 Q1-Q4'15 Q1-Q4'15 Q1-Q4'15 Q1-Q4'14 Q1-Q4'14 Q1-Q4'14
Net sales 0 0 0 0 0 0 0 0 0 1 0 1
Cost of sales 0 0 0 0 0 0 0 0 0 (1) 0 (1)
Gross profit 0 0 0 0 0 0 0 0 0 0 0 0
Research and development expenses 0 0 0 0 0 0 0 0 0 0 0 0
Selling, general and administrative expenses 1 (34) (59) (93) (36) (5) (41) (122) (99) (221) (123) (29) (152)
Other income and expenses 2 (21) 0 (21) (8) 0 (8) 94 0 94 2 10 12
Operating loss (56) (58) (114) (43) (6) (49) (28) (99) (127) (120) (21) (141)
Depreciation and amortization (2) 0 (2) (6) 0 (6) (7) 0 (7) (7) 0 (7)
Share of results of associated companies and joint
ventures 0 0 0 (1) 0 (1) (14) 0 (14) (3) 0 (3)
EBITDA (54) (58) (112) (39) (5) (44) (35) (99) (134) (117) (20) (137)
1 Transaction and other related costs of EUR 58 million in Q4'15 and EUR 98 million in 2015 and EUR 5 million in Q4'14 and EUR 29 million in 2014.
2 Gain on sale of fixed assets of EUR 6 million in 2014. Transaction and other related cost reversals of EUR 4 million in 2014.

Nokia Corporation Interim Report February 11, 2016 38
4. Segment information and eliminations, Continuing Operations (unaudited)
Q4 2015
EUR million
Mobile
Broadband
Global
Services
Nokia
Networks
Other1
Nokia
Networks
Total
Nokia
Technologies
Group
Common
Functions Eliminations Total Exclusions
Nokia
Continuing
Operations
Non-IFRS Non-IFRS Non-IFRS Non-IFRS Non-IFRS Non-IFRS Non-IFRS Non-IFRS Reported
Q4'15 Q4'15 Q4'15 Q4'15 Q4'15 Q4'15 Q4'15 Q4'15 Q4'15 Q4'15
Net sales 1 723 1 487 0 3 210 403 0 (4) 3 609 0 3 609
Costs and expenses (1 472) (1 295) 0 (2 768) (88) (34) 4 (2 886) (79) (2 965)
Other income and expenses 16 10 0 26 7 (21) 0 11 (13) (2)
Operating profit/(loss) 267 202 0 468 322 (56) 0 734 (93) 641
% of net sales 15.5% 13.6% 0.0% 14.6% 79.9% 20.3% 17.8%
Depreciation and
amortization (40) (11) 0 (51) (1) (2) 0 (54) (21) (75)
Q4 2014
EUR million
Mobile
Broadband
Global
Services
Nokia
Networks
Other1
Nokia
Networks
Total
Nokia
Technologies
Group
Common
Functions Eliminations Total Exclusions
Nokia
Continuing
Operations
Non-IFRS Non-IFRS Non-IFRS Non-IFRS Non-IFRS Non-IFRS Non-IFRS Non-IFRS Reported
Q4'14 Q4'14 Q4'14 Q4'14 Q4'14 Q4'14 Q4'14 Q4'14 Q4'14 Q4'14
Net sales 1 760 1 579 25 3 365 149 0 (4) 3 510 0 3 510
Costs and expenses (1 542) (1 349) (11) (2 901) (71) (36) 3 (3 004) (30) (3 034)
Other income and expenses 2 0 4 6 (1) (8) 1 (2) (5) (7)
Operating profit/(loss) 220 230 18 470 77 (43) 0 503 (35) 468
% of net sales 12.5% 14.6% 72.0% 14.0% 51.7% 14.3% 13.3%
Depreciation and
amortization (35) (9) 0 (44) (1) (6) 0 (51) (17) (68)
1 Nokia Networks Other includes net sales and related cost of sales and operating expenses of non-core businesses, IPR net sales and related costs.

Nokia Corporation Interim Report February 11, 2016 39
January-December 2015
EUR million
Mobile
Broadband
Global
Services
Nokia
Networks
Other 1
Nokia
Networks
Total
Nokia
Technologies
Group
Common
Functions Eliminations Total Exclusions
Nokia
Continuing
Operations
Non-IFRS Non-IFRS Non-IFRS Non-IFRS Non-IFRS Non-IFRS Non-IFRS Non-IFRS Reported
Q1-Q4'15 Q1-Q4'15 Q1-Q4'15 Q1-Q4'15 Q1-Q4'15 Q1-Q4'15 Q1-Q4'15 Q1-Q4'15 Q1-Q4'15 Q1-Q4'15
Net sales 6 064 5 422 4 11 490 1 024 0 (15) 12 499 0 12 499
Costs and expenses (5 478) (4 777) (3) (10 258) (311) (122) 15 (10 676) (146) (10 822)
Other income and expenses 18 9 (1) 25 7 94 0 126 (114) 12
Operating profit/(loss) 604 654 0 1 257 720 (28) 0 1 949 (261) 1688
% of net sales 10.0% 12.1% 0.0% 10.9% 70.3% 15.6% 13.5%
Depreciation and amortization (153) (41) 0 (194) (6) (7) 0 (207) (79) (286)
January-December 2014
EUR million
Mobile
Broadband
Global
Services
Nokia
Networks
Other 1
Nokia
Networks
Total
Nokia
Technologies
Group
Common
Functions Eliminations Total Exclusions
Nokia
Continuing
Operations
Non-IFRS Non-IFRS Non-IFRS Non-IFRS Non-IFRS Non-IFRS Non-IFRS Non-IFRS Reported
Q1-Q4'14 Q1-Q4'14 Q1-Q4'14 Q1-Q4'14 Q1-Q4'14 Q1-Q4'14 Q1-Q4'14 Q1-Q4'14 Q1-Q4'14 Q1-Q4'14
Net sales 6 039 5 105 54 11 198 578 1 (15) 11 763 0 11 763
Costs and expenses (5 346) (4 442) (29) (9 817) (220) (124) 16 (10 146) (110) (10 256)
Other income and expenses (10) (10) 3 (17) (1) 2 (1) (16) (79) (95)
Operating profit/(loss) 683 653 28 1 364 357 (120) 0 1 600 (188) 1 412
% of net sales 11.3% 12.8% 51.9% 12.2% 61.8% 13.6% 12.0%
Depreciation and amortization (130) (34) 0 (166) (1) (7) 0 (173) (67) (240)
1Nokia Networks Other includes net sales and related cost of sales and operating expenses of non-core businesses, IPR net sales and related costs.

Nokia Corporation Interim Report February 11, 2016 40
5. NET SALES BY GEOGRAPHIC AREA, NOKIA GROUP, Continuing Operations, reported (unaudited)
EUR million YoY QoQ
YoY
Q4'15 Q4'14 change Q3'15 change Q1-Q4'15 Q1-Q4'14 change
Europe 1 200 1 010 19% 839 43% 3 812 3 492 9%
Middle East & Africa 356 350 2% 298 19% 1 177 1 053 12%
Greater China 482 413 17% 489 (1)% 1 712 1 381 24%
Asia-Pacific 806 915 (12)% 782 3% 3 230 3 290 (2)%
North America 484 514 (6)% 371 30% 1 594 1 538 4%
Latin America 281 308 (9)% 256 10% 973 1 009 (4)%
Total 3 609 3 510 3% 3 036 19% 12 499 11 763 6%
6. PERSONNEL BY GEOGRAPHIC AREA, NOKIA GROUP, Continuing Operations (unaudited)
YoY QoQ December
31, 2015
December
31, 2014 change
September
30, 2015 change
Europe 22 171 21 601 3% 22 489 (1)% Middle East & Africa 2 275 2 358 (4)% 2 290 (1)% Greater China 8 485 9 537 (11)% 9 217 (8)% Asia-Pacific 16 663 15 571 7% 16 792 (1)% North America 3 665 3 631 1% 3 858 (5)% Latin America 2 459 2 701 (9)% 2 448 0%
Total 55 718 55 399 1% 57 094 (2)%
7. PERSONNEL BY SEGMENT, NOKIA GROUP, Continuing Operations (unaudited) 1
YoY QoQ December
31, 2015
December
31, 2014 change
September
30, 2015 change
Nokia Networks 54 513 54 218 1% 55 911 (3)% Nokia Technologies 573 592 (3)% 553 4% Group Common
Functions 632 589 7% 630 0%
Total 55 718 55 399 1% 57 094 (2)%
1 Personnel by segment for Group common functions on December 31, 2014 has been restated to account for a transfer
from Nokia Networks to Group Common Functions.

Nokia Corporation Interim Report February 11, 2016 41
8. DISCONTINUED OPERATIONS, reported (unaudited)
On August 3, 2015 the Group announced the sale of the HERE business to a consortium of leading automotive companies, comprising AUDI AG, BMW Group and Daimler
AG. Subsequent to that date, the Group has presented the HERE business as discontinued operations excluding items outside the final transaction scope until
completion of the sale on December 4, 2015. Accordingly the Group has also reclassified the comparative periods on the consolidated condensed income statement. In
September 2013, Nokia announced the Sale of the D&S Business. Subsequent to the approval for the sale received in the Extraordinary General Meeting in November
2013, Nokia Group has presented Devices & Services as discontinued business, including those items outside of the final scope of the transaction. The sale was
completed on April 25, 2014.
Results of discontinued operations1 Assets and liabilities disposed
EUR million
EUR million
HERE
December
4, 2015
D&S April
25, 2014 Q4'15 Q4'14
Q1-
Q4'15 Q1-Q4'14
Net sales 242 298 1 075 3 427 Goodwill and other intangible assets 2 722 1 427
Cost of sales (44) (80) (245) (2 325) Property, plant and equipment 115 534
Gross profit 198 218 831 1 102 Deferred tax assets and other non-current assets 151 371
Research and development expenses (98) (150) (498) (899) Inventories 14 374
Selling, general and administrative expenses (46) (56) (212) (628) Trade and other receivables 174 541
Other income and expenses 2 5 (122) (23) (1 352) Prepaid expenses and other current assets 87 1 638
Operating profit/(loss) 60 (110) 98 (1 777) Bank and cash and current available-for-sale investments 56 1 114
Financial income and expense 24 1 (9) 10 Total assets 3 319 5 999
Profit/(loss) before tax 84 (109) 89 (1 767)
Income tax expense 3 18 229 7 (277) Deferred tax liabilities and other liabilities 286 203
Profit/(loss) for the period, ordinary activities 101 120 96 (2 045) Trade and other payables 55 1 340
Gain on the sale of HERE/D&S Business, net of tax 4 1 191 0 1 178 2 803 Deferred income and accrued expenses 306 1 205
Profit from discontinued operations 1 292 120 1 274 758 Provisions 5 795
Costs and expenses include: Total liabilities 652 3 543
Depreciation and amortization 0 (13) (33) (57) Non-controlling interests 0 109
Impairments 0 (50) 0 (1 320) Net assets disposed of (2 667) (2 347)
1 The amounts presented for periods in 2015 relate mainly to the results of operations of HERE business
and the amounts presented for 2014 include both the results of HERE and D&S businesses. 2 Impairment of goodwill of EUR 1 209 million relating to HERE business in Q1-Q4'14. 3 Income tax expense excluding the tax effects from disposals. 4 The amounts represent net gain on disposals. Costs to sell are recognized as incurred.

Nokia Corporation Interim Report February 11, 2016 42
Cash flows from / used in discontinued operations Gain on the sale of the discontinued operations
EUR million
Reported Reported Reported Reported
EUR million HERE
business
D&S
business Q4'15 Q4'14
Q1-
Q4'15 Q1-Q4'14
Net cash (used in)/from operating activities (47) (54) 6 (947) Fair value of sales proceeds less costs to sell 1 2 551 5 167
Net cash from investing activities 2 532 141 2 553 2 376 Net assets disposed (2 667) (2 347)
Net cash used in financing activities 0 0 0 (9) Settlement of Windows Phone royalty 2 - 383
Net cash flow for the period 2 485 87 2 559 1 420 Other - (28)
Total (116) 3 175
Foreign exchange differences reclassified from other
comprehensive income 1 174 (212)
Profit before tax 1 058 2 963
Income tax 3 120 (160)
Gain on the sale of the discontinued operations, net of
tax 1 178 2 803
1 For the sale of the HERE business comprises purchase price of EUR 2 800 million,
reduced by adjustments for certain defined liabilities of EUR 249 million. For the Sale of
the D&S Business comprises purchase price of EUR 3 790 million, net cash adjustment of
EUR 1 114 million and other adjustments of EUR 263 million.
2 Recognized when the partnership with Microsoft to license the Windows Phone
smartphone platform was terminated in conjunction with the Sale of the D&S Business.
3 For the sale of the HERE business the divestment was largely tax exempt and the tax
benefit is due to hedging-related tax deductible losses. For the Sale of the D&S Business
tax expense mainly due to non-resident capital gains taxes in certain jurisdictions, as well
as tax impacts of legal entity restructuring carried out in connection with the sale.

Nokia Corporation Interim Report February 11, 2016 43
9. FAIR VALUE OF FINANCIAL INSTRUMENTS, NOKIA GROUP, Continuing Operations, reported (unaudited)
Financial assets and liabilities recorded at fair value are categorized based on the amount of unobservable inputs used to measure their fair value. Three hierarchical levels are based on an increasing
amount of judgment associated with the inputs used to derive fair valuation for these assets and liabilities; Level 1 being market values and Level 3 requiring most management judgment. At the end of
each reporting period Nokia categorizes its financial assets and liabilities to appropriate level of fair value hierarchy.
Carrying amounts Fair
value1
At December 31, 2015, EUR million
Current available-
for-sale financial
assets
Non-current
available-for-sale
financial assets
Financial instruments
at fair value through
profit or loss
Loans and
receivables
measured at
amortized cost
Financial
liabilities
measured at
amortized cost
Total
Total
Available-for-sale investments, publicly quoted equity shares 0 16 0 0 0 16 16
Available-for-sale investments, carried at fair value 0 647 0 0 0 647 647
Available-for-sale investments, carried at cost less impairment 0 285 0 0 0 285 285
Long-term loans receivable 0 0 0 49 0 49 39
Accounts receivable 0 0 0 3 913 0 3 913 3 913
Current portion of long-term loans receivable 0 0 0 21 0 21 21
Other current financial assets 0 0 96 11 0 107 107
Investments at fair value through profit and loss, liquid assets 0 0 687 0 0 687 687
Available-for-sale investments, liquid assets carried at fair value 2 167 0 0 0 0 2 167 2 167
Cash and cash equivalents carried at fair value 6 995 0 0 0 0 6 995 6 995
Total financial assets 9 162 948 783 3 994 0 14 887 14 877
Long-term interest-bearing liabilities 0 0 0 0 2 023 2 023 2 100
Current portion of interest-bearing liabilities 0 0 0 0 1 1 1
Short-term borrowing 0 0 0 0 50 50 50
Other financial liabilities 0 0 113 0 8 121 121
Accounts payable 0 0 0 0 1 910 1 910 1 910
Total financial liabilities 0 0 113 0 3 992 4 105 4 182
Items included in the following table are measured at fair value on a recurring basis.
At December 31, 2015, EUR million
Instruments with
quoted prices in
active markets
Valuation
technique using
observable data
Valuation technique
using non-
observable data Total
(Level 1) (Level 2) (Level 3)
Available-for-sale investments, publicly quoted equity shares 16 0 0 16 Available-for-sale investments, carried at fair value 1 13 632 646 Other current financial assets, derivatives 0 96 0 96 Investments at fair value through profit and loss, liquid assets 687 0 0 687 Available-for-sale investments, liquid assets carried at fair value 2 156 11 0 2 167 Cash and cash equivalents carried at fair value 6 995 0 0 6 995
Total assets 9 855 120 632 10 607
Other financial liabilities, derivatives 0 113 0 113
Total liabilities 0 113 0 113

Nokia Corporation Interim Report February 11, 2016 44
Carrying amounts
Fair
value1
At December 31, 2014, EUR million
Current
available-for-
sale financial
assets
Non-current
available-for-
sale financial
assets
Financial
instruments at
fair value
through profit
or loss
Loans and
receivables
measured at
amortized cost
Financial
liabilities
measured at
amortized cost
Total
Total
Available-for-sale investments, publicly quoted equity shares 0 14 0 0 0 14 14
Available-for-sale investments, carried at fair value 0 571 0 0 0 571 571
Available-for-sale investments, carried at cost less impairment 0 244 0 0 0 244 244
Long-term loans receivable 0 0 0 34 0 34 28
Accounts receivable 0 0 0 3 429 0 3 429 3 429
Current portion of long-term loans receivable 0 0 0 1 0 1 1
Other current financial assets 0 0 241 25 0 266 266
Investments at fair value through profit and loss, liquid assets 0 0 418 0 0 418 418
Available-for-sale investments, liquid assets carried at fair value 2 127 0 0 0 0 2 127 2 127
Cash and cash equivalents carried at fair value 5 170 0 0 0 0 5 170 5 170
Total financial assets 7 297 829 659 3 489 0 12 274 12 268
Long-term interest-bearing liabilities 0 0 0 0 2 576 2 576 4 058
Current portion of interest-bearing liabilities 0 0 0 0 1 1 1
Short-term borrowing 0 0 0 0 115 115 115
Other financial liabilities 0 0 174 0 0 174 174
Accounts payable 0 0 0 0 2 313 2 313 2 313
Total financial liabilities 0 0 174 0 5 005 5 179 6 661
1 For items not carried at fair value the following fair value measurement methods are used. The fair value is set to carrying amount for available-for-sale investments carried at cost less impairment for which no reliable fair value
has been possible to estimate. These assets are tested for impairment annually using a discounted cash flow analysis. The fair value of loan receivables and payables is estimated based on discounted cash flow method or current
market values of similar instruments (level 2). The fair values of long-term interest bearing liabilities are based on discounted cash flow analysis (level 2) or quoted prices (level 1). The fair value is estimated to be equal to the
carrying amount for short-term financial assets and financial liabilities due to limited credit risk and short time to maturity.
Items included in the following table are measured at fair value on a recurring basis.
At December 31, 2014, EUR million
Instruments
with quoted
prices in active
markets
(Level 1)
Valuation
technique
using
observable
data
(Level 2)
Valuation
technique
using non-
observable
data
(Level 3)
Total
Available-for-sale investments, publicly quoted equity shares 14 0 0 14 Available-for-sale investments, carried at fair value 1 13 557 571 Other current financial assets, derivatives 0 241 0 241 Investments at fair value through profit and loss, liquid assets 418 0 0 418 Available-for-sale investments, liquid assets carried at fair value 2 115 11 0 2 126 Cash and cash equivalents carried at fair value 5 170 0 0 5 170
Total assets 7 718 265 557 8 540
Other financial liabilities, derivatives 0 174 0 174
Total liabilities 0 174 0 174

Nokia Corporation Interim Report February 11, 2016 45
Level 3 includes a large number of investments in unlisted equities and unlisted funds, including investments managed by Nokia Growth Partners specializing in growth-
stage investing and by BlueRun Ventures focusing on early stage opportunities. Within level 3 fair value is determined by using one or more valuation techniques, where
the use of the market approach generally consists of using comparable market transactions, while the use of the income approach generally consists of calculating the
net present value of estimated future cash flows. For unlisted funds the selection of appropriate valuation techniques by the fund managing partner may be affected by
the availability and reliability of relevant inputs. In some cases, one valuation technique may provide the best indication of fair value while in other circumstances,
multiple valuation techniques may be appropriate.
The inputs generally considered in determining the fair value include the original transaction price, recent transactions in the same or similar instruments, completed or
pending third-party transactions in the underlying investment or comparable issuers, subsequent rounds of financing, recapitalizations or other transactions undertaken
by the issuer, offerings in the equity or debt capital markets, and changes in financial ratios or cash flows, adjusted as appropriate for liquidity, credit, market and/or
other risk factors. Level 3 investments are valued on a quarterly basis taking into consideration any changes, projections and assumptions, as well as any changes in
economic and other relevant conditions. The fair value may be adjusted to reflect illiquidity and/or non-transferability, with the amount of such discount estimated by
the managing partner in the absence of market information. Assumptions used by the managing partner due to the lack of observable inputs may significantly impact
the resulting fair value of individual investments, but no individual input has a significant impact on the total fair value of Nokia’s level 3 investments. The following table
shows a reconciliation of the opening and closing balances of Level 3 financial assets:
EUR million Other available-for-sale investments
carried at fair value
Balance at December 31, 2014 557
Net gains in income statement 96
Net gains recorded in other comprehensive income 27
Purchases 70
Sales (147)
Other movements 29
Balance at December 31, 2015 632
The gains and losses from financial assets categorized in level 3 are included in other operating income and expenses in cases where the investment and disposal
objectives for these investments are business driven. In other cases the gains and losses are included in financial income and expenses. A net gain of EUR 4 million (net
loss of EUR 2 million in 2014) related to level 3 financial instruments held at December 31, 2015, was included in the profit and loss during 2015.

Nokia Corporation Interim Report February 11, 2016 46
10. PROVISIONS, NOKIA GROUP, Continuing Operations, reported (unaudited)
EUR million Restructuring Divestment
related Warranty
Project
losses Litigation
Material
liability Other Total
At January 1, 2014 443 0 94 152 70 19 144 922
Translation differences 2 0 3 0 (1) 0 3 7
Reclassification1 7 94 0 17 (7) 0 (17) 94
Additional provisions 116 72 70 64 15 28 87 452
Changes in estimates (56) (5) (10) (30) (6) (9) (15) (131)
Charged to income statement 60 67 60 34 9 19 72 321
Utilized during period (265) (24) (40) (96) (3) (14) (29) (471)
At December 31, 2014 247 137 117 107 68 24 173 873
At January 1, 2015 247 137 117 107 68 24 173 873
Disposal of businesses 0 0 0 0 (3) 0 (2) (5)
Translation differences (4) (12) 2 0 (11) 0 7 (18)
Reclassification2 (15) (6) 0 0 15 0 (9) (15)
Additional provisions 105 49 31 5 24 46 42 302
Changes in estimates (14) (22) (21) (25) (11) (20) (18) (131)
Charged to income statement 91 27 10 (20) 13 26 24 171
Utilized during period (125) (17) (35) (25) (13) (21) (45) (281)
At December 31, 2015 194 129 94 62 69 29 148 725
1 The reclassification from other provisions consists of EUR 17 million to project losses relating to a settlement agreement with a customer. The reclassification from litigation consists of EUR 7 million to
restructuring to better reflect the nature of these items. The reclassification of EUR 94 million is from accrued expenses to divestment related provisions.
2 The reclassification from restructuring consists of EUR 15 million to litigation to better reflect the nature of these items. VAT deposits of EUR 6 million were reclassified to partially offset divestment related
provisions. The reclassification of EUR 9 million from other provisions consists of EUR 5 million to allowance for excess and obsolete inventory and EUR 4 million to accrued expenses.
All other material contingencies and off-balance sheet arrangements are disclosed in note 28, Provisions, of our Annual Report on Form 20-F for 2014 and section “Operating and financial review and
prospects—Liquidity and capital resources” on page 64 of our Annual Report on Form 20-F for 2014, respectively. LG Electronics has agreed to take a royalty-bearing smartphone patent license from Nokia
Technologies in June 2015. The detailed royalty payment obligations will be subject to commercial arbitration. There have not occurred any other significant changes to other material contingencies and off-
balance sheet arrangements.

Nokia Corporation Interim Report February 11, 2016 47
11. COMMITMENTS AND CONTINGENCIES, NOKIA GROUP, Continuing Operations, reported (unaudited)
EUR million December 31, 2015 December 31,
2014
Collateral for own commitments
Assets pledged 7 10
Contingent liabilities on behalf of Group companies
Other guarantees 601 673
Contingent liabilities on behalf of associated companies
Financial guarantees 15 13
Contingent liabilities on behalf of other companies
Financial guarantees 6 6
Other guarantees 137 165
Leasing obligations 476 542
Financing commitments
Customer finance commitments 180 155
Venture fund commitments 230 274
The amounts above represent the maximum principal amount of commitments and contingencies.
12. RELATED PARTY TRANSACTIONS, NOKIA GROUP, Continuing Operations, reported (unaudited)
Significant related party transactions with associated companies and joint ventures in 2015 include Share of results of associated companies and joint ventures of EUR 29 million income (EUR 12
million expense in 2014) and Purchases from associated companies and joint ventures of EUR 233 million (EUR 305 million in 2014).
Transactions and balances with companies over which Nokia exercises control are eliminated on consolidation. Refer to Note 1, Accounting principles and Note 33, Principal Group companies, of our
Annual Report on Form 20-F for 2014.
Nokia has related party transactions with a pension fund and the management and the Board of Directors. There have been no significant changes to related party transactions with the pension fund
nor to management and Board of Directors' compensation since December 31, 2014. Refer to note 34, Related party transactions, and section “Compensation” on page 92 of our Annual Report on
Form 20-F for 2014.

Nokia Corporation Interim Report February 11, 2016 48
13. INTEREST-BEARING LIABILITIES, NOKIA GROUP, Continuing Operations, reported (unaudited)
EUR million Issuer/Borrower Final Maturity December 31,
2015
December 31,
2014
Revolving Credit Facility (EUR 1 500 million)1 Nokia Corporation June 2018 0 0
USD Bond 2039 (USD 500 million 6.625%) Nokia Corporation May 2039 459 412
USD Bond 2019 (USD 1 000 million 5.375%) Nokia Corporation May 2019 919 824
EUR Bond 2019 (EUR 500 million 6.75%) Nokia Corporation February 2019 500 500
EUR Convertible Bond 2017 (EUR 750 million 5%)2 Nokia Corporation October 2017 0 750
Differences between Bond nominal and carrying values3 Nokia Corporation 68 21
Other liabilities4 Nokia Corporation and various subsidiaries 128 185
Total 2 074 2 692
1 In June 2015 Nokia refinanced its undrawn EUR 1 500 million Revolving Credit Facility maturing in March 2016 with new similar size Facility maturing in June 2018. The new facility has
two one year extension options, no financial covenants and it remains undrawn.
2 Nokia has utilized the early redemption option of EUR 750 million convertible bond in November 2015 at their principal amount outstanding plus accrued interest. Virtually all
bondholders elected to convert their convertible bonds into Nokia shares before redemption.
3 This line includes mainly Fair Value adjustments for bonds that are designated under Fair value hedge accounting and in 2014 also the difference between Convertible Bond nominal
value and carrying value of the financial liability component.
4 This line includes also EUR 4 million (EUR 8 million, at December 31, 2014) of non-interest bearing payables relating to cash held temporarily due to the divested businesses where Nokia
Networks continues to perform services within a contractually defined scope for a specified timeframe.
Nokia Corporation is the issuer or borrower in all material Nokia Group borrowings. All of these borrowings are senior unsecured and have no financial
covenants.

Nokia Corporation Interim Report February 11, 2016 49
14. NOTES TO THE CONSOLIDATED STATEMENT OF CASH FLOWS, NOKIA GROUP, reported (unaudited)
In 2014, cash generated from operations included EUR 1 650 million cash inflow relating to the 10 year patent license agreement with Microsoft which was paid in connection with
the Sale of the D&S Business.
The capital expenditure cash outflow in 2014 includes EUR 59 million and in 2015 EUR 27 million capital expenditure cash outflows relating to discontinued operations.
In 2014 proceeds from the Sale of the D&S Business is presented net of the amount of principal and accrued interest on the repaid convertible bonds.
EUR million Q4'15 Q4'14 Q1-Q4'15 Q1-Q4'14
Adjustments for1
Depreciation and amortization 76 80 320 297
Loss/(profit) on sale of property, plant and equipment and available-for-sale investments 12 49 (132) (56)
Income tax expense/(benefit) 97 (133) 338 (1 281)
Share of results of associated companies and joint ventures (17) 3 (29) 12
Financial income and expenses 33 41 211 600
Transfer from hedging reserve to sales and cost of sales 8 11 61 (10)
Impairment charges 7 59 11 1 335
Gain on the sale of the HERE and the D&S Businesses (1 191) 0 (1 178) (3 386)
Asset retirements 2 3 6 8
Share-based payment 13 11 49 37
Restructuring-related charges2 0 2 66 115
Other income and expenses (4) 38 34 67
Total (964) 164 (243) (2 262)
Change in net working capital
(Increase)/decrease in short-term receivables (532) (66) (693) 115
Decrease/(increase) in inventories 168 43 341 (462)
Increase/(decrease) in interest-free short-term liabilities 222 (90) (664) 1 500
Total (142) (113) (1 016) 1 153
1 Adjustments for continuing and discontinued operations. 2 The adjustments for restructuring-related charges represent the non-cash portion of the restructuring-related charges recognized in the consolidated income statement.

Nokia Corporation Interim Report February 11, 2016 50
15. SUBSEQUENT EVENTS, reported (unaudited) On April 15, 2015, Nokia and Alcatel-Lucent announced their intention to combine through a Public Exchange Offer (the "Exchange Offer") in France and in the United States. Alcatel-Lucent
is a global leader in IP networking, ultra-broadband access and cloud applications. The combined company will leverage the combined scale of its operations, complementary technologies,
portfolios and geographical presence and unparalleled innovation capabilities to lead in next generation network technology and services and create access to an expanded addressable
market with improved long term growth opportunities. As part of the Exchange Offer, all holders of Alcatel-Lucent ordinary shares, Alcatel-Lucent American Depositary Shares ("ADS") and
OCEANE convertible bonds (collectively, the "Alcatel-Lucent Equity Securities") could exchange their Alcatel-Lucent Equity Securities for Nokia shares on the basis of 0.55 of a new Nokia
share for every Alcatel-Lucent share.
Nokia obtained control of Alcatel-Lucent on January 4, 2016 when the interim results of the successful initial Exchange Offer were announced by the French stock market authority, Autorité
des Marchés Financiers ("AMF"). As part of the initial Exchange Offer, Nokia acquired 76.31% of the share capital and at least 76.01% of the voting rights of Alcatel-Lucent, 89.14% of the
OCEANEs 2018, 24.34% of the OCEANEs 2019 and 15.11% of the OCEANEs 2020. Nokia issued 1 455 678 563 new Nokia ordinary shares and new Nokia ADSs in total as a result of the
initial Exchange Offer.
On January 14, 2016, as required by AMF General Regulation, Nokia reopened its Exchange Offer in France and the United States based on the same terms and conditions used in the initial
Exchange Offer for the outstanding Alcatel-Lucent Equity Securities not tendered during the initial Exchange Offer period.
Following the initial and reopened Exchange Offers, Nokia holds 91.25% of the share capital and at least 91.17% of the voting rights of Alcatel-Lucent. Nokia holds 99.62%, 37.18% and
68.17% for the OCEANE 2018, OCEANE 2019 and OCEANE 2020 convertible bonds, respectively.
Nokia will issue 320 701 193 new Nokia ordinary shares and new Nokia ADSs in total as a result of the reopened Exchange Offer. After these shares are registered with the Finnish Trade
Register on February 12, 2016, the total number of Nokia shares outstanding will equal 5 769 443 837 shares. Assuming the conversion of all remaining outstanding Alcatel-Lucent Equity
Securities into Nokia shares at the exchange ratio offered in the initial and reopened Exchange Offers, the total number of Nokia shares outstanding would equal approximately 6 billion
shares.
Nokia has determined that the initial and reopened Exchange Offers are linked transactions that must be considered together as a single arrangement given that the reopened Exchange
Offer is required by AMF General Regulation and is based on the same terms and conditions as the initial Exchange Offer. The purchase consideration for the acquisition of Alcatel-Lucent is
comprised of the fair value of the Alcatel-Lucent Equity Securities obtained by Nokia through the initial and reopened Exchange Offers plus the portion of the fair value of Alcatel-Lucent
stock options and performance shares to be settled with Nokia shares that is attributable to pre-combination services. The fair value of the purchase consideration will be determined based
on the closing price of the Nokia share of EUR 6.58 on NASDAQ Helsinki on January 4, 2016 and the Exchange Offer ratio of 0.55 Nokia share for every one Alcatel-Lucent share. The
estimation of the fair value of the purchase consideration and the individual purchase consideration components is currently under assessment by Nokia.
In accordance with the terms of the OCEANEs and subject to applicable law, Nokia reserves the right to cause Alcatel Lucent to redeem for cash at par value plus, as applicable, accrued
interest, any series of the OCEANEs if less than 15% of the issued OCEANEs of any such series remain outstanding at any time. Nokia intends to conduct an assessment of various
alternatives to obtain at least 95% of the share capital and voting rights of Alcatel-Lucent. With 95% of the share capital and voting rights, Nokia can, in accordance with applicable law and
following a buy-out offer, squeeze-out the remaining Alcatel-Lucent Equity Securities, enabling Nokia to obtain 100% of the share capital and voting rights of Alcatel-Lucent.
Alcatel-Lucent Equity Securities that may be acquired by Nokia in the future (including through the squeeze-out) will be accounted for as an equity transaction with the remaining non-
controlling interests in Alcatel-Lucent. As such, any new Nokia shares or cash consideration paid to obtain the additional Alcatel-Lucent Equity Securities will be recorded directly within
equity against the carrying amount of non-controlling interests.
Following the public announcement of the interim results of the initial Exchange Offer on January 4, 2016 and the reopened Exchange Offer on February 10, 2016, Nokia commenced the
preparation of the purchase accounting for the acquisition of Alcatel-Lucent including the preparation of a purchase price allocation to assess the fair value of the acquired assets and
assumed liabilities. However, due to the short timeframe between the announcement of the results of the initial and reopened Exchange Offers and Nokia's release of Q4 and full year 2015
earnings, detailed estimates of the purchase accounting for the acquisition of Alcatel-Lucent are not currently available. Nokia expects to obtain additional information and to conduct
additional analyses in order to provide provisional purchase accounting information on the fair value of the purchase consideration and the fair values of assets acquired and liabilities
assumed as part of Nokia's 2015 Annual Report on Form 20-F and Nokia’s release of Q1 2016 earning Based on a preliminary assessment, Nokia expects potentially material purchase
accounting adjustments in relation to the fair values recognized for goodwill, intangible assets, deferred taxes, inventories, deferred revenue and interest-bearing liabilities. Nokia also
expects to record fair value adjustments in relation to its assessment of other assets acquired and liabilities assumed as part of the acquisition of Alcatel-Lucent.

Nokia Corporation Interim Report February 11, 2016 51
RISKS AND FORWARD-LOOKING STATEMENTS
It should be noted that Nokia and its businesses are exposed to various risks and uncertainties and certain statements
herein that are not historical facts are forward-looking statements, including, without limitation, those regarding: A) Nokia’s
ability to integrate Alcatel-Lucent into its operations and achieve the targeted business plans and benefits, including
targeted synergies in relation to the acquisition of Alcatel-Lucent announced on April 15, 2015 and closed in early 2016
(“Acquisition”); B) Nokia’s ability to squeeze out the remaining Alcatel-Lucent shareholders in a timely manner or at all to
achieve full ownership of Alcatel-Lucent; C) expectations, plans or benefits related to Nokia’s strategies; D) expectations,
plans or benefits related to future performance of Nokia’s businesses; E) expectations, plans or benefits related to changes
in our management and other leadership, operational structure and operating model, including the expected
characteristics, business, organizational structure, management and operations following the Acquisition; F) expectations
regarding market developments, general economic conditions and structural changes; G) expectations and targets
regarding performance, including those related to market share, prices, net sales, income and margins; H) timing of the
deliveries of our products and services; I) expectations and targets regarding our financial performance, results, operating
expenses, taxes, cost savings and competitiveness, as well as results of operations, including targeted synergies; J)
expectations and targets regarding collaboration and partnering arrangements, as well as the expected customer reach of
Nokia following the Acquisition; K) outcome of pending and threatened litigation, arbitration, disputes, regulatory
proceedings or investigations by authorities; L) expectations regarding restructurings, investments, uses of proceeds from
transactions, acquisitions and divestments and our ability to achieve the financial and operational targets set in connection
with any such restructurings, investments, divestments and acquisitions; and M) statements preceded by or including
“believe,” “expect,” “anticipate,” “foresee,” “sees,” “target,” “estimate,” “designed,” “aim,” “plans,” “intends,” “focus,”
“continue,” “project,” “should,” “will” or similar expressions. These statements are based on the management’s best
assumptions and beliefs in light of the information currently available to it. Because they involve risks and uncertainties,
actual results may differ materially from the results that we currently expect. Factors, including risks and uncertainties, that
could cause such differences include, but are not limited to: 1) Nokia’s inability to achieve the targeted business and
operational benefits and synergies or disruption caused by the Alcatel-Lucent transaction, including inability to integrate
Alcatel-Lucent into Nokia operations and any negative effect from the implementation of the combination, for instance due
to the loss of customers, loss of key executives or employees or reduced focus on day-to-day operations and business, or
negative effects caused by delays or inability to squeeze out the remaining Alcatel-Lucent shareholders; 2) our ability to
identify market trends and business opportunities to select and execute strategies successfully and in a timely manner, and
our ability to successfully adjust our operations and operating models; 3) our ability to sustain or improve the operational
and financial performance of our businesses and correctly identify or successfully pursue new business opportunities; 4)
our dependence on general economic and market conditions, including the capacity for growth in internet and technology
usage; 5) our exposure to regulatory, political or other developments in various countries or regions; 6) our ability to invent
new relevant technologies, products and services, to develop and maintain our intellectual property portfolio and to
maintain the existing sources of intellectual property related revenue and establish new such sources; 7) our ability to
protect our intellectual property rights and defend against third-party infringements and claims that we have infringed third
parties’ intellectual property rights (“IPR”), as well as increased licensing costs and restrictions on our ability to use certain
technologies, and litigation related to IPR; 8) the potential complex tax issues, tax disputes and tax obligations we may face,
including the obligation to pay additional taxes in various jurisdictions and our actual or anticipated performance, among
other factors, which could reduce our ability to utilize deferred tax assets; 9) our ability to retain, motivate, develop and
recruit appropriately skilled employees, for instance due to possible disruption caused by the Acquisition and related
operational and other changes; 10) the performance of the parties we partner and collaborate with, as well as that of our
financial counterparties, and our ability to achieve successful collaboration or partnering arrangements, including any
disruption from the transaction in obtaining or maintaining the contractual relationships; 11) exchange rate fluctuations,
particularly between the euro, which is our reporting currency, and the US dollar, the Japanese yen and the Chinese yuan, as
well as certain currencies; 12) the impact of unfavorable outcome of litigation, arbitration, contract-related disputes or
allegations of health hazards associated with our businesses; 13) any inefficiency, malfunction or disruption of a system or
network that our operations rely on or any impact of a possible cybersecurity breach; 14 our ability to achieve targeted
benefits from or successfully implement planned transactions, such as acquisitions, divestments, mergers or joint ventures,
and manage unexpected liabilities related thereto; 15) our ability to manage our operating expenses and reach targeted
results through efforts aimed at improving our financial performance, for instance through cost savings and other efforts
aimed at increased competitiveness; 16) Nokia’s ability to optimize its capital structure as planned and re-establish our
investment grade credit rating; 17) Nokia’s ability to execute its strategy or to effectively and profitably adapt its business
and operations in a timely manner to the increasingly diverse needs of its customers in the information technology and
communications industries and related services market or to appropriately adapt to related technological developments;
18) Nokia’s ability to effectively and profitably invest in new competitive high-quality products, services, upgrades and
technologies and bring them to market in a timely manner; 19) Nokia’s dependence on a limited number of customers and

Nokia Corporation Interim Report February 11, 2016 52
large multi-year agreements and adverse effects as a result of further operator consolidation; 20) Nokia’s ability to manage
its manufacturing, service creation and delivery, as well as our logistics efficiently and without interruption; 21) Nokia’s
dependence on a limited number of suppliers, who may fail to deliver sufficient quantities of fully functional products and
components or deliver timely services meeting its customers’ needs; 22) adverse developments with respect to customer
financing or extended payment terms Nokia provides to customers; 23) Nokia Technologies’ ability to maintain its existing
sources of intellectual property related revenue or establish new sources; 24) Nokia Technologies’ dependence on a limited
number of key licensees that contribute proportionally significant patent licensing income, including the outcome of any
pending arbitrations or negotiations; 25) Nokia Technologies’ dependence on adequate regulatory protection for patented
or other proprietary technologies; 26) Nokia Technologies’ ability to execute its plans through business areas such as
licensing the Nokia brand and other business ventures, including benefits and plans related to technology innovation and
incubation; and 27) unexpected liabilities or issues with respect to the Acquisition, including pension and employee liabilities
or higher than expected transaction costs, as well as the risk factors specified on pages 74 to 89 of Nokia’s latest annual
report on Form 20-F under “Operating and Financial Review and Prospects—Risk factors” as well as in Nokia’s other filings
with the U.S. Securities and Exchange Commission. Other unknown or unpredictable factors or underlying assumptions
subsequently proven to be incorrect could cause actual results to differ materially from those in the forward-looking
statements. Nokia does not undertake any obligation to publicly update or revise forward-looking statements, whether as a
result of new information, future events or otherwise, except to the extent legally required.
These financial statements were authorized for issue by management on February 10, 2016.
Media and Investor Contacts:
Corporate Communications, tel. +358 10 448 4900 email: [email protected]
Investor Relations Europe, tel. +358 4080 3 4080 email: [email protected]
Nokia plans to publish its "Nokia in 2015" annual report, which includes the review by the Board of Directors and the
audited annual accounts, in week 13 of 2016. The annual report will be available at www.nokia.com/financials.
Nokia plans to publish its first quarter 2016 results on May 10, 2016.
Nokia's Annual General Meeting 2016 is scheduled to be held on June 16, 2016.