information economy report 2011 - unctad
TRANSCRIPT

ICTs as an Enabler for Private Sector Development
INFORMATION ECONOMY
REPORT 2011
U N I T E D N AT I O N S C O N F E R E N C E O N T R A D E A N D D E V E L O P M E N T
New York and Geneva, 2011

ii INFORMATION ECONOMY REPORT 2011
NOTEWithin the UNCTAD Division on Technology and Logistics, the ICT Analysis Section carries out policy-oriented
analytical work on the development implications of information and communication technologies (ICTs). It is
responsible for the preparation of the Information Economy Report. The ICT Analysis Section promotes inter-
national dialogue on issues related to ICTs for development, and contributes to building developing countries’
capacities to measure the information economy and to design and implement relevant policies and legal frame-
works.
In this Report, the terms country/economy refer, as appropriate, to territories or areas. The designations em-
ployed and the presentation of the material do not imply the expression of any opinion whatsoever on the part
of the Secretariat of the United Nations concerning the legal status of any country, territory, city or area or of its
authorities, or concerning the delimitation of its frontiers or boundaries. In addition, the designations of country
groups are intended solely for statistical or analytical convenience and do not necessarily express a judgement
about the stage of development reached by a particular country or area in the development process. The major
country groupings used in this Report follow the classification of the United Nations Statistical Office. These are:
Developed countries: the member countries of the Organization for Economic Cooperation and Development
(OECD) (other than Mexico, the Republic of Korea and Turkey), plus the new European Union member countries
that are not OECD members (Bulgaria, Cyprus, Latvia, Lithuania, Malta and Romania), plus Andorra, Israel,
Liechtenstein, Monaco and San Marino. Countries with economies in transition: South-East Europe and the
Commonwealth of Independent States. Developing economies: in general, all the economies that are not speci-
fied above. For statistical purposes, the data for China do not include those for Hong Kong Special Administrative
Region (Hong Kong, China), Macao Special Administrative Region (Macao, China), or Taiwan Province of China.
Reference to companies and their activities should not be construed as an endorsement by UNCTAD of those
companies or their activities.
The following symbols have been used in the tables:
Two dots (..) indicate that data are not available or are not separately reported. Rows in tables have been
omitted in those cases where no data are available for any of the elements in the row;
A dash (–) indicates that the item is equal to zero or its value is negligible;
A blank in a table indicates that the item is not applicable, unless otherwise indicated;
A slash (/) between dates representing years, e.g. 1994/95, indicates a financial year;
Use of an en dash (–) between dates representing years, e.g. 1994–1995, signifies the full period involved,
including the beginning and end years;
Reference to “dollars” ($) means United States dollars, unless otherwise indicated;
Annual rates of growth or change, unless otherwise stated, refer to annual compound rates;
Details and percentages in tables do not necessarily add up to the totals because of rounding.
The material contained in this study may be freely quoted with appropriate acknowledgement.
UNITED NATIONS PUBLICATION
UNCTAD/IER/2011
Sales No. E.11.II.D.6
ISSN 2075-4396
ISBN 978-92-1-112833-8
e-ISBN 978-92-1-055120-5
Copyright © United Nations, 2011
All rights reserved. Printed in Switzerland

iiiPREFACE
PREFACE
This year’s Information Economy Report highlights the role of information and communication technologies
(ICTs) in enabling private-sector development (PSD), and seeks to establish a bridge between ICT and PSD
policymakers.
The United Nations attaches great importance to the role of a vibrant and socially responsible private sector
in achieving sustainable development and the Millennium Development Goals. Private-sector development is
essential for inclusive and equitable economic growth, and Member States are actively engaged in promoting
enterprises capable of creating jobs, raising incomes and productivity, diversifying the economy and generating
government revenue. Our challenge is to accelerate progress and ensure that our efforts reach the poorest and
most vulnerable in particular. ·
The Information Economy Report 2011 identifies four areas in which the ICT-PSD interface is especially promis-
ing: strengthening the private sector’s role in extending ICT infrastructure and services; enhancing ICT use in
enterprises; promoting the ICT sector itself; and making more efficient use of ICTs in various public interventions
aimed at promoting PSD. Although some countries are already taking advantage of the close links between
ICTs and PSD, much more can be done to make ICTs a powerful force for improving the competitiveness of the
private sector.
These policy challenges should be addressed urgently. The information, analysis and recommendations in this
report point the way towards fully exploiting the great potential of ICTs for private-sector development.
BAN Ki-moon
Secretary-General
United Nations

iv INFORMATION ECONOMY REPORT 2011
ACKNOWLEDGEMENTS
The Information Economy Report 2011 was prepared by a team comprising Torbjörn Fredriksson (team leader),
Cécile Barayre, Scarlett Fondeur Gil, Diana Korka, Rémi Lang, Thao Nguyen, Marta Pérez Cusó and Smita
Barbattini, under the direct supervision of Mongi Hamdi and overall guidance by Anne Miroux.
The Information Economy Report 2011 benefited from major substantive inputs provided by Christopher Foster,
Michael Minges, Raja Mitra and Simon White.
Additional inputs were contributed by Tiziana Bonapace, Stephania Bonilla, Julia Burchell, Giuseppe Di Capua,
Fulvia Farinelli, Richard L. Field, Frank Grozel, Dylan Higgins, Henriette Kolb, Martin Labbe, Reema Nanavaty,
Ali Ndiwalana, Geoffroy Raymond, Michael Riggs, Roxanna Samii, and by various experts at the United Nations
Economic Commission for Africa, the United Nations Economic and Social Commission for Asia and the Pacific,
and the United Nations Conference on International Trade Law. A contribution by the research team of Professor
You Jianxin at Tongji University, China, is also gratefully acknowledged.
Useful comments on various parts of the text were given by experts attending a regional seminar organized
in Geneva in April 2011, including Angel González Sanz, Johan Hellström, Neo Matsau, Fiorina Mugione, Antti
Piispanen, David Souter, Susan Teltscher and Stijn van der Krogt. Valuable comments were also received at
various stages of the production of the report from Frédéric Bourassa, Ineke Buskens, Jillian Convey, Ben
Cramer, Daniel Einfeld, Xavier Faz, Marije Geldolf, Richard Heeks, Renata Henriques, Claire Hunsaker, Dorothea
Kleine, Mark Levy, Julius Okello, Pranav Prashad, Joni Simpson, Michael Tarazi and Tim Unwin.
UNCTAD is grateful for the sharing of data by national statistical offices, and for the responses received to
UNCTAD’s annual survey on the ICT sector and ICT usage by enterprises. The sharing of data for this report by
Eurostat, ITU, Nokia, OECD and the World Bank is also highly appreciated.
The cover and other graphics were designed by Sophie Combette and Nathalie Loriot. Desktop publishing was
carried out by Nathalie Loriot, and the Report was edited by Daniel Sanderson, Lucy Deleze-Black and Mike
Gibson.
Financial support from the Government of Finland is gratefully acknowledged.
vCONTENTS
CONTENTS
Preface ................................................................................................................................................iii
Acknowledgements ........................................................................................................................... iv
List of Abbreviations ........................................................................................................................... x
Executive Summary ..........................................................................................................................xiii
CHAPTER I: PRIVATE SECTOR DEVELOPMENT AND THE ROLE OF ICTs .................. 1
1. Why an expanding private sector matters ........................................................................................2
2. Barriers to enterprise creation and expansion ...................................................................................2
3. Promoting private sector development .............................................................................................5
1. The PSD strategies of development partners ...................................................................................7
2. National PSD and ICT strategies ......................................................................................................9
a. Africa ...........................................................................................................................................9
b. Latin America and the Caribbean ...............................................................................................10
c. Asia-Pacific region .....................................................................................................................10
CHAPTER II: FACILITATING ENTERPRISE USE OF ICTs ......................................... 15
1. Fixed telephony ..............................................................................................................................18
2. Mobile telephony ............................................................................................................................18
a. Expansion continues ..................................................................................................................18
b. New forms of mobile use ...........................................................................................................20
c. Pricing of mobile services ...........................................................................................................22
3. Computer use ................................................................................................................................24
4. Internet and broadband use ...........................................................................................................24
a. Connectivity is improving ...........................................................................................................24
(i) Internet use ............................................................................................................................24
(ii) Broadband ............................................................................................................................27
(iii) International bandwidth ........................................................................................................28
b. Business use of the Internet .......................................................................................................30
c. Pricing of Internet use ................................................................................................................36
CHAPTER III: PROMOTING PRIVATE ICT-SECTOR DEVELOPMENT ......................... 45
1. Telecommunications ......................................................................................................................49
a. Private-sector investment in telecommunications .......................................................................49
b. Opportunities for PSD in the mobile sector ................................................................................51
2. Other ICT services and ICT-enabled services..................................................................................53

vi INFORMATION ECONOMY REPORT 2011
1. ICT-sector liberalization and regulation ...........................................................................................57
2. Developing human resources .........................................................................................................58
3. Incubation and technology parks ...................................................................................................61
4. Using government procurement to create demand ........................................................................62
CHAPTER IV: MAKING PSD INTERVENTIONS MORE EFFECTIVE WITH ICTs ........... 65
1. Improving business registration and licensing procedures ..............................................................67
2. Improving tax policies and administration .......................................................................................69
3. Trade facilitation measures .............................................................................................................70
1. ICT use in training and advisory services ........................................................................................71
2. Enhancing access to relevant information.......................................................................................74
a. Making markets work better: the case of rural enterprises in Zambia .........................................74
b. Ethiopia Commodity Exchange: revolutionizing Ethiopian farming ..............................................75
c. DrumNet and KACE: two Kenyan market information services ...................................................76
3. Concluding observations ................................................................................................................77
1. Mobile money services ...................................................................................................................77
2. Mobile solutions to international remittances ..................................................................................80
3. Microfinance and ICTs ....................................................................................................................82
4. Policy challenges and opportunities with mobile money .................................................................85
a. System oversight .......................................................................................................................86
b. User issues ................................................................................................................................87
c. Crime and national security considerations ................................................................................88
d. Infrastructure policies .................................................................................................................88
CHAPTER V: LEVERAGING ICTs TO SUPPORT WOMEN’S ENTREPRENEURSHIP ..... 91
1. Access to finance ..........................................................................................................................92
2. Time constraints due to family responsibilities ................................................................................93
3. Restricted physical mobility ............................................................................................................93
4. Limited skills and training ...............................................................................................................93
1. Choice of ICT tools ........................................................................................................................94
2. Overcoming barriers with ICT-based support..................................................................................94
a. Access to finance ......................................................................................................................95
b. Limited time and physical mobility ..............................................................................................96
c. Limited skills and training ...........................................................................................................97
CHAPTER VI: POLICY RECOMMENDATIONS ..................................................... 101
REFERENCES ................................................................................................ 107
STATISTICAL ANNEX ..................................................................................... 117
Selected UNCTAD publications in the area of science, technology and ICT for development ............144
Readership survey ...........................................................................................................................147

viiCONTENTS
Boxes
I.1. Defining the private sector ..............................................................................................................3
I.2. Factors explaining low productivity in Latin America and the Caribbean ..........................................4
I.3. Barriers to private sector development in Africa ..............................................................................5
I.4. Examples of links between ICTs and PSD in national strategies in Africa .........................................9
I.5. ICT policies for private sector development in the Republic of Korea .............................................11
II.1. The Broadband Commission for Digital Development ...................................................................28
II.2. The challenge of leveraging ICTs for PSD in Peru ..........................................................................40
II.3. Training entrepreneurs to use mobile phones as a business tool ...................................................41
III.1. What is included in the ICT sector? ...............................................................................................46
III.2. The emerging mobile ecosystem in Kenya ....................................................................................52
III.3. Bringing micro-work to poor but talented workers in the South .....................................................54
III.4. The role of freelancers in the Bangladeshi IT- and ICT-enabled services industry ...........................55
III.5. Crowd-sourcing via mobile phones: the case of TxtEagle .............................................................56
III.6. New ICT goods definition boosts Asia’s share in ICT export statistics............................................57
III.7. Promoting globally competitive infocomm manpower in Singapore ...............................................59
III.8. Boosting the number of ICT graduates in Egypt ............................................................................60
III.9. ICT park in Rwanda ......................................................................................................................62
III.10. Building a network of certified small and local ICT enterprises .......................................................63
IV.1. Elements of the business environment ..........................................................................................66
IV.2. Speeding up business registration at the local level in the Philippines ............................................68
IV.3. UNCTAD’s easy business formalization (micro-legalization) programme.........................................69
IV.4. Automated customs to support PSD: the case of ASYCUDA ........................................................71
IV.5. Fighting pests and diseases: the case of the Digital Early Warning Network ..................................73
IV.6. Using multiple ICTs to provide market information to 300,000 producers and entrepreneurs
in the Plurinational State of Bolivia .................................................................................................74
IV.7. Mobile financial services in Mexico: opportunities and challenges .................................................79
IV.8. Mobile money services for MSEs in Africa: the case of Orange Money ..........................................80
IV.9. Using smart cards to improve the efficiency of MFIs ......................................................................83
IV.10. Bringing smaller MFIs into mobile microfinance: the Kopo Kopo case ...........................................84
IV.11. How German Development Cooperation can support the successful roll-out of branchless
banking services ...........................................................................................................................86
V.1. Understanding the diverse ICT and business needs of women-owned MSEs in Kenya .................95
V.2. Supporting women entrepreneurs with ICT: lessons from the field .................................................98
Tables
I.1. Extent to which ICT policies cover private sector development in the Asia-Pacific .........................10
II.1. Effects of ICT use on enterprise performance in developing economies ........................................16
II.2. SMEs with access to mobile cellular phones for business purposes, 14 African economies (%) ....20
II.3. Average mobile revenue and minutes per user, selected economies and regions, 2010 ................23
II.4. Sales of computing devices and mobile handsets, 2009 and 2010 (quantity in millions) ................26
II.5. Economies in which no mobile broadband services had been launched by December 2010.........29
II.6. Skype out rates, US cents per minute, March 2011 ......................................................................36
II.7. Mobile versus fixed broadband pricing, selected economies, March 2011 (dollars) .......................39
III.1. UNCTAD core indicators for the ICT sector, selected developing and transition economies,
latest year .....................................................................................................................................47
III.2 Global telecommunications services market, 2006–2010 (billions of dollars)..................................49
III.3. Infrastructure participation in developing regions, 1990–2009 (number of economies,
millions of dollars) .........................................................................................................................50
III.4. Exports of computer and communications services, 2000 and 2009 ($ million, %) ........................53

viii INFORMATION ECONOMY REPORT 2011
III.5. Top 10 exporters of computer and information services, 2009 ($ million, %) .................................53
III.6. Status of competition in telecommunications services, countries allowing competition in each
market segment, 2010 (%) ............................................................................................................58
IV.1. International remittances as a share of GDP in 2008, and mobile cellular subscriptions
per 100 inhabitants in 2010, economies with a high reliance on remittances .................................81
VI.1. Overview of levels of policy intervention and relevant technical areas ..........................................103
Box Tables
III.2.1. The mobile money ecosystem in Kenya ........................................................................................52
Figures
I.1. Enterprises identifying various factors as major constraint, world average, 2010 (as percentages) ......4
I.2. Four facets of the ICT–PSD interface ..............................................................................................7
II.1. Persons with a non-VAT registered business reporting need for assistance in different areas,
South Africa, 2009 ........................................................................................................................17
II.2. Fixed telephone subscriptions per 100 inhabitants, by country group, 2000–2010........................18
II.3. Mobile cellular subscriptions per 100 inhabitants, by country group, 2000–2010 ..........................19
II.4. Top 20 economies by largest increase in mobile cellular subscriptions per 100 inhabitants,
2005–2010 ...................................................................................................................................19
II.5. Population covered by a voice mobile signal, by country group, 2000–2010 (%) ...........................20
II.6. Mobile money deployments, 2001–2011 (number of deployments) ...............................................21
II.7. Mobile money deployments, by region, April 2011 (number of deployments) ................................21
II.8. Average mobile money and bank prices across low, average and high value transactions,
2010 (PPP$, %) ............................................................................................................................22
II.9. Nokia total cost of ownership (TCO) mobile price basket, world average, 2005–2010 ($) ..............23
II.10. Price of SMS, prepaid, PPP$ cents, selected economies, 2010 ....................................................24
II.11. Enterprises using computers, selected economies, by enterprise size, latest year (%) ...................25
II.12. Internet users per 100 inhabitants, 2000–2010 .............................................................................26
II.13. Top 20 economies by largest increase in Internet users per 100 inhabitants,
2005–2010 ...................................................................................................................................27
II.14. Fixed broadband subscriptions per 100 inhabitants, by country group, 2000–2010 ......................28
II.15. Top 20 economies by largest increase in fixed broadband subscriptions per 100 inhabitants,
2005–2010 ...................................................................................................................................29
II.16. Average download speeds, selected economies, 2010 (Mbps) .....................................................30
II.17. International Internet bandwidth (Tbps) .........................................................................................31
II.18. Enterprises with own website, latest year (2006–2009) (%) ...........................................................31
II.19. Enterprises using the Internet, by enterprise size, latest year (%) ...................................................32
II.20. Enterprises using the Internet to place and receive orders, selected economies, 2008-2009 (%) ......33
II.21. Enterprises using the Internet to get information from and interact with Governments,
selected economies, latest year (%) ..............................................................................................34
II.22. Enterprises using the Internet via fixed broadband, selected economies, latest year (%) ...............35
II.23. Global subscriptions of voice over Internet Protocol, Q4 2005–Q2 2010 (millions) .........................36
II.24. Fixed broadband price index ($/Mbps) ..........................................................................................37
II.25. Price of monthly mobile data usage (2 MB per month), 2010 ($) ...................................................38
III.1. Value added of the ICT sector, by main components, selected economies, latest year
(as a percentage) ..........................................................................................................................48
III.2. Investment value of telecommunications infrastructure projects with private participation,
by region, 1990–2009 (millions of dollars) .....................................................................................50
III.3. Distribution of employment in the mobile sector along the mobile supply chain,
four selected economies (as percentages) ....................................................................................51

ixCONTENTS
IV.1. Impact of the online one-stop system on starting a business in Peru ............................................67
IV.2. Internet business registrations, 2009 ............................................................................................67
IV.3. Users reporting bribery, computerized versus manual government systems, India,
2006 (percentages) .......................................................................................................................69
Annex tables
I.1. Donor strategy documents reviewed ...........................................................................................119
II.1. Penetration of Selected ICTs, 2005 and 2010 or latest year (per 100 inhabitants)........................120
II.2. Use of computers by enterprise size, latest available reference year (%)
B1 - Proportion of businesses using computers ..........................................................................126
II.3. Use of Internet by enterprise size, latest available reference year (%)
B3 - Proportion of businesses using the Internet .........................................................................128
II.4. Type of enterprise connection to the Internet, by enterprise size (%)
B9 - Proportion of businesses using the Internet by type of access
(fixed broadband and mobile broadband) ....................................................................................130
II.5. Use of computers by economic activity (ISIC Rev 3.1), latest available reference year (%)
B1- Proportion of businesses using computers ...........................................................................132
II.6. Use of Internet by economic activity (ISIC Rev 3.1), latest available reference year (%)
B3- Proportion of businesses using the Internet ..........................................................................136
II.7. Use of the Internet by type of activity, latest available reference year
Enterprises with 10 or more persons employed ..........................................................................140

x INFORMATION ECONOMY REPORT 2011
LIST OF ABBREVIATIONS
ADB Asian Development Bank
AfDB African Development Bank
AOPEB Asociación de Organizaciones de Productores Ecológicos de Bolivia
APPM average price per minute
ARPU average revenue per user
ASYCUDA Automated System for Customs Data
B2B business-to-business
B2C business-to-consumer
BASIS Bangladeshi Software and Information Services Association
BDS business development services
BoP balance of payments
BPLS Business Permit and Licence System
BPO business process outsourcing
BSM Business Sophistication Modelling
CELAC Collecting and Exchange of Local Agricultural Content
CGAP Consultative Group to Assist the Poor
CESO Canadian Executive Service Organization
CIS Commonwealth of Independent States
CNBV Comisión Nacional Bancaria y de Valores
DCED Donor Committee for Enterprise Development
DPI United Nations Department of Public Information
EAC East African Community
ECOWAS Economic Community of West African States
ECX Ethiopia Commodity Exchange
EDI electronic data interchange
eGov4MD e-Governance for Municipal Development
FAO Food and Agricultural Organization of the United Nations
FATF Financial Action Task Force
FOSS free and open source software
GDP gross domestic product
GenARDIS Gender, Agriculture and Rural Development in the Information Society
GIZ Gesellschaft für Internationale Zusammenarbeit
GNI gross national income
GPRS general packet radio service
GSB Growing Small Businesses
GSMA GSM Association
IADB Inter-American Development Bank
ICIP Inveneo Certified ICT Partner
ICT information and communication technology
ICT4D ICT for Development
IFAD International Fund for Agricultural Development
IFC International Finance Corporation
IICD International Institute for Communication and Development
ILO International Labour Organization
IMF International Monetary Fund
IT information technology
ITC International Trade Centre UNCTAD/WTO
ITU International Telecommunication Union

xiLIST OF ABREVIATIONS
IVR Interactive Voice Receiver
KACE Kenya Agricultural Commodity Exchange
KADET Kenya Agency for the Development of Enterprise and Technology
KPO knowledge process outsourcing
KYC know your customer
LAC Latin America and the Caribbean
LDC least developed country
MDG Millennium Development Goal
MEST Meltwater Entrepreneurial School of Technology
MFA Ministry for Foreign Affairs (Finland)
MFI microfinance institution
mLab mobile applications laboratory
MNO mobile network operator
MoU minutes of use
MSEs micro- and small enterprises
NGO non-governmental organization
NICI National Information and Communication Infrastructure
NZAID New Zealand Aid Programme
OECD Organization for Economic Cooperation and Development
OPPAZ Organic Producers and Processors Association of Zambia
PC personal computer
POS point of sale
PSD private sector development
R&D research and development
RFID radio frequency identification technology
RIA Research ICT Africa
RPTS Real Property Tax System
SaaS Software as a Service
SACCOs savings and cooperative credit organizations
SEWA SEWA Self-Employed Women’s Association
SMEs small and medium-sized enterprises
SMEP Small and Micro Enterprise Programme
SMS short message service
SOE state-owned enterprise
TNC transnational corporation
UCC Uganda Communications Commission
UNCITRAL United Nations Commission on International Trade Law
UNCTAD United Nations Conference on Trade and Development
UNDESA United Nations Department of Economic and Social Affairs
UNDP United Nations Development Programme
UNECA United Nations Economic Commission for Africa
UNECLAC United Nations Economic Commission for Latin America and the Caribbean
UNESCAP United Nations Economic and Social Commission for Asia and the Pacific
UNIDO United Nations Industrial Development Organization
UNWTO World Tourism Organization
VAT value added tax
VoIP voice over Internet protocol
WOUGNET Women of Uganda Network
WSIS World Summit on the Information Society
WTO World Trade Organization
ZNFU Zambia National Farmers’ Union


xiiiEXECUTIVE SUMMARY
The Information Economy Report 2011 demonstrates
that effective use of information and communication
technologies (ICTs) in both the private and the public
sector can significantly contribute to and accelerate
progress in private sector development (PSD).
Governments and their development partners should
take a holistic and comprehensive approach to lever-
aging ICTs in PSD, although a review of PSD strategies
indicates that this is often not the practice. Similarly,
donor strategies often refer to the use of ICTs in PSD
in a peripheral manner only, if at all. On its own, new
technology will have limited effects on PSD. However,
when carefully integrated into policies and processes,
ICTs can reduce business costs, promote transpar-
ent, rules-based systems, and improve communica-
tion between the public and private sector. Govern-
ments need to work with the private sector to create
an investment climate and a business environment
that encourage the use of ICTs within private firms as
well as in government. The potential of ICTs can then
be realized, through adequate infrastructure and skills,
and a commitment by governments to making mar-
kets work effectively. In some areas, there is already
considerable experience and evidence to guide policy
initiatives. In other areas, where opportunities for ICTs
to contribute to PSD have emerged only in the past
few years (as in the case of mobile money services),
more analysis and testing of different business models
is needed to assess potential and identify best prac-
tices.
Enterprises face many challenges which reflect the
need to make markets work better, to make internal
management and production systems more efficient,
to facilitate improved access to information, knowl-
edge, financial services and other resources, and to
make business environments more transparent and
enabling. The effective use of ICTs can help to im-
prove all of these areas and thereby pave the way for
more enterprise creation and expansion. The Informa-
tion Economy Report 2011 identifies four facets of
the ICT–PSD interface, which serve as a basis for its
policy recommendations.
Firstly, the quality of the ICT infrastructure is an increas-
ingly vital determinant of the overall investment climate
of a country. Governments and their development
partners need to ensure that the ICT infrastructure
meets the needs of different kinds of enterprises, from
micro- and small enterprises (MSEs) to larger, transna-
tional corporations. Leveraging the opportunities cre-
ated by mobile telephony and its related services and
applications is particularly important for smaller enter-
prises in low-income countries. Mobile broadband will
require more attention in the coming years as a new
way for the private sector in developing countries to
leverage the Internet. In order to speed up the roll-out
of mobile broadband, Governments need to allocate
spectrum, and license operators to provide the ser-
vice. Indeed, at the end of 2010, some 50 developing
and transition economies were yet to launch mobile
broadband services.
Secondly, enterprises must be able to make the best
use possible of ICTs, as they positively affect produc-
tivity in both large and small enterprises. Different kinds
of ICTs help enterprises to manage their resources
more efficiently, access the information needed for
better business decision-making, reduce transaction
costs, and enhance their ability to bring products and
services to customers. Governments should play a
key role in enhancing business use of ICTs in PSD by
– for example – ensuring that relevant ICT tools and
services are available and affordable, and providing a
legal and regulatory framework that supports the up-
take and productive use of ICTs.
Thirdly, supporting the ICT sector itself is important.
The production of ICT goods and services is provid-
ing new opportunities for private firms to start up and
grow, create jobs, and spur innovation, thereby con-
tributing to overall economic growth. Governments
can create an enabling framework for the ICT sector to
expand by liberalizing the sector, enhancing competi-
tion in all segments, providing adequate regulations,
increasing trust in the use of ICT services, providing
training in ICT skills, nurturing ICT enterprises through
incubation and by establishing technology parks, and
using public procurement to create demand among
local ICT enterprises.
Fourthly, Governments and other institutions can ap-
ply ICTs to make PSD interventions more effective –
both in business environment reforms, and in the pro-
vision of business development, business information
and financial services. ICTs can reduce the cost of de-
livering such services, extend their reach, and improve
EXECUTIVE SUMMARY
xiv INFORMATION ECONOMY REPORT 2011
the functioning of markets. The Information Economy
Report 2011 gives some examples: agricultural exten-
sion services, providing business development train-
ing material online, establishing business helplines,
crowd-sourcing to detect and fight pests and dis-
eases, and ICT-related initiatives aimed at helping
small-scale producers to meet certification standards
and acquire the skills needed to boost exports. To be
successful, ICT–PSD solutions need to factor in both
user needs (in terms of what information and other
inputs are needed), and possible constraints (e.g. il-
literacy, aversion to using new tools, scarce electricity,
and unaffordable user charges and prices). Involving
the private sector in designing and providing training
and advisory services can help ensure that the ser-
vices offered are demand-driven. At the same time,
more research and rigorous impact assessments are
needed in order to identify best practices in this area.
The introduction of new mobile money systems is one
of the most promising opportunities for leveraging
ICTs for PSD. Mobile money systems have provided
increased access to finance for MSEs, which have tra-
ditionally had greater difficulty than larger enterprises
in benefiting from existing financial services. The sys-
tems allow for real-time transfer and receipt of small
amounts of funds at low cost, and can also reduce
the costs of processing and administering small loans,
thereby alleviating a significant disincentive for lend-
ers to extend credit to micro- and small enterprises.
At the same time, they raise important policy issues
and challenges for Governments, and deserve atten-
tion from policymakers and the research community in
order to ensure positive outcomes.
It is still too soon to fully assess the impact of mo-
bile money solutions on access by MSEs to financial
services. Uptake will accelerate as more enterprises
become active users of the systems, and when ser-
vices are well adapted to their needs. Key policy areas
requiring consideration are the institutional and regula-
tory framework, user issues, crime and security con-
siderations, and infrastructure. Many Governments
will have to pioneer new legislation and regulations,
and the international community should actively sup-
port the development of sound regulatory frameworks
and relevant institutions, as well as supporting the ex-
change of practice and expertise.
Another distinct area of PSD that can be better ad-
dressed by the use of ICTs is women’s entrepreneur-
ship. While ICTs do little to redress underlying societal
structures and economic systems that hamper oppor-
tunities for women entrepreneurs, they may be used
to overcome some of the challenges that women face,
including access to finance, limited skills and training,
lack of time due to family commitments, and limited
physical mobility. Initiatives and training programmes
must be developed bearing in mind these constraints,
and with the active participation of the women entre-
preneurs that they are to assist.
Finally, the Information Economy Report 2011 makes
a series of policy recommendations:
(a) Promote affordable access to relevant ICTs,
taking into consideration what improvements
in the ICT infrastructure are required to support
private sector activities.
(b) Enhance investment in, and the use of ICTs by,
private firms to reduce the costs of business
transactions, improve business management,
and enhance the capacity to get goods and
services to the market.
(c) Include ICT modules in business skills training
programmes. Such training may range from
providing advice on using mobile phones as
a business tool to more advanced training
in using technologies and applications to
improve operational management, customer
relationship management or resource planning.
(d) Adopt regulatory frameworks that help
to enhance confidence in the use of new
technology or new applications of known
technology. In many countries, adequate legal
and regulatory frameworks are still needed in
order to fully realize the potential of electronic
transactions.
(e) Facilitate the expansion of the ICT sector.
Governments should consider how best
to tap into new opportunities presented by
the production of ICT goods and services.
Governments could facilitate ICT growth and
employment creation through policy that is
aimed at improving the availability of skills,
stimulating demand for ICT uptake among local
firms, providing appropriate ICT infrastructure
and regulatory frameworks, promoting and
clustering entrepreneurship and innovations
through incubation and ICT parks, and using
government procurement.
(f) Make ICT use an integral part of business
environment reforms. When applied effectively,
ICT-based solutions have reduced the time and
cost of registering companies and obtaining
licences, and have increased government

xvEXECUTIVE SUMMARY
revenue and transparency. A simplified
company registration process may also
encourage informal enterprises to formalize
– another key PSD objective. ICTs have been
able to connect formal and informal businesses
to market opportunities, and it should also
be possible to connect them to government
programmes and services.
(g) Leverage different ICT tools in the delivery
of business development and information
services. Better use of ICTs could extend the
reach of BDS to new and growing enterprises,
by overcoming the tyranny of distance and
reducing the cost of service delivery.
(h) Leverage mobile money services to create
more inclusive financial markets. Mobile
money services hold great promise in
reducing the costs of providing financial
services, especially to MSEs. The international
community should support the development
of regulatory frameworks and institutions.
(i) Recognize the ICT potential in existing or new
initiatives to support women entrepreneurs.
More programme and policy attention should
be given to the use of ICTs in addressing the
specific needs of women entrepreneurs.
(j) Better reflect ICTs in donor PSD strategies.
Strategies should address the ICT–PSD
interface in a comprehensive way and explicitly
recognize the importance of multi-level use of
ICTs.
(k) Develop guidelines for donors. In collaboration
with UNCTAD and other relevant organizations,
the Donor Committee for Enterprise
Development could develop guidelines for
donor and development agencies, and their
programmatic partners, on how to best
integrate ICTs into PSD strategies. Such
guidelines would help to establish a bridge
between donor assistance related to PSD
and donor assistance related to ICT for
development.
(l) Make interventions more demand-driven,
and leverage partnerships. To enhance ICTs’
contribution to PSD, policies must be designed
and implemented with a solid understanding
of the specific needs and situation of diverse
enterprises. The input and engagement
of enterprises in programme design and
implementation should be sought. Such a
demand-driven approach will require effective
partnerships between Governments, donors,
the private sector and civil society.
(m) Devote adequate resources to the measurement
of ICT use and impact assessments. There is
an absence of systematic, evidence-based
impact evaluation regarding the use of ICTs to
promote PSD, resulting in reliance on anecdotal
evidence. There is a need for reliable and
internationally comparable statistics related to
both enterprise and government use of ICTs,
and for more comprehensive project and
policy evaluations based on empirical evidence
conducted through independent research.
A vibrant private sector contributes to building the
foundations in an economy to generate the resourc-
es needed to address the Millennium Development
Goals. It is time for Governments and their develop-
ment partners to start integrating ICT solutions in a
systematic and comprehensive way when designing
and implementing interventions aimed at nurturing the
private sector. It is hoped that the analysis and rec-
ommendations presented in the Information Economy
Report 2011 will provide valuable input into this pro-
cess.
Supachai Panitchpakdi
Secretary-General, UNCTAD


There is growing potential for information and communication
technologies (ICTs) to contribute to the social and economic prog-
ress of developing countries. The Information Economy Report
2010 showed how ICT use by micro- and small enterprises (MSEs)
has often improved not only business performance but also liveli-
hoods (UNCTAD, 2010). Thanks to the mobile revolution, many
entrepreneurs in developing countries now have – for the first time
– a real possibility of benefiting from ICTs in their activities, with
enhanced productivity as a result. By improving communication
along the value chain, both domestically and internationally, the
application of relevant ICTs can greatly enhance the competitive-
ness of the enterprise sector as a whole.
At the same time, in their efforts towards promoting an expansion
and upgrading of the private sector, Governments and their various
partners are far from taking full advantage of the opportunities that
are emerging in the new ICT landscape. This is evident from the rela-
tively limited attention that has been given to ICTs in strategies aimed
at promoting private sector development (PSD). Against this back-
ground, the Information Economy Report 2011 is devoted to exploring
areas in which a more effective use of ICTs – by different stakeholders
– would facilitate the creation of new and expanding enterprises in
developing countries.
This first chapter introduces the relevant issues. It emphasizes
the importance of developing the private sector, identifies the
various facets of the ICT–PSD interface, and reviews the state of
play with regard to how the ICT dimension is captured in current
PSD strategies. The chapter concludes with a roadmap to the rest
of the Report.
PRIVATE SECTOR DEVELOPMENTAND THE ROLE OF ICTs 1
2 INFORMATION ECONOMY REPORT 2011
“
”
A. DEVELOPING THE PRIVATE SECTOR – A KEY DEVELOPMENT OBJECTIVE
A dynamic, broadly based, well-functioning
and socially responsible private sector is a
valuable instrument for increasing investment
and trade, employment and innovation,
thereby generating economic growth and
eradicating poverty and serving as an
engine for industrialization and structural
transformation. The private sector therefore
is a key to sustained, inclusive and equitable
economic growth and sustainable development
in LDCs.
Programme of Action for the Least Developed
Countries for the Decade 2011–2020, para. 54
1. Why an expanding private sector matters
The private sector (defined in box I.1) plays a central
role in achieving sustained and equitable economic
growth and development. The countries that have
been the most successful in creating wealth and re-
ducing poverty are those that have managed to sus-
tain high economic growth over prolonged periods,
typically by increasing agricultural productivity and
then by dynamic growth of modern industry and ser-
vices sectors.1 The creation of private sector jobs is
both a source of income – and often empowerment –
for entrepreneurs as well as for workers, and a source
of taxation for Governments. Thus, a vibrant private
sector also contributes to building the foundation in an
economy to generate the resources needed to finance
investments in social welfare.
Most developing countries, as well as their development
partners, recognize the relevance of developing the pri-
vate sector. In Africa, for example, the private sector is
seen as the most important agent for the realization of
growth objectives and poverty reduction targets (UN-
ECA, 2009: 2). For some time now, support for PSD
has been an important ingredient in development and
donor agencies’ strategies to boost economic growth
and achieve a “more equitable diffusion of the benefits
of growth” (OECD, 1995: 6). Indeed, development of
the private sector is essential for the attainment of most
of the Millennium Development Goals (MDGs).
Foreign and domestic flows of private investment
complement other sources of financing for develop-
ment, including official development assistance and
remittances, and boost the capacity of develop-
ing economies to grow and create new productive
and decent work opportunities and to reduce pov-
erty (DPI, 2003). Private investment in infrastructure
projects can relieve pressure on public budgets and
enable Governments to redirect more resources to
social spending. It can also improve the delivery ef-
ficiency of essential services and extend these to
the poor (ADB, 2000; IADB et al., 2004; UNECA,
2009). In addition, PSD can empower poor people
by providing them with services and consumer prod-
ucts, increasing choices and reducing prices (UNDP,
2004).
2. Barriers to enterprise creation and expansion
Various internal and external factors impede the com-
petitiveness and profitability of private enterprises in
developing countries. Some of the main internal fac-
tors are the limited levels of organizational and finan-
cial management skill, business experience, financial
resources, and technical or production skill. Many
MSEs also face serious limitations in their access to
information and knowledge, although their needs vary
considerably, between different kinds of enterprises
and depending on their market orientation (UNCTAD,
2010).
For subsistence-based enterprises (i.e. those that
provide the most direct livelihood support for the
poor), accessing client markets (especially distant
markets) presents a particular challenge, requiring in-
teraction with market intermediaries. Enterprises serv-
ing local markets often rely on information delivered
informally through local networks of communication.
Lack of timeliness of information is a serious failure of
the information delivery system currently used, and a
significant aspect of the vulnerability of subsistence-
based enterprises to changes in the surrounding envi-
ronment (Duncombe and Heeks, 2002). The quantity
and range of information received through traditional
channels is an issue too, with barriers including litera-
cy and language. Weaknesses in informal information-
sourcing should similarly be recognized.2
Growth-oriented enterprises frequently seek to ex-
tend their market reach. Their sectoral value chains
often reach beyond the local area to main centres of

3CHAPTER I : PRIVATE SECTOR DEVELOPMENT AND THE ROLE OF ICTs
population, and sometimes across national bound-
aries. A higher degree of integration of enterprises
into market systems requires more formalization of
information systems (Gelb et al., 2009; Duncombe
and Molla, 2009; Murphy, 2002). Particular charac-
teristics of the transition towards greater formaliza-
tion include (a) demand for an increased volume and
complexity of information, as the value of information
is better recognized; (b) reduced information needs
gaps, as internal capacity to meet information needs
rises; and (c) greater emphasis on external commu-
nication.
Linking into global value chains is one potential way
for enterprises in developing countries to access high-
volume markets for a broad range of primary and
manufactured products. But in order to participate in
such value chains, enterprises need to have the ca-
pacity to handle large-scale production for exports,
and they need to conform with strict quality standards
(UNCTAD, 2007). This often requires a far higher de-
gree of formalization of information systems (Parikh et
al., 2007). Those who lack the capacity and opportu-
nity to comply tend to be marginalized and excluded
from global value chains (Kaplinsky and Morris, 2001;
McCormick, 1999).
There are also various external factors that need to be
addressed in order to help MSEs become more pro-
ductive and competitive. As noted in the Programme
of Action for the Least Developed Countries for the
Decade 2011–2020 (para. 55): “structural constraints,
particularly infrastructural bottlenecks, and institu-
tional constraints have limited the growth of the pri-
vate sector”. External limitations include the markets
in which MSEs operate, and the policies, laws and
regulations that Governments put in place to regulate
and promote business activities, as well as the orga-
nizational arrangements, skills availability and quality
of infrastructure that surround the enterprise. Thus,
an “enabling” external environment is an important
element in the promotion of MSEs, as well as other
enterprises. The cost of a poor business environment
can amount to over 25 per cent of sales, or more
than three times what firms pay in taxes (World Bank,
2004). In addition, barriers to competition caused by
poor policies, laws and regulations have been found
to benefit some firms, while denying opportunities and
increasing costs to others, as well as to consumers.
These barriers weaken incentives for private firms to
innovate and improve their productivity.3
Taken together, internal and external constraints of-
ten place smaller firms at a disadvantage vis-à-vis
larger enterprises, in terms of accessing critical input,
reaching out to markets, and coping with government
regulations. The World Bank has identified barriers
that impact on existing enterprise activities, based on
interviews with firms of different sizes from around the
world. The most significant constraints were found
to be related to tax rates, corruption and electricity
(fig. I.1). Depending on the situation, some barriers
and constraints are more or less pronounced. Boxes
I.2 and I.3 provide insights into the experiences from
Latin America and Africa, respectively.
Box I.1. Defining the private sector
The Information Economy Report 2011 uses the term “private sector” to refer to the sector of the economy that is pri-
vately owned, either by an individual or by a group of individuals, in any sector, including agriculture. This includes micro-,
small, medium-sized and large enterprises, as well as transnational corporations (TNCs). It encompasses unregistered
firms, family-owned enterprises, sole proprietors, incorporated companies, and cooperatives. Private enterprises are the
entities that are used to mobilize available resources and to direct them towards the provision of the goods and services
that the market demands.
The composition of the private sector varies greatly across countries. This Report focuses on MSEs, which are often
the main focus of Governments’ PSD strategies. At the same time, much interaction takes place between companies
of different sizes and from different sectors. Symbiotic relationships between small and large enterprises may appear,
in industries ranging from subsistence farming to sophisticated economic activities such as research and development
(R&D) in high-technology areas. In describing the full range of activities that are required to bring a good or service from
its initial conception to its end use, the value chain concept provides a useful basis for systematic analysis of the linkages
and interactions required for an enterprise to operate and trade in a market (Gereffi, 1999; Humphrey, 2003; Porter, 1985).
Source: UNCTAD.

4 INFORMATION ECONOMY REPORT 2011
35
24
15
37
17
32
31
39
21
17
12
26
Tax rates
Tax administration
Licensing and permits
Corruption
Courts
Informal sector competitors
Access to finance
Electricity
Transportation
Customs and trade regulations
Labour regulations
Labour skill level
Percentage0 5 10 15 20 25 30 35 40 45
Figure I.1. Enterprises identifying various factors as major constraint, world average, 2010 (as percentages)
Source: World Bank Enterprise Surveys.
Box I.2. Factors explaining low productivity in Latin America and the Caribbean
As part of the process of developing a new strategy for the promotion of PSD, the Inter-American Development Bank
(IADB) has sought to identify the key barriers to increased productivity among private enterprises in Latin America and the
Caribbean (LAC). Some of the most important barriers are highlighted below.
Among the barriers that are facing the private sector and are impeding investment, expansion of firms, job creation and
sustainable growth, the IADB has highlighted (a) basic infrastructure deficits; (b) institutional failures, such as unclear
rules, poorly defined property rights, unreliable enforcement mechanisms and inequitable tax and customs regimes; and
(c) market failures related to financing gaps and information asymmetries.
Limited access to financial services and capital markets was another area of concern. In many LAC countries, finance
is viewed as a binding constraint on firms’ growth and productivity improvements. The situation is the most precarious
for micro-enterprises, of which fewer than 8 per cent have access to credit from financial institutions.
High levels of informality also reduce productivity. This is a persistent feature in the region. Informality limits access to
productivity-enhancing services, particularly finance and access to legal recourse. Also, the activities of informal firms
sometimes undercut the profitability of enterprises in the formal sector.
Limited innovation activity similarly keeps productivity growth low (Griliches, 1979). In terms of adoption of new ICTs, LAC
enterprises tend to lag behind other regions for several reasons, including limited quality and coverage of telecommuni-
cations infrastructure, regulatory issues that raise connectivity costs, a lack of ICT literacy, and the absence of financial
instruments to make technology adoption attractive to smaller firms.
Other barriers noted include low skill levels on the part of workers and management, inadequate infrastructure for
competitiveness and trade (especially with regard to transport and electricity), and high volatility and risk.
Source: IADB (2011a).

5CHAPTER I : PRIVATE SECTOR DEVELOPMENT AND THE ROLE OF ICTs
3. Promoting private sector development
Private sector development aims to increase the
number of private enterprises that start up, survive,
upgrade and expand. This can be achieved by ad-
dressing the internal and external constraints that af-
fect enterprises. Improvements in these areas allow
private enterprises to become more productive and
more competitive, and, as a result, more profitable –
which can lead to greater levels of investment.
PSD typically takes a broad approach to the achieve-
ment of national development goals, but within this
broad approach, the role of MSEs requires specific
attention, not least to reach the poor and to reduce
poverty (Chen, 2005).4 Moreover, MSEs often account
for up to 99 per cent of all enterprises in low-income
countries. Whereas they may enjoy certain advantag-
es compared with larger firms (e.g. in terms of flexibil-
ity), they also face particular challenges, with potential
negative effects on their productivity and their abil-
ity to survive and compete (UNCTAD, 2005b). Com-
pared with large enterprises, they have fewer internal
resources, and they often have to operate in volatile
niche markets.
Micro-enterprises, as well as small and medium-sized
enterprises (SMEs), are often given particular attention
within PSD work. Many developing countries are fa-
miliar with the problem of the “missing middle”, where
a high number of informal sector micro-enterprises are
found alongside a few large firms, creating a gap left
by the absence of formal SMEs (UNCTAD, 2006b).5
The contribution of the informal sector to gross do-
mestic product (GDP) is estimated at 30 per cent in
Latin America, 31 per cent in Asia, and 64 per cent in
sub-Saharan Africa (OECD, 2009).
It is similarly important to recognize the gender dimen-
sion of PSD, not least to “make better use of untapped
economic potential”.6 While women are active in the
private enterprise sector in most developing econo-
mies, their representation in the MSE sector and in the
informal sector is, in general, disproportionately high.
Many women support themselves and their families
through the income they receive from their entrepre-
neurial activities, making supporting women’s entre-
preneurship important to family well-being (Kantor,
2001). Moreover, some constraints on the growth of
MSEs “do not affect men’s and women’s business-
es in the same way, since men-owned and women-
owned businesses do not operate in the same sectors
or locations, or have equal access, control, and use
of the same resources and marketing outlets” (Esim
2001: 9; see also Chapter V).
Various kinds of intervention can be used to promote
PSD in developing economies. Governments and
Box I.3. Barriers to private sector development in Africa
Across the African continent, the private sector is seen as the most important agent of growth, and hence of poverty
reduction. A review undertaken by the United Nations Economic Commission for Africa (UNECA) has concluded that
African firms face various external challenges in areas such as starting a business, getting the requisite licences, legal re-
gimes for hiring and firing workers, registering property, obtaining credit, protecting investments and enforcing contracts.
The top constraint for the African continent as a whole was related to access to finance. This reflects high demand from
lenders for collateral, the perceived high risk of loan default, and high transaction costs. African managers ranked cor-
ruption as the second most serious problem, meaning that enhanced transparency in the regulatory environment would
be a welcome improvement.
Related to this, inefficient government bureaucracy was the third most cited problem. This translates into more time
consumed and higher costs for starting up a business, registering property, or expanding an already existing activity. In
sub-Saharan Africa, complying with tax laws takes 321 hours per year on average, but it may take up to 1,400 hours
in some countries. In the case of customs management, Africa performs weakly. For instance, customs clearance time
ranges from 1 day in Ethiopia to 25 days in Nigeria, with an average for the continent of 12.7 days. Inadequate supply
of infrastructure was the fourth constraint identified. While major private sector investments in telecommunications infra-
structure have contributed greatly to improving the situation, remaining weaknesses in this area are holding back Africa’s
development.
Thus, priority interventions were primarily called for within the financial markets, in institutional transformation (translated
into fighting corruption and bureaucracy), and for the improvement of infrastructure – including with regard to ICTs.
Source: UNECA (2009).

6 INFORMATION ECONOMY REPORT 2011
their development partners – including civil society
and business organizations, and international donor
and development agencies – can support the devel-
opment of the private sector. PSD promotion can be
organized into three levels: macro-, meso- and micro-
level interventions.7
Macro-level interventions focus on making the broad-
er investment climate more attractive to private sector
activities. Key concerns here include the development
of an open, competitive economy, macroeconomic
stability, provision of the infrastructure and education
system necessary to stimulate economic growth, and
the establishment of rule of law. Specific interventions
may aim at improving governance and strengthening
state institutions, liberalizing the economy, privatizing
state-owned enterprises (SOEs), establishing compe-
tition laws and institutions, reforming financial institu-
tions, and mobilizing private investment for infrastruc-
ture development.
Improvements at the meso level seek to create a more
enabling environment for enterprise growth – i.e. an
environment that displays well-designed, sensibly en-
forced regulations (avoiding unnecessary red tape)
and is consistent with an open, innovative and grow-
ing business community and with a competitive econ-
omy. Interventions at this level are geared towards
strengthening the institutions that affect the perfor-
mance of the private sector. This includes government
institutions that regulate and support private enterpris-
es, as well as the mechanisms through which private
enterprises organize and participate in public–private
dialogue. Close interaction with the private sector is
of essence, in order to allow the Government to un-
derstand the needs and opportunities of businesses in
specific sectors and activities.
Micro-level interventions target private enterprises,
either directly, or through intermediary organizations
such as government agencies, private service pro-
viders, community-based organizations, business
associations, or chambers of commerce. These in-
terventions attempt to address enterprises’ internal
constraints, by providing training and information, fa-
cilitating business linkages, and improving access to
finance to enhance the capacity of private enterprises
to start up and grow. In recent years, increased at-
tention has been paid to the functioning of the mar-
kets in which enterprises operate, and to developing
systemic responses to the needs and capacities of
targeted firms. The role of enterprises within specific
sectors and value chains has also become a critical
area of focus.
Whereas Governments and donor agencies have in-
creasingly shifted the emphasis towards interventions
at the meso and macro levels, micro-level interven-
tions still have an important role to play. Improvements
to the investment climate and business environment,
which help to stimulate markets for PSD and mobilize
investment, are “not enough to maximize the invest-
ment potential in developing countries” (OECD, 2005:
14). In Latin America and the Caribbean, for example,
the removal of barriers to entry, and improved compe-
tition, have not been sufficient to stimulate innovation
within and among firms. The need for specific policy
instruments to promote innovation has been recog-
nized, especially after a process of deregulation and
trade liberalization (Lederman, 2009).
B. FACETS OF THE ICT–PSD INTERFACE
ICTs can contribute to a broad range of aspects on
the PSD agenda. Many of the challenges and con-
straints facing enterprises are associated with a need
to make markets work better, to make internal man-
agement systems more efficient, to facilitate improved
access to information and other resources, to en-
hance transparency, and to make environments more
enabling. These are all domains in which the effective
application of ICTs can make a significant difference
(UNCTAD, 2009a and 2010). ICTs thereby contribute
to creating a business environment that is more con-
ducive to PSD, and open new ways of communication
among and between enterprises and Governments.
The role of ICTs in the context of PSD can be viewed
from at least four perspectives (fig. I.2). The first per-
spective, which is concerned with the broad invest-
ment climate for private firms, includes the provision
of affordable access to relevant ICT infrastructure and
services. There are two private sector aspects to ICT
infrastructure. On the one hand, ICT infrastructure is
an increasingly critical input for the development of the
private sector. On the other hand, the private sector
itself has a leading role in the development of ICT net-
works and services.
The second perspective is related to business use of
ICTs. ICT use can lower transaction costs, help firms
obtain information about new market opportunities,
improve their communication along the value chain,
and broaden the ways in which products and services
are provided to the customer. Private firms invest in
ICTs to become more productive and more competi-

7CHAPTER I : PRIVATE SECTOR DEVELOPMENT AND THE ROLE OF ICTs
tive. Policy efforts to enhance the productivity of the
private sector may therefore seek to boost the uptake
and productive use of different ICTs.
The third perspective is to promote the ICT sector it-
self. The production of ICT goods and services repre-
sents in itself an important part of the private sector,
which can be stimulated in order to create opportuni-
ties for private firms to start up and grow. Opportuni-
ties are emerging both in manufacturing and in ser-
vices, and also in business activities that have been
enabled by improved access to ICTs. Examples of the
latter include various forms of business process out-
sourcing (BPO), and micro-enterprises in the mobile
sector (chapter III). Governments may adopt mea-
sures that aim to strengthen the ICT-producing sector.
The fourth perspective relates to the various ways in
which Governments and other relevant institutions
can make use of ICTs to create an enabling business
environment. This involves regulating and promoting
private sector activities, including through various e-
government and business support programmes. Sim-
ilarly, Governments have a role to play in developing
and implementing a legal and regulatory framework
that makes it possible for ICTs to help markets func-
tion better. Recent technological developments have
created completely new ways of leveraging ICTs in this
context to reduce the cost of delivering services, ex-
tend the reach of services, and improve the function-
ing of markets.
All four facets of the ICT–PSD interface are relevant.
However, their nature and significance vary, depend-
ing on the specific situation and on the policy priorities
of Governments. Even with such caveats in mind, it is
clear that effective use of ICTs can contribute in sev-
eral ways to enhancing the performance of the private
sector.
C. THE ICT–PSD DIMENSION IN DEVELOPMENT STRATEGIES
An important starting point, in order for policy inter-
ventions to generate full benefits from ICT use in sup-
port of PSD, is for Governments, donors and other
stakeholders to specify in their PSD and other devel-
opment strategies how ICTs can make a difference.
This section reviews the current state of play in that
area.
1. The PSD strategies of development partners
In its practical guidance for development agencies
on how to support business environment reforms,
the Donor Committee for Enterprise Development
(DCED) succinctly explained why development part-
ners should pay attention to the role of ICTs (DCED,
2008: 16–17):
“Development agencies are advised to consider
the ways in which they can support the introduc-
tion or upgrading of information and communi-
cations technology (ICT) to improve regulatory
processes and provide a more effective commu-
nications channel to constituent businesses. The
potential benefits arising from the effective use of
ICT, as part of a larger regulatory simplification
initiative, can include some or all of the following:
(a) increased efficiency of the reformed regulatory
processes;
(b) reduced scope for official corruption;
(c) improved information availability and
transparency;
(d) reduced obstacles to formality;
(e) increased tax compliance and government
revenue generation; and
(f) improved facilitation of new investment
projects.”
ICT and
private sector
development
Strengthening
the ICT
infrastructure
Enhancing
ICT
use in
enterprises
Promoting
the ICT
producing
sector
Using ICTs
to make PSD
interventions
more effective
Figure I.2. Four facets of the ICT-PSD interface
Source: UNCTAD.

8 INFORMATION ECONOMY REPORT 2011
Despite these and other opportunities for ICTs to con-
tribute to PSD, relatively few development partners
have so far paid much attention to the ICT dimension
in their strategy documents. This section presents the
results of a review of available PSD strategies issued
during the past few years by selected bilateral and
multilateral development agencies. Most of the strate-
gies were formulated in 2007 or later, while some are
considerably older. The results from the desk review
were complemented by direct interaction with the rel-
evant agencies.
A total of 22 PSD strategies formulated by bilateral
development agencies or ministries of foreign affairs
were considered (annex table I.1). Out of these, nine
(41 per cent) made no reference to the ICT dimension.
In seven documents, ICTs were mentioned as an im-
portant part of a country’s infrastructure. For example,
the Aid for Trade Action Plan of Finland notes that “ICT
is also a key element of economic infrastructure” (MFA,
2008: 19). The New Zealand Aid Programme (NZAID,
2008: 27) notes that effective “communications and
infrastructure, including […] information and commu-
nications technology, provide an essential foundation
for economic growth and wider development efforts.”
Two PSD strategy documents highlight promotion of
the ICT producing sector. The first document men-
tions the growing opportunities for outsourcing of ICT
services to developing countries, and the importance
of removing related trade barriers (Ministry of Foreign
Affairs, Netherlands, 2007: 7). Meanwhile, the Finnish
Aid for Trade Action Plan singles out the Information
Society as one of its priority targets.
In two donor strategies, the ICT dimension is reflected
through the promotion of greater ICT use in enterpris-
es. For example, a comprehensive study by Germany’s
GTZ (now GIZ) on sustainable economic development
in Asia notes that Governments “often try to influence
the broad direction of structural change without fa-
vouring specific industries, for example by […] foster-
ing the use of ICT” (GTZ, 2008: 136). A Spanish PSD
strategy document explicitly stresses the role of ICT
use in enhancing enterprise productivity (Ministerio de
Asuntos Exteriores y de Cooperación, 2005).
Finally, six strategies recognize the opportunities that
ICTs provide for making PSD interventions more ef-
fective. Australia sees a need to strengthen the mar-
ket for business development services by, among
other things, building the capacity of local trainers
to develop in the area of information technology (IT)
(Commonwealth of Australia, 2000: 18). The Ministry
of Foreign Affairs, Netherlands (2007) notes that by
using ICTs, the International Institute for Communica-
tion and Development (IICD) has helped to improve
the livelihoods of small-scale farmers, for example by
providing them with knowledge of markets. The Swiss
Agency for Development and Cooperation (2007) rec-
ognizes the potential of mobile money services, while
the Japan International Cooperation Agency (undated
document) emphasizes the importance of using ICTs
to make trade facilitation procedures more effective.
Among the eight multilateral strategy documents
reviewed for this report, ICTs were given somewhat
more attention; six of the papers refer to such tech-
nologies. However, neither the African Develop-
ment Bank (2008) nor the Asian Development Bank
(2006) makes a link to the role of ICTs in its PSD
document.
Only one of the eight documents touches upon ICTs in
the context of infrastructure development (ILO, 2007).
The United Nations Development Programme (UNDP)
gives considerable attention to the ICT sector within
its PSD work. For example, the ICT sector is included
among the industries covered by the Growing Small
Businesses (GSB) programme (UNDP, 2008a). More-
over, UNDP’s Global ICT Skills Building Programme is
helping to narrow the digital divide in 10 countries in
Africa, Asia, Latin America and Eastern Europe, by ex-
panding ICT access to underprivileged groups.
Two documents note the importance of promoting
greater ICT use in enterprises. For example, UNIDO
(2009: 37) states that “helping businesses in these
countries to gain access to business information and
ICTs plays an important role in overcoming these de-
velopment hurdles. The gradual creation of such an
information society in developing countries, and par-
ticularly in LDCs, is a key prerequisite for stimulating
increased innovation, productivity, competitiveness,
and market linkages.” Similarly, ILO cites access to
ICTs as one important determinant of the productiv-
ity of firms (ILO, 2007: 12): “To develop international
competitiveness, enterprises need to keep pace with
international developments in […ICTs and] knowledge
management.” In the area of rural development, the
same document finds that new advances in ICTs “can
help rural agricultural-based and non-farm enterprises
respond in a more timely fashion to changing market
opportunities and to market niches resulting from their
isolation, thereby turning disadvantage into advan-
tage” (ibid.: 146).

9CHAPTER I : PRIVATE SECTOR DEVELOPMENT AND THE ROLE OF ICTs
The area in which the multilateral agencies most fre-
quently cite opportunities for ICTs to make a differ-
ence is related to their application to make PSD in-
terventions more effective. The International Finance
Corporation (IFC), for example, has developed its
SME Toolkit, which uses ICTs to help SMEs in emerg-
ing markets learn sustainable business management
practices (IFC, 2007b). ILO (2007) recognizes the po-
tential of mobile microfinance to facilitate transactions,
of radio programmes to support small businesses,
and of the effective use of ICTs to improve access to
services provided by business associations.
The PSD strategy of OECD (2006a) notes that ICTs can
help simplify administration, improve small business
development services with a view to providing targeted
assistance to expand existing activities, penetrate new
markets, and improve efficiency. There is also reference
to ICT applications geared towards women producers.
Meanwhile, UNIDO (2009) stresses that building bridg-
es between Government and industry is vital to reduc-
ing bureaucratic complexities and facilitating access to
key information. Electronic portals that offer access to
integrated information on aspects such as regulatory
mandates, support institutions and generic business
advice are especially helpful for SMEs and entrepre-
neurs. According to the paper, such e-government
solutions can facilitate the delivery of industry-specific
public services, because, firstly, they contribute to in-
creasing the transparency, effectiveness and coverage
of such services, and secondly, they set standards for
ICT usage, particularly among SMEs.
In summary, despite the DCED recommendation to
give due attention to the introduction or upgrading of
ICTs, many donor strategies related to PSD do not
mention ICT at all. Moreover, among those strategy
documents that do recognize the opportunities offered
by ICTs, the recognition is often only given in a periph-
eral way – for example, only highlighting a specific is-
sue. Few strategy papers consider the broad spectrum
in which such technologies could make a difference.
2. National PSD and ICT strategiesThe potential that ICTs offer for PSD is more often re-
flected in national strategies, though there is room for
improvement in this case too. The findings presented
in this section draw on several surveys and reviews
conducted by UNCTAD, UNECA, UNECLAC and UN-
ESCAP.
a. Africa
The link between ICTs and PSD has been recognized
by many African Governments, as demonstrated in
their national strategy documents – notably in National
Box I.4. Examples of links between ICTs and PSD in national strategies in Africa
In Ghana’s Second Medium-Term Private Sector Development Strategy, the overriding focus is to develop a private
sector that creates jobs and enhances livelihoods for all. To this end, the strategy envisages, among other things, that
the Government and the public sector should focus on improving the quality of ICT infrastructure.
In Mali, the Strategic Framework for Growth and Poverty Reduction 2007–2011 identifies PSD through SMEs as a
priority pillar, and puts an emphasis on ICTs, among other services. It places priority on several ICT-related activities, namely
ICT skills, universal access to information through computerization, private investment in cybercentres and multi-purpose
community centres, the provision and use of market information, and better telecommunications infrastructure.
In Nigeria, the National Economic, Empowerment and Development Strategy emphasizes private sector growth
to support the development agenda in all sectors, including ICTs. Meanwhile, the national ICT policy identifies
programmes to enhance the role of the private sector in ICT developments, including the establishment of the
National ICT Statistical Information Service; the development of e-banking, e-commerce, e-trade, and electronic
financial services; the development of a local ICT industry; software development and technology parks; programmes
for the utilization and development of ICT in industry; and BPO services.
In its second NICI (2006–2010), the Government of Rwanda stated its intention to make Rwanda an information and
knowledge-based economy and society. This strategy identified activities that pertain to all four aspects of the ICT–PSD
interface. These include the development of a national ICT infrastructure; the creation of an enabling environment to
deploy and use ICTs; the development of a local ICT industry and of human resources; the development of e-commerce;
and the development of standards, practices and guidelines to deploy ICTs and to contribute to the development of
e-government.
Source: Information provided by UNECA.
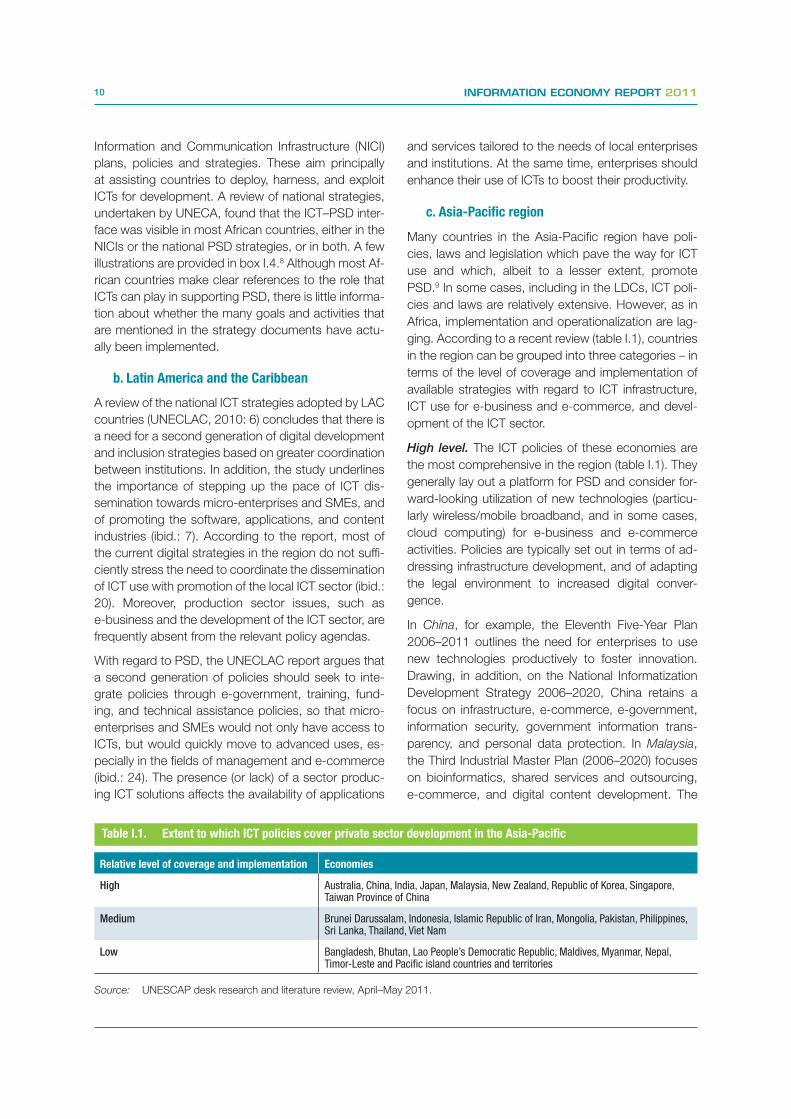
10 INFORMATION ECONOMY REPORT 2011
Information and Communication Infrastructure (NICI)
plans, policies and strategies. These aim principally
at assisting countries to deploy, harness, and exploit
ICTs for development. A review of national strategies,
undertaken by UNECA, found that the ICT–PSD inter-
face was visible in most African countries, either in the
NICIs or the national PSD strategies, or in both. A few
illustrations are provided in box I.4.8 Although most Af-
rican countries make clear references to the role that
ICTs can play in supporting PSD, there is little informa-
tion about whether the many goals and activities that
are mentioned in the strategy documents have actu-
ally been implemented.
b. Latin America and the Caribbean
A review of the national ICT strategies adopted by LAC
countries (UNECLAC, 2010: 6) concludes that there is
a need for a second generation of digital development
and inclusion strategies based on greater coordination
between institutions. In addition, the study underlines
the importance of stepping up the pace of ICT dis-
semination towards micro-enterprises and SMEs, and
of promoting the software, applications, and content
industries (ibid.: 7). According to the report, most of
the current digital strategies in the region do not suffi-
ciently stress the need to coordinate the dissemination
of ICT use with promotion of the local ICT sector (ibid.:
20). Moreover, production sector issues, such as
e-business and the development of the ICT sector, are
frequently absent from the relevant policy agendas.
With regard to PSD, the UNECLAC report argues that
a second generation of policies should seek to inte-
grate policies through e-government, training, fund-
ing, and technical assistance policies, so that micro-
enterprises and SMEs would not only have access to
ICTs, but would quickly move to advanced uses, es-
pecially in the fields of management and e-commerce
(ibid.: 24). The presence (or lack) of a sector produc-
ing ICT solutions affects the availability of applications
and services tailored to the needs of local enterprises
and institutions. At the same time, enterprises should
enhance their use of ICTs to boost their productivity.
c. Asia-Pacific region
Many countries in the Asia-Pacific region have poli-
cies, laws and legislation which pave the way for ICT
use and which, albeit to a lesser extent, promote
PSD.9 In some cases, including in the LDCs, ICT poli-
cies and laws are relatively extensive. However, as in
Africa, implementation and operationalization are lag-
ging. According to a recent review (table I.1), countries
in the region can be grouped into three categories – in
terms of the level of coverage and implementation of
available strategies with regard to ICT infrastructure,
ICT use for e-business and e-commerce, and devel-
opment of the ICT sector.
High level. The ICT policies of these economies are
the most comprehensive in the region (table I.1). They
generally lay out a platform for PSD and consider for-
ward-looking utilization of new technologies (particu-
larly wireless/mobile broadband, and in some cases,
cloud computing) for e-business and e-commerce
activities. Policies are typically set out in terms of ad-
dressing infrastructure development, and of adapting
the legal environment to increased digital conver-
gence.
In China, for example, the Eleventh Five-Year Plan
2006–2011 outlines the need for enterprises to use
new technologies productively to foster innovation.
Drawing, in addition, on the National Informatization
Development Strategy 2006–2020, China retains a
focus on infrastructure, e-commerce, e-government,
information security, government information trans-
parency, and personal data protection. In Malaysia,
the Third Industrial Master Plan (2006–2020) focuses
on bioinformatics, shared services and outsourcing,
e-commerce, and digital content development. The
Relative level of coverage and implementation Economies
High Australia, China, India, Japan, Malaysia, New Zealand, Republic of Korea, Singapore, Taiwan Province of China
Medium Brunei Darussalam, Indonesia, Islamic Republic of Iran, Mongolia, Pakistan, Philippines, Sri Lanka, Thailand, Viet Nam
Low Bangladesh, Bhutan, Lao People’s Democratic Republic, Maldives, Myanmar, Nepal, Timor-Leste and Pacific island countries and territories
Table I.1. Extent to which ICT policies cover private sector development in the Asia-Pacific
Source: UNESCAP desk research and literature review, April–May 2011.
11CHAPTER I : PRIVATE SECTOR DEVELOPMENT AND THE ROLE OF ICTs
“u-Korea” master plan of 2006 aims, in a compre-
hensive manner, at enhancing national infrastructure
facilities, strengthening the competitiveness of exist-
ing industries, creating an enabling environment, and
promoting international cooperation. Box I.5 illustrates
the ICT policies of the Republic of Korea for PSD.
Singapore has taken a number of steps to leverage
new developments in ICT for PSD, as outlined in its
10-year master plan entitled Realising the iN2015 Vi-
sion: Singapore: An Intelligent Nation, A Global City,
Powered by Infocomm (iN2015). To make Singapore
an “intelligent nation”, the Infocomm Development
Authority (2010), together with industry, has identi-
fied several programmes and initiatives aimed at (a)
extending broadband access, through an integrated
network of wireless LAN, broadband Internet, and
mobile telephony; (b) supporting a globally competi-
tive infocomm industry; (c) ensuring access to the
relevant manpower; and (d) sectoral transformation
of economic sectors, Government and society. The
Eleventh Five-Year Plan (2007–2012) of India focuses
on infrastructure development and the expansion of
broadband. This plan also promotes the development
of new e-business applications, m-commerce, and
other business models to mainstream e-commerce
and thus enhance benefits to SMEs. The plan refers
to the promotion of start-up companies, SMEs, wom-
en entrepreneurs, IT incubation facilities, and various
e-government initiatives.
Middle level. In Indonesia, Strategy ICT-315 identi-
fies SMEs as needing special support, and places
emphasis on the development of the ICT industry
through strategic public–private partnerships. In order
to support ICT use, laws on cybersecurity and elec-
tronic transactions have been in place since 2008. In
the Philippines, the National IT Plan for the Twenty-first
Century, launched in 1997, outlines the development
of ICT infrastructure and competitive IT products, and
seeks to position the country as a knowledge cen-
tre for Asia. An important aspect of the National ICT
Policy Framework 2011–2020 of Thailand is the rec-
ognition of emerging technologies such as cloud com-
puting, and the societal impacts of the increasing use
of social networks. Whereas ICT developments have
been vibrant, the level of operationalization of legisla-
tive frameworks in Mongolia, Pakistan and Sri Lanka,
for example in relation to e-commerce, has been low.
In the Islamic Republic of Iran, promotion of the ICT
industry, via the empowerment of SMEs, incubation
centres, and technology parks, is one of the national
ICT agency’s seven focus areas with regard to ICT ini-
tiatives.
Box I.5. ICT policies for private sector development in the Republic of Korea
The Government of the Republic of Korea has designed and implemented various policies to expand ICT infrastructure to
rural areas, and to promote competitiveness and new ICT services to bridge the digital divide.
In order to make full use of the expanding ICT infrastructure and to increase productivity, the Government has endeav-
oured to spread developments in ICT to services industries and SMEs, which are characterized by lower levels of ICT use.
In this context, the Ministry of the Knowledge Economy is implementing a comprehensive plan to promote the productivity
of the services industries by the use of ICTs. The plan identifies several ways for ICTs to contribute to the services indus-
tries, namely by (a) creating new and high value-added businesses; (b) promoting the use of knowledge and innovation;
(b) expanding openness and accessibility to services by expanding the use of time and space inputs; (d) improving service
quality; and (e) promoting collaboration and networking among enterprises.
For the implementation of the plan, seven action plans, under three strategies, will be enacted from 2008 to 2012, with
an investment of 0.12 trillion won ($112 million) from the public and private sectors. In addition, several relevant Acts have
been passed:
(a) Comprehensive Plan on Cloud Computing (December 2009);
(b) Comprehensive Plan on Wireless Internet Development (April 2010);
(c) Plan on Enhancing Smart Work Infrastructure and Development of the Private Sector (July 2010);
(d) Industry Fusion Promotion Act (April 2011);
(e) Comprehensive Plan on Smart Mobile Security (December 2010); and
(f) Revised Act on Using and Protecting Location-based Information (June 2010).
Source: Information provided by UNESCAP.
12 INFORMATION ECONOMY REPORT 2011
Low level. In this group, there is growing awareness
of the potential of ICTs, but implementation of policies
and strategies is limited. The Government of Bhutan
had set a target of creating an enabling framework to
promote e-business by the year 2009, and has sought
to boost the ICT activities of local companies by out-
sourcing government ICT work to local private enter-
prises. However, implementation has been slow. The
National ICT Policy 2009 of Bangladesh encourages
maximum utilization of ICT services nationwide to en-
hance SME productivity and increase efficiency in the
management of the agricultural supply chain, but has
not yet been operationalized. The Digital Bangladesh
“Vision 2021” promotes the use of ICTs in business
as one of its four key components. This component
aims to increase market access and promote ICTs as
a complementary measure to other key components
such as human resource development, people in-
volvement, and civil services.
In Cambodia, enterprise development is one of four
areas recognized in the National ICT Policy. There are
reduced import taxes on ICT equipment and systems.
In addition, the Government has pledged to provide
special support to SMEs to adopt and use e-commerce
systems and to take appropriate measures to ensure
the efficiency, privacy, security and reliability of e-com-
merce systems based on international, interoperable
standards. In the Lao People’s Democratic Republic, the
National ICT Policy 2009 focuses, among other things,
on creating an enabling environment for investors in the
ICT sector to upgrade their knowledge and experience.
While a number of cyberlaws have been passed, their
implementation and operationalization have been ham-
pered by a lack of a national information infrastructure.
In Afghanistan and Maldives, and in the Pacific Islands,
current national ICT strategies contain no explicit men-
tion of promoting ICT use in the domestic private sector,
and Timor-Leste has no ICT policy in place.
* * * * *
Reviews by United Nations regional commissions
suggest that many national strategies recognize the
important interface between ICTs and PSD. However,
as has been illustrated by looking at developments
in Asia and the Pacific, there are considerable differ-
ences across countries regarding the level of compre-
hensiveness of the strategies, and regarding the ex-
tent to which actions and goals proposed have been
implemented in practice. Thus, for a large number of
developing countries, there appears to be significant
scope for better leveraging of the ICT–PSD interface.
D. SUMMARY AND CONCLUDING REMARKS
This chapter has underlined that PSD is a key objec-
tive in most developing countries and among donors.
Special attention is often given to MSEs, as these
face particular barriers and challenges, some of which
can be addressed in part by effective use of ICTs – by
enterprises and Governments alike. With recent ad-
vances in ICT connectivity, and the emergence of new
ICT applications and services (chapter II), including in
LDCs, the scope for ICT-enabled solutions to make a
difference in the area of PSD has radically improved.
This chapter noted that PSD interventions can be
made at the micro, meso or macro level, and it identi-
fied four aspects of the ICT–PSD interface:
(a) An improved ICT infrastructure makes the
investment climate more attractive.
(b) ICT use in enterprises can enhance the
productivity of the private sector.
(c) An expanding ICT producing sector
represents an important part of the private
sector, and can support the sustainable use of
ICTs in other industries.
(d) ICT use by Governments and other relevant
institutions can support the creation and
growth of enterprises.
While the potential for ICTs to contribute to business
environment reforms is well recognized, many PSD
strategies currently do not give this area adequate
attention. The review of recent donor strategy docu-
ments in this area showed that many of the strategies
do not make any reference at all to how ICTs might
be leveraged for PSD. Moreover, among those docu-
ments that do acknowledge opportunities from ICT
use in this context, this acknowledgement is often
only given in a peripheral way – for example, highlight-
ing a specific issue rather than the broad spectrum in
which such technologies could make a difference.10
Many developing countries’ national strategies do as-
sign importance to the role of ICTs. This is reflected
either in PSD strategies or ICT strategies, or in both.
The fact that the ICT–PSD interface is frequently well
reflected in national strategies does not mean that all
the goals and activities proposed in them are actually
implemented. Many countries pay particular attention
to the development of ICT infrastructure, to the con-
tributions of the ICT sector, and to the need to boost

13CHAPTER I : PRIVATE SECTOR DEVELOPMENT AND THE ROLE OF ICTs
ICT use in the enterprise sector. Fewer examples were
found with regard to the potential of ICTs to make the
delivery of PSD interventions more efficient. However,
some countries, such as Rwanda and Singapore,
have chosen to view ICTs as a powerful lever towards
improving the competitiveness of their private sectors,
and have identified concrete actions with regard to im-
proving all four aspects of the ICT–PSD interface.
* * * * *
The four facets of the ICT–PSD interface will serve as
the organizing principle for the remainder of this report.
Chapter II is devoted to the question of facilitating up-
take of relevant ICTs by different kinds of enterprises,
taking their varying needs into account. It reviews the
extent to which affordable ICT infrastructure and ser-
vices are available to and used by the private sector,
and it discusses policy options to promote uptake.
Chapter III focuses attention on the ICT sector itself,
to identify key opportunities for a sectoral approach to
PSD. Based on a review of available data on the size
and composition of the ICT sector in different coun-
tries, it explores policy options for nurturing vibrant
growth and development in the ICT sector. Chapter
IV is devoted to the use of ICTs, by Governments and
other relevant institutions, in interventions that aim to
address some of the internal and external constraints
on enterprise creation and growth. Special emphasis
is given to the role of ICTs in business environment
reforms, in business development services, and in im-
proving access to finance. Chapter V explores how
ICT use can help promote women’s entrepreneurship.
Finally, Chapter VI presents recommendations to na-
tional Governments and their development partners.
NOTES1 Keeping the promise: a forward-looking review to promote an agreed action agenda to achieve the Millennium Development
Goals by 2015. Report of the Secretary-General. A/64/665. 12 February 2010.
2 Studies from Kenya (Moyi, 2003) and Botswana (Duncombe and Heeks, 2002) found that many enterprises reliedon informal information sourcing, which was largely inadequate for their needs and which resulted in high search costs and in poor-quality information being acquired.
3 Analysis carried out in 130 countries concluded that higher regulatory costs resulting from poorly conceived laws wereassociated with more poverty, larger informal sectors, higher unemployment, lower productivity and more corruption (World Bank, 2003).
4 However, it should also be recognized that while a higher proportion of MSEs in the economy is associated with higher growth, MSEs do not necessarily create higher economic growth or improve pro-poor growth (Bylund, 2005).
5 In Ghana, for example, the informal private sector accounts for about 81 per cent of the employed workforce, with the formal private sector accounting for only 8 per cent of the employment of the economically active population. See Republic of Ghana (2003).
6 See Programme of Action for the Least Developed Countries for the Decade 2011–2020, para 56.
7 There are variations in the way agencies define these levels, but in general there is agreement regarding the value of this typology of intervention. See OECD (2005). Some also include interventions at the “meta level”, which refers to those that are geared towards changing perceptions and values for the adoption of new and innovative entrepreneurial activities. This concerns the cultural and social norms of society, and the extent to which citizens, including businessmen and business-women, exhibit entrepreneurial values and attitudes.
8 Information provided by UNECA, March 2011.
9 This section is based on information provided by UNESCAP.
10 This observation was confirmed in a recent study of policies of international development donors and investors engaged in support for small and growing businesses in developing countries (Barbarasa, 2010).


Information and communication technologies (ICTs) are used by
private enterprises to improve their productivity and competitiveness
in the marketplace. Various kinds of ICTs help firms in all sectors to
manage their resources more efficiently, access the information needed
for better business decision-making, reduce the costs of business
transactions and enhance their ability to bring their products and
services to customers. Consequently, it is useful to consider ways
to enhance business use of ICTs in the context of private sector
development. To promote ICTs within firms, governments need to
provide an enabling environment that is conducive to business use
of ICTs. Characteristics of such an environment include the avail-
ability of affordable and relevant ICT infrastructure – an area which
is still characterized by significant divides. There is also a need to
ensure access to adequately trained human resources and a legal
and regulatory framework that supports the uptake and productive
application of ICTs.
FACILITATING ENTERPRISEUSE OF ICTs 2
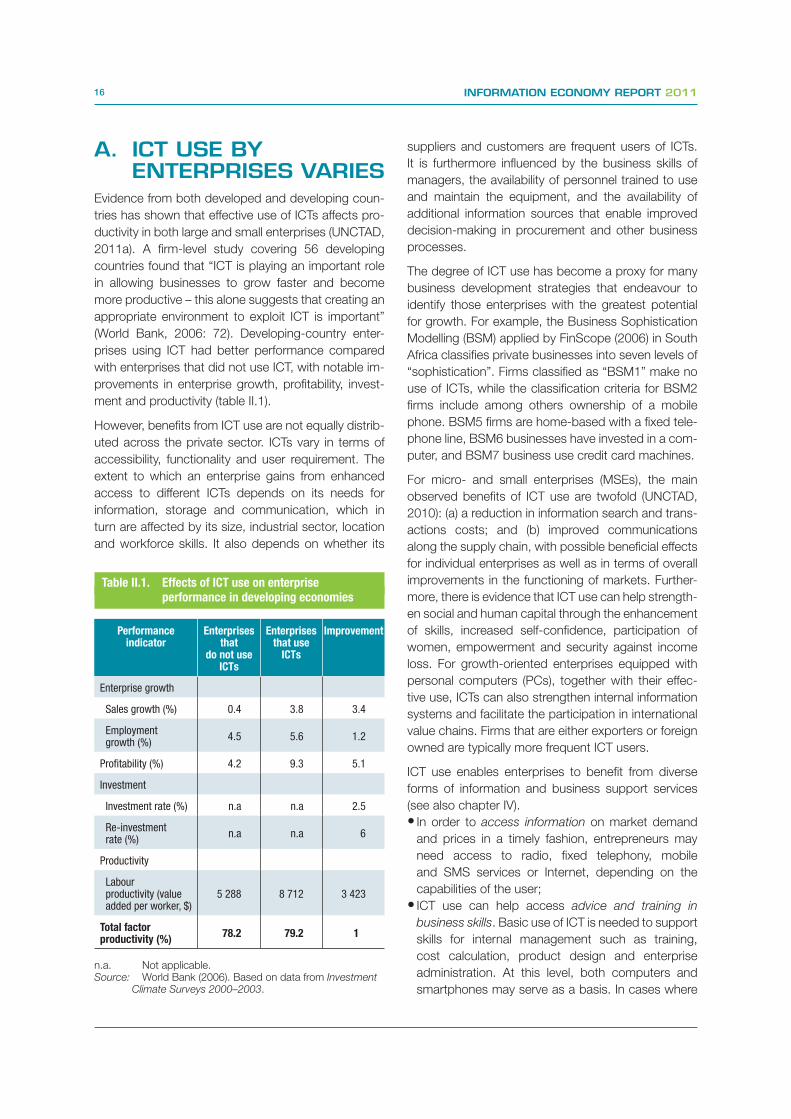
16 INFORMATION ECONOMY REPORT 2011
A. ICT USE BY ENTERPRISES VARIES
Evidence from both developed and developing coun-
tries has shown that effective use of ICTs affects pro-
ductivity in both large and small enterprises (UNCTAD,
2011a). A firm-level study covering 56 developing
countries found that “ICT is playing an important role
in allowing businesses to grow faster and become
more productive – this alone suggests that creating an
appropriate environment to exploit ICT is important”
(World Bank, 2006: 72). Developing-country enter-
prises using ICT had better performance compared
with enterprises that did not use ICT, with notable im-
provements in enterprise growth, profitability, invest-
ment and productivity (table II.1).
However, benefits from ICT use are not equally distrib-
uted across the private sector. ICTs vary in terms of
accessibility, functionality and user requirement. The
extent to which an enterprise gains from enhanced
access to different ICTs depends on its needs for
information, storage and communication, which in
turn are affected by its size, industrial sector, location
and workforce skills. It also depends on whether its
suppliers and customers are frequent users of ICTs.
It is furthermore influenced by the business skills of
managers, the availability of personnel trained to use
and maintain the equipment, and the availability of
additional information sources that enable improved
decision-making in procurement and other business
processes.
The degree of ICT use has become a proxy for many
business development strategies that endeavour to
identify those enterprises with the greatest potential
for growth. For example, the Business Sophistication
Modelling (BSM) applied by FinScope (2006) in South
Africa classifies private businesses into seven levels of
“sophistication”. Firms classified as “BSM1” make no
use of ICTs, while the classification criteria for BSM2
firms include among others ownership of a mobile
phone. BSM5 firms are home-based with a fixed tele-
phone line, BSM6 businesses have invested in a com-
puter, and BSM7 business use credit card machines.
For micro- and small enterprises (MSEs), the main
observed benefits of ICT use are twofold (UNCTAD,
2010): (a) a reduction in information search and trans-
actions costs; and (b) improved communications
along the supply chain, with possible beneficial effects
for individual enterprises as well as in terms of overall
improvements in the functioning of markets. Further-
more, there is evidence that ICT use can help strength-
en social and human capital through the enhancement
of skills, increased self-confidence, participation of
women, empowerment and security against income
loss. For growth-oriented enterprises equipped with
personal computers (PCs), together with their effec-
tive use, ICTs can also strengthen internal information
systems and facilitate the participation in international
value chains. Firms that are either exporters or foreign
owned are typically more frequent ICT users.
ICT use enables enterprises to benefit from diverse
forms of information and business support services
(see also chapter IV).
• In order to access information on market demand
and prices in a timely fashion, entrepreneurs may
need access to radio, fixed telephony, mobile
and SMS services or Internet, depending on the
capabilities of the user;
• ICT use can help access advice and training in
business skills. Basic use of ICT is needed to support
skills for internal management such as training,
cost calculation, product design and enterprise
administration. At this level, both computers and
smartphones may serve as a basis. In cases where
Performance indicator
Enterprises that
do not use ICTs
Enterprises that use
ICTs
Improvement
Enterprise growth
Sales growth (%) 0.4 3.8 3.4
Employment growth (%)
4.5 5.6 1.2
Profitability (%) 4.2 9.3 5.1
Investment
Investment rate (%) n.a n.a 2.5
Re-investment rate (%)
n.a n.a 6
Productivity
Labour productivity (value added per worker, $)
5 288 8 712 3 423
Total factor productivity (%)
78.2 79.2 1
Table II.1. Effects of ICT use on enterprise performance in developing economies
n.a. Not applicable.Source: World Bank (2006). Based on data from Investment
Climate Surveys 2000–2003.
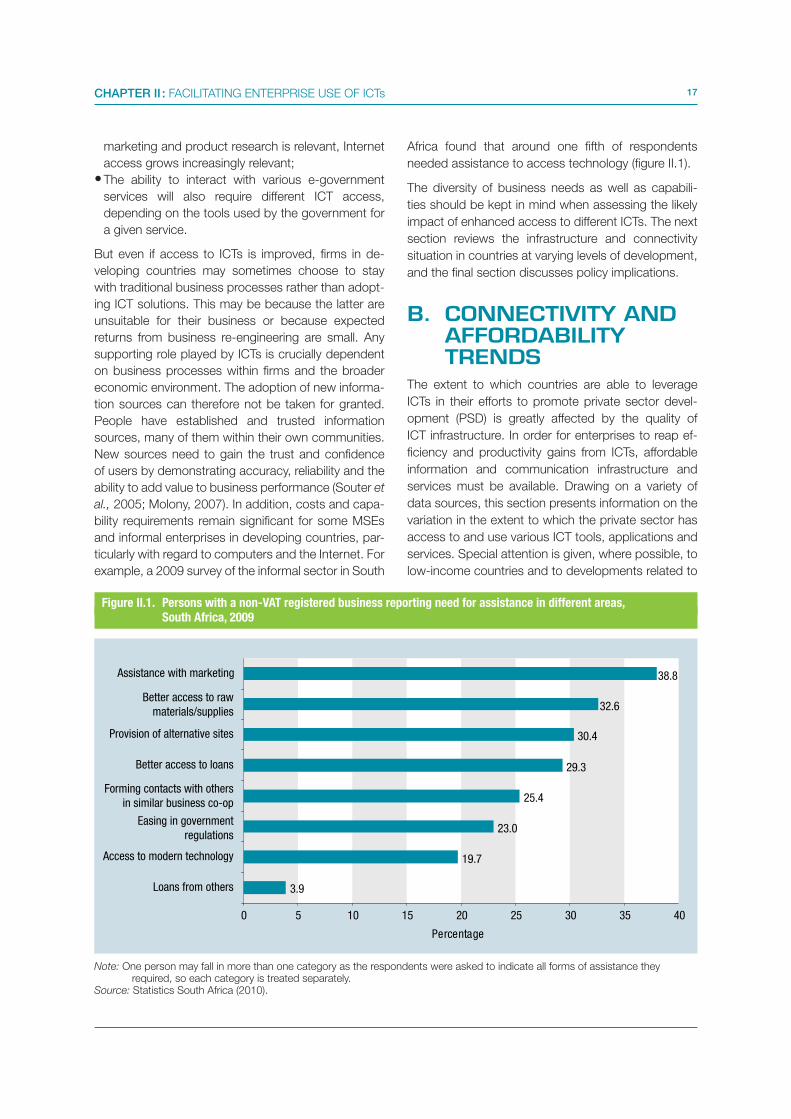
17CHAPTER II : FACILITATING ENTERPRISE USE OF ICTs
marketing and product research is relevant, Internet
access grows increasingly relevant;
• The ability to interact with various e-government
services will also require different ICT access,
depending on the tools used by the government for
a given service.
But even if access to ICTs is improved, firms in de-
veloping countries may sometimes choose to stay
with traditional business processes rather than adopt-
ing ICT solutions. This may be because the latter are
unsuitable for their business or because expected
returns from business re-engineering are small. Any
supporting role played by ICTs is crucially dependent
on business processes within firms and the broader
economic environment. The adoption of new informa-
tion sources can therefore not be taken for granted.
People have established and trusted information
sources, many of them within their own communities.
New sources need to gain the trust and confidence
of users by demonstrating accuracy, reliability and the
ability to add value to business performance (Souter et
al., 2005; Molony, 2007). In addition, costs and capa-
bility requirements remain significant for some MSEs
and informal enterprises in developing countries, par-
ticularly with regard to computers and the Internet. For
example, a 2009 survey of the informal sector in South
Africa found that around one fifth of respondents
needed assistance to access technology (figure II.1).
The diversity of business needs as well as capabili-
ties should be kept in mind when assessing the likely
impact of enhanced access to different ICTs. The next
section reviews the infrastructure and connectivity
situation in countries at varying levels of development,
and the final section discusses policy implications.
B. CONNECTIVITY AND AFFORDABILITY TRENDS
The extent to which countries are able to leverage
ICTs in their efforts to promote private sector devel-
opment (PSD) is greatly affected by the quality of
ICT infrastructure. In order for enterprises to reap ef-
ficiency and productivity gains from ICTs, affordable
information and communication infrastructure and
services must be available. Drawing on a variety of
data sources, this section presents information on the
variation in the extent to which the private sector has
access to and use various ICT tools, applications and
services. Special attention is given, where possible, to
low-income countries and to developments related to
3.9
19.7
23.0
25.4
29.3
30.4
32.6
38.8
0 5 10 15 20 25 30 35 40
Loans from others
Access to modern technology
Easing in government
regulations
Forming contacts with others
in similar business co-op
Better access to loans
Provision of alternative sites
Better access to raw
materials/supplies
Assistance with marketing
Percentage
Figure II.1. Persons with a non-VAT registered business reporting need for assistance in different areas, South Africa, 2009
Note: One person may fall in more than one category as the respondents were asked to indicate all forms of assistance theyrequired, so each category is treated separately.
Source: Statistics South Africa (2010).

18 INFORMATION ECONOMY REPORT 2011
ICTs that are of particular relevance for PSD, notably
mobile telephony, Internet and broadband. While radio
remains a crucial tool to reach entrepreneurs in remote
areas (UNCTAD, 2010), it is not discussed explicitly
below.
1. Fixed telephonyPoor coverage of fixed telephony in many developing
countries has become less of a business constraint as
a result of the diffusion of mobile phones. Nonethe-
less, fixed telephones remain important to many en-
terprises. They may support a line-sharing platform for
offices, tariffs are often lower compared with mobiles,
and a fixed telephone line can support DSL broadband
access. There are also circumstances where there is a
need for a telephone to remain tied to a business loca-
tion so that customers and associates call a common
number rather than someone’s cell phone. For enter-
prises in urban areas, fixed telephony is often the main
channel to access the Internet for commercial use.
At the end of 2010, there were 1.1 billion fixed tele-
phone lines around the world for an average penetra-
tion of some 16 subscriptions per 100 inhabitants
(figure II.2). In developed and developing economies,
fixed telephone lines continue to decrease as users
disconnect conventional fixed line voice telephony
subscriptions to switch to mobile and voice over
broadband connections. The number of subscribers
is marginally increasing in the transition economies
and the least developed countries (LDCs). In the for-
mer group, low tariffs continue to make traditional
fixed telephone lines an attractive option. In the latter
group, most growth is from fixed wireless rather than
traditional, copper-based fixed lines.
Average affordability – measured by the International
Telecommunication Union’s (ITU’s) fixed basket as a
percentage of gross national income (GNI) per capita
– improved from 6.2 per cent in 2008 to 5.8 per cent
in 2010.1 The relevance of current tariff benchmarks
for fixed telephone service is increasingly being ques-
tioned due to technological shifts and user preferenc-
es. This impacts their usefulness for understanding
affordability vis-à-vis enterprises and particularly small
and medium-sized enterprises (SMEs). For example,
when making international calls, SMEs in developing
countries are more likely to use public telephones and
inexpensive Internet telephony options (see section
II.B.4). A more relevant component of fixed telephone
tariffs is the monthly rental cost in relation to its poten-
tial for broadband use.2
2. Mobile telephony
a. Expansion continues
The diffusion of mobile phones continues to transform
the ICT landscape with major potential implications for
PSD (UNCTAD, 2010). First, it is extending access to
those at the bottom of the economic pyramid, i.e. to
MSEs and to the self-employed. Secondly, the expand-
ing range of mobile applications, from text messaging
to financial transactions, is widening the scope for de-
livering a multitude of services that are of high relevance
to PSD. The mobile phone has become the most prev-
alent ICT tool among the poor, among rural inhabitants
and among micro-enterprises in low-income countries.
This opens opportunities not only to leverage the mo-
bile phone as a business tool, but also a new channel
for Governments and other organizations to reach pre-
viously unconnected parts of the private sector.
At the end of 2010, global mobile penetration was es-
timated at 79 subscriptions per 100 inhabitants, up
from 69 the year before (figure II.3). According to ITU,
there were some 5.4 billion subscriptions worldwide.
Developed and transition economies now boast more
than one mobile subscription per inhabitant, while
penetration in developing economies in 2010 was
about 77 per 100 inhabitants, close to the global aver-
age. In the LDCs, there were on average 33 mobile
subscriptions per 100 inhabitants, a remarkable im-
provement in a very short time.3 There appears, how-
0
10
20
30
40
50
60
2000
2001
2002
2003
2004
2005
2006
2007
2008
2009
2010
Developed economies
Developing economies
Economiesin transitionLDCsWorld
Figure II.2. Fixed telephone subscriptions per 100 inhabitants, by country group, 2000-2010
Source: Adapted from ITU World Telecommunication/ICT Indicators database.
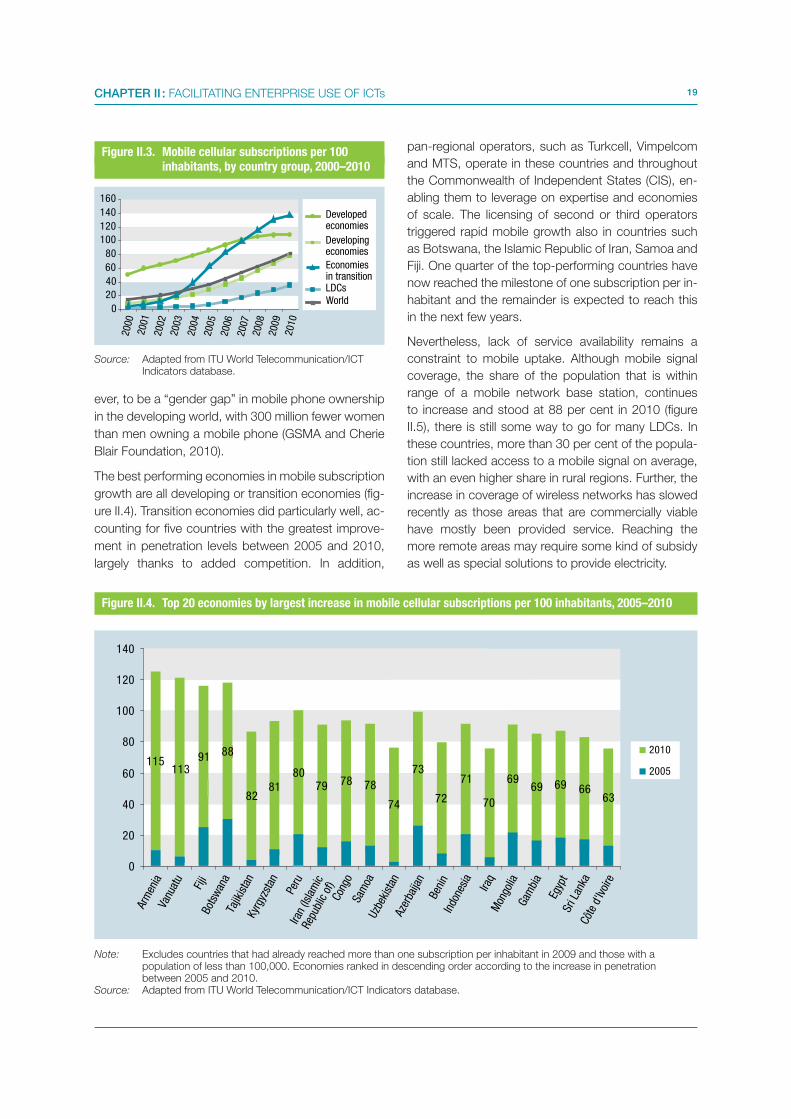
19CHAPTER II : FACILITATING ENTERPRISE USE OF ICTs
ever, to be a “gender gap” in mobile phone ownership
in the developing world, with 300 million fewer women
than men owning a mobile phone (GSMA and Cherie
Blair Foundation, 2010).
The best performing economies in mobile subscription
growth are all developing or transition economies (fig-
ure II.4). Transition economies did particularly well, ac-
counting for five countries with the greatest improve-
ment in penetration levels between 2005 and 2010,
largely thanks to added competition. In addition,
pan-regional operators, such as Turkcell, Vimpelcom
and MTS, operate in these countries and throughout
the Commonwealth of Independent States (CIS), en-
abling them to leverage on expertise and economies
of scale. The licensing of second or third operators
triggered rapid mobile growth also in countries such
as Botswana, the Islamic Republic of Iran, Samoa and
Fiji. One quarter of the top-performing countries have
now reached the milestone of one subscription per in-
habitant and the remainder is expected to reach this
in the next few years.
Nevertheless, lack of service availability remains a
constraint to mobile uptake. Although mobile signal
coverage, the share of the population that is within
range of a mobile network base station, continues
to increase and stood at 88 per cent in 2010 (figure
II.5), there is still some way to go for many LDCs. In
these countries, more than 30 per cent of the popula-
tion still lacked access to a mobile signal on average,
with an even higher share in rural regions. Further, the
increase in coverage of wireless networks has slowed
recently as those areas that are commercially viable
have mostly been provided service. Reaching the
more remote areas may require some kind of subsidy
as well as special solutions to provide electricity.
0
20
40
60
80
100
120
140
160
Developed economies
Developing economies
Economiesin transitionLDCsWorld
2000
2001
2002
2003
2004
2005
2006
2007
2008
2009
2010
Figure II.3. Mobile cellular subscriptions per 100 inhabitants, by country group, 2000–2010
Source: Adapted from ITU World Telecommunication/ICT Indicators database.
11391 88
8281
8079 78 78
74
73
72
71
70
6969 69 66
63
0
20
40
60
80
100
120
140
Arm
enia
Vanu
atu
Fiji
Bots
wan
aTa
jikis
tan
Kyrg
yzst
an
Peru
Iran
(Isla
mic
Repu
blic
of)
Cong
oSa
moa
Uzbe
kist
anAz
erba
ijan
Beni
nIn
done
sia
Iraq
Mon
golia
Gam
bia
Egyp
tSr
i Lan
kaCô
te d
'Ivoi
re
2010
2005115
Figure II.4. Top 20 economies by largest increase in mobile cellular subscriptions per 100 inhabitants, 2005–2010
Note: Excludes countries that had already reached more than one subscription per inhabitant in 2009 and those with a population of less than 100,000. Economies ranked in descending order according to the increase in penetration between 2005 and 2010.
Source: Adapted from ITU World Telecommunication/ICT Indicators database.

20 INFORMATION ECONOMY REPORT 2011
There is only limited systematic and up-to-date infor-
mation on the extent and nature of mobile phone use
by enterprises in developed and developing coun-
tries.4 International statistics on ICT use by enterprises
generally do not include mobile phones (UNCTAD,
2009a). But like other ICTs, mobile phones can affect
the internal processes of a business and the way it
relates to clients and suppliers (Donner and Escobari,
2009). Micro-enterprises and SMEs, many of which
operate in the informal sector in developing countries,
appear to be the most affected by the adoption of mo-
bile telephony (Donner and Escobari, 2009; Junqueira
Botelho and da Silva Alves, 2007; UNCTAD, 2010).
Data from Africa show a high proportion of mobile
phone use by enterprises. A 2005–06 survey of SMEs
of 14 African countries found that 83 per cent had ac-
cess to mobile phones, a figure that is undoubtedly
even higher today (table II.2) (Esselar et al., 2007). In-
terestingly, the level of use was consistently high also
in informal-sector SMEs. The same study found that
76 per cent of the SMEs used the phones for contact-
ing customers, while only 48 per cent used fixed lines
(ibid.).
b. New forms of mobile use
Mobile phones are increasingly used by enterprises
in developing countries for non-voice uses, such as
text and picture messaging, Internet access and mo-
bile money. These new applications are relevant for
micro-enterprises and SMEs, supporting areas such
as communications with suppliers and customers,
market information and business networking. Their
use has been found to help raise productivity and re-
duce information search and communication costs
through better price information. Moreover, it reduces
the need for travel, and thereby lowers transportation
costs (UNCTAD, 2010).
The integration of computer-like processing and fea-
tures in smaller devices with connectivity via wireless
broadband networks could be particularly beneficial
for SMEs, because of their frequent mobility and need
for a lower cost solution than the traditional computer
connected to fixed broadband. However, most mobile
Internet subscribers in developing countries are using
low-end mobile handsets with minimal features, which
limits their functionality, particularly with regard to ad-
vanced business applications. For the trend in devel-
oped economies, where smartphones are used for
applications that previously required a laptop as ac-
cessing the Web, making payments, sending invoices,
e-mail and word processing,5 to spread more widely
into developing economies, smartphones and tablets
need to come down in price and mobile broadband
coverage to be further extended.
Text messaging continues to grow. It represents an
alternative to expensive voice calls and for users who
do not have or want to access the Internet on their
mobiles. It is also a tool for value added information
services. ITU reckons that 6.1 trillion SMS messages
were sent in 2010, three times the 2007 figure (ITU,
2010). The practice is important for micro-enterprises
and SMEs in developing countries. For example, in the
area of agriculture, a number of market information
applications have been developed around SMS plat-
forms that are improving farmers’ livelihoods through
better knowledge of prices (UNCTAD, 2010: chapter
IV). SMS is also used by enterprises as a marketing
and communication tool.
0
10
20
30
40
50
60
70
80
90
100
Developed economies
Developing economies
Economiesin transitionLDCsWorld
2000
2001
2002
2003
2004
2005
2006
2007
2008
2009
2010
Pe
rce
nta
ge
Figure II.5. Population covered by a voice mobile signal, by country group, 2000-2010 (%)
Source: Adapted from ITU and national sources.
Informal Semi-formal
Formal All
Manufacturing 80.5 84.5 85.9 82.7
Construction 86.1 92.0 94.0 89.7
Services 83.4 82.6 82.7 82.9
All 82.9 83.3 83.7 83.3
Table II.2. SMEs with access to mobile cellular phones for business purposes, 14 African economies (%)
Source: Research ICT Africa (2006): 11.
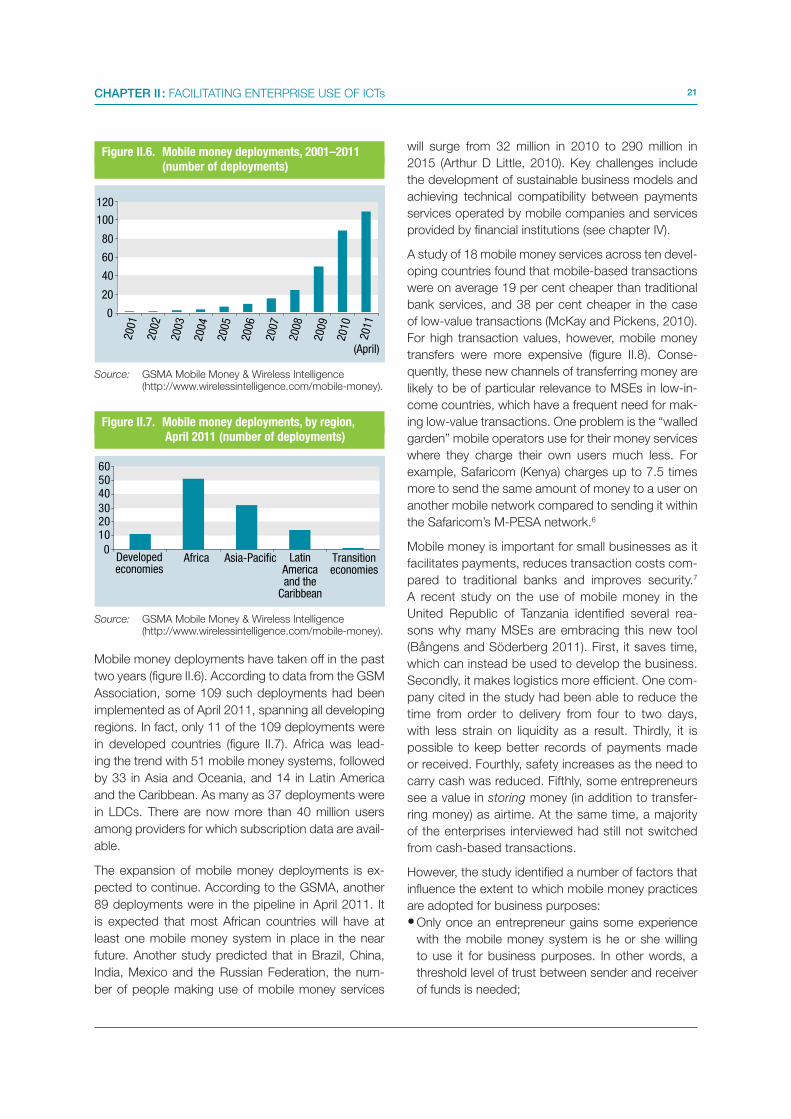
21CHAPTER II : FACILITATING ENTERPRISE USE OF ICTs
Mobile money deployments have taken off in the past
two years (figure II.6). According to data from the GSM
Association, some 109 such deployments had been
implemented as of April 2011, spanning all developing
regions. In fact, only 11 of the 109 deployments were
in developed countries (figure II.7). Africa was lead-
ing the trend with 51 mobile money systems, followed
by 33 in Asia and Oceania, and 14 in Latin America
and the Caribbean. As many as 37 deployments were
in LDCs. There are now more than 40 million users
among providers for which subscription data are avail-
able.
The expansion of mobile money deployments is ex-
pected to continue. According to the GSMA, another
89 deployments were in the pipeline in April 2011. It
is expected that most African countries will have at
least one mobile money system in place in the near
future. Another study predicted that in Brazil, China,
India, Mexico and the Russian Federation, the num-
ber of people making use of mobile money services
will surge from 32 million in 2010 to 290 million in
2015 (Arthur D Little, 2010). Key challenges include
the development of sustainable business models and
achieving technical compatibility between payments
services operated by mobile companies and services
provided by financial institutions (see chapter IV).
A study of 18 mobile money services across ten devel-
oping countries found that mobile-based transactions
were on average 19 per cent cheaper than traditional
bank services, and 38 per cent cheaper in the case
of low-value transactions (McKay and Pickens, 2010).
For high transaction values, however, mobile money
transfers were more expensive (figure II.8). Conse-
quently, these new channels of transferring money are
likely to be of particular relevance to MSEs in low-in-
come countries, which have a frequent need for mak-
ing low-value transactions. One problem is the “walled
garden” mobile operators use for their money services
where they charge their own users much less. For
example, Safaricom (Kenya) charges up to 7.5 times
more to send the same amount of money to a user on
another mobile network compared to sending it within
the Safaricom’s M-PESA network.6
Mobile money is important for small businesses as it
facilitates payments, reduces transaction costs com-
pared to traditional banks and improves security.7
A recent study on the use of mobile money in the
United Republic of Tanzania identified several rea-
sons why many MSEs are embracing this new tool
(Bångens and Söderberg 2011). First, it saves time,
which can instead be used to develop the business.
Secondly, it makes logistics more efficient. One com-
pany cited in the study had been able to reduce the
time from order to delivery from four to two days,
with less strain on liquidity as a result. Thirdly, it is
possible to keep better records of payments made
or received. Fourthly, safety increases as the need to
carry cash was reduced. Fifthly, some entrepreneurs
see a value in storing money (in addition to transfer-
ring money) as airtime. At the same time, a majority
of the enterprises interviewed had still not switched
from cash-based transactions.
However, the study identified a number of factors that
influence the extent to which mobile money practices
are adopted for business purposes:
• Only once an entrepreneur gains some experience
with the mobile money system is he or she willing
to use it for business purposes. In other words, a
threshold level of trust between sender and receiver
of funds is needed;
Figure II.6. Mobile money deployments, 2001–2011 (number of deployments)
Figure II.7. Mobile money deployments, by region, April 2011 (number of deployments)
Source: GSMA Mobile Money & Wireless Intelligence (http://www.wirelessintelligence.com/mobile-money).
Source: GSMA Mobile Money & Wireless Intelligence (http://www.wirelessintelligence.com/mobile-money).
0
20
40
60
80
100
120
(April)20
11
2001
2002
2003
2004
2005
2006
2007
2008
2009
2010
0
102030
405060
Developedeconomies
Africa Asia-Pacific LatinAmericaand the
Caribbean
Transitioneconomies

22 INFORMATION ECONOMY REPORT 2011
• A minimum geographical distance between the two
parties is normally required;
• Standardized products are more conducive to the
use of mobile payments;
• Government regulations may need to be adapted
to business use of mobile money systems. A tiered
mobile money service may be relevant, with higher
transaction and balance limits as well as higher
security measures for small business users. For
example, in the United Republic of Tanzania, the use
of mobile payments is currently restricted to single
transactions of less than about $330. In Kenya
and Uganda, however, a dialogue between mobile
network operators (MNOs) and the Central Banks
has resulted in the approval of new limits, which are
yet to become operationalized.8
Kenya has been at the centre of the emergence of
many new innovations that are pioneering mobile
banking and insurance schemes, and creating new
job opportunities in the mobile sector (see chapter
III). One financial area with large potential is micro-
insurance, which is not available in many rural areas
in developing nations. If risks can be reduced, rural
farmers would be more willing to expand operations
by investing in seeds, fertilizers and equipment. Kili-
mo Salama is an index-based micro-insurance prod-
uct offered to farmers in Kenya. Farmers can protect
their investments in improved seeds and farm inputs
against drought and excess rain through their mobiles.
The project is a partnership between Syngenta Foun-
dation for Sustainable Agriculture, UAP Insurance and
Safaricom, and was launched in March 2010. In Sep-
tember 2010, the first payouts were issued through
the M-PESA system. Over 100 farmers in Embu then
received insurance payouts via M-PESA.9 While few
similar projects have so far been implemented, the in-
dustry recognizes the potential (Zurich Financial Ser-
vices Group, 2011: 6):
“As low-cost collection/transmission of payments
is a key requirement for access to insurance,
mobile payments could be the next big enabler
for insuring new customers.”
c. Pricing of mobile services
Affordability is a key demand side factor for mobile
services.10 Indeed, in a study of African SMEs, the
main obstacle to ICT use was cost-related (Esselaar
et al., 2007). ITU data suggest that the average price
of a prepaid mobile cellular monthly basket around
the world in 2010 stood at about 8.6 per cent of per
capita income, down from 11 per cent in 2008.11
However, according to Nokia, which compiles mobile
price baskets composed of a prorated handset cost,
services charges based on a prepaid user and taxes,
the global price average actually rose somewhat in
2009 due to the financial crisis (figure II.9).12 This was
the first increase since it began compiling the basket
in 2005. In 2010, prices fell back to almost the level
of 2008. Between 2005 and 2010, prices declined by
14 per cent, bringing the global average price for the
monthly mobile basket aimed at a low-income user
to $11.46.
0
1
2
3
4
5
6
7
8
Low value Average High value
Pri
ce (
PP
P $
)
Mobile money transaction
Bank transaction
-38% -19%
+45%
Figure II.8. Average mobile money and bank prices across low, average and high value transactions, 2010 (PPP$, %)
Source: McKay and Pickens (2010).

23CHAPTER II : FACILITATING ENTERPRISE USE OF ICTs
The biggest decline was related to the price of hand-
sets (figure II.9), which is becoming less of a barrier
to service take-up. According to one estimate, the
average retail price of Nokia phones declined by 39
per cent between 2005 and 2009, while for Samsung
handsets the drop was 33 per cent.13 The growing
replacement ratio (i.e. users replacing phones rather
than a new user buying a handset for the first time)
has expanded the availability of used handsets on the
market, driving down prices for second hand mobile
phones. This trend is particularly relevant for the mi-
cro-enterprises.
Mobile price baskets do not reflect the actual usage
among countries. Users adjust their talking according
to pricing and in general, the lower the price, the more
they will use the service. This is reflected in indicators
such as average revenue per user (ARPU) and min-
utes of use (MoU). ARPU and MoU can be combined
to produce the average price per minute (APPM),
which provides another benchmark for mobile pricing
(table II.3). India’s ARPU is one of the lowest in the
world and often used as a benchmark for low-income
countries. Table II.3 shows the ARPU for selected tele-
com operators in India, other large emerging econo-
mies and the Africa region. Although Bangladesh had
a lower ARPU than India (at $2.3 per month) in 2010,
given the higher level of use in India, the average price
of a minute of use was about the same in the two
countries (approximately $0.01 per minute). In Africa,
ARPU is on average much higher and minutes of use
are lower. This suggests that prices need to fall further
for mobile services to become widely affordable there.
Meanwhile, the most expensive country in the table is
Brazil, where average revenue per minute was $0.11 in
2010. Even though China has almost the same ARPU
as Brazil, usage is more than five times higher, making
the average price of a call only $0.02 per minute.
Given the popularity of mobiles and their use beyond
voice, it is relevant to compare the prices of text mes-
saging as well. As the marginal cost of an SMS is
close to zero, there is potential to significantly expand
access and usage of these applications if the price of
text-messaging can be driven down. Some operators
provide bundles of free SMS with prepaid recharges
or as a low-cost tariff option. Text-messaging prices
vary widely around the world, ranging from $0.02 in
Bangladesh to $0.37 in Turkey (figure II.10).
14
12
10
8
6
4
2
02005 2007 2008
20092010
service
74%
tax 15%
tax 14% tax 17%
service
78%service
76%
service
79% -12%
-4%
-43%handset 7%handset 7%handset 11% handset 8%
tax 14%
Dol
lars
Figure II.9. Nokia total cost of ownership (TCO) mobile price basket, world average, 2005–2010 ($)
Note: Percentages indicated at the right side of the figure show the change in price in the three components between 2005 and 2010.
Source: Information provided by Nokia.
Average revenue per user (dollars per month)
Minutes of use (per month)
Average price per minute (dollars)
2010 2009 % change 2010 2009 2010 2009 % change
Africa 7.3 n.a. n.a. 120 n.a. 0.06 n.a.
Bangladesh 2.3 2.5 -8.00% 232 259 0.01 0.01 2.70%
Brazil 10.8 12.6 -14.80% 96 93 0.11 0.14 -17.40%
China 10.6 11.3 -5.90% 520 494 0.02 0.02 -10.60%
India 4.4 4.9 -10.20% 449 446 0.01 0.01 -10.80%
Russian Federation 11.2 10.6 5.70% 222 214 0.05 0.05 1.60%
Table II.3. Average mobile revenue and minutes per user, selected economies and regions, 2010
Note: 2009 data for Africa not available.Source: Adapted from Airtel, América Móvil, China Mobile, Orascom Telecom and Vimpelcom.
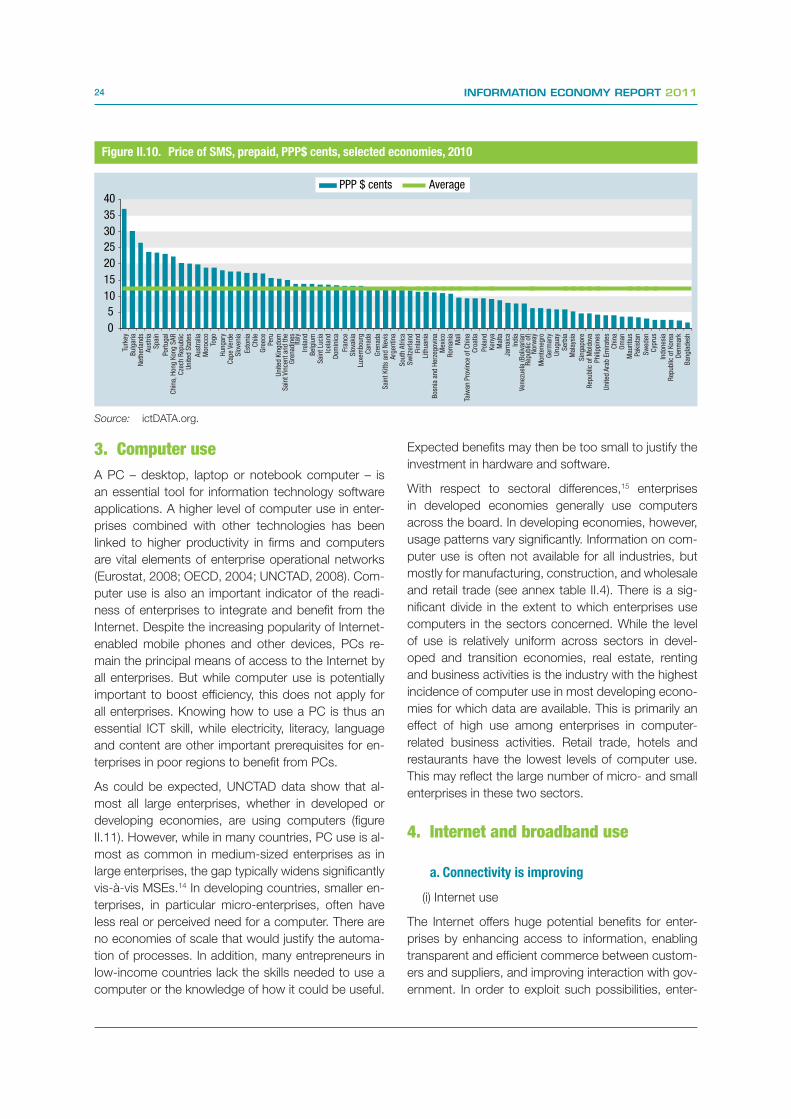
24 INFORMATION ECONOMY REPORT 2011
3. Computer useA PC – desktop, laptop or notebook computer – is
an essential tool for information technology software
applications. A higher level of computer use in enter-
prises combined with other technologies has been
linked to higher productivity in firms and computers
are vital elements of enterprise operational networks
(Eurostat, 2008; OECD, 2004; UNCTAD, 2008). Com-
puter use is also an important indicator of the readi-
ness of enterprises to integrate and benefit from the
Internet. Despite the increasing popularity of Internet-
enabled mobile phones and other devices, PCs re-
main the principal means of access to the Internet by
all enterprises. But while computer use is potentially
important to boost efficiency, this does not apply for
all enterprises. Knowing how to use a PC is thus an
essential ICT skill, while electricity, literacy, language
and content are other important prerequisites for en-
terprises in poor regions to benefit from PCs.
As could be expected, UNCTAD data show that al-
most all large enterprises, whether in developed or
developing economies, are using computers (figure
II.11). However, while in many countries, PC use is al-
most as common in medium-sized enterprises as in
large enterprises, the gap typically widens significantly
vis-à-vis MSEs.14 In developing countries, smaller en-
terprises, in particular micro-enterprises, often have
less real or perceived need for a computer. There are
no economies of scale that would justify the automa-
tion of processes. In addition, many entrepreneurs in
low-income countries lack the skills needed to use a
computer or the knowledge of how it could be useful.
Expected benefits may then be too small to justify the
investment in hardware and software.
With respect to sectoral differences,15 enterprises
in developed economies generally use computers
across the board. In developing economies, however,
usage patterns vary significantly. Information on com-
puter use is often not available for all industries, but
mostly for manufacturing, construction, and wholesale
and retail trade (see annex table II.4). There is a sig-
nificant divide in the extent to which enterprises use
computers in the sectors concerned. While the level
of use is relatively uniform across sectors in devel-
oped and transition economies, real estate, renting
and business activities is the industry with the highest
incidence of computer use in most developing econo-
mies for which data are available. This is primarily an
effect of high use among enterprises in computer-
related business activities. Retail trade, hotels and
restaurants have the lowest levels of computer use.
This may reflect the large number of micro- and small
enterprises in these two sectors.
4. Internet and broadband use
a. Connectivity is improving
(i) Internet use
The Internet offers huge potential benefits for enter-
prises by enhancing access to information, enabling
transparent and efficient commerce between custom-
ers and suppliers, and improving interaction with gov-
ernment. In order to exploit such possibilities, enter-
0
5
10
15
20
25
30
35
40PPP $ cents Average
Turk
eyB
ulga
ria
Net
herl
ands
Aus
tria
Spa
in
Port
ugal
Chi
na, H
ong
Kon
g S
AR
Cze
ch R
epub
licU
nite
d S
tate
s
Aus
tral
iaM
oroc
coTo
go
Hun
gary
Cap
e Ve
rde
Slo
veni
a
Esto
nia
Chi
leG
reec
ePe
ruU
nite
d K
ingd
omS
aint
Vin
cent
and
the
G
rena
dine
sIta
lyIr
elan
dB
elgi
umS
aint
Luc
iaIc
elan
dD
omin
ica
Fran
ceS
lova
kia
Luxe
mbo
urg
Can
ada
Gre
nada
Sai
nt K
itts
and
Nev
isA
rgen
tina
Sou
th A
fric
aS
witz
erla
ndFi
nlan
dLi
thua
nia
Bos
nia
and
Her
zego
vina
Mex
ico
Rom
ania
Mal
i
Taiw
an P
rovi
nce
of C
hina
Cro
atia
Pola
ndK
enya
Mal
taJa
mai
caIn
dia
Vene
zuel
a (B
oliv
aria
n R
epub
lic o
f)N
orw
ayM
onte
negr
oG
erm
any
Uru
guay
Ser
bia
Mal
aysi
a
Sin
gapo
reR
epub
lic o
f M
oldo
vaP
hilip
pine
s
Uni
ted
Ara
b Em
irat
esC
hina
Om
anM
auri
tius
Paki
stan
Sw
eden
Cyp
rus
Indo
nesi
aR
epub
lic o
f K
orea
Den
mar
k
Ban
glad
esh
Figure II.10. Price of SMS, prepaid, PPP$ cents, selected economies, 2010
Source: ictDATA.org.

25CHAPTER II : FACILITATING ENTERPRISE USE OF ICTs
Figure II.11. Enterprises using computers, selected economies, by enterprise size, latest year (%)
0 10 20 30 40 50 60 70 80 90 100
Occupied Palestinian Territory (2007)
Egypt (2009)
India (2005)
Cuba (2007)
Uruguay (2005)
Lesotho (2008)
Panama (2006)
Colombia (2006)
Turkey (2010)
Tunisia (2009)
Thailand (2008)
Qatar (2008)
Senegal (2008)
United Arab Emirates (2008)
Mauritius (2009)
Jordan (2008)
China, Macao SAR (2007)
China, Hong Kong SAR (2009)
Brazil (2009)
Transition economies
Developed economies
Econ
omy
(ref
eren
ce y
ear)
Percentage
0–9 10–49 50–249 250+ All enterprises
Source: Information Economy Database.

26 INFORMATION ECONOMY REPORT 2011
prises need affordable Internet connectivity as well as
the knowledge and skills to use it. Whereas Internet
use remains fairly limited in many low-income coun-
tries, this is likely to change as the deployment of fixed
and mobile broadband makes faster Internet access
available.
At the end of 2010, there were an estimated 2 bil-
lion Internet users, which corresponds to about 30 per
cent of the world’s population (figure II.12).16 There re-
mains a significant gulf between developed and devel-
oping economies and between developing economies
and the LDCs. In developed economies, more than
75 per cent of the population was Internet users. In
developing countries, only 24 per cent of the popula-
tion used the Internet; in transition economies, the rate
was higher at 35 per cent. In LDCs, the rate was just
4 per cent.
Devices for accessing the Internet have proliferated.
The days of a PC being the main Internet access de-
vice are numbered. According to one industry source,
351 million PCs were sold in 2010 to add to the es-
timated base of 1.5 billion around the world.17 This
pales against sales of mobile phones, estimated at
1.6 billion in 2010 (table II.4).18 “Smartphones” feature
processor chips similar to those found in computers
and are now produced by a variety of manufacturers.
Overall sales of such devices were up 72 per cent in
2010, totaling almost 300 million units and accounting
for around a fifth of all mobile handset sales.19 Another
entry into the device world came in April 2010: the
Apple iPad, which straddles the boundary between
smartphones and laptop computers. With 15 million
units sold in 2010, the iPad has attracted competitors
into the so-called tablet arena and sales are expected
to exceed 200 million units by 2014.
Most growth is coming from Internet usage via mo-
bile phones, as illustrated by data for the two largest
developing-country markets. In China, mobile access
to the Internet rose to 277 million by mid-2010, up by
19 per cent since the beginning of the year.20 Some
12 per cent of Chinese Internet users use their mobile
phones to go online. In India there were a quarter bil-
lion mobile data users in September 2010.21 Compre-
hensive data on mobile Internet use for other develop-
ing countries are not readily available. Where provided,
they reflect the trends in China and India. For example,
in Colombia, five million out of eight million Internet
users had a mobile Internet subscription in March
2010.22 In Kenya, there were some 3.2 million mobile
Internet subscriptions, accounting for 99 per cent of
all Internet subscriptions in September 2010.23 Op-
era, a popular browser for low-end Internet-enabled
handsets, particularly in developing nations, reported
90 million users in January 2011, up 80 per cent in
one year and data traffic is growing even faster.24 Giv-
en that mobile phones are the main ICT tool used by
micro-enterprises and SMEs in low-income countries,
these trends reinforce the likelihood that mobile net-
works will be their main way of accessing the Internet.
In Africa, where 84 million mobile handsets are already
capable of using the Internet, 7 out of 10 are expected
to be Internet-enabled by 2014.25
Countries in Latin America and the Caribbean, North
Africa and Central and West Asia are among those
that have shown the largest increase in Internet pen-
etration over the past five years (figure II.13).26 In Latin
0
10
20
30
40
50
60
70
80
Developed economies
Developing economies
Economiesin transition
LDCsWorld
2000
2001
2002
2003
2004
2005
2006
2007
2008
2009
2010
Figure II.12. Internet users per 100 inhabitants, 2000–2010*
*Estimates.Source: ITU World Telecommunication /ICT Indicators data
base.
Table II.4. Sales of computing devices and mobile handsets, 2009 and 2010 (quantity in millions)
Note: PC includes desk-based PCs, mobile PCs including mini-notebooks, but not tablets.
Source: Adapted from Gartner.
Device 2010 sales (m) 2009 sales (m) Change
PCs 351 308 13.80%
Mobile handsets 1 597 1 211 31.80%
of which smartphones
297 172 72.10%
Tablets 19.5 0 n.a.

27CHAPTER II : FACILITATING ENTERPRISE USE OF ICTs
America, the Dominican Republic and Panama have
seen increased Internet use, with around two out of
five persons now being online. Similarly, in North Africa
and West Asia, the top performing countries in terms
of increased penetration during 2005–2010 now have
more than 30 per cent of their population using the
Internet. This strong growth has contributed to social
media use.
(ii) Broadband
Broadband is gaining increasing attention by Govern-
ments worldwide as a general-purpose technology
with important impacts on the economy, employment,
education and health (see e.g. Broadband Commis-
sion (2010); box II.1). At the end of 2010, there were
an estimated 527 million fixed broadband subscrip-
tions around the world. Global penetration rose less
than one point between 2009 and 2010 from 7.0 to
7.7 fixed broadband subscriptions per 100 inhabitants
(figure II.14). The gap between developed and devel-
oping countries remains massive (26 versus 4) and in
LDCs there were less than 1 million fixed broadband
subscriptions in 2010. An average person in a devel-
oped economy was 294 times more likely to have ac-
cess to fixed broadband than one living in an LDC.
Figure II.13. Top 20 economies by largest increase in Internet users per 100 inhabitants, 2005-2010
56
45
44 42
39
3837
34
34
34
32
32
31
31
31
30
28
28
2828
0
10
20
30
40
50
60
70
80
90
Oman
Antig
ua a
nd B
arbu
da
Qatar
Israe
l
Alba
nia
United
Ara
b Em
irate
s
Fran
ce
Mor
occo
Bahra
in
Czech
Rep
ublic
Arm
enia
Belaru
s
Pana
ma
Kaza
khsta
n
Bosnia
and
Her
zego
vina
Guyan
a
Saud
i Ara
bia
Irelan
d
Domini
can
Repub
lic
Azer
baija
n
2010
2005
Note: Excluding economies with a population of less than 100,000. Economies ranked according to the increase in penetration between 2005 and 2010.
Source: Adapted from ITU World Telecommunication/ICT Indicators database.
Almost all economies that have seen the largest in-
creases in fixed broadband connectivity in the past
few years are developed ones, mainly from Europe
(figure II.15). Of the three non-developed economies
top performers, Belarus and Croatia are transition
economies whereas Dominica is a high-income devel-
oping country with relatively small population and land
area making it relatively easy to connect with fixed
high-speed infrastructure.
The global broadband landscape is characterized
by huge gaps not only in basic connectivity but also
in terms of download speeds. The world average in
2010 was about 6.4 Mbps. But whereas the highest
average download speed was noted for the Repub-
lic of Korea at 37.6 Mbps, the situation in developing
countries such as Nepal, Lebanon and Bangladesh
were below 1 Mbps (figure II.16).
Digital Subscriber Line (DSL) technology over fixed
telephone lines accounts for the lion’s share of fixed
broadband connections followed by cable modem (20
per cent) and fibre optic to the premise (12 per cent)
(Point Topic, 2010). The remaining share (2 per cent)
includes such technologies as fixed wireless (e.g.
WiMAX). At the same time, given the far greater pen-
etration of mobile phones compared with fixed broad-

28 INFORMATION ECONOMY REPORT 2011
band subscriptions, wireless broadband holds signifi-
cant potential for boosting high-speed Internet access
in developing economies. Many developing nations
have mobile subscription penetration rates similar to
developed countries but far lower fixed broadband
penetration.
Mobile solutions are likely to be the preferred route to
extending broadband in many low-income countries
with limited fixed line infrastructure. In some develop-
ing countries that have launched mobile broadband
networks, including in Africa, high-speed wireless sub-
scriptions now surpass fixed broadband. For example,
according to data from the GSM Association, in Sep-
tember 2010, there were 2.2 million wireless broad-
band subscriptions in South Africa but only 1,200 fixed
broadband subscriptions, and in Nigeria, there were
almost four times as many mobile as fixed broadband
subscriptions.27 Although mobile broadband penetra-
tion in low-income countries is still far below the world
average, the gap is smaller than in the case of fixed
broadband. ITU estimates that there were about 872
million active mobile broadband subscriptions in 2010.
Whereas global mobile broadband penetration was
about 65 per cent higher than fixed broadband pen-
etration, in Africa it was 1,400 per cent higher.28
In order to speed up the roll-out of mobile broadband,
countries need to allocate spectrum and license op-
erators to provide the service. At the end of 2010,
almost 50 developing and transition economies had
yet to launch mobile broadband services (table II.5).
But licensing mobile broadband services is insufficient
for guaranteeing access throughout a country. Only
around 2 billion people out of the entire world’s popu-
lation are covered by high-speed data networks, and
even in developed regions such as Europe it is esti-
mated that around 20 per cent of the population is
not yet covered by mobile broadband.29 The mobile
industry expects to see rapid growth in the coming
years. According to Ericsson, the number of mobile
broadband subscriptions is predicted to grow from
about 1 billion in 2011 to almost 5 billion by 2016.30
(iii) International bandwidth
International bandwidth – i.e the total capacity avail-
able for accessing websites and other Internet appli-
cations located outside of a country – is another im-
portant aspect of connectivity for the private sector.
Due to a lack of local content, most Internet traffic in
developing countries is often to overseas locations. If
international bandwidth is constrained, the broadband
experience will be poor, limiting the types of applica-
tions users can access and discouraging them from
using the full potential of the Internet. Although inter-
national connectivity can be provided by satellite and
other transmission mediums, the most cost-effective
Box II.1. The Broadband Commission for Digital Development
The Broadband Commission for Digital Development was launched in May 2010 during the World Summit on the Infor-
mation Society (WSIS) Forum 2010 in Geneva. It is led by two co-chairs, H.E. Mr. Paul Kagame, President of Rwanda;
and Mr. Carlos Slim Helú, Honorary Lifetime Chair of Grupo Carso. The heads of the ITU and the United Nations Educa-
tional, Scientific and Cultural Organization (UNESCO) serve as vice-chairs. Other commissioners are from government,
the private sector, international agencies (including the Secretary-General of UNCTAD) and civil society and academia.
The Broadband Commission has produced two initial outcome reports and has also created a number of working groups
to focus on specific areas of importance. The first, high-level, report is entitled Broadband: A Leadership Imperative, and
reflects input from the Commissioners and was presented to United Nations Secretary-General Ban Ki-moon in Septem-
ber 2010, ahead of the 2010 Millennium Development Goals (MDGs) Summit. The second report, Broadband: A Platform
for Progress, is a more comprehensive analytical piece, which looks at financing models, return on investment, technol-
ogy choices, and strategies for deployment across a range of different types of economies.
Source: The Broadband Commission (www.broadbandcommission.org).
0
5
10
15
20
25
30
Developed economies
Developing economies
Economiesin transitionLDCsWorld
2000
2001
2002
2003
2004
2005
2006
2007
2008
2009
2010
Figure II.14. Fixed broadband subscriptions per 100 inhabitants, by country group, 2000-2010
Source: ITU World Telecommunication/ICT Indicators data base.
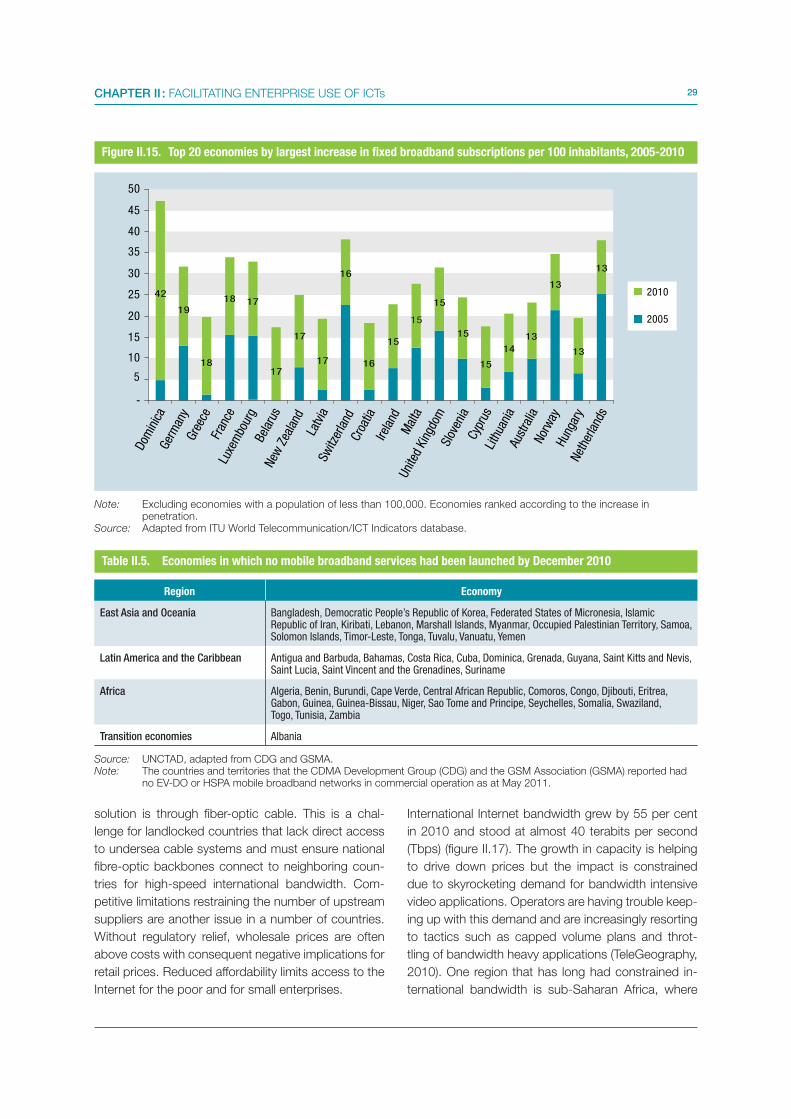
29CHAPTER II : FACILITATING ENTERPRISE USE OF ICTs
42
19
18
18 17
17
17
17
16
16
15
15
15
15
15
14
13
13
13
13
-
5
10
15
20
25
30
35
40
45
50
Dom
inic
aGe
rman
yGr
eece
Fran
ceLu
xem
bour
gBe
laru
sN
ew Z
eala
ndLa
tvia
Switz
erla
ndCr
oatia
Irela
ndM
alta
Unite
d Ki
ngdo
mSl
oven
iaCy
prus
Lith
uani
aAu
stra
liaN
orw
ayHu
ngar
yN
ethe
rland
s
2010
2005
Figure II.15. Top 20 economies by largest increase in fixed broadband subscriptions per 100 inhabitants, 2005-2010
Note: Excluding economies with a population of less than 100,000. Economies ranked according to the increase in penetration.
Source: Adapted from ITU World Telecommunication/ICT Indicators database.
Region Economy
East Asia and Oceania Bangladesh, Democratic People’s Republic of Korea, Federated States of Micronesia, Islamic Republic of Iran, Kiribati, Lebanon, Marshall Islands, Myanmar, Occupied Palestinian Territory, Samoa, Solomon Islands, Timor-Leste, Tonga, Tuvalu, Vanuatu, Yemen
Latin America and the Caribbean Antigua and Barbuda, Bahamas, Costa Rica, Cuba, Dominica, Grenada, Guyana, Saint Kitts and Nevis, Saint Lucia, Saint Vincent and the Grenadines, Suriname
Africa Algeria, Benin, Burundi, Cape Verde, Central African Republic, Comoros, Congo, Djibouti, Eritrea, Gabon, Guinea, Guinea-Bissau, Niger, Sao Tome and Principe, Seychelles, Somalia, Swaziland, Togo, Tunisia, Zambia
Transition economies Albania
Table II.5. Economies in which no mobile broadband services had been launched by December 2010
Source: UNCTAD, adapted from CDG and GSMA. Note: The countries and territories that the CDMA Development Group (CDG) and the GSM Association (GSMA) reported had
no EV-DO or HSPA mobile broadband networks in commercial operation as at May 2011.
solution is through fiber-optic cable. This is a chal-
lenge for landlocked countries that lack direct access
to undersea cable systems and must ensure national
fibre-optic backbones connect to neighboring coun-
tries for high-speed international bandwidth. Com-
petitive limitations restraining the number of upstream
suppliers are another issue in a number of countries.
Without regulatory relief, wholesale prices are often
above costs with consequent negative implications for
retail prices. Reduced affordability limits access to the
Internet for the poor and for small enterprises.
International Internet bandwidth grew by 55 per cent
in 2010 and stood at almost 40 terabits per second
(Tbps) (figure II.17). The growth in capacity is helping
to drive down prices but the impact is constrained
due to skyrocketing demand for bandwidth intensive
video applications. Operators are having trouble keep-
ing up with this demand and are increasingly resorting
to tactics such as capped volume plans and throt-
tling of bandwidth heavy applications (TeleGeography,
2010). One region that has long had constrained in-
ternational bandwidth is sub-Saharan Africa, where

30 INFORMATION ECONOMY REPORT 2011
there was only one major interregional undersea cable
until 2009. Since then, five new systems have been
launched and another two are scheduled to go opera-
tional over the next few years.31 These new cable sys-
tems have already helped prices come down in some
countries and will raise the total capacity delivered
by fibre-optic cable in the region from 3 Tbps to 21
Tbps.32 It will also provide direct access for practically
every sub-Saharan African country bordering the sea,
and could begin to integrate the region into the global
information economy. For this to happen, regulators
need to ensure that supply bottlenecks are minimized
through effective price pressure such as extensive
competition and controls on operators with significant
market power.
b. Business use of the Internet
Developing economies lag behind significantly com-
pared to developed ones and world average in terms
of enterprise use of the Internet. For example, less
-
5
10
15
20
25
30
35
40
Nep
al
Leba
non
Iran
(Is
lam
icR
epub
lic o
f)
Ban
glad
esh
Iraq
Lao
Peo
ple’
sD
emoc
ratic
Rep
ublic
Alg
eria
Vene
zuel
a (B
oliv
aria
nR
epub
lic o
f)S
udan
Indi
a
Egyp
t
Ken
ya
Viet
Nam
Uni
ted
Sta
tes
Por
tuga
l
Japa
n
Luxe
mbo
urg
Net
herl
ands
Rom
ania
Rep
ublic
of
Mol
dova
Sw
eden
Latv
ia
Lith
uani
a
Rep
ublic
of
Kor
ea
Download speed, Mbps World average
Figure II.16. Average download speeds, selected economies, 2010, (Mbps)
Note: Speeds based on tests of consumer download speeds around the globe. The value is the rolling mean throughput in Mbps over the past 30 days where the mean distance between the client and the server is less than 300 miles. Data were downloaded on 9 March 2010.
Source: OOKLA (www.ookla.com/).
than one in five enterprises in sub-Saharan Africa has
a web site, compared to four out of five in the Orga-
nization for Economic Cooperation and Development
(OECD) countries and about 30 per cent for the world
as a whole (figure II.18).
While Internet use by enterprises continues to grow in
developing countries, large differences still remain in
the type of use according to enterprise size and eco-
nomic sector. As with computers, there is a clear dif-
ference in the level of Internet use between medium-
sized and large enterprises, on the one hand, and of
small and (especially) micro-enterprises on the other
(see figure II.19). Take Jordan, where virtually all enter-
prises with more than 250 employees but just 6 per
cent of the micro-enterprises use the Internet.
Low levels of Internet adoption by the smallest firms
tend to pull down overall levels of ICT use in devel-
oping economies, as evidenced by the data regard-
ing Internet use by sectors. In terms of the economic
sector, available data for developing countries do not
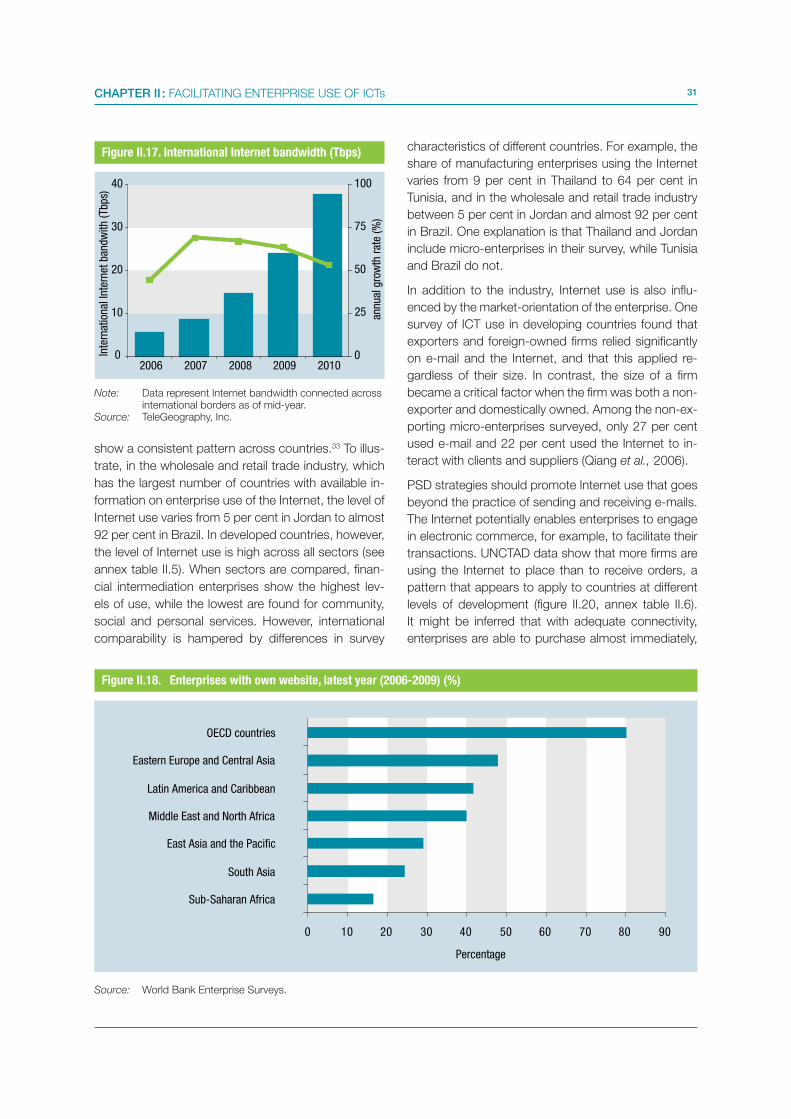
31CHAPTER II : FACILITATING ENTERPRISE USE OF ICTs
characteristics of different countries. For example, the
share of manufacturing enterprises using the Internet
varies from 9 per cent in Thailand to 64 per cent in
Tunisia, and in the wholesale and retail trade industry
between 5 per cent in Jordan and almost 92 per cent
in Brazil. One explanation is that Thailand and Jordan
include micro-enterprises in their survey, while Tunisia
and Brazil do not.
In addition to the industry, Internet use is also influ-
enced by the market-orientation of the enterprise. One
survey of ICT use in developing countries found that
exporters and foreign-owned firms relied significantly
on e-mail and the Internet, and that this applied re-
gardless of their size. In contrast, the size of a firm
became a critical factor when the firm was both a non-
exporter and domestically owned. Among the non-ex-
porting micro-enterprises surveyed, only 27 per cent
used e-mail and 22 per cent used the Internet to in-
teract with clients and suppliers (Qiang et al., 2006).
PSD strategies should promote Internet use that goes
beyond the practice of sending and receiving e-mails.
The Internet potentially enables enterprises to engage
in electronic commerce, for example, to facilitate their
transactions. UNCTAD data show that more firms are
using the Internet to place than to receive orders, a
pattern that appears to apply to countries at different
levels of development (figure II.20, annex table II.6).
It might be inferred that with adequate connectivity,
enterprises are able to purchase almost immediately,
0
10
20
30
40
2006 2007 2008 2009 2010
Inte
rnat
iona
l Int
erne
t ba
ndw
ith (
Tbps
)
0
25
50
75
100
annu
al g
row
th r
ate
(%)
Figure II.17. International Internet bandwidth (Tbps)
Note: Data represent Internet bandwidth connected across international borders as of mid-year.
Source: TeleGeography, Inc.
show a consistent pattern across countries.33 To illus-
trate, in the wholesale and retail trade industry, which
has the largest number of countries with available in-
formation on enterprise use of the Internet, the level of
Internet use varies from 5 per cent in Jordan to almost
92 per cent in Brazil. In developed countries, however,
the level of Internet use is high across all sectors (see
annex table II.5). When sectors are compared, finan-
cial intermediation enterprises show the highest lev-
els of use, while the lowest are found for community,
social and personal services. However, international
comparability is hampered by differences in survey
0 10 20 30 40 50 60 70 80 90
Sub-Saharan Africa
South Asia
East Asia and the Pacific
Middle East and North Africa
Latin America and Caribbean
Eastern Europe and Central Asia
OECD countries
Percentage
Figure II.18. Enterprises with own website, latest year (2006-2009) (%)
Source: World Bank Enterprise Surveys.
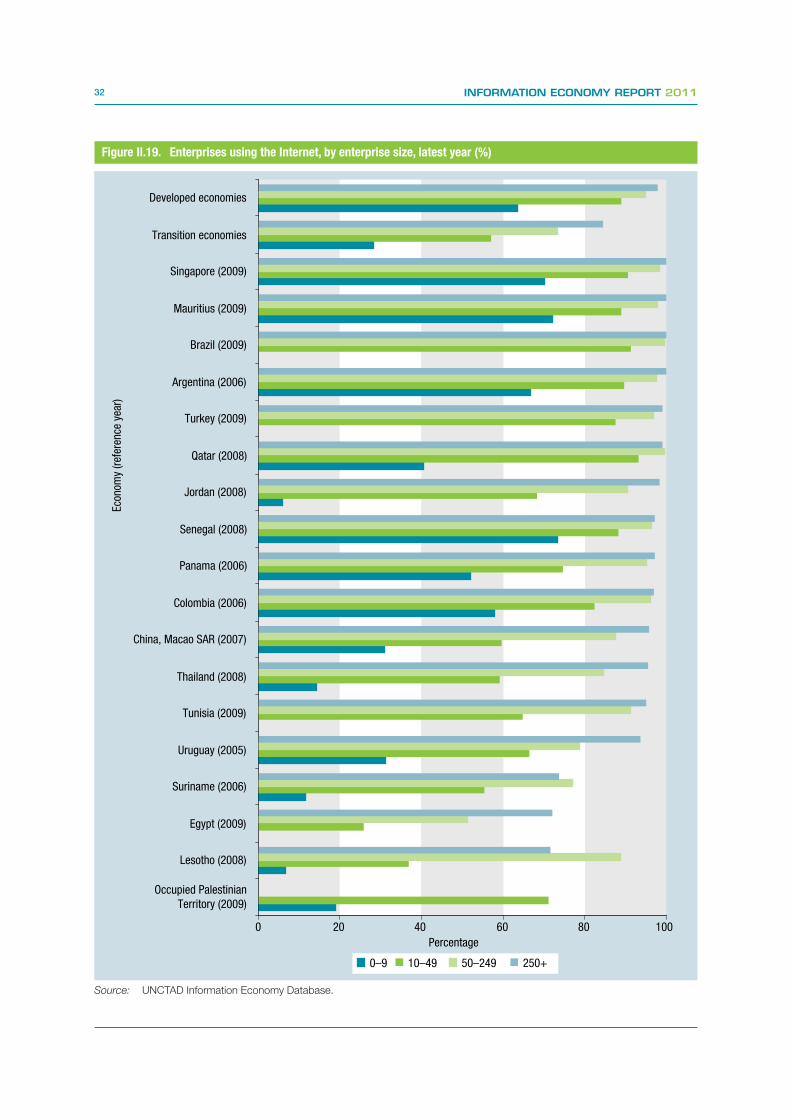
32 INFORMATION ECONOMY REPORT 2011
0 20 40 60 80 100
Occupied PalestinianTerritory (2009)
Lesotho (2008)
Egypt (2009)
Suriname (2006)
Uruguay (2005)
Tunisia (2009)
Thailand (2008)
China, Macao SAR (2007)
Colombia (2006)
Panama (2006)
Senegal (2008)
Jordan (2008)
Qatar (2008)
Turkey (2009)
Argentina (2006)
Brazil (2009)
Mauritius (2009)
Singapore (2009)
Transition economies
Developed economies
Econ
omy
(ref
eren
ce y
ear)
0–9 10–49 50–249 250+
Percentage
Figure II.19. Enterprises using the Internet, by enterprise size, latest year (%)
Source: UNCTAD Information Economy Database.

33CHAPTER II : FACILITATING ENTERPRISE USE OF ICTs
but setting up systems that will allow them to sell on-
line, in particular if it involves creating or upgrading a
Web presence and restructuring sales and inventory
processes, requires more time and resources. Large
and medium-sized enterprises may be better placed
to engage in e-commerce more quickly, and may also
have a greater need for such systems.34
The Internet is an important channel for enterprises
to engage online with Governments. The provision of
e-government services is a way for Governments to
apply ICTs in support of PSD (see chapter IV). Better
access to relevant information from the government
can reduce information search costs, and the ability
to make transactions with government organizations
carries even greater potential for improved efficiency
and cost reduction. E-government-to-business trans-
action services include the declaration and payment
of taxes online, payment of utilities and other fees,
automated customs systems, job banks matching
employers with potential employees or application for
government assistance.35
UNCTAD data suggest that developing-country en-
terprises use the Internet more for obtaining informa-
tion from governments than for conducting transac-
tions with them (figure II.21). This may be due partly
to the limited range of e-government services on of-
fer. According to the United Nations E-Government
Survey 2010, “only a few countries are able to offer
many secure transactions online… although the trend
is toward more e-forms and e-payments” (UNDESA,
2010: 77). Even in cases where enterprises report
that they use the Internet more for interaction than for
getting information, such as in Brazil, this interaction
does not necessarily reflect online transactions.36 For
example, a recent study of the “gov.br” domain found
that approximately 80 per cent of documents pub-
lished in Brazilian Government websites were in “.pdf”
format, and only 5 per cent were in “.xml” format, used
for data interoperation.37 When integrating ICT in their
PSD strategies, countries might envisage not only fa-
cilitating the provision of government services for en-
terprises online, but also building trust in the online
environment so as to promote uptake by enterprises.
Figure II.20. Enterprises using the Internet to place and receive orders, selected economies, 2008-2009 (%)
Developed economies
05
101520253035404550
0-9 10-49 50-249 250+Enterprise size
Per
cent
age
Receiving online orders Placing online orders
The former Yugoslav Republic of Macedonia, 2009
0123456789
10
0-9 10-49 50-249 250+Enterprise size
Per
cent
age
Receiving online orders Placing online orders
Senegal, 2008
0
2
4
6
8
10
12
14
0-9 10-49 50-249 250+Enterprise size
Per
cent
age
Receiving online orders Placing online orders
Thailand, 2008
02468
1012141618
0-9 10-49 50-249 250+Enterprise size
Per
cent
age
Receiving online orders Placing online orders
Source: UNCTAD Information Economy Database.

34 INFORMATION ECONOMY REPORT 2011
High-speed connections are essential to make full
use of today’s multimedia-rich Internet and to enable
powerful business applications. Studies in developed
countries show that broadband is essential to enable
enterprises to make full use of Internet-based services
and applications (UNCTAD, 2009a). As can be seen
from figure II.22, fixed broadband use is almost ubiq-
uitous in developed economies, with around 90 per
cent of enterprises benefiting from high-speed Inter-
net access. In developing countries for which data are
available, the pattern is more diverse. For example,
while more than three quarters of medium and large
enterprises in Brazil, Colombia, Qatar, Republic of Ko-
rea, Singapore, Turkey and the United Arab Emirates
have broadband Internet access, the corresponding
share is much lower in other economies, especially in
the case of MSEs.38
One advantage of having broadband access is the
possibility to use Voice over Internet Protocol (VoIP),
which is rapidly expanding (figure II.23). This is of
particular relevance for micro-enterprises and SMEs
in developing countries, given its lower cost structure
compared to traditional telephone services.39 A 2008
survey in Fiji found that 21 per cent of SMEs used
the VoIP application Skype to communicate and
negotiate with their foreign-based suppliers (Devi,
2008). Over one fifth of fixed broadband subscrip-
tions around the world include voice over broadband
service.40 This amounted to some 110 million in mid
2010 (figure II.23) or around 10 per cent of conven-
tional fixed telephone lines. It should be noted that
several countries reportedly either ban VoIP services
(as in Ethiopia, Kuwait and Oman) or have restric-
tions that make it almost impossible for such ser-
vices to be provided by competitive providers (as in
Armenia, Bangladesh, Egypt, Philippines, Saudi Ara-
bia, Thailand and the United Arab Emirates) (Voice on
the Net Coalition, 2010).41
The wholesale pricing legacy of traditional telephone
networks has impacted on VoIP services. Fixed tele-
phone operators charge a wholesale “termination” rate
to complete calls within their networks. This applies to
calls coming from an IP-based service and terminating
on a telephone line. This explains why a VoIP service,
such as Skype, offers free computer-to-computer
calls but charges for computer-to-telephone calls.
The lowest price Skype charges for a call to conven-
tional telephone numbers around the world is $0.023
per minute. However, Skype offers that rate only for
calls to fixed lines in three dozen primarily developed
0
10
20
30
40
50
60
70
80
90
100
Dev
elop
ed
econ
omie
s av
erag
e
Sing
apor
e
Qat
arRe
publ
ic o
f Kor
ea
Braz
il
Arge
ntin
a
Pana
ma
Urug
uay
Turk
ey
Tuni
sia
Unite
d Ar
abEm
irate
s
Colo
mbi
a
Egyp
t
Getting information Interacting
Percentage
Figure II.21. Enterprises using the Internet to get information from and interact with Governments, selected economies, latest year (%)
Source: UNCTAD Information Economy Database.

35CHAPTER II : FACILITATING ENTERPRISE USE OF ICTs
Figure II.22. Enterprises using the Internet via fixed broadband, selected economies, latest year (%)
0 10 20 30 40 50 60 70 80 90 100
Developed economiesaverage
Republic of Korea (2008)
China, Hong Kong SAR (2009)
Turkey (2009)
Senegal (2008)
Qatar (2008)
Colombia (2006)
The former YugoslavRepublic of Macedonia (2009)
Brazil (2009)
Uruguay (2005)
Singapore (2009)
Thailand (2008)
United Arab Emirates (2008)
Russian Federation (2008)
Egypt (2009)
Tunisia (2009)
Kyrgyzstan (2009)
Lesotho (2008)
Serbia (2007)
Argentina (2006)
Azerbaijan (2009)
Kazakhstan (2008)
Occupied PalestinianTerritory (2009)
Econ
omy
(ref
eren
ce y
ear)
Percentage
0–9
10–49
50–249
250+
Source: UNCTAD Information Economy Database.

36 INFORMATION ECONOMY REPORT 2011
countries. Calls to other fixed lines are more expensive
and calls terminating on mobile phones even more so.
The main reasons are market failure, resulting in above
cost wholesale prices, and regulations banning com-
puter to phone services. Developed economies have
the lowest Skype “Out” (computer to telephone) rates
while the LDCs have the highest (table II.6). This is
not surprising, since most LDC citizens cannot afford
to make many outgoing calls whereas incoming calls
from wealthier countries are less price-sensitive and
generate income for domestic operators through non-
cost-based termination charges.
Broadband also facilitates the use of social media
and many of its applications, which present eco-
nomic and marketing opportunities for enterprises.42
The potential of social networks, such as Facebook
and Twitter, lies particularly in relation to customer
interaction, such as marketing and brand monitor-
ing. Their nature encourages customer feedback,
which can serve to guide business decisions and
strategy. Young people are particularly adept at
social media use and are an emerging consumer
group that can be targeted. Social media may of-
fer a cost-effective way for informal enterprises and
SMEs to establish a Web presence. Furthermore, as
mobile versions of social networking do not require
much bandwidth, they can be attractive options for
users in countries with slow Internet connections.43
It may also provide better information on demand
and user preferences.
A 2010 study found that 20 per cent of companies
in the United States and Europe already use blogs,
forums or wikis for internal or external purposes
(Deutsche Bank Research, 2010). In April 2010,
some 37 per cent of all Twitter users (or around 40
million people) were “tweeting” from their mobiles.44
Short “tweets” are similar to text messages and
therefore a good fit for mobile phones.45 Twitter is
working with mobile operators to lower the cost of
sending tweets via SMS or even making them free.
Most of the top 10 countries by penetration are in
the developing world. In Brazil, Indonesia and the
Bolivarian Republic of Venezuela, around every fifth
Internet user accesses Twitter.46 Some 200 million
people are accessing Facebook through their mo-
biles.47 Facebook can be a cost-effective platform for
micro-enterprises and SMEs compared to traditional
websites. More and more businesses are flocking to
Facebook to tap into its expanding user base, some-
times with a consequent fall in traffic to traditional
company websites.48 But while Facebook is the most
popular social networking application worldwide,
others lead in specific national markets such as Or-
kut in Brazil, Qzone in China and Vkontakte in the
Russian Federation.49
c. Pricing of Internet use
When comparing pricing trends in developing coun-
tries, the mode of accessing the Internet is important.
Although much focus is on broadband, dial-up is typi-
cally cheaper for low usage, and may be enough for
enterprises using simple, low bandwidth applications
such as e-mail. Many micro-enterprises in developing
countries go online only through Internet cafés or their
mobile phones. Therefore, fixed broadband monthly
subscription prices may not be the most relevant
benchmark. A comparison of the cost of Internet use
at public facilities or mobile Internet prices would be
0
20
40
60
80
100
120
Q4
05
Q2
06
Q4
06
Q2
07
Q4
07
Q2
08
Q4
08
Q2
09
Q4
09
Q2
10
Mill
ions
Figure II.23. Global subscriptions of voice over Internet Protocol, Q4 2005–Q2 2010, (millions)
Source: Point Topic.
Table II.6. Skype out rates, US cents per minute, March 2011
Note: Average (mean) rates for calls made from Skype to fixed or mobile telephone numbers in each economic group.
Source: Adapted from Skype.
Group Fixed Mobile
Developed economies 4.5 22.5
Developing economies 24.3 26.1
LDCs 41.6 42.8
Transition economies 15.2 22.6
World 23.5 31.2
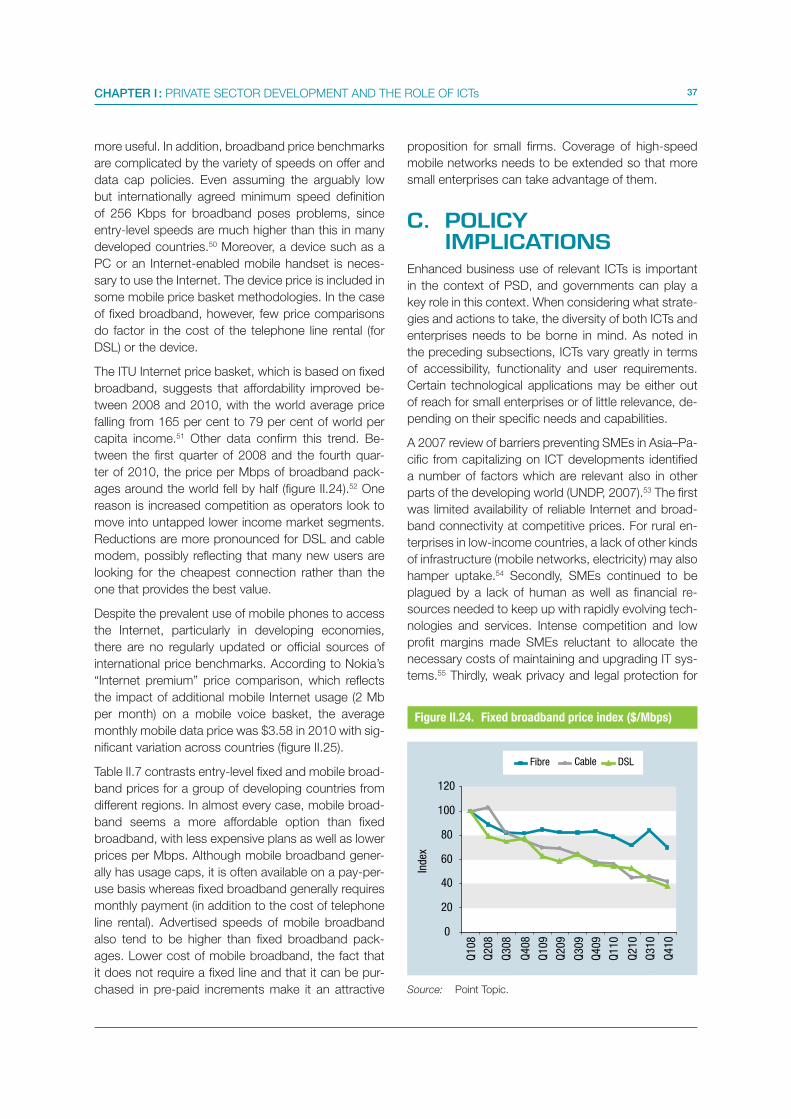
37CHAPTER I : PRIVATE SECTOR DEVELOPMENT AND THE ROLE OF ICTs
more useful. In addition, broadband price benchmarks
are complicated by the variety of speeds on offer and
data cap policies. Even assuming the arguably low
but internationally agreed minimum speed definition
of 256 Kbps for broadband poses problems, since
entry-level speeds are much higher than this in many
developed countries.50 Moreover, a device such as a
PC or an Internet-enabled mobile handset is neces-
sary to use the Internet. The device price is included in
some mobile price basket methodologies. In the case
of fixed broadband, however, few price comparisons
do factor in the cost of the telephone line rental (for
DSL) or the device.
The ITU Internet price basket, which is based on fixed
broadband, suggests that affordability improved be-
tween 2008 and 2010, with the world average price
falling from 165 per cent to 79 per cent of world per
capita income.51 Other data confirm this trend. Be-
tween the first quarter of 2008 and the fourth quar-
ter of 2010, the price per Mbps of broadband pack-
ages around the world fell by half (figure II.24).52 One
reason is increased competition as operators look to
move into untapped lower income market segments.
Reductions are more pronounced for DSL and cable
modem, possibly reflecting that many new users are
looking for the cheapest connection rather than the
one that provides the best value.
Despite the prevalent use of mobile phones to access
the Internet, particularly in developing economies,
there are no regularly updated or official sources of
international price benchmarks. According to Nokia’s
“Internet premium” price comparison, which reflects
the impact of additional mobile Internet usage (2 Mb
per month) on a mobile voice basket, the average
monthly mobile data price was $3.58 in 2010 with sig-
nificant variation across countries (figure II.25).
Table II.7 contrasts entry-level fixed and mobile broad-
band prices for a group of developing countries from
different regions. In almost every case, mobile broad-
band seems a more affordable option than fixed
broadband, with less expensive plans as well as lower
prices per Mbps. Although mobile broadband gener-
ally has usage caps, it is often available on a pay-per-
use basis whereas fixed broadband generally requires
monthly payment (in addition to the cost of telephone
line rental). Advertised speeds of mobile broadband
also tend to be higher than fixed broadband pack-
ages. Lower cost of mobile broadband, the fact that
it does not require a fixed line and that it can be pur-
chased in pre-paid increments make it an attractive
proposition for small firms. Coverage of high-speed
mobile networks needs to be extended so that more
small enterprises can take advantage of them.
C. POLICY IMPLICATIONS
Enhanced business use of relevant ICTs is important
in the context of PSD, and governments can play a
key role in this context. When considering what strate-
gies and actions to take, the diversity of both ICTs and
enterprises needs to be borne in mind. As noted in
the preceding subsections, ICTs vary greatly in terms
of accessibility, functionality and user requirements.
Certain technological applications may be either out
of reach for small enterprises or of little relevance, de-
pending on their specific needs and capabilities.
A 2007 review of barriers preventing SMEs in Asia–Pa-
cific from capitalizing on ICT developments identified
a number of factors which are relevant also in other
parts of the developing world (UNDP, 2007).53 The first
was limited availability of reliable Internet and broad-
band connectivity at competitive prices. For rural en-
terprises in low-income countries, a lack of other kinds
of infrastructure (mobile networks, electricity) may also
hamper uptake.54 Secondly, SMEs continued to be
plagued by a lack of human as well as financial re-
sources needed to keep up with rapidly evolving tech-
nologies and services. Intense competition and low
profit margins made SMEs reluctant to allocate the
necessary costs of maintaining and upgrading IT sys-
tems.55 Thirdly, weak privacy and legal protection for
Figure II.24. Fixed broadband price index ($/Mbps)
Source: Point Topic.
0
20
40
60
80
100
120
Q1
08
Q2
08
Q3
08
Q4
08
Q1
09
Q2
09
Q3
09
Q4
09
Q1
10
Q2
10
Q3
10
Q4
10
Inde
x
Fibre Cable DSL

38 INFORMATION ECONOMY REPORT 2011
electronic transactions was an issue in many countries
in Asia Pacific, especially LDCs. Moreover, the special
needs of SMEs seldom feature in regulatory systems
addressing security, privacy and consumer protection.
Governments can create environments for greater ICT
uptake, by liberalizing markets to expand and improve
network infrastructure, providing a supportive legal
and regulatory environment for electronic transactions,
and taking steps to enhance technological diffusion
(UNCTAD, 2009a). They can also seek to overcome
market failures by creating demand aggregation (e.g.
by developing e-government services, such as e-pro-
curement, and encouraging firms to use them) and by
supporting the development of ICT skills (Qiang et al.,
2006; UNCTAD 2009a). An additional area relates to
the development of better data. As highlighted above,
many countries lack up-to-date information on the
nature of ICT use among their enterprises, hamper-
ing their ability to formulate and monitor policies and
strategies in this area (box II.2). As part of the work of
the Partnership on Measuring ICT for Development,
UNCTAD and several regional commissions of the
United Nations are actively supporting the production
of statistics related to ICT use in enterprises.56 How-
ever, the need for capacity-building and training in this
area remains huge.
In terms of enhancing access to different ICTs, Gov-
ernments can contribute by opening up ICT markets
and improving competition. This involves macro-level
reforms of the investment climate and business en-
vironment. Competition increases the likelihood that
private sector investment – whether with a partnership
of the public sector or not – will help make relevant (i.e.
size and sector-specific) ICTs available to the business
community at increasingly affordable rates (see chap-
ter III). Where relevant connectivity is still lacking due
to market failures, such as in the case of mobile net-
works in rural areas of LDCs, Governments and their
development partners need to explore approaches
to extending both network access and local access
(UNCTAD, 2010).
0
1
2
3
4
5
6
7
8
9
10
Sud
anB
urki
na F
aso
Uni
ted
Rep
ublic
of
Tanz
ania
Egyp
tVi
et N
amK
enya
Uzb
ekis
tan
Cam
bodi
aS
ri L
anka
Mal
awi
Col
ombi
aIn
done
sia
Indi
aP
akis
tan
Zam
bia
Ethi
opia
Kaz
akhs
tan
Moz
ambi
que
Mad
agas
car
Ban
glad
esh
Gha
naS
outh
Afr
ica
Uga
nda
Iran
(Is
lam
ic R
epub
lic o
f)S
yria
n A
rab
Rep
ublic
Chi
leD
emoc
ratic
Rep
ublic
of
the
Con
goA
ngol
aN
iger
iaA
rgen
tina
Bol
ivia
(P
luri
natio
nal S
tate
of)
Sen
egal
Chi
naP
hilip
pine
sP
eru
Thai
land
Turk
eyD
omin
ican
Rep
ublic
Cam
eroo
nC
ôte
d'Iv
oire
Ecua
dor
Alg
eria
Bra
zil
Tuni
sia
Zim
babw
eC
had
Gui
nea
Hon
dura
sG
uate
mal
aH
aiti
Mor
occo
Internet premium (dollars) World average
Figure II.25. Price of monthly mobile data usage (2 MB per month), 2010 ($)
Source: Nokia.
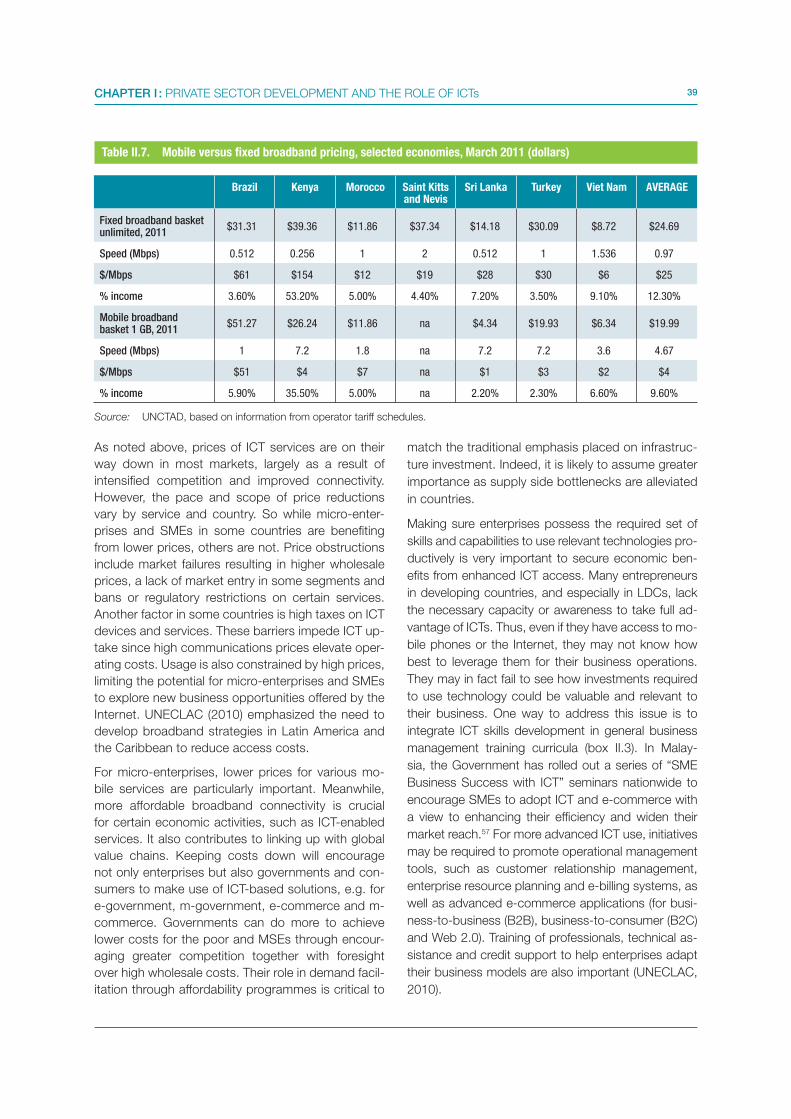
39CHAPTER I : PRIVATE SECTOR DEVELOPMENT AND THE ROLE OF ICTs
As noted above, prices of ICT services are on their
way down in most markets, largely as a result of
intensified competition and improved connectivity.
However, the pace and scope of price reductions
vary by service and country. So while micro-enter-
prises and SMEs in some countries are benefiting
from lower prices, others are not. Price obstructions
include market failures resulting in higher wholesale
prices, a lack of market entry in some segments and
bans or regulatory restrictions on certain services.
Another factor in some countries is high taxes on ICT
devices and services. These barriers impede ICT up-
take since high communications prices elevate oper-
ating costs. Usage is also constrained by high prices,
limiting the potential for micro-enterprises and SMEs
to explore new business opportunities offered by the
Internet. UNECLAC (2010) emphasized the need to
develop broadband strategies in Latin America and
the Caribbean to reduce access costs.
For micro-enterprises, lower prices for various mo-
bile services are particularly important. Meanwhile,
more affordable broadband connectivity is crucial
for certain economic activities, such as ICT-enabled
services. It also contributes to linking up with global
value chains. Keeping costs down will encourage
not only enterprises but also governments and con-
sumers to make use of ICT-based solutions, e.g. for
e-government, m-government, e-commerce and m-
commerce. Governments can do more to achieve
lower costs for the poor and MSEs through encour-
aging greater competition together with foresight
over high wholesale costs. Their role in demand facil-
itation through affordability programmes is critical to
match the traditional emphasis placed on infrastruc-
ture investment. Indeed, it is likely to assume greater
importance as supply side bottlenecks are alleviated
in countries.
Making sure enterprises possess the required set of
skills and capabilities to use relevant technologies pro-
ductively is very important to secure economic ben-
efits from enhanced ICT access. Many entrepreneurs
in developing countries, and especially in LDCs, lack
the necessary capacity or awareness to take full ad-
vantage of ICTs. Thus, even if they have access to mo-
bile phones or the Internet, they may not know how
best to leverage them for their business operations.
They may in fact fail to see how investments required
to use technology could be valuable and relevant to
their business. One way to address this issue is to
integrate ICT skills development in general business
management training curricula (box II.3). In Malay-
sia, the Government has rolled out a series of “SME
Business Success with ICT” seminars nationwide to
encourage SMEs to adopt ICT and e-commerce with
a view to enhancing their efficiency and widen their
market reach.57 For more advanced ICT use, initiatives
may be required to promote operational management
tools, such as customer relationship management,
enterprise resource planning and e-billing systems, as
well as advanced e-commerce applications (for busi-
ness-to-business (B2B), business-to-consumer (B2C)
and Web 2.0). Training of professionals, technical as-
sistance and credit support to help enterprises adapt
their business models are also important (UNECLAC,
2010).
Brazil Kenya Morocco Saint Kitts and Nevis
Sri Lanka Turkey Viet Nam AVERAGE
Fixed broadband basket unlimited, 2011
$31.31 $39.36 $11.86 $37.34 $14.18 $30.09 $8.72 $24.69
Speed (Mbps) 0.512 0.256 1 2 0.512 1 1.536 0.97
$/Mbps $61 $154 $12 $19 $28 $30 $6 $25
% income 3.60% 53.20% 5.00% 4.40% 7.20% 3.50% 9.10% 12.30%
Mobile broadband basket 1 GB, 2011
$51.27 $26.24 $11.86 na $4.34 $19.93 $6.34 $19.99
Speed (Mbps) 1 7.2 1.8 na 7.2 7.2 3.6 4.67
$/Mbps $51 $4 $7 na $1 $3 $2 $4
% income 5.90% 35.50% 5.00% na 2.20% 2.30% 6.60% 9.60%
Table II.7. Mobile versus fixed broadband pricing, selected economies, March 2011 (dollars)
Source: UNCTAD, based on information from operator tariff schedules.
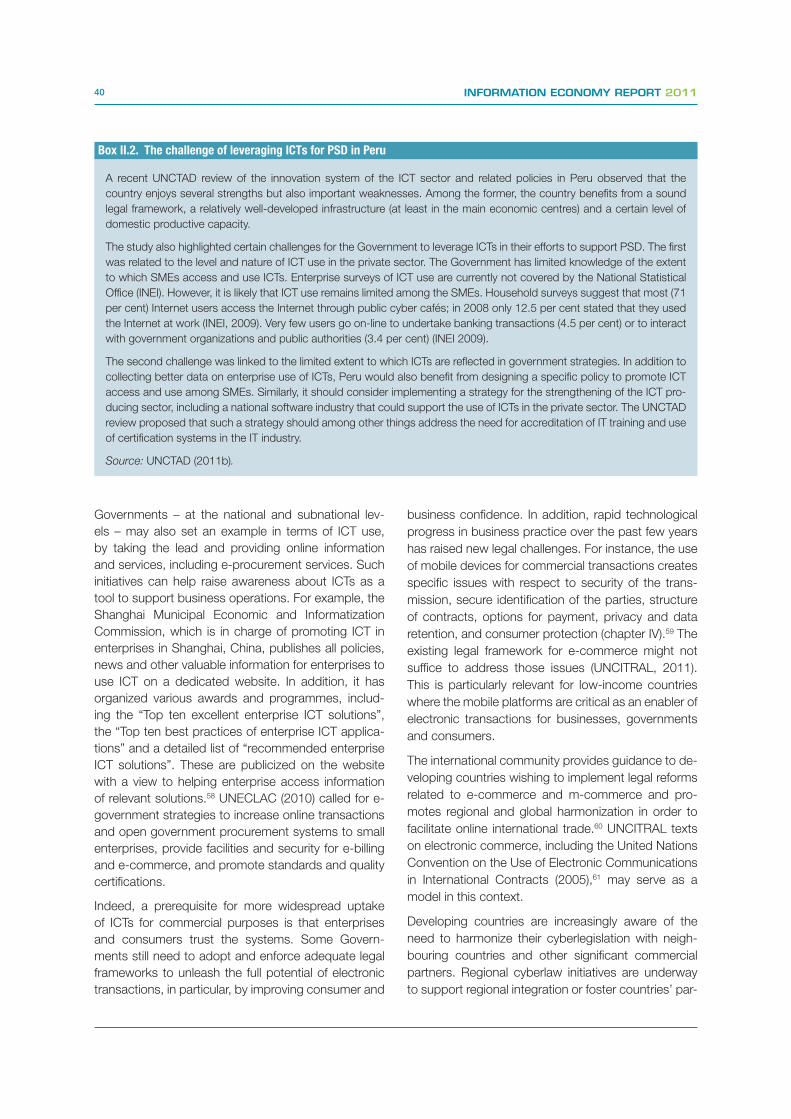
40 INFORMATION ECONOMY REPORT 2011
Governments – at the national and subnational lev-
els – may also set an example in terms of ICT use,
by taking the lead and providing online information
and services, including e-procurement services. Such
initiatives can help raise awareness about ICTs as a
tool to support business operations. For example, the
Shanghai Municipal Economic and Informatization
Commission, which is in charge of promoting ICT in
enterprises in Shanghai, China, publishes all policies,
news and other valuable information for enterprises to
use ICT on a dedicated website. In addition, it has
organized various awards and programmes, includ-
ing the “Top ten excellent enterprise ICT solutions”,
the “Top ten best practices of enterprise ICT applica-
tions” and a detailed list of “recommended enterprise
ICT solutions”. These are publicized on the website
with a view to helping enterprise access information
of relevant solutions.58 UNECLAC (2010) called for e-
government strategies to increase online transactions
and open government procurement systems to small
enterprises, provide facilities and security for e-billing
and e-commerce, and promote standards and quality
certifications.
Indeed, a prerequisite for more widespread uptake
of ICTs for commercial purposes is that enterprises
and consumers trust the systems. Some Govern-
ments still need to adopt and enforce adequate legal
frameworks to unleash the full potential of electronic
transactions, in particular, by improving consumer and
business confidence. In addition, rapid technological
progress in business practice over the past few years
has raised new legal challenges. For instance, the use
of mobile devices for commercial transactions creates
specific issues with respect to security of the trans-
mission, secure identification of the parties, structure
of contracts, options for payment, privacy and data
retention, and consumer protection (chapter IV).59 The
existing legal framework for e-commerce might not
suffice to address those issues (UNCITRAL, 2011).
This is particularly relevant for low-income countries
where the mobile platforms are critical as an enabler of
electronic transactions for businesses, governments
and consumers.
The international community provides guidance to de-
veloping countries wishing to implement legal reforms
related to e-commerce and m-commerce and pro-
motes regional and global harmonization in order to
facilitate online international trade.60 UNCITRAL texts
on electronic commerce, including the United Nations
Convention on the Use of Electronic Communications
in International Contracts (2005),61 may serve as a
model in this context.
Developing countries are increasingly aware of the
need to harmonize their cyberlegislation with neigh-
bouring countries and other significant commercial
partners. Regional cyberlaw initiatives are underway
to support regional integration or foster countries’ par-
Box II.2. The challenge of leveraging ICTs for PSD in Peru
A recent UNCTAD review of the innovation system of the ICT sector and related policies in Peru observed that the
country enjoys several strengths but also important weaknesses. Among the former, the country benefits from a sound
legal framework, a relatively well-developed infrastructure (at least in the main economic centres) and a certain level of
domestic productive capacity.
The study also highlighted certain challenges for the Government to leverage ICTs in their efforts to support PSD. The first
was related to the level and nature of ICT use in the private sector. The Government has limited knowledge of the extent
to which SMEs access and use ICTs. Enterprise surveys of ICT use are currently not covered by the National Statistical
Office (INEI). However, it is likely that ICT use remains limited among the SMEs. Household surveys suggest that most (71
per cent) Internet users access the Internet through public cyber cafés; in 2008 only 12.5 per cent stated that they used
the Internet at work (INEI, 2009). Very few users go on-line to undertake banking transactions (4.5 per cent) or to interact
with government organizations and public authorities (3.4 per cent) (INEI 2009).
The second challenge was linked to the limited extent to which ICTs are reflected in government strategies. In addition to
collecting better data on enterprise use of ICTs, Peru would also benefit from designing a specific policy to promote ICT
access and use among SMEs. Similarly, it should consider implementing a strategy for the strengthening of the ICT pro-
ducing sector, including a national software industry that could support the use of ICTs in the private sector. The UNCTAD
review proposed that such a strategy should among other things address the need for accreditation of IT training and use
of certification systems in the IT industry.
Source: UNCTAD (2011b).

41CHAPTER I : PRIVATE SECTOR DEVELOPMENT AND THE ROLE OF ICTs
ticipation in international trade. In Asia, for instance, 8
of the 10 members of the Association of Southeast
Asian Nations (ASEAN) have adopted harmonized e-
commerce laws based on UNCITRAL models. The
remaining two, Cambodia and the Lao People’s Dem-
ocratic Republic, are intending to adopt similar legis-
lation by 2012. In Africa, several regional groupings
are in the process of developing guidelines in view of
the development of e-commerce and m-commerce.
The East African Community (EAC), for example,
has already made significant advances by preparing
a regional Framework for Cyberlaws. EAC member
countries have taken a number of steps to adopt cy-
berlaws based on the recommendations contained in
the Framework prepared by the EAC and UNCTAD. In
Latin America and the Caribbean, the adoption of cy-
berlaws is given attention at the supra-national as well
as the national level.62 A number of Central American
countries have de facto harmonized their e-commerce
legislation on the basis of UNCITRAL texts. Similarly,
the ITU HIPCAR project is promoting the adoption of
uniform texts for cyberlegislation in the Caribbean.
To be effective and reach intended beneficiaries, pol-
icy interventions to promote greater ICT uptake and
use in the private sector must be tailored to specific
contexts and based upon a clear understanding of
the real experience and requirements of different en-
terprises (UNCTAD, 2010). Policymakers should in
this context actively seek the input and engagement
of enterprises in programme design and implementa-
tion. Their direct involvement brings relevant experi-
ence – of the constraints faced by enterprises and of
ways in which they can make use of technology – to
the fore and helps to focus interventions on outcomes
of higher value to end-users.
Box II.3. Training entrepreneurs to use mobile phones as a business tool
In collaboration with the Government of Panama and four partner United Nations agencies (the United Nations Industrial
Development Organization (UNIDO), the Food and Agriculture Organization of the United Nations (FAO), the World Tour-
ism Organization (UNWTO) and the United Nations Development Programme (UNDP)), UNCTAD is implementing a Joint
Programme on “Entrepreneurship Network Opportunities for Poor Families” in Panama.a In 2010, specific mobile exer-
cises were integrated for the first time into UNCTAD’s Empretec entrepreneurship training for micro-entrepreneurs in that
country. Although most of the entrepreneurs had their own cell phones, the majority used them only to communicate with
friends and relatives. The Empretec workshop helped them treat the phone as a business tool. As a result, participants
subsequently started using them to store clients’ contact details, to calculate costings and sending texts for marketing
purposes. Notably, many of the entrepreneurs that participated in the training now seek out more information about
prices, competition and potential clients through their cell phones.
The need to train entrepreneurs in using ICTs has been observed in other countries as well. In collaboration with the
International Institute for Communication and Development (IICD), the SEND Foundation in Ghana and the Federation of
Agricultural producers in Burkina Faso both started in 2009 to use the West African ESOKO market information system
delivered via mobile services to access relevant market information. Despite improved access to information, however,
the results did not match expectations. The intended beneficiaries – small-scale farmers (especially women) – generally
lacked the technical and marketing skills needed to use the information and the mobile services effectively. To address
this situation, the organizations focused on building the capacities of underprivileged women to use mobile phones and
product codes to request information from the platform. Participants learned how to interpret the information provided,
relate it to their own production plans, and to make better marketing and sales decisions. As explained by one of the
women, “I learned how to use the mobile phone to find a market for my own goods. Accessibility to markets has enabled
me to pay school fees, purchase animal draft power and construction of a house.”
Source: UNCTAD, based on information provided by Empretec and IICD.a The project is financed by the Government for Spain.

42 INFORMATION ECONOMY REPORT 2011
NOTES1 The fixed telephone price basket published by ITU is based on the monthly line rental plus 15 peak and 15 off-peak three-
minute local calls. It does not include calls to mobile phones, which are much more expensive than local calls to fixed lines.
See “ICT services getting more affordable worldwide”, Press Release. 16 May 2011, http://www.itu.int/net/pressoffice/
press_releases/2011/15.aspx.
2 In some countries, operators have waived this additional fee and bundle the telephone line with a broadband DSL
subscription or so-called “naked DSL”. This can be particularly relevant for SMEs in developing countries where fixed
broadband tends to be expensive and the additional cost of paying for the telephone lines can make or break the decision
to have broadband.
3 While these penetration rates are based on subscription data and therefore do not necessarily reflect actual mobile owner-
ship, the data indicate growth of the sector in general terms.
4 A survey of small businesses in the United States confirms that use of mobile applications is also of high relevance in developed
markets. Nearly three quarters of the enterprises surveyed were using mobile applications in their businesses. Their primary
reasons were to save time, increase productivity and reduce costs. See “AT&T Survey Shows Mobile Apps Integral to Small
Business Operations, Remote Workers on the Rise, Facebook Use Growing Rapidly”, AT&T Press Release, 15 March 2011,
available at http://www.att.com/gen/press-room?pid=19326&cdvn=news&newsarticleid=31689&mapcode=enterprise.
5 Almost half of the SMEs in the United Kingdom have already adopted smartphones because of their ease of use,
decreasing costs and increase in power. Barclays Plc. “Mobile businesses rush to embrace smartphones.” Press Release,
3 September 2010. http://www.newsroom.barclays.com/content/Detail.aspx?ReleaseID=1807&NewsAreaID=2.
6 “Africa’s Mobile Money Pricing Systems Need Fixing”. The East African, 21 March 2011. http://allafrica.com/
stories/201103211297.html.
7 Entrepreneurs in Uganda have been found to benefit by saving on transport costs and time waiting in banks. “MTN
MobileMoney and Zain Zap boosting SMEs In Uganda”. Mobile Money Africa, 13 August 2009. http://mobilemoneyafrica.
com/?p=427.
8 Information by MNOs and confirmed by discussions with Central Bank representatives during field trips in June 2011.
9 See http://kilimosalama.wordpress.com/.
10 See the Information Economy Report 2010 (UNCTAD, 2010) for an extensive review of ICT service affordability issues and
methodologies.
11 See “Newly released data from ITU’s ICT Price Basket (IPB) show that ICT services are getting more affordable worldwide”
at: http://www.itu.int/ITU-D/ict/ipb/index.html.
12 Information provided by Nokia from its Total Cost of Ownership study 2011.
13 “Global average retail prices for 70 per cent of mobile phones to fall under USD 100 by 2015”. Press Release, 1 March
2011. http://www.evalueserve.com/EVSRecentPressReleases/tabid/181/Default.aspx.
14 For this and all other indicators, there are issues of comparability due to the use of different methodology and different
population or sample characteristics. For example, micro-enterprises in Senegal appear to have a higher level of computer
use than the average, even for developed economies. This is partly explained by the fact that the Senegalese survey cov-
ered only the formal sector, while most micro-enterprises are in the informal sector (Granström, 2009). Considering that
household PC penetration in Senegal was merely 5.7 per cent in 2010 (ITU data), there is a distorted image of the actual
adoption of computers by the business sector as a whole (including informal enterprises).
15 As reflected by data on computer use disaggregated by industrial classification ISIC rev. 3.1.
16 Based on the percentage reported for each country times the total population. This may cause some overestimation for
countries in which the reported share refers to specific age groups and not the entire population.
17 UNCTAD estimation based on Gartner shipment data and assuming PCs are replaced every five years. “Gartner Says
Worldwide PC Shipments in Fourth Quarter of 2010 Grew 3.1 Percent; Year-End Shipments Increased 13.8 Percent.”
Press Release, January 12, 2011. http://www.gartner.com/it/page.jsp?id=1519417.
18 “Gartner Says Worldwide Mobile Device Sales to End Users Reached 1.6 Billion Units in 2010; Smartphone Sales Grew
72 Percent in 2010.” Press Release, 9 February 2011. http://www.gartner.com/it/page.jsp?id=1543014.
19 Ibid.
20 China Internet Network Information Center. July 2010. Statistical Report on Internet Development in China. http://www.
cnnic.net.cn/en/index/index.htm.

43CHAPTER I : PRIVATE SECTOR DEVELOPMENT AND THE ROLE OF ICTs
21 Telecom Regulatory Authority of India. 2011. The Indian Telecom Services Performance Indicators, July – September
2010. http://www.trai.gov.in/reports_list_year.asp.
22 Ministerio de Tecnologías de la Información y las Comunicaciones. August 2010. Informe Trimestral de Conectividad –
Marzo 2010. http://www.mintic.gov.co/.
23 Communications Commission of Kenya. 2011. Quarterly Sector Statistics Report. http://www.cck.go.ke/.
24 Opera. January 2011. State of the Mobile Web. http://www.opera.com/smw/2011/01/.
25 Ledgard, J. M. “Digital Africa.” Intelligent Life. Spring 2011. http://moreintelligentlife.com/content/ideas/jm-ledgard/digital-africa.
26 A number of central and southern European economies are also included in the top 20 list, closing the gap on more de-
veloped countries in the region.
27 See “Mobile Broadband Success Story, Challenges and Opportunities”, http://www.gsmamobilebroadband.com/upload/
resources/files/GSMA%20-%20SMC%20Tunisia%208Nov2010%20MBB.pdf.
28 See http://www.itu.int/ITU-D/ict/statistics/at_glance/KeyTelecom2010.html.
29 See ABI Research. “Two Billion Covered by 3G and 4G Data Services.” Press Release, 29 November 2010. http://www.
abiresearch.com/press/3562-Two+Billion+Covered+by+3G+and+4G+Data+Services.
30 See “Ericsson teams up with Akamai to speed up mobile internet”, Reuters, 14 February 2011, http://uk.reuters.com/
article/2011/02/14/mobile-fair-ericsson-idUKLDE71D0C620110214.
31 The TEAMs, Seacom, EASSy, MainOne and Glo1 undersea fibre-optic cables are in commercial deployment and WACS
and ACE are scheduled for launch. See “African Undersea Cables” at http://manypossibilities.net/african-undersea-
cables/.
32 In East Africa, mobile data prices have fallen sharply since the introduction of new fibre-optic submarine cables.
Prepaid data plans are available for as little as $0.08 per 1 Mb, enough for daily e-mail checking. See http://whiteafrican.
com/2010/10/28/snapshot-mobile-data-costs-in-east-africa/.
33 The sectors with the most available data on Internet use are: manufacturing; construction; wholesale and retail trade;
hotels and restaurants; transport, storage and communications; financial intermediation; real estate, renting and business
activities; and other community, social and personal service activities (annex table II.5).
34 For example, data from European countries show that the presence of automated supply chain management systems
increases with enterprise size (Eurostat, 2010).
35 For example, crisis-response websites following the recent economic crisis (UNDESA, 2010).
36 In European countries, 60 per cent of enterprises download government forms, and 50 per cent fill them in and return
them electronically (Eurostat, 2010).
37 See “Dimensions and characteristics of the Brazilian Web, a study by the gov.br”, at http://www.cgi.br/publicacoes/
pesquisas/govbr/cgibr-nicbr-censoweb-govbr-2010-en.pdf.
38 Among countries that report data on mobile broadband, it is still significantly behind fixed broadband use among enterprises.
For example, in Senegal and Singapore, less than 10 per cent of enterprises reported using mobile broadband to access the
Internet, compared with 82 per cent (Senegal) and 60 per cent (Singapore) using fixed broadband (annex table II.6).
39 Other compelling reasons to use VoIP include the possibility to chat, do videoconferencing and send files.
40 “More Than One in Five Consumer Broadband Lines Now Come with VOIP.” Press Release, 19 October 2010.
http://point-topic.com/press.php.
41 Information provided by Voice on the Net Coalition, June 2011.
42 See Web 2.0 at http://en.wikipedia.org/wiki/Web_2.0.
43 Sid Murlidhar. “Fast and Free Facebook Mobile Access with 0.facebook.com.” The Facebook Blog. 18 May 2010.
http://www.facebook.com/blog.php?post=391295167130.
44 “Just the Facts: Statistics from Twitter Chirp.” ReadWriteWeb, 14 April 2010, see http://www.readwriteweb.com/archives/
just_the_facts_statistics_from_twitter_chirp.php.
45 A “tweet” is 140 characters (compared to 160 characters for an SMS).
46 comScore. “Indonesia, Brazil and Venezuela Lead Global Surge in Twitter Usage.” Press Release. August 11, 2010.
http://www.comscore.com/Press_Events/Press_Releases/2010/8/Indonesia_Brazil_and_Venezuela_Lead_Global_
Surge_in_Twitter_Usage.

44 INFORMATION ECONOMY REPORT 2011
47 http://www.facebook.com/press/info.php?statistics.
48 “Facebook becomes the new company website.” Financial Times, 31 March 2011. http://www.ft.com/cms/s/0/240f19d4-5afc-11e0-a290-00144feab49a.html#axzz1IOOh6o5G.
49 “World Map of Social Networks.” Vincos Blog. http://www.vincos.it/world-map-of-social-networks/.
50 Although entry-level prices may seem high, it is a better value since users are getting more bandwidth. A related issue is that there can be significant variation between the “advertised” and the actual speed. In some developing countries entry-level packages are even below 256 Kbps and the main criteria for broadband is that the connection is “always on”. Upload speeds also vary.
51 See “Newly released data from ITU’s ICT Price Basket (IPB) show that ICT services are getting more affordable worldwide” at: http://www.itu.int/ITU-D/ict/ipb/index.html.
52 Point Topic. “Consumers now pay 50 per cent less for bandwidth than in 2008.” Press Release, 1 February 2011.http://point-topic.com/press.php.
53 See also UNECLAC (2010).
54 An analysis of ICT-related projects implemented by the International Institute for Communication and Development (IICD) noted that, in rural areas, a lack of electricity and ICT connectivity as well as high levels of illiteracy acted as a key constraint on the use of both Internet and mobile-based services. Inhibitive costs associated with SMS-based information services also limited large-scale use of mobile services. Information provided by IICD.
55 UNDP-APDIP e-Primer “e-Commerce and e-Business, 2003,” http://www.apdip.net/publications/iespprimers/eprimer-ecom.pdf and http://en.wikibooks.org/wiki/E-Commerce_and_E-Business.
56 See e.g. http://measuring-ict.unctad.org.
57 See http://www.pikom.org.my/cms/General.asp?whichfile=Press+Releases&ProductID=22708&CatID=33.
58 Information provided by the research team of Professor You Jianxin, Tongji University.
59 For consumer protection in online and mobile payments, see OECD (2010).
60 For more information, see e.g. UNCTAD (2006a: chapter 8), UNCTAD (2005a: chapter 6).
61 Relevant UNCITRAL texts included the Electronic Communications Convention (2005); the UNCITRAL Model Law on Electronic Signatures (2001) and the UNCITRAL Model Law on Electronic Commerce (1996). See: http://www.uncitral.org/uncitral/en/uncitral_texts/electronic_commerce.html.
62 See UNCTAD comparative studies on cyberlaw in Latin America (UNCTAD, 2009b) and Central America (UNCTAD, 2009c).
A dynamic ICT sector contributes to making the private sector more
productive and competitive. It creates new jobs, spurs innovation,
and – not least – supports sustained use of ICTs throughout the en-
tire economy. Recent studies confirm that even in low-income coun-
tries, a thriving ICT sector can make a major contribution to economic
growth. Kenya is interesting in this context. Its ICT sector has been
the main driver of economic growth over the past decade. Since 2000,
this sector has grown annually by more than 20 per cent, and it was
responsible for a staggering 24 per cent of Kenya’s GDP growth dur-
ing that period (World Bank, 2010b). Moreover, thanks to technologi-
cal change and the birth of new business models, many employment
opportunities are emerging in the ICT sector in low-income countries.
As part of their efforts to promote PSD, Governments and other actors
are increasingly considering how best to tap into these opportunities.
PROMOTINGPRIVATE ICT-SECTOR DEVELOPMENT 3

46 INFORMATION ECONOMY REPORT 2011
A. AN EVOLVING GLOBAL ICT SECTOR
From the perspective of supporting PSD, the competi-
tiveness of the ICT sector is relevant for several rea-
sons. Firstly, it is an important part of the economy in
many countries. Secondly, in a number of developing
countries, the ICT sector is characterized by relatively
high productivity and rapid growth. Thirdly, it is a sec-
tor that comprises a wide array of economic activities,
ranging from basic tasks that require little formal edu-
cation, to highly sophisticated functions such as soft-
ware development and chip design (box III.1). Depend-
ing on its characteristics and level of development, an
economy may be in a more or less favourable position
to develop the various sectoral activities. Fourthly, the
documented impact of ICT use on the productivity of
enterprises (chapter II) is another reason to facilitate a
stronger ICT sector. Without adequate ICT sales, re-
pair services, consultancy, and software development,
it is difficult for other businesses to properly integrate
ICTs into their operations.
UNCTAD annually collects two statistical indicators on
the ICT sector: the share of total business sector em-
ployment accounted for by the ICT sector (ICT-1), and
the share of the total business sector value added ac-
counted for by the ICT sector (ICT-2).1 While a grow-
ing number of countries collect and report such data,
more efforts are needed to further improve coverage
(UNCTAD, 2010). As at early 2011, the ICT-1 indica-
tor was reported by 54 economies (of which only 18
were developing economies), and the ICT-2 indicator
was available for 47 economies (of which only 13 were
developing economies).
The importance of the ICT sector in the national econ-
omy varies considerably across developing and transi-
tion economies (table III.1). In employment terms, the
ICT sector carries particular weight in countries with
a sizeable ICT manufacturing sector (e.g. Malaysia,
the Republic of Korea, and Singapore), as well as in
countries that are significant exporters of IT services
and ICT-enabled services (e.g. Egypt and Mauritius).
The ICT sector typically accounts for a larger share of
value added (ICT-2) than of employment, reflecting its
relatively high capital-intensity (UNCTAD, 2010).
Various recent studies suggest that the ICT sector
is playing a growing role in a number of developing
countries not captured in table III.1. As noted above,
Kenya’s ICT sector has experienced very high growth
in the past decade, outperforming every other sec-
Box III.1. What is included in the ICT sector?
The ICT sector encompasses the production of both goods and services. It includes – among other things – the manufac-
turing of goods such as computers, electronic components and telecommunications equipment. It also covers wholesale
and rental services related to ICT equipment, as well as telecommunications, IT consultancy services (e.g. software and
hardware, database), and other computer-related activities. The agreed definition only covers activities where production
of ICT products is the main activity; it excludes retail activities.
Some ICT-related activities do not fall within the definition of the ICT sector. This applies, for example, to various mo-
bile- and PC-related services provided by ICT micro-enterprises, such as retailing of mobile phones and accessories.
Furthermore, such activities often occur in the informal sector and are not properly captured in official statistics. Another
example is the ICT-enabled services that have emerged thanks to improved ICT connectivity, such as the business pro-
cess outsourcing (BPO) of accounting, human resources or payroll services.
According to the definition used in UNCTAD’s most recent collection of ICT statistics (based on ISIS Rev. 3.1, OECD,
2002),a the ICT sector comprises activities which result in products that “are primarily intended to fulfil the function of
information processing and communication by electronic means, including transmission and display, or must use elec-
tronic processing to detect, measure, and/or record physical phenomena or to control a physical process.” In the revised
definition for the ICT sector (based on ISIC Rev. 4, OECD, 2007),b the scope is limited to products that “are primarily
intended to fulfil the function of information processing and communication by electronic means, including transmission
and display.” The new definition is expected to be gradually applied when developing countries report data on the ICT
sector. See also UNCTAD (2010) for a further discussion on the definition of the ICT sector.
Source: UNCTAD.a OECD (2002). Reviewing the ICT sector definition: Issues for discussion. DSTI/ICCP/IIS(2002)2.b OECD (2007). Information economy – Sector definitions based on the International Standard
Industry Classification (ISIC Rev. 4). DSTI/ICCP/IIS(2006)2.
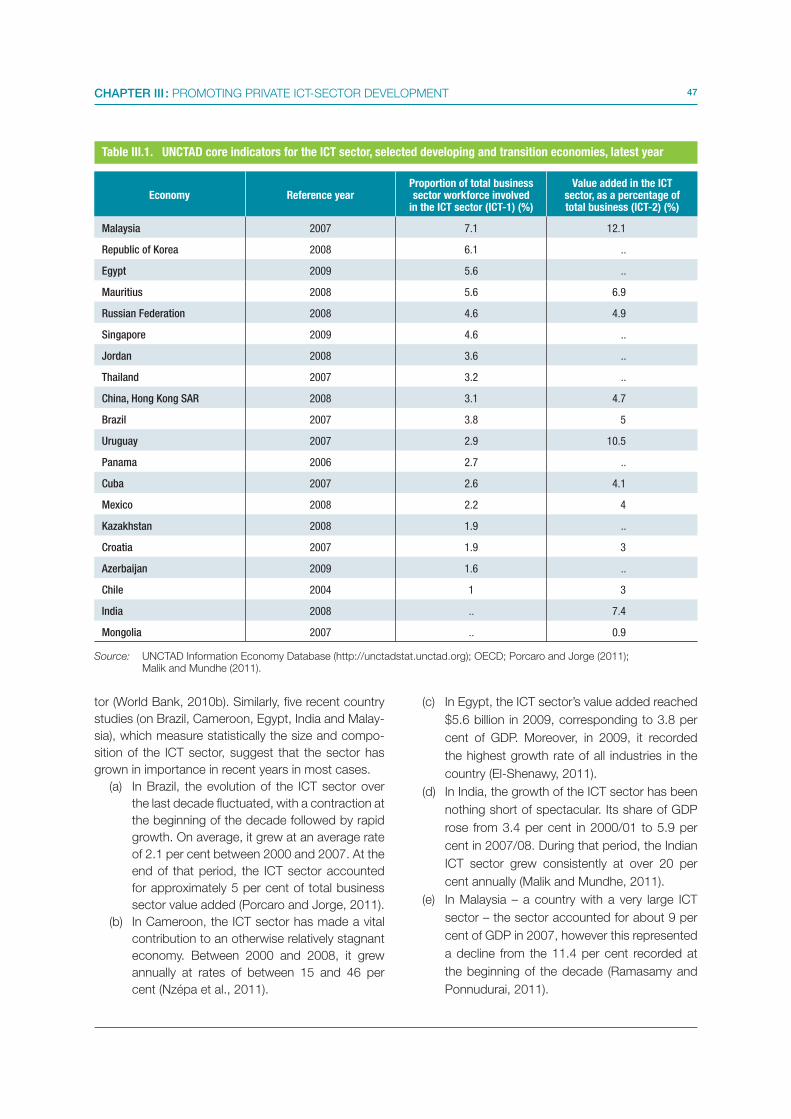
47CHAPTER III : PROMOTING PRIVATE ICT-SECTOR DEVELOPMENT
tor (World Bank, 2010b). Similarly, five recent country
studies (on Brazil, Cameroon, Egypt, India and Malay-
sia), which measure statistically the size and compo-
sition of the ICT sector, suggest that the sector has
grown in importance in recent years in most cases.
(a) In Brazil, the evolution of the ICT sector over
the last decade fluctuated, with a contraction at
the beginning of the decade followed by rapid
growth. On average, it grew at an average rate
of 2.1 per cent between 2000 and 2007. At the
end of that period, the ICT sector accounted
for approximately 5 per cent of total business
sector value added (Porcaro and Jorge, 2011).
(b) In Cameroon, the ICT sector has made a vital
contribution to an otherwise relatively stagnant
economy. Between 2000 and 2008, it grew
annually at rates of between 15 and 46 per
cent (Nzépa et al., 2011).
(c) In Egypt, the ICT sector’s value added reached
$5.6 billion in 2009, corresponding to 3.8 per
cent of GDP. Moreover, in 2009, it recorded
the highest growth rate of all industries in the
country (El-Shenawy, 2011).
(d) In India, the growth of the ICT sector has been
nothing short of spectacular. Its share of GDP
rose from 3.4 per cent in 2000/01 to 5.9 per
cent in 2007/08. During that period, the Indian
ICT sector grew consistently at over 20 per
cent annually (Malik and Mundhe, 2011).
(e) In Malaysia – a country with a very large ICT
sector – the sector accounted for about 9 per
cent of GDP in 2007, however this represented
a decline from the 11.4 per cent recorded at
the beginning of the decade (Ramasamy and
Ponnudurai, 2011).
Table III.1. UNCTAD core indicators for the ICT sector, selected developing and transition economies, latest year
Source: UNCTAD Information Economy Database (http://unctadstat.unctad.org); OECD; Porcaro and Jorge (2011); Malik and Mundhe (2011).
Economy Reference yearProportion of total business sector workforce involved
in the ICT sector (ICT-1) (%)
Value added in the ICT sector, as a percentage of total business (ICT-2) (%)
Malaysia 2007 7.1 12.1
Republic of Korea 2008 6.1 ..
Egypt 2009 5.6 ..
Mauritius 2008 5.6 6.9
Russian Federation 2008 4.6 4.9
Singapore 2009 4.6 ..
Jordan 2008 3.6 ..
Thailand 2007 3.2 ..
China, Hong Kong SAR 2008 3.1 4.7
Brazil 2007 3.8 5
Uruguay 2007 2.9 10.5
Panama 2006 2.7 ..
Cuba 2007 2.6 4.1
Mexico 2008 2.2 4
Kazakhstan 2008 1.9 ..
Croatia 2007 1.9 3
Azerbaijan 2009 1.6 ..
Chile 2004 1 3
India 2008 .. 7.4
Mongolia 2007 .. 0.9

48 INFORMATION ECONOMY REPORT 2011
Traditionally, the ICT sector has been dominated by
large public corporations or transnational corporations
(TNCs). Previously, the need for upfront capital meant
that progress in the ICT market was driven by larger
firms. Indeed, most of the related business technol-
ogy services such as data storage, cloud computing
and software development are dominated by large
entities. However, there are also important roles for
smaller businesses. Many new job opportunities have
emerged among ICT MSEs (UNCTAD, 2010).
Millions of people in developing countries have found
new income-generating opportunities in the ICT sec-
tor – in formal or informal enterprises. For example,
while some 60,000 people are employed in the formal
ICT sector in Cameroon, it is estimated that another
200,000 are working in the informal ICT sector (Nzépa
et al., 2011). In Egypt, the ICT sector, and enterprises
in ICT-enabled services, together employed approxi-
mately 182,000 people in 2009 (El-Shenawy, 2011),
while in India, formal ICT-sector employment stood
at some 2.5 million in 2004/05 (Malik and Mundhe,
2011). Despite a decline since 2000, formal ICT-sector
employment in Malaysia was about 479,000 in 2007
(Ramasamy and Ponnudurai, 2011). In Brazil, in 2006,
approximately 1 million people, or 3.8 per cent of the
business-sector workforce, were employed in the ICT
sector – about 80 per cent of which were in the formal
sector and 20 per cent in the informal sector (Porcaro
and Jorge, 2011).
Jobs in the ICT sector have proved to be more pro-
ductive than in other sectors. Among the OECD coun-
tries, labour productivity growth rates during the pe-
riod 1995–2008 were, with few exceptions, generally
higher in the ICT sector than for all industries.2 The
data reported in table III.1 confirm that the ICT sec-
tor’s share is typically higher in value added than in
employment terms, suggesting relatively high labour
productivity in developing economies too. Moreover,
ICT-sector employees tend to have an above-average
level of education, and to be younger than the em-
ployees in other sectors. Furthermore, jobs in the ICT
sector are often perceived as desirable, because of
upward mobility, job security, and the availability of
training opportunities.3
Although the economic role of the ICT sector is ex-
panding in a number of developing economies, the
underlying factors for this trend differ, reflecting the
varying composition of the sector across countries
(fig. III.1). In order to understand the scope for PSD
opportunities in the ICT sector, it is important to look
into trends and developments at disaggregated levels.
0 20 40 60 80 100
Malaysia (2007)
Croatia (2007)
Mexico (2008)
Russian Federation (2008)
Brazil (2007)
Uruguay (2007)
Mongolia (2007)
Cuba (2007)
Mauritius (2008)
Chile (2004)
Kazakhstan (2006)
Azerbaijan (2006)
Manufacturing
Wholesale and renting
Telecommunications
Computer andrelated activities
n.a.
Percentage
Figure III.1. Value added of the ICT sector, by main components, selected economies, latest year (as a percentage)
Source: UNCTAD Information Economy database at http://unctadstat.unctad.org, and Porcaro and Jorge (2011).

49CHAPTER III : PROMOTING PRIVATE ICT-SECTOR DEVELOPMENT
B. PSD OPPORTUNITIES IN ICT AND ICT-ENABLED SERVICES
ICT services and ICT-enabled services offer growing
PSD opportunities. Not only do they provide business
and employment opportunities in their own right, but
they are also essential for diffusing ICT use throughout
the economy, and facilitating the adoption, adaptation
and maintenance of ICTs by local companies – thereby
contributing to their productivity and competitiveness.
The availability of relevant skills locally is therefore
important. ICT services encompass telecommunica-
tions, activities related to commerce (e.g. wholesale,
renting) and computer-related services (box III.1).
Services enabled by improved ICT connectivity are
also relevant to consider, including those related to
business process outsourcing (BPO) and knowledge
process outsourcing (KPO). While export-oriented ac-
tivities in this area remain relatively concentrated geo-
graphically, new opportunities to tap into this market
are emerging, including for low-income countries.
1. TelecommunicationsThe telecommunications sector is large and vibrant,
and accounts for a significant proportion of the econ-
omy in most countries. Worldwide telecom revenues
were $1,381 billion in 2009.4 The sector was impacted
by the global financial crisis, but nonetheless man-
aged to register positive growth (table III.2).
As indicated in figure III.1, telecommunications ser-
vices account for a significant share of ICT sector
value added in many developing countries. They con-
stitute a basic infrastructure, and are important even
if other parts of the ICT sector are relatively modestly
developed. The relative importance of this subsector
is most pronounced in countries in which the ICT sec-
tor is relatively small (UNCTAD, 2010). For most low-
income countries, telecommunications services offer
the greatest opportunities for employment creation
within the ICT sector – in both formal and informal
enterprises. In Cameroon and Kenya, for example,
this subsector dominates the ICT sector (World Bank,
2010b; Nzépa et al., 2011). In Egypt, telecommuni-
cations account for 70 per cent of total sector rev-
enues, most of which were related to the mobile sec-
tor (El-Shenawy, 2011). In Brazil, telecommunications
account for almost half of all ICT-sector value added
(Porcaro and Jorge, 2011).
a. Private-sector investment
in telecommunications
Since liberalization and the removal of barriers to for-
eign market entry began, the private sector has been
the driving force in the development of ICT infrastruc-
ture, with tangible results. Arguably, no other infra-
structure area has evolved as positively in low-income
countries. Between 1990 and 2009, more countries
reported private participation in telecommunications
projects than in any other infrastructure sector, and
the investment value was the highest in telecoms, too
(table III.3). The private sector has been especially
important in rolling out mobile telecommunications
– the predominant ICT technology used by MSEs in
developing countries. During the same period, out of
some 800 telecom projects with private-sector par-
ticipation in developing countries, almost three quar-
ters involved greenfield operations primarily in mobile
telephony.5 As indicated in figure III.2, all parts of the
developing world have been affected by the invest-
ment surge since 2003. For example, between 2003
and 2009, sub-Saharan Africa saw projects with pri-
2006 2007 2008 2009a 2010a
Fixed telephony 403.7 392.1 375.3 348.6 326.0
Mobile services 604.7 670.9 714.3 738.7 775.8
Data and Internet 214.2 232.4 250.7 262.8 279.6
Total 1 222.7 1 295.3 1 340.3 1 350.2 1 381.3
Annual growth rate 5.5% 5.9% 3.5% 0.7% 2.3%
Table III.2. Global telecommunications services market, 2006–2010 (billions of dollars)
a Forecast. Source: IDATE (2010). World Telecom Services Market 2010: Global market worth 1,348.9 billion USD in 2009. 25 August. http://blog.idate.fr/?p=133.

50 INFORMATION ECONOMY REPORT 2011
vate participation worth more than $50 billion, and the
corresponding value in South Asia was $68 billion.
Despite the improvements, the remaining weaknesses
are among the most important economic issues hold-
ing back Africa’s development (box I.3).
In 2009, 241 infrastructure projects with private par-
ticipation reached financial or contractual closing in
42 low- and middle-income countries. These projects
involved a total investment of $153 billion – a drop of
7 per cent from the levels reported in 2008. In tele-
communications, investment fell by 23 per cent to
$61 billion, driven by the slowdown in network expan-
sion across most regions. This was the first time since
2003 that investment in telecommunications had de-
clined (fig. III.2). In the coming few years, the need to
roll out fixed and mobile broadband is expected to
sustain investments in telecommunications networks.6
Telecommunications Energy Transport Water and sewage
Number of economies with private participation 133 107 82 61
Investment in projects (millions of dollars) 719 645 481 695 253 197 60 280
Table III.3. Infrastructure participation in developing regions, 1990–2009 (number of economies; millions of dollars)
Source: World Bank. Private Participation in Infrastructure Projects database.
Source: World Bank and Public–Private Infrastructure Advisory Facility (2011). Private Participation in Infrastructure Projects database. 4 March. http://ppi.worldbank.org.Note: Data include projects in low- and middle-income countries. Projects include management or lease contracts, concessions, greenfield projects, and divestitures.
0
10,000
20,000
30,000
40,000
50,000
60,000
70,000
80,000
90,000
1990 1991 1992 1993 1994 1995 1996 1997 1998 1999 2000 2001 2002 2003 2004 2005 2006 2007 2008 2009
Mill
ion
s of
dol
lars
East Asia and the Pacific Europe and Central Asia
Latin America and the Caribbean Middle East and North Africa
South Asia Sub-Saharan Africa
Figure III.2. Investment value of telecommunications infrastructure projects with private participation, by region, 1990–2009 (millions of dollars)
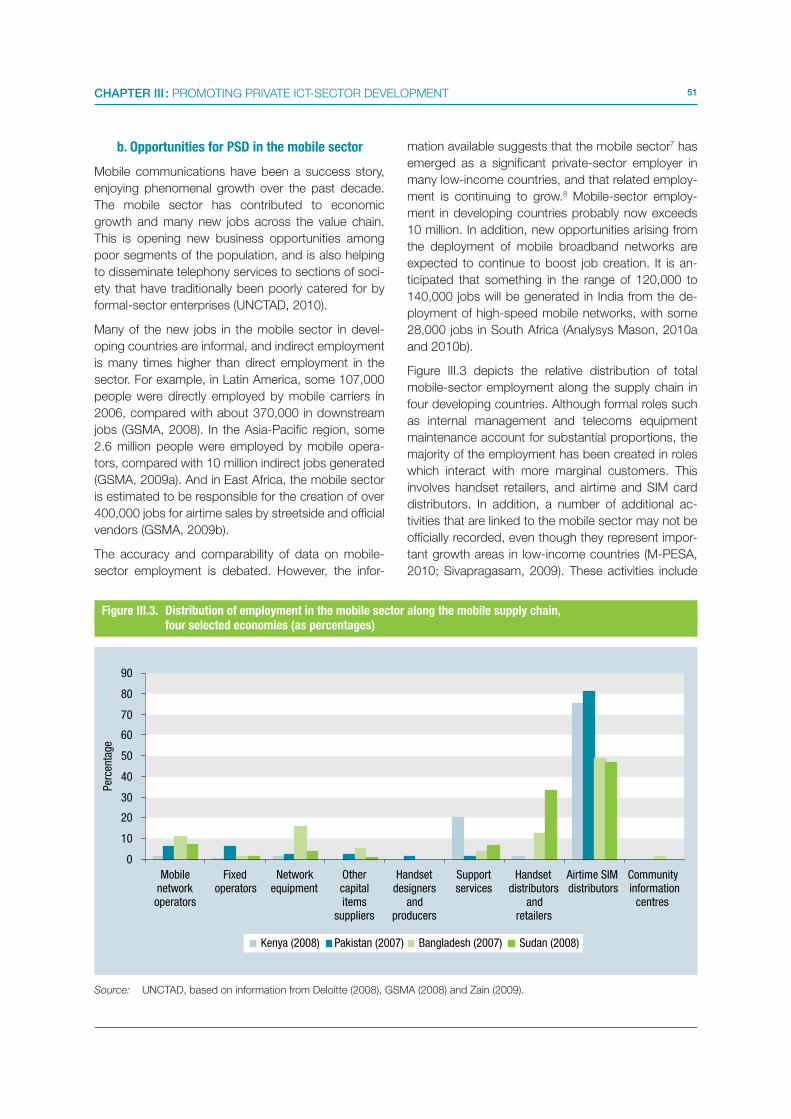
51CHAPTER III : PROMOTING PRIVATE ICT-SECTOR DEVELOPMENT
b. Opportunities for PSD in the mobile sector
Mobile communications have been a success story,
enjoying phenomenal growth over the past decade.
The mobile sector has contributed to economic
growth and many new jobs across the value chain.
This is opening new business opportunities among
poor segments of the population, and is also helping
to disseminate telephony services to sections of soci-
ety that have traditionally been poorly catered for by
formal-sector enterprises (UNCTAD, 2010).
Many of the new jobs in the mobile sector in devel-
oping countries are informal, and indirect employment
is many times higher than direct employment in the
sector. For example, in Latin America, some 107,000
people were directly employed by mobile carriers in
2006, compared with about 370,000 in downstream
jobs (GSMA, 2008). In the Asia-Pacific region, some
2.6 million people were employed by mobile opera-
tors, compared with 10 million indirect jobs generated
(GSMA, 2009a). And in East Africa, the mobile sector
is estimated to be responsible for the creation of over
400,000 jobs for airtime sales by streetside and official
vendors (GSMA, 2009b).
The accuracy and comparability of data on mobile-
sector employment is debated. However, the infor-
mation available suggests that the mobile sector7 has
emerged as a significant private-sector employer in
many low-income countries, and that related employ-
ment is continuing to grow.8 Mobile-sector employ-
ment in developing countries probably now exceeds
10 million. In addition, new opportunities arising from
the deployment of mobile broadband networks are
expected to continue to boost job creation. It is an-
ticipated that something in the range of 120,000 to
140,000 jobs will be generated in India from the de-
ployment of high-speed mobile networks, with some
28,000 jobs in South Africa (Analysys Mason, 2010a
and 2010b).
Figure III.3 depicts the relative distribution of total
mobile-sector employment along the supply chain in
four developing countries. Although formal roles such
as internal management and telecoms equipment
maintenance account for substantial proportions, the
majority of the employment has been created in roles
which interact with more marginal customers. This
involves handset retailers, and airtime and SIM card
distributors. In addition, a number of additional ac-
tivities that are linked to the mobile sector may not be
officially recorded, even though they represent impor-
tant growth areas in low-income countries (M-PESA,
2010; Sivapragasam, 2009). These activities include
Source: UNCTAD, based on information from Deloitte (2008), GSMA (2008) and Zain (2009).
Figure III.3. Distribution of employment in the mobile sector along the mobile supply chain, four selected economies (as percentages)
0
10
20
30
40
50
60
70
80
90
Mobilenetworkoperators
Fixedoperators
Networkequipment
Othercapitalitems
suppliers
Handsetdesigners
andproducers
Supportservices
Handsetdistributors
andretailers
Airtime SIMdistributors
Communityinformation
centres
Per
cent
age
Kenya (2008) Pakistan (2007) Bangladesh (2007) Sudan (2008)

52 INFORMATION ECONOMY REPORT 2011
mobile money retailing, selling second-hand phones,
and repairing mobile phones, as well as the activities
of payphone operators and people selling mobile top-
ups. Thus, not only does the mobile sector employ
millions of people in the developing world, but the ma-
jority of the jobs engage people who are in marginal
positions, or who interact with people in marginal po-
sitions, close to poverty.
Surveys of the informal ICT sector in Burkina Faso and
Senegal confirm the prominent role of the informal
sector in mobile-sector employment (85 per cent in
Burkina Faso and 75 per cent in Senegal) (Bayala et
al., 2010; Ndiaye et al., 2009).9 In Senegal, there is a
large discrepancy between urban and rural areas in
terms of access to telecommunications, making the
role of the informal sector in providing services par-
ticularly important. At the same time, many of those
working in the informal mobile sector need to leverage
other income-generating activities as well (UNCTAD,
2010). A minority of the micro-entrepreneurs surveyed
reported increases in their profit margins in the 12
months before the surveys were carried out (25 per
cent in Burkina Faso and 34 per cent in Senegal). In
both countries, entrepreneurs faced difficulties in ex-
panding their businesses due to intense levels of com-
petition and limited purchasing power among clients
(Yam Pukri, 2010). Generally, entrepreneurs based in
rural areas experienced more volatility in their busi-
nesses than entrepreneurs in urban areas.
The activity of informal-sector mobile entrepreneurs is
having a positive impact on other private enterprises,
not least in the informal sector. Mobile-sector micro-
enterprises are often in a better position to understand
the needs of other informal-sector entrepreneurs, and
Box III.2. The emerging mobile ecosystem in Kenya
Partly thanks to a buoyant ICT sector, Kenya’s GDP growth during the past decade surpassed its population growth.
The Kenyan ICT sector has flourished since the liberalization of the telecommunications sector, providing economic op-
portunities for large and small business alike, both in the formal and informal sectors. The introduction of competition
and the increase in the volume of traffic enabled costs to fall from $0.20 per minute to $0.04 per minute between 2002
and 2010. With a 23 per cent average annual growth rate since 2000, the ICT sector has outperformed the rest of the
economy by far.
This success has also spurred innovations and employment opportunities related to ICT use – particularly mobile phones.
Foreign and local enterprises in Kenya are today spearheading the development of new applications in areas such as
mobile money and mobile insurance and are thereby providing services that are essential to PSD, in view of the fact that
large parts of the population are unbanked and uninsured. Kenya is quickly becoming a global leader in financial and
payment-technology innovation. Since the launch of Safaricom M-PESA in 2007, countless players have entered the
market to extend efficient payment services throughout the country. The list of companies that either provide services to
mobile money systems in Kenya, or build on the existing services, is long, diverse, and continuously evolving (box III.2.1).
Source: UNCTAD, based on World Bank (2010b) and interviews.
Type of activity Enterprises
Mobile money platform Airtel (formerly Zain), Essar Telecom (Yu Cash), MobiKash, MobiPay, Safaricom (M-PESA)Tangaza Limited, Orange Telecom (Orange Money)
M-money integration platform Cellulant, CoreTEC, Craft Silicon, Intrepid Data Systems, Kopo Kopo, Tangazoetu LimitedThe Software Group, Zege Technologies, Web Tribe Limited
M-money e-commerce processing ePay Kenya, PesaPal, Symbiotic Media Consortium, Tristar
Management Information System integrated with mobile money
Flexus Technologies
International remittances via local mobile money channel
Beyonic, Western Union/Safaricom
ATM infrastructure integrated with mobile money
Paynet Group, KCB Kenya, Equity Bank
Box table III.2.1. The mobile money ecosystem in Kenya
Source: UNCTAD. Based on information provided by Kopo Kopo, March 2011.
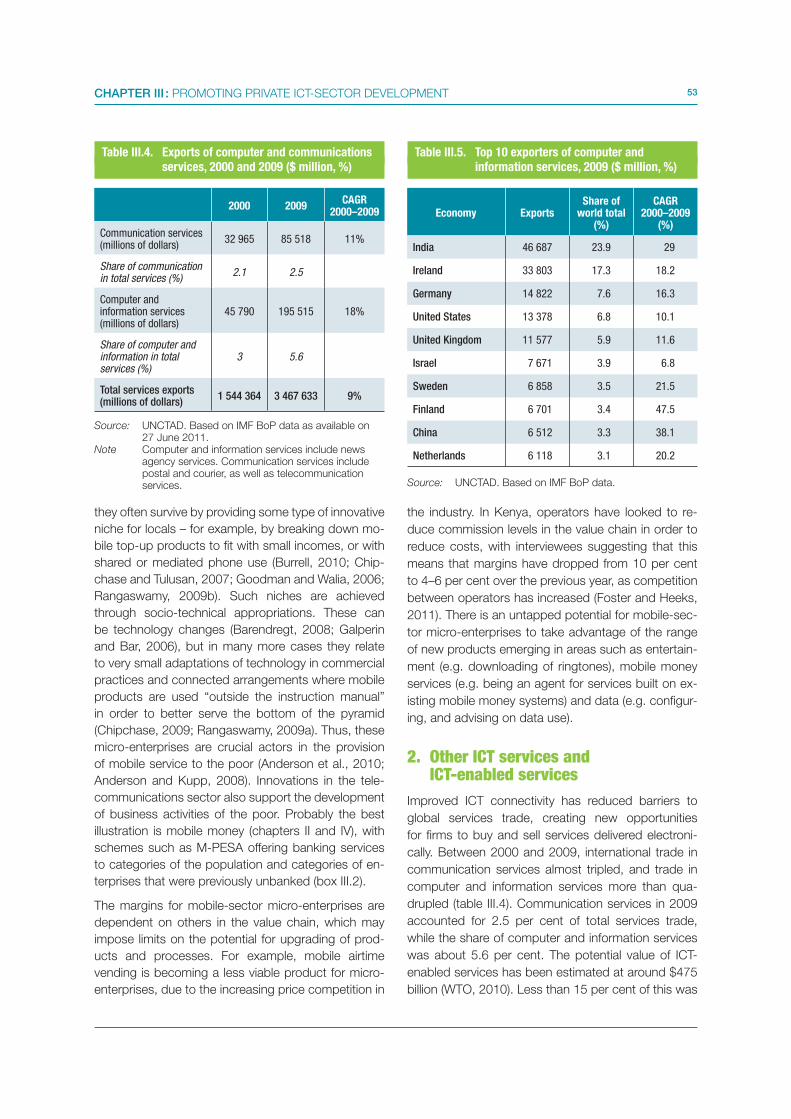
53CHAPTER III : PROMOTING PRIVATE ICT-SECTOR DEVELOPMENT
they often survive by providing some type of innovative
niche for locals – for example, by breaking down mo-
bile top-up products to fit with small incomes, or with
shared or mediated phone use (Burrell, 2010; Chip-
chase and Tulusan, 2007; Goodman and Walia, 2006;
Rangaswamy, 2009b). Such niches are achieved
through socio-technical appropriations. These can
be technology changes (Barendregt, 2008; Galperin
and Bar, 2006), but in many more cases they relate
to very small adaptations of technology in commercial
practices and connected arrangements where mobile
products are used “outside the instruction manual”
in order to better serve the bottom of the pyramid
(Chipchase, 2009; Rangaswamy, 2009a). Thus, these
micro-enterprises are crucial actors in the provision
of mobile service to the poor (Anderson et al., 2010;
Anderson and Kupp, 2008). Innovations in the tele-
communications sector also support the development
of business activities of the poor. Probably the best
illustration is mobile money (chapters II and IV), with
schemes such as M-PESA offering banking services
to categories of the population and categories of en-
terprises that were previously unbanked (box III.2).
The margins for mobile-sector micro-enterprises are
dependent on others in the value chain, which may
impose limits on the potential for upgrading of prod-
ucts and processes. For example, mobile airtime
vending is becoming a less viable product for micro-
enterprises, due to the increasing price competition in
the industry. In Kenya, operators have looked to re-
duce commission levels in the value chain in order to
reduce costs, with interviewees suggesting that this
means that margins have dropped from 10 per cent
to 4–6 per cent over the previous year, as competition
between operators has increased (Foster and Heeks,
2011). There is an untapped potential for mobile-sec-
tor micro-enterprises to take advantage of the range
of new products emerging in areas such as entertain-
ment (e.g. downloading of ringtones), mobile money
services (e.g. being an agent for services built on ex-
isting mobile money systems) and data (e.g. configur-
ing, and advising on data use).
2. Other ICT services and ICT-enabled services
Improved ICT connectivity has reduced barriers to
global services trade, creating new opportunities
for firms to buy and sell services delivered electroni-
cally. Between 2000 and 2009, international trade in
communication services almost tripled, and trade in
computer and information services more than qua-
drupled (table III.4). Communication services in 2009
accounted for 2.5 per cent of total services trade,
while the share of computer and information services
was about 5.6 per cent. The potential value of ICT-
enabled services has been estimated at around $475
billion (WTO, 2010). Less than 15 per cent of this was
Table III.5. Top 10 exporters of computer and information services, 2009 ($ million, %)
Source: UNCTAD. Based on IMF BoP data.
Economy ExportsShare of
world total (%)
CAGR 2000–2009
(%)
India 46 687 23.9 29
Ireland 33 803 17.3 18.2
Germany 14 822 7.6 16.3
United States 13 378 6.8 10.1
United Kingdom 11 577 5.9 11.6
Israel 7 671 3.9 6.8
Sweden 6 858 3.5 21.5
Finland 6 701 3.4 47.5
China 6 512 3.3 38.1
Netherlands 6 118 3.1 20.2
Table III.4. Exports of computer and communications services, 2000 and 2009 ($ million, %)
Source: UNCTAD. Based on IMF BoP data as available on 27 June 2011.
Note Computer and information services include news agency services. Communication services include postal and courier, as well as telecommunication
services.
2000 2009CAGR
2000–2009
Communication services (millions of dollars)
32 965 85 518 11%
Share of communication in total services (%) 2.1 2.5
Computer and information services (millions of dollars)
45 790 195 515 18%
Share of computer and information in total services (%)
3 5.6
Total services exports (millions of dollars)
1 544 364 3 467 633 9%

54 INFORMATION ECONOMY REPORT 2011
captured in 2007, indicating huge potential. According
to WTO, computer and information services exports
amounted to $185 billion in 2009 (WTO, 2010).
At the world level, India in 2009 led exports of comput-
er and information services, with almost a quarter of
the world total (table III.5). China was the ninth-largest
exporter, with over $6.5 billion in that year. The other
major exporters of computer services have mainly
been developed countries. Developing and transition
economies with significant exports include Malaysia
($1.4 billion), Singapore ($1.3 billion), the Russian
Federation ($1.3 billion), the Philippines ($1.3 billion)
and Argentina ($1 billion). In terms of growth between
2000 and 2009, exports of such services were par-
ticularly dynamic in some transition economies. For
example, especially high annual growth rates were
noted for Ukraine (57 per cent), the Republic of Mol-
dova (55 per cent), Belarus (49 per cent) and the Rus-
sian Federation (41 per cent). Among LDCs, Uganda
significantly increased its exports of computer and
information services, albeit from a low level (reach-
ing $36 million in 2009). Other developing countries
that achieved significant forays into the computer and
information services export markets between 2000
and 2009 include Costa Rica ($771 million), Morocco
($248 million), South Africa ($245 million), Sri Lanka
($245 million), Pakistan ($182 million), Uruguay ($180
million) and Egypt ($171 million).
New business models for international outsourcing
are emerging on the back of better broadband con-
nectivity, creating new opportunities for PSD linked
to international trade in services. The outsourcing of
“micro-work”, including through “crowd-sourcing”, is
of particular interest in this context.10 While still at an
early stage, such outsourcing offers interesting pros-
pects of PSD in low-income countries endowed with
spare capacity among literate labour.
The outsourcing of “micro-work” essentially requires
that a company breaks down activities into many very
small tasks that can be performed outside by individu-
als and delivered through the Internet, or other media,
against payment (World Bank, 2011). Tasks that can
potentially be sourced in this way include elaborate
professional services (such as computer program-
ming), as well as simple tasks that require only basic
skills and can often be performed very quickly against
small payments. Micro-work is often sought and deliv-
ered by workers via specialized websites which serve
as platforms, and which can either be commercially
oriented, or have a charitable or development objec-
tive as in the case of Samasource (box III.3).
While micro-work is still at an embryonic stage of devel-
opment, its growth potential is sizable, possibly reach-
ing several billion dollars within the next five years (World
Bank, 2011). Its inroads into developing countries have
been quite spectacular in recent years. For example,
in 2008, 76 per cent of the micro-workers of a leading
platform (Amazon Mechanical Turk) were based in the
United States and only 8 per cent in India. Two years
later, the United States accounted for less than half (47
Box III.3. Bringing micro-work to poor but talented workers in the South
Samasource was founded in 2008 as a non-profit social enterprise to tackle global poverty with micro-work. Its vision is
to provide a bridge between poor but talented people on the one hand, and businesses that seek a competitively priced,
qualified workforce and also care about ethical aspects, on the other.
After receiving projects from clients in the United States, most of which are big technology companies in Silicon Valley,
Samasource breaks them down into very small and simple tasks. These are then distributed to 16 centres worldwide via
an online work-distribution tool called SamaHub. After workers have completed the tasks online, the work is returned
for quality control at head office before being delivered to the client. Tasks range from content generation and optical
character recognition clean-up, to business listings verification and image-tagging. For example, Samasource workers
may research and gather information on businesses or universities by aggregating content from the Web. Clients to date
include Intuit, LinkedIn and Google.
Samasource focuses on providing employment especially to people who are socially disadvantaged, such as women,
rural workers and youth. So far, some 1,200 jobs have been created in Haiti, India, Kenya, Pakistan, South Africa and
Uganda. Over 1 million dollars in worker payments have been distributed to the field, and Samasource is committed to
further increasing sales, international operations, and worker development. By 2012, it intends to reach 10,000 staff.
Source: UNCTAD, based on Samasource (http://www.samasource.org) and on a BBC News Africa article from 18 June
2011 entitled “How Silicon Valley outsources work to African refugees”.
55CHAPTER III : PROMOTING PRIVATE ICT-SECTOR DEVELOPMENT
Box III.4. The role of freelancers in the Bangladeshi IT- and ICT-enabled services industry
According to the Bangladeshi Software and Information Services Association (BASIS), around 10,000 Bangladeshi free-
lancers are active online. The vast majority of them work for clients in the United States and Europe – usually SMEs – but
they also work for local-government institutions, non-governmental organizations (NGOs), and even individuals. They pro-
vide a range of ICT-related services, such as software development, graphic design, search engine optimization, social-
media marketing, blogging, and data entry. Projects vary from building large e-commerce websites to doing product entry
on eBay or posting positive feedback for companies on review websites.
Online portals such as www.freelancer.com, www.odesk.com and www.bworker.com, where freelancers can be hired
on an assignment basis, are popular among “micro-workers” in Bangladesh, who export services over the web in an
informal manner. Many of the freelancers have a day-time job or are students at IT faculties. The revenues generated by
the most successful individuals can be in the tens of thousands of dollars, while the average is around a few hundred to a
few thousand dollars. Although some freelancers work on high-value projects, which take months to complete, the most
common situation is to be involved in small projects with multiple clients on a day-to-day basis.
Despite freelancers’ low visibility in the country, BASIS reckons that they have now overtaken the formal IT- and ICT-
enabled services industry in sales volume, although there are no official statistics to verify this. Indeed, until recently, the
Central Bank of Bangladesh would consider payments related to these assignments and channelled through Western
Union and the like as “remittances” and tax them accordingly.
However, a directive issued in May 2011 by the Central Bank of Bangladesh recognizes that these funds should be
treated as export-related commercial income, which is tax-exempt. This is significant for the freelancers, who are now
asking that PayPal be formally allowed as a means of electronic payment. A project funded by the Centre for Promotion
of Imports from Developing Countries (a Dutch development agency) and being implemented by the International Trade
Centre UNCTAD/WTO (ITC) is supporting this initiative by advocating with the Government of Bangladesh for a more
business-friendly e-commerce environment.
Source: Information provided by BASIS and ITC.
per cent), while the share of Indian workers had surged
to 34 per cent. Interestingly, the remaining 19 per cent
of the work was carried out by workers in as many as 66
other countries (World Bank, 2011). Micro-workers are
often freelancers looking for complementary income, as
in the case of Bangladesh (box III.4). In order for micro-
work to take off, mechanisms are needed to ensure that
micro-workers are paid rapidly and accurately.
Up to now, the main vehicle to deliver micro-work has
been computers connected to the Internet. However,
with more widespread use of mobile broadband, the
mobile phone may emerge as an attractive tool for
certain activities. One firm, TxtEagle, is already out-
sourcing micro-work services through mobile phones
in over 80 countries. The company provides market-
ing and consumer information services about emerg-
ing markets’ consumers, and its employees are paid
with airtime. It has been suggested that the target
population could potentially exceed 2 billion people in
developing countries (see box III.5).
If adequate ICT infrastructure is in place, micro-work
can offer employment opportunities to people with ba-
sic levels of skills (such as literacy and familiarity with
ICTs), and can be an avenue for the development of
profitable market opportunities for businesses in both
developed and developing countries. Its growth may
well turn out to be exponential once the opportuni-
ties it offers become better known among both buyers
and suppliers. The availability of micro-work services
could trigger demand from business sectors that pre-
viously have not used them – in a similar way to the
development of “traditional” BPO.
Micro-work is exposing young workers to entrepre-
neurship, and encourages them to further familiarize
themselves with technologies; this can strengthen
their skills and employability in other areas. Moreover,
some workers may gradually upgrade their skills, and
become able to tackle more complicated and better
remunerated tasks. It should be noted that micro-work
is often vulnerable to technological improvements or
changes in the business model. For example, in the
third-party gaming industry, new software has been
developed to replace human labour on game sites. In
the medium term, it is likely that human labour will be
difficult to replace for some types of activities. More-
over, with the expanded use of smartphones, the role
of micro-work may grow further.

56 INFORMATION ECONOMY REPORT 2011
As is always the case with the introduction of new
technologies and business models, micro-work also
raises issues concerning possible negative effects, for
example with regard to low levels of pay, work eth-
ics, and working conditions. Cases have been noted
where prison detainees have been forced to work until
exhaustion to perform micro-work tasks such as “gold
farming” on online video games for the profit of their
guards.11 There are also reports that micro-work is
extensively used by spammers, who sometimes do
not pay for the work conducted.12 Further research is
needed to better understand the full implications of
this new phenomenon.
C. PSD OPPORTUNITIES IN ICT MANUFACTURING
Global manufacturing of ICT goods is highly concen-
trated, with a number of economies in East Asia ac-
counting for an increasing share.13 In 2009, seven of
the world’s top 10 exporters of ICT goods were in Asia,
with China – by far the leading exporter – accounting
for $356 billion worth of such exports. Asian econo-
mies are responsible for about two thirds of the global
export market; China alone accounts for 25 per cent
of the total (WTO, 2010). The recent adoption of a new
definition of ICT goods has resulted in an even higher
share for Asia of global ICT goods exports (box III.6).
Malaysia is among the few developing economies in
which manufacturing accounts for the majority of the
ICT-sector value added (fig. III.1). It is also one of the
world’s top 10 exporters of ICT goods. In 2009, more
than one third of its merchandise exports consisted of
ICT goods. In terms of employment, ICT manufacturing
accounted for over 387,000 jobs in 2007 – approxi-
mately 80 per cent of the total ICT sector. Between 2000
and 2007, approximately 70,000 jobs in the production
of television, radio and communication equipment were
lost in Malaysia, while more than 30,000 new jobs were
added in computer production. Global competition is
fierce in this industry, from both existing and emerging
players. For example, India has experienced one of the
sharpest increases in ICT goods exports, which surged
by 244 per cent from 2008 to 2009.
ICT manufacturing in other parts of the developing
world is very limited; non-Asian developing economies
accounted for less than 5 per cent of world exports in
2009.14 Nonetheless, there are examples of ICT goods
manufacturing in low-income countries. For example,
Nigeria is home to a computer and component as-
sembly company, Omatek, which is growing both in
the local and the regional market.15 In various other
developing countries, assembling computers, laptops
and other IT equipment is providing employment and
economic opportunities. Local assembly can pro-
vide benefits in terms of reduced costs and tailoring
of products to local or individual needs. In Peru, for
example, informal assemblers accounted for 43.5 per
cent of the sales of laptops and desktops in 2008
(UNCTAD, 2011b). Some ICT manufacturing activities
are reported in the informal ICT sector, too. For exam-
ple, the production of antennas for television reception
(including satellite television) is frequently observed in
Africa.16 However, such production is constrained by
technology evolution, which may make such prod-
ucts obsolete. Although there may be an opportunity
Box III.5. Crowd-sourcing via mobile phones: the case of TxtEagle
TxtEagle, a United States-based company, offers crowd-sourcing and market research services in developing markets.
Its platform enables businesses to collect information, data on the ground, and opinions, via mobile phones. TxtEagle
uses the USSD protocol, which has the advantage of allowing for communication that is free of charge.
Survey questions are sent to registered users, who receive free airtime in exchange for their answers. For example, one
enterprise used the platform to collect information on road signs in the mobile users’ local area, and put together a sat-
ellite navigation system. Another company used the TxtEagle platform to monitor television advertisements and check
that local stations were broadcasting them correctly. The platform has also been applied to the translation of marketing
materials into local dialects. Marketing activities to increase customer engagement – such as opt-in customer campaigns
or the provision of incentives – are offered too.
The company has reportedly partnered with over 200 mobile network operators, and has a presence in more than
80 countries. Recently, it raised $8.5 million of private funds to expand its operations. Mobile operators are compensated
by the airtime purchases made by TxtEagle to pay its customers.
Source: UNCTAD, based on information from TxtEagle.com, Evans (2011) and Bain (2011).
57CHAPTER III : PROMOTING PRIVATE ICT-SECTOR DEVELOPMENT
to modify ICT components instead of importing them
(given the modern modularization of devices), due to
economies of scale and high costs of entry, it is un-
likely that the trend towards the geographical concen-
tration of ICT manufacturing in Asia will reverse any
time soon.
D. POLICY IMPLICATIONS
As was noted in chapter I, several developing coun-
tries recognize the importance of including promotion
of the ICT sector in their PSD strategies. Many see this
sector as strategically important for the development
of a competitive economy. Governments can facilitate
expansion of the ICT sector by creating an enabling
framework to address bottlenecks to its development.
This involves a wide range of interventions in various
policy domains, including liberalization and effective
regulation of the ICT sector, enhancing trust in the use
of ICT services (chapter II), providing training in ICT
skills, nurturing ICT enterprises via incubation and by
establishing technology parks, and using public pro-
curement to create demand.
Priority-setting needs to reflect the kinds of activity
that the Government wants to develop. For example,
the nature of infrastructure and skills requirements var-
ies considerably between activities aimed at servicing
the local market and those aimed at servicing the in-
ternational market. In order for policies aimed at pro-
moting the ICT sector to be efficient, they should be
well integrated in the overall PSD strategy.
1. ICT-sector liberalization and regulation
A key element in creating an investment climate that
enables the use of ICTs is the liberalization and effec-
tive regulation of the ICT sector. As noted in chapter
II, in countries with limitations on market entry, the
roll-out of infrastructure and the uptake of ICT use
among enterprises have typically been more limited
than elsewhere. A more open market for ICT ser-
vices allows private enterprises to enter, stimulates
growth and investment, increases the availability of
infrastructure and affordable services, and fosters
innovation. At the same time, adequate regulation
is required in order to reap full benefits from open-
ing up.
Despite the rapid growth of the ICT sector in the past
few decades, various constraints to its expansion re-
main. A number of countries have not liberalized the
ICT sector fully, and even in those that have, barriers
to entry may remain, in terms of high licensing costs
or significant market power over key facilities that are
hard to replicate. The role of Governments includes
minimizing direct and indirect barriers to market entry,
as well as providing adequate regulation of existing
players. Limits on market entry through de facto or
de jure monopolization of specific market segments,
high administrative prices for licences or spectrum,
complex and cumbersome licensing processes, and
a lack of effective regulation for dealing with compa-
nies that have significant market power, constrain the
effectiveness of the market.
Box III.6. New ICT goods definition boosts Asia’s share in ICT export statistics
The definition of what constitutes ICT goods was updated in 2009 and released by OECD in 2010. The change in defini-
tion entailed the removal of 79 product items, and the addition of 7. This resulted in a total number of 95 ICT goods items.
For the world as a whole, the value of ICT goods exports in 2009 was about $173 billion,a 11 per cent less than would
have been the case under the old definition.
Although for most exporters, the net impact of the change in definition implies a reduction in the total value of ICT exports,
the magnitude of this reduction varies widely by country. In China, the top exporter of ICT goods, the new definition en-
tailed only a small reduction in ICT goods exports, as the value of the goods added was worth 99 per cent of the value
of the goods removed. By contrast, major ICT goods exporters in developed countries have been affected more. The
United States, Germany, Japan and France saw some of the largest net declines in the value of their ICT goods exports.
The change in definition will accelerate the trend of ICT goods exports shifting towards developing Asia (UNCTAD, 2009a
and 2010).
Source: UNCTAD.
a See UNCTAD (2011). Implications of applying the new definition of “ICT goods”. Technical note no. 1.
http://new.unctad.org/Documents/ICT%20sector/ICTA_TN_1_unedited.PDF.

58 INFORMATION ECONOMY REPORT 2011
According to ITU, most countries now allow com-
petition in key ICT network services (table III.6). The
most open market segments are mobile and Internet
services, which have also been the two exhibiting the
strongest growth over the last 10 years. By contrast,
a number of countries have not moved to fully com-
petitive markets, or still allow monopoly control over
other segments. These restrictions limit market entry,
and tend to hamper the ability of the economy to ben-
efit from the reduced prices, innovation and market
growth made possible by the combination of private-
sector involvement and competition.
Access to different ICT services at affordable rates is
essential to the development of various ICT producing
activities. As the examples of such countries as India or
the Philippines demonstrate, cheap and reliable broad-
band connectivity is essential for the development of
an outsourcing industry. Likewise, increased availability
and affordability of mobile services should lead to more
jobs and business opportunities in the mobile sector,
including the development of mobile applications, the
provision of mobile money services, and the repair and
sale of mobile phones and related accessories.
A survey of 17 African countries carried out by Re-
search ICT Africa (RIA) (2010) identified seven aspects
of ICT policy to promote affordable and quality ICT in-
frastructures: (a) market entry and open access (which
should be technology-neutral); (b) allocation of scarce
resources (such as spectrum); (c) interconnectivity; (d)
regulation of anticompetitive practices; (e) universal
service; (f) tariff regulation; and (g) quality of service.
Only two of the countries (Botswana and the United
Republic of Tanzania) provided an ICT policy environ-
ment that was viewed positively by local actors, while
in other countries it was, at best, viewed neutrally
(Ghana, Tunisia and Uganda).
Improving the ICT policy environment is key to attract-
ing local and foreign investment in ICTs, and to en-
suring that the potential benefits materialize. One of
the general policy recommendations is to ensure the
effective autonomy of the regulator. Too often, espe-
cially in LDCs, regulators do not have enough politi-
cal autonomy or the effective means to carry out their
duties fully. Moreover, regulators and other authorities
involved often lack the necessary capacity to imple-
ment appropriate measures in these areas. Building
the capacities of ICT policymakers is thus important
and requires international support.
2. Developing human resourcesDeveloping a thriving ICT sector depends crucially on
the availability of adequately trained human resources.
Lack of the necessary skills is often cited as a barrier to
the development of a local ICT industry, and serves as
an effective barrier to attracting foreign investment. At
the same time, in order for government or private-sec-
tor initiatives that aim at developing human resources
to achieve their goals, it is essential to have a clear
understanding of the precise needs of the enterprises
in question. Matching supply and demand is neces-
sary in order to ensure that skills developed through
education and training are those that are sought by
ICT enterprises. A poor match increases the likelihood
of educated people having to look elsewhere for work,
possibly contributing to brain drain.
In general, people who are ICT-literate have a higher
chance of finding employment, as both companies
and Governments need their skills in order to better
participate in the knowledge-based economy. Gov-
ernments should therefore seek to enhance digital
literacy, by using the basic education system, be-
ginning at primary school level, and by emphasizing
lifelong learning through adult training programmes.
Ideally, the public and private sectors, and academia
and training institutions, should work together to de-
velop national policies that focus on imparting ap-
propriate skills that reflect the requirements of the
ICT industry. The provision of free Internet access in
public schools, universities and libraries can serve
to broaden the use of technology and the Internet
for entrepreneurs. At the same time, care should be
Table III.6. Status of competition in telecommunications services, countries allowing competition in each market segment, 2010 (%)
Source: ITU.
CompetitionPartial/ duopoly
Monopoly
Local services 56 14 30
International long distance
53 15 31
Leased lines 58 17 24
Mobile 62 28 10
Internet services 78 15 7
International gateways
58 24 18

59CHAPTER III : PROMOTING PRIVATE ICT-SECTOR DEVELOPMENT
Box III.7. Promoting globally competitive infocomm manpower in Singapore
To support its fast-growing infocomm industry, the Government of Singapore has stressed the importance of developing a
rich pool of globally competitive ICT human resources. To this end, the manpower development programmes under the na-
tional development strategy (iN2015) are focused on developing competencies in key sectors, developing globally competi-
tive ICT professionals, and attracting, developing and retaining ICT talent. The Government is aiming for 80,000 new jobs by
2015, comprising 55,000 ICT and 25,000 non-infocomm jobs in the industry. By 2009, Singapore had reached the halfway
mark, with more than 41,000 additional jobs created. A few of the related initiatives are presented below.
The Critical Infocomm Technology Resource Programme is a training incentive programme designed to equip infocomm
professionals with critical and emerging skills. In April 2009 it was enhanced, to provide more funding for course and ex-
amination fees. Training courses are aligned with the National Infocomm Competency Framework, and more than 27,800
professionals have benefited from it since 2006. Some of the critical skills targeted for development by the programme
include data integration and information management, infrastructure and network management, ICT in media and enter-
tainment, IT services, business management and software development.
The National Infocomm Competency Framework articulates the competency requirements of key professionals. It seeks
to widen and deepen the capabilities of Singapore’s ICT professionals and to guide their career development and pro-
gression. Training courses are delivered through Continuing Education Training centres, which are expected to train up to
10,000 professionals over five years. The framework now offers about 250 job roles in areas such as infocomm security,
data centre management, channels management, quality assurance, and portfolio management. The framework will be
continually updated to cover new and emerging areas such as cloud computing, business analytics, green computing,
next generation networking, and service science engineering.
The Infocomm Leadership and Development (iLEAD) programme aims to build a pipeline of experts in high-end, strategic
growth areas such as business analytics, cloud computing, and green ICT. This is to ensure that Singapore’s infocomm
manpower capabilities keep pace with technological change. Organizations can use iLEAD to boost the capabilities of
their existing employees and to take in new trainees.
The Techno-Strategists Programme aims to develop professionals with both technical and business knowledge of sec-
tors such as financial services, healthcare, hospitality, retail, and interactive digital media. Training courses, workshops
and certification examinations exist in five industry domains, and more than 1,000 professionals have acquired hybrid
skills since April 2008.
As part of the effort to attract some of the best students to pursue a career in the ICT sector, two scholarship programmes
have been launched. The National Infocomm Scholarship (NIS) provides “A” level students and polytechnic graduates
with a government scholarship and valuable private-sector work exposure in top infocomm and end-user companies.
About 180 students have so far been awarded the NIS. For outstanding “O” level students, the Integrated Infocomm
Scholarship (IIS) was launched in 2009. This includes the opportunity for talented students to gain experience in major
infocomm corporations locally and overseas. To date, 52 students have been awarded the IIS.
Source: Infocomm Development Authority (2010).
taken when seeking to leverage ICTs for educational
purposes, as many initiatives in this area have failed
to generate the results hoped for (see, for example,
IADB, 2011a).17
The development of ICT professionals is a priority in
many countries, including Singapore (box III.7) and
Egypt (box III.8). In Cambodia, more than 3,000 soft-
ware developers graduate every year, and the cost of
hiring them is generally much lower than for software
developers from China or India. Nevertheless, due to
their skill levels being below international standards,
they are still not competitive.18 Here, as in many other
developing countries, one of the challenges is to adapt
the ICT curriculums taught in universities to reflect new
developments in the area of software. The Meltwater
Foundation offers a three-phase entrepreneurial pro-
gramme designed to foster software companies in Af-
rica. It begins at the Meltwater Entrepreneurial School
of Technology (MEST) campus in Accra, Ghana, with
a two-year training programme. IT entrepreneurs with
business ideas that are deemed to be viable then
move to the MEST Incubator for assistance in getting
their businesses off the ground.19
In UNECLAC’s review of national ICT strategies in Latin
America and the Caribbean, the software, applications
and content industries were given special attention.
UNECLAC underlined that new products depended
increasingly on greater integration of hardware and
60 INFORMATION ECONOMY REPORT 2011
software components, and that the development of
ICTs in the coming decade would be shaped by tech-
nology convergence. With a view to strengthening the
software industry, the review made the following ob-
servation (UNECLAC, 2010: 28).
“From a national and regional public policy
viewpoint, the short- and medium-term goal
should be to resolve the main competitiveness
gaps associated with the ICT industry, especially
in the areas of human resource capacity,
enterprise operational excellence, technology
transfer, and the promotion of cluster initiatives.”
Mexico has a comprehensive programme called
PROSOFT to addresses specific challenges related to
the human, regulatory, business, market and invest-
ment aspects of developing a domestic ICT industry.
The programme contains a wide number of instru-
ments, including some that deal with the promotion
of human talent in software development and IT ser-
vices. To improve the availability of trained/certified
IT professionals, several concrete actions have been
taken. Mexico First20 is an initiative that financially
supports (by up to 70 per cent) the certification of IT
specialists and other skilled labour needed in IT- and
ICT-enabled services. The programme aims to sup-
port the certification of 12,000 professionals annually.
Applications can be made for a wide range of certi-
fications, in the areas of multimedia, IT and BPO, as
well as in English and project management. IT Talent
is another programme, which supports the certifica-
tion of graduates in competencies specifically required
by industry. Five different profiles have been identified,
and 48 people had been certified as software archi-
tects by April 2011.21
India’s success in IT- and ICT-enabled services exports
is partly explained by the local availability of a qualified
workforce which is the result of a long-planned educa-
tion strategy. In India, several companies are engaged
in training and capacity-building activities, helping to
support skills development for the IT/BPO market. In-
dian companies are also piloting BPO training activi-
ties and projects in rural areas, to assess the potential
that this market represents for meeting the demand for
outsourcing by hiring employees in rural areas directly
while at the same time encouraging employment at
the local and community level. Other Indian compa-
nies are also providing BPO certification directly.22
Development partners can make important contribu-
tions to the development of relevant ICT skills. For ex-
ample, the German organization InWEnt has launched
an initiative to support the capacity-building pro-
gramme run by the Free Software and Open Source
Foundation for Africa (FOSSFA) and by GIZ, which sup-
ports ICT SMEs and aims to encourage the growth of
African ICT sectors. The programme specifically pro-
motes free and open source business models, Linux
administration certification, and innovative African free
and open source software (FOSS) applications.23
In addition, a range of private-sector initiatives have
been launched to speed up the development of ICT
skills. For example, the Cisco Networking Academy
programme delivers a learning experience to more than
900,000 students each year. Since 1997, over 3 million
students from more than 165 countries have gained
ICT skills through the programme.24 Microsoft works
with partners to create relevant training opportunities
and innovative tools for people who are underserved by
technology. As part of the “Microsoft Unlimited Poten-
Box III.8. Boosting the number of ICT graduates in Egypt
Thanks to various initiatives, often in partnership with the private sector, the Government of Egypt has managed to in-
crease the number of graduates with relevant skills for the ICT sector. The number of graduates that have received formal
ICT training has increased significantly since 2006, when about 27,000 were trained. By May of 2011, there were already
40,000 graduates enrolled for formal ICT training.a The availability of trained technical staff graduating from Egyptian uni-
versities is expected to meet the demand of the market for several years to come. In the area of software development,
the Software Engineering Competence Centre (SECC) has, since 2003, been delivering courses and offering advisory ser-
vices to Egyptian companies to assess their maturity level. Over thirty companies have attended these courses and have
achieved certification for Capability Maturity Model Integration (CMMI) maturity levels 2–5. By meeting the requirements of
the SECC, Egyptian ICT companies can claim that they meet internationally acceptable criteria for software development,
which helps them compete internationally. To date, SECC has focused particularly on lower-level certifications. Only a
handful of Egyptian companies have so far achieved CMMI certification levels 4 or 5. SECC expects that it will take about
another year for it to be able to provide level 4 and 5 certifications.
Source: UNCTAD (2011c).a MCIT (2010). Egyptian ICT Indicators Portal. http://www.mcit.gov.eg/Indicators.aspx.
61CHAPTER III : PROMOTING PRIVATE ICT-SECTOR DEVELOPMENT
tial” commitment, employability and workforce devel-
opment programmes support organizations that work
to ensure that individuals have the required IT skills.25
Beyond the ICT-specific training needs, the develop-
ment of general entrepreneurship and management
skills is also of the essence. This is one of the rec-
ognized challenges for ICT SMEs in Africa (Excelsior,
2011). Across the region, there are few skills develop-
ment training programmes to help young entrepreneurs
develop the necessary marketing, finance and opera-
tional tools needed to launch successful ICT enterpris-
es. This also applies to basic activities that foster local
adoption of ICTs, such as mobile and computer repairs
and maintenance, running cybercafes etc. A few ex-
amples in this respect can be highlighted. The Success
in Information Business programme, implemented by
Jidaw Systems Limited, is dedicated to building human
capacities for ICT entrepreneurship in Nigeria. It pro-
vides short courses on management that are specific
to the ICT industry, for would-be business starters in
the ICT sector.26 In Zambia, Youth Resource Centres
supported by IICD are deploying ICT in training curricu-
lums. This includes promoting the operation of Internet
connectivity as a potential area for entrepreneurship de-
velopment. These schemes may contribute to helping
Nigeria and Zambia benefit from a larger pool of work-
ers with relevant skills who can then support ICT roll-out
in the local private sector and create new ICT-related
businesses. In Kenya, such basic skill-building partly
comes through informal apprenticeships. There are, for
example, successful ICT learning spaces in slum areas,
such as the Digital Design School, NairoBits in Kibera,
and the Mathari Resource Centre – which could be bet-
ter supported or scaled up with appropriate support.27
3. Incubation and technology parksTo boost specific ICT enterprises, many countries
have established various kinds of business incuba-
tors. Such initiatives may seek to overcome difficulties
in raising local public- and private-sector awareness
of the importance of supporting entrepreneurship and
SME development in the ICT sector. They also aim
at boosting the survival rate of start-ups by providing
key services at their most vulnerable stage of devel-
opment, and by fostering cooperation and emulation
through geographical proximity benefits. They are
typically geared towards supporting relatively sophis-
ticated activities. Experience from developed coun-
tries show that enterprises that have benefited from
business incubation have a higher rate of survival; the
same observation has been made for Brazil and Chi-
na (United Nations Millennium Project, 2005). At the
same time, some concerns have been raised about
incubation, for instance regarding the extent to which
benefits are sustainable, the potential for outreach,
and the risks in “picking winners” (ibid.).
InfoDev, a donor-funded research, capacity-building
and advisory programme, helps developing coun-
tries and their international partners use innovation
and ICTs as tools for sustainable social and economic
development.28 One of its programmes is the Global
Business Incubator Initiative, which aims to build ca-
pacity and to undertake research. The initiative was
launched in 2002, with support from the Government
of Japan. By April 2011, the network had 337 incuba-
tors in 93 countries. Most of the incubators target the
ICT sector specifically, whereas others have a focus
on agriculture, manufacturing, or other areas. InfoDev
estimates that almost 17,000 SMEs have been incu-
bated, that over 4,000 enterprises have graduated,
and that more than 230,000 jobs have been created.
An online incubator support centre (http://www.idisc.
net) has been set up to give incubators the opportu-
nity to network and to learn using knowledge tools
designed for business incubators.
Recently, the Government of Finland, Nokia and in-
foDev jointly launched a new network of regional mo-
bile applications laboratories (mLabs). Locations for
the first five mLabs have been identified: Armenia,
Kenya, Pakistan, South Africa and Viet Nam. For ex-
ample, in the case of Kenya, the mLab for East Africa
will be established by the *iHub Consortium, which
includes the World Wide Web Foundation and the
Nairobi School of Computing and Informatics. *iHub
– Nairobi’s Innovation Hub for the technology com-
munity – is an open space for technologists, inves-
tors, technology companies and computer specialists
in the area. It focuses on young entrepreneurs, web
and mobile phone programmers, designers and re-
searchers. It is partly an open community workspace
(co-working), partly a vector for investors and venture
capitalists, and partly an incubator.29
There is a need for more systematic assessments of
the extent to which incubators generate the results
anticipated. For example, a more comprehensive as-
sessment of the impact of individual incubators within
the infoDev network could generate valuable insights
into how and when incubators work the best. In Peru,
incubators have had limited success in the estab-
lishment of technology-based enterprises (UNCTAD,

62 INFORMATION ECONOMY REPORT 2011
2011b). They have faced demand constraints in the
form of a lack of participants, as well as limited oppor-
tunities to link with crucial institutions such as research
institutions, or to access financial resources.
Many developing countries have established dedi-
cated technology parks to provide internationally
competitive ICT infrastructure and other facilities to
foreign and domestic investors in technology-inten-
sive industries. Among developing regions, Asia has
been particularly active in using such policy instru-
ments (Andersson et al., 2004). Well-known examples
in Asia include Hsinchu Science Park (Taiwan Prov-
ince of China), Zhongguancun Science Park in Beijing
(China), the many technology parks dedicated to IT
services in India, and the Multimedia Super Corridor
(Malaysia). In recent years, the number of parks has
also increased in Africa – examples being SMART Vil-
lage in Egypt and the ICT park in Rwanda (box III.9).
Some initiatives seek to support ICT micro-enterprises
engaged in less advanced activities. For example, the
mobile operator Uninor’s Hand in Hand Citizen Cen-
tres are a set of over 500 facilities across the State of
Tamil Nadu, India, which are designed to allow female
entrepreneurs to generate income and to deliver ICT
training and support to other women in their com-
munities.30 Entrepreneurs are selected from self-help
groups set up by the NGO Hand in Hand for women
at the bottom of the pyramid. The women are given
technical and business training, and loans for equip-
ment which they repay monthly. The programme aims
to empower local women with skills that will improve
their income-generation and decision-making pro-
cesses. At the same time, Uninor gains access to the
rural market, and a point of contact with underserved
customers. Mohanapriya is a 22-year-old entrepre-
neur working with a Centre in a rural village outside
of Chennai. She and her mother sell mobile products
and provide local women with ICT training, business
training, and education on how to assert civil rights
using ICT tools. The business allows them to make
regular loan repayments and to generate a monthly in-
come of 4000 INR ($88), a quadrupling of the income
they had before joining the programme.
An important avenue to strengthen the competitive-
ness of small ICT enterprises is to promote improve-
ments in quality. Where micro-enterprises are more
clustered, such as in the case of urban handset ven-
dors and repairers, local associations may be able to
provide some controlling of quality and behaviours. In a
Nigerian computer reseller cluster, such an association
was able to improve and standardize quality somewhat
among its members (Oyelaran-Oyeyinka, 2007). There
is also room for policy to ensure behavioural standards.
In the mobile money in Kenya, for instance, a policy
to outline the roles and responsibilities of m-banking
agents (signage, rates and qualifications) is pushing
the value chain to enforce standards in order to pre-
serve the reputation of the entire value chain (Dias and
McKee, 2010). Moreover, the Digital Village scheme
launched by the ICT Board of Kenya, which is still in
its early stages, is seeking to work with existing ICT
micro-enterprises and support them through loans and
training to build digital centres in rural areas (Foster and
Heeks, 2011). Another approach that has been taken
by the United States-based social enterprise Inveneo
aims to develop a network of certified local ICT enter-
prises that can deliver IT solutions to rural and remote
regions of low-income countries (box III.10).
4. Using government procurement to create demand
States can play an active role in promoting a national
ICT industry by expanding the demand for ICT servic-
es. In developing countries, the Government is often
the largest ICT user. Consequently, the way in which
it buys ICT goods and services influences overall de-
mand for the local ICT sector. For example, UNECLAC
recommends that Governments in Latin America and
the Caribbean should encourage nationwide ICT-
intensive modernization processes – for example via
Box III.9. ICT park in Rwanda
Rwanda established an ICT park and incubation facility in Kigali in 2006. Kigali ICT Park is managed by the Rwanda
Development Board, and promotes innovation, private sector development, capacity-building and sustainability. The
Park offers a service package including subsidized office space, Internet connections, power, and other facilities. There
are three main objectives: (a) incubation (for ICT start-ups); (b) technology production and exhibition (by ICT companies);
and (c) the Multi-Disciplinary Centre of Excellence in ICT. At least six ICT companies have graduated from the Park, and
another 12 are being incubated. There are plans to expand the scope and function of the Park in the coming years.
Source: UNCTAD, based on information provided by UNECA.

63CHAPTER III : PROMOTING PRIVATE ICT-SECTOR DEVELOPMENT
the automation of customs services, the digitization of
transactions, public procurement, and traceability sys-
tems, and the use of mobile payments and services
based on open data. Such reforms would open the
way for domestic ICT enterprises to take better advan-
tage of their innovation potential (UNECLAC, 2010).
The role of public procurement as a catalyst for local
ICT industry development deserves more attention.
As emphasized by Porter (1985), domestic demand
is a strong stimulus to the competitiveness of local
industry. Government ICT procurement represents
an important part of domestic demand in low-income
countries. At the same time, it is the nature of that
demand (i.e. whether it is for cutting-edge, innovative
ICT applications) as much as the size of the demand
that matters. However, procurement rules relating to
ICT goods and services should be designed in such
a way that local ICT enterprises are given a real op-
portunity to qualify for the tender process. For ex-
ample, Nigerian PC firms such as Zinok and Omatek
were able to grow thanks to local procurement from
the Government of Nigeria (Excelsior, 2011). It is im-
portant that government procurement is not seen as
purely a question of financial investment, but also as a
tool that can spur development of the local economy.
Moreover, it is important to ensure that SMEs that are
able to provide goods and services for government
procurement are paid promptly, as they typically do
not have the liquidity to extend credit over time.
Social outsourcing, as described in UNCTAD (2010),
is a case in point. In India, several state Governments
have made a deliberate decision not to route out-
sourced IT services work to large private-sector firms
(sometimes subsidiaries of TNCs) but instead to chan-
nel it to social enterprises in poor communities. This
deliberate procurement strategy aims at developing
emerging ICT micro-enterprises, sometimes in rural
areas (Heeks and Arun, 2010). A key problem facing
small and new outsourcing firms – especially if they
are located in rural areas – is to find enough clients
to make the venture sustainable.31 In such a situa-
tion, government procurement can act as a catalyst
and help new market entrants to build sufficient scale
and a track record that can subsequently be used in
reaching out to new clients.
The introduction of e-procurement systems can act
as an incentive for more SMEs to increase their use
of the Internet as a business tool, and can thereby
also create more local private demand for ICT consul-
tancy services. The experience of Chile demonstrates
that an e-procurement system backed up by strong
policies on procurement can save government money
and increase the quality of the goods and services
procured, and at the same time can promote ICT up-
take among SMEs and help to level the playing field in
public procurement, so that more companies and not
just large firms benefit (Chile Compra, 2008).
Box III.10. Building a network of certified small and local ICT enterprises
Inveneo is a non-profit social enterprise which aims to make ICT tools such as computers, telephony and Internet ac-
cess available to people and organizations in rural and highly underserved communities of the developing world. In order
to deliver the most sustainable ICT solutions for relevant organizations, Inveneo is building a network of in-country IT
entrepreneurs who are recruited, trained and certified to provide local IT services to schools, hospitals, enterprises and
Governments.
The Inveneo Certified ICT Partner (ICIP) programme is seeking to develop certified local technology companies that will
have the necessary skills to deliver cost-effective installation and IT support services. By means of the programme, Inve-
neo has developed a network of over 76 partners in 24 developing countries – 18 of which are LDCs.
Inveneo continues to expand its network of partner companies. The preferred potential ICIPs are small ICT businesses
with 3 to 20 full-time local employees and which have a track record in serving enterprise, government and/or school
system clients over the last two or more years. They should also possess strong experience in at least three of the fol-
lowing technical areas: enterprise/school networking; basic Linux and open-source knowledge; Microsoft-certified; long-
distance wireless networking; VoIP or rural power systems (battery and solar). In addition, they must be willing to commit
two staff and the associated travel costs for two weeks of training, which is held on site in a rural location.
Applicants who wish to become ICIPs go through a rigorous recruitment and selection process. If they pass the screen-
ing, they benefit from intense training on rural ICT solutions, which consists of both classroom and hands-on field instruc-
tion, robust certification processes, and ongoing partner-support and management systems. ICIP partners have seen up
to $2,000 a month in increased revenue through new clients acquired by virtue of being an ICIP.
Source: Inveneo (http://www.inveneo.org).

64 INFORMATION ECONOMY REPORT 2011
NOTES1 The information is available online at http://unctadstat.unctad.org/TableViewer/tableView.aspx?ReportId=1634.
2 OECD data presented by Pierre Montagnier, OECD, at WSIS Forum 2011. 17 May 2011.
3 See the summary of the discussion held at the Partnership session held during WSIS Forum 2011, available athttp://new.unctad.org/upload/WSIS%20Forum%202011/WSIS_Session_summary_17052011.PDF.
4 See IDATE (2010). World Telecom Services Market 2010: Global market worth 1,348.9 billion USD in 2009. 25 August. http://blog.idate.fr/?p=133.
5 Source: World Bank and Public–Private Infrastructure Advisory Facility (2011). Private Participation in InfrastructureProjects database. 4 March. http://ppi.worldbank.org.
6 See, for example, Business Wire (2011). Yankee group forecast shows global telecom spending rising for first time since financial crash. 25 May. http://www.businesswire.com/news/home/20110525005249/en/CORRECTING-REPLACING-Yankee-Group-Forecast-Shows-Global.
7 All direct activity in the mobile supply chain is seen as being part of the supply side of the mobile sector. This approach diverges from the agreed definition of the ICT sector (OECD, 2009), which excludes vending and retailing. However, in developing countries, the actions and behaviours of such vendors very much reposition them as an active part of the sphere of production.
8 See examples for Bangladesh, Kenya and Uganda in Deloitte (2008), GSMA (2009b), Ovum (2006) and UCC (2007).
9 Bayala S, Kabore M and Traoré I (2009). Le sous-secteur informel des TIC au Burkina Faso: rapport de recherche. Research paper funded by International Development Research Centre (Canada). Also: Ndiaye SM, Niang A and Diongue K (2010). Le sous-secteur des TIC au Sénégal. Research paper funded by International Development Research Centre (Canada).
10 Crowd-sourcing is the act of outsourcing tasks traditionally performed by an employee or contractor to an undefined,large group of people or community (a “crowd”) through an open call.
11 The Guardian (2011). China used prisoners in lucrative Internet gaming work. 25 May. http://www.guardian.co.uk/world/2011/may/25/china-prisoners-internet-gaming-scam.
12 The Economist (2011). Turks of the world, unite! 24 May. http://www.economist.com/blogs/babbage/2011/05/repetitive_tasks.
13 UNCTAD (2011). In wake of financial crisis, Asia’s share of global ICT exports surges to record high. Press release.http://www.unctad.org/Templates/webflyer.asp?docid=14417&intItemID=1528&lang=1.
14 Mexico is the main non-Asian developing-country exporter, accounting for 3.5 per cent of world exports of ICT goods.The remainder of the non-Asian developing countries account for less than 1.5 per cent of the total.
15 See http://www.omatekcomputers.com/company_profile.html (accessed on 10 August 2011).
16 Ouédraogo S, Bayala S, Niang A and Tankeu R (2010). Dynamiques et rôle économique et social du secteur informel des TIC en Afrique de l’Ouest et du Centre: cas du Burkina Faso, du Cameroun et du Sénégal. Research paper funded by International Development Research Centre (Canada). September.
17 IADB (2011a) found that increased access to computers in schools by itself had had low returns in the Latin American and Caribbean region. In order for ICTs to have a positive impact, complementary inputs were critical – including hardware, software, electricity, teacher training, and technical and pedagogical support.
18 Economics Today (2011). Using ICT to help rural areas. 16–30.
19 See http://www.meltwater.org/about/.
20 See: www.mexico-first.org/
21 As reported at http://www.canieti.org/noticias/vista/11-04-04/Estrena_M%C3%A9xico_sus_primeros_Arquitectos_de_Software.aspx
22 Hero Mindmine (2008). Global BPO certification. See http://www.heromindmine.com/index.html.
23 See http://www.ict-innovation.org/.
24 See http://www.cisco.com/web/about/citizenship/socialinvestments/docs/NetAcadBrief.pdf.
25 See http://www.microsoft.com/about/corporatecitizenship/en-us/our-actions/in-the-community/workforce-development.aspx.
26 See http://www.jidaw.com.
27 See, for example, http://www.nairobits.com/.
28 See http://www.infodev.org.
29 See http://www.ihub.co.ke/pages/about.php.
30 Information provided by the GSMA mWomen programme. See http://www.mwomen.org.
31 See http://ict4dblog.wordpress.com/2011/05/31/development-2-0-case-study-socially-responsible-outsourcing-to-rural-indian-telecentres/.

Governments and other organizations are engaged in many activities
aimed at supporting the creation and growth of enterprises. However,
the expanded scope for leveraging ICTs in this context has so far not
been fully reflected in the strategies and policies of national Govern-
ments and their development partners. This chapter explores selected
areas in which ICT use has the potential to contribute to making the
business environment more enabling and PSD interventions more ef-
fective.
This chapter concentrates on three areas that are of high priority in
the context of PSD interventions. Section A is concerned with the
use of ICTs to make business environments more enabling. Section
B focuses on ICT use in the delivery of business development and
agricultural extension services, with special emphasis on training and
advisory services and on making the relevant information more ac-
cessible. Section C examines how ICTs can be leveraged to improve
access to finance – the biggest barrier to growth and development in
micro- and small enterprises (MSEs).
MAKING PSD INTERVENTIONS MORE EFFECTIVEWITH ICTs 4
66 INFORMATION ECONOMY REPORT 2011
A. HOW CAN ICTs HELP TO MAKE BUSINESS ENVIRONMENTS MORE ENABLING?
As noted in chapter I, in order to facilitate growth and
development of the private sector, an important task
for Governments is to make the investment climate
and business environment as enabling as possible.
The business environment can be seen as a subset
of the investment climate – consisting of a complex
set of policy, legal, institutional and regulatory condi-
tions that govern business activities (box IV.1). While
the investment climate has an overall effect on private-
sector activities, the business environment is directly
affected by government decisions at national, provin-
cial and local levels. This section illustrates how ICTs
can contribute in this context, with examples covering
three areas, namely (a) facilitating business registration
and licensing; (b) improving tax policies and adminis-
tration; and (c) facilitating trade.
Governments and their partners, including bilateral
donor and multilateral development agencies, are
seeking to reform the business environment so that
private enterprises are able to change their behav-
iour in ways that lead to enhanced economic growth
through increased levels of investment and innovation,
and to more and better jobs. This is done by reducing
business costs (in order to increase profits or market
share); reducing the risks associated with poor or fre-
quently changing government policies, laws and regu-
lations; and increasing competitive pressure through
having new enterprises enter the market to stimulate
market efficiency and incentives for innovation (DCED,
2008).
The relationship that is formed between government
and business is a key aspect of the business envi-
ronment. It can be improved through processes that
make it more transparent, rules-based and efficient,
thereby bringing down the costs of complying with
regulations. The private sector devotes considerable
time and effort to following administrative procedures
and filling out forms. Therefore, the effective use of
ICTs (e.g. using various e-government and auto-
mated solutions) plays a role in improving this rela-
tionship. E-government applications can streamline
processes and make them more efficient. If well im-
plemented, e-government also enhances transpar-
ency, by systemizing and publicizing the procedures
for government interactions, and reduces the scope
for corruption. The likelihood of positive gains from
the introduction of ICT-based solutions increases if
they are implemented as part of broader initiatives to
simplify regulation.
There are many “functional areas” of business environ-
ment reform (DCED, 2008: 14–15), such as (a) simpli-
fying business registration and licensing procedures;
(b) improving tax policies and administration; (c) im-
proving labour laws and administration; (d) improving
the overall quality of regulatory governance; (e) im-
proving land titles, registers and administration; (f) sim-
plifying and speeding up access to commercial courts
and to alternative dispute resolution mechanisms; (g)
broadening public–private dialogue; (h) improving ac-
cess to market information; and (i) enabling better ac-
cess to finance. There are also possibilities for ICTs
to make a difference in areas not explicitly covered in
this chapter, although the scope for beneficial effects
is likely to vary considerably from area to area. Rather
than covering all the areas, the remainder of this sec-
tion gives special attention to the following three: (a)
business registration and licensing; (b) tax administra-
tion; and (c) trade facilitation. Rather than claiming to
be comprehensive, the analysis uses selected exam-
ples to illustrate how ICTs have contributed – or could
Box IV.1. Elements of the business environment
From a policy perspective, three broad subcomponents of the business environment can be identified:
(a) The policy, legal and regulatory framework refers to the range of policies, laws and regulations that affect business
owners – men and women.
(b) Administrative systems refers to the ways in which policies, laws and regulations are enforced, and includes issues
such as governance (public and private, corruption etc.).
(c) National organizational arrangements refers to the ways in which government and business represent themselves
and communicate with each other, and includes the issues of social dialogue and public–private dialogue.
Source: DCED (2008).
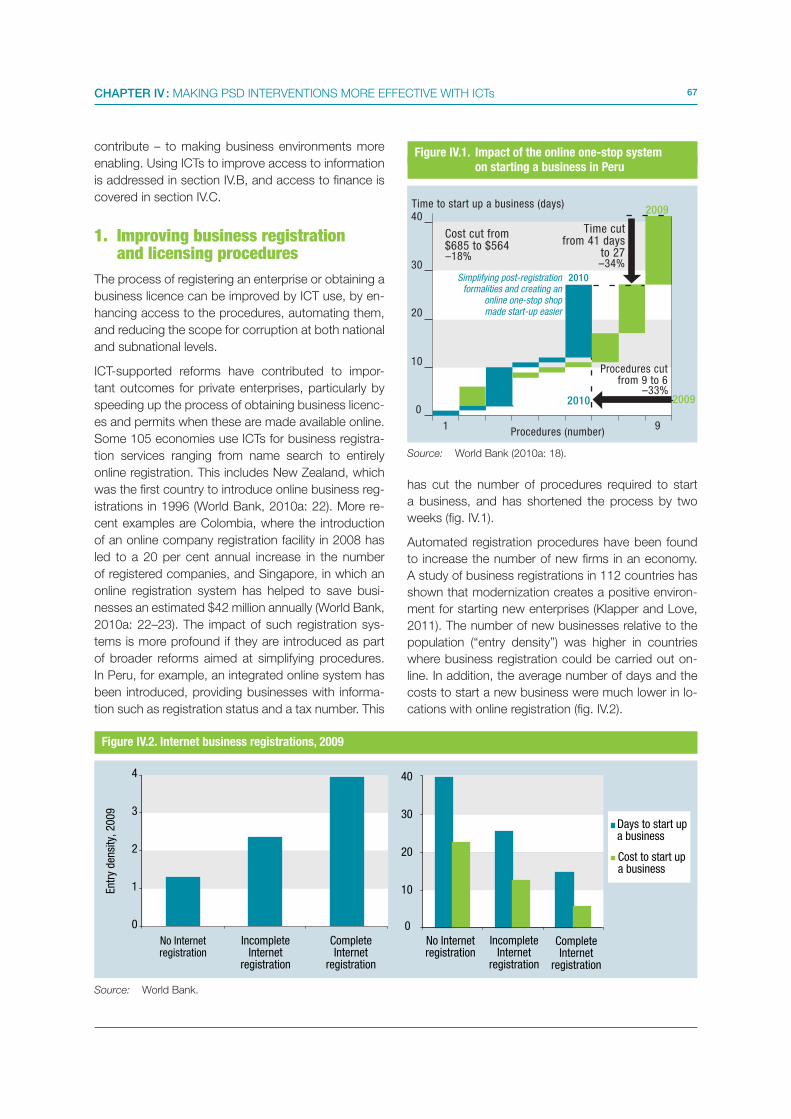
67CHAPTER IV : MAKING PSD INTERVENTIONS MORE EFFECTIVE WITH ICTs
contribute – to making business environments more
enabling. Using ICTs to improve access to information
is addressed in section IV.B, and access to finance is
covered in section IV.C.
1. Improving business registration and licensing procedures
The process of registering an enterprise or obtaining a
business licence can be improved by ICT use, by en-
hancing access to the procedures, automating them,
and reducing the scope for corruption at both national
and subnational levels.
ICT-supported reforms have contributed to impor-
tant outcomes for private enterprises, particularly by
speeding up the process of obtaining business licenc-
es and permits when these are made available online.
Some 105 economies use ICTs for business registra-
tion services ranging from name search to entirely
online registration. This includes New Zealand, which
was the first country to introduce online business reg-
istrations in 1996 (World Bank, 2010a: 22). More re-
cent examples are Colombia, where the introduction
of an online company registration facility in 2008 has
led to a 20 per cent annual increase in the number
of registered companies, and Singapore, in which an
online registration system has helped to save busi-
nesses an estimated $42 million annually (World Bank,
2010a: 22–23). The impact of such registration sys-
tems is more profound if they are introduced as part
of broader reforms aimed at simplifying procedures.
In Peru, for example, an integrated online system has
been introduced, providing businesses with informa-
tion such as registration status and a tax number. This
has cut the number of procedures required to start
a business, and has shortened the process by two
weeks (fig. IV.1).
Automated registration procedures have been found
to increase the number of new firms in an economy.
A study of business registrations in 112 countries has
shown that modernization creates a positive environ-
ment for starting new enterprises (Klapper and Love,
2011). The number of new businesses relative to the
population (“entry density”) was higher in countries
where business registration could be carried out on-
line. In addition, the average number of days and the
costs to start a new business were much lower in lo-
cations with online registration (fig. IV.2).
91
0
20
10
30
40Time to start up a business (days)
2009
20092010
Time cutfrom 41 days
to 27–34%
–33%
–18%
Cost cut from$685 to $564
Procedures cutfrom 9 to 6
Procedures (number)
Simplifying post-registrationformalities and creating an
online one-stop shopmade start-up easier
2010
Figure IV.1. Impact of the online one-stop system on starting a business in Peru
Source: World Bank (2010a: 18).
0
1
2
3
4
No Internetregistration
IncompleteInternet
registration
CompleteInternet
registration
No Internetregistration
IncompleteInternet
registration
CompleteInternet
registration
Entr
y de
nsity
, 200
9
0
10
20
30
40
Days to start upa business
Cost to start upa business
Source: World Bank.
Figure IV.2. Internet business registrations, 2009

68 INFORMATION ECONOMY REPORT 2011
ICTs are also useful in helping to reduce corruption by
making administrative processes more transparent, at
both national and subnational levels. Automating in-
teractions between businesses and the government
limits the scope for human intervention and bribery,
which results in lower business costs. For example,
the introduction of automated processes for several
e-government projects in India was linked directly to
a decline in the incidence of corruption (fig. IV.3). It is
worth highlighting that after the e-government projects
were deployed, bribery reoccurred whenever the sys-
tem was down. In the Philippines, the introduction of
e-governance at the municipality level significantly in-
creased government revenue and shortened the time
needed for obtaining a business licence (box IV.2).
Better regulations, and better access to regulations,
can be an effective way to empower informal-sector
enterprises. While in some cases informality is a con-
scious choice – a decision to avoid taxes and other
obligations – it very often reflects a lack of awareness
of the law or of the ways to comply with the law, or
a lack of capacity to undertake the necessary pro-
cedures. Indeed, burdensome and poorly conceived
Box IV.2. Speeding up business registration at the local level in the Philippines
In many municipalities in the Philippines, it takes 3–5 days or more for a business to secure a permit to operate.
The underlying reasons include excessive red tape and inefficiencies in the manual processing of applications.
The situation is often aggravated by the rent-seeking practices of public officials. All of the above has meant lower
government revenues and higher costs of doing business. Although investing in system informatization can help
municipalities to improve the situation, many local government units lack the know-how and resources to implement
such solutions.
The e-Governance for Municipal Development (eGov4MD) project, which is funded by the Canadian International
Development Agency, is a collaborative initiative between the League of Municipalities of the Philippines, the Mayors
Development Centre, the Canadian Executive Service Organization (CESO), and the Commission on Information and
Communication Technology of the National Computer Centre (CICT-NCC). The project, which started in 2007, is also
supported by the Department of the Interior and Local Government, and by the Department of Trade and Industry
through its regional and provincial offices.
The project aims to improve local governance, increase the efficiency of public service delivery, and raise government
revenues. This is to be achieved by building the capacity of selected e-ready municipalities nationwide, and imple-
menting an open source-based software package consisting of a Real Property Tax System (RPTS), a Business Per-
mit and Licence System (BPLS) and a Treasury Operations Management System (TOMS). The initiative also provides
training for municipal personnel. Advisory services are delivered by CESO’s volunteer advisers.
By early 2011, an enhanced eBPLS had been set up in 75 municipalities. Many of these reported 15 to 150 per cent
increases in business permit revenues, large reductions in application processing times (from 2–3 days down to 1
hour), and increased user satisfaction. A number of the selected local government units had also updated or revised
their revenue codes and streamlined the application process.
From April 2007 to October 2010, participating municipalities invested about PhP 28 million (approx. $636,000) in
ICT hardware, excluding costs for capacity-building. About 40 CESO volunteer advisers were deployed, and 26 mu-
nicipalities received training on eRPTS. More than 400 municipal department heads and staff were trained in open
source technologies, the use of eBPLS, basic software programming, IT planning, and ICT project management. An
NGO was established, comprising all municipal staff trained under the eGov4MD Project, to ensure sustainability and
replication beyond the CESO partnership.
Venturing into e-governance requires long-term political support, institutional maturity, capital investment both in
hardware and human resources, and a well-designed, visionary roadmap. Experience to date has shown the impor-
tance of political leadership in championing the process, from adopting municipal resolutions, sending staff to train-
ings, and allocating resources to procure the IT equipment needed, to having a project management plan.
The vision is that more municipalities will venture into e-governance, which will make them more competitive and
business-friendly. The multi-stakeholder eGov4MD project is founded on a commitment to change. It is an initiative
to break away from the status quo, to reform and to innovate. The League of Municipalities of the Philippines and its
partners are searching for more local government units to join the initiative.
Source: Sagun (2011).

69CHAPTER IV : MAKING PSD INTERVENTIONS MORE EFFECTIVE WITH ICTs
regulations have been found to be a major barrier to
entry into the formal economy.1 Legal empowerment
measures – such as strengthening effective eco-
nomic governance to make it easy and affordable to
set up and operate a business, access markets, and
exit if necessary – are indispensable for potential and
emerging entrepreneurs. Informality narrows the fiscal
space, and represents considerable revenue shortfalls
for State budgets in developing countries. Informal
businesses make little contribution to the government
budget. They pay no registration fees, no licence fees,
no VAT on their sales, no corporate income tax, and
no social contribution for their employees. Unregis-
tered land and dwellings generate no registry or trans-
fer fees, or local taxes. And yet, informal businesses
often have to pay bribes, easily falling victim to officials
who take advantage of informal operators’ status and
lack of awareness. Various e-government solutions
and the effective use of ICTs in communicating with
informal-sector enterprises can make an important
contribution, as was found in an UNCTAD-led initiative
(box IV.3).
2. Improving tax policies and administration
Reforms of the tax administration system in devel-
oping countries typically aim to improve compliance
among MSEs, including in the informal sector. ICTs
have proved to contribute to reforms of tax policies
and procedures through the introduction of electronic
filing of returns, electronic payment of taxes, and the
provision of taxpayer services via the Internet.
In many developing countries, large businesses have
been able to rely on online, IT-based systems for filing
tax returns and making payments. In countries with
widespread access to the Internet and mobile phones,
the expansion of IT-based filing and payment opportu-
0 10 20 30 40
AMC
eSeva
CARD
KAVERI
Bhoomi
Bhoomi (RTC)
Manual Computerized
Percentage
Figure IV.3. Users reporting bribery, computerized versus manual government systems, India, 2006 (percentages)
Source: Adapted from World Bank (2009a).
Box IV.3. UNCTAD’s easy business formalization (micro-legalization) programme
UNCTAD has designed a programme to help Governments implement regulations suited to the needs of MSEs and to
facilitate the formalization of informal businesses, based on international best practice. Advisory and capacity-building
services are offered for:
(a) Inventory and diagnosis of existing regulations applicable to the creation and operation of micro-enterprises (filling
in tax declarations and paying taxes). This may be carried out via online applications such as the eRegulations
system;
(b) Simplification of existing schemes and/or the proposal of new, tailor-made regulations to minimize the number of
steps and requirements for users and to maximize the legal and social benefits;
(c) Organization of internal processing – within and among the administrations involved – with an emphasis on the
use of eGovernment tools. For example, “iCREATOR” is an application that allows entrepreneurs to register their
business online and helps Governments to monitor the flows of documents among the administrations involved.
Smartcards are also used as a way to integrate government services;
(d) Negotiation of partnerships for combined delivery of services with microfinance institutions and other providers of
basic services to the poor;
(e) Drawing up and execution of external communications to raise awareness among micro-enterprises;
(f) Measuring results.
Source: UNCTAD (http://www.eregulations.org).

70 INFORMATION ECONOMY REPORT 2011
nities for the small business community is being con-
sidered. In Latvia, for example, around 20,000 taxpay-
ers (80 per cent of which are SMEs) use a paperless,
web-based secure e-tax declaration system (IFC,
2007a). In 1995, the Bureau of Internal Revenue in the
Philippines introduced payment by mobile phone for
small tax debts. Initially, the project was used for the
payment of business registration fees, and it was sub-
sequently extended to payments of income taxes and
stamp duty (ibid.).
The Rwanda Revenue Authority has embarked on an
initiative to enable businesses, in the future, to submit
tax returns online. To cater for businesses without on-
line facilities, the Authority plans to introduce Internet
kiosks around the country that can be easily accessed
and used by businesses, for a fee. The Authority also
intends to introduce a facility for the online validation of
tax clearance certificates to remove the need for com-
panies to copy and notarize such certificates when
they submit multiple tenders (World Bank, 2010a: 23).
Online filing of taxes saves time for enterprises, and
when the tax process is properly redesigned for auto-
mation, it often results in a reduction of forms and pro-
cedures. Azerbaijan has reformed its tax system and
introduced an online payment system. By September
2008, about 85,000 out of 200,000 active VAT payers
(43 per cent) had switched to the Automated Taxa-
tion Information Service to file and pay their taxes. This
system resulted in the removal of 15 payment proce-
dures, and time savings equivalent to 576 hours per
year (Hacibeyoglu, 2009).
3. Trade facilitation measuresIn a globalizing world economy, a facilitative trade re-
gime is vital for private investment and the develop-
ment of the private sector. In this context, ICT-enabled
solutions can serve an important role.
Development support in this field has typically shifted
from trade-related technical assistance (e.g. export
promotion and trade liberalization) to trade facilitation
(to reduce transaction costs) and promoting aware-
ness and knowledge among national institutions of
the rules, procedures and institutions of the interna-
tional trading system. This is especially important for
growth-oriented firms that seek to expand into broad-
er markets, both regionally and internationally.
Customs administrations play a central role in facili-
tating the smooth handling of exports and imports.
The implementation of modern ICT solutions has sig-
nificantly improved the efficiency of many customs ad-
ministrations. Such solutions facilitate the completion
and processing of customs declarations and other
paperwork associated with importing and exporting.
Electronic customs declarations have been shown to
bring clearance times down and to reduce the time
that goods have to stay at border crossings and in
ports. Most importantly, this leads to a reduction in
costs to business. In addition, government revenue
is boosted through improved collection of taxes. Au-
tomated customs systems, such as the Automated
System for Customs Data (ASYCUDA) (box IV.4), play
an important role in this regard. Moreover, the intro-
duction of ICT-based solutions has helped to remove
opportunities for corruption among customs officials,
by increasing the level of accountability (IFC, 2007c).
ICTs provide audit trails for the monitoring and review
of administrative decisions, and minimize face-to-face
contact between customs personnel and clients.2
Despite the documented success of ASYCUDA and
other automated customs systems, developing coun-
tries (particularly LDCs) continue to face multiple chal-
lenges related to customs automation. Key concerns
include the lack of financial resources for infrastructure
and equipment, insufficient awareness and training,
compliance risks, and resistance to change. In this re-
spect, securing continued support from international
donors is vital in order to ensure further improvements
to trade facilitation efforts in this area.
B. HOW CAN ICTsBE USED TO SUPPORT BUSINESS DEVELOPMENT SERVICES?
The provision of business development services (BDS)
and extension services to rural enterprises can be
made more effective by applying ICTs.3 In the context
of services delivery, ICTs play two important and re-
lated roles: they can be used to extend the reach of
the services offered, and they can reduce the transac-
tion costs associated with the delivery of the services.
BDS and extension services are typically provided
to nascent enterprises to improve their survival rates
and to foster expansion that leads to job creation and
economic growth. As noted in chapter I, many MSEs
in developing economies are confronted with internal
barriers to their operations and growth prospects,

71CHAPTER IV : MAKING PSD INTERVENTIONS MORE EFFECTIVE WITH ICTs
including limited organizational and financial man-
agement skills, and limited business experience and
technical or production skills. In response, a range of
services is offered by various development agencies
to overcome these obstacles.
In the late 1980s and early 1990s, a conceptual dis-
tinction was made between financial and non-financial
services provided to enterprises, in an effort to achieve
greater sustainability through specialization.4 Financial
services referred to the range of financial mechanisms
that are used to help enterprises start up and expand
(e.g. loans, banking services, revolving funds and
microfinance), while non-financial services referred
to virtually everything else. Thus, BDS has come to
embrace the following micro-level development in-
struments: training, counselling and advice, develop-
ing commercial entities, technology development and
transfer, information, and business linkages. Within
each of these, various ICTs have been used to en-
hance outreach and efficiency (Anderson, 2008). Ser-
vices in the BDS field serve small enterprises in much
the same way as agricultural extension workers serve
farmers (Gibson, 1997).
The remainder of this section focuses on the BDS ar-
eas of training, advisory services and market informa-
tion provision – domains in which effective use of ICTs
can make a difference. As shown below, this potential
has most often been realized in the agricultural do-
main.
1. ICT use in training and advisory services
There are several ways in which ICTs can be used to
enhance the delivery of training and advisory services:
(a) making business development toolkits available on-
line; (b) leveraging the Internet to make agricultural ex-
tension services more interactive and participatory; (c)
helping small-scale producers meet certifications and
other requirements, via information systems, in order
to boost exports; and (d) providing mobile-based busi-
ness support services. Regrettably, there is little sys-
tematic evaluation of the effectiveness of ICT use in
these areas. However, reflecting the varying needs and
capabilities of the different beneficiaries of such sup-
port services, it is advisable to explore a range of ICT
tools – including radio, Internet, and mobile telephony.
One way of leveraging ICTs is by making various kinds
of business development toolkits (containing generic
advice, business planning guidance and templates),
as well as self-assessment and business diagnostic
tools, available online. While such standardized tools
Box IV.4. Automated customs to support PSD: the case of ASYCUDA
ASYCUDA is a computerized customs management system that covers most foreign trade procedures. The system
handles customs declarations, accounting procedures, and transit and suspense procedures, thereby generating valu-
able trade data that can be used for statistical economic analysis. The ASYCUDA software, which has been developed
by UNCTAD, takes into account the international codes and standards developed by international bodies, and can be
configured to suit the national characteristics of individual customs regimes. It provides for electronic data interchange
(EDI) between traders and customs in accordance with EDIFACT (EDI for Administration, Commerce and Transport) rules
and in compliance with the World Customs Organization (WCO) Data Model.
ASYCUDA was first developed for West Africa, in response to a request from the secretariat of the Economic Commu-
nity of West African States (ECOWAS) to assist in the compilation of foreign trade statistics in their member States. The
development of this management system has aided the reform of customs clearance processes in many developing
economies and has encouraged the integration of regional economic communities. By the end of 2010, there were some
67 operational ASYCUDA technical assistance projects, and the programme was present in 90 countries, 41 of which
were in Africa.
In Madagascar, the new TradeNet system connects trade organizations, using the ASYCUDA platform to share informa-
tion and transmit documents electronically (Fjeldsted, 2009). The results included a reduction of three weeks for importing
a container and 72 hours in customs clearance time. Customs receipts doubled, and corruption was reduced. Similarly, in
Liberia, ASYCUDA first came into use at the end of 2009. Between December of that year and October 2010, port transit
time fell from 49.7 days on average to only 3.8 days. Moreover, one year after the introduction of the automated system,
the monthly revenue collected had increased by more than 50 per cent.a
Source: UNCTAD.a Comparisons between December 2009–February 2010 and December 2010–February 2011.

72 INFORMATION ECONOMY REPORT 2011
can serve a useful role in informing the user about
relevant areas of business development, PSD prac-
titioners need to be wary of the risks of supply-ori-
ented services and the delivery of programmes that
do not respond to a clearly defined demand.5 A study
of Internet-based business support services for small
businesses in Cape Town, South Africa, found a dis-
crepancy between the views of the agencies involved
in providing the services and those of the beneficiaries
(Mitrovic and Bytheway, 2011). Although the providers
were able to point to a number of outputs (such as
numbers of visitors to websites, attendees at work-
shops), they lacked awareness of the actual impact
on business performance that had come about as a
result of the services extended. Many enterprises in-
terviewed were also unaware of the services that were
available, and those that were aware of the services
found them to be ineffective in delivering benefits.
Many agricultural extension services have leveraged
the Internet as a way to increase interactivity and par-
ticipation (Richardson, 2003). Internet-based services
might be more successful at making support services
available via local sector-specific intermediaries, rath-
er than directly. Indeed, there have been many failed
attempts at reaching the poor through web-based
solutions, especially in countries with limited Internet
penetration and low levels of literacy (De Silva and
Ratnadiwakara, 2009).
Some extension services draw on a combination of
ICT tools. The Collecting and Exchange of Local Agri-
cultural Content (CELAC) project, for example, seeks
to share good practice in the areas of crop and ani-
mal farming to farmers in seven districts of Uganda.6 It
uses SMS (text messages), as well as other multime-
dia communications including online and hard-copy
newsletters. The use of community radio call-in pro-
grammes is integrated into the service, as is the use
of drama on videocassette and DVD to portray farm-
ing practices and challenges encountered in farming
(UNCTAD, 2010). In the Plurinational State of Bolivia,
a daily radio programme gives information about pro-
duction technologies and the treatment of diseases,
on the basis of listener requests sent via telephone
and chat. Selected information is also available on
request via an SMS service which is currently being
used by a pilot group of 1,000 persons, including, in
particular, SMEs and traders.7
ICTs can also be used to help small-scale producers
meet certification and other requirements in order to
boost exports. ICTs are helping the Organic Produc-
ers and Processors Association of Zambia (OPPAZ) to
enhance its ability to respond to increasing demand
for high-priced ecological products. With support from
the International Institute for Communication and De-
velopment (IICD), OPPAZ implemented a database in
2009 containing information required for organic cer-
tification (e.g. volumes, quality, inputs, and production
methods). Farm inspectors now use hand-held mobile
devices with GPS to collect data and produce accurate
maps of the plots monitored. The organic producers’
association in the Plurinational State of Bolivia (Asoci-
ación de Organizaciones de Productores Ecológicos
de Bolivia (AOPEB)), in the same year, introduced an
ICT-enabled solution to support its internal certification
system for 35,000 organic producers. In this case,
trained producers collect field data using a laptop that
has mobile Internet and connects to a central data-
base at headquarters. While the complexity and high
costs of collecting data often impede the participation
of smaller-scale producers, the use of ICTs has made
the certification more effective and efficient. Some 75
per cent of the participants found that both certifica-
tion costs and the time needed in order to comply with
the certification requirements had fallen considerably.
About 70 per cent of the participants found that prices
and incomes had increased as a direct result of ICT
use, and OPPAZ and AOPEB both experienced a 20
per cent increase in their membership.8
The rapid growth of mobile access suggests significant
potential for mobile-based business support services.
In the Information Economy Report 2010, the Jigya-
sha 7676 helpline was highlighted as a successful,
demand-driven approach to providing advisory ser-
vices to small-scale famers in Bangladesh. This initia-
tive was developed jointly by Banglalink – the second-
largest mobile operator in Bangladesh – and Katalyst
(UNCTAD, 2010: 103). A review of African countries
found a range of related initiatives delivering various
forms of support services to small enterprises, small
farms and the self-employed via mobile telephones
(Donner, 2009). The study concluded that there were
more services targeting agriculture than small enter-
prises; in fact, it found no instances of mobile-based
BDS to non-agricultural enterprises. The same study
mentioned Kenya’s National Farmers Information Ser-
vice, which invites farmers to call in on their mobile
phones to interact via voice menus with a database
with answers frequently asked questions. As in the
case of Jigyasha 7676, the content is tailored to the
specific needs of the users, and the communication
costs are borne by the farmer.9

73CHAPTER IV : MAKING PSD INTERVENTIONS MORE EFFECTIVE WITH ICTs
In Uganda, the Community Knowledge Worker ini-
tiative, supported by the Grameen Foundation, pro-
vides advice to farmers via the Internet and mobile
phones. Farmers can visit the community knowledge
worker closest to them to access crucial information
about best practices in farming (as well as information
about market prices and the weather). The commu-
nity knowledge worker sends an SMS-based query or
uses a custom-built application to query a database
directly from a mobile phone. The content is provided
by agriculture research organizations and is reviewed
by a panel of experts. There are currently 98 com-
munity knowledge workers, each of whom reaches
between 500 and 1,000 farmer households.10
One critical area in which small-scale farmers look for
advice is plant protection, to save crops from diseas-
es and pests. Smallholder farmers are often unaware
of plant diseases or are unable to accurately assess
them. Among other things, plant diseases reduce ag-
ricultural productivity and raise costs. By using mobile
phones and radio frequency identification technology
(RFID), it is now possible to provide farmers with bet-
ter knowledge regarding what diseases or pests to
monitor, and how to respond if these are found. New
technological solutions can help small-scale produc-
ers to identify, track and protect their crops, animals
and livelihoods. To give some examples, ICTs are be-
ing used for locust surveillance from Mauritania to In-
dia, for cassava disease management in central Af-
rica, and for large-scale pest reporting in Uganda and
the United Republic of Tanzania – with positive results
(box IV.5).
In order for projects that aim at providing advisory ser-
vices for rural enterprise development to be effective,
and to ensure that relevant knowledge and expertise
is represented, working in some form of partnership
is often recommendable. Large and small agricul-
tural firms alike have an interest in controlling water,
diseases and pests, and therefore often also have
an interest in partnering with government agencies.
Meanwhile, rural communities themselves already
have considerable complementary knowledge. Vast
differences in ecological and agronomic conditions
make farmers’ knowledge indispensable for projects
to improve smallholders’ productivity. As in the case
of the Digital Early Warning Network (box IV.5), ICTs
enable two-way communication, ensuring that local
knowledge is acquired and utilized appropriately. In
addition to creating opportunities for information and
knowledge dissemination, they offer ways of capturing
local expertise.
Rigorous impact evaluations of the effectiveness of
ICT-enabled agricultural extension work are rare and
much needed (Aker, 2010). However, a recent study
has looked specifically at the effects of ICT use on
such services to marginalized farmers in rural India
(Fu and Aktar, 2011). In this case, the delivery of ag-
ricultural extension services involved using GPRS-
compatible phones and employing village workers
(local youths known as “munnas”) to speedily com-
municate Short Dialogue Strips (audiovisual dia-
logues between agricultural experts and farmers on
local agricultural problems, issues and knowledge).
Detailed analysis has shown that, as a result of this
approach, farmers have gained in awareness and
agricultural knowledge. Over 75 per cent of farmers
said that mobile phone-assisted services were use-
ful, over 86 per cent viewed these services as faster
than the agricultural services that were previously
available, and over 96 per cent were using more ag-
ricultural advice since they had been exposed to the
new mobile-based services.
Box IV.5. Fighting pests and diseases: the case of the Digital Early Warning Network
The eradication of pests requires large-scale, collective efforts, which can be facilitated by ICTs. In the Lake Zone of
the United Republic of Tanzania, farmers from ten districts have been participating in the Digital Early Warning Network,
which has trained them to recognize the symptoms of cassava mosaic disease and cassava brown streak disease. The
network is part of the Great Lakes Cassava Initiative, which aims to improve the livelihoods of more than a million farmers
in six countries of the Great Lakes region. Armed with mobile phones, these farmers now “crowd source”, or send out
monthly text messages to researchers, about disease incidence. In return, they receive advice on how to cope with the
disease. When more than 10 per cent of the members of a group spot a disease that was not present previously (or that
has become more prevalent), a project team visits the area to verify the information and advise farmers on what steps to
take. Each group of farmers is given a topped-up phone card that is used to send the text messages. The groups meet
monthly to discuss observations and share experiences.
Source: Information provided by FAO and IFAD.

74 INFORMATION ECONOMY REPORT 2011
There is a lack of systematic evidence on the inci-
dence of ICT-based training, advisory and extension
services to urban and rural enterprises, and even less
information on the impact of such initiatives. Neverthe-
less, based on anecdotal evidence and the few im-
pact assessments that have been carried out, some
preliminary observations can be made. Firstly, there is
scope for many more training and advisory projects
to make use of ICT-based solutions. Secondly, such
projects are likely to be more effective if the intended
users are consulted during the design and implemen-
tation phases. In general, the more that services are
tailored to the precise needs of their beneficiaries, the
more valuable they are. Thirdly, there is an advantage
in forming partnerships between relevant stakehold-
ers. Involvement by the private sector in the provision
of training and advisory services can help ensure that
the services offered are demand-driven (Committee
of Donor Agencies for Small Enterprise Development,
2001).
2. Enhancing access to relevant information
The area of business development services where
ICT applications have been used the most is in the
provision of information about the market. In this area
too, most of the focus has been placed on informa-
tion related to agricultural enterprise, typically with the
goal of helping farmers to transition from subsistence
to commercial agriculture (Okello, forthcoming). Given
the prevalence of poor people in the rural areas of low-
income countries, such services may be of particular
relevance from a poverty reduction perspective (UNC-
TAD, 2010).
Better access to market information has been found
to help small-scale farmers improve their productiv-
ity and to support other rural entrepreneurs along the
agricultural value chain (UNCTAD, 2010). ICT use in-
creases the chances of essential information reach-
ing farmers when they need it, which enables them
to make better-informed decisions, and to adjust their
practices and optimize their use of scarce resources
(see, for example, box IV.6). In addition, ICT solutions
are allowing Governments and development partners
to monitor agricultural productivity and rural enterprise
development, make more accurate projections, and
improve planning. Some of the more innovative de-
velopments are found in Africa. The potential of ICTs
for enhancing access to information is illustrated here
by looking at some examples from Africa, namely
ZNFU4455 in Zambia, the Ethiopia Commodity Ex-
change and the Kenya Agricultural Commodity Ex-
change, and Kenya’s DrumNet projects.
a. Making markets work better: the case
of rural enterprises in Zambia11
ZNFU4455 is a market information service in Zambia
that is open to all smallholder producers and traders.
Launched in 2006 by the Government of Zambia, with
assistance from the International Fund for Agricultural
Development (IFAD) and in cooperation with the Zam-
bia National Farmers’ Union (ZNFU), the service pro-
vides accurate and up-to-date agricultural and market
information reported by the buyers and covering the
entire value chain. This allows smallholder produc-
ers to make better-informed decisions about what to
grow, the volumes required, storage, processing, mar-
keting, and investment opportunities.
Its main objective is to make markets work better for
smallholder producers and traders. The service cov-
ers 180 traders and their offers for 15 commodities.
To find the best available price, producers and traders
send an SMS to 4455 containing the first four letters
of the commodity and the relevant district or prov-
ince. They immediately receive a text message with
the best prices and with codes designating the po-
Box IV.6. Using multiple ICTs to provide market information to 300,000 producers and entrepreneurs in the Plurinational State of Bolivia
In the Plurinational State of Bolivia, an ICT programme run by the Government of the Department of Santa Cruz reaches
out to producers, traders and companies using a combination of Internet, radio and mobile services. Thanks to this in-
tegrated approach and the widespread dissemination, the ICT programme has become a reference point for all actors
along the value chain – i.e. small-scale producers, SMEs, and large-scale traders and supermarkets – enabling them to
make better-informed business decisions. Around 60 per cent of the beneficiaries have indicated that they now know bet-
ter where to sell, and 45 per cent feel that they are able to negotiate better prices and improve their income. Households
also use the information to choose the lowest-priced products on the market.
Source: IICD.

75CHAPTER IV : MAKING PSD INTERVENTIONS MORE EFFECTIVE WITH ICTs
tential buyers. After selecting a bid, the farmer sends
a second SMS with the buyer’s code. The farmer then
receives a text message containing the buyer’s name
and phone number. Finally, the farmer phones the
buyer directly and starts trading. Each message costs
about $0.15. The service is easy to understand and
use, and it provides information upon request rather
than pushing content onto farmers.
This demand-driven service has improved market ef-
ficiency. Its business model rests on revenues gener-
ated from advertisements and sponsorships, and it
leverages several different ICTs including SMS, Inter-
net and radio. The radio programme is broadcast in
English as well as seven local languages. Importantly,
ZNFU4455 enjoys full government support, and is
now an integral part of the national agricultural policy.
Zambia’s good mobile phone coverage in rural areas,
and the fact that the service is hosted in a credible
institution such as ZNFU, have contributed to its suc-
cess. Since its launch in August 2006, ZNFU4455
appears to have strengthened the bargaining power
of smallholder producers, by providing them with bet-
ter access to markets and allowing them to deal with
traders on a more equal footing. Farmers also benefit
from lower transaction costs, and by producing high-
er-value outputs, reaching wider markets, and avoid-
ing overproduction. Meanwhile, policymakers in Zam-
bia have benefited from more up-to-date information,
which is used to identify trends in the price fluctuations
and to flag food-security challenges.
b. Ethiopia Commodity Exchange:
revolutionizing Ethiopian farming12
The Ethiopia Commodity Exchange (ECX) was
launched in 2008. Through the use of ICTs, it is con-
tributing to making agricultural practices in the coun-
try more productive. The ECX is seeking to create
an integrated agricultural information system, using
ICTs to disseminate data and information to farmers
across the country and to establish a database with
up-to-date world market prices on commodities. This
ICT-based marketplace serves the entire value chain:
farmers, traders, processors, exporters and consum-
ers.
Agricultural markets in Ethiopia have been character-
ized by high transaction costs and risks. With only a
third of output reaching the market, commodity buy-
ers and sellers have traditionally only traded with peo-
ple they know. Trade took place on the basis of visual
inspection, as there was no way of assuring product
quality or quantity. This drove up market costs as well
as consumer prices. Small-scale farmers, who ac-
count for 95 per cent of Ethiopia’s agricultural output,
came to the market with little information, and were
at the mercy of merchants in the markets they knew,
poorly equipped to negotiate prices or reduce their
risk.
The new exchange, which is a partnership of mar-
ket actors, the Members of the Exchange and the
Government of Ethiopia, automated the system from
beginning to end, from warehousing to clearing and
settlement of payments to the delivery of commodi-
ties. By bringing integrity, security and efficiency to the
market, the exchange has become visible throughout
the supply chain, resulting in real-time price trans-
mission, improvements in the quality of exports, and
better returns for farmers. During its first 1,000 days,
ECX traded over a billion dollars worth of commodi-
ties, including four million bags of goods handled and
delivered. It processed 69,000 transactions involving
450 ECX members.13
ECX traders now have an incentive to win local pro-
ducers as clients and to provide information to them
about how to benefit from the market. Whereas pro-
ducers previously had an incentive to degrade the
quality of their produce by adding water or even dirt
to increase its weight, the dissemination of information
about the new quality system and the possibilities of
getting higher prices for better quality have led to a
significant increase in the supply of high-quality coffee,
and also sesame.
Price information from the exchange is transmitted to
local farmers through several ICT channels. ECX uses
SMS, Interactive Voice Receiver (IVR) services, com-
munity information centres, electronic display boards,
and its own website, as well as traditional media such
as radio, television and the print media. Although
knowing about prices does not automatically give
small-scale farmers a competitive advantage, better
access to information implies a reduced disadvantage
vis-à-vis more informed market players. Enhanced
market transparency has made small-scale farmers
better able to negotiate prices. They can now also get
a market premium for adding value to their products,
and are no longer restricted or captive to local mar-
kets. Farmers are now also able to use future prices
for planting decisions and for collateral.
76 INFORMATION ECONOMY REPORT 2011
c. DrumNet and KACE: two Kenyan market
information services14
The DrumNet and Kenya Agricultural Commodity Ex-
change (KACE) projects are two market information
services in Kenya that operate in overlapping areas
but differ in terms of geographic coverage. DrumNet
consists of projects implemented in two Kenyan prov-
inces and focuses on sunflowers and French beans.
KACE has nationwide coverage. The impact of both
services was recently assessed in an independent
study.
The DrumNet project was launched in 2003, with the
primary objective of shortening the value chain of tar-
geted commodities and improving farmers’ revenues.
It aimed to replace numerous intermediaries by us-
ing a mobile phone-based platform to provide mar-
ket information to the project’s partners. The partners
include farmers organized into smallholder farmer
groups averaging 30 members per group, a financial
organization (Equity Bank), a buyer, and an agro-input
dealer. The farmers in western Kenya grow sunflowers
for sale to Bidco Oil Ltd., while the farmers in central
Kenya grow French beans for sale to Kenya Horticul-
tural Exporters, a leading exporter of fresh produce.
In both the central and western regions, produc-
tion and market information is sent via an SMS from
DrumNet’s central computer-based platform in Nairobi
(Okello et al., 2010). Smallholder farmers participat-
ing in the project pay a commission to DrumNet in
return for agricultural information and other services.
The fees are recovered upon sale of the beans or sun-
flowers. The link between farmers and DrumNet goes
through a member selected by the group to act as
“transaction agent”. Information from DrumNet is then
sent via SMS to the agent, who is expected to relay
it to the members. The agent also confirms by SMS
to DrumNet that the information has actually reached
the group.
The KACE project was first launched in 1996 as a
commodity exchange with an auction floor located
in Nairobi. Its goal was to provide a forum to bring
sellers (farmers) and buyers together, and thereby
to eliminate the many intermediaries and reduce the
transaction costs. The commodities traded included
staple and non-staple food crops, livestock, livestock
products and cash crops. In 1998, KACE launched a
website through which subscribing buyers and sellers
could place bids for commodities. The company also
initiated a mobile phone-based information-provision
programme with nationwide coverage. By means of
this service, sellers (farmers) and buyers have been
able to obtain commodity prices in different markets
by sending an SMS to KACE at a cost of K Sh 5
(about $0.05). Furthermore, KACE runs a nationwide
radio programme which allows buyers and sellers to
offer bids for commodities during the broadcast.
KACE has a team of people who collect prices from
wholesalers at different times in the morning. The data
collected are sent (usually by e-mail) to KACE’s head
office in Nairobi, which processes the information
and publishes average prices for major markets on
its website and computer-based platform. The prices
for each day become available for download from the
website or via SMS at about noon each day. KACE
also runs market information points under franchise
in some major towns in western Kenya. Each market
information point has a computer with an Internet con-
nection, and hence can be used by farmers (sellers)
and buyers to download information.
An assessment of these two projects found that both
had generated a number of benefits for the farmers
involved:
(a) DrumNet members had achieved significantly
higher sales volumes and agricultural income
than their counterparts.
(b) Farmers using the KACE services were
spending significantly less on travel and search
costs than those who had not used these
services.
(c) Participation in ICT-based projects had
improved market access/commercialization
and had led to more efficient use of agricultural
inputs.
(d) Furthermore, the use of ICT tools had led to
an overall improvement in market efficiency,
as indicated by lower margins being paid to
intermediate traders in areas where ICT tools
were being used.
Both projects faced challenges in terms of financial
sustainability. The poor economic status of farmers
sometimes encouraged them to engage in opportu-
nistic behaviour that undermined project sustainability.
Moreover, certain factors related to the physical envi-
ronment reinforced this tendency, further affecting the
project’s ability to recover its loans and performance.
In addition, inflexible business regulations and the
lack of an enforceable legal framework also worked
against the projects. The study suggested that in order
to ensure long-term sustainability, an enabling socio-

77CHAPTER IV : MAKING PSD INTERVENTIONS MORE EFFECTIVE WITH ICTs
economic environment, a supporting legal framework,
and flexible strategies were needed.
3. Concluding observationsIn summary, the use of ICTs to extend the reach of
BDS to nascent and growing enterprises appears to
be expanding, but from a low level. This practice is
more developed in agriculture than in other sectors,
but even in agriculture there is room for greater use of
ICT-based solutions.
In the case of ICT use to make training and advisory
services more effective, the results from the studies
available underline the importance of tailoring the ser-
vices to the precise needs of the beneficiaries. This
makes it essential to develop a good understanding of
the situation of the enterprises concerned and to in-
volve them in project design and implementation. The
various examples cited above also show the power of
using a combination of different ICT tools rather than
opting for any single technical solution. This is par-
ticularly important in low-income countries character-
ized by varying levels of connectivity and by dissimilar
capabilities and needs among enterprises. Projects
that make use of broadcast media, such as radio, are
particularly appreciated by people who have less ca-
pacity to read. More educated users indicate greater
satisfaction with projects that utilize computers and
the Internet. Broadcast media and mobile phones re-
main vital for reaching out to less privileged members
of society.
The expanding use of mobile phones among MSEs
offers considerable scope for the delivery of BDS, in-
cluding to rural enterprises, and for the use of mobile
phones in combination with other ICT tools. There are
good reasons for BDS providers to explore this field
further to expand their client base and to reduce the
costs of delivering relevant services. More services
could be built around text messaging, such as allow-
ing entrepreneurs to (a) ask for information about pub-
lic services and to comment on them; (b) make pay-
ments of fees and taxes; and (c) receive alerts about
weather forecasts and market prices. This approach
is conducive to making services more demand-driven
and tailored to specific needs of users. At the same
time, more research and rigorous impact assess-
ments are needed, in order to identify best practices
in terms of ICT use geared towards enhancing the ef-
fectiveness of BDS.
C. HOW CAN ICTs BE USED TO ENHANCE ACCESS TO FINANCE?
Limited access to finance is one of the most frequently
mentioned barriers to the growth and competitiveness
of MSEs (e.g. Schiffer and Weder, 2001; CGAP, 2010;
IADB, 2011b: chapter I). There are many reasons for
this situation, including policy distortions in the finan-
cial sector, lack of know-how in banks, information
asymmetries, and the relatively high risk associated
with MSE operations (Mohini et al., 2006). MSEs gen-
erally face greater difficulties in obtaining credit than
larger enterprises (Beck, Demirgüç-Kunt and Maksi-
movic, 2002), and the problem is most accentuated in
economies with poorly developed capital and financial
markets and with a large proportion of unbanked, or
underbanked, people and enterpreneurs. An improve-
ment to the financial system that would help to relax
some of the limitations on accessing finance would
therefore be particularly beneficial for MSEs.
ICTs may play a role in this context. The emergence
of mobile money systems is creating new possibilities
for MSEs to access financial resources at reduced
cost.15 Firstly, the introduction of mobile money sys-
tems makes it possible for MSEs to receive and trans-
fer – in real time – very small amounts of funds at low
cost across long distances (even internationally). In
this way, mobile money can act as a lubricant in the
economy and can contribute to a more efficient al-
location of available capital by enabling funds to flow
wherever they are most needed. Secondly, mobile
financial services can offer a way to bring down the
otherwise high transactions costs related to the pro-
cessing and administration of small loans, and thereby
alleviate a significant disincentive for banks and other
lenders to extend credit to MSEs. The introduction of
various kinds of mobile money systems has potential
implications for banks and microfinance institutions
(MFIs), and also for other lending sources. It also rais-
es several policy issues. The following sections exam-
ine these possibilities in further detail.
1. Mobile money services As noted in chapter II, mobile money deployments in
developing countries are spreading rapidly. These are
still early days for mobile money services, which makes
it difficult to assess the potential of this phenomenon.
In fact, out of the known deployments, more than half
have been launched either in 2010 or in 2011, and
78 INFORMATION ECONOMY REPORT 2011
many more are expected to be introduced in the near
future. Most deployments were introduced with the
primary goal of offering person-to-person transfers,
rather than targeting businesses. Moreover, as most
MSEs in low-income countries remain excluded from
the formal financial sector, retail banks and mobile op-
erators have little knowledge of their financial needs
(Bångens and Söderberg, 2011). Thus, there is still
limited information with regard to the impact of such
schemes on the performance of MSEs.
The nature of the services offered by the various exist-
ing and planned schemes differs considerably. Three
broad categories of services can be distinguished,
from basic to more sophisticated ones: (a) money
transfer services (domestic and/or international); (b)
payment services (for airtime top-ups, bills, salaries,
and other goods and services); and (c) financial ser-
vices (savings, credit, insurance). Domestic money
transfers, airtime and bill payments are the three most
common services currently offered. Relatively few de-
ployments cater for transactions such as repayments
of loans from MFIs (section IV.C.2) or international
money transfers (section IV.C.3). However, much inno-
vation is under way, and many new types of services
are emerging.
Even basic money transfer or payment functions can
have a major impact on the way in which MSEs oper-
ate. The value chain for MSEs often involves providers
across a dispersed geographic area, making the abil-
ity to transfer money efficiently of critical importance
in order for an enterprise to be able to manage its
cash flow and expedite the fulfilment of supplies and
goods. In the absence of mobile money transfers, an
entrepreneur in a low-income economy may have to
choose from a number of less competitive options,
such as the following (Bångens and Söderberg, 2011:
chapter II):
(a) Traditional money transfers via Western Union,
MoneyGram, banks, and post operators,
which are often considered expensive and/or
inconvenient;
(b) Informal or local solutions, such as sending
funds by bus, which can be costly, and unsafe
due to the risk of theft; or
(c) Delivering the money in person.
In addition, the mobile money system approach
makes it possible to move funds in real time, when
the need arises, rather than in the form of lump sums
of cash that have to be amassed before a planned
transfer can take place. This feature is significant for
entrepreneurs who make business transactions with
buyers or suppliers in distant regions.
Several business models are used to supply mobile
money services. Firstly, the mobile phone may be
used as an additional channel (in the same way that
users can access their accounts via the Internet),
as in Mexico (box IV.7). This approach tends to face
lower regulatory barriers, but may be less successful
in reaching the unbanked. Secondly, some services
allow users to load money into an electronic account
operated through a mobile phone that can store,
transfer or redeem value, with limited involvement by
banks (the electronic money account is operated by
the mobile network operator). The M-PESA system in
Kenya is an example of such a scheme. Thirdly, there
may be combinations of the first two options, as in
the case of SMART, in the Philippines. Fourthly, a third
party may provide an electronic account that can be
operated via a mobile phone or by using a prepaid
card. While this approach has so far had little traction
(Germany, BMZ and GIZ, 2011), some examples are
emerging. Yo! Payments is a mobile payments aggre-
gation service in Uganda which enables businesses
to receive payments from their customers via mobile
money, and to make mobile money payments to any
mobile money account holder. It aims to interconnect
all mobile money providers and financial institutions
worldwide and to provide Yo! Payments account hold-
ers with a unified method of receiving payments from
any customer who has a subscription to any mobile
money service provider or has a bank account.16
What model is implemented depends – among other
things – on the relative market power of the different
telecom and financial players, the nature of the ser-
vices to be provided, and the regulatory environment.
In Africa, MNO-led initiatives predominate, due to low
levels of banking penetration and high levels of mobile
penetration. In Latin America, card and point of sale
(POS)-based approaches (banking agents equipped
with POS terminals where customers can use their
bank cards, generally prepaid) are more common. In
Asia, third party-led models (either card- or phone-
based) often operate under the licence of a partner
bank (Germany, BMZ and GIZ, 2011).
As the network of people and enterprises using mo-
bile phones to make financial transactions expands,
and the platform becomes pervasive, the demand for
services to extend beyond transfers grows too. From
the perspective of MSEs, mobile solutions may be of
interest, for example to handle merchant, bill and sal-

79CHAPTER IV : MAKING PSD INTERVENTIONS MORE EFFECTIVE WITH ICTs
ary payments (box IV.8). In terms of rolling out more
sophisticated financial services – especially credit,
savings and insurance – MNOs will need to partner
with banks, MFIs, insurance companies, or other insti-
tutions that have the expertise and a licence to deliver
such products. For banks, the main driver for offering
mobile money services may be to expand outreach,
acquire customers and reduce costs, while mobile
operators see it as a way of strengthening customer
loyalty, and, to a lesser extent, increasing ARPU and
acquiring new customers (Germany, BMZ and GIZ
2011).
Box IV.7. Mobile financial services in Mexico: opportunities and challenges
Mobile financial services are still at a nascent stage in Mexico, but the market holds significant potential for their applica-
tion. In contrast to the case of Kenya, mobile financial services in Mexico are being introduced by the banks rather than
by the mobile network operators (MNOs). The Government has made significant reforms that seek to leverage mobile
phones and third-party agents (banking agents or “corresponsales”) for enhanced financial inclusion. To this end, the new
regulatory framework enables financial institutions to develop transactional accounts targeting low-income customers
and to use third-party agents to serve those segments. These accounts could be linked to a mobile phone in order to use
it as a transactional channel. The use of mobile phones for money transactions is still limited, though this may change as
mobile financial services develop.
In 2010, Mexico had a mobile penetration of 81 subscriptions per 100 inhabitants (annex table II.1). Less than 60 per
cent of the population have a bank account (Mexico, Ministry of Finance, 2011), and 57 per cent of municipalities lack a
presence of any kind by a formal financial services provider (either commercial, development, microcredit, or cooperative
banks) (CNBV, 2010). In addition, many households (particularly those with low incomes) receive remittances but have
limited access to financial services. Internet banking has yet to become widely adopted; only 12 per cent of Internet users
with a bank account currently use Internet banking (CNBV, 2010). Thus, there should be opportunities for mobile ap-
plications to help expand the geographical and functional coverage of financial services and to reduce operational costs
associated with financial transactions.
The new regulatory framework developed in 2009–2010 establishes improved conditions for financial inclusion. Firstly,
it enables the use of third-party “banking agents”, and secondly, it enables “niche” banks to emerge, which can take
deposits leveraging the development of e-payments. The new framework opens the possibility for conducting small
financial transactions through accounts linked to a mobile phone number. Additionally, this new regulation also enables
four different types of accounts with proportional know-your-customer requirements for account opening commensurate
with the level of risk. Specific information on these new account types (based on transactional level and requirements for
identification) are expected to be released during 2011.
The current regulatory framework allows for shared business models where MNOs provide the operative platform. How-
ever, it does not permit MNOs to offer financial services. Deposit-taking (be it redeemable or for the purposes of pay-
ments) remains a banking activity. Some new business models are emerging to leverage mobile networks:
(a) Government welfare transfers through point of sales terminals located in hundreds of community shops (affiliated
to Diconsa, a government agency that supports the distribution of basic goods). Bansefi, a national development
bank focusing on low-income customers, distributes government aid through these shops, using a card storing
digital fingerprints together with wireless point of sales terminals.
(b) A banking institution and the national energy company are partnering in order to provide customers with electronic
accounts that can be operated via a smart card (for point of sale payments and automatic teller machines) or via
mobile phones to make low-value transaction payments.
(c) As at April 2011, four banks were providing mobile services (as an added service feature) to their existing clients,
who in most cases already have Internet banking services. Mobile transactions are managed using a traditional
electronic funds transfer linked to a debit account number rather than to the mobile phone number.
In order for the development of mobile payments and Internet banking to play a bigger role for small-scale businesses and
entrepreneurs, the design of future mobile money services will need to take advantage of the new regulatory framework.
It will also require detailed information on their actual access, their use, and their needs.
Source: UNCTAD, based on Chatain et al. (2011), CGAP and Dalberg Global Development Advisers (2010), CGAP
(2009a), and interviews in Mexico with CNBV and experts from the private sector and civil society.
a SOFIPOS is short for Sociedades Financieras Populares (popular financing companies).
80 INFORMATION ECONOMY REPORT 2011
2. Mobile solutions to international remittances
International remittances represent a potentially impor-
tant source of finance for MSEs that are inadequately
serviced by the formal capital markets. In 2009, official-
ly recorded flows totalled over $414 billion worldwide,
of which more than three quarters ($316 billion) went
to developing countries. In more than 20 countries, re-
mittances accounted for over 10 per cent of GDP; and
in 10 of these countries they accounted for over 20
per cent of GDP.17 Recent research has found that the
high costs associated with international remittances,
especially those that are sent to sub-Saharan Africa,
are likely to be reducing the amounts transmitted as
well as their development impact (AfDB and World
Bank, 2011). High costs are often the result of exclu-
sivity agreements between banks or post offices and
international money transfer companies, low levels of
financial market development, and the small number
of companies that are engaged in remittance transfers.
Some evidence suggests that remittance flows can
have a positive effect on business investment and
entrepreneurial activities (AfDB and World Bank,
2011: 63):
(a) In urban Mexico, about one fifth of the
capital invested by 6,000 microenterprises
was financed by remittances (Woodruff and
Zenteno, 2001);
(b) In rural Pakistan, the propensity to invest in
agricultural land has increased with international
remittances (Adams, 1998);
Box IV.8. Mobile money services for MSEs in Africa: the case of Orange Money
Orange Money is one of the providers of mobile money in Africa, and has been launched in six countries, namely Côte
d’Ivoire, Kenya, Madagascar, Mali, Niger and Senegal. There are plans to extend such services to all countries where
Orange has obtained a licence to provide mobile telephony.
The nature of the services offered by Orange Money varies by country, reflecting the local market situation and the bank–
Orange partnership. According to the company, Orange Money is the market leader in four of the six countries, and is in
second position in Niger and fourth position in Kenya. In the latter market, where Safaricom (M-PESA) has a dominant
position, Orange has decided to offer an out-of-the-ordinary service and has therefore partnered with Equity Bank to
develop an Orange Money account, called Iko-Pesa, that is linked directly to a bank account. This account allows con-
sumers to load and send money, and to deposit it and withdraw it into/out of their Equity bank account, and also to apply
for, process and receive loans, via their mobile phones. Subscribers can also use this system to pay utility bills and to buy
consumer goods from certain retail stores.
For the mobile operator, revenue is generated directly from the use of the mobile money services offered. There can also
be indirect revenues, as a result of greater customer loyalty or by attracting new clients. Various service applications are
of potential interest to MSEs:
(a) Money transfers from buyers to suppliers can save travel time, reduce transaction costs, and reduce the need to
move around with cash.
(b) Differentiated accounts can allow companies to accommodate B2B use, by allowing larger amounts to be stored
or transferred with the Orange Money Account. This solution requires agreement from the central bank.
(c) Merchant payments, for which there is always a cost involved. Some merchants have to pay to obtain cash. If they
can use electronic payments, costs can be reduced and they can avoid moving cash around. Merchant payments
may be relevant for very small restaurants, as well as for large enterprises. Hundreds of shops already accept pay-
ments via Orange Money in the six countries where the service has been launched.
(d) Bill payments, e.g. for electricity, water, and pay TV (large enterprises).
(e) Salary payments, e.g. for staff working for Orange.
Some banks regard these new services as new competition, and are lobbying regulators to limit the ability of MNOs to
provide services that have traditionally been the realm of banks. So far, central banks in Africa have generally shown open-
ness to the entry of MNOs in this area. However, in developing new money services in a country, it is important for central
banks to have a good understanding of the risks involved with different kinds of services.
Source: UNCTAD, based on an interview with Orange.

81CHAPTER IV : MAKING PSD INTERVENTIONS MORE EFFECTIVE WITH ICTs
(c) In the Philippines, households that received
remittances were more likely to start relatively
capital-intensive entrepreneurial activities
(Yang, 2008);
(d) In Egypt, overseas savings were associated
with more entrepreneurship and investment
(McCormick and Wahba, 2001 and 2003); and
(e) The growth impact of remittances has tended
to be stronger when the level of financial
development is weaker (Giuliano and Ruiz-
Arranz, 2009).
Innovative, mobile-based solutions represent an at-
tractive option to facilitate more remittances and
greater development gains in Africa. As noted recently
(AfDB and World Bank, 2011: 73):
“The technologies have the potential to vastly
improve access to both remittances and broader
financial services, including low-cost savings
and credit products, for African migrants and
remittance recipients.”
Many countries in which the highest proportion of
GDP is accounted for by international remittances
also enjoy high rates of mobile phone penetration
(table IV.1). Nevertheless, out of the 109 known mo-
bile money deployments, only eight allow cash out
via a customer or agent mobile account; another 15
are preparing for such services (CGAP and Dalberg
Global Development Advisers, 2010).18 Only two of
the existing systems have been in operation for over
a year, namely G-Cash and Smart, both in the Philip-
pines (ibid.). Among the 15 countries included in table
IV.1, only Jamaica was able to accommodate inter-
national remittances to mobile phones. This suggests
clear potential to leverage mobile solutions for interna-
tional remittances.
In the latter half of 2010, Vodafone and Telenor both
announced plans to introduce new services into their
mobile money systems, including international remit-
tances (Menon, 2011). Vodafone Qatar and Philip-
pines-based Globe Telecom announced that they
would jointly enable a money transfer service between
their two networks. Vodafone Money Transfer account
holders in Qatar will be able to send funds directly from
their mobile phones to Globe subscribers in the Philip-
pines.19 Over 200,000 Filipinos now live and work in
Qatar. Their remittances sent back home during the
year 2009 amounted to more than $185 million. Tele-
nor Pakistan expanded its “easypaisa” mobile money
service, with an international transfer service offered
in collaboration with Xpress Money (United Kingdom).
Senders of funds from abroad can transfer their mon-
ey through the wide network of Xpress agents present
in more than 80 countries.20
One of the first challenges is to facilitate a more rapid
roll-out of mobile money systems that can handle in-
ternational remittances; current deployments affect
only a fraction of total remittance flows. Another chal-
lenge is to reduce the costs associated with using the
services. At least for certain remittance streams, the
price of sending money via mobile schemes appears
to be similar to that of using cash remittances, de-
spite the fact that reliance on mobile phone transfers
gets around the need to develop distribution networks
(AfDB and World Bank, 2011). This may partly reflect a
lack of competition in the paying network. The follow-
ing regulatory challenges have been identified as po-
tentially restricting the launch and growth of relevant
solutions (CGAP and Dalberg Global Development
Advisers, 2010: 14):
Table IV.1. International remittances as a share of GDP in 2008, and mobile cellular subscriptions per 100 inhabitants in 2010, economies with a high reliance on remittances
Source: Remittances data, Development Prospects Group, World Bank and ITU World Telecommunication/ICT
Indicators database.
CountryRemittances
as a share of GDP, 2008 (%)
Mobile cellular subscriptions per
100 inhabitants, 2010 (%)
Tajikistan 49.6 86.4
Tonga 37.7 52.2
Republic ofMoldova
31.4 88.6
Kyrgyzstan 27.9 91.9
Lesotho 27.0 32.2
Samoa 25.8 91.4
Lebanon 25.1 68.0
Guyana 24.0 73.6
Nepal 21.6 30.7
Honduras 20.4 125.1
Haiti 20.3 40.0
Jordan 19.0 107.0
El Salvador 17.2 124.3
Bosnia and Herzegovina
14.8 80.1
Jamaica 14.5 113.2

82 INFORMATION ECONOMY REPORT 2011
(a) Regulations that dictate the type of organizations
permitted to send international money transfers
and how they are allowed to operate;
(b) Compliance with know-your-customer/anti-
money laundering requirements, which affect
the type of agent and customer acquisition;
(c) Regulations that restrict the involvement of
non-banks in financial transactions and affect
the types of activities that non-banks can
engage in, or how money is held.
3. Microfinance and ICTsMicrofinance plays an important role in providing fi-
nancial services to unbanked or underbanked entre-
preneurs in low-income countries. The idea behind
microfinance and microinsurance is to adapt ser-
vices to populations that have been excluded from
the formal financial system and the risk-management
schemes of mainstream banking. Subsistence farm-
ers and small-scale entrepreneurs in the informal sec-
tor are often viewed by traditional banks and insur-
ance companies as low-profit and high-risk clients.
This is an important constraint for MSE development
in many low-income economies, and makes it perti-
nent to consider the scope for ICT solutions to make
microfinance and microinsurance more inclusive and
effective.
Relatively few mobile money services have so far been
used to facilitate MFI loan disbursements and repay-
ments, partly due to the diverging priorties of MFIs and
MNOs (Germany, BMZ and GIZ, 2011). As one study
notes (Kumar et al., 2010: 1):
“…MFIs and successful m-banking businesses
occupy different worlds today…The MFI world
focuses on creating low-cost, human-driven
infrastructure, while the m-banking world is tied
into and uses payment systems infrastructure. It
is not surprising then that these two worlds have
not yet aligned.”
Services offered by MFIs are based on frequent con-
tacts with their clients. Face-to-face meetings are
considered important to building and nurturing the so-
cial capital that is the basis for creating trust and as-
sessing credit risk. By using appropriate technology,
MFIs might be able to reduce somewhat the need for
physical meetings, enable the processing of a higher
number of transactions at lower cost and risk, and ex-
tend the reach of their services.21 Many MFIs conduct
numerous transactions daily, and frequently have daily
collections of cash. Their members include owners of
small businesses, vendors and farmers, whose work-
ing days are long and for whom daily trips to a bank
mean lost time and higher costs.
The efficient collection of savings and of credit instal-
ments is crucial to the financial sustainability of MFIs.
In this context, they often rely on commercial agents
to find new clients and to service existing ones. One of
the challenges faced by MFIs that rely on paper-based
collection and tracking systems is to mitigate money
leakage and fraud. When a client pays the commer-
cial agent in cash, the transaction is typically noted
in the client’s savings or credit notebook as well as
in that of the commercial agent.22 Occasionally, the
amount declared to the MFI falls short of the total sum
of cash collected. If a significant discrepancy is noted
between the MFI’s accounting and the client’s expec-
tation, it may be the result of fraud or embezzlement
on the part of the agent. Such situations create col-
lateral damage and can be hard to remedy. Indeed,
a substandard system for tracking payments can in
itself encourage fraudulent behaviour – ultimately with
serious consequences for an MFI. A substandard sys-
tem makes published financial results less reliable,
lowers the willingness of lenders to fund MFI activities,
and may possibly result in higher interest rates being
charged. Finally, it undermines trust in the MFI–client
relationship.
Technology can help to improve the tracking of pay-
ments. Ideally, MFIs should be able to handle the flow
of data between members, service suppliers, micro-
credit (or microinsurance) units and investors in an
integrated manner. This can be done by streamlining
routine business processes such as customer regis-
tration, loan or claims management, and implement-
ing systems.23 Technological solutions may include
the use of smart cards (box IV.9) and/or mobile de-
vices.
The success of M-PESA has led some MFIs in Kenya
and the United Republic of Tanzania to adopt mo-
bile solutions for loan repayments and sometimes for
savings. Examples include Tujijenge Tanzania, which
makes it mandatory for all repayments on individual
loans of less than $1,800 to be made via M-PESA, and
the Small and Micro Enterprise Programme (SMEP) in
Kenya, which in 2009 allowed its 51,000 customers to
make mobile loan repayments and savings contribu-
tions (Kumar et al., 2010). These systems have made
it possible for MFIs and savings and cooperative credit
organizations (SACCOs) to offer their customers more
83CHAPTER IV : MAKING PSD INTERVENTIONS MORE EFFECTIVE WITH ICTs
convenient, affordable products, while simultaneously
increasing efficiency, security and transparency in the
back office. Another example is the Kenya Agency
for the Development of Enterprise and Technology
(KADET), which has also linked up with the M-PESA
platform. At the end of 2010, nearly half of KADET’s
clients were making loan repayments and savings de-
posits using mobile phones. Previously, they made
their payments at a bank branch where KADET held
an account, entailing up to one day of travel for those
located in remote areas. KADET plans to expand its
range of services to include loan approvals via SMS,
offering loan disbursements via mobile money, and
sending repayment reminders by SMS (Capsuto,
2011).
In order to seize opportunities from mobile money sys-
tems in microfinance, the institutions involved need to
integrate one (or multiple) mobile money systems with
their management system, so that transactions made
are automatically assigned to the corresponding cus-
tomer account and posted to a back-office database.
MFIs with a large customer base in countries with a
high penetration of mobile money users are the best
Box IV.9. Using smart cards to improve the efficiency of MFIs
When exploring technological solutions to some of the challenges facing MFIs, smart cards are often the first option to
be considered as a partial replacement for paper-based systems (Gerelle and Berende, 2008).a For example, Tegona,
a Swiss company, has developed a smart card solution consisting of two parts: the front office and the back office.
The front office is responsible for the tracking of credit and debit operations. Each agent is equipped with a point of
sale terminal, which transmits all transactions to the back office, using general packet radio service (GPRS) (via GSM
operators).b To make transactions more secure, every client receives a chip card when opening his/her account or
when subscribing to an insurance product. The back office involves the monitoring of the transactions, and the man-
agement of the client portfolio, particularly with regard to savings, credit or insurance, and connects the information to
the MFI’s Management Information System. The back office solution is offered as Software as a Service (SaaS), which
means that the MFI does not need to make large investments in equipment or software, or to enter system mainte-
nance costs into its bookkeeping.
The front office terminals allow the MFI to reinforce agents’ presence among clients. Apart from the collection of savings
and credits, they make it possible to answer locally clients’ concerns and needs, giving them immediate access to ac-
count statements, credit instalment details, provisioning and withdrawing.
Pilot studies of the system undertaken in Côte d’Ivoire in 2010 have revealed a number of positive effects. Firstly, better
and more secure cash management has made agents more efficient by allowing them to concentrate on the commercial
representation and on the growth of the portfolio. It has also reduced the time to market during the creation of a new
partnership. The amount of fraud has also dropped significantly, which has expanded the space for new products and
reduced the level of risk. Secondly, a more proactive local attitude has helped some MFIs to generate a more dynamic
and stable cashflow while at the same time reducing outstanding debts. Thirdly, computerization and automation of the
tracking of operations has significantly improved customer relationship management, by way of better business intelli-
gence related to asset and risk management. Finally, further growth in the portfolio of customers and in the payments that
they generate, as well as enhanced customer loyalty, have helped to lower the portfolio management costs. Lower costs
should eventually allow the whole sector to expand.
But the implementation of such a system is not without costs and challenges. First, smart cards need to be issued, which
introduces an additional step when an account for a new client is being opened. Various improvements are currently being
explored in this context, with the aim of simplifying and shortening the process, by replacing the memory card form factor
by a smart sticker (using RFID), for example on the back of a mobile phone. The recent introduction of mobile phones
embedded with NFC technology could further simplify the process. However, the deployment of that technology will take
time. Smart card or RFID technology can be alternatives to today’s standard mobile phone payment schemes in countries
that lack reliable ID cards. The introduction of new technology and habits to clients is another challenge. People need to
be trained how to use the system in order to trust it.
Source: UNCTAD, based on information provided by Tegona.a A smart card (or chip card) can be defined as any pocket-sized card with embedded integrated circuits that
can process information.b Several MFIs have piloted the use of point of sale terminals to distribute loans and accept borrowers’ repayments
(Gerelle and Berende, 2008).

84 INFORMATION ECONOMY REPORT 2011
Box IV.10. Bringing smaller MFIs into mobile microfinance: the Kopo Kopo case
The dynamism of mobile money services in Africa is attracting entrepreneurs in developed countries to innovate
locally and develop new business solutions. Kopo Kopo, an enterprise that was incorporated in the United States
in August 2010, chose to place its headquarters in Nairobi, Kenya, to serve the sub-Saharan market. By offering a
Software-as-a-Service platform for integrating mobile money systems with banking and enterprise resource planning
software, the company seeks to enable small MFIs and SACCOs to leverage mobile money systems.
To test its new software application, Kopo Kopo decided to run a pilot project in Sierra Leone. As in many other low-
income countries, banks are few and far between in Sierra Leone. For example, there are only 2.3 bank branches
per 100,000 adults (ibid.). While other companies (e.g. Web Tribe, The Software Group and Zege Technologies) had
already offered mobile money integration services in East Africa, Kopo Kopo was the first to do so in Sierra Leone.
The pilot project, which involved Hope Micro, an MFI, and Splash Mobile Money, commenced in January 2011 in the
Greater Freetown area. The goal was to enable Hope Micro borrowers to repay their loans via Splash instead of mak-
ing cash repayments at the Hope Micro Central Office, thereby benefiting borrowers in terms of less time spent away
from their businesses and less money spent on taxi fares.
At the outset, a business process analysis was undertaken, with the aim of understanding how incorporating Splash
might change employee roles and responsibilities in Hope Micro. Of the various employees involved, the cashiers,
data entry personnel and loan officers required the most retraining. The cashiers were trained to recruit borrowers
into the pilot when they arrived to pick up their loan disbursement cheques. The data entry personnel were trained in
how to use the service to download mapped transactions and import them to Hope Micro’s management information
system. Finally, the loan officers were trained to escort borrowers through all the processes necessary to make a loan
repayment via Splash.
Once everyone understood their new roles and responsibilities, Hope Micro started to process loan repayments via
Splash. The first round of repayments required a loan officer to call each participating borrower one day before a
repayment was due, to set a time to meet the next day, and then to accompany the borrower to the nearest Splash
agent to assist with the cash-in, send the loan repayment, and log the transaction ID in the loan repayment booklet.
Borrowers immediately saw the advantages of using the mobile service over repaying in cash. For example, one
borrower found that she could save Le96,000 (about $24) over the life cycle of her loan by avoiding taxi fares. With
most borrowers spending hours in traffic each week to make loan repayments, the mobile solution also freed up time
to keep businesses open longer. One client estimated that she would save a full working week over the life cycle of
her loan.
There were also challenges. The Splash agent network, for instance, struggled to serve Hope Micro customers. On
several occasions, Splash agents turned borrowers away because they either lacked the electronic float necessary
to perform a cash-in (the process where a borrower converts cash to electronic currency) or because there were too
few Splash customers to make it profitable. Getting Hope Micro staff to champion and take ownership of the pilot
was another challenge. Although cashiers and data entry personnel were enthusiastic, only a few loan officers actively
encouraged their borrowers to use Splash. As a result, many borrowers were not well enough informed to understand
the purpose and possible benefits of the pilot. Other challenges included finding borrowers for the pilot, teaching bor-
rowers to protect their Splash PIN numbers, and dealing with faulty SIM cards.
Despite such hurdles, the system is being managed and scaled by Hope Micro. It remains to be seen if Splash will
be of sufficient benefit to the institution. In order for other MFIs in Sierra Leone to integrate with Splash and extend
mobile financial services throughout the country, a clear business case has to be proved. Hope Micro needs enough
borrowers in order for the cost savings from increased efficiency (e.g. lower cash management costs and fewer full-
time data entry personnel) to outweigh the expenses involved with changing business processes and buying the new
technology.
Source: UNCTAD, based on information from Kopo Kopo.

85CHAPTER IV : MAKING PSD INTERVENTIONS MORE EFFECTIVE WITH ICTs
positioned to reap cost savings from leveraging such
systems. MFIs that operate in markets where there
is already an established market solution are likely
to reap the benefits (e.g. SMEP in Kenya). By con-
trast, for the many MFIs that have a small customer
base and low transaction volumes, the initial costs
may make mobile solutions a less attractive option.
One way for even small MFIs and SACCOs to over-
come some of these set-up costs may be to apply a
Software-as-a-Service platform for integrating existing
mobile money services with their enterprise resource
planning software. Such systems are currently being
developed and piloted in Africa (box IV.10).
While relatively few MFIs have so far integrated mo-
bile money systems into their operations (Kumar et
al., 2010), this situation should change in the next
few years as more evidence emerges from those sys-
tems that have been implemented. There is scope
for improving the outreach to remote areas, reducing
transaction costs, improving customer service, and
reducing fraud, with the help of mobile technology.
Adequate attention should be given to learning from
early adopters, in order to identify best practices for
additional MFIs to effectively exploit ICT solutions in
their operations.
4. Policy challenges and opportunities with mobile money
It is still too soon to assess the impact of mobile mon-
ey solutions on access by MSEs to financial services.
On the one hand, MSE owners and managers have
seen advantages from using these new technolo-
gies and approaches, as a more secure and afford-
able means for making financial transactions. Uptake
is likely to accelerate as the network of business us-
ers expands and when services are adapted to the
needs of relevant enterprises. On the other hand, even
if transaction costs are reduced, other issues affect-
ing the decisions of financial service providers remain.
Demands for collateral, business experience, and a
lending history will continue to influence the decisions
of financial service providers. Moreover, to date, most
mobile money systems have mainly focused on ba-
sic money transfers rather than on credit services or
international remittances. Thus, there appears to be
scope for expansion. This makes it important to con-
sider what policy challenges and issues Governments
should address in order to ensure positive outcomes
from the introduction of mobile money services.
Most mobile money deployments are in developing
countries. Thus, Governments in those countries (in-
cluding several LDCs) face the challenge of pioneer-
ing new legislation and regulation related to the use
of mobile money. This situation contrasts with most
other policy domains, where developed countries are
ahead in terms of policy design and implementation.
Against this background, it is essential that policymak-
ers and regulators understand the potential benefits
and risks. Challenges include the creation of enabling
environments that facilitate the roll-out of services that
are in demand, but that also help avoid possible nega-
tive effects. The international community can play a
role in supporting the development of sound regula-
tory frameworks and relevant institutions, as illustrated
in a recent report for the German Development Coop-
eration (box IV.11).
The introduction of mobile money services into an
economy that lacks a strong financial sector and is
characterized by many unbanked people can produce
both good and bad effects. While various benefits al-
ready have been discussed, consideration must also
be given to the risks. At the same time, it may not be
desirable to aim for fully developed regulations prior
to permitting the launch of mobile money operations.
Instead, many developing countries have opted for a
“test and learn” approach, by which conditional ap-
provals are granted which allow the regulators to ob-
serve market developments before issuing regulations
that are based on actual identified risks and not on
conjecture. This concept is also reflected in the G20
Principles on Financial Inclusion.24
As regulations evolve, there may be reason to exam-
ine the effect on bank accounts and deposit bases,
which may serve as consumer and commercial lend-
ing resources. There should be an understanding of
the use of reserves, both in the promotion of safety
and soundness and in monetary policy. Strengths of
traditional and well-developed bank-based payment
systems may need to be reproduced or adapted
for a non-bank mobile money environment, includ-
ing know-your-customer and anti-money laundering
requirements, traceability, a restitution structure that
is consistent and understandable, ensuring the con-
tinued solvency of a system, the availability of a gov-
ernment “backstop” for emergencies, establishment
of trust in the system through vetting and oversight
as well as during times of adversity. This will become
increasingly pertinent as the use of mobile money sys-
tems scales up.
86 INFORMATION ECONOMY REPORT 2011
The use of mobile money services entails both legal
and policy considerations, which may have domestic
as well as cross-border implications. In addition to the
issues already addressed, a preliminary checklist of
selected policy and legal issues in mobile money ser-
vices can be identified. For the sake of convenience,
this is separated below into broad categories related
to systems oversight, user-related concerns, crime
and security considerations, and infrastructure issues
(Field, forthcoming). The discussion that follows is not
intended to be comprehensive or applicable to every
situation, but rather to serve as a starting point in con-
sidering policy areas in need of attention to ensure the
successful introduction of mobile money services.25
a. System oversight
Regulation of mobile money is a challenge for devel-
oping countries, not least because it traverses two
previously distinct and independent sectors – com-
munications and finance. When MNOs approach their
conventional communications regulator with mobile
money ideas, they are typically referred to the finan-
cial regulator for approval. In most cases, a start-off
requirement is that the MNO must partner with a finan-
cial institution whose activities are already regulated by
the central bank using existing legislation. In all cases,
the financial institution holds the actual cash deposits,
against which “e-value” is issued, and therefore, by
proxy, the same system of regulation is extended to
mobile money.
Differing national views of the nature of electronic
money, and what it means to issue electronic money,
have produced several different approaches to regu-
lation. For some States, electronic money is the elec-
tronic equivalent of a national currency and there-
fore should be issued only by the State. For others,
electronic “money” represents only one part of the
service of moving value from one owner to another.
That service may be composed of a number of steps
– some of which could be carried out by banks or
non-banks – which bring efficiencies to the process.
Under this view, the goals of regulation would be to
ensure the safety and soundness of the entire pay-
ment system, consumer protection, and other social
objectives.
Under either view, the nature and the extent of regula-
tion and supervision of mobile money services need
to be considered. Non-bank mobile money provid-
ers (such as MNOs) are normally not regulated com-
prehensively in their payment services, though some
Governments have utilized existing “money transmit-
ter” or similar laws to regulate non-bank providers.
Key issues include the need to determine the loca-
tion of the virtual services and the appropriate jurisdic-
tion – among government agencies (e.g. banking vs.
telecom) and with respect to courts. Transparency is
paramount. For services with a cross-border aspect,
international harmonization, such as adoption of trea-
ties or conventions, may come into play. In designing
regulations, a balance must be sought between en-
Box IV.11. How German Development Cooperation can support the successful roll-out of branchless banking services
In a 2011 study, German Development Cooperation assessed the potential role for development partners to assist devel-
oping countries in the area of mobile money and other branchless banking services. In view of the experience to date, it
has identified several ways in which its active involvement could make a difference:
(a) Provision of advice to market players and regulators, related to realizing an overall conducive framework addressing
all core aspects of branchless banking
(b) Resource centre: Bridging existing knowledge gaps in order to avoid future failures in new projects. This would
involve the development of practical tools to support market assessments, agent network sizing, segmentation etc.
(c) Supporting Governments in leveraging branchless banking. Enabling Governments to reap the fruits of these initia-
tives (e.g. through government-to-person payments) should result in increased global interest in branchless banking.
(d) Being a partner for private initiatives. German Development Cooperation could act as a catalyst between MFIs,
banks, MNOs and technology vendors. The support could include product design support for specific segments,
ICT enhancements for MFIs, funding pilot projects, technical support to third-party providers, and support in setting
up viable agent networks.
(e) Linking branchless banking to other development objectives in order to enhance its impact.
Source: Germany, BMZ and GIZ (2011).
87CHAPTER IV : MAKING PSD INTERVENTIONS MORE EFFECTIVE WITH ICTs
couraging experimentation that can lead to new ap-
proaches, and maintaining economic stability.
Risk allocation can be addressed through proactive
regulation, or can be left to private agreement be-
tween the parties, or can be addressed via a com-
bination of the two. It is appropriate to allow risk al-
location to vary by kind of service, usage, parties, and
possibly even system architecture, since each varia-
tion may change the relative power of the parties and
their ability to detect and prevent loss. Generally, there
should be incentives for the party with the ability to im-
prove the system over time to act. It is important not to
overregulate, as this may hamper the establishment of
new services. Regulation should be calibrated in light
of the nature of the financial services (e.g. transfers,
payments or savings), and the risks associated with
each of these (Dittus and Klein, 2011).
The goal of promoting commerce and the need for
liquidity in a payment system are significant. Moreover,
mobile money services may be useful in advancing re-
lated e-government goals, such as the collection of
taxes, duties and fees (including taxation of e-transac-
tions), procurement, and payment obligations by Gov-
ernments (benefits, salaries, grants/loans, subsidies).
Identity management must be addressed too – either
on a case-by-case basis by the service provider, or
more comprehensively. This may include recognition
of electronic signatures, as well as other aspects such
as website authentication and account authorization
services. Regulatory consideration must be given to
system security and resilience, including the identifica-
tion and banning of bad payers, the evaluation and
supervision of systems, mitigation of the risk of system
collapses (which may include public safety nets), and
contingency planning.
Addressing these and other concerns will increasingly
require effective collaboration between communica-
tions and telecommunications regulators; while one is
an expert in the financial aspects of mobile money,
the other better understands the facilitating technol-
ogy. Currently, in many countries, contacts do exist
between individuals working at the two regulators, but
there is often no formal institutional link between the
two types of regulators. In the United Republic of Tan-
zania, the Bank of Tanzania and the Tanzania Commu-
nications Regulatory Authority have signed a formal
Memorandum of Understanding to collaborate on the
regulation of mobile money.
b. User issues
There is a spectrum of consumer protection concerns,
which may vary based on social expectations. The
most important is how to protect customer funds in
cases where a non-bank is the e-money issuer. Non-
banks are rarely subject to the kind of prudential regu-
lation that applies to banks, so when non-banks issue
e-money, regulators are likely to be concerned about
ensuring adequate protection for customer funds
(Tarazi and Breloff, 2010). General concerns include
the relative obligations of the counterparties, banks,
and MNOs and their agents, including loss allocation
as well as protection against fraud, user error, and
system error or loss.
Particular attention is being given to regulating MNO
agents, since effective mobile money models require
cash in/cash out points located near the customer
(Tarazi and Breloff, 2011). Key issues include who can
be an agent, what kind of services agents should be
allowed to provide and on what terms, and the extent
of bank liability for agents. There is no one-size-fits-all
regulatory solution for the provision of mobile money
services via agents, and markets are experimenting
with various approaches to find out what works. Al-
though this process may produce results consistent
with customer interests, regulators should view this as
an argument supporting a light-touch regulatory ap-
proach, not a presumption that regulation is unneces-
sary (ibid.).
Effective dispute resolution is an integral part of any
successful payment system (at least, if alternatives
are available). Countries vary with regard to whether
there should be negligence or strict liability standards
for losses due to the unauthorized use of devices or
access codes. An independent and trusted judiciary
and/or arbitration-type process may be called for,
especially when considering integration into global
markets. Issues of payment raise issues of insolvency
and related risks. It may be necessary to characterize
prepaid “money” and to recognize the special risk for
prepay customers who may be financially unable to
afford other payment plans.
A variety of issues relating to personal privacy are
also of significant concern in most consumer pay-
ment systems. Matters of data mining, and of carry-
ing a transaction history and other information with
an electronic payment, may be problematic. Related
issues include confidentiality and data protection, as
well as anonymity. There may, however, be valid rea-

88 INFORMATION ECONOMY REPORT 2011
sons for using mobile payment data for economic,
social or even health research. Since money trans-
fers often involve buying and selling, there are also
concerns related to e-contract enforceability, dis-
tance selling (language, disclosures), and applicable
law and jurisdiction.
c. Crime and national security considerations
Money laundering presents a critical set of issues in
any payment system. Systems must be built in a way
that discourages such practices and allows for some
form of monitoring or review. The Financial Action
Task Force (FATF), an independent, intergovernmental
body, has issued guidance in this area,26 dividing mo-
bile services into four categories:
(a) Mobile financial information services for viewing
accounts only, without the ability to conduct
transactions. These are considered low-risk.
(b) Mobile banking and securities account services
tied to existing accounts. These are likely to be
regulated and supervised.
(c) Mobile payment services allowing payments
to be made by non-account holders. These
come under the widely varying controls
and supervision of non-traditional financial
institution payment service providers.
(d) Mobile money services which offer the ability
to store value on mobile phones in the form of
phone credits or airtime, or by other means,
are still unregulated and unsupervised in many
countries.
Terrorist financing presents similar issues, including is-
sues of anonymity, traceability, and supervision. Risks
may be mitigated through the technical establishment
of value limits, as well as through appropriate moni-
toring. Customer due diligence and the adoption of
know-your-customer principles also play a significant
role. Currently, there are no uniform international stan-
dards for low-risk e-payment products, but the FATF
has issued a Guidance Paper on Financial Inclusion,
outlining how several countries around the world apply
a risk-based approach to branchless banking (FATF,
2011).
Ways to discourage other uses of electronic money
for criminal purposes – such as tax evasion, fraud
(by issuers or others), theft and hold-ups, blackmail,
kidnapping and piracy, bribery and gambling – should
be built into any system, and should be addressed in
law.27 Similarly, corruption at all levels, as well as the
requirement for government and financial transparen-
cy, must be addressed. Depending on the technical
architecture of a mobile money system (e.g. the value
that is resident on the mobile device, as opposed to
“in the cloud”), the seizure of phones and devices at
borders by customs, or other seizures by police, may
have financial implications.
d. Infrastructure policies
Various other related public policies will greatly affect
the success of mobile money services. Some of these
are best addressed within the private sector, while
others may require government intervention.
In the area of standards and technical coordination,
policies may need to be negotiated between and
among device manufacturers, issuers, merchants and
banks. Increased bandwidth requirements also need
to be addressed. In certain situations, there may be
benefits from considering offline approaches to pay-
ment or even dedicated networks.
A State may wish to promote competition in mobile
money services. Issues of cooperation, barriers to en-
try, and intellectual property sharing then come into
play. For consumer protection, monetary policy or oth-
er reasons, security and system resilience may need
to be encouraged or required.
The development and operation of a successful
mobile payment system requires the use of “cutting
edge” technologies. It will be necessary to identify ap-
propriate technologies and to address their use locally.
There may be conflicts involving export restrictions,
and patent and other intellectual property policies;
there may also be restrictions on the use of certain
encryption techniques. Furthermore, there may be
reasons to promote or allow partnerships with foreign
experts or investors.
New technological systems do not function in a vacu-
um. If mobile money systems are to be fully beneficial,
additional infrastructure may be needed in order to
support hem. This may include transport infrastructure
and delivery systems, customs processing, financial
settlement and netting systems, judiciary and regula-
tory efficiency and independence, and legal regula-
tion of payment systems (particularly where mobile
systems have “leapfrogged” prior technologies and
no appropriate laws covering payment systems ex-
ist). There might also be a call for public education
and awareness-raising, including technical and legal
instruction. Additionally, some societies may be faced

89CHAPTER IV : MAKING PSD INTERVENTIONS MORE EFFECTIVE WITH ICTs
with an underdeveloped corporate culture, undevel-
oped debt, credit and equity markets, or underdevel-
oped legal frameworks.
* * * * *
Mobile money services promise widespread benefits for
private sector development, and particularly for MSEs
that are currently poorly catered for by existing finan-
cial services. If well managed, these services have the
potential to contribute to much-improved financial in-
clusion (G20 Financial Inclusion Experts Group, 2010).
Governments and their central banks should take the
opportunity to explore ways to absorb these enter-
prises into the mainstream via mobile-based commer-
cial and financial transactions. If well managed, mobile
money systems have great potential to improve and
expand markets, create jobs, and build a middle class.
In order to capture the full potential in this area, dedi-
cated research is needed in order to extract lessons
from the early adopters. Donor support is important, to
help countries that are eager to implement appropriate
frameworks capable of addressing the issues outlined
in this section. As summarized by the German develop-
ment agency (Germany, BMZ and GIZ, 2011: 8):
“Success will require building partnerships
between mobile operators, financial institutions,
retail organizations and other ecosystem
members, and establishing new delivery models.
It will require building a corpus of knowledge,
sharing lessons, and leveraging all resources
that are available. Most importantly, it will require
organizational commitment and sharp execution
by service providers. Only then will branchless
banking be truly transformational.”

90 INFORMATION ECONOMY REPORT 2011
NOTES1 See, for example, UNDP’s work on legal empowerment of the poor, at http://www.undp.org/legalempowerment/.
2 Automated customs systems can be programmed to select randomly from a roster of available customs officers in order
to check customs declarations, thereby minimizing opportunities for collusion (IFC, 2007c: 53)
3 The term “business development service” was first coined in 1997 by the international Committee of Donors for Small
Enterprise Development, which defined it as “services that improve the performance of the enterprise, its access to
markets, and its ability to compete. [This includes] a wide array of business services, both strategic and operational.
BDS are designed to serve individual businesses, as opposed to the larger business community” (Committee of Donor
Agencies for Small Enterprise Development, 2001: 11).
4 This long-time separation between BDS and financial services is not uncontested. There is growing evidence of improvements
gained through a more integrated approach (Sievers and Vandenburg, 2004).
5 The importance of tailoring activities to the demand of users has been highlighted many times. See, for example,
Miehlbradt (1999) and UNCTAD (2010).
6 See http://www.celac.or.ug/.
7 Information provided by IICD.
8 Information provided by IICD.
9 See also Hellström (2010), which mentions the following examples from East Africa: MPAIS in Rwanda and Uganda,
Farmer’s Friend in Uganda, and Question Box in Uganda.
10 See http://www.grameenfoundation.applab.org/ckw/section/data-collection-info-services-technology.
11 This section is based on information provided by FAO and IFAD.
12 This section is based on information provided by UNECA.
13 See ECX:1000 perfect days. Available at http://capitalethiopia.com/index.php?option=com_content&view=article&id=
14135:ecx1000-perfect-days&catid=12:local-news&Itemid=4.f
14 This section is based on Okello (forthcoming).
15 In this section, the term “mobile money systems” refers to all kinds of mobile platforms that can facilitate services such
as money transfers (domestic and/or international), payments, and financial services (e.g. savings, credit, insurance).
16 See https://payments.yo.co.ug/index.php/component/content/article/44-about-yopayments/60-what-is-yo-payments.
17 See http://www.migrationinformation.org/datahub/remittances.cfm.
18 The eight deployments are M-Via (Mexico), Paymaster (Jamaica), Maroc Telecom (Morocco), M-PESA (Kenya),
Zap (East Africa), Banglalink (Bangladesh), G-Cash (Philippines) and Smart (Philippines).
19 See http://www.cellular-news.com/story/46363.php.
20 See http://www.cellular-news.com/story/45114.php.
21 For example, ICT solutions can be used for remote updates, sending reminders, providing training, and collecting
payments.
22 An agent may collect money from 50 to 100 clients per day, each of them entrusting the agent with, say, up to 20 per cent
of his/her daily gross revenue.
23 See, for example, http://www.microinsurancefacility.org/en/thematic-pages/technology.
24 Knowledge: Utilize improved data to make evidence-based policy, measure progress, and consider an incremental
“test and learn” approach acceptable to both regulator and service provider. Principle 7 of the G20 Principles on Financial
Inclusion (http://www.g20.utoronto.ca/2010/to-principles.html).
25 This section draws significantly on the forthcoming publication by Field.
26 Financial Action Task Force (2010). Money laundering using new payment methods. October. Available at
http://www.FATF-GAFI.org. See also: FATF 40 Recommendations. Standards for money laundering. Available at
the same website.
27 For certain systems, a need may arise for government-to-government sharing of information. This commonly arises
in tax evasion and money laundering investigations, but also may arise in other situations.
Exploring how ICTs can be used to support women entrepreneurs is
important for several reasons. Firstly, women’s entrepreneurship rep-
resents untapped potential for PSD. While women-owned MSEs have
been found to be less profitable than MSEs owned by men (Alturki
and Braswell, 2010; GTZ, 2010; IFC, 2007b; IFC, 2010; Ilavarasan
and Levy, 2010; ILO, 2008b), this gender-based difference seems to
disappear for larger ventures. In fact, some evidence suggests that
among medium-sized and large enterprises, those owned by women
are equally or more productive than those owned by men (GTZ, 2010).
This makes it important to identify and address possible barriers con-
straining the growth and upgrading of women-owned MSEs. Second-
ly, a number of key barriers to growth are specific, or particularly con-
straining, to women entrepreneurs. As will be shown in this chapter,
ICTs can be used to help overcome some of these. Thirdly, ICTs have,
so far, seldom been used systematically to make initiatives aimed at
supporting women’s entrepreneurship more effective. Against this
background, this chapter discusses how ICTs can be used to address
the above-mentioned barriers. It provides recommendations to stake-
holders interested in using ICTs to support women-owned MSEs more
effectively, and explores relevant initiatives.1
LEVERAGING ICTs TO SUPPORTWOMEN’S ENTREPRENEURSHIP
5

92 INFORMATION ECONOMY REPORT 2011
A. BARRIERS FACING WOMEN ENTREPRENEURS IN DEVELOPING REGIONS
Women-owned MSEs in developing countries can
largely be divided into subsistence-based enterprises
and growth-oriented enterprises. The focus of the for-
mer tends to be on making a stable income, without
necessarily seeking to expand the economic activity.
The latter kind of enterprise is characterized by great-
er entrepreneurial drive and a stronger desire to grow
(Levy et al., 2010). Currently, most women-owned
MSEs in developing regions belong to the first catego-
ry, operating informally in activities that require limited
skills and training, such as smallholder farming, petty
trading, street vending and beauty services (Naituli et
al., 2008; World Bank, 2009b; Ilavarasan and Levy,
2010; IFC, 2010; Banerjee and Duflo, 2011).
Both groups are affected to different degrees by
a number of barriers that are specific to women-
owned MSEs and that ICTs can potentially help
overcome:
(a) Women-owned MSEs often face greater
difficulty in accessing financing from formal
sources, such as banks and traditional lending
institutions;
(b) Women entrepreneurs tend to have less
time to spend on their business due to family
responsibilities and the biased division of
labour in the household;
(c) Women often have less physical mobility,
affecting their ability to access opportunities
and markets, and to network and build their
businesses; and
(d) Women have less access to skills and training.
Additionally, in many countries, patriarchal social
structures limit the freedom of women to engage suc-
cessfully in business. In these instances, while inno-
vative ICT-enabled initiatives could be used to reduce
these effects to a certain degree (practical gender
interests), more overarching initiatives are required to
address broader societal issues.2
1. Access to finance
Accessing affordable, suitable finance is a key chal-
lenge for most MSEs, and even more so for women-
owned MSEs. This problem is a function of many fac-
tors; three of the most pertinent are described here.
Firstly, traditional collateral, such as proof of property
ownership, is often required by banks. In many coun-
tries, however, customs, social practices or even laws
do not allow women to own property. In 43 countries
in Africa, 23 in Asia and Oceania, 5 in Latin America
and the Caribbean, and 2 in Eastern Europe, women
are reported not to have equal rights with men to ac-
quiring and owning land (UNDESA, 2010). In most
African and many Asian countries, although equal
property-ownership rights are stipulated by law, the
prevailing customary practices3 (which in a number
of cases take precedence over statutory law) prevent
women from having control over the shared proper-
ty of the married couple, or even over the property
that they brought into the marriage (UNDESA, 2010;
OECD, 2006b; EIU, 2010). There is little that ICTs can
do to address such legal barriers.
Secondly, the majority of women entrepreneurs in de-
veloping countries have limited awareness of where
and how to access financial services, and mostly
lack a bank account (UNDP, 2008b; World Bank,
2010a). For example, in Viet Nam, the Government
has launched a number of initiatives to assist women
entrepreneurs, including opening special branches
at Sacombank (the country’s largest privately owned
commercial bank), and starting a programme dedicat-
ed to women in rural areas at Agribank (the country’s
largest state-owned commercial bank). However, as
only about 10 per cent of Vietnamese have a bank
account, the effectiveness of these policies has been
limited (EIU, 2010). Thirdly, many women entrepre-
neurs in developing regions are considered by banks
to be high-risk, low-profit customers, as they oper-
ate informal businesses in low-growth sectors of the
economy (ibid.).
Consequently, various studies have found borrow-
ing from friends and family to be the primary source
of loans for women entrepreneurs. For example, a
study of women entrepreneurs in Nepal found that
such loans made up 85 per cent of women’s borrow-
ing (UNESCAP, 2005). Microfinance is another viable
option, as it does not require traditional collateral.
However, it has been noted, for example in India and
Kenya, that while microfinance loans may be suited
to the needs of subsistence-based women-owned
MSEs, they are often less well adapted to the needs
of growth-oriented ones (ILO, 2008b; Banerjee and
Duflo, 2011).4

93CHAPTER V : LEVERAGING ICTs TO SUPPORT WOMEN’S ENTREPRENEURSHIP
2. Time constraints due to family responsibilities
Most women entrepreneurs in developing countries
suffer from a biased division of household labour along
gender lines, and bear the burden of running a busi-
ness as well as taking care of domestic chores, chil-
dren and the elderly.5 Balancing these responsibilities
with running a business is one of the most frequently
cited challenges for women entrepreneurs.6 Often the
woman is the primary caregiver for the family, and
has to dedicate time to help family members who fall
ill. In effect, with less time to devote to the business,
she is likely to lose out on income, especially if she is
the primary or only worker in the business. Ironically,
although most women entrepreneurs in developing
countries end up working longer hours than men, they
often have less time to dedicate to their business. This
also means that they have less “discretionary time”
for activities that are important to their business, such
as learning new skills or technologies, networking, or
searching for information about market opportunities
(ILO, 2008a; Gill et al., 2010). Unsurprisingly, the extent
to which they become members of business associa-
tions is far less than that of men (World Bank, n.d.).
3. Restricted physical mobilityWomen-owned MSEs in developing countries are of-
ten disadvantaged by restrictions on women’s physical
mobility, which are rooted in social norms, customs,
and family responsibilities. Restrictions due to social
norms range from constraints on appropriate places
for a woman to visit and the times at which she can be
out of the house, to female seclusion in certain coun-
tries of South Asia and the Middle East, where women
are required to avoid any interaction with males who
are not their relatives (Esplen and Brody, 2007). For
example, women in Saudi Arabia are prohibited from
driving, have restricted access to public transporta-
tion, and require permission from a male family mem-
ber to travel overseas (Alturki and Braswell, 2010). Ad-
ditionally, a woman entrepreneur’s mobility may also
be constrained by family obligations.
The impacts of such restrictions on women-owned
MSEs range from discouraging women from starting
a business because of the association with dishon-
our and shame when a woman works outside of her
home (Esplen and Brody, 2007) to putting constraints
on participation by women in activities that are crucial
for business operation and growth, such as access-
ing markets, creating networks or obtaining training
(Bolton and Thompson, 2000). Finding and accessing
markets is frequently cited as one of the main areas
where women entrepreneurs have more difficulties
than men (Alturki and Braswell, 2010; GTZ, 2010;
IFC, 2007b). They may be restricted to accessing in-
formation and business opportunities from within their
immediate physical surroundings (neighbourhood or
city) (OECD, 2006b). A study of women micro-en-
trepreneurs in Mumbai, India, found them to be less
likely than male entrepreneurs to have customers from
outside that city: only 3 per cent of the women re-
ported having customers “at a distance” (compared
with 20 per cent of their male counterparts) and only
1.5 per cent of them ever contacted businesspeople
who live in different areas of the same city by mobile
telephone (Levy et al., 2010). Women entrepreneurs
in Saudi Arabia have been found to be less likely than
those in other countries in the region to be involved in
international trade: only 21 per cent of the 264 wom-
en-owned businesses (202 registered and 62 unreg-
istered) that participated in a study were importing,
exporting, or both (Alturki and Braswell, 2010).
4. Limited skills and training Most women-owned MSEs in developing countries
have limited skills and training, which constrains their
choice of business activities, as well as their ability to
meet the needs of their business. For example, a sur-
vey of entrepreneurs in Kenya in 1999 showed that
although the numbers of men and women owning
micro-enterprises were almost equal (670,727 men
compared to 612,848 women), most women (74.7 per
cent) were in trade-related businesses that did not re-
quire formal skills (Munyua and Mureithi, 2008). It has
also been documented that in developing countries,
women are concentrated in low-profit, low-growth,
informal businesses (IFC, 2010; Ilavarasan and Levy,
2010; Naituli et al., 2008; World Bank, 2009b). In ad-
dition to having limited time available for training, many
of these women entrepreneurs are unlikely to have re-
ceived basic education – further constraining their ac-
cess to suitable skills and training. Although inequality
has been reduced in terms of access to primary edu-
cation, women still make up two thirds of the world’s
774 million illiterate adults (UNDESA, 2010). It could
be argued that their lack of basic education, coupled
with time constraints, results in situations whereby
even those who are motivated and entrepreneurial are
trapped in informal economic activities, lacking the re-
sources and training to grow.

94 INFORMATION ECONOMY REPORT 2011
B. ADDRESSING THE BARRIERS
There are multiple ways in which the use of different
ICT tools can assist women-owned MSEs in over-
coming some of the barriers highlighted above.
1. Choice of ICT toolsThere is limited information on how ICT use among en-
trepreneurs varies by gender. Radios, mobile phones,
PCs, the Internet, telecentres and Internet cafes (and
sometimes a combination of these) appear to hold po-
tential for reaching women entrepreneurs in developing
regions and for meeting their needs. Women-owned
MSEs’ needs for and potential benefits from different
ICTs vary greatly, as illustrated by a study of 77 urban
women-owned MSEs in Kenya (box V.1). Furthermore,
subsistence-based businesses have different needs
compared to businesses that are growth-oriented. For
example, business skills training related to marketing
and business planning may meet the training needs of
growth-oriented businesses, but may only rarely meet
the training needs of subsistence-based enterprises
(Banerjee and Duflo, 2011).
While radio is the most widely diffused ICT tool in many
developing countries, including the poorest commu-
nities without electricity, radio use has certain limita-
tions. It provides one-way communication, making it
challenging to give feedback and to receive informa-
tion tailored to the needs of the listener. Furthermore, it
may be difficult for women entrepreneurs to reconcile
radio schedules with their other business responsibili-
ties, with domestic chores, and with caring for family
members. However, the combined use of radio and
mobile phones in a rural context has, in some cases,
helped to improve access by rural women entrepre-
neurs to information or business skills training (Radloff
et al., 2010; SEWA, 2011). For example, the Women
of Uganda Network (WOUGNET) is a membership or-
ganization that uses ICTs to support women. In the
northern province of Apac, it uses a combination of
community radio and mobile phones to improve its
access to rural women entrepreneurs. Special radio
programmes are broadcast via a local community sta-
tion called Radio Apac, and the content of the shows
is designed to suit the needs and capacities of the
listeners. The women gather in groups to listen to the
radio, and each group has a mobile phone that is used
to pose questions to the radio station. Women find the
programme useful, as it is easy to participate in, and
does not require them to travel or acquire complex
technical skills (Okello, 2010).
The widespread uptake of mobile phones means op-
portunities for reaching and supporting women en-
trepeneurs. A survey of 662 urban micro-enterprises,
carried out in 2009 in Mumbai, found that nearly every
woman who owned or managed a micro-enterprise
had a mobile phone (Ilavarasan and Levy, 2010). Simi-
larly, all urban, women-owned MSEs (including infor-
mal enterprises) in the Kenya study (box V.1) owned a
mobile phone or a SIM card (Nguyen, 2011).
While the value of computers and the Internet is high,
especially for growth-oriented enterprises, these are
less in demand as business tools by women in sub-
sistence-based businesses and by women operating
in areas with an unreliable electricity supply (UNCTAD,
2010; Esselaar et al., 2007; Donner, 2006; Molony,
2007). The study of women entrepreneurs in Mum-
bai found that businesses with up to five hired work-
ers saw no need for a computer (Ilavarasan and Levy,
2010). Telecentres and Internet cafes provide shared,
cost-effective access to PCs and the Internet. How-
ever, there are limitations associated with using such
centres to support women entrepreneurs. For exam-
ple, in a survey of urban micro-enterprises in Mum-
bai, few business owners, and no women business
owners, visited Internet cafes for business purposes
(Ilavarasan and Levy, 2010). This may have been the
result of various factors – including not needing PC
access for the business, lacking time, or the Internet
cafe environment being inappropriate for women. The
latter point may apply especially where the premises
are used primarily by young men practising online
gaming or viewing adult content (Chawla and Behl,
2006; Rangaswamy, 2007; Ilavarasan and Levy, 2010;
Kleine, 2010).
2. Overcoming barriers with ICT-based support
Few studies have looked specifically at the scope for
ICT-based interventions to support women’s entrepre-
neurship. Moreover, few current initiatives in this area
appear to be taking full advantage of ICTs.7 For ex-
ample, a review of the projects listed in IFC’s Women
in Business programme found no reference to ICT
usage (IFC, 2011). Similarly, out of the vast range of
activities coordinated by ILO and aimed at support-
ing women’s entrepreneurship, very few references
are made to the potential of ICTs, and the number of

95CHAPTER V : LEVERAGING ICTs TO SUPPORT WOMEN’S ENTREPRENEURSHIP
Box V.1. Understanding the diverse ICT and business needs of women-owned MSEs in Kenya
The findings from in-depth interviews with women in Kenya who own MSEs in Nairobi and Kisumu, and from practitioners
who work for various business-support organizations, underline the importance of developing a clear understanding of
the information needs of different categories of MSEs. The research was undertaken in 2010 and covered 77 women-
owned MSEs. The respondents were primarily in the trade and services sectors, and were grouped into four categories:
self-employed micro-enterprises (0 employees), micro-enterprises (1–5 employees), very small enterprises (6–15 employ-
ees) and small enterprises (16–50 employees). The study found that the nature of the respondents’ information needs and
communication needs, their ICT usage, and the resources they had available to meet their needs, varied considerably. As
discussed below, the diversity of needs largely corresponded with the number of employees, the type of business, and
the educational level of the owner.
Respondents with 0–5 employees (whose enterprises could largely be described as subsistence-based) indicated the
need for information on basic business skills, such as how to identify products or services, how to carry out bookkeep-
ing, or where to obtain capital. Capital constraints, lack of business skills, bad debts, fluctuations in pricing and revenue
due to seasonality of products, and family burdens all contributed to their financial struggle. These respondents reported
meeting their information needs through personal experience, watching other people around them, and word of mouth via
face-to-face meetings. Most either owned or had access to a mobile phone. Access to radio was ubiquitous too, but few
used it to obtain business information. These respondents’ information searches were limited to the immediate physical
environment, i.e. what they could observe or who they could talk with in their surroundings.
Entrepreneurs with 6–15 employees reported information needs that were primarily concerned with how to market prod-
ucts or services, and how to retain skilled employees. The need to obtain information about accessing affordable finance
remained a priority for some respondents, however the majority of respondents at this level stated that their priority was to
obtain information related to the marketing of their business. Several respondents had attended a number of business skill
training courses, and indicated a demand for further training in specific areas of business management, for example sales
and marketing, or strategy. Most also requested information on the success stories of other businesspeople, in order to
draw inspiration from them and learn from their experiences. These respondents met their information needs through
face-to-face conversations, phone calls, newspapers and television.
The information needs of entrepreneurs with 16–50 employees included those that have been mentioned above, but also
how to access export markets, and how to increase the efficiency and effectiveness of operations. This could involve
creating management information systems and obtaining detailed reporting and monitoring on the business operation.
Respondents with this level of information needs mostly called for “just in time” information on how to deal with business
problems at hand.
Source: Nguyen (2011).
initiatives that currently seek to leverage ICTs for their
delivery is small. An extensive search for ICT-enabled
initiatives returned only a few relevant programmes.
So, in general, very little information is available on the
existing programmes, and very little evidence is avail-
able on their impacts, making a rigorous and system-
atic evaluation of initiatives highly desirable in future
research. The following discussion should primarily be
seen as a first endeavour to identify key areas in which
the use of ICTs should be further explored, in order to
make efforts at facilitating the creation and expansion
of women-owned MSEs more effective.
a. Access to finance
There are a number of ways for ICTs to help lower
the barrier to accessing financing for women entrepre-
neurs. Key factors constraining their access to finance
are a lack of information about credit schemes, and a
lack of financial literacy (ILO, 2008a). ICT tools includ-
ing mobile phones, radio and the Internet can be used
to address this situation, by delivering information and
training on these topics. For example, mobile phones
are being used in an initiative to provide 4,000 women
entrepreneurs in Nyanza, Kenya with increased ac-
cess to financial services, and to financial literacy and
business management skills training. The initiative was
developed to address the problem where, even when
banks create special facilities to support SMEs as a
result of government encouragement, women may
not be able to take advantage of the schemes due to
a number of factors, including insufficient information
about the schemes, lack of collateral or even lack of a
bank account, or not meeting the requirements set by
the bank (Cherie Blair Foundation for Women, 2011).

96 INFORMATION ECONOMY REPORT 2011
As has already been discussed, family and friends are
an important source of funding for women entrepre-
neurs. Mobile remittance services, such as those dis-
cussed in chapter IV, section C, can make the process
of soliciting such funds faster and more cost-effective.
For example, in Kenya, M-PESA has made it easier for
rural women to receive funds from their husbands and
other contacts in the city (CGAP, 2009b). Before the
advent of mobile money, they had to travel from rural
areas by bus to the city or to the post office in the local
town in order to collect the money – a process that,
due to poor transportation, could take up to a week,
which is time that women entrepreneurs often do not
have. With mobile money, they can request the funds
via the telephone, and receive the money at a nearby
mobile money agent.
Many women-owned MSEs in developing countries
are vulnerable to personal risks – such as sickness
of family members, divorce, separation, or accidents,
which, if realized, could lead to women having to
spend the capital that they intended to use for their
business, limiting the growth of the business, or in ex-
treme cases, even leading to the collapse of the busi-
ness (ILO, 2008a). The design and implementation of
innovative mobile micro-insurance schemes geared to
the needs of women entrepreneurs could be devised
to assist them in addressing these risks, thereby in-
creasing their confidence in accessing finance. The
case of Kilimo Salama (cited in chapter II) has dem-
onstrated that it is possible to use mobile money sys-
tems innovatively to increase the reach and afford-
ability of insurance programmes, although little is yet
known about their effectiveness. An extensive search
has failed to detect any case where mobile phones or
other ICT tools have been used for women-focused
micro-insurance initiatives, however. Perhaps similar
products could be developed to meet the needs of
women entrepreneurs. Such insurance could cover
the costs associated with life’s events where the bur-
den falls heavily on women – for example childbirth,
or lost income from caring for a sick child or relative
(Iskenderian, 2011). One such example of a women-
specific insurance product is Ri’aya (Caregiver) Micro-
insurance, from the Microfund for Women, which was
launched in Jordan in April 2010. One year later, it had
a customer base of 13,000 women (Microfund for
Women, 2011). ICTs are currently not used for Ri’aya.
However, leveraging mobile phones for this and similar
schemes could increase their reach to more women.
b. Limited time and physical mobility
Making information available via ICTs is one way to
help women entrepreneurs avoid the need to travel,
thereby helping to deal with their time poverty, and
with constraints on their mobility. For example, com-
munity radio is used by the Toro Development Net-
work in Uganda to broadcast selected commodity
prices on a weekly basis, helping women smallholder
farmers save time on lengthy trips into town to ob-
tain such information. This project has been funded
by Gender, Agriculture and Rural Development in the
Information Society (GenARDIS) – a small grants fund
that was started in 2002 to support initiatives that use
ICTs to empower rural women (Radloff et al., 2010).
ICT tools are also used to reduce the need for travel
related to business transactions such as purchasing.
For example, in Kenya, women business owners in-
creasingly use their mobile phones to make payments
through M-PESA, which allows them to save consid-
erable time and cut down on the need to travel to buy
stock or other inputs. Instead of having to travel long
distances, they can place orders via the telephone, pay
with M-PESA, and get the goods delivered through
the public transport service (Cherie Blair Foundation
for Women, 2011). Although the benefits from ICT use
in this case are similar to those that businesses owned
by men would receive, the impact is potentially greater
on women, as women may be affected more acutely
by particular constraints (e.g. limited mobility or lack
of time).
ICTs can also be effective in enhancing awareness of
and providing access to existing business develop-
ment services, which may otherwise be out of reach
to woman entrepreneurs due to their time and physi-
cal mobility constraints. For example, SEBRAE – a
business development organization in Brazil – works
with a network of cybercafe owners who are trained to
support clients in accessing SEBRAE’s business sup-
port services which are available online. For women
entrepreneurs, the online availability of SEBRAE’s ser-
vices, coupled with the assistance of a trained per-
son to help them use the service, could be particularly
helpful.8
Similarly, ICT tools can improve access by women
entrepreneurs to markets and opportunities that were
previously out of reach. For example, mobile phones
have been used by the Mikocheni Agricultural Re-
search Institute to enable women farmers in the village
of Peko-Misegese, United Republic of Tanzania, to

97CHAPTER V : LEVERAGING ICTs TO SUPPORT WOMEN’S ENTREPRENEURSHIP
obtain higher prices for their crops by reaching a wider
range of potential buyers in other towns that they pre-
viously did not have access to (Radloff et al., 2010).
Similarly, business development organizations can as-
sist members to create a Web presence that allows
them to promote and sell their products and services
to customers in markets that are currently out of reach
to them due to their physical mobility constraints.9
The use of mobile phones, e-mail and Web-based
video calls (such as Skype) may allow women-owned
MSEs to substitute for face-to-face meetings (which
may be unfeasible due to mobility constraints), en-
abling them to build business relationships. Mobile
phones have been found to strengthen business and
social relationships, allowing women entrepreneurs to
expand the geographic area within which they can do
business, and to access opportunities (Ilavarasan and
Levy, 2010).
c. Limited skills and training
As has already been noted (chapter II), ICT tools can
help entrepreneurs increase their productivity through
improved access to skills and training needed for their
businesses. For example, Huduma Kwa Wakulima
(Kenya Farmers Helpline), from Kencall, allows farm-
ers to call a phone number and get responses from
experts to specific questions about farming and live-
stock. Approximately 43 per cent of the calls are from
women farmers who, prior to the helpline, rarely re-
ceived any assistance from agricultural professionals
(Cherie Blair Foundation for Women, 2010).
A variety of ICT tools (most notably radio and telecen-
tres) have been used by the Self-Employed Women’s
Association (SEWA) to reach its 1.3 million members.
SEWA believes that the radio remains an important
ICT tool for supporting and training its members, who
listen during work. SEWA has found radio to be par-
ticularly effective in delivering training to women with
no literacy or technical skills, or electricity for that mat-
ter, in the most remote villages in India. In addition,
telecentres are used by SEWA as community learning
centres (CLCs) to offer ICT training, childcare, disaster
mitigation activities, and a village database containing
information on the local economy and SEWA member
profiles. Recently, these facilities have been extended
to rural and remote areas, through the use of mobile
CLC vans that contain a number of personal comput-
ers and have Internet connectivity and appropriate
software (SEWA, 2011).
Furthermore, ICTs can be better exploited to deliver
training in a way that is suitable for women entrepre-
neurs. In a study of growth-oriented women entrepre-
neurs in the United Republic of Tanzania (Stevenson
and St-Onge, 2005), “just in time” training, where
relevant topics are delivered on demand, was found
to be the preferred method for obtaining skills and
training for women entrepreneurs, as opposed to the
traditional two-to-five-day courses held in classrooms,
where participants need to take time away from their
businesses. It was also recommended that follow-up
sessions should be conducted after the training, in a
one-on-one format. This supports the point that time
constraints are one of the key barriers that limit women
entrepreneurs’ access to skills and training. ICTs are
conducive to the delivery of such training programmes
where the content is delivered on demand through
mobile phones or PCs, allowing access whenever and
wherever convenient. The Cherie Blair Foundation for
Women has started using mobile phones to send fol-
low-up messages to women entrepreneurs participat-
ing in its training programmes, and to connect women
entrepreneurs. However, as the project only began in
June 2010, little information is available so far on its
impact (Cherie Blair Foundation for Women, 2011).
C. POLICY RECOMMENDATIONS
To date, insufficient programme or policy attention has
been given to the application of ICT tools in existing or
new initiatives supporting women entrepreneurs. This
seems to be an untapped potential. ICTs should be
used as an enabling tool that enhances the effective-
ness of existing initiatives. For example, organizations
supporting women entrepreneurs should explore ICT-
based solutions as an additional strategy, to comple-
ment face-to-face meetings for trade-promotion activ-
ities. In addition to organizing trade missions to other
countries or markets, or trade fairs that only a limited
number of women entrepreneurs have the resources
to participate in, online meetings could be arranged
between women entrepreneurs on the one hand, and
potential business partners or customers from foreign
markets on the other. These meetings could aim at
initiating new business relationships, and could sub-
sequently support the women entrepreneurs with
follow-up activities.
Any initiatives aimed at supporting women-based en-
trepreneurship using ICTs should be tailored to the

98 INFORMATION ECONOMY REPORT 2011
specific needs of the intended beneficiaries – whether
they are aimed at making incomes sustainable or at
facilitating growth. In order for services to be accessi-
ble and relevant, they need to be based on an under-
standing of the specific information, knowledge, and
support that are demanded. Support programmes
addressing SMEs in general (such as the well-known
SME Toolkit produced by IFC) run the risk of not be-
ing specific enough to be useful to some beneficiaries.
Each subgroup of women-owned MSEs has different
needs and capabilities, and it is important to adjust the
support accordingly. For example, informal micro-en-
terprises with fewer than five employees are unlikely to
have access to computers or to need Web-based ser-
vices or information (Ilavarasan and Levy, 2010). Most
likely, they are less interested in business skills training
or marketing, but more interested in the basics of what
to buy and sell and how to get finance. Meanwhile,
enterprises of 10–15 employees with computers are
more likely to have growth-related needs – such as
learning how to expand their markets, learning new
business skills, and upgrading their ICT skills (box V.1).
A needs assessment should therefore be the starting
point for the development of new ICT-based initiatives,
and an ongoing impact evaluation should be used
to inform decisions. The high and rapidly increasing
penetration rate of mobile phones amongst women
entrepreneurs, including those in subsistence-based
enterprises, presents an opportunity to obtain feed-
back and information that would allow policymakers
and agencies to develop a clear understanding of their
situation. It is important that initiatives take into con-
sideration the capabilities, circumstances, context of
usage and preferences of the target group, in order for
them to be effective (as highlighted in box V.1).
An illustration of the problem of insufficient assess-
ment of needs is the case of the Cameroon Chamber
of Commerce, Industry, Mines and Crafts, where a
multimedia centre with Internet facilities that was cre-
ated for its members who are women entrepreneurs
in the textile sector went largely unused. A major rea-
son for this was that the centre was designed without
understanding the specific situation of its target us-
ers, resulting in the centre being located in an area
that was difficult to get to by public transport and had
opening hours (8 a.m.–4 p.m.) that were inconvenient
for women entrepreneurs. Furthermore, although
most of its target users were unfamiliar with the Inter-
net, there was no training organized for them to learn
how to use the centre. Finally, its existence was not
well promoted (Busken and Webb, 2009).
It is worth noting that lessons from the field have high-
lighted the need for training programmes to be de-
veloped that take into account the limited skills and
training, and even the basic level of education, of most
women who own MSEs. Hence, lessons from pro-
grammes produced by IICD (box V.2) and GenARDIS
(Radloff et al., 2010) underscore the need for skills
development, and to involve women entrepreneurs in
content development.
Box V.2. Supporting women entrepreneurs with ICT: lessons from the field
The International Institute for Communication and Development (IICD) and its partners have suggested a number of les-
sons learnt in using ICT to support women entrepreneurs based on the organization’s experience with the implementation
of 54 ICT programmes for producers and entrepreneurs in nine countries in Africa and Latin America. IICD found that fe-
male participants in its programmes were held back by a combination of low levels of literacy and technical skills, complex
cultural barriers such as unequal access to information compared to men, and an overall lack of power and self-esteem.
Furthermore, programmes supporting entrepreneurs often did not include relevant information for female producers and
entrepreneurs, and overlooked their participation in content-generation, exacerbating the challenges for this group.
A number of approaches were reported to be helpful in addressing barriers constraining women entrepreneurs, including:
(a) Paying attention to the specific information needs of women entrepreneurs, and involving them in content-
generation;
(b) Using audio and multimedia to overcome low levels of literacy;
(c) Tailoring training locations and timings to suit female beneficiaries; and
(d) Ensuring that trainers are gender-sensitive in terms of the training methodology – for example, giving
participants group assignments rather than individually oriented training.
Source: UNCTAD, based on information provided by IICD.
99CHAPTER V : LEVERAGING ICTs TO SUPPORT WOMEN’S ENTREPRENEURSHIP
Finally, the absence of systematic, evidence-based
impact evaluation is observed in current initiatives us-
ing ICTs, including those focusing on women entrepre-
neurs. A search for evidence of impact, even among
the above-mentioned programmes, returned mostly
success stories and brief anecdotal reports. There is
a need for more comprehensive evaluations that are
based on empirical evidence, and that provide a real-
istic picture of the programme’s impact for the majority
of its recipients and not just isolated success stories.
NOTES1 For a broader discussion on how to apply a gender lens to issues related to science, technology and innovation, see
UNCTAD (forthcoming).
2 A distinction can be made between “practical gender interests” (responses to address women’s immediate perceived needs without challenging women’s subordination) versus “strategic gender interests” (efforts at creating more satisfactory, alternative arrangements to those which exist) (Molyneux, 1985). Under this categorization, the discussion in this section focuses mainly on ICTs’ role in addressing practical gender interests.
3 Customary practices are unwritten rules and norms established by long usage (based on customs and cultures) (EIU, 2010).
4 Several factors make microfinance less attractive to growth-oriented businesses. Microfinance involves small loans that need to be repaid quickly. The interest rate is considerably lower than that charged by informal money lenders (which is the alternative for a women entrepreneur who does not have collateral or relatives and friends who can lend the money), but it is considerably higher than bank rates. MFIs typically require weekly meetings, which is time-consuming.
5 On average, women worldwide spend about two hours a day on domestic work – twice as much time as men. In less developed regions they can spend up to five times as many hours as men on unpaid domestic work (UNDESA, 2010). Additionally, caring for relatives alone takes up an average of 55 minutes of a woman’s day in Asia (ibid.).
6 In-depth interviews with women-owned MSEs in Ghana, for example, found that “balancing work and family life” was considered the area in which the women faced the greatest barriers, compared with their male counterparts (IFC, 2007b).
7 For example, at a recent workshop on women’s entrepreneurship organized by the World Bank, ICTs were not mentioned in the programme – despite the work carried out within the Bank on ICT4D (http://go.worldbank.org/XI1101SN20).
8 Information provided by SEBRAE.
9 There are numerous services available that enable a business to set up a website and promote and sell its products,including free and fee-paying, and not-for-profit and commercial services. Examples include Open Entry, Etsy, Shopify, and Amazon Marketplace.


Developing a thriving private sector is a priority for Governments in most de-
veloping countries. The private sector is an indispensable source of job cre-
ation, government revenue and economic diversification, all of which are key
factors in achieving sustainable economic growth and development. From
the perspective of facilitating PSD, this report has underlined the potential
contributions that effective use of ICTs – in the private and the public sec-
tor – can make. While ICT use is not a panacea, it represents an untapped
potential to accelerate progress in regard to PSD. The scope for leveraging
such technologies has been greatly enhanced by recent changes in the ICT
landscape, with many more MSEs now being exposed to affordable interac-
tive communication tools.
POLICYRECOMMENDATIONS
6

102 INFORMATION ECONOMY REPORT 2011
The previous chapters have provided illustrations of
how PSD has been affected by ICTs in the framework
of four interfaces: (a) the development of ICT infra-
structure; (b) enhanced business use of ICTs; (c) the
ICT sector; and (d) using ICTs to make PSD interven-
tions more effective. In view of that analysis, ICTs have
a clear role to play in government interventions at each
level (table VI.1).
At the macro level, contributions from ICTs are related
to reforms that make the investment climate more
competitive and open. Promoting the development
of a competitive ICT infrastructure generally requires
the liberalization and appropriate regulation of the
telecommunications sector, and the mobilization of
private investment. The drive towards greater global
economic integration, and the need for developing
economies to compete within this framework, further
underscore the importance of ICT use in this context,
especially as part of efforts to reform the business en-
vironment. As noted in chapter III, there is still scope
for regulatory improvements in this area in many de-
veloping countries.
Meso-level interventions aim to create a more enabling
business environment. Future business environment
reform processes should build on the substantial body
of knowledge that has been developed with regard to
using ICTs to connect citizens and enterprises with
their Governments, in a number of fields. These in-
clude the improvement of specific regulatory functions
– such as business registration, filing tax returns, and
trade facilitation – and of the ways in which private en-
terprises and their representative organizations liaise
with Governments. At this level, Governments should
also consider how to create a regulatory environment
that supports the roll-out of mobile money services
and related applications, which can alleviate some
of the financial barriers that are faced particularly by
MSEs.
ICT-related micro-level interventions may improve the
productivity and competitiveness of private firms in
two principal ways. Firstly, Governments can create
the conditions in which it makes sense for enterprises
to invest in and use ICTs, and in which the ICT sector
is able to respond to the demands of the business
community. They can establish the relevant ICT infra-
structure, and facilitate the opening and functioning
of relevant ICT markets. Secondly, providers of busi-
ness-development and financial services can improve
the delivery of support to enterprises with ICTs. When
applied effectively, ICTs reduce the costs of deliver-
ing the services, and extend their outreach to client
groups that would otherwise be hard to service.
Against this background, Governments and their devel-
opment partners that are involved in policy formulation
should take a holistic and comprehensive approach to
leveraging ICTs for PSD. On its own, new technology
is likely to have a limited effect on private sector devel-
opment. Broader reforms are necessary in developing
countries to provide the appropriate physical and policy
frameworks. The potential of ICTs cannot be fully re-
alized without adequate infrastructure and skills and a
commitment by government to free and open markets.
Governments can work with the private sector to create
an investment climate that encourages the use of ICTs
within private firms and also across the government
bureaucracy. When carefully integrated into reform pro-
cesses and considered as part of a wider reengineering
process, ICTs stand the best chance of contributing to
cost reduction, to the promotion of transparent, rules-
based systems, and to better communication between
the public and private sectors.
When exploring the potential role of ICTs in supporting
PSD, the diverse and multi-faceted needs of enter-
prise have to be placed at the centre of the analysis.
All enterprises value access to relevant and timely in-
formation, as well as the possibility to communicate
effectively with customers, suppliers and peers, and
with government authorities. As firms grow and their
capabilities are enhanced, their demand for effective
storage and processing of information is accentuated,
too. Nevertheless, the extent to which improved ac-
cess to a certain technology will make a difference de-
pends on the enterprise itself, and also on the context
in which it operates. Are relevant ICT tools and servic-
es available and affordable? Does the enterprise have
sufficient knowledge about how to use the technolo-
gies and applications? Can it find relevant content,
services and support that match its precise require-
ments, and can it influence their supply? To what ex-
tent are its clients and suppliers ICT-proficient? Is the
government – at national or subnational level – making
effective use of ICT solutions in its dealings with the
private sector?
In some areas of intervention, considerable experience
has already been built up and there is ample evidence
to guide the policy directions to follow. This applies,
for example, to policies that are aimed at creating an
open and competitive environment that is conducive
to extending relevant ICT infrastructure at affordable
prices. By contrast, some opportunities for ICT use
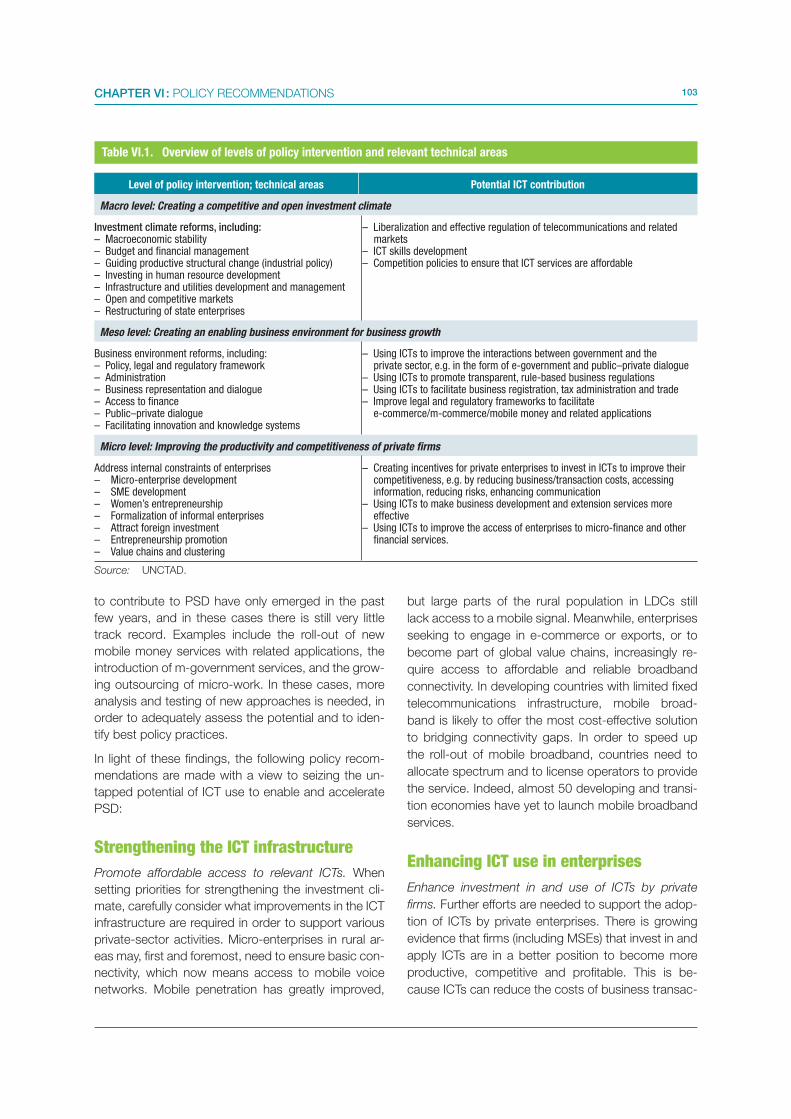
103CHAPTER VI : POLICY RECOMMENDATIONS
to contribute to PSD have only emerged in the past
few years, and in these cases there is still very little
track record. Examples include the roll-out of new
mobile money services with related applications, the
introduction of m-government services, and the grow-
ing outsourcing of micro-work. In these cases, more
analysis and testing of new approaches is needed, in
order to adequately assess the potential and to iden-
tify best policy practices.
In light of these findings, the following policy recom-
mendations are made with a view to seizing the un-
tapped potential of ICT use to enable and accelerate
PSD:
Strengthening the ICT infrastructurePromote affordable access to relevant ICTs. When
setting priorities for strengthening the investment cli-
mate, carefully consider what improvements in the ICT
infrastructure are required in order to support various
private-sector activities. Micro-enterprises in rural ar-
eas may, first and foremost, need to ensure basic con-
nectivity, which now means access to mobile voice
networks. Mobile penetration has greatly improved,
but large parts of the rural population in LDCs still
lack access to a mobile signal. Meanwhile, enterprises
seeking to engage in e-commerce or exports, or to
become part of global value chains, increasingly re-
quire access to affordable and reliable broadband
connectivity. In developing countries with limited fixed
telecommunications infrastructure, mobile broad-
band is likely to offer the most cost-effective solution
to bridging connectivity gaps. In order to speed up
the roll-out of mobile broadband, countries need to
allocate spectrum and to license operators to provide
the service. Indeed, almost 50 developing and transi-
tion economies have yet to launch mobile broadband
services.
Enhancing ICT use in enterprisesEnhance investment in and use of ICTs by private
firms. Further efforts are needed to support the adop-
tion of ICTs by private enterprises. There is growing
evidence that firms (including MSEs) that invest in and
apply ICTs are in a better position to become more
productive, competitive and profitable. This is be-
cause ICTs can reduce the costs of business transac-
Level of policy intervention; technical areas Potential ICT contribution
Macro level: Creating a competitive and open investment climate
Investment climate reforms, including:– Macroeconomic stability– Budget and financial management– Guiding productive structural change (industrial policy)– Investing in human resource development– Infrastructure and utilities development and management– Open and competitive markets– Restructuring of state enterprises
– Liberalization and effective regulation of telecommunications and related markets
– ICT skills development– Competition policies to ensure that ICT services are affordable
Meso level: Creating an enabling business environment for business growth
Business environment reforms, including:– Policy, legal and regulatory framework– Administration– Business representation and dialogue– Access to finance– Public–private dialogue– Facilitating innovation and knowledge systems
– Using ICTs to improve the interactions between government and the private sector, e.g. in the form of e-government and public–private dialogue
– Using ICTs to promote transparent, rule-based business regulations– Using ICTs to facilitate business registration, tax administration and trade – Improve legal and regulatory frameworks to facilitate
e-commerce/m-commerce/mobile money and related applications
Micro level: Improving the productivity and competitiveness of private firms
Address internal constraints of enterprises– Micro-enterprise development– SME development– Women’s entrepreneurship– Formalization of informal enterprises– Attract foreign investment– Entrepreneurship promotion– Value chains and clustering
– Creating incentives for private enterprises to invest in ICTs to improve their competitiveness, e.g. by reducing business/transaction costs, accessing information, reducing risks, enhancing communication
– Using ICTs to make business development and extension services more effective
– Using ICTs to improve the access of enterprises to micro-finance and other financial services.
Table VI.1. Overview of levels of policy intervention and relevant technical areas
Source: UNCTAD.
104 INFORMATION ECONOMY REPORT 2011
tions, provide tools for better business management,
and enhance the capacity to get goods and services
to the market. However, the benefits from the different
uses of ICTs are not distributed uniformly. The value
to an enterprise of having access to a certain technol-
ogy depends on its size, industry, and market orien-
tation. Many MSEs, including in the informal sector,
are hesitant about investing in some ICTs; this may
reflect educational, literacy and cost barriers, or sim-
ply that they do not see the relevance of using such
tools in their business. The major exception to this is
mobile phones. Most MSE owners and managers in
developing countries already own and frequently use
a mobile phone – increasingly for business purposes.
Obtaining market information and building customer
relations appear to be the prime business needs that
are catered for through mobile phone use.
While much benefit from enhanced affordable access
to relevant ICTs will be the result of appropriation by
the private sector itself, independent of any particu-
lar government or donor intervention, the chances for
such gains increase when the regulatory environment
is conducive to the use of ICTs by enterprises. Gov-
ernments and development actors need to learn from
private sector experience and intervene in ways that
help enterprises and civil society to seize opportunities
created by developments in technology. Moreover,
care should be taken not to crowd out private-sector
service providers when launching government initia-
tives, and rather work with the market.
Include ICT modules in business training programmes.
Many entrepreneurs in developing countries, and
especially in LDCs, lack the necessary capacity or
awareness to take full advantage of ICTs. Thus, even
if they have access to mobile phones or the Internet,
they may not know how best to leverage them for their
business operations. One way to address this issue is
to integrate ICT skills development into general busi-
ness-management training curriculums. Depending
on the beneficiaries targeted, such training may range
from providing advice on how to use mobile phones
as a business tool to more advanced training in how to
use various technologies and applications to improve
operational management, customer relationship man-
agement, or resource planning.
Adopt regulatory frameworks that help to enhance
confidence in the use of new technology or the new
application of known technology. A prerequisite for
more widespread uptake of ICTs for commercial pur-
poses is that enterprises and consumers trust the
systems. In many countries, adequate legal frame-
works still need to be adopted and enforced in order
to unleash the full potential of electronic transactions.
The need to act is accentuated by the increased use
of mobile devices for commercial transactions, which
raises new regulatory issues. As this is particularly rel-
evant for low-income countries – where mobile plat-
forms are the main enabler of electronic transactions
for businesses, Governments and consumers – sup-
port from the international community is highly desir-
able.
Promoting the ICT producing sectorFacilitate the expansion of the ICT sector. A thriving
ICT sector services local markets and is often a source
of local innovation and dynamic entrepreneurship.
Thanks to technological change and new business
models, many more employment opportunities are
emerging in the ICT sector of low-income countries.
As part of their efforts to promote PSD, Governments
should carefully consider how best to tap into the
new opportunities presented, for example by social
outsourcing, micro-work, and mobile-sector micro-
enterprises. While the liberalization of ICT markets and
increased competition have contributed to an expan-
sion of this sector in most countries, faster ICT growth
and employment creation can be facilitated through
policy interventions aimed at:
(a) improving the availability of the skills needed in
the ICT sector;
(b) stimulating ICT uptake among local firms,
including MSEs;
(c) providing appropriate ICT infrastructure
and regulatory frameworks that help create
confidence among enterprises and consumers;
(d) promoting and clustering entrepreneurship and
innovations through incubation and ICT parks;
and
(e) using government procurement to create
demand among local ICT enterprises.
Leveraging ICT use to make PSD interventions more effective
Make ICT use an integral part of business environment
reforms. ICTs have been found to play a useful role in
enhancing, extending, and contributing to the sustain-
ability of business environment reforms. The core of
this effort is around improving the governance of the
economy, and the interactions between the Govern-

105CHAPTER VI : POLICY RECOMMENDATIONS
ment and the private sector. Chapter IV showed how
ICTs contribute to improving the legal and regulatory
governance of the private sector, by simplifying and
codifying rules and regulations, reducing compliance
costs and promoting transparency. In order for the in-
troduction of ICTs into business environment reforms
to have the greatest impact, however, there is a need
to shift from passive government information systems
to more interactive ones. If ICTs are used simply to
scan or digitize paper-based systems or to place basic
information on the Internet, the beneficial effect may
be minimal. Such approaches can be taken further by
creating more interactive systems in which business
owners and managers are enabled to use online fa-
cilities to register a business, file tax reports, and pay
fees. When applied effectively, ICT-based solutions
have led to major reductions in the time it takes to reg-
ister a company or obtain a licence, and to increases
in government revenue and greater transparency.
Examine the relationship between ICTs and enter-
prise formality. In many developing countries, infor-
mal-sector enterprises account for a very large part
of the private-sector activity. Better regulations, and
better access to regulations, can be effective ways
of empowering informal-sector enterprises. Lowering
the bar (making it easier, less costly and less time-
consuming to register companies) may enhance the
willingness of companies to formalize. However, there
appears to be value in better understanding how in-
formal enterprises can be made aware of the process
and benefits of formalization – especially through ICTs
that they are already using, such as mobile phones.
Since ICTs have been able to connect formal and in-
formal businesses to market opportunities, it should
also be possible to use these technologies to connect
them to government programmes and services.
Leverage ICTs in the delivery of business development
services. Chapter IV showed how ICT use can extend
the reach of business development services (BDS) to
new and growing enterprises, partly by overcoming
the “tyranny of distance”, and by reducing the cost of
service delivery. Some BDS providers have used the
Internet to provide information and guidance to cli-
ents. However, few such initiatives have drawn on the
potential of the Internet as a more dynamic and inter-
active mechanism for information, training and advi-
sory services. Although innovative practices are more
widespread in the agricultural sector, even in that sec-
tor there is still potential for further expansion in ICT
use. Greater use of mobile phones by MSE owners
and smallholder farmers in developing economies of-
fers scope for novel ways of providing BDS. While the
use of mobile phones offers great scope for extend-
ing BDS to enterprises that are typically unaware of
service providers, or are too far away from them, few
conventional BDS providers have so far integrated the
use of such technology into their programmes. At the
same time, rather than opting for any single techni-
cal solution, BDS providers may leverage the power of
using a combination of different ICT tools.
Leverage mobile money services to create more in-
clusive financial markets. Mobile money services hold
great promise to enable cost reductions in the provi-
sion of financial services, especially to MSEs that are
currently poorly catered for. In some developing coun-
tries, including LDCs, mobile money systems have
quickly been embraced by small-scale business own-
ers and managers as a more accessible, secure and
affordable way of making financial transactions. How-
ever, there is a large untapped potential for mobile
money services, and mobile provision of micro-finance
and other financial services to be leveraged for PSD.
The level of uptake and the impact on enterprises var-
ies from country to country. In this context, attention
should be paid to the extent to which various mobile
money services – most of which were launched as
person-to-person services – can be adapted to the
situation and specific needs of MSEs. States and their
central banks should take the opportunity to explore
ways of absorbing these enterprises into the financial
system through mobile transactions. Developing-
country Governments (including in several LDCs) will
be expected to pioneer new legislation and regula-
tions to make sure that maximum gains for society are
reaped from the use of mobile money. In order to cap-
ture the full potential in this area, dedicated research
is needed to extract lessons from the early adopters.
The international community should play an important
role in supporting the development of sound regula-
tory frameworks and relevant institutions.
Recognize the gender dimension. To date, little pro-
gramme or policy attention has been given in exist-
ing or new initiatives to the application of ICT tools to
support women entrepreneurs. This is an untapped
potential. While ICTs may do little to redress under-
lying societal structures that hamper opportunities
for women entrepreneurs, they can contribute with
regard to several practical gender-related issues. As
stressed earlier, some barriers to enterprise growth
and development are particularly pertinent to women

106 INFORMATION ECONOMY REPORT 2011
entrepreneurs. Four specific challenges, which the
use of ICTs can help to address to some extent, are
(a) access to finance; (b) limited skills and training; (c)
lack of time due to family commitments; and (d) limited
physical mobility. ICTs should be used as an enabler
to overcome these challenges and to enhance the
effectiveness of existing initiatives. For example, or-
ganizations supporting women entrepreneurs should
explore ICT-based solutions as an additional strategy,
to complement face-to-face meetings for trade pro-
motion. Moreover, lessons from the field highlight the
need for training programmes to be developed that
take into account the limited skills and training, and
even the basic level of education, of most women who
own MSEs. In addition, women entrepreneurs should
be invited to participate at the content-development
stage of relevant initiatives.
Overall recommendationsReflect ICTs better in PSD strategies. To date, most
national PSD strategies, as well as those developed
by donor agencies, make relatively few references to
the role of ICTs. While there is a general view that ICTs
contribute to business productivity and competitive-
ness, the details on how this can be promoted are typ-
ically scant. PSD strategies should explicitly recognize
that ICTs can contribute to the development of the pri-
vate sector through interventions at micro, meso and
macro levels. Interventions should also acknowledge
the importance of a multi-level response to this topic
and not treat ICTs in isolation, thus acknowledging the
four ICT–PSD interfaces.
Develop guidelines for donors. In collaboration with
UNCTAD and other relevant organizations, the Donor
Committee for Enterprise Development could develop
guidelines for donor and development agencies, and
their programme partners (i.e. developing-country Gov-
ernments and business membership organizations), on
how to integrate the ICT dimension in future PSD strat-
egies. Such guidelines would help to establish a bridge
between the donor assistance which relates to PSD
and that which relates to ICT for development.
Interventions need to be demand-driven. In order to
enhance the likelihood that the spread of ICTs will con-
tribute to the development of the private sector, the de-
sign and implementation of policies must be grounded
in a solid understanding of the specific needs and situ-
ations of a range of different enterprises. In this con-
text, attention should also be paid to MSEs, as these
face particular barriers and challenges. Moreover, as
has been shown in earlier chapters, even within the
group of MSEs, there are wide differences in needs
and capabilities. Thus, the diversity of the private sec-
tor as well as that of ICTs must be carefully factored
in when Governments, donors and other stakeholders
develop policies, strategies and specific interventions
aimed at leveraging ICTs for PSD. In this context, poli-
cymakers and practitioners should actively seek the
input and engagement of enterprises in programme
design and implementation. Their direct involvement
brings relevant experience to the fore, and helps to fo-
cus interventions on outcomes that are of higher value
to end-users.
Leverage partnerships. A more demand-driven ap-
proach to policy interventions adds importance to the
development of effective partnerships between Gov-
ernments, donors, the private sector and civil soci-
ety. Lessons should be learned from the experience
to date with regard to partnership implementation in
the field of ICT for development. Five success factors
have been identified for such partnerships (Geldof et
al., 2011), namely (a) paying detailed attention to the
local context and ensuring the involvement of the lo-
cal community in the implementation; (b) setting clear
and agreed development outcomes; (c) building sus-
tainability and scalability into the design of the part-
nership; (d) creating a foundation of trust, honesty,
openness, mutual understanding and respect; and (e)
having a supportive wider ICT environment in place,
both in terms of policy and infrastructure.
Devote adequate resources to measurement and im-
pact assessment. An absence of systematic, evidence-
based impact evaluation has been observed in current
initiatives using ICTs to promote PSD. A lack of data
and of resources to undertake rigorous assessments
has led to excessive reliance on “success stories” and
anecdotal evidence. There is a need to accelerate the
production of reliable and internationally comparable
statistics that examine ICT use by both enterprise and
government. In this area, the international community
can support the existing efforts being undertaken by
the Partnership on Measuring ICT for Development.
With a view to developing a richer base of knowledge,
it can also finance more comprehensive project and
policy evaluations based on empirical evidence con-
ducted through independent research. Such initiatives
are needed to provide a more realistic picture of pos-
sible impacts and to generate valuable knowledge for
future policymaking and interventions.

107REFERENCES
REFERENCES
Adams RH (1998). Remittances, investment and rural asset accumulation in Pakistan. Economic Development
and Cultural Change. 47:155–73.
ADB (2000). Private Sector Development Strategy. Manila.
ADB (2006). Private Sector Development: A Revised Strategic Framework. Manila.
AfDB (2008). Strategy update for the bank’s private-sector operations. Prepared by the Infrastructure, Private
Sector, Water and Regional Integration.
AfDB and World Bank (2011). Leveraging Migration for Africa: Remittances, Skills, and Investments. AfDB and
the World Bank. Washington, D.C.
Aker J (2010). Dial “A” for agriculture: using information and communication technologies for agricultural
extension in developing countries. Tufts University, Economics Department and the Fletcher School.
Medford MA02155.
Alturki N and Braswell R (2010). Businesswomen in Saudi Arabia: Characteristics, challenges, and
aspirations in a regional context. Available from www.monitor.com/Expertise/BusinessIssues/
EconomicDevelopmentandSecurity/tabid/69/ctl/ArticleDetail/mid/705/CID/20102207132025370/
CTID/1/L/en-us/Default.aspx.
Analysys Mason (2010a). Assessment of economic impact of wireless broadband in India. Report for GSMA.
November.
Analysys Mason (2010b). Assessment of economic impact of wireless broadband in South Africa. Report
for GSMA. December.
Anderson G (2008). Integrating mass media in small enterprise development: Current knowledge and good
practices. Employment Sector. Employment Working Paper No. 2. ILO. Geneva.
Anderson J and Kupp M (2008). Serving the poor: Drivers of business model innovation in mobile. Info. 10 (1):5–12.
Anderson J et al. (2010). The last frontier: market creation in conflict zones, deep rural areas and urban slums.
California Management Review. 52(4):6–28.
Andersson T et al. (2004). The Cluster Policies Whitebook. Holmbergs i Malmö. Malmö, Sweden.
Bain R (2011). The power of text in the developing world. Research. Source: TxtEagle, 20 January 2011.
Available from http://www.research-live.com/features/the-power-of-text-in-the-developing-world/4004395.
article.
Banerjee A and Duflo E (2011). Poor economics: A radical rethinking of the way to fight global poverty.
Public Affairs.
Bångens L and Söderberg B (2011). Mobile money transfers and usage among micro- and small businesses
in Tanzania. Available from http://www.spidercenter.org/.
Barbarasa E (2010). Catalyzing support for small and growing businesses in developing countries: Mapping the
policies of international development donors & investors. Aspen Network of Development Entrepreneurs.
Washington, D.C.
Barendregt B (2008). Sex, cannibals, and the language of cool: Indonesian tales of the phone and modernity.
The Information Society. 24(3):160–170.
Baumol WJ (2010). The Micro Theory of Innovative Entrepreneurship. Princeton University Press. Princeton.
Bayala S et al. (2010). Dynamiques et rôle économique et social du secteur informel des TIC au BF. Rapport
de recherche RAP.R.TIC INFOR 3.1. Yam Pukri. Ouagadougou.
Beck T et al. (2002). Financing patterns around the world: The role of institutions. Policy Research Working
Paper 2905. World Bank.Washington, D.C.
Bolton WK and Thompson JL (2000). Entrepreneurs: Talent, Temperament, Technique. Butterworth
Heinemann. London.
Broadband Commission (2010). A 2010 leadership imperative: The future built on broadband.
Available from http://www.broadbandcommission.org/outcomes.html.

108 INFORMATION ECONOMY REPORT 2011
Burrell J (2010). Evaluating shared access: Social equality and the circulation of mobile phones in rural Uganda.
Journal of Computer-Mediated Communication. 15(2):230–250.
Busken I and Webb A (2009). African Women & ICTs: Investigating Technology, Gender and
Empowerment. International Development Research Centre. Available from
http://www.idrc.ca/openebooks/399-7/#page_133.
Bylund P (2005). International Desktop Study. SMEs and poverty reduction.
An update for the Centre for Enterprise Development.
Calandro E et al. (2010). Comparative sector performance review 2009/2010: Towards evidence-based ICT
policy and regulation. Volume two. Policy Paper 2. ResearchICTafrica.net.
Capsuto T (2011). Mobile payments: The devil is in the details. KIVA Blog. KIVA.
CGAP (2009a). Notes on branchless banking policy and regulation in Mexico. March.
CGAP (2009b). Poor people using mobile financial services: Observations on customer usage
and impact from M-PESA. Available from http://www.cgap.org/gm/document-1.9.36723/BR_Poor_People_
Using_Mobile_Financial_Services.pdf.
CGAP (2010). Financial Access 2010: The State of Financial Inclusion Through the Crisis. CGAP and the World
Bank Group. Washington, D.C.
CGAP and Dalberg Global Development Advisers (2010). Improving Access and Reducing Costs
of International Remittances through Branchless Banking Solutions. Available from http://www.cgap.org/
gm/document-1.9.49049/Dalberg-CGAP_Intl_Remit_Branchless_Banking_Findings.pdf.
Chatain PL et al. (2011). Protecting Mobile Money against Financial Crimes. Global Policy Challenges and
Solutions. World Bank. Washington, D.C.
Chawla D and Behl R (2006). Perception study of cybercafé users. Global Business Review. 7(1):17–41.
Chen M (2005). The business environment and the informal economy: Creating conditions for poverty
reduction. International Conference on Reforming the Business Environment: From Assessing
Problems to Measuring Results. Committee of Donor Agencies for Small Enterprise Development. Cairo.
Cherie Blair Foundation for Women (2011). Input to the Information Economy Report 2011.
E-mail correspondence.
Chile Compra (2008). ChileCompra, the Public Procurement Bureau facilitates access to the public sector.
Available from http://www.chilecompra.cl/english/whatischilecompra.html.
Chipchase J (2009). Mobile phone practices and the design of mobile money services for emerging markets.
Available from http://www.janchipchase.com/publications.
Chipchase J and Tulusan I (2007). Shared Phone Practices: Exploratory Field Research from Uganda
and Beyond. Available from http://janchipchase.com/content/presentations-and-downloads/
shared-phone-practices/.
Committee of Donor Agencies for Small Enterprise Development (2001). Business Development
Services for Small Enterprises: Guiding Principles for Donor Intervention. Washington, D.C.
Comisión Nacional Bancaria y de Valores (2010). Reporte de inclusión financiera. Junio 2010.
Commonwealth of Australia (2000). Private Sector Development through Australia’s Aid Programme.
Australian Agency for International Development. Canberra.
DCED (2008). Supporting Business Environment Reforms: Practical Guidance for Development Agencies.
2008 edition. DCED. Cambridge. Available from www.enterprise-development.org.
De Silva H and Ratnadiwakara D (2009). Using ICT to reduce transaction costs in agriculture through better
communication: A case study from Sri Lanka. LIRNEasia. Colombo. Available from http://www.lirneasia.net.
Deloitte (2008). Economic impact of mobile communications in Serbia, Ukraine, Malaysia, Thailand,
Bangladesh and Pakistan. Report for Telenor ASA. Available from www.telenor.rs/media/TelenorSrbija/
fondacija/economic_impact_of _mobile_communications.pdf.
Deutsche Bank Research (2010). Enterprise 2.0: How companies are tapping the benefits of Web 2.0 –
Digital economy and structural change. Economics. No. 78. 8 September. Available from www.dbresearch.
com.

109REFERENCES
Devi P (2008). E-governance for small and medium enterprises in a developing country like Fiji: Potentials and
problems. In: Bhattacharya J, ed. Critical Thinking in e-Governance. SIGeGOV. Available from
http://www.csi-sigegov.org/critical.html.
Dias DB and D McKee (2010). Protecting branchless banking consumers: Policy objectives and
regulatory options. Focus Note 64. CGAP. Washington, D.C.
Dittus P and Klein M (2011). On harnessing the potential of financial inclusion. BIS Working Paper No. 347.
Bank for International Settlements, Monetary and Economic Department. Basel.
Donner J (2006). The use of mobile phones by microentrepreneurs in Kigali, Rwanda: Changes to social and
business networks. Information Technologies and International Development. 3(2):3–19.
Donner J (2009). Mobile-based livelihood services in Africa: Pilots and early deployments. In:
Fernández-Ardèvol M and Ros A, eds. Communication Technologies in Latin America and Africa:
A Multidisciplinary Perspective. IN3:37–58. Barcelona.
Donner J and Escobari M (2009). A review of the research on mobile use by micro and small enterprises
(MSEs). In: Heeks R and Tongia R, eds. ICTD 2009 Proceedings. Carnegie Mellon University:17–26. Doha.
DPI (2003). Report of the International Conference on Financing for Development. Monterrey.
Duncombe RA and Heeks RB (2002). Enterprise across the digital divide: information systems and
rural micro-enterprise in Botswana. Journal of International Development. 14(1):61–74.
Duncombe RA and Molla A (2009). The formalisation of information systems in sub-Saharan African
small and medium-sized enterprises. African Journal of Information Systems. 1(2):1–29.
Economist Intelligence Unit (2010). Women’s economic opportunity: A new global index and ranking.
Economist Intelligence Unit. Available from http://graphics.eiu.com/upload/WEO_report_June_2010.pdf.
El-Shenawy N (2011). Statistical compilation of the ICT sector and policy analysis in Egypt. Orbicom. Montreal.
Esim S (2001). See how they grow: business development services for women’s business growth. International
Center for Research on Women. Washington, D.C.
Esplen E and Brody A (2007). Putting gender back in the picture: rethinking women’s economic empowerment.
BRIDGE. Available from www.bridge.ids.ac.uk/reports/BB19_Economic_Empowerment.pdf.
Esselaar S et al. (2007). ICT usage and its impact on profitability of SMEs in 13 African countries. Information
Technologies and International Development. 4(1):87–100.
Eurostat (2008). Final report – Information Society: ICT impact assessment by linking data from different
sources. Eurostat. Luxembourg. Available from http://epp.eurostat.ec.europa.eu/portal/page/portal/
information_society/documents/Tab/ICT_IMPACTS_FINAL_REPORT_V2.pdf.
Eurostat (2010). Europe in Figures – Eurostat Yearbook 2010. Available from
http://epp.eurostat.ec.europa.eu/cache/ITY_OFFPUB/KS-CD-10-220/EN/KS-CD-10-220-EN.PDF.
Evans J (2011). TxtEagle raises $8.5 million to give 2.1 billion a voice. TechCrunch. 12 April.
Excelsior (2011). Transforming the East African ICT Sector by Creating a Business Engine for SMEs.
InfoDev (World Bank), HIVOS, DFID. Washington, D.C.
Field RL (forthcoming). Development implications of mobile money. Forthcoming in: The Lydian Journal.
Available from http://www.pymnts.com/Development-Implications-of-Mobile-Money/.
FATF (2011). Anti-Money Laundering and Terrorist Financing Measures and Financial Inclusion. FATF/OECD.
Paris. Available from www.fatf-gafi.org/dataoecd/62/26/48300917.pdf.
FinScope (2006). Pilot Study Survey Highlights Including BSM Model: FinScope Small Business™
Gauteng 2006. FinMark Trust & Gauteng Enterprise Propeller. Johannesburg.
Fjeldsted K (2009). Trade reform gives Madagascar a competitive edge. In: Celebrating Reform 2009.
World Bank. Washington, D.C. Available from www.doingbusiness.org/reforms/case-studies/2009/
trade-reform-in-madagascar.
Foster C and Heeks R (2011). Employment and the mobile sector in developing countries. Paper prepared for
UNCTAD (mimeo).
Fu X and Aktar S (2011). The impact of ICT on agricultural extension services delivery: evidence from the rural
e-services project in India. QEH SLPTMD Working Paper. University of Oxford. Oxford.

110 INFORMATION ECONOMY REPORT 2011
G20 Financial Inclusion Experts Group (2010). Innovative Financial Inclusion: Principles and Report on
Innovative Financial Inclusion from the Access through Innovation Sub-Group of the G20 Financial Inclusion
Experts Group. 25 May. Available from www.ausaid.gov.au/publications/pdf/G20financialinclusion.pdf.
Galperin H and Bar F (2006). The Microtelco opportunity: Evidence from Latin America. Information
Technologies and International Development. 3(2):73–86.
Gelb A et al. (2009). To formalize or not to formalize? Comparisons of micro-enterprise data from Southern and
Eastern Africa. Working Paper No.175. Center for Global Development. Available from
http://www.cgdev.org/content/publications/detail/1422458.
Geldof M et al. (2011). What are the key lessons of ICT4D partnerships for poverty reduction?
Systematic Review Report for DFID.
Gereffi G (1999). International trade and industrial upgrading in the apparel commodity chain.
Journal of International Economics. 48 (1):37–70.
Gerelle E and Berende M (2008). Technology for microinsurance: Scoping study. Microinsurance Paper No. 2.
MicroInsurance Innovation Facility, ILO. Geneva.
Germany, BMZ and GIZ (2011). The Transformative Role of Mobile Financial Services and the Role
of the German Development Cooperation. GIZ. Eschborn.
Gibson A (1997). Business development services core principles and future challenges. Small Enterprise
Development. 8(3):4–14.
Gill K et al. (2010). Bridging the Gender Divide: How Technology Can Advance Women Economically. ICRW.
Available from http://www.icrw.org/publications/bridging-gender-divide.
Giuliano P and Ruiz-Arranz M (2009). Remittances, financial development and growth. Journal of Development
Economics. 90 (1):144–52.
Goodman J and Walia V (2006). A Sense of Balance: A Socio-Economic Analysis of Airtime Transfer
Service in Egypt. Forum for the Future. London.
Granström SC (2009). The Informal Sector and Formal Competitiveness in Senegal. Lund University. Lund,
Sweden. Available from http://www.nek.lu.se/Publ/mfs/194.pdf.
Griliches Z (1979). Issues in assessing the contribution of research and development to productivity growth.
The Bell Journal of Economics. 10 (1): 92–116.
GSMA (2008). Mobile Telephony Contribution to Latin America Caribbean Economies.
GSMA (2009a). Asia Pacific Mobile Observatory: The Parallel Development Paths of the Mobile Industry in Asia
Pacific.
GSMA (2009b). Taxation and the Growth of Mobile in East Africa.
GSMA and the Cherie Blair Foundation (2010). Women & Mobile: A Global Opportunity. Available from
http://www.mwomen.org/Files/9479a302.
GTZ (2008). The Social and Ecological Market Economy – A Model for Asian Development? Sustainable
Economic Development Sector Network. Asia Division 41. Economic Development and Employment. GTZ.
Eschborn.
GTZ (2010). Women’s Economic Opportunities in the Formal Private Sector in Latin America and the
Caribbean: A Focus on Entrepreneurship. GTZ. Eschborn. Available from http://idbdocs.iadb.org/wsdocs/
getdocument.aspx?docnum=35278574.
Hacibeyoglu C (2009). Azerbaijan: How to create a world-class taxation system from scratch. In: Celebrating
Reform 2009. World Bank. Washington, D.C. Available from http://www.doingbusiness.org/reforms/
case-studies/2009/tax-reform-in-azerbaijan.
Heeks RB and Arun S (2010). Social outsourcing as a development tool: the impact of outsourcing IT services
to women’s social enterprises in Kerala. Journal of International Development. 22:441–454.
Hellström J (2010). The innovative use of mobile applications in East Africa. Sida Review 2010:12. Swedish
International Development Cooperation Agency. Stockholm.
Humphrey J (2003). Globalization and supply chain networks: the auto industry in Brazil and India. Global
Networks. 3(2):121–141.

111REFERENCES
IADB (2011a). Private sector development strategy profile. Washington, D.C. Available from http://idbdocs.
iadb.org/wsdocs/getdocument.aspx?docnum=35573660.
IADB (2011b). Development Connections: Unveiling the Impact of New Information Technologies. IADB.
Washington, D.C.
IADB, Inter-American Investment Corporation & Multilateral Investment Fund (2004). Private sector
development strategy. IADB. Washington, D.C.
IFC (2007a). Designing a Tax System for Micro and Small Businesses: Guide for Practitioners.
World Bank Group. Washington, D.C.
IFC (2007b). Voices of Women Entrepreneurs – Ghana. World Bank Group. Washington, D.C.
Available from www.ifc.org/ifcext/sustainability.nsf/Content/Publications_Report_VoicesWomen-Ghana.
IFC (2007c). Reforming the Regulatory Procedures for Import and Export: Guide for Practitioners.
World Bank Group. Washington, D.C.
IFC (2007d). Creating Opportunities for Small Business. World Bank Group. Washington, D.C.
IFC (2010). Economic Opportunities for Women in the Pacific. Available from www.ifc.org/ifcext/sustainability.
nsf/Content/Publications_Report_EconOpWomenPacific.
IFC (2011). IFC’s women in business program. Available from http://www.ifc.org/ifcext/sustainability.nsf/
Content/WomeninBusiness.
Ilavarasan P and Levy M (2010). ICTs and Urban Microenterprises: Identifying and Maximizing Opportunities for
Economic Development. International Development Research Centre. Available from http://www.idrc.
ca/uploads/user-S/12802403661ICTs_and_Urban_Microenterprises_104170-001.pdf.
ILO (2007). The promotion of sustainable enterprises. International Labour Conference, Ninety-sixth session,
2007, Report VI. ILO. Geneva.
ILO (2008a). WED: ILO strategy on promoting women’s entrepreneurship development. Available from
http://www.enterprise-development.org/page/library-item?id=1477.
ILO (2008b). Women Entrepreneurs in Kenya (A Preliminary Report) & Factors Affecting Women Entrepreneurs
in Micro and Small Enterprises in Kenya (A Primary Research Report). Available from http://www.ilo.org/
empent/Publications/WCMS_107507/lang--en/index.htm.
Infocomm Development Authority (2010). Realizing the iN2015 Vision: Singapore: An Intelligent Nation, A
Global City, Powered by Infocomm. Available from http://www.ida.gov.sg/images/content/About%20us/
About_Us_level1/_iN2015/pdf/realisingthevisionin2015.pdf.
Instituto Nacional de Estadística e Informática (INEI) (2009). Encuesta Nacional de Hogares. INEI. Lima.
Iskenderian M (2011). Banking on women and girls: Key to global poverty alleviation. The conversation blogs,
Harvard Business Review. Available from http://blogs.hbr.org/cs/2011/03/banking_on_women_and_girls_key.html.
ITU (2010). The World in 2010: ICT Facts and Figures. Available from www.itu.int/ITU-D/ict/material/
FactsFigures2010.pdf.
Japan International Cooperation Agency (undated). Effective Approaches to the Promotion of Small and
Medium Enterprises (SMEs). Available from www.jica.go.jp/english/publications/reports/study/topical/spd/
pdf/chapter3.pdf.
Junqueira Botelho A and da Silva Alves A (2007). Mobile use/adoption by micro, small and medium enterprises
in Latin America and the Caribbean. Background paper. DIRSI (Regional Dialogue on the Information
Society). Lima.
Kantor P (2001). Promoting women’s entrepreneurship development based on good practice programmes:
some experiences from the North to the South. Series on Women’s Entrepreneurship Development and
Gender in Enterprises – WEDGE. SEED Working Paper No. 9. Geneva.
Kaplinsky R and Morris M (2001). Handbook on Value Chain Research. International Development Research
Centre. Ottawa. Available from http://www.seepnetwork.org/Resources/2303_file_Handbook_for_Value_
Chain_Research.pdf.
Klapper L and Love I (2011). Entrepreneurship and the financial crisis: An overview of the 2010 Entrepreneur-
ship Snapshots (WBGES).World Bank Group presentation.

112 INFORMATION ECONOMY REPORT 2011
Kleine D (2011). “The men never say that they do not know”: Telecentres as gendered spaces.
In: Steyn J et al., eds. ICTs for Global Development and Sustainability: Practice and Applications.
Volume 2. IGI Global. New York.
Kumar K et al. (2010). Microfinance and mobile banking: The story so far. Focus Note No. 62. CGAP.
Washington, D.C.
Lederman D (2009). Product innovation: The roles of research and development expenditures
and the investment climate. In: Fajnyzylber P et al., eds. Does the Investment Climate Matter?
Microeconomic Foundations of Growth in Latin America. World Bank. Washington, D.C.
Levy M et al. (2010). The economic impact of information and communication technologies (ICTs) on
microenterprises in the context of development. ICA Annual Meeting, Singapore, International
Communication Association. Unpublished.
Little AD (2010). M-Payments in M-BRIC: How to best leverage the upcoming opportunity. Telecom & Media
Viewpoint. Available from www.adl.com/m-payments.
Malik P and Mundhe R (2011). Statistical Compilation of the ICT Sector and Policy Analysis in India. Orbicom.
Montreal.
McCormick D (1999). African enterprise clusters and industrialisation: Theory and reality. World Development.
27(9):1531–1551.
McCormick B and Wahba J (2001). Overseas work experience, savings and entrepreneurship amongst return
migrants to LDCs. Scottish Journal of Political Economy. 48 (2):164–78.
McCormick B and Wahba J (2003). Return international migration and geographical inequality:
The case of Egypt. Journal of African Economies. 12 (4):500–32.
McKay C and Pickens M (2010). Branchless banking 2010: Who’s served? At what price? What’s next?
Focus Note No. 66. CGAP. Washington, D.C.
Menon R (2011). The emerging world’s five most crucial words: “To move money, press pound”. In: Dutta
S and Mia I, eds. The Global Information Technology Report 2010–2011: Transformations 2.0.
World Economic Forum. Geneva.
Mexico, Ministry of Finance (2011). Financial inclusion: Mexico experience. Slide presentation, January. Mimeo.
MFA (2008). Finland’s Aid for Trade Action Plan (2008–2011). Erweko. Helsinki.
Microfund for Women (2011). Microfund for women celebrates one year of helping families to manage risk.
Available from http://www.microfund.org.jo/PublicNews/Nws_NewsDetails.aspx?lang=2&site_id=1&page_
id=107&NewsID=514&Type=P&M=8.
Miehlbradt AO (1999). How to be demand-led: Lessons for business development service providers from
information and communication services in the Philippines. Paper presented at International Conference on
Building a Modern Effective Development Services Industry for Small Enterprises, Rio De Janerio,
2–3 March. Committee of Donor Agencies for Small Enterprise Development.
Ministerio de Asuntos Exteriores y de Cooperación (2005). Plan Director de la Cooperación Española 2005–
2008. Spain. Available from http://www.aecid.pe/publicaciones/store/pub.6.pdf.
Ministry of Foreign Affairs, Netherlands (2007). Private-sector development: Market access and market
development. Sustainable Economic Development Department (DDE) Working Paper. Ministry of Foreign
Affairs, Netherlands (mimeo).
Mitrovic Z and Bytheway A (2011). Servicing advocacy in e-government: Small business development services
in Cape Town. The African Journal of Information and Communication. 11:40–54.
Mohini M et al. (2006). Expanding Access to Finance: Good Practices and Policies for Micro, Small,
and Medium Enterprises. World Bank. Washington, D.C.
Molony T (2007). “I don’t trust the phone; it always lies”: Trust and information and communication
technologies in Tanzanian micro- and small enterprises. Information Technologies and International
Development. 3(4):67–83. Available from http://itidjournal.org/itid/article/view/238.
Molyneux M (1985). Mobilization without emancipation? Women’s interests, the State, and revolution
in Nicaragua. Feminist Studies. 11:2(1985:summer).

113REFERENCES
Moyi ED (2003). Networks, information and small enterprises: new technologies and the ambiguity of
empowerment. Information Technology for Development. 10(4):221–232.
M-PESA (2010). M-PESA key performance statistics. Safaricom. Nairobi.
Munyua A and Mureithi M (2008). Harnessing the power of the cell phone by women entrepreneurs:
New frontiers in the gender equation in Kenya. GRACE project research report. Available from http://www.
grace-network.net/docs/Research%20Reports/KENYA%20Research%20Report%20-%20AW-MM.pdf.
Murphy JT (2002). Networks, trust and innovation in Tanzania’s manufacturing sector. World Development.
30 (4)591–619.
Naituli G et al. (2008). Entrepreneurial characteristics among micro and small-scale women owned enterprises
in North and Central Meru districts, Kenya. Growing Inclusive Markets Conference. Available from
http://cases.growinginclusivemarkets.org/documents/217.
Ndiaye SM et al. (2009). Etat des lieux du secteur informel des TIC au Sénégal. Recherches sur les
dynamiques et rôles économiques et sociales du secteur informel des TIC, TIC INFOR AFRIQ. Yam Pukri.
Ouagadougou.
NZAID (2008). Economic Growth and Livelihoods. NZAID. Wellington.
Nguyen T (2011). Newton International Postdoctoral Fellowship fieldwork finding summary. Royal Holloway,
University of London. Unpublished.
Nzépa ON et al. (2011). Statistical Compilation of the ICT Sector and Policy Analysis in Cameroon. Orbicom.
Montreal.
OECD (1995) Support of Private Sector Development. OECD. Paris.
OECD (2002). Reviewing the ICT sector definition: Issues for discussion. Working Party on Indicators for the
Information Society. DSTI/ICCP/IIS(2002)2. April. OECD. Paris.
OECD (2004). The Economic Impact of ICT: Measurement, Evidence and Implications. OECD. Paris.
Available from http://browse.oecdbookshop.org/oecd/pdfs/free/9204051e.pdf.
OECD (2005). Mobilising Private Investment for Development: Policy Lessons on the Role of ODA. OECD. Paris.
OECD (2006a). Promoting Pro-Poor Growth: Private Sector Development. OECD. Paris. Available from
www.oecd.org/dataoecd/43/63/36427804.pdf.
OECD (2006b). Enhancing women’s market access and promoting pro-poor growth. In: Promoting
Pro-Poor Growth: Private Sector Development. OECD. Paris. Available from www.oecd.org/
dataoecd/43/63/36427804.pdf.
OECD (2007). Information Economy – Sector definitions based on the International Standards Industry
Classification (ISIC 4). Working Party on Indicators for the Information Society. DSTI/ICCP/IIS(2006)2.
March. OECD. Paris.
OECD (2009). Is Informal Normal? Towards More and Better Jobs in Developing Countries. OECD. Paris.
OECD (2010). Consumer protection in online and mobile payments draft report. DSTI/CCP(2010)22/Rev2.
OECD. Paris.
Okello D (2010). E-agriculture for rural women farmers: The WOUGNET experience. Available from
http://www.e-agriculture.org/en/blog/e-agriculture-rural-women-farmers-wougnet-experience.
Okello J (forthcoming). ICT-based market information services (MIS) projects, deployment environment and
performance: Experiences from KACE and DrumNet projects in Kenya. Forthcoming in: Maumbe B and
Patrikakis C, eds. E-agricuture and Rural Development: Global Innovations and Future Prospects.
IGI Global. New York.
Okello J et al. (2010). Using ICT to integrate smallholder farmers into agricultural value chain:
The case of DrumNet project in Kenya. International Journal of ICT and Research Development. 1:23–37.
Ovum (2006). The Economic and Social Benefits of Mobile Services in Bangladesh. GSMA. London.
Available from http://www.dirsi.net/english/files/Ovum%20Bangladesh%20Main%20report1f.pdf.
Oyelaran-Oyeyinka B (2007). Learning in local systems and global links: The Otigba computer hardware cluster
in Nigeria. In: Oyelaran-Oyeyinka B and McCormick D, eds. Industrial Clusters and Innovation Systems in
Africa. United Nations University Press. Tokyo.

114 INFORMATION ECONOMY REPORT 2011
Parikh TS et al. (2007). A Survey of Information Systems Reaching Small Producers in Global Agricultural
Value Chains. School of Information, University of California, Berkley. Available from http://www.stanford.
edu/~neilp/pubs/ictd2007.pdf.
Point Topic (2010). World broadband statistics: Short report. Available from http://point-topic.com/dslanalysis.
php.
Porcaro RM and Jorge MF (2011). Statistical Compilation of the ICT Sector and Policy Analysis in Brazil.
Orbicom. Montreal.
Porter ME (1985). Competitive Advantage: Creating and Sustaining Superior Performance. Free Press.
New York.
Qiang CZW et al. (2006). The role of ICT in doing business. In: 2006 Information and Communications
for Development: Global Trends and Policies. World Bank. Washington, D.C.
Radloff J et al. (2010). GenARDIS 2002 – 2010: Small Grants that Made Big Changes for Women in
Agriculture. Available from http://www.comminit.com/en/node/330274/38.
Rangaswamy N (2007). ICT for development and commerce: A case study of Internet cafes in India.
Available from www.ifipwg94.org.br/fullpapers/R0071-1.pdf .
Rangaswamy N (2009a). ICT for mesh-economy: Case-study of an urban slum. Paper presented at IFIP 2009,
Dubai, 26 May. Available from https://research.microsoft.com/en-us/people/nimmir/ifip2009.doc.
Rangaswamy N (2009b). Keywords in communication: Mesh-economy and business channels in an Indian
urban slum. Paper presented at ICA 2009, Pre-Conference on India and Communication Studies, Chicago,
21 May. Available from http://research.microsoft.com/en-us/people/nimmir/pre-confica2009.doc.
Ramasamy R and Ponnudurai V (2011). Statistical Compilation of the ICT Sector and Policy Analysis in
Malaysia. Orbicom. Montreal.
Republic of Ghana (2003). The Ghana ICT for Accelerated Development (ICT4AD) Policy. Available from
http://img.modernghana.com/images/content/report_content/ICTAD.pdf.
Republic of Korea, Bank of Korea (2006). Current State and the Way Forward of Knowledge-Based Service
Industry in ROK. Bank of Korea. Seoul.
Research ICT Africa (2006). SME e-Access and Usage Across 14 African Countries. Available from
www.researchictafrica.net/publications/Research_ICT_Africa_e-Index_Series/SME%20e-Access%20
and%20Usage%20in%2014%20African%20Countries.pdf.
Research ICT Africa (2010). Comparative Sector performance Review 2009–2010: Towards Evidence-Based
ICT Policy and Regulation. Volume 2, Paper 5. International Development Research Centre.
Richardson D (2003). Agricultural extension transforming ICT: Championing universal access. Paper presented
at the ICTs Conference on Transforming Agricultural Extension by CTA. Wageningen, Netherlands.
Sagun R (2011). Case note on ICT for development project: E-governance for municipal development in the
Philippines. Available from http://unpan1.un.org/intradoc/groups/public/documents/un-dpadm/
unpan037088.pdf.
Schiffer M and Weder B (2001). Firm size and the business environment: Worldwide survey results. Discussion
Paper 43. World Bank and IFC. Washington, D.C.
SEWA (2011). Communication for the Information Economy Report 2011. Mimeo.
Sievers M and Vandenburg P (2004). Synergies through linkages: Who benefits from linking finance and
business development services? SEED Working Paper No. 64 ILO. Geneva.
Sivapragasam N (2009). The future of the public phone: Findings from a six-country Asian study of telecom
use at the BoP. Paper presented at the 4th Communication Policy Research, South Conference, Negombo,
Sri Lanka, 7 December. Available from http://papers.ssrn.com/sol3/papers.cfm?abstract_id=1554187.
Souter D et al. (2005). The Economic Impact of Telecommunications on Rural Livelihoods and Poverty
Reduction. CTO for the United Kingdom Department for International Development. Available from
http://www.telafrica.org/R8347/files/pdfs/FinalReport.pdf.
Statistics South Africa (2010). Survey of Employers and the Self-employed. Quarter 3, 2009. Available from
www.statssa.gov.za.

115REFERENCES
Stevenson L and St-Onge A (2005). Support for Growth-oriented Women Entrepreneurs in Tanzania. ILO.
Geneva. Available from www.afdb.org/fileadmin/uploads/afdb/Documents/Policy-Documents/GOWE%20
Tanzania.pdf.
Swiss Agency for Development and Cooperation (2007). Deepening participation and improving aid effectiveness
through media and ICTs: A practical manual translating lessons learned into daily practice. Working paper.
Tarazi M and Breloff P (2010). Nonbank e-money issuers: Regulatory approaches to protecting customer funds.
Focus Note 63. CGAP. Washington, D.C.
Tarazi M and Breloff P (2011). Regulating banking agents. Focus Note 68. CGAP. Washington, D.C.
TeleGeography (2010). Global Internet geography. Available from http://www.telegeography.com/
research-services/global-internet-geography/.
UCC (2007). A review of the postal and telecommunications sector. Presentation, 15 August, Kampala.
Available from http://www.ucc.co.ug/reviewofCommunicationSector.pdf [Accessed 18 December 2010].
UNDESA (2010). The World’s Women 2010: Trends and Statistics. United Nations publication. Sales No. E.10.
XVII.11. New York. Available from http://unstats.un.org/unsd/demographic/products/Worldswomen/
WW_full%20report_color.pdf.
UNCITRAL (2011). Present and possible future work on electronic commerce. UNCITRAL. A/CN.9/728. 21 March.
UNCTAD (2005a). Information Economy Report 2005: E-Commerce and Development. United Nations
publication. Sales No. E.05.II.D.19. New York and Geneva.
UNCTAD (2005b). Improving the Competitiveness of SMEs through Enhancing Productive Capacity:
*Proceedings of Four Expert Meetings. UNCTAD/ITE/TEB/2005/. United Nations. New York and Geneva.
UNCTAD (2006a). Information Economy Report 2006: The Development Perspective. United Nations
publication. Sales No. E.06.II.D.8. New York and Geneva.
UNCTAD (2006b). Least Developed Countries Report 2006. United Nations publication. Sales No. E.06.II.D.9.
New York and Geneva.
UNCTAD (2007). Enhancing the Participation of Developing Countries’ SME s in Global Value Chains.
United Nations publication. TD /B/COM.3/EM.31/2. New York and Geneva.
UNCTAD (2008). Measuring the Impact of ICT Use in Business: The Case of Manufacturing in Thailand.
United Nations publication. Sales no. E.08.II.D.13. New York and Geneva. Available from
http://new.unctad.org/Documents/Thai_report_w_cover.pdf.
UNCTAD (2009a). Information Economy Report 2009: Trends and Outlook in Turbulent Times. United Nations
publication. Sales No. E.09.II.D.18. New York and Geneva.
UNCTAD (2009b). Study on Prospects for Harmonizing Cyberlegislation in Latin America. United Nations
publication. UNCTAD/DTL/STICT/2009/1. New York and Geneva. In English and Spanish.
UNCTAD (2009c). Estudio sobre las perspectivas de la harmonización de la ciberlegislación en Centroamérica
y el Caribe. United Nations publication. UNCTAD/DTL/STICT/2009/3. New York and Geneva.
UNCTAD (2010). Information Economy Report 2010: ICTs, Enterprises and Poverty Alleviation. United Nations
publication. Sales No. E.10.II.D.17. New York and Geneva.
UNCTAD (2011a). Measuring the Impacts of Information and Communication Technology for Development.
United Nations publication. UNCTAD/DTL/STICT/2011/1. New York and Geneva.
UNCTAD (2011b). Science, Technology and Innovation Policy Review of Peru. United Nations publication.
UNCTAD/DTL/STICT/2010/2. New York and Geneva.
UNCTAD (2011c). ICT Policy Review of Egypt. United Nations publication. New York and Geneva.
UNCTAD (forthcoming). Applying a Gender Lens to Science, Technology and Innovation United Nations
publication. New York and Geneva.
UNDESA (2010). United Nations E-Government Survey 2010. Available from http://www2.unpan.org/egovkb/
documents/2010/E_Gov_2010_Complete.pdf.
UNDP (2004). Unleashing Entrepreneurship: Making Business Work for the Poor. UNDP. New York.
UNDP (2007). The role of governments in promoting ICT access and use by SMEs, considerations for public
policy. APDIP e-Note 12 / 2007. Available from http://www.apdip.net/apdipenote/12.pdf/.

116 INFORMATION ECONOMY REPORT 2011
UNDP (2008a). UNDP and the Private Sector. Fast Facts. May. UNDP. New York.
UNDP (2008b). Innovative Approaches to Promoting Women’s Economic Empowerment. Available
from http://content.undp.org/go/cms-service/stream/asset/?asset_id=2524504.
UNECA (2009). Enhancing the private sector role and participation in key strategic sectors in Africa.
ECA/GPAD/CGPP.1/09/4.
UNECLAC (2010). ICT for Growth and Equality: Renewing Strategies for the Information Society.
Third Ministerial Conference on the Information Society in Latin America and the Caribbean Lima,
21–23 November, 2010. United Nations. Santiago.
UNESCAP (2005). Developing Women Entrepreneurs in South Asia: Issues, Initiatives and Experiences.
Available from http://www.unescap.org/tid/publication/indpub2401.pdf.
UNIDO (2009). Programme and Budgets, 2010–2011: Proposals of the Director-General. IDB.36/7–PBC.25/7.
24 March.
United Nations Millennium Project (2005). Investing in Development. A Practical Plan to Achieve the Millennium
Development Goals. Available from http://www.unmillenniumproject.org/reports/fullreport.htm.
Voice on the Net Coalition (2010). Letter to the Office of the United States Trade Representative. 17 December.
Available from www.von.org/filings/year/02_2010/2010_12_17_VON_USTR_Comments.pdf.
Woodruff C and Zenteno R (2001). Remittances and microenterprises in Mexico. Graduate School of
International Relations and Pacific Studies Working Paper. University of California San Diego.
World Bank (2003). Doing Business in 2004: Understanding Regulation. World Bank, IFC and Oxford University
Press. Washington, D.C.
World Bank (2004). World Development Report: A Better Investment Climate for Everyone. World Bank.
Washington, D.C.
World Bank (2006). 2006 Information and Communications for Development: Global Trends and Policies.
World Bank. Washington, D.C.
World Bank (2009a). Information and Communication for Development: Extending Reach and Increasing
Impact. World Bank. Washington, D.C.
World Bank (2009b). Information and communication technologies for women’s socio-economic
empowerment. World Bank Group Working Paper Series. Available from http://siteresources.worldbank.
org/EXTINFORMATIONANDCOMMUNICATIONANDTECHNOLOGIES/Resources/2828221208273252769/
ICTs_for_Womens_Socio_Economic_Empowerment.pdf.
World Bank (2010a). Doing Business 2011: Making a Difference for Entrepreneurs. World Bank. Washington,
D.C.
World Bank (2010b). Kenya economic update. No. 3. December 2010. Available from http://go.worldbank.org/
S743MCDPM0.
World Bank (2011). Knowledge Map of the Virtual Economy: Converting the Virtual Economy into Development
Potential. World Bank. Washington, D.C.
World Bank (undated). Gender, ICT and entrepreneurship. Available from
http://go.worldbank.org/X8T0NPX820.
WTO (2010). International Trade Statistics 2010. WTO. Geneva.
Yam Pukri (2010). Dynamiques et rôles économiques et social du secteur informel des TIC en Afrique de
l’Ouest et du Centre: Cas du Burkina Faso, du Cameroun et du Sénégal. Rapport final de recherche.
September (www.yam-pukri.org).
Yang D (2008). International migration, remittances and household investment: Evidence from Philippine
migrants’ exchange rate shocks. Economic Journal. 118 (528):591–630.
Zain (2009). Economic impact of mobile communications in Sudan. Briefing paper for Ericsson.
Available from www.ericsson.com/res/thecompany/docs/sudan_economic_report.pdf.
Zurich Financial Services Group (2011). Insurance & Technology to Better Serve Emerging Consumers:
Learning to Improve Access & Service available from http://zdownload.zurich.com/main/Insight/
Insurance_and_Technology.pdf.

STATISTICALANNEXAnnex tables
I.1. Donor strategy documents reviewed ................................................................................... 119
II.1. Penetration of Selected ICTs, 2005 and 2010 or latest year (per 100 inhabitants) ................ 120
II.2. Use of computers by enterprise size, latest available reference year (%)
B1 - Proportion of businesses using computers ................................................................... 126
II.3. Use of Internet by enterprise size, latest available reference year (%)
B3 - Proportion of businesses using the Internet .................................................................. 128
II.4. Type of enterprise connection to the Internet, by enterprise size (%)
B9 - Proportion of businesses using the Internet by type of access
(fixed broadband and mobile broadband) ............................................................................ 130
II.5. Use of computers by economic activity (ISIC Rev 3.1), latest available reference year (%)
B1- Proportion of businesses using computers .................................................................... 132
II.6. Use of Internet by economic activity (ISIC Rev 3.1), latest available reference year (%)
B3- Proportion of businesses using the Internet ................................................................... 136
II.7. Use of the Internet by type of activity, latest available reference year
Enterprises with 10 or more persons employed ................................................................... 140


119STATISTICAL ANNEX
Annex table I.1. Donor strategy documents reviewed
PSD documents from multilateral development agencies
Type of agency Agency Year of document Title of document
Multilateral IFC 2007 Creating Opportunities for Small Business
Multilateral ILO 2007 The Promotion of Sustainable Enterprises
Multilateral Inter-American Development Bank 2004 Private Sector Development Strategy
(The new draft PSD strategy was also considered)
Multilateral OECD 2006 Promoting Pro-Poor Growth: Private Sector Development
Multilateral UNDP 2008 UNDP and the Private Sector, Factsheet “Fast Facts”
(Other UNDP documents reviewed were The MDGs: Everyone’s Business; How inclusive business models contribute to development and who supports them; Business and Poverty: Opening Markets to the Poor; Smart Communications: Low-cost Money Transfers for Overseas Filipino Workers; The Role of the Information and Communications Technology Sector in Expanding Economic Opportunity)
Multilateral UNIDO 2009 Programme and Budgets, 2010–2011, IDB.36/7–PBC.25/7
Multilateral Asian Development Bank 2006 Private Sector Development: A Revised Strategic Framework
Multilateral African Development Bank 2008 Strategy Update for the Bank’s Private Sector Operations
PSD documents from bilateral development agencies
Country Agency Year of document Title of document
Canada Canadian International Development Agency
2010 Stimulating Sustainable Economic Growth: CIDA’s Sustainable Economic Growth Strategy
Australia Ausaid 2000 Private Sector Development through Australia’s Aid Programme
Denmark Danida 2011 Strategisk Ramme for Prioritetsområdet Vaekst & Beskaftigelse 2011–2015
Finland Ministry of Foreign Affairs 2008 Aid for Trade Action Plan 2008–2011
Germany GTZ 2008 The Social and Ecological Market Economy – A Model for Asian Development?
Netherlands Ministry of Foreign Affairs 2007–2008 Results in Development: Report 2007–2008
Netherlands Ministry of Foreign Affairs 2007 Economic Growth and Livelihoods: Towards a Safe and Just World
Netherlands Ministry of Foreign Affairs 2007 Private Sector Development: Market Access and Market Development
Netherlands Ministry of Foreign Affairs 2007 Private Sector Development: Legal and Regulatory Framework
Netherlands Ministry of Foreign Affairs 2007 Private Sector Development: The Key to Economic Growth
Netherlands Ministry of Foreign Affairs 2007 Private Sector Development: Infrastructure
New Zealand NZAID 2008 Economic Growth and Livelihoods
Norway/WB Norwegian Trust Fund for Private Sector and Infrastructure
2009 Annual Report 2009
Spain Ministry of Foreign Affairs 2005–2008 Sector Strategy Document: Promoting the Economy and Enterprise
Spain Ministry of Foreign Affairs 2009–2010 Plan Director de la Cooperación Española 2009–2012
Sweden Ministry of Foreign Affairs 2010 Policy för ekonomisk tillväxt inom svenskt utvecklingssamarbete 2010–2014
Switzerland Swiss Agency for Development and Cooperation
2007 Deepening Participation and Improving Aid Effectiveness through Media and ICTs: A Practical Manual Translating Lessons Learned into Daily Practice
United States USAID 2008 Securing the Future: a Strategy For Economic Growth
United States USAID 2008 Microenterprise Results Reporting
Japan Japan International Cooperation Agency
Undated Effective Approaches on the Promotion of Small and Medium Enterprises (SMEs)
Japan Japan International Coop-eration Agency
Undated Approaches for Systematic Planning of Development Projects / Trade and Investment Promotion

120 INFORMATION ECONOMY REPORT 2011
Annex table II.1. Penetration of selected ICTs, 2005 and 2010 or latest year (per 100 inhabitants)
Fixed telephone linesMobile cellular telephone
subscriptionsInternet users
Fixed broadband Internet subscriptions
2005 2010 2005 2010 2005 2010 2005 2010
Developed economies
Americas
Bermuda 81.82 89.00 82.21 135.82 65.45 84.21 28.83 61.75
Canada 56.21 50.04 52.71 70.66 71.66 81.60 21.70 29.81
United States 59.01 48.70 68.63 89.86 67.97 79.00 17.23 26.34
Asia
Israel 44.46 44.16 117.45 133.11 25.19 67.20 18.62 25.14
Japan 45.93 31.94 76.34 95.39 66.92 80.00 18.44 26.91
Europe
Andorra 45.51 44.98 82.89 77.18 37.61 81.00 13.28 28.87
Austria 45.42 38.66 105.26 145.84 58.00 72.70 14.26 23.85
Belgium 46.04 43.31 92.23 113.46 59.81 79.26 19.31 31.49
Bulgaria 32.17 29.36 80.69 141.23 19.97 46.23 2.14 14.70
Cyprus 40.68 37.58 75.78 93.70 32.81 52.99 3.09 17.62
Czech Republic 31.48 20.95 115.22 136.58 35.27 68.82 6.94 14.66
Denmark 61.78 47.26 100.55 124.41 82.74 88.72 24.80 37.38
Estonia 32.84 35.96 107.39 123.24 61.45 74.10 13.31 24.34
Faroe Islands 49.37 41.42 87.10 122.05 67.90 75.10 12.16 33.40
Finland 40.42 23.30 100.49 156.40 74.48 86.89 22.39 29.07
France 55.26 56.06 78.84 99.70 42.87 80.10 15.53 33.92
Germany 66.38 55.41 96.04 127.04 68.71 81.85 13.07 31.59
Gibraltar a 85.98 82.07 68.79 102.59 39.07 65.07 .. 31.80
Greece 56.44 45.81 91.75 108.22 24.00 44.40 1.43 19.83
Greenland 56.22 38.09 81.27 100.09 57.70 63.00 12.46 20.96
Hungary 33.86 29.82 92.40 120.32 38.97 65.27 6.46 19.59
Iceland 65.33 63.72 95.41 108.72 87.00 95.00 26.29 34.65
Ireland 49.35 46.49 102.69 105.18 41.61 69.85 7.76 22.82
Italy 42.69 35.67 121.87 135.42 35.00 53.68 11.63 22.13
Latvia 31.71 23.63 81.18 102.40 46.00 68.42 2.64 19.31
Liechtenstein 57.67 54.40 79.27 98.52 63.37 80.00 24.84 63.83
Lithuania 23.45 22.08 127.45 147.16 36.22 62.12 6.85 20.58
Luxembourg 53.48 53.68 111.55 143.27 70.00 90.62 15.33 32.83
Malta 49.38 59.38 79.16 109.34 41.24 63.00 12.56 27.54
Netherlands 46.61 43.15 97.11 116.23 81.00 90.72 25.14 37.97
Norway 45.61 34.85 102.84 113.15 81.99 93.39 21.44 34.60
Poland 31.01 24.69 76.42 120.18 38.81 62.32 2.48 13.18
Portugal 40.15 42.01 108.57 142.33 34.99 51.10 11.05 19.44
Romania 20.13 20.94 61.34 114.68 21.50 39.93 1.73 13.96
San Marino a 68.81 68.81 56.60 76.11 50.26 54.21 4.03 32.03
Slovakia 22.10 20.12 83.84 108.47 55.19 79.42 3.35 16.06
Slovenia 40.78 45.01 87.87 104.55 46.81 70.00 9.82 24.39
Spain 44.85 43.20 98.38 111.75 47.88 66.53 11.60 22.96
Sweden 62.41 53.46 100.83 113.54 84.83 90.00 27.93 31.59

121STATISTICAL ANNEX
Fixed telephone linesMobile cellular telephone
subscriptionsInternet users
Fixed broadband Internet subscriptions
2005 2010 2005 2010 2005 2010 2005 2010
Switzerland 69.45 58.56 92.17 123.62 70.10 83.90 22.51 38.16
United Kingdom 56.59 53.71 108.75 130.25 70.00 85.00 16.44 31.38
Oceania
Australia 49.60 38.89 90.28 101.04 63.00 76.00 9.88 23.19
New Zealand 41.82 42.81 85.39 114.92 62.72 83.00 7.76 24.93
Developing economies
Africa
Algeria 7.82 8.24 41.54 92.42 5.84 12.50 0.41 2.54
Angola 0.59 1.59 9.77 46.69 1.14 10.00 0.00 0.10
Benin 1.00 1.51 7.81 79.94 1.27 3.13 0.00 0.29
Botswana 7.28 6.85 30.06 117.76 3.26 6.00 0.09 0.60
Burkina Faso 0.64 0.87 4.46 34.66 0.47 1.40 0.00 0.08
Burundi 0.43 0.39 2.11 13.72 0.54 2.10 0.00 0.00
Cameroon 0.57 2.53 12.83 41.61 1.40 4.00 0.00 0.01
Cape Verde 15.14 14.51 17.28 74.97 6.07 30.00 0.20 3.04
Central African Republic
0.25 0.27 2.49 23.18 0.27 2.30 0.00 ..
Chad 0.13 0.46 2.15 23.29 0.40 1.70 0.00 0.00
Comoros 2.63 2.86 2.41 22.49 3.24 5.10 0.00 0.00
Congo 0.45 0.24 15.80 93.96 1.46 5.00 0.00 0.00
Côte d’Ivoire 1.43 1.13 13.04 75.54 1.04 2.60 0.01 0.04
Democratic Republic of the Congo
0.02 0.06 4.78 17.21 0.24 0.72 0.00 0.01
Djibouti 1.31 2.08 5.45 18.64 0.95 6.50 0.01 0.91
Egypt 14.12 11.86 18.37 87.11 11.70 26.74 0.19 1.82
Equatorial Guinea
1.65 1.93 15.94 57.01 1.15 6.00 0.03 0.17
Eritrea 0.84 1.03 0.90 3.53 1.79 5.40 0.00 0.00
Ethiopia 0.82 1.10 0.55 7.86 0.22 0.75 0.00 0.00
Gabon 2.85 2.02 53.74 106.94 4.89 7.23 0.11 0.25
Gambia 2.93 2.82 16.46 85.53 3.80 9.20 0.00 0.02
Ghana 1.49 1.14 13.28 71.49 1.83 8.55 0.01 0.21
Guinea 0.28 0.18 2.09 40.07 0.54 0.96 0.00 0.01
Guinea-Bissau 0.70 0.33 7.23 39.21 1.90 2.45 0.00 ..
Kenya 0.81 1.14 12.95 61.63 3.10 20.98 0.02 0.01
Lesotho 2.32 1.79 12.09 32.18 2.58 3.86 0.00 0.02
Liberia .. 0.15 5.03 39.34 .. 0.07 .. 0.00
Libyan Arab Jamahiriya
14.77 19.33 34.66 171.52 3.92 14.00 .. 1.15
Madagascar 0.52 0.83 2.85 39.79 0.57 1.70 0.00 0.02
Malawi 0.80 1.07 3.28 20.38 0.38 2.26 0.00 0.03
Mali 0.58 0.74 5.78 47.66 0.51 2.70 0.00 0.02
Mauritania 1.35 2.07 24.47 79.34 0.67 3.00 0.01 0.19
Mauritius 28.45 29.84 52.26 91.67 15.17 24.90 0.43 6.30
Morocco 4.41 11.73 40.78 100.10 15.08 49.00 0.82 1.56
Mozambique 0.32 0.38 7.24 30.88 0.85 4.17 0.00 0.06
Namibia 6.68 6.66 21.58 67.21 4.01 6.50 0.01 0.42
Niger 0.18 0.54 2.49 24.53 0.22 0.83 0.00 0.02
Nigeria 0.87 0.66 13.29 55.10 3.55 28.43 0.00 0.06
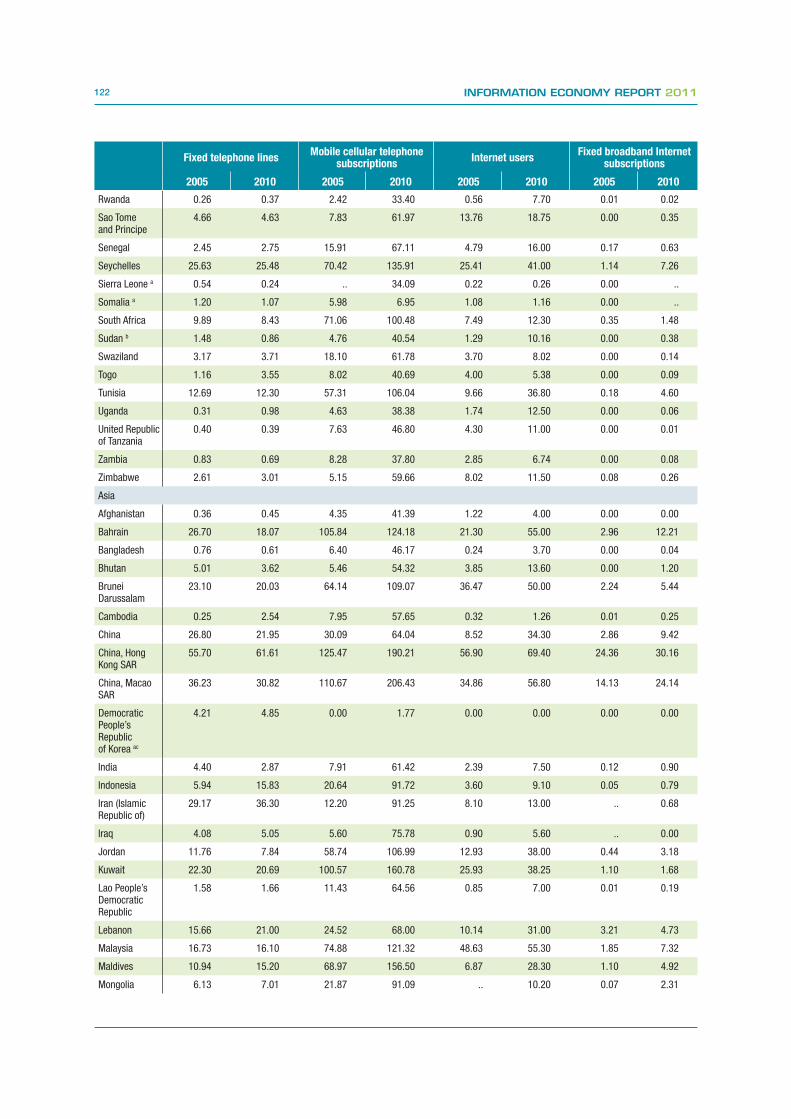
122 INFORMATION ECONOMY REPORT 2011
Fixed telephone linesMobile cellular telephone
subscriptionsInternet users
Fixed broadband Internet subscriptions
2005 2010 2005 2010 2005 2010 2005 2010
Rwanda 0.26 0.37 2.42 33.40 0.56 7.70 0.01 0.02
Sao Tome and Principe
4.66 4.63 7.83 61.97 13.76 18.75 0.00 0.35
Senegal 2.45 2.75 15.91 67.11 4.79 16.00 0.17 0.63
Seychelles 25.63 25.48 70.42 135.91 25.41 41.00 1.14 7.26
Sierra Leone a 0.54 0.24 .. 34.09 0.22 0.26 0.00 ..
Somalia a 1.20 1.07 5.98 6.95 1.08 1.16 0.00 ..
South Africa 9.89 8.43 71.06 100.48 7.49 12.30 0.35 1.48
Sudan b 1.48 0.86 4.76 40.54 1.29 10.16 0.00 0.38
Swaziland 3.17 3.71 18.10 61.78 3.70 8.02 0.00 0.14
Togo 1.16 3.55 8.02 40.69 4.00 5.38 0.00 0.09
Tunisia 12.69 12.30 57.31 106.04 9.66 36.80 0.18 4.60
Uganda 0.31 0.98 4.63 38.38 1.74 12.50 0.00 0.06
United Republic of Tanzania
0.40 0.39 7.63 46.80 4.30 11.00 0.00 0.01
Zambia 0.83 0.69 8.28 37.80 2.85 6.74 0.00 0.08
Zimbabwe 2.61 3.01 5.15 59.66 8.02 11.50 0.08 0.26
Asia
Afghanistan 0.36 0.45 4.35 41.39 1.22 4.00 0.00 0.00
Bahrain 26.70 18.07 105.84 124.18 21.30 55.00 2.96 12.21
Bangladesh 0.76 0.61 6.40 46.17 0.24 3.70 0.00 0.04
Bhutan 5.01 3.62 5.46 54.32 3.85 13.60 0.00 1.20
Brunei Darussalam
23.10 20.03 64.14 109.07 36.47 50.00 2.24 5.44
Cambodia 0.25 2.54 7.95 57.65 0.32 1.26 0.01 0.25
China 26.80 21.95 30.09 64.04 8.52 34.30 2.86 9.42
China, Hong Kong SAR
55.70 61.61 125.47 190.21 56.90 69.40 24.36 30.16
China, Macao SAR
36.23 30.82 110.67 206.43 34.86 56.80 14.13 24.14
Democratic People’s Republic of Korea ac
4.21 4.85 0.00 1.77 0.00 0.00 0.00 0.00
India 4.40 2.87 7.91 61.42 2.39 7.50 0.12 0.90
Indonesia 5.94 15.83 20.64 91.72 3.60 9.10 0.05 0.79
Iran (Islamic Republic of)
29.17 36.30 12.20 91.25 8.10 13.00 .. 0.68
Iraq 4.08 5.05 5.60 75.78 0.90 5.60 .. 0.00
Jordan 11.76 7.84 58.74 106.99 12.93 38.00 0.44 3.18
Kuwait 22.30 20.69 100.57 160.78 25.93 38.25 1.10 1.68
Lao People’s Democratic Republic
1.58 1.66 11.43 64.56 0.85 7.00 0.01 0.19
Lebanon 15.66 21.00 24.52 68.00 10.14 31.00 3.21 4.73
Malaysia 16.73 16.10 74.88 121.32 48.63 55.30 1.85 7.32
Maldives 10.94 15.20 68.97 156.50 6.87 28.30 1.10 4.92
Mongolia 6.13 7.01 21.87 91.09 .. 10.20 0.07 2.31
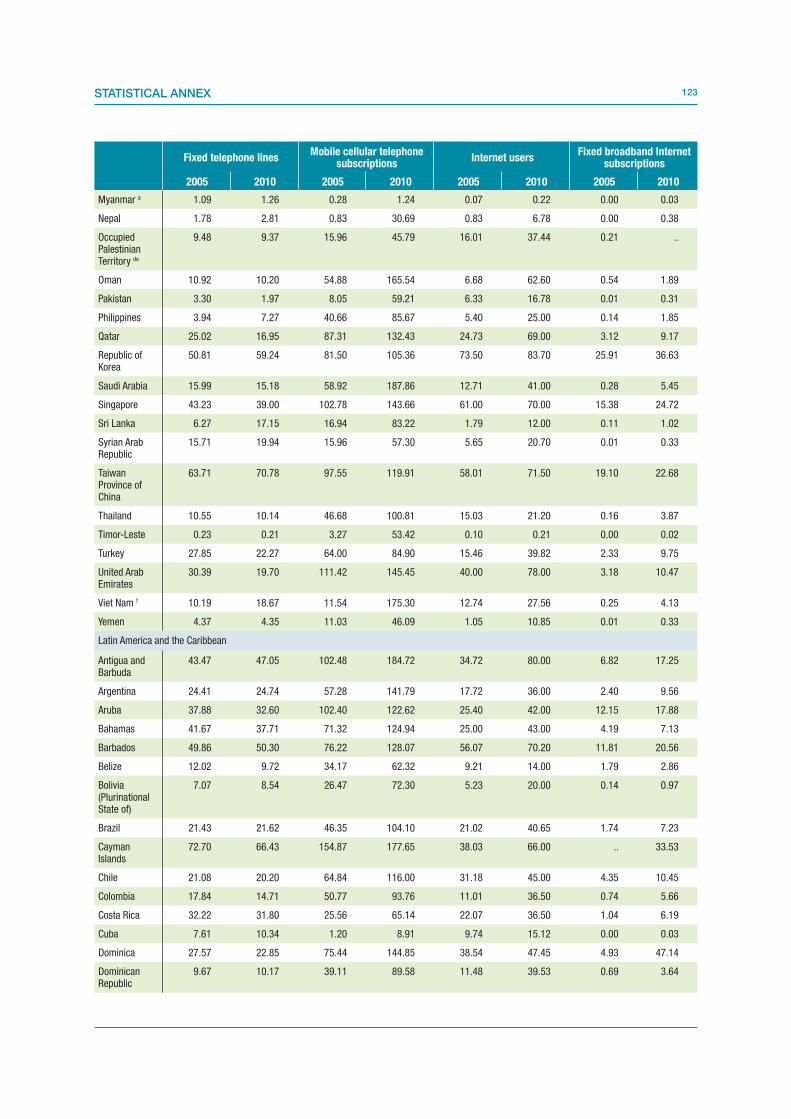
123STATISTICAL ANNEX
Fixed telephone linesMobile cellular telephone
subscriptionsInternet users
Fixed broadband Internet subscriptions
2005 2010 2005 2010 2005 2010 2005 2010
Myanmar a 1.09 1.26 0.28 1.24 0.07 0.22 0.00 0.03
Nepal 1.78 2.81 0.83 30.69 0.83 6.78 0.00 0.38
Occupied Palestinian Territory de
9.48 9.37 15.96 45.79 16.01 37.44 0.21 ..
Oman 10.92 10.20 54.88 165.54 6.68 62.60 0.54 1.89
Pakistan 3.30 1.97 8.05 59.21 6.33 16.78 0.01 0.31
Philippines 3.94 7.27 40.66 85.67 5.40 25.00 0.14 1.85
Qatar 25.02 16.95 87.31 132.43 24.73 69.00 3.12 9.17
Republic of Korea
50.81 59.24 81.50 105.36 73.50 83.70 25.91 36.63
Saudi Arabia 15.99 15.18 58.92 187.86 12.71 41.00 0.28 5.45
Singapore 43.23 39.00 102.78 143.66 61.00 70.00 15.38 24.72
Sri Lanka 6.27 17.15 16.94 83.22 1.79 12.00 0.11 1.02
Syrian Arab Republic
15.71 19.94 15.96 57.30 5.65 20.70 0.01 0.33
Taiwan Province of China
63.71 70.78 97.55 119.91 58.01 71.50 19.10 22.68
Thailand 10.55 10.14 46.68 100.81 15.03 21.20 0.16 3.87
Timor-Leste 0.23 0.21 3.27 53.42 0.10 0.21 0.00 0.02
Turkey 27.85 22.27 64.00 84.90 15.46 39.82 2.33 9.75
United Arab Emirates
30.39 19.70 111.42 145.45 40.00 78.00 3.18 10.47
Viet Nam f 10.19 18.67 11.54 175.30 12.74 27.56 0.25 4.13
Yemen 4.37 4.35 11.03 46.09 1.05 10.85 0.01 0.33
Latin America and the Caribbean
Antigua and Barbuda
43.47 47.05 102.48 184.72 34.72 80.00 6.82 17.25
Argentina 24.41 24.74 57.28 141.79 17.72 36.00 2.40 9.56
Aruba 37.88 32.60 102.40 122.62 25.40 42.00 12.15 17.88
Bahamas 41.67 37.71 71.32 124.94 25.00 43.00 4.19 7.13
Barbados 49.86 50.30 76.22 128.07 56.07 70.20 11.81 20.56
Belize 12.02 9.72 34.17 62.32 9.21 14.00 1.79 2.86
Bolivia (Plurinational State of)
7.07 8.54 26.47 72.30 5.23 20.00 0.14 0.97
Brazil 21.43 21.62 46.35 104.10 21.02 40.65 1.74 7.23
Cayman Islands
72.70 66.43 154.87 177.65 38.03 66.00 .. 33.53
Chile 21.08 20.20 64.84 116.00 31.18 45.00 4.35 10.45
Colombia 17.84 14.71 50.77 93.76 11.01 36.50 0.74 5.66
Costa Rica 32.22 31.80 25.56 65.14 22.07 36.50 1.04 6.19
Cuba 7.61 10.34 1.20 8.91 9.74 15.12 0.00 0.03
Dominica 27.57 22.85 75.44 144.85 38.54 47.45 4.93 47.14
Dominican Republic
9.67 10.17 39.11 89.58 11.48 39.53 0.69 3.64

124 INFORMATION ECONOMY REPORT 2011
Fixed telephone linesMobile cellular telephone
subscriptionsInternet users
Fixed broadband Internet subscriptions
2005 2010 2005 2010 2005 2010 2005 2010
Ecuador 12.51 14.42 46.52 102.18 5.99 24.00 0.20 1.36
El Salvador 16.06 16.16 39.86 124.34 4.20 15.00 0.70 2.83
French Guiana a
25.25 19.68 .. .. 20.79 25.70 .. ..
Grenada 26.70 27.15 45.61 116.71 20.49 33.46 3.14 10.12
Guatemala 9.81 10.41 35.46 125.57 5.70 10.50 0.21 1.80
Guyana 14.76 19.86 37.71 73.61 .. 29.90 0.27 1.59
Haiti 1.55 0.50 5.35 40.03 6.38 8.37 0.00 x..
Honduras 7.18 8.81 18.63 125.06 6.50 11.09 0.00 1.00
Jamaica 11.90 9.60 73.89 113.22 12.80 26.10 1.68 4.26
Mexico 18.32 17.54 44.26 80.55 17.21 31.00 1.81 9.98
Netherlands Antilles
45.71 44.85 .. .. .. .. .. ..
Nicaragua 4.07 4.46 20.64 65.14 2.57 10.00 0.19 0.82
Panama 14.53 15.73 54.00 184.72 11.48 42.75 0.54 7.84
Paraguay 5.43 6.27 31.99 91.64 7.91 23.60 0.09 0.61
Peru 8.72 10.87 20.26 100.13 17.10 34.30 1.28 3.14
Puerto Rico 27.44 23.79 52.71 78.26 23.40 45.30 3.13 14.72
Saint Kitts and Nevis a
41.28 39.31 103.72 161.44 26.46 32.87 13.22 25.00
Saint Lucia a 23.60 23.58 63.93 102.89 21.57 36.00 4.24 10.67
Saint Vincent and the Grenadines a
20.69 19.85 64.93 120.54 9.20 69.59 3.35 11.43
Suriname 16.23 16.19 46.62 169.64 6.40 31.59 0.22 2.99
Trinidad and Tobago
24.50 21.87 70.25 141.21 28.98 48.50 0.82 10.81
Uruguay 30.28 28.56 34.76 131.71 20.09 43.35 1.46 11.37
Venezuela (Bolivarian Republic of)
13.69 24.44 46.86 96.20 12.55 35.63 1.34 5.37
Virgin Islands (U.S.) a
65.56 69.51 73.43 .. 27.34 27.40 2.71 8.34
Oceania
American Samoa
16.52 15.20 .. .. .. .. .. ..
Fiji 13.68 15.92 24.92 116.19 8.45 14.82 0.85 1.86
French Polynesia
20.95 20.29 47.08 79.73 21.54 49.00 4.32 11.91
Guam a 38.86 36.41 .. .. 38.56 50.64 .. 1.67
Kiribati 4.57 4.12 0.71 10.05 4.00 9.00 .. 0.90
Marshall Islands a
8.46 8.14 1.27 7.03 3.88 3.55 0.00 ..
Micronesia, (Federated States of)
11.38 7.61 12.88 24.78 11.88 20.00 0.04 0.90
Nauru 17.80 0.00 .. 60.46 .. 6.00 .. 3.90
New Caledonia a
23.94 28.78 58.10 88.02 32.36 33.99 4.15 15.23
Northern Mariana Islands
34.58 41.86 .. .. .. .. 0.00 ..
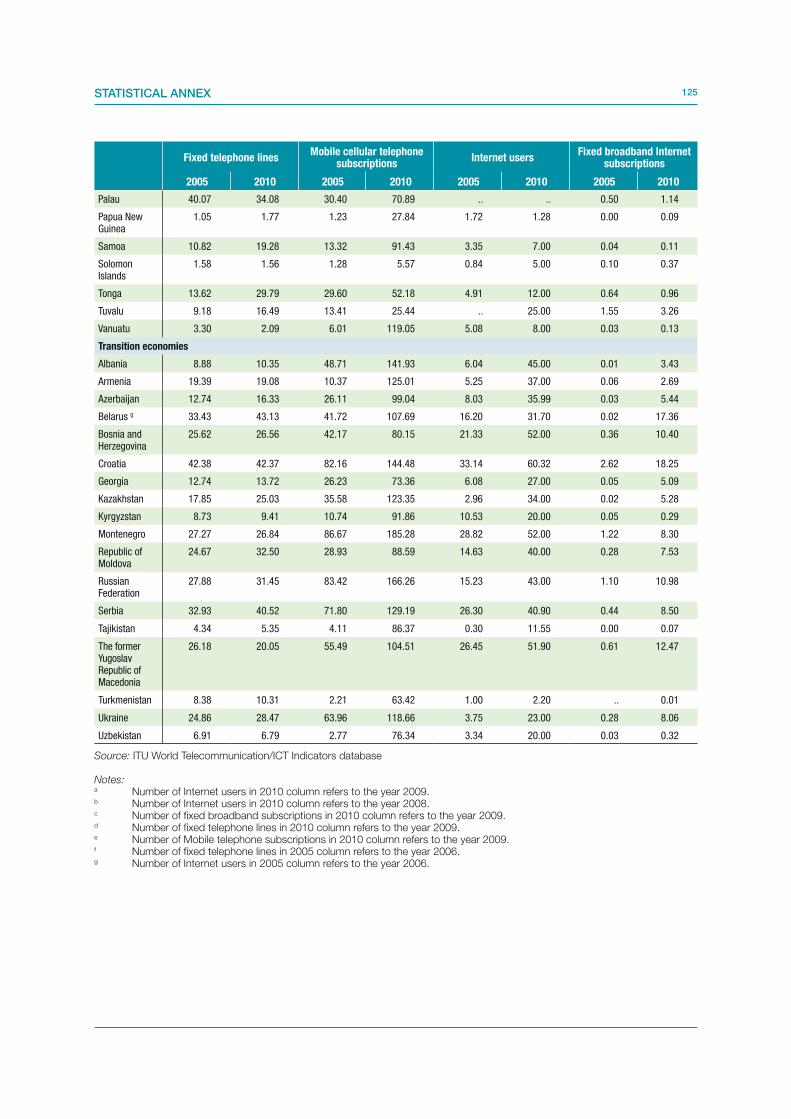
125STATISTICAL ANNEX
Source: ITU World Telecommunication/ICT Indicators database
Notes:a Number of Internet users in 2010 column refers to the year 2009.b Number of Internet users in 2010 column refers to the year 2008.c Number of fixed broadband subscriptions in 2010 column refers to the year 2009.d Number of fixed telephone lines in 2010 column refers to the year 2009.e Number of Mobile telephone subscriptions in 2010 column refers to the year 2009.f Number of fixed telephone lines in 2005 column refers to the year 2006.g Number of Internet users in 2005 column refers to the year 2006.
Fixed telephone linesMobile cellular telephone
subscriptionsInternet users
Fixed broadband Internet subscriptions
2005 2010 2005 2010 2005 2010 2005 2010
Palau 40.07 34.08 30.40 70.89 .. .. 0.50 1.14
Papua New Guinea
1.05 1.77 1.23 27.84 1.72 1.28 0.00 0.09
Samoa 10.82 19.28 13.32 91.43 3.35 7.00 0.04 0.11
Solomon Islands
1.58 1.56 1.28 5.57 0.84 5.00 0.10 0.37
Tonga 13.62 29.79 29.60 52.18 4.91 12.00 0.64 0.96
Tuvalu 9.18 16.49 13.41 25.44 .. 25.00 1.55 3.26
Vanuatu 3.30 2.09 6.01 119.05 5.08 8.00 0.03 0.13
Transition economies
Albania 8.88 10.35 48.71 141.93 6.04 45.00 0.01 3.43
Armenia 19.39 19.08 10.37 125.01 5.25 37.00 0.06 2.69
Azerbaijan 12.74 16.33 26.11 99.04 8.03 35.99 0.03 5.44
Belarus g 33.43 43.13 41.72 107.69 16.20 31.70 0.02 17.36
Bosnia and Herzegovina
25.62 26.56 42.17 80.15 21.33 52.00 0.36 10.40
Croatia 42.38 42.37 82.16 144.48 33.14 60.32 2.62 18.25
Georgia 12.74 13.72 26.23 73.36 6.08 27.00 0.05 5.09
Kazakhstan 17.85 25.03 35.58 123.35 2.96 34.00 0.02 5.28
Kyrgyzstan 8.73 9.41 10.74 91.86 10.53 20.00 0.05 0.29
Montenegro 27.27 26.84 86.67 185.28 28.82 52.00 1.22 8.30
Republic of Moldova
24.67 32.50 28.93 88.59 14.63 40.00 0.28 7.53
Russian Federation
27.88 31.45 83.42 166.26 15.23 43.00 1.10 10.98
Serbia 32.93 40.52 71.80 129.19 26.30 40.90 0.44 8.50
Tajikistan 4.34 5.35 4.11 86.37 0.30 11.55 0.00 0.07
The former Yugoslav Republic of Macedonia
26.18 20.05 55.49 104.51 26.45 51.90 0.61 12.47
Turkmenistan 8.38 10.31 2.21 63.42 1.00 2.20 .. 0.01
Ukraine 24.86 28.47 63.96 118.66 3.75 23.00 0.28 8.06
Uzbekistan 6.91 6.79 2.77 76.34 3.34 20.00 0.03 0.32
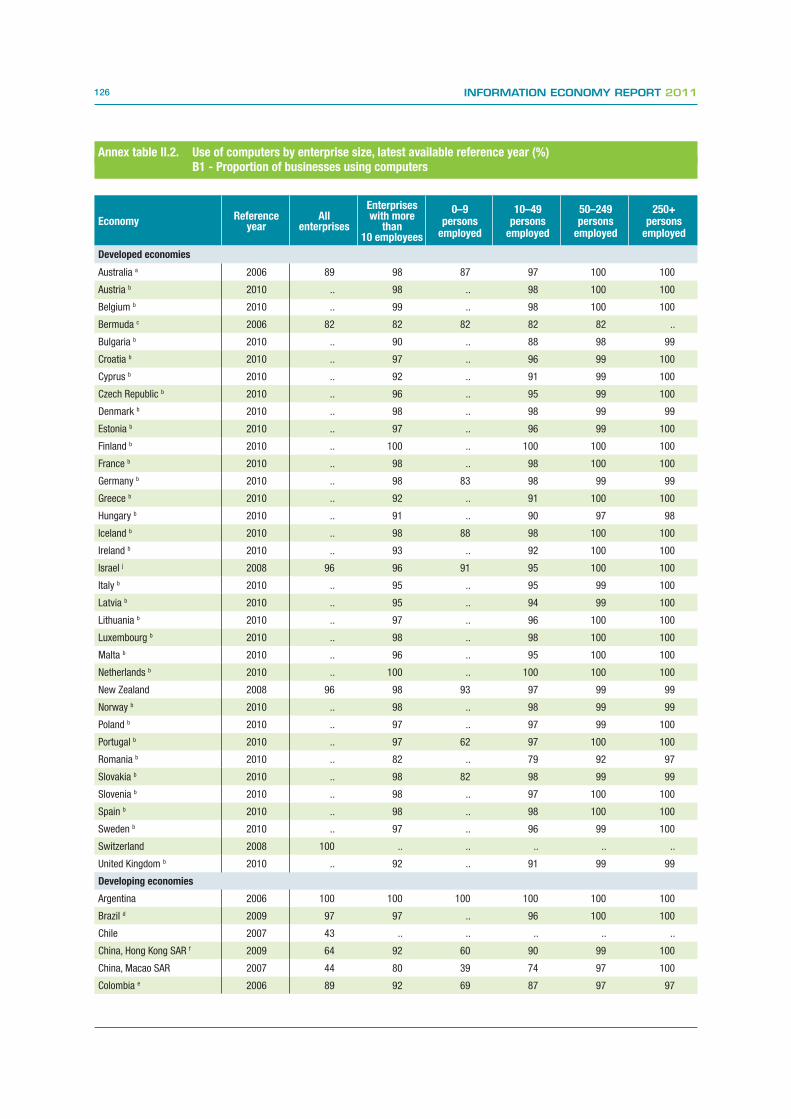
126 INFORMATION ECONOMY REPORT 2011
Annex table II.2. Use of computers by enterprise size, latest available reference year (%) B1 - Proportion of businesses using computers
Economy Reference year
All enterprises
Enterprises with more
than 10 employees
0–9 persons
employed
10–49 persons
employed
50–249 persons
employed
250+ persons
employed
Developed economies
Australia a 2006 89 98 87 97 100 100
Austria b 2010 .. 98 .. 98 100 100
Belgium b 2010 .. 99 .. 98 100 100
Bermuda c 2006 82 82 82 82 82 ..
Bulgaria b 2010 .. 90 .. 88 98 99
Croatia b 2010 .. 97 .. 96 99 100
Cyprus b 2010 .. 92 .. 91 99 100
Czech Republic b 2010 .. 96 .. 95 99 100
Denmark b 2010 .. 98 .. 98 99 99
Estonia b 2010 .. 97 .. 96 99 100
Finland b 2010 .. 100 .. 100 100 100
France b 2010 .. 98 .. 98 100 100
Germany b 2010 .. 98 83 98 99 99
Greece b 2010 .. 92 .. 91 100 100
Hungary b 2010 .. 91 .. 90 97 98
Iceland b 2010 .. 98 88 98 100 100
Ireland b 2010 .. 93 .. 92 100 100
Israel j 2008 96 96 91 95 100 100
Italy b 2010 .. 95 .. 95 99 100
Latvia b 2010 .. 95 .. 94 99 100
Lithuania b 2010 .. 97 .. 96 100 100
Luxembourg b 2010 .. 98 .. 98 100 100
Malta b 2010 .. 96 .. 95 100 100
Netherlands b 2010 .. 100 .. 100 100 100
New Zealand 2008 96 98 93 97 99 99
Norway b 2010 .. 98 .. 98 99 99
Poland b 2010 .. 97 .. 97 99 100
Portugal b 2010 .. 97 62 97 100 100
Romania b 2010 .. 82 .. 79 92 97
Slovakia b 2010 .. 98 82 98 99 99
Slovenia b 2010 .. 98 .. 97 100 100
Spain b 2010 .. 98 .. 98 100 100
Sweden b 2010 .. 97 .. 96 99 100
Switzerland 2008 100 .. .. .. .. ..
United Kingdom b 2010 .. 92 .. 91 99 99
Developing economies
Argentina 2006 100 100 100 100 100 100
Brazil d 2009 97 97 .. 96 100 100
Chile 2007 43 .. .. .. .. ..
China, Hong Kong SAR f 2009 64 92 60 90 99 100
China, Macao SAR 2007 44 80 39 74 97 100
Colombia e 2006 89 92 69 87 97 97

127STATISTICAL ANNEX
Economy Reference year
All enterprises
Enterprises with more
than 10 employees
0–9 persons
employed
10–49 persons
employed
50–249 persons
employed
250+ persons
employed
Cuba 2007 94 95 86 93 93 96
Egypt 2009 64 64 .. 56 79 92
Jordan 2008 18 86 14 79 97 100
Lesotho 2008 34 76 19 71 89 96
Mauritius 2009 98 98 85 97 100 100
Mongolia 2006 37 .. .. .. .. ..
Occupied Palestinian Territory 2009 30 87 28 87 .. ..
Panama g 2006 79 90 65 87 98 97
Philippines 2008 .. .. .. .. .. ..
Qatar 2008 67 98 60 98 100 100
Republic of Korea 2008 50 98 46 98 100 100
Senegal 2008 92 96 88 94 98 100
Singapore 2009 78 94 74 92 98 100
Thailand 2008 23 81 22 75 93 99
Tunisia h 2009 83 83 .. 79 98 99
Turkey b 2010 .. 92 .. 91 97 98
United Arab Emirates 2008 97 97 .. 92 100 100
Uruguay 2007 92 .. .. .. .. ..
Transition economies
Azerbaijan 2009 25 43 15 35 54 75
Kazakhstan 2008 76 76 .. 74 98 100
Kyrgyzstan 2009 97 98 94 98 99 100
Russian Federation i 2008 92 92 .. 84 99 100
Serbia b 2007 92 92 .. 90 98 100
The former Yugoslav Republic of Macedonia
2009 63 95 60 94 96 100
Notes: a Data refer to all businesses during the year ending 30 June 2006.b Data refer to NACE rev. 2 excluding sector K (financial and insurance activities).c Enterprises with 250+ persons employed are included in 50–249. The total includes public administration numbers.d Estimates.e The category 0–9 corresponds to establishments with 1 to 10 persons employed.f Data refer to “establishments” rather than “enterprises”.g Preliminary figures.h The breakdown by enterprise size is 6–49, 50–199, and 200+. This breakdown does not concern public enterprises,
and the total includes public enterprises.i The category 10–49 corresponds to establishments with 1 to 50 persons employed.j The category 0–9 only includes ISIC Rev 3.1 sector K72 and K73.

128 INFORMATION ECONOMY REPORT 2011
Annex table II.3. Use of Internet by enterprise size, latest available reference year (%) B3 - Proportion of businesses using the Internet
Economy Reference Year
All enterprises
Enterprises with
more than 10 employees
0–9 persons
employed
10–49 persons
employed
50–249 persons
employed
250+ persons
employed
Developed economies
Australia a 2007 87 96 84 96 99 99
Austria b 2010 .. 97 .. 97 100 100
Belgium b 2010 .. 97 .. 97 99 100
Bermuda c 2006 71 71 71 71 71 ..
Bulgaria b 2010 .. 85 .. 83 96 99
Canada d 2007 95 95 .. 94 99 100
Croatia b 2010 .. 95 .. 95 98 100
Cyprus b 2010 .. 88 .. 86 98 100
Czech Republic b 2010 .. 95 .. 94 98 100
Denmark b 2010 .. 97 .. 97 98 98
Estonia b 2010 .. 96 .. 95 99 100
Finland b 2010 .. 100 .. 100 100 100
France b 2010 .. 97 .. 96 99 100
Germany b 2010 .. 97 80 97 99 99
Greece b 2010 .. 90 .. 89 99 100
Hungary b 2010 .. 90 .. 88 97 98
Iceland b 2010 .. 98 87 97 100 100
Ireland b 2010 .. 92 .. 91 99 100
Israel l 2008 93 93 90 91 100 100
Italy b 2010 .. 94 .. 93 99 99
Japane 2009 100 100 .. .. 99 100
Latvia b 2010 .. 91 .. 89 98 99
Lithuania b 2010 .. 96 .. 95 100 100
Luxembourg b 2010 .. 96 .. 96 99 100
Malta b 2010 .. 94 .. 93 98 100
Netherlands b 2010 .. 98 .. 98 99 100
New Zealand 2008 93 95 90 95 98 99
Norway b 2010 .. 97 .. 96 99 99
Poland b 2010 .. 96 .. 95 99 100
Portugal b 2010 .. 94 53 93 100 100
Romania b 2010 .. 79 .. 76 90 97
Slovakia b 2010 .. 98 78 98 99 99
Slovenia b 2010 .. 97 .. 96 100 100
Spain b 2010 .. 97 .. 96 99 100
Sweden b 2010 .. 96 .. 95 98 100
Switzerland 2008 100 .. .. .. .. ..
United Kingdom b 2010 .. 91 .. 89 99 99
Developing economies
Brazil f 2009 93 93 .. 91 100 100
Chile 2007 39 .. .. .. .. ..
China, Hong Kong SAR h 2009 61 87 57 86 95 99
China, Macao SAR 2007 36 66 31 60 88 96

129STATISTICAL ANNEX
Economy Reference Year
All enterprises
Enterprises with
more than 10 employees
0–9 persons
employed
10–49 persons
employed
50–249 persons
employed
250+ persons
employed
Colombia g 2006 86 89 58 82 96 97
Cuba 2007 70 70 86 80 65 71
Egypt 2009 35 35 .. 26 51 72
Jordan 2008 10 76 6 68 90 98
Lesotho 2008 17 46 7 37 89 72
Mauritius 2009 92 92 72 89 98 100
Occupied Palestinian Territory 2009 20 71 19 71 .. ..
Panama i 2006 68 80 52 75 95 97
Philippines 2008 73 .. .. .. .. ..
Qatar 2008 50 95 40 93 100 99
Republic of Korea 2008 49 97 45 97 99 100
Senegal 2008 84 91 73 88 96 97
Singapore 2009 75 92 70 91 98 100
Suriname 2006 16 59 12 55 77 74
Thailand 2008 16 68 14 59 85 95
Tunisia j 2009 71 70 .. 65 91 95
Turkey b 2010 .. 91 .. 90 97 98
United Arab Emirates 2008 92 .. .. .. .. ..
Uruguay 2007 84 .. .. .. .. ..
Transition economies
Azerbaijan 2009 17 30 9 22 38 68
Kazakhstan 2008 56 56 .. 53 94 95
Kyrgyzstan 2009 38 40 33 37 41 54
Russian Federationk 2008 76 76 .. 59 91 96
Serbiab 2007 87 87 .. 86 86 94
The former Yugoslav Republic of Macedonia
2009 46 86 42 85 91 100
Notes:a Data refer to proportion of all businesses during the year ending 30 June 2007. b Data refer to NACE rev. 2 excluding sector K (financial and insurance activities).c Enterprises with 250+ persons employed are included in 50-249. The total includes public administration numbers.d Enterprise size categories are: 10–49; 50–299; 300+.e Data refer to the sample and have not been extrapolated to the target population. Enterprise sizes 0–9 and 10–49 persons
employed are not surveyed. “50–249” refers to “100–299”, and “250+” refers to “300+”.f Estimates.g The classification 0–9 corresponds to establishments with 1–10 persons employed.h Data refer to “establishments” rather than “enterprises”.i Preliminary figures.j The breakdown by enterprise size is 6–49, 50–199, and 200+. This breakdown does not concern public enterprises,
and the total includes public enterprises.k The category 10–49 corresponds to establishments with 1 to 50 persons employed.l The category 0–9 only includes ISIC Rev 3.1 sector K72 and K73.

130 INFORMATION ECONOMY REPORT 2011
Annex table II.4. Type of enterprise connection to the Internet, by enterprise size (%) B9 - Proportion of businesses using the Internet by type of access (fixed broadband and mobile broadband)
EconomyReference
year
Fixed broadband Mobile broadband
0–9 persons
employed
10–49 persons
employed
50–249 persons
employed
250+ persons
employed
0–9 persons
employed
10–49 persons
employed
50–249 persons
employed
250+ persons
employed
Developed economies
Australia a 2007 93 97 94 100 .. .. .. ..
Austria b 2010 .. 72 90 96 .. 42 65 91
Belgium b 2010 .. 88 96 99 .. 24 49 70
Bulgaria b 2010 .. 57 75 88 .. 7 14 34
Canada c 2007 .. 93 98 99 .. .. .. ..
Croatia b 2010 .. 73 86 97 .. 29 41 71
Cyprus b 2010 .. 82 97 100 .. 9 19 39
Czech Republic b 2010 .. 83 94 99 .. 13 35 51
Denmark b 2010 .. 82 93 95 .. 39 63 81
Estonia b 2010 .. 86 92 99 .. 7 13 36
Finland b 2010 .. 92 97 98 .. 64 88 95
France b 2010 .. 92 98 99 .. 23 46 68
Germany b 2010 67 86 95 96 7 16 38 63
Greece b 2010 .. 78 94 99 .. 5 14 20
Hungary b 2010 .. 76 90 97 .. 18 36 57
Iceland b 2010 82 94 100 100 20 36 74 78
Ireland b 2010 .. 81 95 97 .. 31 52 73
Italy b 2010 .. 82 93 98 .. 16 38 66
Japan d 2009 .. .. 82 71 .. .. .. ..
Latvia b 2010 .. 63 82 92 .. 10 19 41
Lithuania b 2010 .. 76 85 94 .. 16 32 62
Luxembourg b 2010 .. 85 93 94 .. 17 26 57
Malta b 2010 .. 90 96 97 .. 24 41 62
Netherlands b 2010 .. 89 96 99 .. 23 47 68
New Zealand e 2008 86 91 96 97 6 10 27 42
Norway b 2010 .. 83 93 97 .. 35 61 84
Poland b 2010 .. 61 82 96 .. 16 32 64
Portugal b 2010 40 82 90 98 9 20 48 75
Romania b 2010 .. 45 63 84 .. 6 14 33
Slovakia b 2010 51 68 81 94 21 32 46 67
Slovenia b 2010 .. 83 93 100 .. 26 47 73
Spain b 2010 .. 94 98 99 .. 31 57 75
Sweden b 2010 .. 87 96 99 .. 50 76 91
United Kingdom b 2010 .. 85 96 98 .. 30 58 79
Developing economies
Argentina f 2006 17 16 23 42 0 6 10 7
Brazil g 2009 .. 59 78 87 .. 7 20 30
China, Hong Kong SAR h 2009 57 85 95 99 0 0 1 6
Colombia i 2006 35 60 81 90 .. .. .. ..
Egypt 2009 .. 24 49 67 .. .. .. ..
Lesotho 2008 2 11 39 47 .. .. .. ..

131STATISTICAL ANNEX
EconomyReference
year
Fixed broadband Mobile broadband
0–9 persons
employed
10–49 persons
employed
50–249 persons
employed
250+ persons
employed
0–9 persons
employed
10–49 persons
employed
50–249 persons
employed
250+ persons
employed
Occupied Palestinian Territory
2009 12 63 .. .. .. .. .. ..
Qatar 2008 28 81 95 95 .. .. .. ..
Republic of Korea j 2008 45 97 99 100 .. .. .. ..
Senegal 2008 72 86 96 97 5 8 9 82
Singapore 2009 56 75 85 83 8 9 11 8
Thailand k 2008 10 42 67 83 .. .. .. ..
Tunisial 2009 .. 29 45 58 .. .. .. ..
Turkey b 2010 .. 87 96 98 .. 13 25 41
United Arab Emirates 2008 .. 76 83 76 .. .. .. ..
Uruguay g 2005 23 53 68 84 .. .. .. ..
Transition economies
Azerbaijan 2009 0 4 12 17 0 2 3 8
Kazakhstan 2008 .. 2 11 16 .. 2 6 13
Kyrgyzstan m 2009 12 34 41 53 .. .. .. ..
Russian Federation o 2008 .. 28 52 70 .. .. .. ..
Serbia 2007 .. 36 36 46 .. .. .. ..
The former Yugoslav Republic of Macedonia n
2009 34 77 81 88 6 20 17 29
Notes: a Data refer to total broadband connection with year ending 30 June 2007. b Mobile broadband connection refers to the connection to the Internet via portable computer using 3G modem or via 3G
handset, e.g. smartphone.c Enterprise size categories: 10–49; 50–299; 300+. Data refer to all broadband connections and include ADSL, Cable, other
fixed and wireless broadband; they exclude ISDN.d Data refer to the sample and have not been extrapolated to the target population. Enterprise size “50–249” refers to
“100–299”, and “250+” refers to “300+”. Fixed broadband refers to access by CATV, FTTH, FWA, BWA and DSL. e Estimates; answers include “don’t know” responses.f Mobile broadband includes mobile wireless and fixed wireless. g Estimates.h Enterprise size “0–9” refers to establishmentes with 1–10 persons employed. Data refer to enterprises connecting by ADSL,
dedicated channels, wireless, Frame Relay and EDGE. i Data refer to “establishments” rather than “enterprises”.j Includes mobile broadband (HSDPA etc).k Data refer to total broadband, i.e. both fixed and mobile.l Breakdown by enterprise size is “6–49”, “50–199”, and “200+”.m Data refer to fixed broadband with 256 kbit or more, ADSL, xDSL.n Mobile broadband includes narrowband and broadband (no distinction was made in the questionnaire between these two types of mobile connections).o The category 10–49 corresponds to establishments with 1 to 50 persons employed. Access to internet with 256kbit and
higher.

132 INFORMATION ECONOMY REPORT 2011A
nn
ex t
ab
le I
I.5.
Use
of
com
pu
ters
by
eco
nom
ic a
ctiv
ity
(IS
IC R
ev 3
.1),
la
test
ava
ila
ble
ref
eren
ce y
ear
(%)
B1-
Pro
port
ion
of
bu
sin
esse
s u
sin
g c
om
pu
ters
Eco
no
my
Ref
eren
ce
yea
r
Agriculture, hunting and forestry
Fishing
Mining and quarrying
Manufacturing
Electricity, gas and water supply
Construction
Wholesale and retail trade; repair of motor vehicles, motorcycles, etc.
Sale, maintenance and repair of motor vehicles and motorcycles; etc.
Wholesale trade and commission trade, except of motor vehicles and motorcycles
Retail trade, except of motor vehicles and motorcycles; etc.
Hotels and restaurants
Transport, storage and communications
Land transport; transport via pipelines
Water transport
Air transport
Supporting and auxiliary transport activities; activities of travel agencies
Post and telecommunications
Financial intermediation
Real estate activities
Renting of machinery and equipment
Computer and related activities
Research and development
Other business activities
Education
Health and social work
Other community, social and personal service activities
AB
CD
EF
GG
50
G51
G52
HI
I60
I61
I62
I63
I64
JK
70
K71
K72
K73
K74
MN
O
Dev
elop
ed e
con
om
ies
Aus
tral
ia a
2006
....
89
89
96
88
....
97
83
76
..79
....
..8
39
4..
....
....
..9
7..
Aus
tria
b2010
....
..98
100
99
99
....
..100
98
....
....
..1
00
93
97
10
09
9..
....
..
Bel
gium
b2010
....
..98
..100
98
100
98
....
99
99
99
....
Ber
mud
a c
2006
82
....
82
83
82
82
82
....
82
82
....
....
..8
3..
....
....
82
82
82
Bul
gari
a b
2010
....
..89
91
92
91
100
92
95
85
83
94
98
....
..
Cro
atia
b2010
....
..96
..94
99
99
99
99
92
99
....
....
....
....
10
09
9..
....
..
Cyp
rus
b2010
....
..95
95
86
98
97
99
96
96
93
86
....
..1
00
10
09
29
71
00
98
....
..1
00
Cze
ch R
epub
lic b
2010
....
..96
97
98
97
96
97
95
95
94
96
....
..9
99
59
99
89
09
9..
....
98
Den
mar
k b
2010
....
..99
..99
99
99
99
98
..98
93
....
....
....
95
98
98
....
....
Esto
nia
b2010
....
..97
97
95
96
99
100
98
96
97
98
....
..1
00
96
10
09
69
89
8..
....
..
Finl
and
b2010
....
..100
100
100
100
100
100
100
100
99
98
....
..1
00
..9
91
00
10
01
00
....
....
Fran
ce b
2010
....
..98
100
99
99
98
99
95
99
98
97
....
..9
59
81
00
97
10
01
00
....
....
Ger
man
y b
2010
....
..98
99
99
99
96
98
93
100
97
95
....
..8
71
00
88
98
10
09
9..
....
..
Gre
ece
b2010
....
..95
100
92
96
95
98
88
100
93
94
....
..1
00
10
09
91
00
10
0..
....
..
Hun
gary
b2010
....
..92
100
92
92
92
95
87
93
89
90
....
..8
89
99
08
79
99
5..
....
..
Icel
and
b2010
....
..99
93
98
99
100
100
100
100
100
100
....
..1
00
10
01
00
10
01
00
10
0..
....
..
Irel
and
b2010
....
..99
99
97
96
98
99
97
100
93
98
....
..1
00
10
09
49
71
00
97
....
....
Isra
el l
2008
....
100
96
100
87
100
98
100
100
83
98
95
....
10
01
00
10
09
81
00
10
01
00
99
....
..
Italy
b2010
....
..97
99
95
98
97
100
92
99
94
895
....
..9
51
00
98
92
99
99
....
....
Latv
ia b
2010
....
..95
99
96
96
94
99
90
97
95
96
....
..1
00
10
09
79
89
99
7..
....
..
Lith
uani
a b
2010
....
..98
100
98
97
96
98
95
97
93
92
....
..1
00
98
10
09
61
00
10
0..
....
..

133STATISTICAL ANNEX
Eco
no
my
Ref
eren
ce
yea
r
Agriculture, hunting and forestry
Fishing
Mining and quarrying
Manufacturing
Electricity, gas and water supply
Construction
Wholesale and retail trade; repair of motor vehicles, motorcycles, etc.
Sale, maintenance and repair of motor vehicles and motorcycles; etc.
Wholesale trade and commission trade, except of motor vehicles and motorcycles
Retail trade, except of motor vehicles and motorcycles; etc.
Hotels and restaurants
Transport, storage and communications
Land transport; transport via pipelines
Water transport
Air transport
Supporting and auxiliary transport activities; activities of travel agencies
Post and telecommunications
Financial intermediation
Real estate activities
Renting of machinery and equipment
Computer and related activities
Research and development
Other business activities
Education
Health and social work
Other community, social and personal service activities
AB
CD
EF
GG
50
G51
G52
HI
I60
I61
I62
I63
I64
JK
70
K71
K72
K73
K74
MN
O
Luxe
mbo
urg
b2010
....
..96
100
99
99
97
98
95
99
98
95
....
..9
71
00
..9
99
91
00
....
....
Mal
ta b
2010
....
..96
..88
99
88
91
82
95
98
98
....
..1
00
....
95
10
09
9..
....
..
Net
herl
ands
b2010
....
..100
100
100
100
100
100
100
100
100
100
100
100
100
10
01
00
10
01
00
10
01
00
....
....
New
Zea
land
2008
84
92
94
98
100
98
97
97
99
94
91
99
98
100
100
10
09
89
99
19
99
91
00
98
10
09
89
6
Nor
way
b2010
....
..98
100
100
99
96
100
93
100
95
96
....
..1
00
10
01
00
95
99
99
....
....
Pola
nd b
2010
....
..97
100
97
98
95
98
91
98
98
95
....
..9
81
00
10
09
59
99
8..
....
..
Port
ugal
b2010
....
..98
100
94
99
98
98
100
95
100
100
....
..9
61
00
99
10
01
00
10
0..
....
..
Rom
ania
b2010
....
..82
89
80
83
82
82
82
97
81
80
....
..1
00
..8
87
09
39
0..
....
..
Slo
vaki
a b
2010
....
..98
100
99
98
98
99
97
100
98
99
....
..1
00
99
10
09
71
00
98
....
....
Slo
veni
a b
2010
....
..99
100
90
99
99
100
98
100
100
100
....
..1
00
10
01
00
98
10
01
00
....
....
Spa
in b
2010
....
..99
100
98
99
99
100
97
100
99
97
....
..1
00
10
01
00
97
10
01
00
....
....
Sw
eden
b2010
....
..99
100
96
98
98
99
96
97
93
90
....
..9
51
00
10
09
79
99
7..
....
..
Uni
ted
Kin
gdom
b2010
....
..98
99
95
93
93
97
86
100
94
94
....
..9
59
69
19
69
69
5..
....
..
Dev
elop
ing
eco
nom
ies
Arg
entin
a2006
....
..100
....
....
....
....
....
....
....
....
....
....
....
Bra
zil d
2009
....
..98
..98
98
98
....
88
98
....
....
....
....
....
....
..9
6
Chi
le2007
35
..46
56
66
67
29
29
....
32
49
....
....
..7
2..
....
....
....
39
Chi
na, H
ong
Kon
g S
AR
e
2009
....
..69
..55
....
....
....
39
....
....
82
....
....
..5
7..
..
Chi
na, M
acao
SA
R2007
....
..63
..64
36
36
46
27
27
70
42
69
100
76
73
..7
3..
....
81
....
10
0
Col
ombi
a2006
....
..82
....
97
97
98
95
....
....
....
....
....
....
....
....
Cub
a2007
89
95
100
98
100
99
100
100
99
81
94
90
96
100
100
100
10
01
00
10
01
00
10
01
00
99
99
97
65
Egyp
t2009
....
..5
3..
94
76
76
....
78
74
....
....
..1
00
....
....
....
....
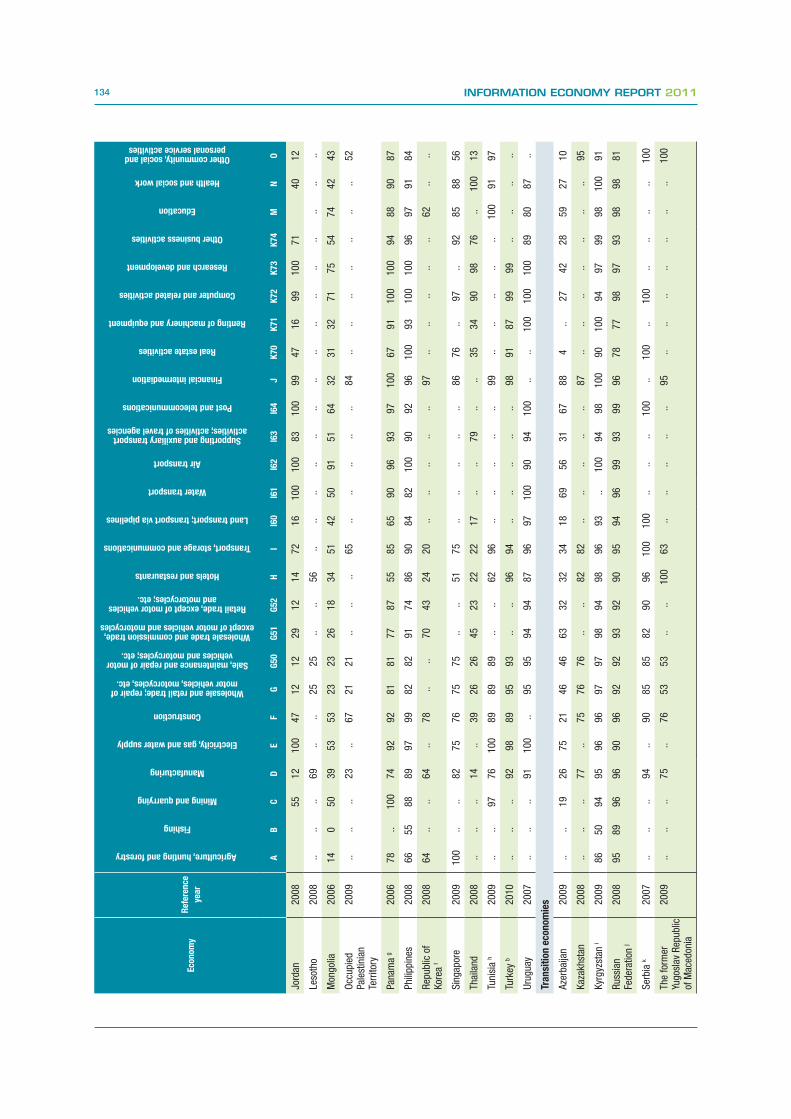
134 INFORMATION ECONOMY REPORT 2011
Eco
no
my
Ref
eren
ce
yea
r
Agriculture, hunting and forestry
Fishing
Mining and quarrying
Manufacturing
Electricity, gas and water supply
Construction
Wholesale and retail trade; repair of motor vehicles, motorcycles, etc.
Sale, maintenance and repair of motor vehicles and motorcycles; etc.
Wholesale trade and commission trade, except of motor vehicles and motorcycles
Retail trade, except of motor vehicles and motorcycles; etc.
Hotels and restaurants
Transport, storage and communications
Land transport; transport via pipelines
Water transport
Air transport
Supporting and auxiliary transport activities; activities of travel agencies
Post and telecommunications
Financial intermediation
Real estate activities
Renting of machinery and equipment
Computer and related activities
Research and development
Other business activities
Education
Health and social work
Other community, social and personal service activities
AB
CD
EF
GG
50
G51
G52
HI
I60
I61
I62
I63
I64
JK
70
K71
K72
K73
K74
MN
O
Jord
an2008
55
12
100
47
12
12
29
12
14
72
16
100
100
83
10
09
94
71
69
91
00
71
40
12
Leso
tho
2008
....
..69
....
25
25
....
56
....
....
....
....
....
....
....
..
Mon
golia
2006
14
050
39
53
53
23
23
26
18
34
51
42
50
91
51
64
32
31
32
71
75
54
74
42
43
Occ
upie
dPa
lest
inia
nTe
rrito
ry
2009
....
..23
..67
21
21
....
..65
....
....
..8
4..
....
....
....
52
Pana
ma
g2006
78
..100
74
92
92
81
81
77
87
55
85
65
90
96
93
97
10
06
79
11
00
10
09
48
89
08
7
Phi
lippi
nes
2008
66
55
88
89
97
99
82
82
91
74
86
90
84
82
100
90
92
96
10
09
31
00
10
09
69
79
18
4
Rep
ublic
of
Kor
ea f
2008
64
....
64
..78
....
70
43
24
20
....
....
..9
7..
....
....
62
....
Sin
gapo
re2009
100
....
82
75
76
75
75
....
51
75
....
....
..8
67
6..
97
..9
28
58
85
6
Thai
land
2008
....
..14
..39
26
26
45
23
22
22
17
....
79
....
35
34
90
98
76
..1
00
13
Tuni
sia
h2009
....
97
76
100
89
89
89
....
62
96
....
....
..9
9..
....
....
10
09
19
7
Turk
ey b
2010
....
..92
98
89
95
93
....
96
94
....
....
..9
89
18
79
99
9..
....
..
Uru
guay
2007
....
..91
100
..95
95
94
94
87
96
97
100
90
94
10
0..
..1
00
10
01
00
89
80
87
..
Tra
nsi
tion
eco
nom
ies
Aze
rbai
jan
2009
....
19
26
75
21
46
46
63
32
32
34
18
69
56
31
67
88
4..
27
42
28
59
27
10
Kaz
akhs
tan
2008
....
..77
..75
76
76
....
82
82
....
....
..8
7..
....
....
....
95
Kyr
gyzs
tan
i2009
86
50
94
95
96
96
97
97
98
94
98
96
93
..100
94
98
10
09
01
00
94
97
99
98
10
09
1
Rus
sian
Fe
dera
tion
j
2008
95
89
96
96
90
96
92
92
93
92
90
95
94
96
99
93
99
96
78
77
98
97
93
98
98
81
Ser
bia
k2007
....
..94
..90
85
85
82
90
96
100
100
....
..1
00
..1
00
..1
00
....
....
10
0
The
form
er
Yugo
slav
Rep
ublic
of
Mac
edon
ia
2009
....
..75
..76
53
53
....
100
63
....
....
..9
5..
....
....
....
10
0

135STATISTICAL ANNEXN
ote
s:
a
Data
refe
r to
the y
ear
end
ing 3
0 J
une 2
006. A
s in
dustr
y d
ivis
ion d
ata
cannot
be s
plit
by
ISIC
60-6
3, a t
ota
l is in
clu
ded
for
Transp
ort
and
Sto
rage in
IS
IC 6
0. N
o t
ota
ls a
re a
vaila
ble
fo
r IS
IC G
and
I. N
o d
ata
are
ava
ilab
le fo
r O
as t
hey
are
colle
cte
d u
nd
er
two s
ep
ara
te d
ivis
ions: C
ultura
l and
recre
ational s
erv
ices a
nd
Pers
onal a
nd
oth
er
serv
ices.
b
Data
refe
r to
NA
CE
Rev
2 s
ecto
rs C
, D
, E
, F,
G, I J, K
64-6
6, L, N
, J, M
.c
Secto
r A
inclu
des fi
shin
g. S
ecto
r K
inclu
des r
eal e
sta
te a
nd
rent,
busin
ess s
erv
ices, oth
er
busin
ess a
ctivi
ties, and
inte
rnational b
usin
esses. P
ub
lic a
dm
inis
tration is
not
inclu
ded
.d
Estim
ate
s. D
ata
refe
r to
national p
roje
ction for
ente
rprises w
ith m
ore
than 9
em
plo
yees.
e
Data
refe
r to
“esta
blis
hm
ents
” ra
ther
than “
ente
rprises”.
f S
ecto
r A
inclu
des s
ecto
rs A
, B
and
C. S
ecto
r M
inclu
des s
ecto
rs L
, M
, N
, O
and
E.
g
Pre
limin
ary
figure
s.
h
Ente
rprise t
ota
ls a
lso in
clu
de p
ub
lic e
nte
rprises.
i D
ata
inclu
de s
ecto
r L75, P
ub
lic a
dm
inis
tration.
j S
ecto
r A
refe
rs t
o ‘Fore
str
y and
pro
visio
n o
f serv
ices in
this
are
a’ (N
AC
E c
od
e 0
2); secto
r M
refe
rs t
o ‘H
igher
ed
ucation’ (c
od
e 8
03); s
ecto
r O
refe
rs t
o ‘E
nte
rtain
ment,
Recre
ation,
Art
s a
nd
Sp
ort
s’ (c
od
e 9
2).
k
secto
r H
inclu
des N
AC
E-R
ev.
1 G
roup
s 5
5.1
and
55.2
- ‘H
ote
ls’ and
‘C
am
pin
g s
ites a
nd
oth
er
pro
visio
n o
f short
sta
y accom
od
ation’; s
ecto
r I6
0 in
clu
des I60-6
3; secto
r K
70
inclu
des K
70, 71, 73, 74; secto
r O
inclu
des O
92.1
and
92.2
- ‘M
otion p
ictu
re a
nd
Vid
eo a
ctivi
ties’ and
‘R
ad
io a
nd
tele
visio
n a
ctivi
ties’
l The c
ate
gory
0–9 o
nly
inclu
des IS
IC R
ev
3.1
secto
r K
72 a
nd
K73.

136 INFORMATION ECONOMY REPORT 2011A
nn
ex t
ab
le I
I.6.
Use
of
Inte
rnet
by
econ
om
ic a
ctiv
ity
(IS
IC R
ev 3
.1),
la
test
ava
ila
ble
ref
eren
ce y
ear
(%)
B3-
Pro
port
ion
of
bu
sin
esse
s u
sin
g t
he
Inte
rnet
Eco
no
my
Ref
eren
ce
year
Agriculture, hunting and forestry
Fishing
Mining and quarrying
Manufacturing
Electricity, gas and water supply
Construction
Wholesale and retail trade; repair of motor vehicles, motorcycles, etc.
Sale, maintenance and repair of motor vehicles and motorcycles; etc.
Wholesale trade and commission trade, except of motor vehicles and motorcycles
Retail trade, except of motor vehicles and motorcycles; etc.
Hotels and restaurants
Transport, storage and communications
Land transport; transport via pipelines
Water transport
Air transport
Supporting and auxiliary transport activities; activities of travel agencies
Post and telecommunications
Financial intermediation
Real estate activities
Renting of machinery and equipment
Computer and related activities
Research and development
Other business activities
Education
Health and social work
Other community, social and personal service activities
AB
CD
EF
GG
50
G51
G52
HI
I60
I61
I62
I63
I64
JK
70
K7
1K
72
K7
3K
74
MN
O
Dev
elop
ed e
con
om
ies
Aus
tral
ia a
2006
....
89
89
96
88
....
97
83
76
..79
....
..8
39
4..
....
....
..9
7..
Aus
tria
b2010
....
..98
100
99
99
....
..100
98
....
....
..1
00
93
97
10
09
9..
....
..
Bel
gium
b2010
....
..98
..100
98
100
98
....
99
99
99
....
Ber
mud
a c
2006
82
....
82
83
82
82
82
....
82
82
....
....
..8
3..
....
....
82
82
82
Bul
gari
a b
2010
....
..89
91
92
91
100
92
95
85
83
94
98
....
..
Cro
atia
b2010
....
..96
..94
99
99
99
99
92
99
....
....
....
....
10
09
9..
....
..
Cyp
rus
b2010
....
..95
95
86
98
97
99
96
96
93
86
....
..1
00
10
09
29
71
00
98
....
..1
00
Cze
ch R
epub
lic b
2010
....
..96
97
98
97
96
97
95
95
94
96
....
..9
99
59
99
89
09
9..
....
98
Den
mar
k b
2010
....
..99
..99
99
99
99
98
..98
93
....
....
....
95
98
98
....
....
Esto
nia
b2010
....
..97
97
95
96
99
100
98
96
97
98
....
..1
00
96
10
09
69
89
8..
....
..
Finl
and
b2010
....
..100
100
100
100
100
100
100
100
99
98
....
..1
00
..9
91
00
10
01
00
....
....
Fran
ce b
2010
....
..98
100
99
99
98
99
95
99
98
97
....
..9
59
81
00
97
10
01
00
....
....
Ger
man
y b
2010
....
..98
99
99
99
96
98
93
100
97
95
....
..8
71
00
88
98
10
09
9..
....
..
Gre
ece
b2010
....
..95
100
92
96
95
98
88
100
93
94
....
..1
00
10
09
91
00
10
0..
....
..
Hun
gary
b2010
....
..92
100
92
92
92
95
87
93
89
90
....
..8
89
99
08
79
99
5..
....
..
Icel
and
b2010
....
..99
93
98
99
100
100
100
100
100
100
....
..1
00
10
01
00
10
01
00
10
0..
....
..
Irel
and
b2010
....
..99
99
97
96
98
99
97
100
93
98
....
..1
00
10
09
49
71
00
97
....
....
Isra
el2008
....
100
95
100
87
93
95
97
85
78
96
93
....
100
95
10
09
69
51
00
10
09
9..
....
Italy
b2010
....
..97
99
95
98
97
100
92
99
94
895
....
..9
51
00
98
92
99
99
....
....
Latv
ia b
2010
....
..95
99
96
96
94
99
90
97
95
96
....
..1
00
10
09
79
89
99
7..
....
..
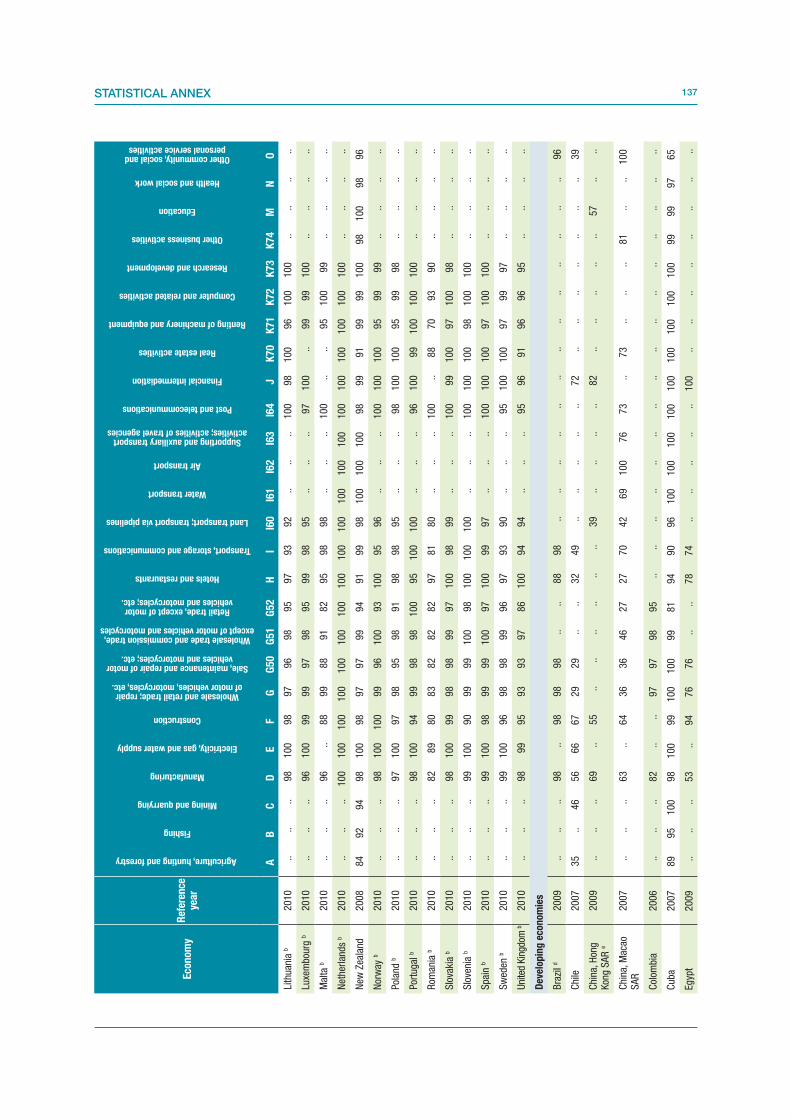
137STATISTICAL ANNEX
Eco
no
my
Ref
eren
ce
year
Agriculture, hunting and forestry
Fishing
Mining and quarrying
Manufacturing
Electricity, gas and water supply
Construction
Wholesale and retail trade; repair of motor vehicles, motorcycles, etc.
Sale, maintenance and repair of motor vehicles and motorcycles; etc.
Wholesale trade and commission trade, except of motor vehicles and motorcycles
Retail trade, except of motor vehicles and motorcycles; etc.
Hotels and restaurants
Transport, storage and communications
Land transport; transport via pipelines
Water transport
Air transport
Supporting and auxiliary transport activities; activities of travel agencies
Post and telecommunications
Financial intermediation
Real estate activities
Renting of machinery and equipment
Computer and related activities
Research and development
Other business activities
Education
Health and social work
Other community, social and personal service activities
AB
CD
EF
GG
50
G51
G52
HI
I60
I61
I62
I63
I64
JK
70
K7
1K
72
K7
3K
74
MN
O
Lith
uani
a b
2010
....
..98
100
98
97
96
98
95
97
93
92
....
..1
00
98
10
09
61
00
10
0..
....
..
Luxe
mbo
urg
b2010
....
..96
100
99
99
97
98
95
99
98
95
....
..9
71
00
..9
99
91
00
....
....
Mal
ta b
2010
....
..96
..88
99
88
91
82
95
98
98
....
..1
00
....
95
10
09
9..
....
..
Net
herl
ands
b2010
....
..100
100
100
100
100
100
100
100
100
100
100
100
10
01
00
10
01
00
10
01
00
10
0..
....
..
New
Zea
land
2008
84
92
94
98
100
98
97
97
99
94
91
99
98
100
100
100
98
99
91
99
99
10
09
81
00
98
96
Nor
way
b2010
....
..98
100
100
99
96
100
93
100
95
96
....
..1
00
10
01
00
95
99
99
....
....
Pola
nd b
2010
....
..97
100
97
98
95
98
91
98
98
95
....
..9
81
00
10
09
59
99
8..
....
..
Port
ugal
b2010
....
..98
100
94
99
98
98
100
95
100
100
....
..9
61
00
99
10
01
00
10
0..
....
..
Rom
ania
b2010
....
..82
89
80
83
82
82
82
97
81
80
....
..1
00
..8
87
09
39
0..
....
..
Slo
vaki
a b
2010
....
..98
100
99
98
98
99
97
100
98
99
....
..1
00
99
10
09
71
00
98
....
....
Slo
veni
a b
2010
....
..99
100
90
99
99
100
98
100
100
100
....
..1
00
10
01
00
98
10
01
00
....
....
Spa
in b
2010
....
..99
100
98
99
99
100
97
100
99
97
....
..1
00
10
01
00
97
10
01
00
....
....
Sw
eden
b2010
....
..99
100
96
98
98
99
96
97
93
90
....
..9
51
00
10
09
79
99
7..
....
..
Uni
ted
Kin
gdom
b2010
....
..98
99
95
93
93
97
86
100
94
94
....
..9
59
69
19
69
69
5..
....
..
Dev
elop
ing
eco
nom
ies
Bra
zil d
2009
....
..98
..98
98
98
....
88
98
....
....
....
....
....
....
..9
6
Chi
le2007
35
..46
56
66
67
29
29
....
32
49
....
....
..7
2..
....
....
....
39
Chi
na, H
ong
Kon
g S
AR
e
2009
....
..69
..55
....
....
....
39
....
....
82
....
....
..5
7..
..
Chi
na, M
acao
S
AR
2007
....
..63
..64
36
36
46
27
27
70
42
69
100
76
73
..7
3..
....
81
....
10
0
Col
ombi
a2006
....
..82
....
97
97
98
95
....
....
....
....
....
....
....
....
Cub
a2007
89
95
100
98
100
99
100
100
99
81
94
90
96
100
100
100
10
01
00
10
01
00
10
01
00
99
99
97
65
Egyp
t2009
....
..53
..94
76
76
....
78
74
....
....
..1
00
....
....
....
....

138 INFORMATION ECONOMY REPORT 2011
Eco
no
my
Ref
eren
ce
year
Agriculture, hunting and forestry
Fishing
Mining and quarrying
Manufacturing
Electricity, gas and water supply
Construction
Wholesale and retail trade; repair of motor vehicles, motorcycles, etc.
Sale, maintenance and repair of motor vehicles and motorcycles; etc.
Wholesale trade and commission trade, except of motor vehicles and motorcycles
Retail trade, except of motor vehicles and motorcycles; etc.
Hotels and restaurants
Transport, storage and communications
Land transport; transport via pipelines
Water transport
Air transport
Supporting and auxiliary transport activities; activities of travel agencies
Post and telecommunications
Financial intermediation
Real estate activities
Renting of machinery and equipment
Computer and related activities
Research and development
Other business activities
Education
Health and social work
Other community, social and personal service activities
AB
CD
EF
GG
50
G51
G52
HI
I60
I61
I62
I63
I64
JK
70
K7
1K
72
K7
3K
74
MN
O
Jord
an2008
55
12
100
47
12
12
29
12
14
72
16
100
100
83
10
09
94
71
69
91
00
71
40
12
Leso
tho
2008
....
..69
....
25
25
....
56
....
....
....
....
....
....
....
..
Mon
golia
2006
14
050
39
53
53
23
23
26
18
34
51
42
50
91
51
64
32
31
32
71
75
54
74
42
43
Occ
upie
d Pa
lest
inia
n Te
rrito
ry
2009
....
..23
..67
21
21
....
..65
....
....
..8
4..
....
....
....
52
Pana
ma
g2006
78
..100
74
92
92
81
81
77
87
55
85
65
90
96
93
97
10
06
79
11
00
10
09
48
89
08
7
Phi
lippi
nes
2008
66
55
88
89
97
99
82
82
91
74
86
90
84
82
100
90
92
96
10
09
31
00
10
09
69
79
18
4
Rep
ublic
of
Kor
ea f
2008
64
....
64
..78
....
70
43
24
20
....
....
..9
7..
....
....
62
....
Sin
gapo
re2009
100
....
82
75
76
75
75
....
51
75
....
....
..8
67
6..
97
..9
28
58
85
6
Thai
land
2008
....
..14
..39
26
26
45
23
22
22
17
....
79
....
35
34
90
98
76
..1
00
13
Tuni
sia
h2009
....
97
76
100
89
89
89
....
62
96
....
....
..9
9..
....
....
10
09
19
7
Turk
ey b
2010
....
..92
98
89
95
93
....
96
94
....
....
..9
89
18
79
99
9..
....
..
Uru
guay
2007
....
..91
100
..95
95
94
94
87
96
97
100
90
94
10
0..
..1
00
10
01
00
89
80
87
..
Tra
nsi
tion
eco
nom
ies
Aze
rbai
jan
2009
....
19
26
75
21
46
46
63
32
32
34
18
69
56
31
67
88
4..
27
42
28
59
27
10
Kaz
akhs
tan
2008
....
..77
..75
76
76
....
82
82
....
....
..8
7..
....
....
....
95
Kyr
gyzs
tan
i2009
86
50
94
95
96
96
97
97
98
94
98
96
93
..100
94
98
10
09
01
00
94
97
99
98
10
09
1
Rus
sian
Fe
dera
tion
j
2008
95
89
96
96
90
96
92
92
93
92
90
95
94
96
99
93
99
96
78
77
98
97
93
98
98
81
Ser
bia
k2007
....
..94
..90
85
85
82
90
96
100
100
....
..1
00
..1
00
..1
00
....
....
10
0
The
form
er
Yugo
slav
R
epub
lic o
f M
aced
onia
2009
....
..75
..76
53
53
....
100
63
....
....
..9
5..
....
....
....
10
0

139STATISTICAL ANNEXN
ote
s:
a
Data
refe
r to
the y
ear
end
ing 3
0 J
une 2
006. A
s in
dustr
y d
ivis
ion d
ata
cannot
be s
plit
by
ISIC
60-6
3 a
tota
l is in
clu
ded
for
Transp
ort
and
Sto
rage in
IS
IC 6
0. N
o t
ota
ls a
re a
vaila
ble
for
ISIC
G a
nd
I. N
o d
ata
are
ava
ilab
le for
O a
s t
hey
are
colle
cte
d u
nd
er
two s
ep
ara
te d
ivis
ions C
ultura
l and
recre
ational s
erv
ices a
nd
P
ers
onal a
nd
oth
er
serv
ices.
b
Data
refe
r to
NA
CE
Rev
2 s
ecto
rs C
, D
, E
, F,
G, I J, K
64-6
6, L, N
, J, M
.c
Secto
r A
inclu
des fi
shin
g. S
ecto
r K
inclu
des r
eal e
sta
te a
nd
rent,
busin
ess s
erv
ices, oth
er
busin
ess a
ctivi
ties, and
inte
rnational b
usin
esses. P
ub
lic a
dm
inis
tration is
not
inclu
ded
.d
Estim
ate
s. D
ata
refe
r to
national p
roje
ction for
ente
rprises w
ith m
ore
than 9
em
plo
yees.
e
Data
refe
r to
“esta
blis
hm
ents
” ra
ther
than “
ente
rprises”.
f S
ecto
r A
inclu
des s
ecto
rs A
, B
and
C. S
ecto
r M
inclu
des s
ecto
rs L
, M
, N
, O
and
E.
g
Pre
limin
ary
figure
s.
h
Ente
rprise t
ota
ls a
lso in
clu
de p
ub
lic e
nte
rprises.
i D
ata
inclu
de s
ecto
r L75, P
ub
lic a
dm
inis
tration.
j S
ecto
r A
refe
rs t
o ‘Fore
str
y and
pro
visio
n o
f serv
ices in
this
are
a’ (N
AC
E c
od
e 0
2); t
he s
ecto
r M
refe
rs t
o ‘H
igher
ed
ucation’
(cod
e 8
03);
the s
ecto
r O
refe
rs t
o ‘E
nte
rtain
ment,
R
ecre
ation, A
rts a
nd
Sp
ort
s’ (c
od
e 9
2).
k
Secto
r H
inclu
des N
AC
E-R
ev.
1 G
roup
s 5
5.1
and
55.2
- ‘H
ote
ls’ and
‘C
am
pin
g s
ites a
nd
oth
er
pro
visio
n o
f short
sta
y accom
od
ation’; s
ecto
r I6
0 in
clu
des I60-6
3; secto
r K
70
inclu
des K
70, 71, 73, 74; secto
r O
inclu
des O
92.1
and
92.2
- ‘M
otion p
ictu
re a
nd
Vid
eo a
ctivi
ties’ and
‘R
ad
io a
nd
tele
visio
n a
ctivi
ties’.

140 INFORMATION ECONOMY REPORT 2011A
nn
ex t
ab
le I
I.7.
Use
of
the
Inte
rnet
by
typ
e of
act
ivit
y, la
test
ava
ila
ble
ref
eren
ce y
ear
E
nte
rpri
ses
wit
h 1
0 o
r m
ore
per
son
s em
plo
yed
Eco
no
my
Ref
eren
ce
yea
r
Pro
po
rtio
n o
f en
terp
rise
s:P
rop
ort
ion
of
ente
rpri
ses
usi
ng
th
e In
tern
et f
or:
With a website
Receiving orders over the Internet
Placing orders over the Internet
Sending and receiving e-mail
Information about goods or services
Information from public authorities
Information searches or research
Internet banking or financial services
Internet banking
Accessing other financial services
Interacting with general government organizations
Providing customer services
Delivering products online
Other types of activity
Telephoning via the Internet/VoIP, or using
videoconferencing
Instant messaging and bulletin boards
Staff training
Internal or external recruit-ment
B5
B7
B8
B12a
B12 b
iB
12 b
iiB
12 b
iii
B12 c
B12 c
iB
12 c
ii
B1
2 d
B1
2 e
B1
2 f
B1
2 g
B1
2 h
B1
2 i
B1
2 j
B1
2 k
Dev
elop
ed e
con
om
ies
Aus
tral
ia a
2007
61
31
56
....
....
..89
..8
1..
....
....
35
..
Aus
tria
b2008
80
14
33
....
71
....
85
..8
15
....
....
30
..
Bel
gium
c2008
76
16
7..
....
....
86
....
3..
....
..2
4..
Ber
mud
a2006
43
624
....
....
....
....
....
....
....
..
Bul
gari
a b
2008
33
24
....
53
....
52
..5
86
....
....
17
..
Can
ada
2007
70
13
65
....
....
....
....
....
....
....
..
Cro
atia
2009
57
23
31
....
56
....
84
..5
9..
....
....
29
..
Cyp
rus
b2008
49
714
....
63
....
55
..6
62
....
....
35
..
Cze
ch R
epub
lic b
2008
74
15
27
....
70
....
88
..7
36
....
....
29
..
Den
mar
k b
2008
87
20
38
....
86
....
94
..9
08
....
....
28
..
Esto
nia
b2008
66
11
18
....
75
....
94
..7
75
....
....
37
..
Finl
and
b2008
82
..25
....
90
....
92
..9
57
....
....
41
..
Fran
ce b
2008
54
13
18
....
67
....
77
..7
43
....
....
23
..
Ger
man
y d
2008
77
....
....
47
....
75
..5
65
....
....
14
..
Gre
ece
b2008
57
69
....
64
....
62
..7
87
....
....
45
..
Hun
gary
b2008
48
47
....
56
....
70
..6
02
....
....
16
..
Icel
and
b2008
63
21
35
....
89
....
99
..9
11
....
....
20
..
Irel
and
b2008
65
26
54
....
84
....
85
..9
13
....
....
37
..
Isra
el2008
61
47
43
89
79
77
....
86
56
41
33
....
26
27
16
44
Italy
b2008
58
312
....
74
....
86
..8
21
2..
....
..1
7..

141STATISTICAL ANNEX
Eco
no
my
Ref
eren
ce
yea
r
Pro
po
rtio
n o
f en
terp
rise
s:P
rop
ort
ion
of
ente
rpri
ses
usi
ng
th
e In
tern
et f
or:
With a website
Receiving orders over the Internet
Placing orders over the Internet
Sending and receiving e-mail
Information about goods or services
Information from public authorities
Information searches or research
Internet banking or financial services
Internet banking
Accessing other financial services
Interacting with general government organizations
Providing customer services
Delivering products online
Other types of activity
Telephoning via the Internet/VoIP, or using
videoconferencing
Instant messaging and bulletin boards
Staff training
Internal or external recruit-ment
B5
B7
B8
B12a
B12 b
iB
12 b
iiB
12 b
iii
B12 c
B12 c
iB
12 c
ii
B1
2 d
B1
2 e
B1
2 f
B1
2 g
B1
2 h
B1
2 i
B1
2 j
B1
2 k
Japa
n e
2009
92
23
40
....
....
....
....
....
....
....
..
Latv
ia b
2008
42
69
....
51
....
83
..5
55
....
....
30
..
Lith
uani
a b
2008
55
22
25
....
83
....
91
..8
61
5..
....
..5
4..
Luxe
mbo
urg
b2008
65
10
23
....
82
....
76
..9
01
0..
....
..2
3..
Mal
ta b
2008
58
13
13
....
72
....
74
..7
44
....
....
26
..
Net
herl
ands
b2008
85
27
40
....
77
....
88
..8
54
....
....
16
..
New
Zea
land
2008
64
42
66
....
69
....
86
..8
06
5..
....
..2
44
4
Nor
way
b2008
73
30
44
....
70
....
85
..7
66
....
....
36
..
Pola
nd b
2008
57
811
....
56
....
75
..6
85
....
....
14
..
Port
ugal
b2008
46
19
20
....
67
....
75
..7
51
3..
....
..3
3..
Rom
ania
b2008
27
44
....
37
....
48
..3
93
....
....
41
..
Slo
vaki
a b
2008
73
59
....
82
....
91
..8
89
....
....
48
..
Slo
veni
a b
2008
71
815
....
85
....
92
..8
81
1..
....
..4
1..
Spa
in b
2008
55
10
19
....
59
....
82
..6
45
....
....
33
..
Sw
eden
b2008
86
19
50
....
76
....
90
..7
87
....
....
26
..
Uni
ted
Kin
gdom
b2008
76
32
47
....
60
....
75
..6
42
....
....
24
..
Dev
elop
ing
eco
nom
ies
Bra
zil f
2009
53
41
51
91
86
60
....
72
..8
14
41
0..
19
50
29
..
Chi
na, H
ong
Kon
g S
AR
h2009
51
625
86
85
77
....
34
22
..1
55
0..
7..
....
Chi
na, M
acao
SA
R2007
..19
24
..56
....
....
....
19
....
....
....
Col
ombi
a g
2006
44
39
37
86
60
49
54
73
....
51
45
10
....
....
..
Cub
a i
2007
26
23
70
70
70
70
10
....
..3
92
70
....
....
Egyp
t2009
22
22
29
24
13
....
8..
61
66
....
....
..
Jord
an2008
50
57
67
72
25
....
....
..2
65
..2
6..
....

142 INFORMATION ECONOMY REPORT 2011
Eco
no
my
Ref
eren
ce
yea
r
Pro
po
rtio
n o
f en
terp
rise
s:P
rop
ort
ion
of
ente
rpri
ses
usi
ng
th
e In
tern
et f
or:
With a website
Receiving orders over the Internet
Placing orders over the Internet
Sending and receiving e-mail
Information about goods or services
Information from public authorities
Information searches or research
Internet banking or financial services
Internet banking
Accessing other financial services
Interacting with general government organizations
Providing customer services
Delivering products online
Other types of activity
Telephoning via the Internet/VoIP, or using
videoconferencing
Instant messaging and bulletin boards
Staff training
Internal or external recruit-ment
B5
B7
B8
B12a
B12 b
iB
12 b
iiB
12 b
iii
B12 c
B12 c
iB
12 c
ii
B1
2 d
B1
2 e
B1
2 f
B1
2 g
B1
2 h
B1
2 i
B1
2 j
B1
2 k
Leso
tho
2008
22
....
44
44
....
....
14
....
....
....
....
Mau
ritiu
s2008
44
35
34
....
....
....
....
....
....
....
..
Occ
upie
d Pa
lest
inia
n Te
rrito
ry2009
38
19
..47
15
....
..3
....
7..
....
....
..
Pana
ma
j2006
..31
35
78
65
54
49
56
....
29
31
..5
6..
....
..
Qat
ar2008
64
61
47
84
76
76
....
48
..5
74
9..
....
....
..
Rep
ublic
of
Kor
ea2008
55
642
91
73
73
....
75
20
69
29
15
..1
4..
20
26
Sen
egal
2008
35
312
89
78
57
....
52
....
49
....
....
....
Sin
gapo
re k
2009
60
41
42
88
85
79
....
62
..8
5..
36
..2
93
31
84
1
Sur
inam
e2006
17
....
....
....
....
....
....
....
....
..
Thai
land
l2008
38
10
11
57
64
....
..14
..1
82
94
....
....
..
Tuni
sia
m2009
30
10
11
63
59
48
....
29
..3
03
5..
19
..5
5
Turk
ey2009
52
915
....
56
....
68
..5
....
....
....
..
Uni
ted
Ara
b Em
irat
es2008
....
..86
83
71
....
54
..6
24
82
5..
....
....
Tra
nsi
tion
eco
nom
ies
Aze
rbai
jan
2009
61
122
10
12
....
13
..2
24
2..
14
11
Kaz
akhs
tan
2008
714
15
49
27
24
....
20
..2
03
92
....
....
8
Kyr
gyzs
tan
2009
12
....
33
..2
....
....
2..
3..
....
....
Rus
sian
Fed
erat
ion
o2008
25
12
18
73
49
39
....
20
..5
3..
4..
13
..2
21
9
Ser
bia
p2007
53
15
17
....
44
47
56
....
52
....
....
....
..
The
form
er Y
ugos
lav
Re-
publ
ic o
f M
aced
onia
n
2009
48
47
....
63
....
61
..6
5..
....
....
33
..
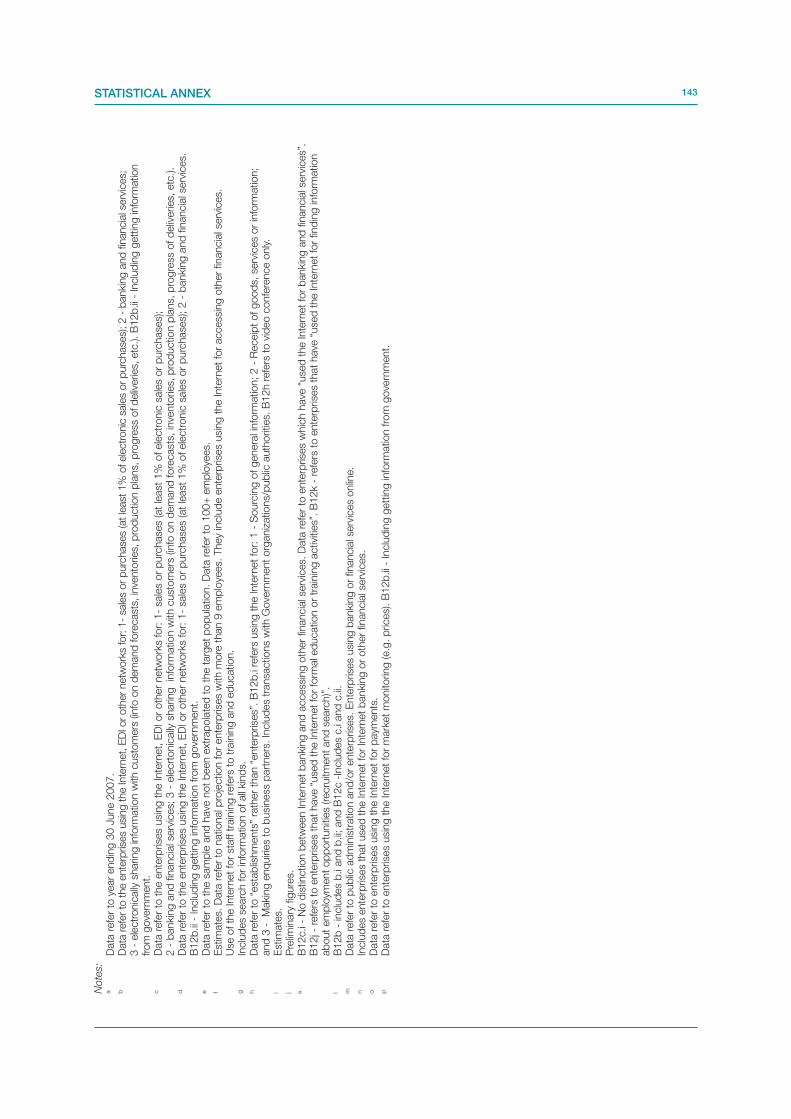
143STATISTICAL ANNEXN
ote
s:
a
Data
refe
r to
year
end
ing 3
0 J
une 2
007.
b
Data
refe
r to
the e
nte
rprise
s usi
ng the Inte
rnet, E
DI or
oth
er
netw
ork
s fo
r: 1
- sa
les
or
purc
hase
s (a
t le
ast
1%
of ele
ctr
onic
sale
s or
purc
hase
s); 2 -
bankin
g a
nd
financia
l serv
ices;
3 -
ele
ctr
onic
ally
sharing in
form
atio
n w
ith c
ust
om
ers
(in
fo o
n d
em
and
fore
cast
s, in
vento
ries,
pro
ductio
n p
lans,
pro
gre
ss o
f d
eliv
eries,
etc
.). B
12b
.ii -
Inclu
din
g g
ett
ing in
form
atio
n
from
gove
rnm
ent.
c
Data
refe
r to
the e
nte
rprises u
sin
g t
he Inte
rnet,
ED
I or
oth
er
netw
ork
s for:
1-
sale
s o
r p
urc
hases (at
least
1%
of ele
ctr
onic
sale
s o
r p
urc
hases);
2 -
bankin
g a
nd
financia
l serv
ices; 3 -
ele
crt
onic
ally
sharing in
form
ation w
ith c
usto
mers
(in
fo o
n d
em
and
fore
casts
, in
vento
ries, p
rod
uction p
lans, p
rogre
ss o
f d
eliv
eries, etc
.).
d
Data
refe
r to
the e
nte
rprises u
sin
g t
he Inte
rnet,
ED
I or
oth
er
netw
ork
s for:
1-
sale
s o
r p
urc
hases (at
least
1%
of ele
ctr
onic
sale
s o
r p
urc
hases); 2
- b
ankin
g a
nd
financia
l serv
ices.
B12b
.ii -
Inclu
din
g g
ett
ing in
form
ation fro
m g
ove
rnm
ent.
e
Data
refe
r to
the s
am
ple
and
have
not
been e
xtr
ap
ola
ted
to t
he t
arg
et
pop
ula
tion. D
ata
refe
r to
100+
em
plo
yees.
f E
stim
ate
s. D
ata
refe
r to
national p
roje
ction for
ente
rprises w
ith m
ore
than 9
em
plo
yees. They
inclu
de e
nte
rprises u
sin
g t
he Inte
rnet
for
accessin
g o
ther
financia
l serv
ices.
Use o
f th
e Inte
rnet
for
sta
ff t
rain
ing r
efe
rs t
o t
rain
ing a
nd
ed
ucation.
g
Inclu
des s
earc
h for
info
rmation o
f all
kin
ds.
h
Data
refe
r to
“esta
blis
hm
ents
” ra
ther
than “
ente
rprises”.
B12b
.i re
fers
usin
g t
he Inte
rnet
for:
1 -
Sourc
ing o
f genera
l info
rmation; 2 -
Receip
t of good
s, serv
ices o
r in
form
ation;
and
3 -
M
akin
g e
nq
uirie
s t
o b
usin
ess p
art
ners
. In
clu
des t
ransactions w
ith G
ove
rnm
ent
org
aniz
ations/p
ub
lic a
uth
orities. B
12h r
efe
rs t
o v
ideo c
onfe
rence o
nly.
i E
stim
ate
s.
j P
relim
inary
figure
s.
k
B12c.i
- N
o d
istinction b
etw
een Inte
rnet
bankin
g a
nd
accessin
g o
ther
financia
l serv
ices. D
ata
refe
r to
ente
rprises w
hic
h h
ave
“used
the Inte
rnet
for
bankin
g a
nd
financia
l serv
ices”.
B
12j -
refe
rs t
o e
nte
rprises t
hat
have
“used
the Inte
rnet
for
form
al e
ducation o
r tr
ain
ing a
ctivi
ties”.
B12k -
refe
rs t
o e
nte
rprises t
hat
have
“used
the Inte
rnet
for
find
ing in
form
ation
ab
out
em
plo
yment
op
port
unitie
s (re
cru
itm
ent
and
searc
h)”
.l
B12b
- in
clu
des b
.i and
b.ii
; and
B12c -
Inclu
des c
.i and
c.ii
.m
Data
refe
r to
pub
lic a
dm
inis
tration a
nd
/or
ente
rprises. E
nte
rprises u
sin
g b
ankin
g o
r fin
ancia
l serv
ices o
nlin
e.
n
Inclu
des e
nte
rprises t
hat
used
the Inte
rnet
for
Inte
rnet
bankin
g o
r oth
er
financia
l serv
ices.
o
Data
refe
r to
ente
rprises u
sin
g t
he Inte
rnet
for
paym
ents
.p
Data
refe
r to
ente
rprises u
sin
g t
he Inte
rnet
for
mark
et
monitoring (e.g
. p
rices). B
12b
.ii -
Inclu
din
g g
ett
ing in
form
ation fro
m g
ove
rnm
ent.

144 INFORMATION ECONOMY REPORT 2011
LIST OF SELECTED PUBLICATIONS IN THE AREA OF SCIENCE, TECHNOLOGY,
AND ICT FOR DEVELOPMENT
A. Flagship reportsInformation Economy Report 2011: ICTs as an Enabler for Private Sector Development. United Nations publication.
Sales no. E.11.II.D.6. New York and Geneva.
Technology and Innovation Report 2010: Enhancing Food Security in Africa through Science, Technology and
Innovation. United Nations publication. UNCTAD/TIR/2009. New York and Geneva.
Information Economy Report 2010: ICTs, Enterprises and Poverty Alleviation. United Nations publication.
Sales no. E.10.II.D.17. New York and Geneva. October.
Information Economy Report 2009: Trends and Outlook in Turbulent Times. United Nations publication.
Sales no. E.09.II.D.18. New York and Geneva. October.
Information Economy Report 2007–2008: Science and Technology for Development – The New Paradigm of ICT.
United Nations publication. Sales no. E.07.II.D.13. New York and Geneva.
Information Economy Report 2006: The Development Perspective. United Nations publication.
Sales no. E.06.II.D.8. New York and Geneva.
Information Economy Report 2005: E-commerce and Development. United Nations publication.
Sales no. E.05.II.D.19. New York and Geneva.
E-Commerce and Development Report 2004. United Nations publication. New York and Geneva.
E-Commerce and Development Report 2003. United Nations publication. Sales no. E.03.II.D.30.
New York and Geneva.
E-Commerce and Development Report 2002. United Nations publication. New York and Geneva.
E-Commerce and Development Report 2001. United Nations publication. Sales no. E.01.II.D.30.
New York and Geneva.
B. ICT Policy ReviewsICT Policy Review of Egypt. United Nations publication (2011). New York and Geneva.
C. Science, Technology and Innovation Policy ReviewsScience, Technology and Innovation Policy Review of Peru. United Nations publication.
UNCTAD/DTL/STICT/2010/2. New York and Geneva.
Science, Technology and Innovation Policy Review of Ghana. United Nations publication.
UNCTAD/DTL/STICT/2009/8. New York and Geneva.
Science, Technology and Innovation Policy Review of Lesotho. United Nations publication.
UNCTAD/DTL/STICT/2009/7. New York and Geneva.
Science, Technology and Innovation Policy Review of Mauritania. United Nations publication.
UNCTAD/DTL/STICT/2009/6. New York and Geneva.
Science, Technology and Innovation Policy Review of Angola. United Nations publication.
UNCTAD/SDTE/STICT/2008/1. New York and Geneva.
Science, Technology and Innovation Policy Review: the Islamic Republic of Iran.
United Nations publication. UNCTAD/ITE/IPC/2005/7. New York and Geneva.
Investment and Innovation Policy Review of Ethiopia. United Nations publication.
UNCTAD/ITE/IPC/Misc.4. New York and Geneva.
Science, Technology and Innovation Policy Review: Colombia. United Nations publication.
Sales no. E.99.II.D.13. New York and Geneva.
Science, Technology and Innovation Policy Review: Jamaica. United Nations publication.
Sales no. E.98.II.D.7. New York and Geneva.

145SELECTED UNCTAD PUBLICATIONS
D. Other publicationsImplementing WSIS Outcomes: Experience to Date and Prospects for the Future. United Nations Commission
on Science and Technology for Development. United Nations publication. UNCTAD/DTL/STICT/2011/3.
New York and Geneva.
Water for Food: Innovative Water Management Technologies for Food Security and Poverty Alleviation.
UNCTAD Current Studies on Science, Technology and Innovation. United Nations publication.
UNCTAD/DTL/STICT/2011/2. New York and Geneva.
Measuring the Impacts of Information and Communication Technology for Development. UNCTAD Current
Studies on Science, Technology and Innovation. United Nations publication. UNCTAD/DTL/STICT/2011/1.
New York and Geneva.
Estudio sobre las Perspectivas de la Harmonización de la Ciberlegislación en Centroamérica y el Caribe.
United Nations publication. UNCTAD/DTL/STICT/2009/3. New York and Geneva. (Spanish only).
Study on Prospects for Harmonizing Cyberlegislation in Latin America. UNCTAD publication.
UNCTAD/DTL/STICT/2009/1. New York and Geneva. (In English and Spanish.)
Financing Mechanisms for Information and Communication Technologies for Development.
UNCTAD Current Studies on Science, Technology and Innovation. United Nations publication.
UNCTAD/DTL/STICT/2009/5. New York and Geneva.
Renewable Energy Technologies for Rural Development. UNCTAD Current Studies on Science,
Technology and Innovation. United Nations publication. UNCTAD/DTL/STICT/2009/4.
New York and Geneva.
Manual for the Production of Statistics on the Information Economy 2009 Revised Edition.
United Nations publication. UNCTAD/SDTE/ECB/2007/2/REV.1. New York and Geneva.
WSIS Follow-up Report 2008. United Nations publication. UNCTAD/DTL/STICT/2008/1.
New York and Geneva.
Measuring the Impact of ICT Use in Business: the Case of Manufacturing in Thailand.
United Nations publication. Sales no. E.08.II.D.13. New York and Geneva.
World Information Society Report 2007: Beyond WSIS. Joint United Nations and ITU publication. Geneva.
World Information Society Report 2006. Joint United Nations and ITU publication. Geneva.
The Digital Divide: ICT Diffusion Index 2005. United Nations publication. New York and Geneva.
The Digital Divide: ICT Development Indices 2004. United Nations publication. New York and Geneva.
Africa’s Technology Gap: Case Studies on Kenya, Ghana, Tanzania and Uganda. United Nations publication.
UNCTAD/ITE/IPC/Misc.13. New York and Geneva.
The Biotechnology Promise: Capacity-Building for Participation of Developing Countries
in the Bioeconomy. United Nations publication. UNCTAD/ITE/IPC/2004/2. New York and Geneva.
Information and Communication Technology Development Indices. United Nations publication.
Sales no. E.03.II.D.14. New York and Geneva.
Investment and Technology Policies for Competitiveness: Review of Successful Country Experiences.
United Nations publication. UNCTAD/ITE/IPC/2003/2. New York and Geneva.
Electronic Commerce and Music Business Development in Jamaica: A Portal to the New Economy?
United Nations publication. Sales no. E.02.II.D.17. New York and Geneva.
Changing Dynamics of Global Computer Software and Services Industry: Implications for Developing
Countries. United Nations publication. Sales no. E.02.II.D.3. New York and Geneva.
Partnerships and Networking in Science and Technology for Development. United Nations publication.
Sales no. E.02.II.D.5. New York and Geneva.
Transfer of Technology for Successful Integration into the Global Economy: A Case Study of Embraer in Brazil.
United Nations publication. UNCTAD/ITE/IPC/Misc.20. New York and Geneva.
Transfer of Technology for Successful Integration into the Global Economy: A Case Study of the South African
Automotive Industry. United Nations publication. UNCTAD/ITE/IPC/Misc.21. New York and Geneva.
Transfer of Technology for the Successful Integration into the Global Economy: A Case Study of the
Pharmaceutical Industry in India. United Nations publication. UNCTAD/ITE/IPC/Misc.22.
New York and Geneva.

146 INFORMATION ECONOMY REPORT 2011
Coalition of Resources for Information and Communication Technologies. United Nations publication.
UNCTAD/ITE/TEB/13. New York and Geneva.
Key Issues in Biotechnology. United Nations publication. UNCTAD/ITE/TEB/10. New York and Geneva.
An Assault on Poverty: Basic Human Needs, Science and Technology. Joint publication with IDRC.
ISBN 0-88936-800-7.
Compendium of International Arrangements on Transfer of Technology: Selected Instruments.
United Nations publication. Sales no. E.01.II.D.28. New York and Geneva.
E. Publications by the Partnership on Measuring ICT for DevelopmentCore ICT Indicators 2010. ITU. Geneva.
The Global Information Society: A Statistical View 2008. United Nations publication. Santiago.
Measuring ICT: The Global Status of ICT Indicators. Partnership on Measuring ICT for Development.
United Nations ICT Task Force. New York.
F. Issues in BriefMeasuring the information economy: How ICT contributes to development. Issues in Brief No. 7.
UNCTAD/IAOS/MISC/2005/13.
E-Tourism in developing countries: More links, fewer leaks. Issues in Brief No. 6.
UNCTAD/IAOS/MISC/2005/11.
ICT and e-commerce: An opportunity for developing countries. Issues in Brief No. 1.
UNCTAD/ISS/MISC/2003/6.

147READERSHIP SURVEY
READERSHIP SURVEY
Information Economy Report 2011: ICTs as an Enabler for Private Sector Development
In order to improve the quality of this report and other publications of the Science, Technology and ICT Branch of
UNCTAD, we welcome the views of our readers on this publication. It would be greatly appreciated if you would
complete the following questionnaire and return it to:
ICT Analysis Section, Office E-7075
Science, Technology and ICT Branch
Division on Technology and Logistics
United Nations
Palais des Nations,
CH-1211, Geneva, Switzerland
Fax: 41 22 917 00 50
1. Name and address of respondent (optional)
...........................................................................................................................................................................
...........................................................................................................................................................................
...........................................................................................................................................................................
2. Which of the following best describes your area of work?
Government ministry
(please specify) ...........................................
Not-for-profit organization
National statistics office Public enterprise
Telecommunication regulatory authority Academic or research institution
Private enterprise Media
International organization Other (please specify) .....................................
3. In which country do you work? ......................................................................................................................
4. What is your assessment of the contents of this publication?
Excellent
Good
Adequate
Poor

148 INFORMATION ECONOMY REPORT 2011
5. How useful is this publication to your work?
Very useful
Somewhat useful
Irrelevant
6. Please indicate the three things you liked best about this publication.
a) .......................................................................................................................................................................
b) .......................................................................................................................................................................
c) .......................................................................................................................................................................
7. Please indicate the three things you liked least about this publication.
a) .......................................................................................................................................................................
b) .......................................................................................................................................................................
c) .......................................................................................................................................................................
8. What additional aspects would you like future editions of this report to cover:
...........................................................................................................................................................................
...........................................................................................................................................................................
...........................................................................................................................................................................
9. Other comments:
...........................................................................................................................................................................
...........................................................................................................................................................................
...........................................................................................................................................................................