review of maritime transport 2011 - unctad
TRANSCRIPT

UNITED NATIONS CONFERENCE ON TRADE AND DEVELOPMENT
REVIEW OF MARITIMETRANSPORT
2011
Report by the UNCTAD secretariat
Chapter 4
UNITED NATIONS
New York and Geneva, 2011

World container port throughput increased by an estimated 13.3 per cent to 531.4 million TEUs in 2010 after stumbling brie�y in 2009. Chinese mainland ports continued to increase their share of total world container port throughput to 24.2 per cent. The UNCTAD Liner Shipping Connectivity Index (LSCI) reveals that China continues its lead as the single most connected country, followed by Hong Kong SAR, Singapore and Germany. In 2011, 91 countries increased their LSCI ranking over 2010, 6 saw no change, and 65 recorded a decrease. In 2010, the rail freight sector grew by 7.2 per cent to reach 9,843 billion freight ton kilometres (FTKs). The road freight sector grew by 7.8 per cent in 2010 over the previous year with volumes reaching 9,721 billion FTKs.
This chapter covers some of the major port development projects under way in developing countries, container throughput, liner shipping connectivity, improvements in port performance, and inland transportation and infrastructure development in the areas of road, rail, and inland waterways, with a special focus on public-private partnerships (PPPs) in �nancing inland transport infrastructure development and rail transport.
CHAPTER 4
PORT AND MULTIMODAL TRANSPORT
DEVELOPMENTS
4

Review of MaRitiMe tRanspoRt 201186
A. portdevelopments
1. Containerportthroughput
For modern production processes, components of goods are often produced as semi-manufactured goods, re-exported in containers and assembled into final products. These final products may also be exported in a container. Containerized goods are suitable for transhipment, which means more container handling for ports. The growth in semi-manufactured goods and the use of transhipment has thus helped container throughput to thrive in recent decades. In 1990, world container port throughput volumes were around 85 million TEUs, and they have since grown sixfold to 531.4 million TEUs over 20 years. As can been seen from chapter two, the world fleet of container ships also grew by a similar magnitude. In 2010, container port throughput resumed its long climb after a brief stumble in 2009 as a result of the global economic crisis.
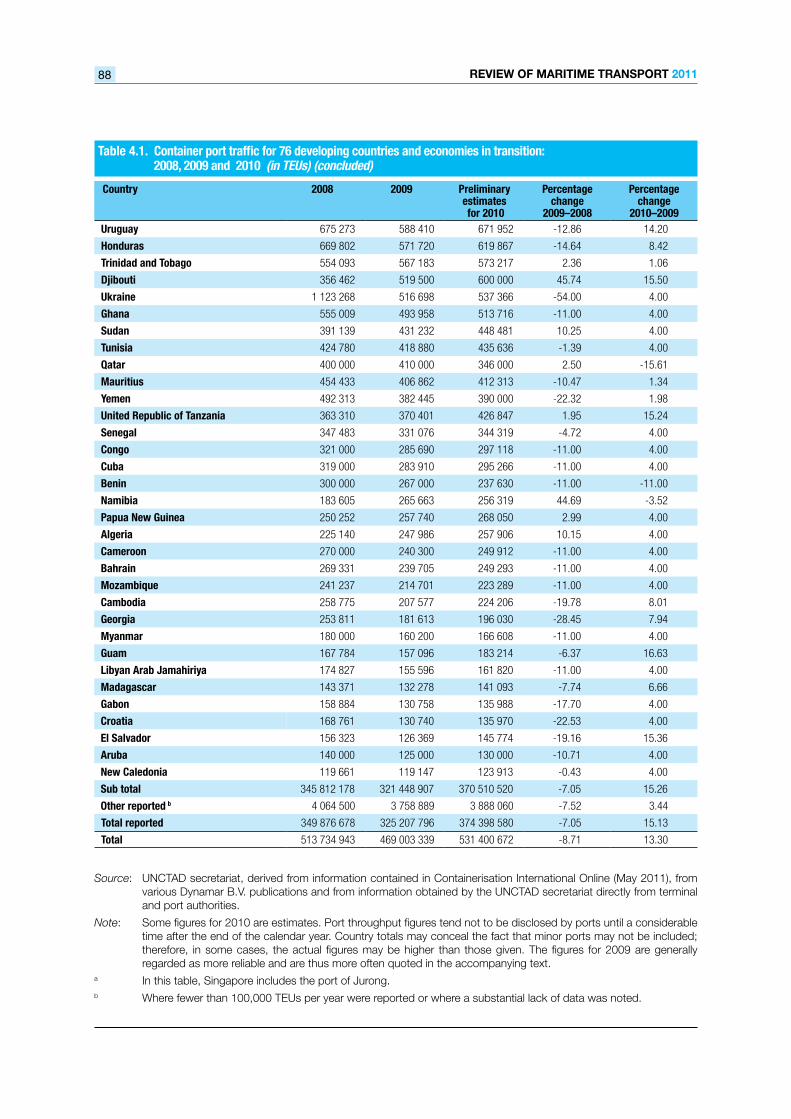
Table 4.1 shows the latest figures available on world container port traffic for 76 developing countries and economies in transition with an annual national throughput of over 100,000 TEUs. (An extended list of port throughput for countries can be found in annex V). In 2009, the container throughput rate of change for developing economies was an estimated minus 7 per cent, with a throughput of 325.2 million TEUs. Their share of world throughput remained virtually unchanged at approximately 69 per cent. Out of the 76 developing economies listed in table 4.1, only 23 experienced a positive growth in port throughput in 2009. The 10 countries registering the highest growth were Ecuador (49.2 per cent), Djibouti (45.7 per cent), Namibia (44.7 per cent), Morocco (32.9 per cent), Jordan (15.8 per cent), Lebanon (15.4 per cent), the Syrian Arab Republic (12.2 per cent), Dominican Republic (11 per cent), the Islamic Republic of Iran (10.3 per cent) and Sudan (10.3 per cent). The country with the largest share of container throughput is China, with nine ports in the top 20. Chinese ports, excluding Hong Kong SAR, experienced a negative growth of 6.58 per cent in 2009 to reach 107.5 million TEUs. Preliminary figures for 2010 showed a rebound for Chinese port throughput of around 19.6 per cent, to 128.5 million TEUs. Despite the fall in overall volumes, Chinese ports, with the exception of Hong Kong SAR, accounted for around 24.2 per cent of world container throughput, up from 22.9 per cent in 2009. The share
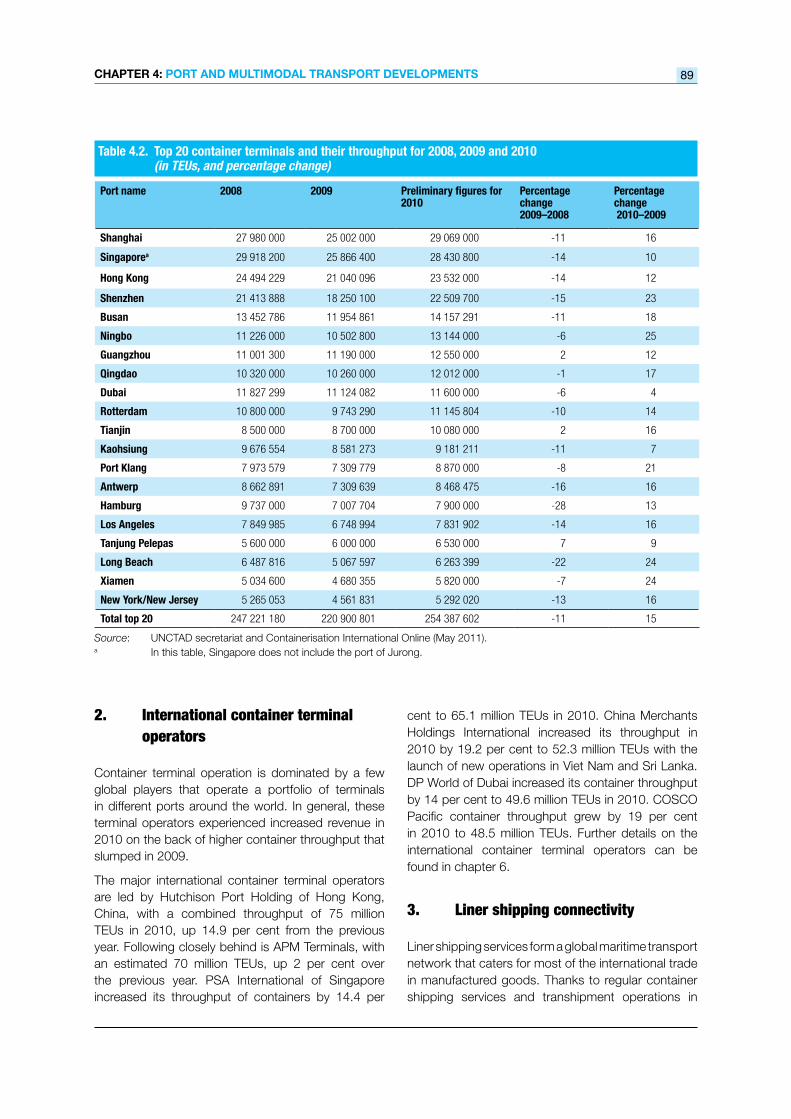
of Chinese ports of world container throughput has risen steadily in recent years from around 1.5 per cent in 1990 to 9.0 per cent in 2000 and 22.5 per cent in 2008. In 2010, the port of Shanghai for the first time took the title of the world’s busiest container port from Singapore, with a throughput of 29.2 million TEUs. This represented a growth rate of over 16 per cent, compared with 2009 and was higher than Singapore’s performance of 9.72 per cent. The port of Shanghai previously overtook Singapore to become the world’s largest port in 2005 in terms of volume handled by all modes of transport. Singapore has faced growing competition in recent years from its neighbours in the form of existing and new potential port projects, for example, Batam Island (Indonesia), Port Tanjung Pelepas (Malaysia), Thailand (Pak Bara) and Cai Mep (Viet Nam).
Table 4.2 shows the world’s 20 leading container ports for 2008–2010. This list includes 14 ports from developing economies, all of which are in Asia; the remaining 6 ports are from developed countries, 3 of which are located in Europe and 3 in North America. In 2010, one Asian port (Laem Chabang, Thailand) fell out of the top 20 and another port from North America (New York/New Jersey) joined the group. This is unusual, given the decline of North American ports in terms of their share of world container throughput. One explanation may be that trade across the Atlantic was less affected by the global economic crisis than trade across the Pacific. Table 4.2 also shows that Ningbo (up two places) and Qingdao (up one place) made gains in their ranking by increasing container throughput 25 and 17 per cent, respectively. Guangzhou (down one place) and Dubai (down two places) slipped in the ranking despite growing 17 and 14 per cent, respectively.
The top 20 container ports combined accounted for approximately 47.9 per cent of world container throughput in 2010, which is up from 47. 1 per cent in 2009 but down from the figure of 48.1 per cent reached in 2008 before the global financial crisis. Combined, these ports showed a 10.7 per cent decrease in throughput in 2009 and a 15.2 per cent increase in 2010. While this is good news for world trade, a closer examination of the numbers reveal that most of the gains reported in 2010 occurred during the first three quarters of the year, weakening significantly in the fourth quarter. In 2009, the top 20 container ports recorded negative growth, except the ports of Guangzhou (China), Tanjung Pelepas (Malaysia) and Tianjin (China).

CHapteR 4: poRt anD MULtiMoDaL tRanspoRt DeveLopMents 87
Table 4.1. Container port traffic for 76 developing countries and economies in transition: 2008, 2009 and 2010 (in TEUs)
Country 2008 2009 Preliminary estimates for 2010
Percentage change
2009–2008
Percentage change
2010–2009
China 115 060 978 107 492 861 128 544 458 -6.58 19.58
Singaporea 30 891 200 26 592 800 29 178 200 -13.91 9.72
China, Hong Kong SAR 24 494 229 21 040 096 23 532 000 -14.10 11.84
Republic of Korea 17 417 723 15 699 161 18 487 580 -9.87 17.76
Malaysia 16 024 829 15 671 296 17 975 796 -2.21 14.71
United Arab Emirates 14 756 127 14 425 039 15 195 223 -2.24 5.34
China, Taiwan Province of 12 971 224 11 352 097 12 302 111 -12.48 8.37
India 7 672 457 8 011 810 8 942 725 4.42 11.62
Indonesia 7 404 831 7 243 557 8 960 360 -2.18 23.70
Brazil 7 238 976 6 574 617 7 979 626 -9.18 21.37
Egypt 6 099 218 6 250 443 6 665 401 2.48 6.64
Thailand 6 726 237 5 897 935 6 648 532 -12.31 12.73
Viet Nam 4 393 699 4 840 598 5 474 452 10.17 13.09
Panama 5 129 499 4 597 112 5 906 744 -10.38 28.49
Turkey 5 218 316 4 521 713 5 508 974 -13.35 21.83
Saudi Arabia 4 652 022 4 430 676 5 313 141 -4.76 19.92
Philippines 4 471 428 4 306 723 5 048 669 -3.68 17.23
Oman 3 427 990 3 768 045 3 774 562 9.92 0.17
South Africa 3 875 952 3 726 313 4 039 241 -3.86 8.40
Sri Lanka 3 687 465 3 464 297 4 000 000 -6.05 15.46
Mexico 3 312 713 2 874 287 3 708 806 -13.23 29.03
Chile 3 164 137 2 795 989 3 162 759 -11.64 13.12
Russian Federation 3 307 075 2 337 634 3 091 322 -29.31 32.24
Iran (Islamic Republic of) 2 000 230 2 206 476 2 592 522 10.31 17.50
Pakistan 1 938 001 2 058 056 2 151 098 6.19 4.52
Colombia 1 969 316 2 056 747 2 443 786 4.44 18.82
Jamaica 1 915 943 1 689 670 1 891 770 -11.81 11.96
Argentina 1 997 146 1 626 351 1 972 269 -18.57 21.27
Bahamas 1 702 000 1 297 000 1 125 000 -23.80 -13.26
Dominican Republic 1 138 471 1 263 456 1 382 601 10.98 9.43
Venezuela (Bolivarian Republic of) 1 325 194 1 238 717 1 228 354 -6.53 -0.84
Peru 1 235 326 1 232 849 1 533 809 -0.20 24.41
Morocco 919 360 1 222 000 2 058 430 32.92 68.45
Bangladesh 1 091 200 1 182 121 1 350 453 8.33 14.24
Ecuador 670 831 1 000 895 1 221 849 49.20 22.08
Lebanon 861 931 994 601 949 155 15.39 -4.57
Guatemala 937 642 906 326 1 012 360 -3.34 11.70
Costa Rica 1 004 971 875 687 1 013 483 -12.86 15.74
Kuwait 961 684 854 044 888 206 -11.19 4.00
Syrian Arab Republic 610 607 685 299 710 642 12.23 3.70
Côte d'Ivoire 713 625 677 029 704 110 -5.13 4.00
Jordan 582 515 674 525 610 000 15.80 -9.57
Kenya 615 733 618 816 643 569 0.50 4.00
Review of MaRitiMe tRanspoRt 201188
Country 2008 2009 Preliminary estimates for 2010
Percentage change
2009–2008
Percentage change
2010–2009Uruguay 675 273 588 410 671 952 -12.86 14.20
Honduras 669 802 571 720 619 867 -14.64 8.42
Trinidad and Tobago 554 093 567 183 573 217 2.36 1.06
Djibouti 356 462 519 500 600 000 45.74 15.50
Ukraine 1 123 268 516 698 537 366 -54.00 4.00
Ghana 555 009 493 958 513 716 -11.00 4.00
Sudan 391 139 431 232 448 481 10.25 4.00
Tunisia 424 780 418 880 435 636 -1.39 4.00
Qatar 400 000 410 000 346 000 2.50 -15.61
Mauritius 454 433 406 862 412 313 -10.47 1.34
Yemen 492 313 382 445 390 000 -22.32 1.98
United Republic of Tanzania 363 310 370 401 426 847 1.95 15.24
Senegal 347 483 331 076 344 319 -4.72 4.00
Congo 321 000 285 690 297 118 -11.00 4.00
Cuba 319 000 283 910 295 266 -11.00 4.00
Benin 300 000 267 000 237 630 -11.00 -11.00
Namibia 183 605 265 663 256 319 44.69 -3.52
Papua New Guinea 250 252 257 740 268 050 2.99 4.00
Algeria 225 140 247 986 257 906 10.15 4.00
Cameroon 270 000 240 300 249 912 -11.00 4.00
Bahrain 269 331 239 705 249 293 -11.00 4.00
Mozambique 241 237 214 701 223 289 -11.00 4.00
Cambodia 258 775 207 577 224 206 -19.78 8.01
Georgia 253 811 181 613 196 030 -28.45 7.94
Myanmar 180 000 160 200 166 608 -11.00 4.00
Guam 167 784 157 096 183 214 -6.37 16.63
Libyan Arab Jamahiriya 174 827 155 596 161 820 -11.00 4.00
Madagascar 143 371 132 278 141 093 -7.74 6.66
Gabon 158 884 130 758 135 988 -17.70 4.00
Croatia 168 761 130 740 135 970 -22.53 4.00
El Salvador 156 323 126 369 145 774 -19.16 15.36
Aruba 140 000 125 000 130 000 -10.71 4.00
New Caledonia 119 661 119 147 123 913 -0.43 4.00
Sub total 345 812 178 321 448 907 370 510 520 -7.05 15.26
Other reported b 4 064 500 3 758 889 3 888 060 -7.52 3.44
Total reported 349 876 678 325 207 796 374 398 580 -7.05 15.13
Total 513 734 943 469 003 339 531 400 672 -8.71 13.30
Table 4.1. Container port traffic for 76 developing countries and economies in transition: 2008, 2009 and 2010 (in TEUs) (concluded)
Source: UNCTAD secretariat, derived from information contained in Containerisation International Online (May 2011), from various Dynamar B.V. publications and from information obtained by the UNCTAD secretariat directly from terminal and port authorities.
Note: Some figures for 2010 are estimates. Port throughput figures tend not to be disclosed by ports until a considerable time after the end of the calendar year. Country totals may conceal the fact that minor ports may not be included; therefore, in some cases, the actual figures may be higher than those given. The figures for 2009 are generally regarded as more reliable and are thus more often quoted in the accompanying text.
a In this table, Singapore includes the port of Jurong.b Where fewer than 100,000 TEUs per year were reported or where a substantial lack of data was noted.
CHapteR 4: poRt anD MULtiMoDaL tRanspoRt DeveLopMents 89
Source: UNCTAD secretariat and Containerisation International Online (May 2011).a In this table, Singapore does not include the port of Jurong.
Table 4.2. Top 20 container terminals and their throughput for 2008, 2009 and 2010 (in TEUs, and percentage change)
Port name 2008 2009 Preliminary figures for 2010
Percentage change 2009–2008
Percentage change 2010–2009
Shanghai 27 980 000 25 002 000 29 069 000 -11 16
Singaporea 29 918 200 25 866 400 28 430 800 -14 10
Hong Kong 24 494 229 21 040 096 23 532 000 -14 12
Shenzhen 21 413 888 18 250 100 22 509 700 -15 23
Busan 13 452 786 11 954 861 14 157 291 -11 18
Ningbo 11 226 000 10 502 800 13 144 000 -6 25
Guangzhou 11 001 300 11 190 000 12 550 000 2 12
Qingdao 10 320 000 10 260 000 12 012 000 -1 17
Dubai 11 827 299 11 124 082 11 600 000 -6 4
Rotterdam 10 800 000 9 743 290 11 145 804 -10 14
Tianjin 8 500 000 8 700 000 10 080 000 2 16
Kaohsiung 9 676 554 8 581 273 9 181 211 -11 7
Port Klang 7 973 579 7 309 779 8 870 000 -8 21
Antwerp 8 662 891 7 309 639 8 468 475 -16 16
Hamburg 9 737 000 7 007 704 7 900 000 -28 13
Los Angeles 7 849 985 6 748 994 7 831 902 -14 16
Tanjung Pelepas 5 600 000 6 000 000 6 530 000 7 9
Long Beach 6 487 816 5 067 597 6 263 399 -22 24
Xiamen 5 034 600 4 680 355 5 820 000 -7 24
New York/New Jersey 5 265 053 4 561 831 5 292 020 -13 16
Total top 20 247 221 180 220 900 801 254 387 602 -11 15
2. Internationalcontainerterminal operators
Container terminal operation is dominated by a few global players that operate a portfolio of terminals in different ports around the world. In general, these terminal operators experienced increased revenue in 2010 on the back of higher container throughput that slumped in 2009.
The major international container terminal operators are led by Hutchison Port Holding of Hong Kong, China, with a combined throughput of 75 million TEUs in 2010, up 14.9 per cent from the previous year. Following closely behind is APM Terminals, with an estimated 70 million TEUs, up 2 per cent over the previous year. PSA International of Singapore increased its throughput of containers by 14.4 per
cent to 65.1 million TEUs in 2010. China Merchants Holdings International increased its throughput in 2010 by 19.2 per cent to 52.3 million TEUs with the launch of new operations in Viet Nam and Sri Lanka. DP World of Dubai increased its container throughput by 14 per cent to 49.6 million TEUs in 2010. COSCO Pacific container throughput grew by 19 per cent in 2010 to 48.5 million TEUs. Further details on the international container terminal operators can be found in chapter 6.
3. linershippingconnectivity
Liner shipping services form a global maritime transport network that caters for most of the international trade in manufactured goods. Thanks to regular container shipping services and transhipment operations in
Review of MaRitiMe tRanspoRt 201190
so-called hub ports, basically all coastal countries are connected to each other. The connectivity level of countries to this global network varies, and since 2004, the annual LSCI established by UNCTAD has captured trends and differences in countries’ liner shipping connectivity. The LSCI covers 162 coastal countries and is made up of five components: (a) the number of ships, (b) their container carrying capacity, (c) the number of companies, (d) the number of services provided and (e) the size of the largest vessels that provide services from and to each country’s seaports.1
In July 2011, China continued to lead the LSCI ranking, followed by China (Hong Kong), Singapore and Germany. The best connected LDCs is Djibouti benefiting from recent port reforms and a geographical position next to major trade routes. Between 2010 and 2011, 91 countries increased their LSCI, 6 countries saw no change and 65 recorded a decrease.
With regard to LSCI components, in 2011 the industry continued to consolidate and the average number of companies per country decreased, while the average vessel size grew. While the use of larger vessels makes it possible to achieve economies of scale and thus reduce trade costs, the extent to which cost savings are passed on to importers and exporters depends on the level of competition among carriers. Many developing countries are confronted with the double challenge of having to accommodate larger ships while having access to fewer regular shipping services to and from a country’s ports.
Several recent empirical studies have found strong correlations between liner shipping connectivity and trade costs, in particular transport costs.2 Different connectivity components, such as the number of direct liner services between a pair of countries, the vessel sizes or the level of competition on a given trade route, are all found to be closely related to lower transport costs. A recent research project by the Economic and Social Commission for Asia and the Pacific (ESCAP) included the LSCI in an empirical study on trade costs, and concluded that “about 25% of the changes in non-tariff policy-related trade costs can be explained by the liner shipping connectivity index”.3 For the estimated trade costs between a number of Asian exporters and importers, the ESCAP study found that the exporting country’s LSCI had a higher correlation with the trade costs than the importing country’s LSCI.
In order to complement the country-level LSCI data and to facilitate further analysis of trade costs and flows, UNCTAD has created a more comprehensive database on pair-of-country connectivity data. The database includes the air and maritime distances between countries’ main air- and seaports, combined with data on the liner shipping services between the latter. Using this database to compare the structure of the global liner shipping network of 2006 and 2010, some interesting trends can be observed. In 2006, 18.4 per cent of pairs of countries were connected with each other through direct liner shipping services, while the remaining 81.6 per cent required at least one transhipment. In 2010, the percentage of direct connections increased slightly to 18.9 per cent. Of the routes that had direct services in 2006, 83 per cent were able to retain those direct services in 2010, i.e. 17 per cent of the pairs of countries had lost the direct service connection four years later. By the same token, 19 per cent of the pairs of countries with direct services between them in 2010 did not have a direct connection in 2006.
The average number of service providers per direct route declined from 5.63 in 2006 to 4.96 in 2010, a decrease of 12 per cent. During the same period, the average size of the largest ships deployed per country pair grew by 38 per cent, from 2,774 TEUs to 3,839 TEUs.
The country-pair data thus confirm trends that were already measured with the LSCI at the country level; as the size of deployed vessels increases, the level of competition decreases. The data further suggest that the overall structure of the global liner shipping network is relatively stable, albeit showing some adjustments over time. Shipping companies may add direct services, for example, in response to growing bilateral trade, or they may drop a direct service if, for example, feedering into a transhipment port helps to fill larger ships on the main route.
Shipping connectivity is an important determinant of trade costs, and understanding them will allow policymakers to improve their country’s trade competitiveness. Carriers’ choices of ports of call are determined by three main considerations: (a) the port’s geographical position within the global shipping networks, (b) the port’s captive cargo base (hinterland), (c) port pricing and the quality of services and of infrastructure.

CHapteR 4: poRt anD MULtiMoDaL tRanspoRt DeveLopMents 91
4. recentportdevelopments
In all parts of the world, new port projects or the expansion of existing facilities, are under way. In 2009, there was a brief pause in port developments as uncertainty surrounded trade volumes and the availability of finance. The recovery in trade volumes witnessed during the first half of 2010 gave renewed confidence for the continuation of many of these projects. The following sections give a snapshot of port projects from around the world; based on diverse sources, they illustrate some of the trends in global port development.
Latin America and the Caribbean
Latin America is continuing apace with some of the world’s most sizeable port development projects on the back of increased commodity exports. The region is catching up with other regions through larger port investment, which stands at almost $12 billion. The port projects listed in this section do not provide an exhaustive analysis of all port projects in the region.
In Brazil, a rise in foreign demand for sugar, soybean and iron ore pushed exports up by 32 per cent to $201.9 billion. Imports also increased by 42 per cent to $181.6 billion as the largest consumer-fuelled demand in two decades took hold.4 In the south of the country, the ports of Antonina and Paranagua reported exports of soybean, corn and sugar expanding significantly.5 Despite Brazil’s continued port investments of around $1 billion since 1995,6 the increase in trade led to port congestion, which forced many shipowners to cancel ship calls.7 To tackle the congestion, the Brazilian Government has announced several major port development projects that are expected to be completed over the next few years.8 In the port of Santos, international investment of $679 million, for instance, was secured to improve its container and liquid cargo-handling facilities. Facilities capable of handling 1.2 million tons of liquid cargo per annum, primarily for exports of ethanol, are being developed. Container-handling facilities will nearly double with the addition of 2.2 million TEUs in capacity to the existing 2.7 million TEUs of throughput in 2010. Elsewhere in Brazil, the largest Brazilian port and logistics company, Wilson Sons, announced plans to invest $1.8 billion in its facilities, including $247 million to expand Tecon Salvador Container Terminal at Salvador Port and Tecon Rio Grande at Rio Grande Port.9 Brazil’s mining giant, Vale, announced plans to spend $2.9 billion expanding port facilities at Ponta da Madeira to reach
150 million tons.10 Ponta da Madeira handled the world’s largest ore carrier, the 402,347 dwt Vale Brasil, with iron ore destined for Dalian, China, in 2011.
In Chile, the concession of the new Terminal 2 project at Valparaiso port has stalled, as none of the three pre-qualified companies, out of the original 18 companies that expressed interest, made a bid.11 The current development work is estimated to cost $350 million and to be completed by 2014. As well as being a maritime gateway to the world, Valparaiso port is part of a vital land transport link to Argentina through the Libertadores mountain pass. In addition, the area around Valparaiso generates approximately 60 per cent of Chile’s GDP.
In Colombia, major plans were announced to develop the country’s transport infrastructure. The estimated cost is $56 billion up to 2021 and includes updating the country’s ports.12
In Uruguay, plans to develop a $3.5 billion deepwater port in Rocha province near La Paloma have been submitted to the government by a consortium of private companies.13
In Panama, plans to build two new ports at Balboa and Rodman with international assistance in both construction and operation were announced by the government.14 The development of a container terminal at Rodman port was previously estimated to cost $100 million and to have a capacity of 450,000 TEUs.15 Rodman port, built as a United States navy base, is expected to be expanded using waste material excavated from the ongoing Panama Canal expansion. The canal expansion, which is set to be completed in 2014 and cost around $5.25 billion, will allow for much larger – although not the largest – vessels to transit (see chapter 2 for more details).
In the Dominican Republic, the port of Caucedo completed its second phase of development in 2011 with an additional 300 metres of quayage. The port, which was originally estimated to cost $300 million, now has a handling capacity of 1.25 million TEUs.16 The port is located next to the International Airport with free zones and logistics centres nearby and 25 km from the capital, Santo Domingo.17
In Jamaica, the port of Kingston announced plans to extend the port to cater for the expected increased demand once the Panama Canal enlargement is completed. The $200 million project will see dredging works take the port’s entrance channel down to 16 metres deep and the quay area extended by 1.5 km.18
Review of MaRitiMe tRanspoRt 201192
In Costa Rica, APMT won a 33-year concession to develop and operate a container terminal at Moin port in Limon province on the Atlantic coast. The project is expected to cost $1 billion and the first phase to be completed by 2016. The port entrance and turning basin will be first dredged to 16 metres and then to 18 metres in a second phase. One thousand direct jobs are expected to be generated during the construction phase and 450, during the first phase of operation, indirect jobs into the local community.19
In El Salvador, the port of La Unión opened for business in 2010. Its construction, which began in 2005, cost over $180 million and will have an annual container throughput capacity of 500,000 TEUs in phase one, rising to 1.7 million TEUs by completion of a second and third phase.20 21 A concession scheme for private companies to operate the port is being finalized.
In Peru, APMT won in 2011 a concession to operate the Terminal Muelle Norte in the port of Callao.22 APMT is expected to invest $749 million in the port, turning it into a multi-purpose port for general cargo, containers, Ro-Ro, break bulk and cruise ships. In 2010, DP World won a concession to operate Muelle Sur pier at Callao and with APMT’s arrival more intra-port competition is expected to be beneficial for port users. Among the mains areas for increased competition are the export of metals (Peru is the world’s number-one silver producer and the second largest copper producer), natural gas, fishmeal and coffee.
Europe
In Europe there are far fewer new port development projects because the market is more mature and the procedural requirements to build new ports often involve a lengthy public consultation process. Western European ports are predominately privately operated with States controlling only around 7 per cent of container port throughput.23 In Eastern Europe the figure is around 16 per cent, suggesting that further reform or development of new ports may be more likely to occur here.
In Greece, the government revealed plans to privatize the ports of Thessaloniki and Piraeus as part of a wider programme to cut government expenditure and increase revenue.24 In 2008, COSCO Pacific won a 35-year concession at the port of Piraeus to operate two container terminals.
In Croatia, a 30-year concession was awarded to ICTSI to operate and develop the Adriatic Gate Container Terminal at the port of Rijeka. The development plan
includes extending the quay by 330 metres and dredging the port to 14.5 metres. Once completed, the port will have a container-handling capacity of 600,000 TEUs.25
In Poland, the DCT Gdansk container terminal, operated by ICTSI, began receiving its first regular deep-sea vessels in January 2010. In May 2011, it welcomed the 13,092 TEU Maersk Elba, the largest container vessel to enter the Baltic Sea.26 The development of Gdansk as a transhipment hub will have an impact on trade flows within the region and economies of scale should bring savings to importers and exIn Georgia, APMT acquired the management of the Black Sea port of Poti. In 2008, Ras Al Khaimah Investment Authority (RAKIA), a sovereign wealth fund of the United Arab Emirates, acquired a 49-year concession to operate the port but failed to attract sufficient investors to the nearby free trade zone. APMT is expected to invest $65 million in the port and the free trade zone.27
Africa
In Africa there is still a large State involvement in ports. For instance, around 50 per cent – the highest of all regions – of the continent’s container throughput passes through ports in which the State owns part of the operation. Many ports in the bulk sector, which handle the export of raw commodities, are joint ventures between governments and foreign companies wishing to purchase a single commodity. Port development projects in Africa are pushing ahead, as illustrated by a number of projects that have been announced or are under way in several countries. For instance, in Guinea, one of the world’s largest exporters of bauxite and alumina and where some of the world’s highest-grade iron ore deposits can be found, a change in political leaders also heralded change at Conakry’s container port. In April 2011, a previous 25-year concession awarded to Getma International in 2008 was cancelled and given to Bolloré Africa Logistics, which had lost out in the initial bidding process. Bolloré Africa Logistics is set to invest €500 ($640) million in the port, which will double the existing quay length, triple the yard area and create a rail connection.28 In a separate deal, Bolloré Group also announced plans to build a $150 million dry port to help relieve congestion through the country. In 2011, an agreement was also signed between the Guinean Government and the mining giant Rio Tinto to develop a new port in the country by 2015.29 The port will handle exports from the Simandou iron ore project, which is expected to
CHapteR 4: poRt anD MULtiMoDaL tRanspoRt DeveLopMents 93
produce 95 million tons of iron ore. The route from the mine to the coast will involve a 650-km dedicated railway, including 21 km of tunnels to reach a wharf located 11 km offshore from Matakang Island.
In Togo, Bolloré Africa Logistics announced plans to build a third quay at Lomé port at a cost of $640 million aimed at doubling container traffic to around 800,000 TEUs within five years. The quay will be 450 metres long, 15 metres deep and will be able to handle vessels up to 7,000 TEUs. 30
In Cameroon, work by the French construction firm Razel got under way to prepare for the construction of a deepwater port at Kribi, some 300 km south of Yaoundé. Once completed, the $1 billion project will provide valuable access to international markets for neighbouring Chad and the Central African Republic.31
In Kenya, bids for construction of a second 1.2 million TEU container terminal at Mombasa is under review.32 In 2010, the port handled 695,000 TEUs, up 12 per cent over the previous year. The port was originally designed to handle 250,000 TEUs, hence the severe congestion. Local unions are, however, concerned that there will be significant reductions to the 7,000 personnel currently employed by the Kenya Port Authorities, should the port become privatized.33
In Mozambique, several port development plans are in progress. In Maputo, the coal terminal is being upgraded to handle 25 million tons by 2014 and developments at the container terminal are nearly completed.34 The dredging of the port from 9.4 metres to 11 metres was completed in early 2011. The port of Nacala, in the north of the country, is set to benefit from increased coal exports from the Moatize mine. Exports from the mine were planned to be transported by the Sena railway line to the port of Beira but construction delays have meant a diversion of coal to Nacala. The Moatize mine is expected to produce 8 millions tons of hard coking coal and 4 million tons of thermal coal annually by 2013.35 The port of Beira is presently undergoing an 18-month dredging programme at a cost of $52 million to receive ships of 60,000 dwt.
In the United Republic of Tanzania, the construction of two new container terminals at the port of Dar es Salaam is to be completed by the end of 2012, doubling the port’s capacity by a further 500,000 TEUs. Dar es Salaam is the country’s principal port, boasting a capacity that can handle 4.1 million tons of dry cargo and 6 million tons of bulk liquid cargo. The port also serves the landlocked countries of Malawi,
Zambia, Burundi, Rwanda and Uganda, as well as the eastern part of the Democratic Republic of the Congo. Presently the port is operating at maximum container capacity with port congestion reportedly increasing from 11 days in 2010 to around 19 days in 2011.
In South Africa, plans are being proposed to develop the county’s busiest port, Durban, by increasing its container-handling capacity from 2.5 million to 6 million TEUs. The work is not expected to start until 2015 and will take four years to complete, thereafter involving a PPP.36 To tackle congestion at Durban port, a new port at Ngqura opened for business at the end of 2009, and is now South Africa’s third-deepest port, achieving 28 container moves per hour. In Cape Town, dredging works at two of four terminals was complete. By the end of the planned development phase, container capacity will double to 1.4 million TEU.37
Asia
Many Asian ports were early adopters of containerization and private participation in port operations. These factors collectively enabled the region to master container handling and become home to some of the world largest global terminal operators.38 Asia is the home to the world’s largest port (Shanghai), most busiest port (Singapore) and to some of the most efficient ports (e.g. Port Klang in Malaysia and Dubai in the United Arab Emirates).39 In addition, there are many new greenfield ports being built, and existing facilities, expanded.
In Israel, plans were announced to privatize the port of Eilat on the Red Sea to boost container throughput. Presently container throughput at Eilat port remains negligible compared with the country’s two other ports, Ashod and Haifa, which together handled 2.2 million TEUs in 2010. Eilat port has a depth of around 11.5 metres, which is sufficient for container vessels of around 3,000 TEUs. If the port is developed to include container handling, it would lower the cost of imports and exports to and from Asia by avoiding the need to use the Suez Canal.
In Iraq, there are plans to issue a tender for the construction of a new port south of Basra that will receive containers bound for Europe and transport them overland by rail, thereby avoiding the use of the Suez Canal. The project is expected to cost $6.4 billion; the initial phase should be completed by the end of 2013, and the second phase, four years later. Upon completion, the port will have 7 km of quays. However, just across the border in Kuwait, plans to develop the Mubarak port on Boubyan Island are

Review of MaRitiMe tRanspoRt 201194
causing concern about the viability of Iraq’s existing and planned ports. The port, to be completed in 2016 at a cost of $1.1 billion, is expected to handle 1.8 million TEUs.40
In Oman, construction work at the port of Salalah has begun. The $645 million project will see the port increase its capacity to 40 million tons of dry bulk commodities and 5 million tons of liquid cargo.41 At the port of Sohar, the Brazilian mining company, Vale, is nearing completion of a new 600-metre jetty to receive its iron ore exports from Brazil. Vale is building an iron ore pelletizing plant at the port of Sohar and supplying it with its own iron ore to extract and re-export the iron pellets.
In Qatar, work has begun on the first phase of the $4.5 billion New Doha port, which is expected to be completed by 2014.42 The first phase will handle containers, general cargo, bulk grain, vehicle carriers, livestock and offshore supply support operations, and a facility for the Qatar coast guard and navy. The new container terminal will have a throughput capacity of two million TEUs, and is one of three planned terminals, which will see throughput rise to a maximum of 12 million TEUs. A dry dock and ship repair yard capable of servicing LNG vessels has been completed.
In Pakistan, the port of Qasim received its first container vessels as the newly completed first phase, 400,000 TEU Terminal 2, became operational. Phases two and three will see capacity rise to 1.2 million TEUs. The port is operated by DP World and can accommodate vessels up to a capacity of 6,700 TEUs.43
In India, the newly deepened Dhamra port in the Bay of Bengal became operational to ships with a draft of up to 18 metres. The port will handle India’s export of bulk cargoes, such as, coal, iron ore, chromites, bauxite and steel.44 The operation of container facilities at the port is expected to be taken over by APMT. Elsewhere in India, a number of other port projects, including those at Chennai, Enmore and Vallarpadam, are contributing to the country’s growing port capacity.45 Indian ports reached an annual capacity capable of handling 1 billion tons in January 2011.46 At the Jawaharial Nehru Port Trust in Mumbai, a new terminal is expected to be built which will add a further 4.8 million TEUs to the port’s present 4 million TEU capacity.
In Indonesia, plans were announced to develop Belawan port from its present 850,000 TEU capacity to 1.2 million TEUs. The port handles around 60 per cent of the country’s palm oil exports, but is suffering from
congestion and long loading and unloading times. The plans include extending the quay length by 350 metres and purchasing new cranes to improve productivity. In addition, access to the port is expected to be improved by increased dredging. Further development at Indonesian ports is also expected as legislation on opening up port competition was enacted in 2011.47
In Viet Nam, the Tan Cang Cai Mep International Terminal with a capacity of 1.15 million TEUs, opened in March 2011.48 The new terminal, located 50 km from Ho Chi Minh City, has a draft of 15.8 metres allowing it to accommodate some of the world’s largest container vessels. Its first customer was the 11,500 TEU CMA CGM Columba, which was sailing on her maiden voyage. Elsewhere in Viet Nam, the development of Van Phong port project in the central province of Khanh Hoa has stalled, while costs have reportedly almost doubled to $295 million.49 A new container port was opened in Hai Cang Ward, Quy Nhon City, Binh Dinh Province, in February 2011 and received its first customer, the Vsico Pioneer, with a capacity of 7,055 dwt. The port will help attract goods from the central provinces of Viet Nam and landlocked neighbouring Laos.
In China, the world’s largest port developer, the focus has shifted from sea ports to inland port development. Plans to spend $2.7 billion on developing Yangtze ports over the period 2011–2015 have been revealed.50 The works will allow a 50,000-dwt vessel to reach Nanjing and be complete by 2015. The river is currently suffering from severe drought, leaving hundreds of vessels stranded.51
B. InlAndtrAnsport developments
This section highlights some recent key developments in global freight volume movement by main inland transport systems, namely rail, road and waterways.52 The subsequent section will consider recent developments affecting developing countries’ inland transport infrastructure with a special focus on PPPs in financing inland transport infrastructure development.
In 2010, global inland freight transport volumes continued the recovery that had started in late 2009 but remained below pre-crisis volumes. By December 2010, road and rail levels were estimated to have remained 5–15 per cent below pre-crisis volumes.53

CHapteR 4: poRt anD MULtiMoDaL tRanspoRt DeveLopMents 95
1. rail
In 2010, the global rail freight sector grew by 7.2 per cent to reach 9,843 billion FTKs, or $161,797 million in value terms, a 7.7 per cent increase over the previous year.54
By the end of 2010, the United States, which accounted for 43.2 per cent of the global rail freight sector value, recorded a strong recovery, albeit with rail freight volumes that were somewhat below pre-crisis levels at the end of the last quarter of 2010.55 Overall traffic for coal and grain commodity carloads, as well as intermodal traffic, was good in 2010, reflecting the increase in global demand for the goods. Total carloads for the year were 14.8 million, up 7.3 per cent compared with 2009 total carloads, and intermodal volume was 11.3 million trailers and containers, up 14.2 per cent compared with 2009.56 The recovery continued in 2011, with reported cumulative rail volumes up 3.3 per cent for the first five months of 2011 and 4.5 million trailers and containers, 8.8 per cent higher than the same period in 2010.57
In 2010, rail freight volumes in the European Union (EU) were estimated to be 16 per cent below the 2008 peak level. Eurostat reported a small recovery in EU-27 freight rail volumes. Data available for the first two quarters in 2010 show increases of 8 per cent and 14 per cent, respectively, compared with the same quarters in 2009. EU-27 rail freight transport suffered significantly in 2009 from the crisis with a 17 per cent reduction in the freight traffic volume, falling to 366 billion ton-kilometres; national and international traffic declined 15 per cent and 20 per cent, respectively. The drop of freight rail transport for the period 2008–2009 has been visible in all EU Member States, except Estonia and Norway, which reported a slight improvement in freight transport, 0.1 per cent and 1.2 per cent, respectively.
The rail freight volumes in China experienced continued growth in 2010, up by 9.6 per cent over the previous year, bringing the total volume to 2,733 billion FTKs.58 Likewise, rail freight volumes recorded an upward trend in the Russian Federation, countries of Central and Eastern Europe and Central Asia. Data from the Community of European Railway and Infrastructure Companies show that rail freight volume in ton-kilometres increased in Central and Eastern Europe by 7.6 per cent compared with 2009.59 Freight volumes on rail lines in the Russian Federation
rose 7.8 per cent to 2.0 trillion ton-kilometres. Russian rail transport accounts for a substantial share of external trade freight between the Russian Federation and China. During the first 10 months of 2010, the volume of rail freight between the countries increased by 33 per cent to reach 53 million tons. The vast majority (94 per cent) of cargo comprises Russian oil, timber, chemicals and mineral fertilizer exports, but there are also increased volumes of imports of Chinese machinery and technical goods. With direct rail freight with China estimated to grow by 50–100 per cent over next decade, and as part of efforts to develop cooperation in rail container freight, Russian Railways have been developing the main freight routes between the Russian Federation and China through large investments in rail infrastructure in the regions of Siberia and the Russian Federation’s Far East.60 At the end of 2010, an agreement was reached with Chinese and German partners to create a joint venture for container transport.61
An emerging trend is the renewed interest in rail freight transport mainly due to the rising price and demand for raw materials (primarily in emerging markets) and the widespread view that rail transport is one of the most optimal modes of transport for large, heavy, bulk freight transfer/haulage over long distances. For instance, coal accounted for 47 per cent of the United States railroad traffic volume in 2009 and generated 25 per cent of railroad gross revenues in that country in 2009.62 Equally, the Australian Rail Growth in the freight transport industry, led by the resources boom, was 6.9 per cent in the last five years, and was worth $10.5 billion in 2010–11. In Brazil, the world’s sixth-largest freight rail market, the freight rail company MRS Logistica 63 experienced an increase in traffic volume of 12 per cent in 2010, surpassing 140 million tons, owing to strong demand worldwide for the country’s commodities, including iron ore, steel, cement and other critical commodities. Box 4.1 provides examples of how the boom in minerals is driving Africa’s railways development, with more investment targeting dedicated minerals railways.
2. road
In 2010, the global road freight sector grew by 7.8 per cent over 2009, with volumes reaching 9,721 billion FTKs. In terms of value, global road freight – the largest segment of inland transport since they are usually reserved for high-value, time-sensitive products – expanded by 8.5 per cent in 2010, compared

Review of MaRitiMe tRanspoRt 201196
Box 4.1. The recent minerals boom and its impact on railway development in Africa
Since late 2009, the mining sector has gathered momentum and the boom in demand has led major railway development in many commodity-producing countries, particularly in Africa.
• China Railway Construction Corporation (CRCC), the second-largest State-owned construction enterprise; Vale SA, a Brazilian mining company, ranked number two after BHP Billiton, Australia; and other companies are investing at least $35 billion in rail projects over the next five years to transport copper and coal out of Africa to power plants in China and India.
• Sinohydro Corporation. China’s State-owned hydropower engineering and construction company, is restoring the 1,344-km Benguela railway linking the cobalt reserves in the southern Democratic Republic of the Congo and copper mines in Zambia to Angola’s Lobito port, 243 miles south of Luanda, the capital.
• Sundance Resources, an Australian exploration company, has signed an MoU with CRCC Africa Construction (CAC) to develop a railway and the required rolling stock to support Sundance’s Mbalam project in Cameroon and the Congo, West Africa. The MoU engages the parties to work together to establish the scope, cost and programme for delivery of railway track and rolling stock sufficient to support a planned output of 35 million tons per annum of iron ore from Sundance’s proposed Cameroon and Congo mines, and sets out the terms for CAC’s delivery of the mine rail project.
• The Brazilian mining company Vale, signed an MoU for the construction of a new railway across southern Malawi to take Vale’s coal from its mining concession in Mozambique’s Moatize coal basin (west) to the northern port of Nacala. The railway is necessary because the existing Sena line, from Moatize to the central port of Beira, will be unable to handle the vast amounts of coal exports planned by Vale and the other mining companies exploiting the Moatize coal basin. The total distance from Moatize to Nacala is about 900 km; not all the line will be entirely new, since after passing through Malawi it will join the existing northern railway to Nacala.
• Freeport-McMoRan Copper & Gold Inc., a leading international mining company with headquarters in Phoenix, Arizona, may build rail lines to transport ore from its $2 billion Tenke project in the Democratic Republic of the Congo, possibly connecting with the Benguela line.
• The Trans-Kalahari Rail Line, linking coal deposits in landlocked Botswana to Namibia’s Walvis Bay for an estimated cost of $9 billion, has drawn great interest from contract bidders such as Anglo American, Canada’s CIC Energy Corporation and South Africa’s Exxaro Resources, Ltd.
with the previous year, with levels reaching $1,720 billion.64 Global road freight volumes are forecast to reach 12,350.5 billion FTKs in 2015, an increase of 27 per cent over 2010. In terms of value, the projected figure amounts to $2,198 billion, an increase in value of 27.8 per cent over 2010. The Americas – United States, Mexico and Canada – account for the largest share of the global road freight sector value, about 56 per cent. The United States road freight sector is estimated to have reached a total volume of 2,918.4 billion FTKs and total revenues of $787 billion in 2010.65
Measured in seasonally adjusted ton-kilometres, road freight in the EU-27 area stagnated in 2010, with volumes remaining 14 per cent below pre-crisis levels.66 The EU’s road freight volumes in 2010 were
estimated at 1,658 billion FTKs. Western Europe accounted for the largest share, with a total of 1,229 billion FTKs, while Eastern Europe reached a total of 429 billion FTKs in 2010.67 In 2009, a little over two thirds of goods carried by road were related to the transportation of goods on national road networks. However, this proportion varied considerably between the EU Member States, with the highest proportion of national road freight transport on Cyprus (98.1 per cent) and the United Kingdom (93.6 per cent in 2007), while the relative importance of national road freight transport was much lower in Slovakia (19.9 per cent), Slovenia (15.4 per cent), Lithuania (14.8 per cent) and Luxembourg (6.3 per cent). For most freight hauliers registered in the EU, international road freight transport mostly relates to intra-EU trade.68

CHapteR 4: poRt anD MULtiMoDaL tRanspoRt DeveLopMents 97
3. Inlandwaterways
Inland water transport, including rivers and canals, represents an important inland transport alternative and an environmentally friendly means of transporting goods, both in terms of energy consumption and exhaust gas emissions. It is estimated that its energy consumption per km/ton of transported goods is approximately 17 per cent of that of road transport and 50 per cent of rail transport.69
Globally, great importance is being given to the inland waterways sector. In the United States, out of 41,000 km of navigable waterways, 24,000 km have a depth of more than 2.75 metres and the modal share of inland waterways transport represents 15 per cent. Although this mode of transport offers the lowest price per ton-mile, this may not be sufficient to guarantee the future of the United States waterway network. Lack of investment and maintenance for aging infrastructure and dredging shortfalls have in recent years been identified as the principal threats to waterway viability and efficiency.70
Inland waterway transport also plays an important role in the transport of goods in the EU. More than 37,000 km of waterways connect hundreds of cities and industrial regions. Some 20 out of the 27 EU Member States have inland waterways, 12 of which have an interconnected waterway networks.71 In 2010, the share of inland waterways in the total transport system was the highest in the Netherlands (42 per cent), followed by France (15 per cent), Hungary (15 per cent), Germany (14 per cent) and Belgium (13 per cent). These shares are likely to grow in the future, particularly in view of Europe-wide policies aimed at promoting its further use. In this respect, the European Commission, through its action programme on the Promotion of Inland Waterway Transport “NAIADES”, aims to develop and strengthen the competitive position of inland waterway transport and to facilitate its integration into the intermodal logistic chain so as to create a sustainable, competitive and environmentally friendly European-wide transport network.
Asia is generously endowed with navigable inland waterways representing 290,000 km in length. More than 1 billion tons of cargo are carried annually on these waterways. China contributes approximately 70 per cent or some 690 million tons of freight of volume per year. With an inland waterway system comprising more than 5,600 navigable rivers and a total navigable length of 119,000 km, and 200 inland ports, China
has the most highly developed inland waterways transport subsector in Asia. This mode of transport has been growing in recent years, given China’s Inland Transport Development Strategy. For instance, in Hunan province, the inland water container transport volume increased from 1,929 TEUs in 1993 to 101,632 TEUs in 2006 at an average annual growth rate of 36 per cent. In central China, where the Yangtze River is used to transport commodities such as coal and steel to and from river cities, freight volumes have been increasing at 40 per cent per annum.72
The aim of China’s Inland Transport Development Strategy is to develop a modern, efficient, green inland waterway system, and build more river ports and infrastructure to develop the country’s vast interior regions and increase water transport capacity, enabling the freight traffic of the national waterways to expand to more than 3 billion tons by 2020.73
Elsewhere in Asia, for example, in Bangladesh, a number of initiatives were launched to enhance the inland waterway mode of transport, which is estimated to carry approximately 35 per cent of the country’s annual freight volume. A major project being implemented by the Bangladesh Inland Water Transport Authority (BIWTA) is the first-ever inland container terminal project at Pangaon in Dhaka, a joint venture between BIWTA and Chittagong Port. The project aims to transport at least 50 per cent of containers through waterways. This is expected to reduce time, cut costs by about 30 per cent a day and lessen pressure on the roads. The terminal is likely to handle about 0.115 million TEUs at the initial stage and reach a 0.16 million TEU capacity. Other inland terminals are planned and are expected to handle over 0.5 million TEUs a year.74 The government will also develop the Ashuganj River port as a container terminal for the smooth transhipment of Indian goods to Tripura through Akhaura.
Africa’s inland waterways have long been recommended as part of the solution to the continent’s transport development and networks integration, mainly for the 29 African countries with navigable waterways. Yet relatively little effort has been put into developing this energy-efficient mode of transport and promoting its integration with road and rail transport links. According to the August-September 2007 issue of African Business, East African waterways offer cheap and easy access to and from ocean ports, although its transport potential has been neglected in the past. Now, however, governments, mainly in southern and central Africa, are
Review of MaRitiMe tRanspoRt 201198
showing interest in the significance of inland waterways, including Lake Malawi and the Zambezi and Shire river system. The Governments of Zambia, Malawi and Mozambique have signed an MoU to promote shipping on the Zambezi–Shire water system. The Shire–Zambezi waterway project, which has been adopted by both the Southern African Development Community (SADC) and the Common Market for Eastern and Southern Africa, aims to develop the waterway as part of regional transport corridors, opening up new outlets to the sea for SADC countries, and promoting regional integration. Another initiative being developed is the establishment of the Commission Internationale du Bassin Congo-Ouabangui-Sangha under the auspices of the Economic and Monetary Community of Central Africa to improve the physical and regulation arrangements for inland navigation between Cameroon, the Congo, the Democratic Republic of the Congo and the Central African Republic.75
C. surfACetrAnsport InfrAstruCturedevelopment IndevelopIngCountrIesThe following section looks more closely at recent developments affecting inland transport infrastructure, mainly in developing countries. The increasing importance of private-sector entities, including through PPPs in financing transport infrastructure development is also highlighted, with an emphasis on rail transport.
In today’s globalized world economy, dominated by interdependent international supply networks, efficient transport systems have come to depend more and more on inland transport networks. They play a crucial role in ensuring the smooth and prompt delivery of goods from production centres or producers’ warehouses to the port of loading and the onward forwarding of cargo to final customers. Inefficient inland transport infrastructure and services can seriously undermine a country’s connectivity and access to global markets and negatively impact its trade performance and competitiveness. The case of landlocked developing countries (LLDCs), which represent about one third of the LDCs, illustrates this point. For African LLDCs, for example, where inland transport-related bottlenecks are significant, freight expenses are very high, averaging 14 per cent of the value of the traded goods,76 compared with an average share in developed countries of 6 per cent. The added transport costs, therefore, erode trade competitiveness and can offset advantages like lower
wage rates that are inherent to LLDCs and the benefits that could be derived from access to globalized markets and international trade.
Addressing the transport infrastructure gap to develop efficient and cost-effective transport infrastructure and services, both interregional and international, requires mass investment. Given the limited availability of public-sector funds, developing countries have been increasingly turning to the private sector, seeking the infusion of private-sector finance, innovation and efficiencies in infrastructure provision through PPPs. In the last two decades, these have been used as a mechanism to leverage greater private investment participation and most importantly to access specialized skills, innovations and new technologies associated with infrastructure development, operation and maintenance.
While there is no single universal definition of PPPs, a widely accepted definition refers to PPP in infrastructure as a mechanism for the “creation and/or management of public infrastructure and/or services through private investment and management for a pre-defined period and with specific service level standards”. 77 As such, PPPs can vary in shape and size, ranging from small service contracts to full-blown concessions, greenfield projects and divestitures.
The sections that follow give a brief analysis of the pattern of private-sector involvement in transport infrastructure development, mainly inland transport, in developing regions over the past two decades.
1. typesoftransport-relatedpublic- privatepartnerships(ppps)in developingcountries78
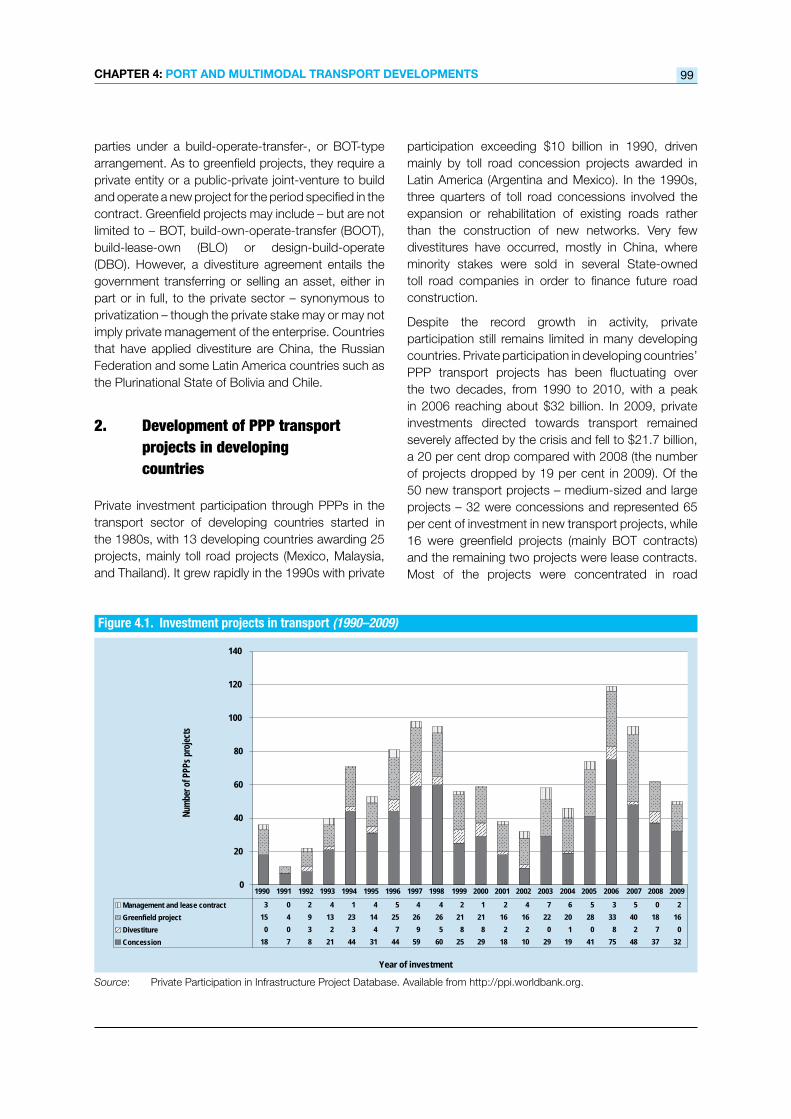
The types of transport-related PPPs that have been developed over the last two decades in developing regions have been mostly concessions and greenfield projects – which may also entail concessions (figure 4.1). The concession model is associated with a long-term contractual arrangement that can be broadly said to signify the private entity taking over an existing State-owned project/providing an infrastructure asset for a given period during which it assumes operation and maintenance of the assets as well as financing and managing all required investment. The government may retain the ultimate legal ownership of the facility and/or right to supply the services. A concession is similar in scope and approach to what is applied in a typical operation and maintenance agreement between
CHapteR 4: poRt anD MULtiMoDaL tRanspoRt DeveLopMents 99
Source: Private Participation in Infrastructure Project Database. Available from http://ppi.worldbank.org.
Figure 4.1. Investment projects in transport (1990–2009)
0
20
40
60
80
100
120
140
Year of investment
Num
ber o
f PPP
s pr
ojec
ts
Management and lease contract 3 0 2 4 1 4 5 4 4 2 1 2 4 7 6 5 3 5 0 2
Greenfield project 15 4 9 13 23 14 25 26 26 21 21 16 16 22 20 28 33 40 18 16
Divestiture 0 0 3 2 3 4 7 9 5 8 8 2 2 0 1 0 8 2 7 0
Concession 18 7 8 21 44 31 44 59 60 25 29 18 10 29 19 41 75 48 37 32
1990 1991 1992 1993 1994 1995 1996 1997 1998 1999 2000 2001 2002 2003 2004 2005 2006 2007 2008 2009
parties under a build-operate-transfer-, or BOT-type arrangement. As to greenfield projects, they require a private entity or a public-private joint-venture to build and operate a new project for the period specified in the contract. Greenfield projects may include – but are not limited to – BOT, build-own-operate-transfer (BOOT), build-lease-own (BLO) or design-build-operate (DBO). However, a divestiture agreement entails the government transferring or selling an asset, either in part or in full, to the private sector – synonymous to privatization – though the private stake may or may not imply private management of the enterprise. Countries that have applied divestiture are China, the Russian Federation and some Latin America countries such as the Plurinational State of Bolivia and Chile.
2. developmentofppptransport projectsindeveloping countries
Private investment participation through PPPs in the transport sector of developing countries started in the 1980s, with 13 developing countries awarding 25 projects, mainly toll road projects (Mexico, Malaysia, and Thailand). It grew rapidly in the 1990s with private
participation exceeding $10 billion in 1990, driven mainly by toll road concession projects awarded in Latin America (Argentina and Mexico). In the 1990s, three quarters of toll road concessions involved the expansion or rehabilitation of existing roads rather than the construction of new networks. Very few divestitures have occurred, mostly in China, where minority stakes were sold in several State-owned toll road companies in order to finance future road construction.
Despite the record growth in activity, private participation still remains limited in many developing countries. Private participation in developing countries’ PPP transport projects has been fluctuating over the two decades, from 1990 to 2010, with a peak in 2006 reaching about $32 billion. In 2009, private investments directed towards transport remained severely affected by the crisis and fell to $21.7 billion, a 20 per cent drop compared with 2008 (the number of projects dropped by 19 per cent in 2009). Of the 50 new transport projects – medium-sized and large projects – 32 were concessions and represented 65 per cent of investment in new transport projects, while 16 were greenfield projects (mainly BOT contracts) and the remaining two projects were lease contracts. Most of the projects were concentrated in road

Review of MaRitiMe tRanspoRt 2011100
projects and in a few large developing economies, such as Brazil, India and Mexico.
In the first quarter of 2010, the trend of investment commitments to new transport projects had not changed compared with the first quarter of 2009. An estimated 440 projects in 61 developing countries were reported to be at the final tender stage, or had been awarded contracts, or were seeking financing, or were yet to start looking for finance.
Despite the difficult environment and financial market conditions associated with the 2009 crisis, many developing country governments maintained their commitment to their PPP programmes. Projects with strong economic and financial fundamentals and solid support from sponsors were still able to get finance, albeit with more stringent conditions such as lower debt/equity ratios, shorter tenors and more conservative structures. Other implementation issues such as delays in land acquisition or government approvals had become more of an issue.
The role of development banks, as well as bilateral and multilateral agencies, was central in raising substantial finance. For instance, about $1.3 billion was provided in 2010 by the Asian Development Bank for transport infrastructure in central and west Asia, mostly under multitranche financing.79 This included a $340 million regional road project in Afghanistan, $456 million for the Central Asia Regional Economic Cooperation (CAREC) corridors programme in Kazakhstan and $115 million in Uzbekistan. The financing will also benefit the 75-km railway line from Hairatan dry port located on Afghanistan’s border with Uzbekistan to Mazar-e-Sharif, the second largest commercial city in northern Afghanistan.80 According to the Infrastructure Consortium for Africa (ICA),81 total commitments to the continent’s freight and passenger transport sector increased by 20 per cent between 2008 and 2009, that is, from $5.9 billion to $7.1 billion in 2009.82 In this regard, a major contribution of some $2 billion83 was made by the African Development Bank.
South–South cooperation has also been a prominent mechanism for financing the transport infrastructure in developing countries. In Africa, for example, China is involved in financing railway and road projects, spearheaded by highly competitive State enterprises with considerable experience in large-scale construction. According to ICA, China’s total commitments to Africa’s infrastructure in 2009 are estimated at $5 billion, mainly across Nigeria, Angola, Ethiopia and Sudan. Another example is India’s
commitments to infrastructure projects in the region, which averaged $500 million per year from 2003 to 2007. In recent years, India has committed funding to an estimated 20 African infrastructure projects worth a total of $2.6 billion. Like China’s financing activities, India’s are closely linked to interests in natural resource development.
3. railtransport
This section explores private-sector participation in transport infrastructure development by focusing on the special case of freight rail transport in Africa.
Railways remain a strategic mode of transport for inland haulage, especially over long distances and for high-volume low-value cargo such as bulk. Rail is also suited to carry container traffic between ports and inland production centres. Over the last two decades, rail transport has grown in tandem with global economic growth and is projected to expand further. By 2015, the global rail freight sector is forecast to carry 12,213 billion FTKs, an increase of 24.1 per cent over 2010. The value of these volumes is expected to reach $199,974 million, 23.6 per cent more than in 2010.84
The relevance of freight rail and the merit of focusing on this mode are further heightened by growing environmental concerns and the prominence of sustainability considerations on the agendas of regulators, traders, transport operators, shippers and consumers. Rail transport offers a fuel-efficient, cost-effective and less polluting means of transport. According to the World Bank, “…rail provides several comparative advantages over road, including higher transport capacity per unit of money invested (50 per cent less cost per kilometre of rehabilitated rail track compared with a two-lane road), higher durability (roads need complete rebuilding every 7 to 10 years as compared with every 15 to 20 years for rail tracks), lower energy consumption and carbon footprint per ton transported – up to 75 per cent and 85 per cent less, respectively”.85
Given the low carbon footprint on a ton-kilometre basis and the prospects of growing rail freight demand, national and regional transport policies have focused on investments in related infrastructure and services to order to foster a modal shift from road to rail. An example can be found in the strategic objectives and policy set forth in the White Paper on Transport adopted by the European Commission
CHapteR 4: poRt anD MULtiMoDaL tRanspoRt DeveLopMents 101
in March 2011. The document sets a clear objective to strengthen the role of rail in freight and passenger traffic. This would entail the shifting of 50 per cent of freight transport on medium distances from road to rail and maritime and river transport. This also aims to contribute to the overall objective of reducing by 60 per cent transport-generated emissions by 2050. The White Paper proposes optimizing the performance of multimodal logistics chains by using several more energy-efficient modes of transport on a larger scale. This means that 30 per cent of road freight moving over 300 km would shift to other modes such as rail or waterborne transport by 2030, and more than 50 per cent by 2050, facilitated by efficient and green freight corridors. Meeting this goal implies the development of adequate infrastructure.86
PPP railway projects in developing countries
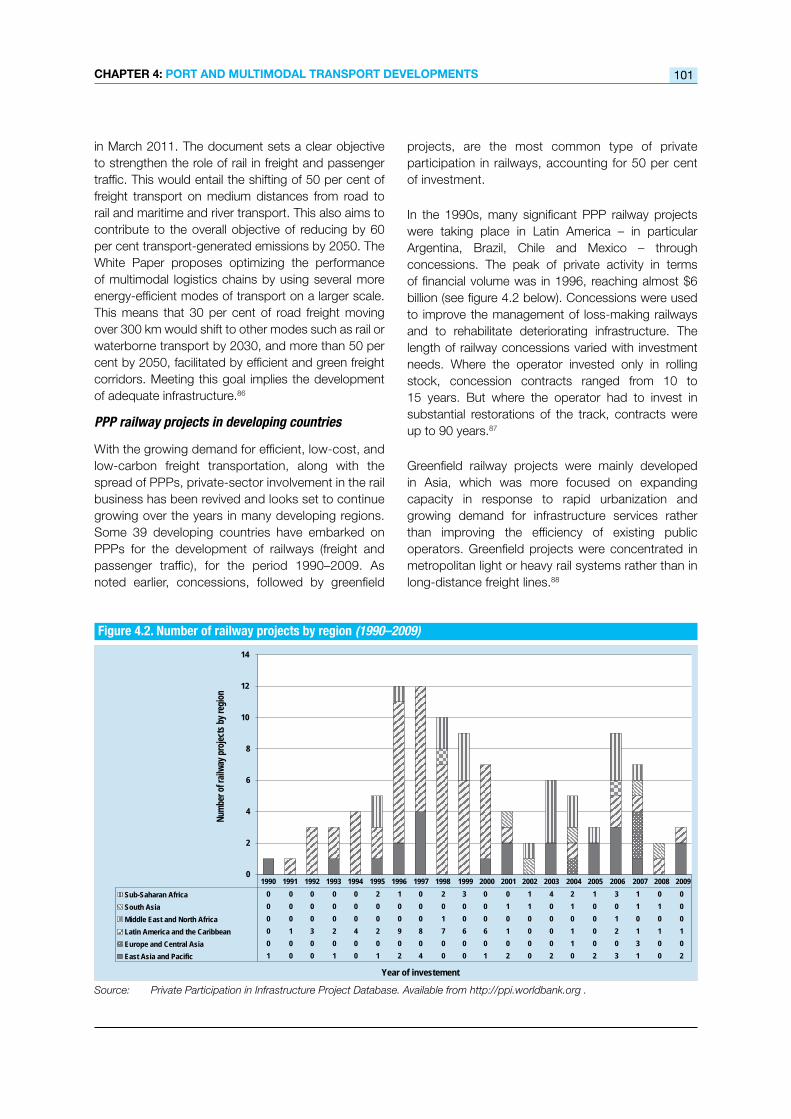
With the growing demand for efficient, low-cost, and low-carbon freight transportation, along with the spread of PPPs, private-sector involvement in the rail business has been revived and looks set to continue growing over the years in many developing regions. Some 39 developing countries have embarked on PPPs for the development of railways (freight and passenger traffic), for the period 1990–2009. As noted earlier, concessions, followed by greenfield
projects, are the most common type of private participation in railways, accounting for 50 per cent of investment.
In the 1990s, many significant PPP railway projects were taking place in Latin America – in particular Argentina, Brazil, Chile and Mexico – through concessions. The peak of private activity in terms of financial volume was in 1996, reaching almost $6 billion (see figure 4.2 below). Concessions were used to improve the management of loss-making railways and to rehabilitate deteriorating infrastructure. The length of railway concessions varied with investment needs. Where the operator invested only in rolling stock, concession contracts ranged from 10 to 15 years. But where the operator had to invest in substantial restorations of the track, contracts were up to 90 years.87
Greenfield railway projects were mainly developed in Asia, which was more focused on expanding capacity in response to rapid urbanization and growing demand for infrastructure services rather than improving the efficiency of existing public operators. Greenfield projects were concentrated in metropolitan light or heavy rail systems rather than in long-distance freight lines.88
Source: Private Participation in Infrastructure Project Database. Available from http://ppi.worldbank.org .
Figure 4.2. Number of railway projects by region (1990–2009)
0
2
4
6
8
10
12
14
Year of investement
Num
ber o
f rai
lway
pro
ject
s by
regi
on
Sub-Saharan Africa 0 0 0 0 0 2 1 0 2 3 0 0 1 4 2 1 3 1 0 0
South Asia 0 0 0 0 0 0 0 0 0 0 0 1 1 0 1 0 0 1 1 0
Middle East and North Africa 0 0 0 0 0 0 0 0 1 0 0 0 0 0 0 0 1 0 0 0
Latin America and the Caribbean 0 1 3 2 4 2 9 8 7 6 6 1 0 0 1 0 2 1 1 1
Europe and Central Asia 0 0 0 0 0 0 0 0 0 0 0 0 0 0 1 0 0 3 0 0
East Asia and Pacific 1 0 0 1 0 1 2 4 0 0 1 2 0 2 0 2 3 1 0 2
1990 1991 1992 1993 1994 1995 1996 1997 1998 1999 2000 2001 2002 2003 2004 2005 2006 2007 2008 2009

Review of MaRitiMe tRanspoRt 2011102
4. railwaystransportdevelopmentinAfrica
Africa has recently been experiencing strong growth, and the rail sector cannot be overemphasized as an enabler of sustainable trade-led growth on the continent.89 Rail transport is of particular relevance for Africa in view of the following factors: (a) the structure of the continent’s trade (i.e. mainly high-volume, low-value goods), (b) its economic and geographical situation (i.e. many LLDCs and high potential for increasing intraregional trade), (c) the prevailing prohibitive cost of inland transport, which drives up overall trade costs (to cite one example, shipping a container from Dubai to Mombasa costs $1,400–$1,700 for a 40-ft container, while inland transport from Mombasa to Kampala costs $3,800), and (d) containerization and the associated developments in multimodal requirements (i.e. if multimodal transport is to be effectively promoted in Africa and if diversification of its trade to include more containerized cargo is to be enabled). Yet, like in many developing regions, historic underinvestment and maintenance in government-owned rail links have resulted in unreliable, inefficient services in many African countries.
Most of the African railways were built at the end of the nineteenth and at the beginning of the twentieth century, linking ports to the production sites of primary commodities – mainly mining – in the hinterland for export. Until the mid-1990s, railways in Africa were mainly run as State monopolies, characterized by cumbersome and bureaucratic administrations. The lack of investment, poor management and maintenance of the railways structure, together with the generally obsolete and inefficient rolling stock and rundown equipment, did not allow the railways to compete adequately with other modes of transport, mainly roads, which had attracted most of the focus of development efforts and private-sector participation in the past two decades. It has been estimated that long-term maintenance neglect has caused a massive investment backlog of approximately $3 billion for Africa’s railways.90
Beyond restoring and modernizing railways, the additional challenge lies in connecting existing networks and building new lines in order to enhance the connectivity of the African railway networks and develop regional trade. This was underpinned by the Twelfth Session of the African Union Summit in February 2009, which endorsed the Programme for
Infrastructure Development in Africa (PIDA).91 The Programme defined a multisectoral set of infrastructure development plans and identified priority projects, including the interconnecting Africa railways networks as listed in box 4.2.
The private sector remains an essential player in mobilizing the significant investments required to develop, operate and maintain well-performing and reliable railway systems.
The participation of the private sector in railway operations in Africa has taken different forms of PPPs:
• Hybrid rail concession contracts/“affermage” scheme – a type of lease widely used in France, for example, Sitarail in Côte d’Ivoire and Burkina Faso – the first concession that took place in Africa in 1996;
• Full-blown concession contracts, for example, Tanzania Rail Corporation, Railway Systems of Zambia and Camrail in Cameroon;
• Management contracts such as the one with Société Nationale des Chemins de Fer du Congo (Democratic Republic of the Congo).
Today more than 70 per cent of rail activities are in the hands of private operators. An overview of cases in which the private sector was involved in PPP railways in Africa is set out in box 4.2. By 2010, there were 14 concessions in the sub-Saharan African railway systems (arrangements for 3 of the 14 networks were cancelled and subsequently revived with different operators, including Senegal/Mali and Gabon, and Kenya/Uganda). Côte d’Ivoire and Malawi were affected by conflict and years of cyclone damage, respectively. Another four were at varying stages of progress. 92
Generally, PPP railway concessions in Africa have shown mixed results. On the one hand, railway concessions did provide positive impacts, particularly with respect to increased labour and asset productivity and traffic volumes. Further, they resulted in better freight services and safety conditions, and reduced the financial strain and debt burden on governments. For example, Sitarail (Côte d’Ivoire/Burkina Faso) and Camrail (Cameroon) have both witnessed increases in labour productivity of over 50 per cent and in freight traffic of around 40 per cent following their concessioning.93
CHapteR 4: poRt anD MULtiMoDaL tRanspoRt DeveLopMents 103
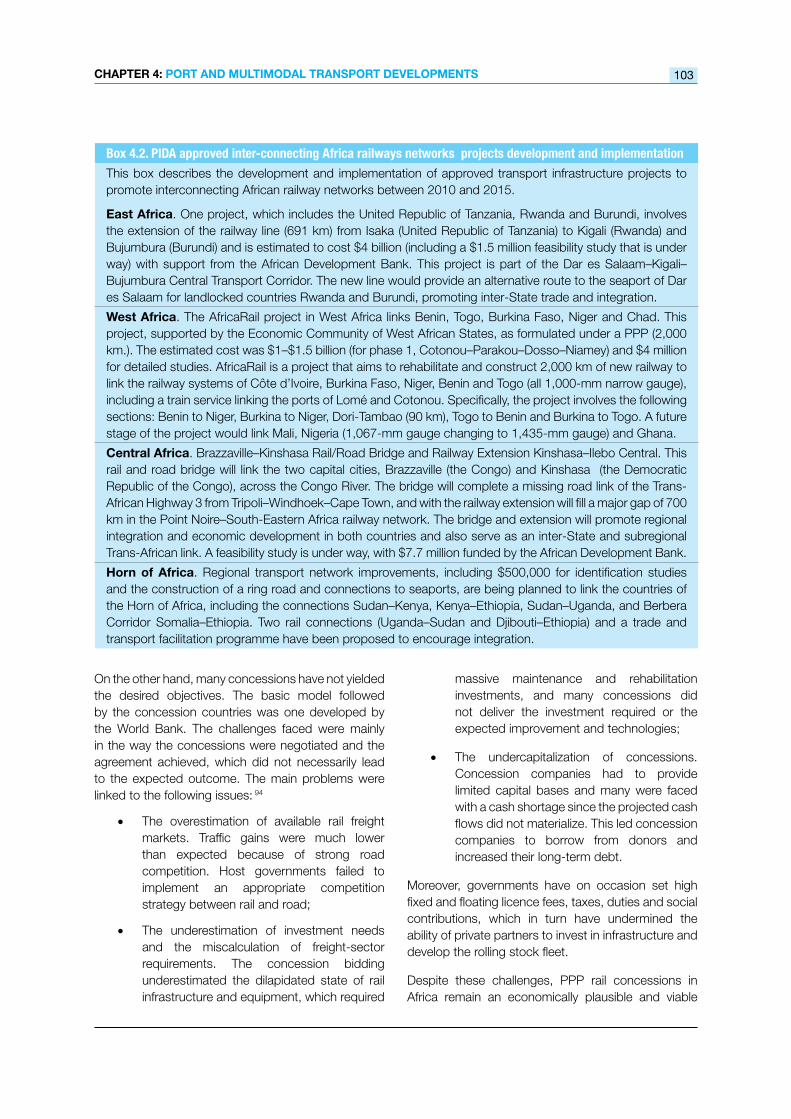
Box 4.2. PIDA approved inter-connecting Africa railways networks projects development and implementationThis box describes the development and implementation of approved transport infrastructure projects to promote interconnecting African railway networks between 2010 and 2015.
east africa. One project, which includes the United Republic of Tanzania, Rwanda and Burundi, involves the extension of the railway line (691 km) from Isaka (United Republic of Tanzania) to Kigali (Rwanda) and Bujumbura (Burundi) and is estimated to cost $4 billion (including a $1.5 million feasibility study that is under way) with support from the African Development Bank. This project is part of the Dar es Salaam–Kigali–Bujumbura Central Transport Corridor. The new line would provide an alternative route to the seaport of Dar es Salaam for landlocked countries Rwanda and Burundi, promoting inter‐State trade and integration.
west africa. The AfricaRail project in West Africa links Benin, Togo, Burkina Faso, Niger and Chad. This project, supported by the Economic Community of West African States, as formulated under a PPP (2,000 km.). The estimated cost was $1–$1.5 billion (for phase 1, Cotonou–Parakou–Dosso–Niamey) and $4 million for detailed studies. AfricaRail is a project that aims to rehabilitate and construct 2,000 km of new railway to link the railway systems of Côte d’Ivoire, Burkina Faso, Niger, Benin and Togo (all 1,000-mm narrow gauge), including a train service linking the ports of Lomé and Cotonou. Specifically, the project involves the following sections: Benin to Niger, Burkina to Niger, Dori‐Tambao (90 km), Togo to Benin and Burkina to Togo. A future stage of the project would link Mali, Nigeria (1,067-mm gauge changing to 1,435-mm gauge) and Ghana.
Central africa. Brazzaville–Kinshasa Rail/Road Bridge and Railway Extension Kinshasa–Ilebo Central. This rail and road bridge will link the two capital cities, Brazzaville (the Congo) and Kinshasa (the Democratic Republic of the Congo), across the Congo River. The bridge will complete a missing road link of the Trans‐African Highway 3 from Tripoli–Windhoek–Cape Town, and with the railway extension will fill a major gap of 700 km in the Point Noire–South‐Eastern Africa railway network. The bridge and extension will promote regional integration and economic development in both countries and also serve as an inter‐State and subregional Trans‐African link. A feasibility study is under way, with $7.7 million funded by the African Development Bank.
Horn of africa. Regional transport network improvements, including $500,000 for identification studies and the construction of a ring road and connections to seaports, are being planned to link the countries of the Horn of Africa, including the connections Sudan–Kenya, Kenya–Ethiopia, Sudan–Uganda, and Berbera Corridor Somalia–Ethiopia. Two rail connections (Uganda–Sudan and Djibouti–Ethiopia) and a trade and transport facilitation programme have been proposed to encourage integration.
On the other hand, many concessions have not yielded the desired objectives. The basic model followed by the concession countries was one developed by the World Bank. The challenges faced were mainly in the way the concessions were negotiated and the agreement achieved, which did not necessarily lead to the expected outcome. The main problems were linked to the following issues: 94
• The overestimation of available rail freight markets. Traffic gains were much lower than expected because of strong road competition. Host governments failed to implement an appropriate competition strategy between rail and road;
• The underestimation of investment needs and the miscalculation of freight-sector requirements. The concession bidding underestimated the dilapidated state of rail infrastructure and equipment, which required
massive maintenance and rehabilitation investments, and many concessions did not deliver the investment required or the expected improvement and technologies;
• The undercapitalization of concessions. Concession companies had to provide limited capital bases and many were faced with a cash shortage since the projected cash flows did not materialize. This led concession companies to borrow from donors and increased their long-term debt.
Moreover, governments have on occasion set high fixed and floating licence fees, taxes, duties and social contributions, which in turn have undermined the ability of private partners to invest in infrastructure and develop the rolling stock fleet.
Despite these challenges, PPP rail concessions in Africa remain an economically plausible and viable

Review of MaRitiMe tRanspoRt 2011104
Source: Private Participation in Infrastructure (PPI) Project Database (available from http://ppi.worldbank.org), Richard Bullock 2010, and Pozzo di Borgo 2010.
Country PPP type Company PPP subtype Segment Financial closure
year
Algeria Management and lease contract
Management contract
Fixed assets and passenger
2007
Burkina Faso/Côte d’Ivoire Concession Sitarail Rehabilitate, lease or rent, and transfer
Fixed assets and freight
1995/ 1996
Cameroon Concession Camrail Rehabilitate, operate and transfer
Fixed assets, freight and passenger
1999
Democratic Republic of the Congo
Management and lease contract
Sizarail (from 1995–1997) and SNCC (Société Nationale des Chemins de Fer du Congo) as of 2011
Management contract
Freight 1995
Gabon Concession Rehabilitate, operate and transfer
Fixed assets 2005
Gabon Concession Transgabonais - change in conces-sion
Rehabilitate, operate and transfer
Freight and pas-senger
1999
Kenya/Uganda Concession RVRC (Rift Valley Rail Corporation) – change in concession
Rehabilitate, operate and transfer
Fixed assets, freight and passenger
2006
Madagascar Concession Madarail Rehabilitate, operate and transfer
Fixed assets, freight and passenger
2003
Malawi Concession CEAR (Central East African railways Corporation) – severely affected for some years by cyclone damage
Management contract
Fixed assets, freight and passenger
1999/ 2000
Mali/Senegal Concession Transrail – change in concession Rehabilitate, operate and transfer
Fixed assets, freight and passenger
2003
Mozambique Concession CCFB (Companhia dos Caminhos de Ferro da Beira)
Rehabilitate, lease or rent and transfer
Fixed assets, freight and passenger
2004/ 2005
Mozambique Concession CDN (Corredor de Desenvolvimento do Norte)
Rehabilitate, lease or rent and transfer
Freight and pas-senger
2004/ 2005
Mozambique Concession Maputo Corridor Rehabilitate, operate and transfer
Freight 2002
Togo Management and lease contract
Canac/WACEM (1995–2002) Management contract
Fixed assets, freight and passenger
1996
United Republic of Tanzania Concession TRL /Tanzania Railways (cancelled in 11/2010)
Rehabilitate, operate and transfer
Fixed assets, freight and passenger
2007
United Republic of Tanzania Greenfield project Build, operate and transfer
Fixed assets 1998
Zambia Concession RSZ (Railway Systems of Zambia) Rehabilitate, operate and transfer
Fixed assets, freight and passenger
2003
Zimbabwe Greenfield project BBR (Beitbridge Bulawayo Railway) Build, operate and transfer
Fixed assets and freight
1998
Planned railways Concessions
Congo CFCO (Congo - Ocean Railway) 2012
Nigeria NRC (Nigerian Railway Corporation) 2012
Box 4.3. Private-sector participation in African railways

CHapteR 4: poRt anD MULtiMoDaL tRanspoRt DeveLopMents 105
solution to promote private participation in the rail sector; lessons can be drawn from the long history of rail concessioning in Africa and thus help optimize PPPs. It has been noted, for instance, that African rail markets such as those in sub-Saharan Africa, are sometimes too small in terms of traffic volumes to ensure a profitable concession and sustainable rail business to cover the financing of both rail track infrastructure and rolling stock. In this respect, the government should play a crucial role in shouldering some of the costs such as investment in infrastructure and rail rehabilitation to ensure positive public and private economic returns on investments, while ensuring a framework for fair rail/road competition and putting in place an enabling environment for sustained partnerships For example, governments should be ready whenever necessary to surrender higher concession fees for more investment.
Today, second-generation contract concessions are making their appearance in Africa with a more prominent role for the government. This is illustrated by new concession agreements concluded by Camrail (Cameroon) and Madarail (Madagascar), where the scope of the partnership and share of the investments are redefined in a more balanced manner. In this type of concessions, private operators have taken the responsibility for financing rolling stock maintenance and renewal, and governments have agreed to finance infrastructure track renewal, partially securitized by an infrastructure renewal fee paid by the concessionaire. In such a case, private operators bear the cost of track maintenance.
endnotes1 See annex VI. The underlying data are provided by Containerisation International Online, www.ci-online.co.uk . The
UNCTAD LSCI is also included in the World Bank database of World Development Indicators 2010, http://data.worldbank.org/indicator/IS.SHP.GCNW.XQ . It can be found on the UNCTAD website under http://unctadstat.unctad.org/TableViewer/tableView.aspx?ReportId=92 . The Index is generated as follows: For each of the five components, a country’s value is divided by the maximum value of that component in 2004, and the average of the five components is calculated for each country. This average is then divided by the maximum average for 2004 and multiplied by 100. In this way, the index generates the value for the country with the highest average index of the five components in 2004.
2 For recent empirical studies with comprehensive literature overviews, see Wilmsmeier G (2011), Explaining Maritime Transport Costs, Ashgate Publishing, Farnham, Surrey; Kumar S and Hoffmann J (2010), Globalization – the maritime nexus, in: Grammenos C, ed., The Handbook of Maritime Economics and Business, Second Edition, Informa Law, London; and Korinek J (2009), Determinants of Maritime Transport Costs, TAD/TC/WP(2009)4, OECD, Paris.
3 Duval Y and Utoktham C (2011). Trade Facilitation in Asia and the Pacific: Which Policies and Measures Affect Trade Costs the Most? Asia-Pacific Research and Training Network on Trade Working Paper Series, No. 94, January 2011, Bangkok. Available from www.unescap.org/tid/artnet/pub/wp9411.pdf.
4 Bloomberg (2011). Exports Brazil: Brazil port stocks quadruple on record shipping: Freight markets, 13 April.5 Corn exports tripled and leather increased by 45 per cent; see Fairplay (2011), Brazil ports unveil rises, 13 January.6 Dredging Today (2010). Latin America’s countries invest in port development, 27 August.7 Brazil’s 17 leading ports generated 850 cancellations in 2010 and an increase of 86 per cent from the previous year’s
figure of 457; see Dredging Today (2011), Brazil’s ports face lack of investment in infrastructure, 3 May.8 See the UNCTAD Review of Maritime Transport 2010 for more details on Brazil’s port development programme.9 Business News Americas (2011). Brazil: Wilson, Sons launches USD 1.8 billion ports investment plan, 17 May.10 Fairplay (2011). Vale to spend $2.9bn expanding port, 25 May.11 Port Strategy (2011). Valparaiso tender dead in the water. May.12 Business News Americas (2011). Colombia’s Transport Ministry plans $56 billion investment up to 2021, 6 May.

Review of MaRitiMe tRanspoRt 2011106
13 BusinessNews Americas (2011). Uruguay’s government aims to declare $3.5 bn deepwater port of public interest, 12 January.
14 Moveforward (2011). Two mega ports to be built to cope with Panama Canal expansion, 31 March.15 Business News Americas (2007). Mici, PSA ink agreement for Rodman port development, 17 October.16 Dominican Today (2007). Caucedo Port lowers Dominican freight costs, executive says, 3 August.17 TradeArabia (2011). DP World launches second phase of Caucedo port, 20 March.18 Port Technology (2011). Port of Kingston prepares for Panama Canal expansion, 21 March.19 Cargo Systems (2011). APM terminals wins Costa Rica concession, 1 March.20 Cocatram (2010). Central American Ports Handbook 2010–2011. Land & Marine Publications Ltd.:41 Essex,
United Kingdom.21 South East Shipping News (2010). Operarán Puerto La Unión mientras reparan Acajutla, 30 June.22 Cargonews Asia (2011). APM gets nod to bid for India terminal project, 13 May.23 Drewry (2010). Annual Review of Global Container Terminal Operators. August. Drewry Shipping Consultants Limited.
London. Available from http://www.drewry.co.uk/publications/view_publication.php?id=356.24 Economics NewsPaper (2011). Privatization: Greece plans sale of shares in Ports, 23 May.25 Dredging Today (2011). Croatia: ICTSI inks port of Rijeka deal, 8 March.26 Marine-Cafe.com (2011). Baltic record for Rickmers boxship, 18 May.27 Reuters (2011). APM terminals buys Georgia port from RAKIA-official. 4 April.28 Bolloré Africa Logistics (2011). Bolloré Africa Logistics wins container terminal management contract at Conakry,
29 March.29 Port Technology International (2011). New Guinean port construction as part of Rio Tinto mining agreement,
26 April.30 Reuters (2011). Bollore confirms $640 mln Lomé port expansion plan, 7 March.31 Transport Weekly (2011). Cameroon plan for ultramodern deep seaport moves ahead, 12 January.32 Cargo Systems (2011). Second Mombasa box terminal imminent, 10 May.33 Dredging Today (2011). Kenya: Mombasa port expansion unlikely before 2013, 10 May.34 Ftwonline.co.za (2011). Maputo port expansion plans on track, 7 March. 35 Reuters (2011). Mozambique’s CDN to invest $200 mln in port upgrade, 2 March.36 Cargo Systems (2011). New 6 million TEU terminal for Durban, 17 March.37 Transnet Limited (2011). Milestone for Cape Town container terminal expansion, 6 May.38 For example, DP World (United Arab Emirates), COSCO Pacific (China), Evergreen (Taiwan Province of China), HPH
(Hong Kong, China), ICTSI (Philippines) and PSA (Singapore). 39 Malaysia’s Port Klang is often cited in the news for breaking productivity records in container handling.40 Dredging Today (2011). New Kuwait port to cut Iraq’s main port traffic by 60 per cent, 16 May.41 Oman Daily Observer (2011). Port expansion projects to boost Oman’s industrial and shipping capability, 10 March.42 Dredging News Online (2010). Ports expansion key to Qatar $100 billion economic investment, 4 March.43 Containershipping.com (2011). DP World opens terminal 2 in Port Qasim, 12 January.44 Press Trust of India (2011). Dhamra Port to go operational in April, says its CEO, 13 March.45 Ship-technology.com (2011). Vallarpadam Container Terminal to open. 9 February. Available from http://www.ship-
technology.com/news/news109567.html.46 IFW (2011). Indian ports reach a milestone. 8 February. Available from http://www.cargosystems.net/freightpubs/
ifw/analysis/indian-ports-reach-a-milestone/20017847105.htm;jsessionid=F6B8ADB37D807DE0DBA398FFFFABDBCD.cb1a6af26f4f089d0d4cce62279dcbca5a310b19.
47 In Indonesia, a new law came into force in 2011 limiting port operators Pelindo I, II, III and IV acting as port regulators.See Port & Shipping News (2011), Indonesia: New regulation throws open ports to private competition, 4 May.
48 Dredging Today (2011). Viet Nam: CMA CGM arrives at newly opened Cai Mep International Terminal, 30 March.49 Cargonews Asia (2011). Viet Nam asks line to speed up port project, 8 May.50 Dredging Today (2011). China to invest USD 2.7 billion in Yangtze River dredging, 3 May.51 Associated Press (2011). Drought in China snags Yangtze River shipping, 8 May.52 Whenever possible, data on road and inland waterways have been provided.53 Recovery continues in global freight transport – uncertainties remain. International Transport Forum, March 2011.
Available from http://www.oecd.org/document/48/0,3746,en_2649_35131810_47354672_1_1_1_1,00.html.
CHapteR 4: poRt anD MULtiMoDaL tRanspoRt DeveLopMents 107
54 Rail Freight: Global Industry Guide. Datamonitor. January 2011. Available from http://www.datamonitor.com/store/Product/rail_freight_global_industry_guide_2010?productid=4AAF392A-F290-443B-9C1E-FDE5878CA897.
55 See International Transport Forum, Statistics Brief, May 2011, available from http://www.internationaltransportforum.org/statistics/StatBrief/2011-05.pdf; Rail freight: global industry guide, Datamonitor, January 2011.
56 See Great Expectations 2011, a publication by the Association of American Railroads, available from http://www.aar.org/AAR/GreatExpectations.aspx.
57 According to data compiled by the Association of American Railroads in May 2011, http://www.aar.org/AAR/NewsAndEvents/Freight-Rail-Traffic/2011/05/26-railtraffic.aspx.
58 Data extracted from the statistics centre of China Ministry of Railways, http://www.china-mor.gov.cn/.59 The Community of European Railway and Infrastructure Companies, March 2011, http://www.cer.be/index.
php?option=com_content&view=article&id=2124:rail-freight-grows-by-more-than-5-in-2010-in-further-sign-of-recovery-in-rail-markets&catid=918.
60 In 2009 alone, more than 12 billion rubles ($425 million) were spent on developing rail infrastructure in the Far East regions, compared with some 13 billion rubles ($461 million) in 2010. The project is being carried out on the basis of a PPP, and is directly linked to the creation of an ore mining and smelting cluster in the Amur area. Under the project, the parties plan to deliver around 20 million tons of iron ore and other commodities to China annually by 2020. A potential area for expanding cooperation is container freight from north-western Chinese provinces with no direct access to the coast via Russian Far East ports, for subsequent delivery to south China, Japan, the Republic of Korea and other countries. Sources: Russian Railways, http://eng.rzd.ru/isvp/public/rzdeng?STRUCTURE_ID=4092&layer_id=4839&refererPageId=704&refererLayerId=4537&id=105604 and http://www.ftnnews.com/other-news/10929-rail-freight-traffic-with-china-could-double-in-coming-decade.html.
61 Ibid.62 Association of American Railroads estimate.63 MRS Logística S.A. is a freight rail company located in Brazil that operates 1,643 km of track. It is the concessionary
company that operates the South-eastern Federal Railroad Network. The operation started in 1996, combining the lines Rio de Janeiro–São Paulo, Rio de Janeiro–Belo Horizonte, São Paulo–Santos and Ferrovia do Aço. These lines are in the richest and most populous area of Brazil (54 per cent of Brazil’s GDP), and MRS Logistica has a connection to three of Brazil’s leading seaports, Rio de Janeiro, Itaguaí and Santos. The company also has a connection to the privately owned iron ore terminal of MBR in Ilha de Guaíba on Angra dos Reis Bay.
64 See http://www.researchandmarkets.com/reportinfo.asp?report_id=1215443&tracker=related.65 Road Freight in North America. Datamonitor, March 2011. 66 International Transport Forum. Statistics Brief, May 2011. Available from http://www.internationaltransportforum.org/
statistics/StatBrief/2011-05.pdf.67 Data extracted from the International Transport Forum, Statistics Brief, May 2011, and from Road freight in Europe,
Road freight in Western Europe, and Road freight in Eastern Europe, Datamonitor, March 2011.68 See http://epp.eurostat.ec.europa.eu/statistics_explained/index.php/Freight_transport_statistics.69 See http://ec.europa.eu/transport/inland/index_en.htm.70 See http://www.envisionfreight.com/modes/default.aspx?id=waterway#fn1.71 See http://ec.europa.eu/transport/inland/index_en.htm and http://www.naiades.info/.72 UNESCAP, available from http://www.unescap.org/ttdw/Publications/TPTS_pubs/pub_2307/pub_2307_ch11.pdf,
and Hindustan Chamber Review: 44(9), February 2011.73 See http://news.xinhuanet.com/english2010/china/2011-01/30/c_13713969.htm.74 Rupayun, a private company, has received approval to set up another river terminal in Narayanganj and the government
will set up more terminals – one in Khanpur under a PPP – and AK Khan Group and Kumudini Trust have already submitted proposals to set up two other terminals in the Narayanganj area. Sources: http://proquest.umi.com/pqdweb?did=2252346091&sid=1&Fmt=3&clientId=23038&RQT=309&VName=PQD and http://www.thefinancialexpress-bd.com/more.php?date=2011-03-06&news_id=128152n.
75 African Development Report 2010: Ports, Logistics and Trade in Africa. African Development Bank and Oxford University Press: 2011. Oxford.
76 Reaching over 45 per cent in many countries, such as Malawi (56 per cent), Chad (52 per cent) and Rwanda (4 per cent).
77 From the presentation, “Public Private Partnerships in Infrastructure in India”, delivered by Dr. Arvind Mayaram, Additional Secretary, Ministry of Rural Development, Government of India, at the UNCTAD Multi-year expert meeting on investment, February 2011.
78 This and the following section draw from the Private Participation in Infrastructure Projects Database (joint product of the World Bank’s Infrastructure Economics and Finance Department and the Public-Private Infrastructure Advisory Facility – PPIAF, a multi-donor technical assistance facility). The database divides transport infrastructure projects into

Review of MaRitiMe tRanspoRt 2011108
four sectors: (a) airports (runways and terminals), (b) railways (including fixed assets, freight, intercity passenger and local passenger), (c) roads (toll roads, bridges, highways and tunnels) and (d) ports (port infrastructure, superstructures, terminals and channels). See www.ppiaf.org.
79 Asian Development Bank. Annual Report 2010, volume 1.80 The CAREC corridors link Central Asia’s key economic hubs and connect the region to other Eurasian markets. The
line is under construction by Uzbek Railway through a design-and-build contract. It will save transport costs and freight time for commodities (such as fuel) and general cargo.
81 Bilateral members of ICA include the G-8 countries – Canada, France, Germany, Italy, Japan, the Russian Federation, the United States and the United Kingdom, and multilateral institutions such as the African Development Bank Group, the European Commission, the European Investment Bank, the Development Bank of Southern Africa and the World Bank Group. The ICA secretariat is located at the African Development Bank.
82 ICA Annual Report 2009.83 See http://www.icafrica.org/en/infrastructure-issues/transport/.84 Rail Freight: Global Industry Guide, Datamonitor. January 2011. Available from http://marketpublishers.com/report/
services/transport_logistics/rail_freight_global_industry_guide.html.85 Pierre Pozzo di Borgo, 2011. Available from http://www.afd.fr/jahia/webdav/site/proparco/shared/PORTAILS/
Secteur_prive_developpement/PDF/SPD%209/Proparco%20SPD_9_UK_A-balance-between-public-and-private-sector-roles-the-key-to-a-succesful-rail-concession.pdf.
86 European Commission White Paper 2011. Available from http://ec.europa.eu/transport/strategies/2011_white_paper_en.htm.
87 Private Participation in Infrastructure: Trends in Developing Countries in 1990–2001. Available from http://ppi.worldbank.org/book/Chapter11.pdf.
88 Ibid.89 This section draws mainly from: Africa’s Infrastructure: A Time for Transformation, http://www.infrastructureafrica.org/
system/files/WB147_AIATT_CH11.pdf, Assessing Regional Integration in Africa IV: Enhancing Intra-African Trade by the Economic Commission for Africa – http://www.uneca.org/aria4/chap9.pdf, and Africa Review Report on Transport, United Nations Economic and Social Council, Economic Commission for Africa, Sixth Session of the Committee on Food Security and Sustainable Development (CFSSD-6) ECA/FSSD/CFSSD/6/12, Ethiopia, August 2009.
90 See http://www.icafrica.org/en/infrastructure-issues/transport/railways/.91 The Programme is designed to be a successor to the Medium- to Long-Term Strategic Framework of the New
Partnership for Africa’s Development (NEPAD), to develop a vision and strategic framework for the development of regional and continental infrastructures (energy, transport, information and communication technologies, and transboundary water resources). The PIDA initiative is being led by the African Union Commission, the NEPAD Secretariat and the African Development Bank, which serves as the executing agency.
92 Richard Bullock. African railway concessions, a step forward but not the whole answer. Proparco’s Magazine. Issue No. 9. March 2011.
93 Ibid.94 “Africa railway concessions: Lessons learned and potential solutions for a revival of the sector”, presentation by Pierre
Pozzo di Borgo, the World Bank, March 2011.