information asymmetry in corporate bond trading, … asymmetry in corporate bond trading, ... one...
TRANSCRIPT

Information Asymmetry in Corporate Bond Trading, Credit Risk, and Yield Spread
Song Han Division of Research & Statistics
Federal Reserve Board
Xing Zhou Department of Finance & Economics
Rutgers Business School Rutgers University
ABSTRACT Taking advantage of recently augmented corporate bond transaction data, we examine the pricing
implications of informed trading in corporate bonds, as well as its ability in predicting corporate defaults.
We find that microstructure measures of information asymmetry seem to capture adverse selection in
corporate bond trading reasonably well. We demonstrate that information asymmetry in bond trading has
explanatory power for corporate bond yield spreads, and this result holds after controlling for the
transaction costs of liquidity, credit risk and other traditional bond pricing factors. Further, information
asymmetry can help forecast corporate defaults after conditioning on other default prediction variables.
Such forecasting ability of bond informed trading is especially useful for private firms as the bond market
constitutes the only venue for informed traders to exploit their information advantages.
Keywords: Corporate Bond Yield Spread, Information Asymmetry, Information Risk Premium JEL Classifications: G12, G14
For their helpful comments and discussions, we thank Hazem Daouk, David Easley, Yongmiao Hong, Robert Jarrow, Francis Longstaff, David Ng, Maureen O’Hara, David Weinbaum, Xiaoyan Zhang, and seminar participants at Cornerstone Research, Cornell University, Rutgers University, San Francisco State University, University of South Carolina, University of Toronto, and the American Economic Association Annual Meetings. The views expressed herein are completely our own and do not necessarily reflect the views of the Federal Reserve Board or its staff.

0
Information Asymmetry in Corporate Bond Trading, Credit Risk, and Yield Spreads
ABSTRACT
Taking advantage of recently augmented corporate bond transaction data, we examine the pricing
implications of informed trading in corporate bonds, as well as its ability in predicting corporate defaults.
We find that microstructure measures of information asymmetry seem to capture adverse selection in
corporate bond trading reasonably well. We demonstrate that information asymmetry in bond trading has
explanatory power for corporate bond yield spreads, and this result holds after controlling for the
transaction costs of liquidity, credit risk and other traditional bond pricing factors. Further, information
asymmetry can help forecast corporate defaults after conditioning on other default prediction variables.
Such forecasting ability of bond informed trading is especially useful for private firms as the bond market
constitutes the only venue for informed traders to exploit their information advantages.

1
I. Introduction
One salient feature of the U.S. corporate bond market is the predominance of institutional
trading.1 Recent work suggests that trading by sophisticated institutions tends to be information based.2
According to market microstructure theory, the presence of such informed trading can affect bond prices.
As uninformed traders face the risks of losing to informed ones, given a bond’s contractual cash flow,
lower prices, or equivalently, higher yields are required to hold bonds with more informed trading. Based
on this rationale, we examine the degree of information asymmetry in corporate bond trading and its
effect on corporate yield spreads. We also examine whether information asymmetry in bond trading can
help predict corporate defaults. If trading activities by informed bond investors carry important
information on the issuer’s credit conditions, they should be useful for forecasting defaults.
The possibility of informed trading in the corporate bond market may stem from its institutional
nature. First of all, institutional investors differ significantly in their sophistication levels. Some
institutions are better able to interpret the value relevance public information than others (see for example
Kandel and Pearson (1995)). Secondly, information advantages of some institutions can also arise due to
their privileged access to information. For example, most institutional investors who trade corporate
bonds, such as hedge funds and mutual funds, often participate in syndicated loans for the same issuer. As
large creditors are entitled to send representatives to regular meetings with the borrowing company’s
management, they have access to confidential information, such as updated growth projections, covenant
negotiations, and merger/acquisition or divestiture plans.3 Moreover, a single trader at a hedge fund often
deals in all of a company's debt instruments. In a situation of this nature, precluding improper use of
private information and maintaining confidentiality are a challenge.4
In fact, both anecdotal evidence and empirical studies indicate that informed trading takes place
in the corporate bond market. Following insider trading and price manipulation scandals in corporate
1 Institutional investors account for the majority of the ownership and most of the trading volume of corporate bonds. According to the Flow of Funds Accounts of the United States, outstanding corporate bonds issued by U.S. firms totaled about $7 trillion at the end of 2009, the bulk of which were owned by institutional investors. Edwards, Harris, and Piwowar (2007) report that institutional sized trades (those greater than $100,000 in par value), account for most of the dollar volume of corporate bonds. 2 See, for example, Ke and Petroni (2004), Bushee and Goodman (2007), Barber, Lee, Liu and Odean (2009), Ivashina and Sun (2010), and Boulatov, Hendershott, and Livdan (2010) for evidence on institutional trading in the equity markets. 3 Ivashina and Sun (2010) provide some evidence that institutional investors trade stocks based on private information acquired from the loan market. There has also been anecdotal evidence of such channel of information leakage. For example, Movie Gallery's stock dropped by 25 percent over the two days following a private conference call with lenders, most of whom are hedge funds, despite the fact that the firm did not release any news to the public. See, “As Lenders, Hedge Funds Draw Insider Scrutiny,” New York Times, October 16, 2006. 4 “You can't put a Chinese wall through someone's head," commented by Michael Kaplan at Davis Polk & Wardwell LLP. For further discussions of potential insider trading in the bond market, see “The New Insider Trading?” Investment Dealers’ Digest, October 31, 2005.

2
bonds in the late 1980s,5 the opaqueness of this market has become a major concern for regulators. Datta
and Iskandar-Datta (1996) argue that in the absence of any reporting requirements for insider bond
transactions, insiders have an enhanced opportunity to exploit private information and take advantage of
uninformed traders. Consistent with this view, former SEC chairman Arthur Levitt stated in 1998 that the
SEC had “found anecdotal evidence of the possible misuse of inside information in the high-yield (debt)
market.”6 Recently, there have also been a few high profile cases, such as Delphi and Six Flags debt
restructurings, with alleged insider trading in corporate bonds.7 Further, several recent empirical studies
have explored potential informed trading in corporate bonds. For example, Kedia and Zhou (2009)
provide evidence consistent with the occurrence of informed bond trading prior to corporate takeover
announcements. Massa and Manconi (2009) show that balanced mutual funds tend to invest in bonds
issued by firms in which they already hold an equity stake to reduce the cost of information collection.
Market microstructure theory suggests that information asymmetry affects asset prices. Easley
and O’Hara (2004) show that during the process of incorporating new information into prices, the
informational advantage of informed traders creates additional risks for uninformed ones. Uninformed
traders have different beliefs than informed ones regarding an asset’s risk and price profiles, and always
end up with portfolios that invest too much in bad assets and too little in good ones. Further, in a world
with asymmetric information, the uninformed are unable to diversify this risk of losing to the informed.
Therefore, in a non-revealing equilibrium, lower price is required in order for investors to hold securities
about which they are uninformed. Several empirical studies have examined this theoretical prediction by
testing whether more informed trading leads to lower prices, and hence higher returns, using equity
market data. For example, Easley, Hvidkjaer and O’Hara (2002) show that, all else being equal, stocks
with relatively more private information earn a higher excess return. Easley, Hvidkjaer, and O’Hara (2010)
find that zero-investment portfolios formed by sorting on information measures earn significant excess
returns which cannot be explained by the Fama-French or momentum factors. Using an alternative
information measure, Burlacu et. al. (2008) also conclude that stock prices embed an information risk
premium. However, Duarte and Young (2009) find that liquidity, rather than information asymmetry, is
priced in the cross-section of stock returns.
5 In a well-known case in 1989, James Dahl, an employee of Michael Milken’s junk bond department, swore before a grand jury that Milken advised him to buy up Caesar’s World’s bonds from its own customers on the day when Milken made a presentation to Caesar’s World on how to handle its finance. 6 See “The Importance of Transparency in America’s Debt Market,” a speech delivered by Authur Levitt at the Media Studies Center in New York on September 9, 1998. 7 In 2008, Delphi Corporation accused investors of insider trading, alleging that at least one of its seventeen institutional investors shorted its bonds after receiving confidential information on the firm’s bankruptcy exit financing. See Jeffrey McCracken (2008), “Delphi Recovery Hits Snag -- Bankruptcy-Court Exit Sidetracked by Disputes with Investor Groups,” the Wall Street Journal (WSJ) 03/13/2008. In 2009, a hedge fund allegedly dumped the low-rated bonds of Six Flags Incorporation after obtaining information in the process of negotiating the firm’s reorganization plan. See Mike Spector and Tom McGinty (2010), “Bankruptcy Court Is Latest Battleground for Traders,” WSJ 09/07/2010.

3
In this paper, we explore the relevance of information asymmetry for corporate bonds by
examining the pricing implications of informed bond trading and its power in predicting corporate
defaults. First, given the coupon rate and principal amount, the value of a corporate bond is largely
determined by the term structure of interest rates and the risk of default. When some investors have
superior information on a firm’s cash-flow prospects, they can better assess the credit risks of its bonds.
The existence of such information asymmetry creates additional risks for uninformed investors, since
informed traders always gain on what the uninformed lose. Therefore, all else being equal, bonds with a
higher degree of information asymmetry should have lower prices, or equivalently, higher yields in
equilibrium to compensate bond investors for taking such information risk. Second, corporate bonds are
very sensitive to downside risks. When the issuer’s financial condition deteriorates, credit risk related
information become especially valuable, since such information can potentially generate significant
returns for informed traders before the issuer default on its debt obligations. Therefore, we expect
informed trading to increase when the issuer gets close to default. Information conveyed by informed
trading prior to corporate default can thus be used to enhance the predictive power of traditional default
forecasting models.
To this end, we utilize an augmented TRACE data to estimate two alternative measures of
information asymmetry in bond trading, measures based on Madhavan, Richardson, and Roomans (1997)
and Glosten and Harris (1988) (hereafter MRR and GH, respectively). The augmented TRACE data
include transaction data used in previous studies, such as the execution date and time, price, and quantity
for each trade, as well as additional information on the trading direction, an indicator for the side of a
trade that the reporting party (a dealer) takes.8 In the absence of quality dealer quote data, knowing the
direction of the trades allows us to estimate information-based microstructure measures, a task that was
not feasible before.
Our key findings are the following: First, microstructure measures of information asymmetry,
even though originally developed for the equity market, seem to capture adverse selection in corporate
bond trading reasonably well. In particular, both of our measures show that information asymmetry is
higher in larger sized trades, consistent with the notion that, due to larger transaction costs for smaller
bond trades, bond traders do not break orders to minimize price impact, in contrast to the common
practice in the equity market.
Second, we find strong evidence that information asymmetry in bond trading has significant
power in explaining corporate yield spreads even after accounting for the transaction costs of liquidity
and other bond pricing factors. Specifically, a one-basis-point increase in the MRR and the GH measures
8 The TRACE data analyzed by Edwards, Harris and Piwowar (2007) also included information on trade direction, but this information was not made available to the public until very recently.

4
of a corporate bond causes the bond’s yield spread to increase 0.37 and 0.30 basis point, respectively.9
This result is robust after controlling for the transaction cost of liquidity, alternative measures of credit
risk, firm and time fixed effects, industry effects, as well as after using an instrumental variable approach
to mitigate the potential influence of endogeneity and unobservable credit risks. We also find stronger
information effects for lower rated and shorter term bonds, and bonds issued by privately-held firms.
Finally, the degree of informed trading in bonds can help predict corporate defaults. The
predictive power of our asymmetric information measures remains significant, albeit weaker, after we
condition on other firm-specific and macroeconomic default prediction variables as used in Duffie, Saita,
and Wang (2007). Further, information asymmetry in corporate bond trading seems to be especially
useful in forecasting defaults for private firms. This is consistent with the notion that for these firms,
corporate bond market constitutes the only venue for informed traders to exploit their information
advantages.
Our main contributions to the literature are the following: First, to the best of our knowledge, this
study is the first to examine the implications of information asymmetry in bond trading for corporate
bond pricing, which sheds light on the widely documented credit spread puzzle. Both structural and
reduced-form models have had limited success in explaining the observed corporate yield spreads,10 and
empirical applications of these models find that credit risk accounts for only a part of yield spreads.11 A
recent strand of the literature has started to look beyond the traditional bond pricing framework for better
explanations of the credit spread puzzle. Odders-White and Ready (2004) show that microstructure
measures of adverse selection in equities are larger when credit ratings of the issuer’s bonds are poor.
Duffie and Lando (2001) argue that incomplete accounting information in between a firm’s periodical
financial reports may help explain the seemingly-high short-term yield spreads. Consistent with this, Yu
(2005) finds empirical evidence that firms with higher accounting transparency tend to have lower credit
spreads. Further, several studies have explored the role of liquidity in the pricing of corporate bonds.
Since illiquidity increases transaction costs and prevents investors from continuously hedging their risks,
lower prices, or equivalently higher yields, are required for holding bonds with lower liquidity. See, for
example, Longstaff, Mithal and Neis (2005), Nashikkar and Subrahmanyam (2006), Chen, Lesmond and
9 This magnitude is comparable to the liquidity effect documented in Chen, Lesmond, and Wei (2007), who find an increase of 0.21 and 0.82 basis points in the yield spread for a one-basis-point increase in their estimated liquidity cost for investment-grade and high-yield bonds, respectively. 10 For structural models, see Merton (1974); Black and Cox (1976); Geske (1977); Ingersoll (1977); Kim, Ramaswamy, and Sundaresan (1993); Leland (1994, 1998); Longstaff and Schwartz (1995); Anderson and Sundaresan (1996); Leland and Toft (1996); Mella-Barral and Perraudin (1997); Collin-Dufresne and Goldstein (2001); and Duffie and Lando (2001). For reduced-form models, see Jarrow and Turnbull (1995); Das and Tufano (1996); Duffie and Singleton (1997, 1999); Jarrow, Lando, and Turnbull (1997); Lando (1997); Madan and Unal (1998, 2000); Duffee (1999); and Elton, Gruber, Agrawal, and Mann (2001). 11 See for example Collin-Dufresne, Goldstein, and Martin (2001); and Huang and Huang (2003).

5
Wei (2007), and Bao, Pan and Wang (2009). Liquidity has also been examined as a risk factor in
determining expected bond returns (see De Jong and Driessen (2006)).12
This paper contributes to the literature on the credit spread puzzle by showing that in addition to
the transaction costs of liquidity, information asymmetry among bond traders plays an important role in
determining yield spreads. O’Hara (2003) argues that liquidity and price discovery are two main but
different functions of markets and that both of them are important for asset pricing. Liquidity refers to the
ease of matching buys and sells. When buy and sell orders follow independent stochastic processes
without being informative about future price movements, a spread can emerge between buying and selling
prices as compensation for providing liquidity. 13 Therefore, strictly speaking, liquidity is not necessarily
related to how information gets incorporated into prices, nor to the degree of information asymmetry.
This liquidity cost dimension of the bond market has been addressed in the aforementioned studies.
However, the price discovery dimension of the bond market that underlies the asymmetry
information risk has not yet been explicitly explored in the literature. By decomposing total trading cost
into a liquidity cost component and an asymmetric information component based on whether the price
impact of a trade is transitory or permanent, we highlight the role of adverse selection risks in determining
corporate yield spreads.14 Our finding suggests that in addition to compensation for liquidity costs,
corporate yield spreads may contain an information premium that has not been considered in traditional
bond pricing models. It confirms the argument by O’Hara (2003) that “asset pricing models need to be
recast in broader terms to incorporate the transaction costs of liquidity and the risks of price discovery.”
Second, our paper represents the first attempt to measure the degree of information asymmetry in
corporate bond trading. Since both stocks and bonds represent claims on the same underlying assets of a
firm, investors with superior information on the firm’s assets can potentially benefit from trading with
those relatively uninformed in either market. While a large body of literature has examined adverse
selection in the equity market and its implications for corporate decisions, firm valuations, and regulatory
policies, surprisingly little attention has been devoted to potential informed trading in the bond market.
We not only show that microstructure models on estimating information asymmetry using transaction
level data can be generalized to asset classes other than stocks, but also highlight the implications of
information asymmetry for a firm’s cost of borrowing. Our study thus complements Cai, Helwege and
12 While lower bond price implies higher yields or higher expected returns, yield spreads and expected returns are not identical. Expected returns can be measured by yield spreads corrected for default losses. See De Jong and Driessen (2006), and Campello, Chen and Zhang (2008). We thank an anonymous referee for pointing this out. 13 A strand of microstructure literature has been focused on the notion of liquidity. See, for example, Demsetz (1968), Garman (1976), Stoll (1978), Ho and Stoll (1981), Amihud and Mendelson (1986, 1991), O’Hara and Oldfield (1986), Grossman and Miller (1988), Biais (1993), and Madhavan and Smidt (1993). O’Hara (1995) provides an excellent textbook treatment of liquidity issues in microstructure theory. 14 The liquidity effect documented by previous studies might also include some of the influence from information risks that we are focusing on here. Since the liquidity measures used in these studies are broadly defined, they may capture some of impact of adverse selection under asymmetric information (see O’Hara (2003)). Analysis in Section IV.C below confirms this prediction.

6
Warga (2007) who find information asymmetry between managers and bondholders drives underpricing
in the corporate bond market.
Third, our study shed some light on the decision of public equity listing by examining the effect
of being private on funding costs. While early studies have explored the effect of information
environment on a firm’s equity or overall values, the direct effect of public status on the cost of debt has
received little attention.15 Further, limited data on private firms render it very difficult to empirically
evaluate the costs and benefits of being private.16 Because corporate bonds are publicly traded for both
public and private firms, we not only circumvent the data challenge, but also provide additional insights
into the benefits of being public. Thus, our study compliments the discussions on the motivation for being
public and the relative costs of capital in the public versus private markets.17
Finally, our study contributes to the literature on corporate default prediction. Several studies
have explored the predictive power of some firm-specific and macroeconomics variables, including the
firm’s distance to default and stock return, stock market return and risk-free interest rate (see for example,
Duffie, Saita, and Wang (2007), and Bharath and Shumway (2008)). However, little attention has been
devoted to the role played by the corporate bond market. During the price discovery process of credit risk,
some information is revealed through informed trading by bond investors. As bond investors incur
substantial losses following a default event, their trading activities can be especially informative prior to
actual defaults. Indeed, we find that microstructure measures of information asymmetry exhibit additional
power in forecasting corporate defaults after conditioning on traditional default prediction variables.
Further, since equity trade information and Compustat liability data do not exist for private held firms, it
is not feasible to estimate some of the key predictors of default, such as a firm’s distance to default
measure and stock return. Our results highlight the value of information conveyed by trading activities in
an issuer’s bonds when the firm has not publicly traded equity.
II. Measuring Information Asymmetry, Liquidity, and Yield Spreads for Corporate Bonds
A. Data and Sampling
Compared with the abundant literature on the pricing of equity securities, research on corporate
bond pricing is much sparser due in part to the lack of high-quality bond transaction data. Unlike the
stock market, the corporate bond market is an opaque dealer market where most securities are traded over
15 See, for example, Leland and Pyle (1977), Chemmanur and Fulghieri (1999), and Subrahmanyam and Titman (1999). 16 See, for example, Pagano, Panetta, and Zingales (1998); Boehmer and Ljungvist (2004); Helwege and Packer (2004); Kim and Weisbach (2008); and Bharath and Dittmar (2010). 17 See Modigliani and Miller (1963) and Scott (1976).

7
the counter (OTC).18 Until recently, information about trading activity, such as transaction price and
quantity, was not widely available to the public. Under pressure from regulatory agencies and investors,
the Financial Industry Regulatory Authority (FINRA, formerly National Association of Securities Dealers)
now requires its members to report all of their secondary corporate bond transactions through its Trade
Reporting and Compliance Engine (TRACE). FINRA has also phased in real-time reporting of this
information to the public. The initial public dissemination took place on July 1st, 2002, for a small number
of selected corporate bonds, including the bonds that were rolled over from the Fixed Income Pricing
System (FIPS).19 The dissemination expanded over time, and on February 7, 2005, it began to cover OTC
trades of all but Rule 144A corporate bonds.
The augmented TRACE data used in this study include detailed information for each trade,
including the execution date and time (recorded to the second), price, quantity, trade direction indictor, as
well as other information that can be used to purge invalid transaction reports. Trades are of three types:
customer trade in which the dealer bought from a customer, customer trade in which the dealer sold to a
customer, and interdealer trade (only sell-side reports). We use all but interdealer trades. Following the
practice of previous studies using the TRACE data, we removed observations with “data errors”—
observations with missing price or quantity values, price outside the range of 10 and 500, and price
reversals over 20 percent in adjacent trades.20 In addition, to limit estimation errors, we excluded bond-
quarters with fewer than 60 trades in the quarter. We started with a sample consisting of bonds issued by
publicly-traded firms over the period 2003-2008. Information on bond characteristics, such as offering
date and amount, maturity, historical credit ratings and coupon rate, was obtained from the Fixed Income
Securities Database (FISD). Issuer accounting information was retrieved from the COMPUSTAT Annual
Industrial Database, while trade information on issuer equity and macroeconomic data were obtained
from the Center for Research in Security Prices (CRSP) data files.21 We excluded bond-quarters when
either the time since issuance or remaining maturity was shorter than a full quarter.22 Also, except in
Section IV.C where we provide detailed analysis on bonds with credit rating changes, we use only bond-
quarters with no rating changes to better identify the effects of information asymmetry. Applying these
filters resulted in a sample of 2,514 bonds by 522 firms.
B. Microstructure Measures of Information Asymmetry
18 Some corporate bonds are also traded on the NYSE’s Automated Bond System. However, the trading volume is rather small compared with that on the OTC market. 19 For more information about FIPS, please see the NASD Notice to Members (NtM) 94-23, Alexander, Edwards, and Ferri (2000), and Hotchkiss and Ronen (2002). 20 See for example Edwards, Harris and Piwowar (2007), and Goldstein, Hotchkiss, and Sirri (2007). 21 For bonds issued by subsidiaries, we use the parent company’s accounting and equity information. 22 We excluded bonds that were newly issued or close to maturity because trading in these bonds tends to be unusual. See, for example, Goldstein and Hotchkiss (2007), and Cai, Helwege, and Warga (2007). Our results hold when using two quarters or one year as the cutoff point.

8
We use microstructure models to estimate the degree of information asymmetry. A key insight of
the market microstructure literature is that trading by investors possessing superior information of asset
values creates an adverse selection risk to market makers. In equilibrium, market makers require extra
bid-ask spreads to compensate for taking on such informational risk (see, e.g., Kyle (1985)). Importantly,
the effect of adverse selection on asset prices is permanent, as opposed to the transitory effect of the
liquidity provision costs—costs normally associated with order processing and inventory risk. A number
of studies, including MRR and GH, exploit such distinction and design models to decompose bid-ask
spreads into adverse selection or information asymmetry component and liquidity provision component.
Here we implement GH and MRR models using the augmented TRACE data.23
Specifically, the GH model consists of following assumptions:
ttttt eZQmm 1 (1a); tttt CQmP (1b);
tt VzzZ 10 (1c); tt VccC 10 (1d).
The changes in the unobserved “true” price ( tm ) can be caused by either the arrival of public information
( te ), or private information embedded in the order flow ( tt ZQ ) (Eq. (1a)), where tQ is a trade direction
indicator which is +1 if the trade is buyer initiated and -1 if the trade is seller initiated, and tZ is the
adverse selection component of the spread (Eq. (1c)). The observed price, tP , is the summation of the
unobserved “true” price and the transitory component of trading costs ( t tQ C ) (Eq. (1b)), where tC is the
liquidity cost component of the spread (Eq. (1d)). Both components are assumed to be a linear function of
the size of the order ( tV ). Equations (1a)-(1d) are then combined to obtain the following model on
observed price changes ( tP ):
0 1 0 1t t t t t t t tP z Q z QV c Q c QV e . (1)
We use the above model to estimate parameters ( 0z , 1z , 0c , 1c ) and then compute the asymmetric
information and transaction cost components as in equations (1c) and (1d).
The MRR model differs from the GH model in that MRR assume only the surprise in the order
flow has an impact on the expected fundamental value of the asset. That is, using the same notations as
above, MRR differentiate the transitory effect of liquidity provision costs from the permanent effect of
information asymmetry as follows:
1 1 ,t t t t t tm m z Q E Q Q e (2a)
23 See Van Ness, Van Ness, and Warr (2001) for a review of alternative measures of information asymmetry. Due to the lack of quality bond quote data, models which rely on quote prices cannot be estimated for corporate bonds.
9
,t t t tP m cQ (2b)
where 1ˆ
tttt QQEQQ measures the surprise in order flows which may carry private information
about the fundamental asset value. The parameter z captures the permanent impact of order flow
innovations and hence is used to measure the degree of information asymmetry, while c captures the
temporary effect of order flow on prices and therefore is used to measure the liquidity provision costs.
Similar to the GH model, the changes in transaction prices can be expressed as:
.ˆtttt EQcQzP (2)
Following MRR, we assume 1 1t t tE Q Q Q .24 Thus, 1ˆ
ttt QQQ in our estimations.
One limitation with the TRACE data is that the trade size information that is disseminated to the
public is capped for very large trades. Specifically, the caps for investment- and speculative-grade bonds
are $5 million and $1 million, respectively. Because we do not observe the actual trade sizes for these
large trades, we excluded them in implementing the GH model.25 However, we included all trades in
estimating the MRR model because this model uses only information on trade price and direction. We
estimated both the GH and MRR models for each bond-quarter pair. The estimated GH and MRR
measures are highly correlated with each other, with a correlation coefficient of 0.867. Their respective
correlation with total number of trades within the quarter is -0.029 and -0.028.
C. Estimating Corporate Bond Yield Spreads
The yield spread of a corporate bond is defined as the spread of the yield on the corporate bond
over the yield on a default-free bond with exactly the same maturity and coupon. To start, we estimated
the daily risk-free zero-coupon yield curve using the extended Nelson-Siegel model, as outlined in
Appendix 1 (see also Bliss (1997)). Then, for each corporate bond, we discounted its contractual cash
flow at the estimated risk-free yield curve to compute the price of a corresponding risk-free bond. Finally,
yield on this hypothetic risk-free bond was calculated and subtracted from that on the original corporate
bond to obtain its yield spread. We first used this procedure to estimate each bond’s daily yield spread,
and then averaged the daily yield spreads within a quarter to get the bond’s yield spread for that quarter.
III. Assessing Measures of Information Asymmetry in Corporate Bond Trading
24 If trade direction changes follow a Markov process with the probability of switching direction from buyer initiated to seller initiated, or vice versa, being the same , then =1-2 . 25 We also re-estimate the GH model by treating trades with “5MM+”/“1MM+” codes as if their trade sizes were $5,000,000/$1,000,000. The results are qualitatively the same as those reported here, as shown in Table VI and discussed in Section IV.C.

10
Since information measures, including those derived from GH and MRR models, were originally
developed for the equity market, a natural question is how well they capture the underlying information
asymmetry in corporate bond trading. Admittedly, direct assessment of the validity of these measures is
extremely difficult, even for equity trading, simply because information asymmetry is never precisely
observable. In this section, we try to address the model validation issues indirectly by formulating and
testing two hypotheses on the behavior of the asymmetric information measures. If these measures are
indeed able to capture at least some of the information asymmetry in bond trading, they should exhibit
certain patterns consistent with our expectations.
A. Information Asymmetry Measures across Credit Ratings
Our first hypothesis relates the risk of adverse selection in bond trading to the bond’s credit risk.26
According to Merton (1974), corporate debt can be valued as a portfolio comprised of similar risk-free
debt and a short position in a put option on the issuer’s assets. Therefore, any information related to the
firm’s underlying assets should affect its bond values. However, the relevance of the information for bond
traders depends on the moneyness of the option. When the put is deep out of the money (i.e., when the
underlying asset value is way above the strike price (face value of bonds)), the issuer has a low
probability of default, and thus, information on asset values is of little relevance. The relevance of the
information tends to increase for bond traders when the issuer’s credit risk rises. Thus, our hypothesis is
that the degree of informed trading in bonds should be positively related with the bond’s credit risk.
Table I provides summary statistics on the information asymmetry measures estimated using the
GH and MRR models across different credit ratings. Panel A shows that, as expected, information
asymmetry tends to be higher for lower rated bonds. The mean values of information asymmetry
estimates, using either the GH or the MRR model, increase by over 200 percent when we move from high
quality investment-grade bonds (rated AAA or AA) to high-yield bonds (rated BB and lower). Panel B
presents the results of t-test and Wilcoxon sign rank test on the differences in the mean and in the median
of the information asymmetry measures between two broad rating categories, investment-grade and high-
yield bonds. The mean (median) of the MRR information asymmetry measure is 10.89 (7.23) for high-
yield bonds, while it is only 5.55 (4.70) for investment-grade bonds. These differences are all statistically
significant at the 1 percent level. Similar results hold for the GH information asymmetry measure.
B. Information Asymmetry Measures and Trade Size
26 Several studies have examined the relationship between liquidity and bond credit risks. Ericsson and Renault (2006) argue that illiquidity and credit risk are positively correlated. He and Xiong (2011) show that deteriorating market liquidity and shorter debt maturity can lead to excessive credit risk.

11
Our second hypothesis relates information asymmetry in bond trading to trade size.
Microstructure theory suggests that informed traders prefer to make large trades to fully exploit their
information advantages (e.g., Easley and O’Hara (1987)). Therefore, prices for large trades reflect such
increased probability of informed trading. However, empirical studies in equity trading do not always
support such a prediction. For example, Huang and Stoll (1997) find that the adverse selection component
of the bid-ask spread is actually smaller for large trades than for medium and small trades. Barclay and
Warner (1993) show that informed trading in the target stocks of tender offers during pre-announcement
periods is concentrated in medium sized trades, a conclusion also reached by Chakravarty (2001). These
findings are consistent with the notion that large trades tend to be broken up and spread over time to
reduce price impact and transaction costs (Kyle (1985)).
However, such incentive to break large trades into small pieces to reduce transaction costs might
not exist for bond traders. A number of empirical studies have shown that transaction costs in corporate
bond trading are actually larger for smaller sized trades.27 Therefore, as predicted by Easley and O’Hara
(1987), adverse selection risks should be more severe in large trades of corporate bonds. If the
information asymmetry measures derived from GH and MRR models capture the degree of informed
trading, we would expect them to be positively correlated with trade size.
GH explicitly model the information asymmetry component of the bid-ask spread as a function of
trade size (see Eq. (1c)). Therefore, if larger trades are more likely to be initiated by informed traders, we
would expect to see a positive 1z . Panel A of Table II provides supporting evidence for this prediction.
The estimate of 1z is a positive 0.007 with a p-value of 0.0377 when large trades subject to TRACE cap
are excluded. This estimate is little changed when we treat large trades with ‘5MM+’/‘1MM+’ codes as if
their sizes were $5,000,000/$1,000,000, and in this case, the p-value drops to 0.0002.
In the original MRR model, the information asymmetry measure does not depend on trade size.
To test our hypothesis, we extend their model to explicitly account for potential trade size effects.
Specifically, we replace the constant effects of information and liquidity, as captured by the coefficients
z and c in equations (2a) and (2b), with two general functions tVf and tVh , respectively.
First, we assume that, as in GH, both information and liquidity impacts are linear in trade size:
;10 tt VVf (2’a)
.10 tt VVh (2’b)
Therefore, replacing z and c with tVf and tVh in equation (2c) yields:
27 See Hong and Warga (2000), Schultz (2001), Chakravarty and Sarker (2003), Warga (2004), Bessembinder, Maxwell and Venkataraman (2006), Edwards, Harris and Piwowar (2007), and Goldstein, Hotchkiss, and Sirri (2007).

12
.ˆˆ1010 tttttttt EQVQQVQP (2’)
Panel A of Table II shows that the information component estimated using the modified MRR model is
again positively correlated with trade size, with 1 being 0.019 and significant at the 1 percent level.
Second, we employ a semi-parametric approach to allow for potential nonlinear effects of trade
size in the MRR model. Specifically, we create three size dummy variables, sD , mD , and lD , for small,
medium and large trades, respectively. We classify trades with par values less than $100,000 as small
trades, those with par values of at least $1 million as large trades, and those in between as medium size
trades. Notice that this classification also allows us to include all large trades that are subject to TRACE
cap without assigning any fixed number ($5 million or $1 million). Thus, the information and liquidity
effects can be expressed as:
,,,
kt
lmsk
kt DzVf
(2”a)
.,,
kt
lmsk
kt DcVh
(2”b)
Replacing z and c with tVf and tVh in equation (2c) now gives:
.ˆ,,,,
tlmsk
tkt
k
lmskt
kt
kt EQDcQDzP
(2”)
As shown in Panel B, for each size group, both the mean and the median values of the information effect
(as captured by z ) are positive and significant at the 1 percent level. More importantly, the t-test and the
Wilcoxon test indicate that the z estimate for the large trades is greater than that for the medium and the
small trades, while there is no significant difference in the z estimates between medium and small trades.
This result again confirms that larger bond trades tend to be more informative in the bond market, a
finding that is in contrast to that in the equity market documented by Huang and Stoll (1997).
IV. Information Asymmetry and Corporate Yield Spreads
We now examine whether our estimated information asymmetry measures possess any
explanatory power for corporate yield spreads after controlling for factors considered in traditional
corporate bond pricing models. As discussed previously, market microstructure theory suggests that
investors would require higher yields to hold those bonds exhibiting more asymmetric information risk,
above and beyond the compensation for credit risk and the cost of providing liquidity. Therefore, our
hypothesis is that corporate yield spreads are positively related to information asymmetry measures.
A. The Effect of Information Asymmetry on Corporate Yield Spreads
13
Our strategy is to incorporate our information asymmetry measures into existing empirical
models for corporate yield spreads (e.g., Campbell and Taksler (2003) and Chen, Lesmond, and Wei
(2007)). These models are often motivated by a structural view of corporate default, which holds that a
firm’s credit risk, in terms of both the probability of default and recovery rate given default, depends on
its capital structure and the firm value. Various firm accounting variables and macroeconomic variables
have been used as proxies for a firm’s credit risk. In addition, bond-specific characteristics and proxies for
liquidity conditions have also been used as determinants of bond yield spreads. Consistent with this
literature, we specify our empirical model as follows:
,
/
//
).2.10(.1
,1817,16
,15,14,13
,12,1110
98,7,6
,5,4,3,2,10,
tittti
tititi
titit
tttiti
titititititi
tReturnStockMarkeytVolatilitStockMarkekReturnIssuerStoc
ykVolatilitIssuerStocgerestCoveraPretaxIntesalesncomeOperatingI
tionCapitalizaTotalDebtAssetsTotalbtLongtermDeEuroDollar
teTreasuryRayryrteTreasuryRayrCouponIssueSize
AgeMaturityRatingLiquidityAsymInfodYieldSprea
(3)
where tiAsymInfo , and tiLiquidity , refer to, respectively, the asymmetric information and liquidity cost
components of the bid-ask spreads estimated by either MRR or GH model for bond i in quarter t. The rest
of the control variables include bond-specific characteristics: credit rating (Rating), time to maturity
(Maturity), time since issuance (age), coupon rate (coupon), and (log) issue size (IssueSize); firm-specific
characteristics: long-term debt/total asset, total debt/total capitalization, operating income/sales, and pre-
tax interest coverage; and macroeconomic variables: one-year Treasury rate (1yrTreasuryRate), the
difference between ten-year and two-year Treasury rates (10yr.-2yr.Treasuryrate), and the difference
between the 30-day Eurodollar and Treasury yields (EuroDollar).28 Further, following Campbell and
Taksler (2003), we include the mean and the standard deviation of the daily excess return of the issuer
equity relative to the CRSP value-weighted index (IssuerStockReturn and IssuerStockVolatility), as well
as the mean and the standard deviation of the daily stock market returns (measured using CRSP value-
weighted index returns) within each quarter (StockMarketReturn and StockMarketVolatility).
Table III presents regression results based on two specifications of model (3) for each information
asymmetry measure. Because our sample contains multiple bonds issued by the same firm over multiple
periods, we correct the standard errors following Thomson (2009) to account for potential correlations
across bonds and over time. The regression results are presented in Columns I and III for MRR and GH
28 We follow the existing literature in defining our control variables. For credit rating, we assign a numeric value to each S&P rating letter, with 1, 2, ..., 10 denoting AAA, AA,…, D, respectively. Firm-specific variables are calculated using COMPUSTAT data as of the end of the previous calendar year except for when computing total debt/total capitalization ratio, where we use the market value of the equity from CRSP and the book value of debt from COMPUSTAT to calculate total firm capitalization. See Blume, Lim and MacKinlay (1998), Collin-Dufresne, Goldstein and Martin (2001), Elton, Gruber, Agrawal and Mann (2001), Campbell and Taksler (2003), Nashikkar and Subrahmanyam (2006), and Chen, Lesmond and Wei (2007).

14
measures, respectively. There is strong evidence that corporate bond yield spreads reflect information risk.
After controlling for liquidity costs, bond- and firm-specific characteristics, and macroeconomic factors,
the coefficients of our information asymmetry measures (based on both MRR and GH models) are
positive and statistically significant at the 1 percent level. The point estimate using the MRR (GH) model
implies that a one-basis-point increase in the information asymmetry measure leads to a widening of the
yield spread by 0.37 (0.30) basis point. These results continue to hold when we add firm fixed effects in
our model, as shown in Columns II and IV. Controlling for firm fixed effects is desirable because bond
issues may be concentrated in a small set of firms. The fixed effect model also mitigates the effect of
potential unobservable firm heterogeneity on our estimation, effectively allowing us to identify the
informational risk effect by comparing bonds issued by the same firm. As we can see, the coefficients of
information asymmetry measures continue to be positive and statistically significant, and their
magnitudes are only slightly lower.
Consistent with findings in previous studies on liquidity effects, the coefficients for liquidity
provision costs are also positive and significant at the 1 percent level.29 Note that some bond specific
characteristics, such as issue size, coupon rate, and age, have also been used extensively in the literature
as proxies for bond liquidity, especially before the TRACE data became available.30 Our results on these
variables are also largely consistent with findings in existing studies.
Further, the coefficients of other control variables carry expected signs and are generally
consistent with previous studies. The level of term structure, measured by the one-year Treasury rate, is
negative and statistically significant, supporting the argument by Longstaff and Schwartz (1995) that an
increase in the risk-free interest rate implies an upward drift in the risk-neutral process for the firm value,
and hence a reduction in the risk-neutral probability of default and in turn a lower corporate yield spread.
The slope of the term structure, measured by the difference between ten- and two-year Treasury rates, has
a significant negative effect on yield spreads, consistent with the reasoning put forth by Collin-Dufresne,
Goldstein, and Martin (2001) that a larger slope implies an expectation of higher future short rates and a
stronger economy. The coefficient for Eurodollar, which measures market liquidity effects on corporate
bonds relative to Treasury bonds, is positive and statistically significant, as expected. In addition, lower
total debt ratios and higher pre-tax interest coverage are associated with lower yield spreads, suggesting
that financially healthy firms incur lower costs of debt. The coefficients for long-term debt ratio and
operating margin are not statistically significant. Finally, information conveyed by stock market trading
29 See, for example, Nashikkar and Subrahmanyam (2006), Chen, Lesmond, and Wei (2007), and Bao, Pan, and Wang (2008). 30 See, for example, Gehr and Martell (1992), Alexander, Edwards and Ferri (2000), and Hong and Warga (2000). Elton, Gruber, Agrawal and Mann (2004) argue that higher coupon bonds should have higher yield spreads as interest payments on corporate bonds are taxed at the state level.

15
has also a strong effect on the value of bonds. For example, an increase in the volatility of the issuer’s
equity excess returns increases corporate yield spreads, as documented by Campbell and Taksler (2003).
B. Alternative Controls for Credit Risks
In this section, we take two alternative approaches to control for the potential confounding effects
from credit risks. The interpretation of our results relies importantly on appropriate control for credit risk,
because, to the extent that unobserved credit risk may be positively correlated with information
asymmetry in bond trading, inadequate control for credit risk may result in a bias favoring finding
positive information effects.
Our first approach is to experiment with alternative specifications on the credit ratings of bonds,
and to include some structurally generated nonlinear variables, in addition to traditional accounting and
market-based ratios. We present the results from using the MRR information asymmetry measure in
Table IV. Using GH measure yields similar results which, for brevity, are not reported but available upon
request.
First, we refine the credit rating variable by using notch-level ratings (compared to letter-level
ratings above) from Standard and Poor’s.31 A more graduated rating variable may control for more
variation in the credit risk. As shown in Column I of Table IV, the coefficient of the information
asymmetry measures is positive and statistically significant at 1% level. In fact, its magnitude barely
changes from when using the letter-level ratings (See Column II of Table III). To account for potential
non-linear effect from credit rating, we also replace the linear rating variable with six categorical dummy
variables for the following rating classes: AAA, AA, A, BBB, BB, and B. Not surprisingly, higher rated
bonds tend to have lower yield spreads (see Column II). More importantly, using rating dummies to
control for nonlinearities imposes little influence on the estimate of the coefficient of information
asymmetry.
Second, we estimate a distance to default (DtoD) measure and combine it with rating dummies to
control for credit risk. Roughly speaking, the distance to default is the number of standard deviations of
quarterly asset growth by which asset values exceed the firm’s liabilities. In standard structural models,
models that assume a firm defaults when its assets drop to a sufficiently low level relative to its liabilities,
the conditional default probability depends heavily (or completely for some models) on the distance to
default (e.g., Black and Scholes (1973), Merton (1974)). Empirically, the relevance of distance to default
in predicting defaults has also been well established in the literature (e.g, Bharath and Shumway (2008),
31 A numeric value is assigned to each notch of S&P’s credit rating, with 1, 2, 3,…denoting AAA+, AAA, AAA-, … respectively. Notice that the sample for this test shrank a bit since we excluded any bond-quarter when a bond experienced even a single notch of credit rating change.

16
Campbell, Hilscher, and Szilagyi (2011)). Besides its structural and nonlinear nature, distance to default
incorporates current market information more timely than possibly stale credit ratings.
Following Duffie, Saita, and Wang (2009), we construct our distance to default measure based on
the Black-Scholes-Merton specification and use an iterative method to estimate the measure based on
market equity data and Compustat balance sheet data. Since the distance to default measure is essentially
a volatility-adjusted leverage measure, we exclude firm leverage measures and stock volatility measures
as control variables in estimating Model (3). Column III in Table IV shows that the coefficient of
information asymmetry measure remains positive and statistically significant. The coefficient of Merton
DtoD measure is negative and highly significant, consistent with our expectation that bonds issued by
firms far from default tends to have lower yield spreads.
The Black-Scholes-Merton specification implies that the conditional default probability is simply
the cumulative standard normal distribution function valued at the negative distance to default (see, e.g.,
Crosbie and Bohn (2002) and Vassalou and Xing (2004)). So we also use these estimated conditional
default probability as an alternative control for credit risk. As shown in Column IV of Table IV, the
coefficient of default probability is positive and significant, suggesting that yield spreads tend to be wider
when the default probability of the issuer increases. Again, information asymmetry continues to exhibit
significant explanatory power for corporate yield spreads after controlling for credit risks.
Lastly, we use a firm’s 5-year credit default swap (CDS) spread, in addition to credit rating
dummies, to control for credit risk. CDS are insurance contracts to protect investors against the issuer’s
default risk. Thus, CDS spreads are generally viewed as a direct measure for credit risk (see, e.g.,
Longstaff, Mithal, and Neis (2005)).32 Because CDS spreads are market based, they reflect investors’
expectations on a firm’s credit risk in more timely than do credit ratings, as ratings are commonly viewed
as lagging behind the actual changes in a firm’s credit risk. We obtained the data on CDS spreads from
Markit. The results presented in Column V once again confirm the robustness of our results to alternative
credit risk controls.
Our second approach is to use an instrumental variables (IV) method to control for potential
endogeneity between information asymmetry and credit risks as well as for unobservable credit risk. A
valid IV has to meet the exclusivity condition that the IV is correlated with the measures of information
asymmetry but not directly with a bond’s credit risk. Our candidate for the IV is the degree of
concentration in institutional ownership of corporate bonds meets such requirement. Several studies have
used institutional ownership as a proxy for private information (see for example Brennan and
32 CDS spreads may also be affected by their own liquidity issues. Bongaerts, de Jong, and Driessen (2011) find that the effect of liquidity is statistically significant in the CDS market but that the magnitude of the effect is rather small. This small economic effect is consistent with the view of Longstaff, Mithal, and Neis (2005) that liquidity concerns might be less severe in the CDS market due to the contractual nature of CDS. See also Tang and Yan (2007).

17
Subrahmanyam (1995)). Thus, if a bond’s ownership is highly concentrated in a few institutions, the
information asymmetry between a few large block holders and other investors may be greater.
We use information on the fund-level institutional holdings of corporate bonds from Lipper’s
eMAXX fixed income database to estimate the degree of concentration in institutional ownership. This
database provides quarterly bond ownership information by all insurance companies, over 95 percent
mutual funds, and the top 250 public pension funds in the United States.33 Because insurance companies
and pension funds generally face regulatory limitations or investor mandates on their investments in high-
yield bonds, we focus on holdings by mutual funds so that our bond ownership measure is not directly
related to credit risks. For each bond/quarter, we calculate the Herfindahl index in mutual fund holding,
which is the sum of squared share of holding by each institution, and use it as a proxy for concentration.
On average, our sample bonds are held by 28 mutual funds. The Herfindahl index has a mean
value of 0.37, but exhibit high variations across bonds (with a standard deviation of 0.24). Importantly,
Henfindahl index is not higher for lower rated bonds. In fact, the mean and median values of the
Herfindahl index are 0.309 and 0.228 for high-yield bonds, which are smaller than the 0.395 and 0.331 for
their investment-grade counterparts. This finding alleviates the concern that our instrument simply
captures some unobserved credit risk information.
Table V presents the results from the two-stage least squares regressions. In the first stage, we
regress the measures of information asymmetry from the MRR and the GH models on the Herfindahl
index in bond holding and all other control variables used in model (3). Panel A shows that the coefficient
of Herfindahl index is positive and highly significant. This result is consistent with our expectation that
bonds held by competitive institutions have less information asymmetry. The results of the second stage
regressions, in which we replace the measures of information asymmetry with their predicted values from
the corresponding first stage regressions, are presented in Panel B. Consistent with our previous analysis,
the coefficients of the information asymmetry measure are all positive and statistically significant at the 1
percent level.
C. Additional Robustness Checks
We conduct a number of tests to check the robustness of our results and present them in Table VI.
First, we examine whether our results hold when we re-estimate our model (3) using alternative estimates
of the information and liquidity components. We consider the following three alternative estimates: (a)
estimates based on the GH model by treating large trades with ‘5MM+’/‘1MM+’ codes as if their trade
sizes were $5,000,000/$1,000,000; (b) estimates based on a modified MRR model allowing the trade
33 This dataset has been examined in a few recent studies. See for example, Manconi and Massa (2009), and Massa, Yasuda, and Zhang (2008).

18
effects to be linear in trade size (i.e., model (2’) shown above); and (c) estimates based on a modified
MRR model allowing the trade effects to be nonlinear in trade size (i.e., model (2”) shown above). As
shown in Panel A, in all three cases, the coefficients of the information asymmetry measures continue to
be positive and statistically significant at the 1 percent level.
Second, we check whether our results are robust to alternative measures of liquidity costs. For
this purpose, we re-estimate model (3) by replacing the liquidity cost components from the MRR and GH
models with several general liquidity measures estimated from unsigned bond transaction data, such as
turnover (trade volume normalized by issue size), price impact (lower Amihud (2002) measure), and
trading frequency (both in terms of the number of days traded and the number of trades). 34,35 As an
additional measure, we consider intraday price range, which is the difference between the highest and the
lowest transaction prices within a day. As a liquidity proxy, intraday price range is in the same spirit as
both the realized bid-ask spread proposed by Chakravarty and Sarkar (1999) and the volatility measure
proposed by Alexander, Edwards and Ferri (2000) and Hong and Warga (2000).36
The results using the information asymmetry measure based on the original MRR model are
presented in Panel B.37 Results from using the GH measure yields similar results and are not reported here.
All liquidity measures exhibit expected signs and are statistically significant at the 1 percent level.
Specifically, yield spreads are negatively associated with volume-based liquidity measures, including
turnover, number of days traded, and total number of trades, but positively associated with illiquidity
measures, including the Amihud measure and the intraday price range measure.38 Importantly, regardless
of which liquidity measure is used, the coefficients of the information asymmetry measures are all
positive and statistically significant at the 1 percent level. Note that the magnitude of these coefficients
does drop somewhat. The weaker informational effects are not surprising because these conventional
liquidity measures tend to be broadly-defined and may capture part of the effects from information
asymmetry. For example, the Amihud measure, which estimates the impact of order flow on price based
on Kyle’s (1985) coefficient, may reflect both adverse selection costs and inventory costs. Also,
Goldstein, Hotchkiss and Sirri (2007) attribute the cost differences between large and small bond trades to
either a high level of fixed costs for small trades or a rent extracted by dealers in trading with relatively
34 Other studies have also estimated bond liquidity measures using lower frequency data. For example, Chen, Lesmond and Wei (2007) estimate a liquidity measure from Lesmond, Ogden and Trzcinka (1999) using daily prices reported by a large bond dealer. 35 To estimate the Amihud liquidity measure for each bond-quarter, we first calculate the price impact for each bond-day by dividing the absolute daily price changes by daily trade volume, whenever prices for two consecutive trading days are available. We then average the daily price impact over days within each quarter for each bond to obtain a bond-quarter level estimate. 36 The realized bid-ask spread is defined as the difference between average buying and selling prices per bond per day in Chakravarty and Sarkar (1999). 37 Results using the information asymmetry measures based on the GH model, not shown but available upon request, are similar to what we reported here. 38 We also use the intraday price volatility of a bond, a measure very similar to intraday price range, to control for liquidity and found similar results.

19
less-informed retail investors. Lastly, Barinov (2009) argues that turnover is a proxy for firm-specific
uncertainty rather than liquidity. In sum, these findings are consistent with the notion that broadly-defined
liquidity measures might capture more of the adverse selection risks than the transaction costs of liquidity
(Brennan and Subrahmanyam, 1996, and O’Hara, 2003).
Third, we take into account potential industry effects and re-estimate model (3) by excluding
bonds issued by firms in financial or utility industries. The main rationale for such exclusion is that both
financial and utility industries are heavily regulated. Also, in light of the recent financial crisis, a period
that our sample overlaps, one may suspect that there may be some fixed effects about financial industry.
The results, presented in Panel C, show that the effects of information asymmetry on yield spreads are
little changed. We also control for industry effects by including two dummy variables for financial and
utility industries and estimate model (3) on the full sample of bonds. Unreported results show that our
results are again robustness.
Fourth, we also examine a more flexible specification of model (3) by replacing macro-economic
variables with year-quarter fixed effects. This allows us to control for some unobservable time-varying
effects, such as the seasonal effects as in Campbell and Taksler (2003). As seen in Panel D, the
coefficients of information asymmetry measures remain largely unchanged.
Finally, since our information asymmetry measures are estimated with error, we use the inverse
variance of the first stage regression as the weight and re-estimate model (3) using a Weighted Least
Square (WLS) approach. Once again, our results are robustness to this alternative specification (Panel E).
D. The Effects of Information Asymmetry by Credit Rating, Time to Maturity, and the Influence of
Issuer’s Public Equity Listing
In this section, we take a step further and examine whether the effects of information asymmetry
on corporate yield spreads vary across bonds with different credit rating and time to maturity. In addition,
we explore the relationship between a firm’s equity listing status and the effect of information asymmetry
in bond trading on the costs of bond financing.
Our first goal here is to examine if there exist any nonlinear empirical regularities associated with
credit risk. To do so, we follow the literature by separately examining the samples of investment- and
speculative-grade bonds (e.g., Chen, Lesmond, and Wei (2007)). The general rationale for this practice is
that information asymmetry may exhibit stronger pricing impact for lower rate bonds, as bonds are more
sensitive to downside risks. Further, investor behavior may differ when a bond is close to the default
threshold, as opposed to when a bond has little default risk. In our context, investors may care more about
the adverse selection risk in trading speculative-grade bonds as those bonds are closer to default.

20
We re-estimate model (3) separately using the samples of high-yield and of investment-grade
bonds. The results, presented in Panel A of Table VII, show that the coefficients for information
asymmetry measures are positive and statistically significant for both high-yield and investment-grade
samples. Thus, the conditional influence of informed trading on bond spreads is not confined to high-
yield bonds, even though, as we showed earlier, trading in high-yield bonds tends to have a higher degree
of information asymmetry. Nevertheless, the magnitude of the asymmetry information coefficient on the
high-yield sample is much higher than that on the investment-grade sample, and the difference is
statistically significant at the 1 percent level. This finding indicates that both the level of information
asymmetry and its effect on yield spreads are higher for lower rated bonds.
Theoretical work by Darrell and Duffie (2001) indicates that incomplete accounting information
can lead to significant increase in yield spread for bonds with short time to maturity. Consistent with this
prediction, Yu (2005) finds firms with lower accounting transparency tend to have larger yield spreads,
especially for short-term bonds. Arora, Richardson, and Tuna (2011) find asset measurement uncertainty
to be a significant determinant of short-term yield spreads. We also try to shed some light on the impact
of information asymmetry on the term structure of yield spreads by examining the differential pricing
implications of information asymmetry for bonds of different maturity. For this purpose, we divide our
sample bonds into two groups based on whether their time to maturity is less than 5 years, and re-estimate
model (3) separately on these two groups of bonds(see Panel B). While information asymmetry affects
yield spreads for both long-term and short-term bonds, such effect is much stronger for the short-term
sample.
Lastly, we examine the effect of information asymmetry on the issuer’s cost of debt for bonds
issued by private firms. For this purpose, we expand our sample to include all bonds whose issuer has no
publicly traded equity during our sample period. We find that compared to those issued by public firms,
bonds issued by private firm have higher levels of information asymmetry. Based on the MRR model, the
mean (median) value of the information asymmetry estimate for private firm bonds is 9.67 (5.15),
significantly higher than that for public firm bonds, 6.97 (3.39). Both the t-test and the Wilcoxon test
show that the difference is statistically significant at the 1 percent level. Similar results hold for the
information asymmetry estimate based on the GH model. These findings are consistent with the fact that
the bond market constitutes the only venue for informed traders to exploit their information advantages.
We re-estimate model (3) for this sample of private firm bonds and the results are presented in
Panel C. We exclude firm-specific and equity-related variables because their values were missing for
private firms. The coefficient for information asymmetry measure is positive and highly significant.
Noticeably, the magnitude of the asymmetry information coefficient is much higher than that from the
public firm bonds sample as reported in Table 3. Such stronger pricing effects of informed trading are

21
consistent with the notion that it is more costly to collect and analyze information on credit risks when the
issuer is privately held. This finding can also be attributed to some omitted variables for private firms. For
instance, firm level information is not available to explain corporate yield spreads for private firms. Also,
public status can also impact cost of debt financing since access to public equity market might render
equity financing a more attractive choice. Nevertheless, our results highlight the importance of using
bond market trading information to explain corporate yield spreads when the issuer has no publicly traded
equity.
V. Information Asymmetry and Corporate Default Prediction
If microstructure measures of information asymmetry capture the amount of informed trading on
credit risk related information, an interesting question is whether these asymmetry information measures
can help predict corporate defaults. As informed trading in bonds tends to be more severe during times of
credit risk stress, we would expect it to carry important information about the prospect of default by the
issuer. In this section, we examine the relevance of information asymmetry in predicting corporate
defaults.
Data on the timing of default are obtained from Moody’s Default Risk Services, supplemented
using information on defaults in the Mergent FISD database, for the period of 2003-2008. Defaults are
defined as bankruptcy filings, missing coupon or principal payments, and distressed exchanges (when a
firm issues new securities in the form of lower economic values, such as reduced principal amount or
lower coupon, to exchange for its existing debt). For each firm/quarter with asymmetric information
measures, we create a dummy variable, Defaultdum, which takes the value 1 if the issuer defaults on its
debt during the next quarter, and 0 otherwise. In addition, we include the default forecasting variables as
used in Duffie, Saita, and Wang (2007): the issuer’s distance to default measure (DtoD), the issuer’s
trailing one year stock return (StockRet), three-month Treasury bill rate (Tbill), and the trailing on year
return on the S&P 500 index (SPX), and estimate the following Logistic regression:
, 0 1 , 2 , 3 , 4 , 5 , , .i t i t i t i t i t i t i ty AsymInfo DtoD StockRet Tbill SPX (4)
such that Defaultdum =1 if y>0, 0 otherwise. This model is estimated using MRR and GH asymmetry
information measures, and the results are presented in Panels A and B of Table VIII respectively.
Since information on equity trading and firm accounting variables is not available for private
firms, we start with a sample of only public firms. During our sample period, for a total of 61 firms
which defaulted on their bonds, we are able to calculate the average asymmetry information measures in
bond trading during the quarter prior to their defaults. We first estimate a basic specification of Model (4)
by using the AsymInfo measure as the only explanatory variable. Column I shows that the degree of
information trading carries significant power in forecasting corporate defaults. The coefficient for

22
AsymInfo measure is positive and significant at the 1% level. We then estimate a full specification of
Model (4) by including other default forecasting variables (see Column II). AsymInfo measure exhibits
additional power in forecasting defaults: the significance of the AsymInfo measure decreases both
economically and statistically, but it is still significant at the 5% level. The estimates of the coefficients
for the other four predictive variables are largely consistent with Duffie, Saita, and Wang (2007). The
coefficients for both DtoD and StockRet are negative and highly significant, suggesting that firms with
lower leverage (after adjusting for volatility) and higher stock returns tend to have lower probability of
default in the next quarter. The coefficients for both Treasury bill rate and S&P 500 index return are also
negative but not significant at any conventional level.
We also examine the power of bond informed trading in predicting defaults for private firms.
Since the bond market constitutes the only venue for informed traders to exploit their information
advantages, we would expect their trading in the issuer’s bonds to have more information about a firm’s
future defaults. During our sample period, 37 private firms with information asymmetry measures
defaulted on their bonds. We find that the coefficient for AsymInfo measure is positive and significant at
the 1% level (Column III). This result holds even after we control for the other two default predictive
variables, Tbill and SPX (Column IV). Notice that the significance of the coefficient of the AsymInfo
measure is higher than that from the public firm sample, consistent with our expectation that trading in
bonds by private firms tends to be more informative about future defaults than that in their public
counterparts. While these results may also be attributed to the fact that we are unable to compute two
default predictive variables related to the issuer’s equity information, it nonetheless highlights the
importance of using bond trading information in default prediction for private firms.
VI. Conclusion
Valuation of corporate debt has been an important, albeit imprecise task in asset pricing. Both
structural and reduced-form models have had limited success in explaining observed corporate yield
spreads. Taking advantage of a unique corporate bond transaction dataset, we introduce the effect of
information asymmetry into corporate bond pricing. We find that microstructure measures of information
asymmetry seem to capture adverse selection in corporate bond trading reasonably well. We demonstrate
that information asymmetry exhibits additional explanatory power for corporate yield spreads after
controlling for liquidity costs, credit risks, and other relevant factors in bond pricing. The effects of
information asymmetry on yield spreads are stronger for lower rated and shorter term bonds, and for
bonds issued by privately-held firms. This paper extends the literature on the implications of market
microstructure for asset pricing to corporate debt securities and suggests that yields of corporate debt
might embed an information premium that is largely absent in existing corporate bond pricing models.

23
Therefore, valuation of corporate debt needs to be recast in broader terms to integrate transaction costs of
liquidity and risks from information asymmetry during the process of price discovery.
In addition, this paper highlights the value of information embedded in bond trading in
forecasting the issuer’s future defaults. We find that the degree of information trading in corporate bonds
help predict the issuer’s future defaults after conditioning on other default forecasting variables. Such
predictive power is stronger for private firms with no firm level accounting information and publicly
traded stock.
Furthermore, this paper suggests that the information structure surrounding a firm’s debt has
important effects on its financing and risk management decisions. If there is significant information-based
trading in a firm’s bonds, investors will require higher yields to hold these bonds, and hence the firm will
be less willing to issue bonds in equilibrium. This study, consistent with Easley and O’Hara (2004),
implies that a firm can affect its cost of debt by choosing disclosure policies, market microstructure,
accounting treatments, and other factors that will influence the information structure surrounding its debt
securities. It provides a new perspective to understanding the complete market assumption in the
Modigliani and Miller Theorem.

24
References:
Alexander, G., A. Edwards, M. Ferri. 2000. The determinants of trading volume of high-yield corporate bonds. Journal of Financial Markets 3, 177-204.
Amihud, Y. 2002. Illiquidity and stock returns: cross section and time series effects. Journal of Financial Markets 5, 31-56. Amihud, Y., H. Mendelson. 1986. Asset pricing and the bid-ask spread. Journal of Financial Economics 17, 223-249. Amihud, Y., H. Mendelson. 1991. Liquidity, maturity and the yields on U.S. treasury securities. Journal of Finance 46, 1411-
1425. Anderson, R., S. Sundaresan. 1996. Design and valuation of debt contracts. Review of Financial Studies 9, 37-68. Andrade, S., G. Bernile, F. Hood. 2009. SOX, corporate transparency, and the cost of debt. Working paper. Ashbaugh-Skaife, H., D. Collins, W. Kinney Jr., R. LaFond. 2008. The effect of internal control deficiencies from firm risk and
cost of equity. The Accounting Review 83, 217-250. Bao, J., J. Pan, J. Wang. 2008. Liquidity of corporate bonds. working paper. Barber, B., Y. Lee, Y. Liu, T. Odean. 2009. Just how much do individual investors lose by trading? Review of Financial Studies
22, 609-632. Barclay, M., J. Warner. 1993. Stealth trading and volatility: which trades move prices? Journal of Financial Economics 34, 281-
305. Bargeron, L., K. Lehn, C. Zutter, 2010, Sarbanes-Oxley and corporate risk-taking. Journal of Accounting and Finance 49, 34-52. Barinov, A. 2010. Turnover: Liquidity or uncertainty? Working paper. Bessembinder, H., W. Maxwell, K. Venkataraman. 2006. Market transparency, liquidity externalities, and institutional trading
costs in corporate bonds, Journal of Financial Economics 82, 251-288. Bharath, S., T. Shumway. 2008. Forecasting default with the Merton distance to default model. Review of Financial Studies 21,
1339-1369. Bharath, S., A. Dittmar. 2010. Why do firms use private equity to opt out of public markets? Review of Financial Studies 23. Biais, B. 1993. Price formation and equilibrium liquidity in fragmented and centralized markets. Journal of Finance 48, 157-185. Black, F., J. Cox. 1976. Valuing corporate securities: some effects of bond indenture provisions. Journal of Finance 31, 351-367. Bliss, R. 1997. Testing term structure estimation methods. Advances in Futures and Options Research 9, JAI Press, 197-231. Blume, M., F. Lim, C. MacKinlay. 1998. The declining credit quality of U.S. corporate debt: myth or reality? Journal of Finance
53, 1389-1413. Boehmer, E., A. Ljungvist. 2004. On the decision to go public: evidence from privately held firms. Working paper. Bongaerts, D., M. Cremers, W. Goetzmann. 2009. Multiple ratings and credit spreads. working paper. Bongaerts, D., F. de Jong, J. Driessen. 2011. Derivative pricing with liquidity risk: theory and evidence from the credit default
swap Market. Journal of Finance 66, 203-40. Boulatov, A., T. Hendershott, D. Livdan. 2010. Informed trading and portfolio returns. Working paper. Brennan, M., N. Jegadeesh, B. Swaminathan. 1993. Investment analysis and the adjustment of stock prices to common
information. Review of Financial Studies 6, 799-824. Brennan, M., A. Subrahmanyam. 1995. Investment analysis and price formation in securities markets. Journal of Financial
Economics 38, 361-381. Brennan, M., A. Subrahmanyam. 1996. Market microstructure and asset pricing: On the compensation for illiquidity in stock
returns. Journal of Financial Economics 41, 441-464. Burlacu, R., P. Fontaine, S. Jimenez-Garces, M. Seasholes. 2008. Information precision, noise, and the cross-section of stock
returns. Working paper. Bushee, B., T. Goodman. 2007. Which institutional investors trade based on private information about earnings and returns?
Journal of Accounting Research 45, 289-322. Cai, N., J. Helwege, A. Warga. 2007. Underpricing in the corporate bond market. Review of Financial Studies 20. 2021-2046. Campello, M., L. Chen, L. Zhang. 2008. Expected returns, yield spreads and asset pricing tests. Review of Financial Studies 21,
1297-1338. Chakravarty, S., A. Sarkar. 1999. Liquidity in U.S. fixed income markets: a comparison of the bid-ask spread in corporate,
government and municipal bond markets. Working paper. Campbell, J., G. Taksler. 2003. Equity volatility and corporate bond yields. Journal of Finance 58, 2321-2349. Chakravarty, S. 2001. Stealth-trading: which traders’ trades move stock prices? Journal of Financial Economics 61, 289-207. Chen, L., D. Lesmond, J. Wei. 2007. Corporate yield spreads and bond liquidity. Journal of Finance 62, 119-149. Chemmanur, T., P. Fulghieri. 1999. A theory of the going-public decision. The Review of Financial Studies 12, 249-279. Chhaochharia, V., Y. Grinstein. 2007. Corporate governance and firm value: the impact of the 2002 governance rules. Journal of
Finance 62, 1789-1825.

25
Chordia, T., A. Subrahmanyam, R. Anshuman. 2001. Trading activity and expected stock returns. Journal of Financial Economics 59, 3-32.
Collin-Dufresne, P., R. Goldstein. 2001. Do credit spreads reflect stationary leverage ratios? Journal of Finance 56, 1929-1957. Collin-Dufresne, P., R. Goldstein, S. Martin. 2001. The determinants of credit spread changes. Journal of Finance 56, 2177-2208. Cremers, M., J. Driessen, P. Maenhout. 2008. Explaining the level of credit spreads: option-implied jump risk premia in a firm
value model. Review of Financial Studies 21, 2209-2242. Das, S., P. Tufano. 1996. Pricing credit sensitive debt when interest rates and credit spreads are stochastic. Journal of Financial
Engineering 5, 161-198. Datta, S., M. Iskandar-Datta. 1996. Does insider trading have information content for the bond market? Journal of Banking and
Finance 20, 555-575. DeFond, M., M. Huang, E. Karaoglu, J. Zhang. 2008. Was the Sarbanes-Oxley Act good news for corporate bondholders?
Working paper. Demsetz, H. 1968. The cost of transacting. Quarterly Journal of Economics 82, 33-53. De Jong, F., J. Driessen. 2006. Liquidity risk premia in corporate bond and equity markets. Working paper. Duarte, J., L. Young. 2009. Why is PIN priced? Journal of Financial Economics 91, 119-138. Duffee, G. 1999. Estimating the price of default risk. Review of Financial Studies 12, 197-226. Duffie, D., L. Saita, K. Wang. 2007. Multi-period corporate default prediction with stochastic covariates. Journal of Financial
Economics 83, 635-665. Duffie, D., D. Lando. 2001. Term structure of credit spreads with incomplete accounting information. Econometrica 69, 633-664. Duffie, D., K. Singleton. 1997. An econometric model of the term structure of interest rate swap yields. Journal of Finance 52,
1287-1321. Duffie, D., .K. Singleton. 1999. Modeling term structures of defaultable bonds. Review of Financial Studies 12, 687-720. Easley, D., S. Hvidkjaer, M. O’Hara. 2002. Is information risk a determinant of asset pricing? Journal of Finance 57, 2185-2221. Easley, D., S. Hvidkjaer, M. O’Hara. 2010. Factoring information into returns. Jounal of Financial and Quantitative Analysis 45,
293-309. Easley, D., N. Kiefer, M. O’Hara, J. Paperman. 1996. Liquidity, information, and infrequently traded stocks. Journal of Finance
51, 1405-1436. Easley, D., M. O’Hara. 1987. Price, trade size, and information in securities markets. Journal of Financial Economics 19, 69-90. Easley, D., M. O’Hara, 2004, Information and the cost of capital, Journal of Finance 59, 1553-1583. Edwards, A., H., Lawrence, M. Piwowar. 2007. Corporate bond market transaction costs and transparency. The Journal of
Finance 62, 1421-1451. Engel, E., R. Hayes, X. Wang. 2007. The Sarbanes-Oxley Act and firms’ going-private decision. Journal of Accounting and
Economics 44, 116-145. Elton, E., M. Gruber, D. Agrawal, C. Mann. 2001. Explaining the rate spread on corporate bonds. Journal of Finance 56, 247-
277. Elton, E., M. Gruber, D. Agrawal, C. Mann. 2004. Factors affecting the valuation of corporate bonds. Journal of Banking and
Finance 28, 2747-2767. Ericsson, J., O., Renault. 2006., Liquidity and credit risk. Journal of Finance 61, 2219–2250. Gao, F., J. Wu, J., Zimmerman. 2009. Unintended consequences of small firms exemptions from securities regulation: evidence
from SOX. Journal of Accounting Research 47, 459-506. Garman, Mark, 1976, Market microstructure, Journal of Financial Economics 3, 257-275. Gehr, A., T. Martell. 1992. Pricing efficiency in the secondary market for investment-grade corporate bonds. Journal of Fixed
Income 2, 24-38. Geske, R. 1977. The valuation of corporate liabilities as compound options. Journal of Financial and Quantitative Analysis, 541-
552. Glosten, L., L. Harris. 1988. Estimating the components of the bid/ask spread. Journal of Financial Economics 21, 123-142. Goldstein, M., E. Hotchkiss. 2007. Dealer behavior and the trading of newly issued corporate bonds. Working paper. Goldstein, M., E. Hotchkiss, E. Sirri. 2007. Transparency and liquidity: a controlled experiment on corporate bonds. Review of
Financial Studies 20, 235 - 273. Grossman, S., M. Miller. 1988. Liquidity and market Microstructure. Journal of Finance 43, 617-633. Hart, O. 2009. Regulation and Sarbanes–Oxley. Journal of Accounting Research 47, 437–445. He, Z.,W. Xiong. 2011. Rollover risk and credit risk. Forthcoming, Journal of Finance. Helwege, J., F. Pacer. 2004. The decision to go public: evidence from mandatory SEC filings of private firms. Working Paper. Hermalin, B., M. Weisbach. 2007. Transparency and corporate governance. Working paper. Ho, T., H. Stoll. 1981. Optimal dealer pricing under transactions and return uncertainty. Journal of Financial Economics 9, 47-73. Hong, H., T. Lim, J. Stein. 1999. Bad news travels slowly: size, analyst coverage and profitability of momentum strategies.
Journal of Finance 55, 125-149. Hong, G., A. Warga. 2000. An empirical study of bond market transactions. Financial Analysts Journal 56, 32-46. Hostak, P., E. Karaoglu, T. Lys, Y. Yang. 2008. An examination of the impact of the Sarbanes-Oxley Act on the attractiveness of
US capital markets for foreign firms. Working paper. Hotchkiss, E., T. Ronen. 2002. The informational efficiency of the corporate bond market: an intraday analysis. Review of
Financial Studies 15, 1325-1354.

26
Huang, J., M. Huang. 2003. How much of corporate-treasury yield spread is due to credit risk: a new calibration approach. Working paper.
Huang, R., H. Stoll. 1997. The components of the bid-ask spread: a general approach. Review of Financial Studies 10, 995-1034. Iliev, P. 2010. The effect of the Sarbanes-Oxley Act (Section 404). Journal of Finance 65, 1163-1196. Ingersoll, J. 1977. A contingent-claims valuation of convertible securities. Journal of Financial Economics 4, 289-321. Ivashina, V., S. Zheng. 2010. Institutional stock trading on loan market information. Forthcoming in Journal of Financial
Economics. Jarrow, R., D. Lando, S. Turnbull. 1997. A Markov model for the term structure of credit spreads. Review of Financial Studies 10,
481-523. Jarrow, R., S. Turnbull. 1995. Pricing derivatives on financial securities subject to credit risk. Journal of Finance 50, 53-85. Kandel, E., N. Pearson. 1995. Differential interpretation of public signals and trade in speculative markets. Journal of Political
Economics 103, 831-872. Kang, Q., Q. Liu, R. Qi. 2010. The Sarbanes-Oxley Act and corporate investment: a structural assessment. Journal of Financial
Economics 96, 291-305. Ke, B., K. Petroni. 2004. How informed are actively trading institutional investors? Evidence from their trading behavior before a
break in a string of consecutive earnings increases. Journal of Accounting Research 42: 895–927. Kedia, S., X. Zhou. 2009. Insider trading and affiliated dealers: evidence from corporate bonds. Working paper. Kim, J., K. Ramaswamy, S. Sundaresan. 1993. Does default risk in Coupons affect the valuation of corporate bonds? Financial
Management 22, 117-131. Kim, W., M. Weisbach. 2008. Motivations for public equity offers: an international perspective. Journal of Financial Economic
87, 281-307. Kyle, A. 1985. Continuous auctions and insider trading. Econometrica 53, 1315-1336. Lando, D. 1997. Modeling bonds and derivatives with default risk, in M. Dempster and S. Pliska: Mathematics of Derivative
Securities, 369-393, Cambridge University Press, Cambridge, U.K. Leland, H. 1994. Corporate debt value, bond covenants, and optimal capital structure. Journal of Finance 49, 1213-1252. Leland, H. 1998. Agency costs, risk management, and capital structure. Journal of Finance 53, 1213-1242. Leland, H., K. Toft. 1996. Optimal capital structure, endogenous bankruptcy, and the term structure of credit spreads. Journal of
Finance 51, 987-1019. Leland, H., D. Pyle. 1977. Information asymmetries, financial structure, and financial intermediation. Journal of Finance 32,
371-387. Lesmond, D., J. Ogden, C. Trzcinka. 1999. A new estimate of transaction costs. Review of Financial Studies 12, 1113–1141. Leuz, C. 2007. Was the Sarbanes-Oxley Act of 2002 really this costly? A discussion of evidence from event returns and going-
private decisions. Journal of Accounting and Economics 44, 146-165. Longstaff, F., S. Mithal, E. Neis. 2005. Corporate yield spreads: default risk or liquidity? New evidence from the credit-default
swap market. Journal of Finance 60, 2213-2253. Longstaff, F., E. Schwartz. 1995. Valuing risky debt: a new approach. Journal of Finance 50, 789-820. Madan, D., H. Unal. 1998. Pricing the risks of default. Review of Derivative Research 2, 121-160. Madan, D., H. Unal. 2000. A two-factor hazard-rate model for pricing risky debt and the term structure of credit spreads. Journal
of Financial and Quantitative Analysis 35, 43-65. Madhavan, A., M. Richardson, M. Roomans. 1997. Why do security prices change? Review of Financial Studies 10, 1035-1064. Madhavan, A., S. Smidt. 1993. An analysis of daily changes in specialist inventories and quotations. Journal of Finance 48, 189-
210. Nashikkar, A., M. Subrahmanyam. 2006. Latent liquidity and corporate bond yield spreads. Working paper. Manconi, A., M. Massa. 2009. Keeping a foot in both camps: the governance role of institutional investors holding equity and
bonds of the same company. Working paper. Massa, M., A. Yasuda, L. Zhang. 2008. Institutional investors, credit supply uncertainties, and the Leverage of the firm. Working
paper. Mella-Barral, P., W. Perraudin. 1997. Strategic debt service. Journal of Finance 52, 531-566. Merton, R. 1974. On the pricing of corporate debt: the risk structure of interest rates. Journal of Finance 29, 449-470. Modigliani, F., M. Miller. 1963. Corporate income taxes and the cost of capital: a correction. American Economic Review 53,
433-443. Odders-White, E., M. Ready. 2005. Credit ratings and stock liquidity. Review of Financial Studies 19, 119-157. O’Hara, M. 1995. Market microstructure theory. Blackwell, Cambridge, MA. O’Hara, M. 2003. Presidential address: liquidity and price discovery. Journal of Finance 58, 1335-1354. O’Hara, M., G. Oldfield. 1986. The microeconomics of market making. Journal of Financial and Quantitative Analysis 21, 361-
376. Pagano, M., F. Panetta, and L. Zingales. 1998. Why do companies go public? An empirical analysis. Journal of Finance 53, 27-
64. Qian J., P. Strahan, J. Zhu. 2009. The economic benefits of the Sarbanes-Oxley Act? Evidence from a natural experiment.
Working paper. Scott, J. 1976. A theory of optimal capital structure. Bell Journal of Economics 7, 33-54.

27
Stoll, H. 1978. The supply of dealer services in securities markets. Journal of Finance 33, 1133-1151. Subrahmanyam, A., and S. Titman. 1999. The going-public decision and the development of financial markets. Journal of
Finance 54, 1045-1082. Tang, D., H. Yan. 2007. Liquidity and credit default swap spreads. Working paper. Thompson, S. 2009. Simple formulas for standard errors that cluster by both firm and time. Working paper. Van Ness, B., R. Van Ness, R. Warr. 2001. How well do adverse selection components measure adverse selection? Financial
Management 30, 77-98. Yu, F., 2005, Accounting transparency and the term structure of credit spreads. Journal of Financial Economics 75, 53-84. Zhang, I. 2007. Economic consequences of the Sarbanes-Oxley Act of 2002. Journal of Accounting and Economics 44, 74-115.

28
Appendix A
Estimating Default-Free Zero-Coupon Interest Rates by Using the Extended Nelson-Siegel Model
The extended Nelson-Siegel Model fits an exponential approximation of the discount rate function directly to observed bond
prices. In this model, the bond pricing function is simply
iM
m
mmrmii ecp
1
)(,ˆ
,
where c and m refer to the cash flow and its related time respectively. The discount rate function, r(m), takes the following
functional form:
2
21/
2
/
21
/
10 /
1
/
1)(
m
mm
em
e
m
emr
.
A set of parameters, ],,,,[ 21210 , is estimated using the following nonlinear constrained optimization
estimation procedure:
,)(min1
2
,,,, 21210
tN
iiiw
subject to
0)( min mr,
0)( max mr,
and
])(exp[])(exp[ 11 kkkk mmrmmr, maxmin mmm k
,
where
tN
jj
ii
d
dw
1
/1
/1
,
and
iii pp ˆ.
In this model, d denotes the Macaulay duration and i is the pricing error. With the estimates ]ˆ,ˆ,ˆ,ˆ,ˆ[ˆ21210 ,
the discount rate r(m), the default-free zero-coupon interest rate, and thereafter the price and the yield of the corresponding
default-free bonds can be readily calculated.
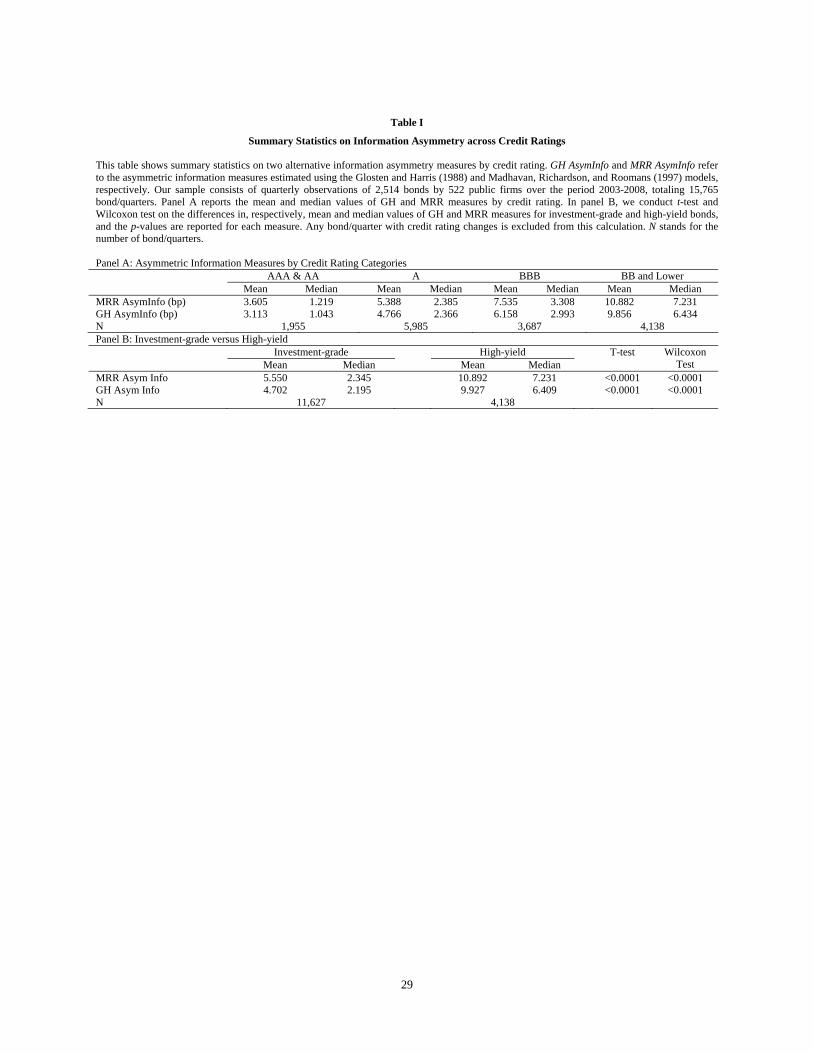
29
Table I Summary Statistics on Information Asymmetry across Credit Ratings
This table shows summary statistics on two alternative information asymmetry measures by credit rating. GH AsymInfo and MRR AsymInfo refer to the asymmetric information measures estimated using the Glosten and Harris (1988) and Madhavan, Richardson, and Roomans (1997) models, respectively. Our sample consists of quarterly observations of 2,514 bonds by 522 public firms over the period 2003-2008, totaling 15,765 bond/quarters. Panel A reports the mean and median values of GH and MRR measures by credit rating. In panel B, we conduct t-test and Wilcoxon test on the differences in, respectively, mean and median values of GH and MRR measures for investment-grade and high-yield bonds, and the p-values are reported for each measure. Any bond/quarter with credit rating changes is excluded from this calculation. N stands for the number of bond/quarters. Panel A: Asymmetric Information Measures by Credit Rating Categories AAA & AA A BBB BB and Lower Mean Median Mean Median Mean Median Mean Median MRR AsymInfo (bp) 3.605 1.219 5.388 2.385 7.535 3.308 10.882 7.231 GH AsymInfo (bp) 3.113 1.043 4.766 2.366 6.158 2.993 9.856 6.434 N 1,955 5,985 3,687 4,138 Panel B: Investment-grade versus High-yield Investment-grade High-yield T-test
Wilcoxon
Test Mean Median Mean Median MRR Asym Info 5.550 2.345 10.892 7.231 <0.0001 <0.0001 GH Asym Info 4.702 2.195 9.927 6.409 <0.0001 <0.0001 N 11,627 4,138

30
Table II Summary Statistics on Proxies for Information Uncertainty and Their Correlations with GH and MRR Measures
This table shows summary statistics on three sets of proxies for information uncertainty and their correlations with the GH and MRR measures. Panel A presents the frequency distribution of the number of rating agencies who rate a bond and the number of agencies assigning the same credit rating. Panels B and C present summary statistics on the proxies related to institutional holding and analyst coverage, respectively. Panel D provides the correlation coefficients and the associated p-values (in parentheses) between asymmetric information measures and these three sets proxies for information uncertainty. N. of Agencies and N. of Consistent Agencies refer to the number of total rating agencies and the number of agencies assigning the same rating, respectively; N. of Institutions is the number of institutional owners, and Herf is the Herfindahl index in institutional holding. Finally, N. of Analysts refers to the number of analysts following, and Dispersion is the standard deviation in the analyst forecasting. Panel A: Frequency Distribution of Number of Rating Agencies and Number of Agencies Assigning the Same Credit Rating
Distribution of N. of Rating Agencies Distribution of N. of Agencies Assigning the Same Credit Rating N. of Agencies Percentage of Sample (%) N. of Consistent Agencies Percentage of Sample (%)
0 1.85 1 25.82 1 1.22 2 53.46 2 12.42 3 20.72 3 84.51
Panel B: Summary Statistics on Institutional Holding Lower Quartile Median Upper Quartile Mean Std Dev
N. of Institutions 44 87 140 103 81 Herf 0.04 0.06 0.11 0.12 0.17
Panel C: Summary Statistics on Analyst Coverage Lower Quartile Median Upper Quartile Mean Std Dev N. ofAnalysts 10 15 19 15 7 Dispersion 0.03 0.06 0.13 0.19 0.51 Panel D: Measures of Information Asymmetry and Proxies for Uncertainty
N. of Agencies N. of Consistent
Agencies N. of Institutions Herf N. ofAnalysts Dispersion
MRR AsymInfo -0.05 -0.06 -0.07 0.05 -0.08 0.03 <.0001 <.0001 <.0001 <.0001 <.0001 0.0035
GH AsymInfo -0.04 -0.06 -0.07 0.05 -0.08 0.04 <.0001 <.0001 <.0001 <.0001 <.0001 0.0002

31
Table III Information Asymmetry and Trade Size
This table analyzes the effect of trade size on the degree of information asymmetry in bond trading. In Panel A, the coefficient for trade size in
determining the information component of bid-ask spread as modeled by GH, that is, 1z in equation (1c), is estimated both with and without large
trades that are subject to TRACE cap. In addition, we modify MRR model to account for a linear size effect, and the estimate of the size
coefficient 1 in equation (2’a) is also included. In panel B, we modify MRR model to account for a non-linear size effect, and estimate the
information effect for large, medium, and small bond trades separately. For a bond/quarter to be included in this examination, we impose the restriction that there are at least 20 trades in each size category, with the total number of trades still being 60 as required in the data description
section. The mean and median values (together with their p-values) are presented for the coefficientssz ,
mz , and lz in equation (2”a). We also
conduct t-test and Wilcoxon test for each pair-wise comparison in these coefficients from different trade size groups and the p-values are presented in the bottom part of panel B. Panel A: The Coefficient of Size in the Information Effect Determination Equations
GH Model without Trades subject to Cap GH Model with all Trades Modified MRR Model (2’) Estimate P-value Estimate P-value Estimate P-value
0.007 0.0377 0.007 0.0002 0.0188 <0.0001 Panel B: Information Asymmetry across Difference Trade Size Groups
Large Trades Medium Small Mean Median Mean Median Mean Median
Estimate 0.035083 0.023081 0.013611 0.006613 0.015227 0.008466 p-value <0.0001 <0.0001 <0.0001 <0.0001 <0.0001 <0.0001 Large vs. Medium Large vs. Small Medium vs. Small T-test Wilcoxon Test T-test Wilcoxon Test T-test Wilcoxon Test p-value <0.0001 <0.0001 <0.0001 <0.0001 0.6078 0.2379
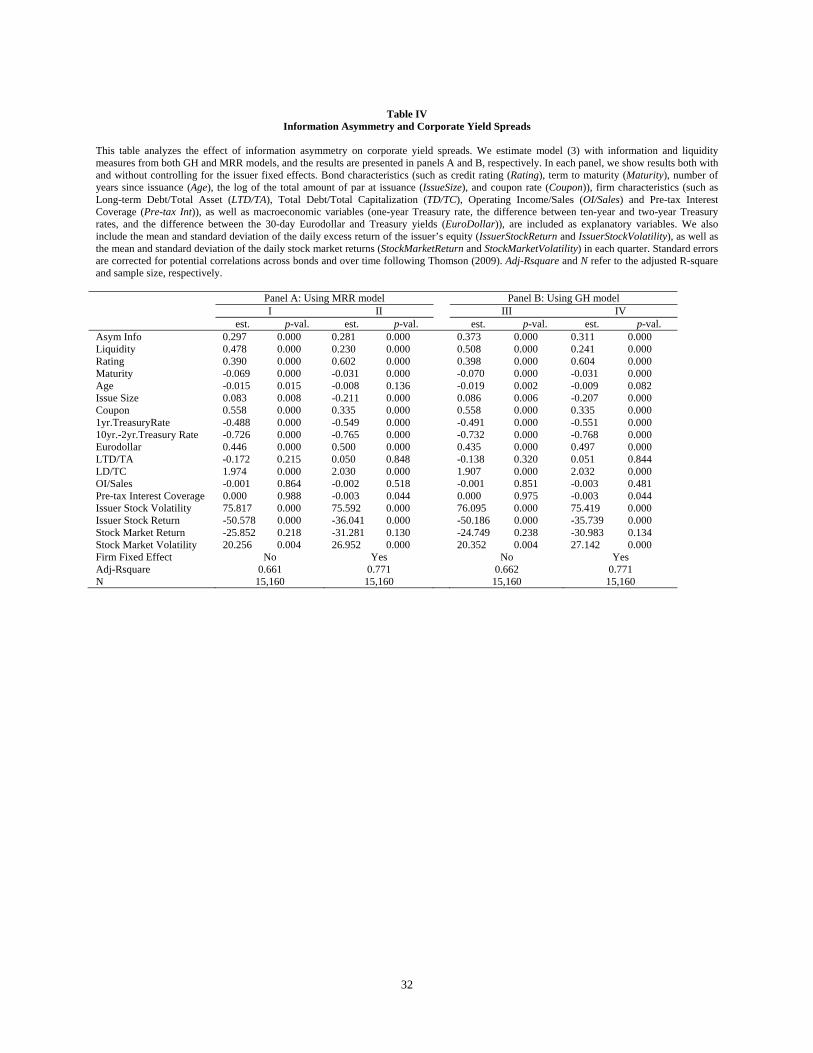
32
Table IV
Information Asymmetry and Corporate Yield Spreads This table analyzes the effect of information asymmetry on corporate yield spreads. We estimate model (3) with information and liquidity measures from both GH and MRR models, and the results are presented in panels A and B, respectively. In each panel, we show results both with and without controlling for the issuer fixed effects. Bond characteristics (such as credit rating (Rating), term to maturity (Maturity), number of years since issuance (Age), the log of the total amount of par at issuance (IssueSize), and coupon rate (Coupon)), firm characteristics (such as Long-term Debt/Total Asset (LTD/TA), Total Debt/Total Capitalization (TD/TC), Operating Income/Sales (OI/Sales) and Pre-tax Interest Coverage (Pre-tax Int)), as well as macroeconomic variables (one-year Treasury rate, the difference between ten-year and two-year Treasury rates, and the difference between the 30-day Eurodollar and Treasury yields (EuroDollar)), are included as explanatory variables. We also include the mean and standard deviation of the daily excess return of the issuer’s equity (IssuerStockReturn and IssuerStockVolatility), as well as the mean and standard deviation of the daily stock market returns (StockMarketReturn and StockMarketVolatility) in each quarter. Standard errors are corrected for potential correlations across bonds and over time following Thomson (2009). Adj-Rsquare and N refer to the adjusted R-square and sample size, respectively. Panel A: Using MRR model Panel B: Using GH model I II III IV est. p-val. est. p-val. est. p-val. est. p-val. Asym Info 0.297 0.000 0.281 0.000 0.373 0.000 0.311 0.000 Liquidity 0.478 0.000 0.230 0.000 0.508 0.000 0.241 0.000 Rating 0.390 0.000 0.602 0.000 0.398 0.000 0.604 0.000 Maturity -0.069 0.000 -0.031 0.000 -0.070 0.000 -0.031 0.000 Age -0.015 0.015 -0.008 0.136 -0.019 0.002 -0.009 0.082 Issue Size 0.083 0.008 -0.211 0.000 0.086 0.006 -0.207 0.000 Coupon 0.558 0.000 0.335 0.000 0.558 0.000 0.335 0.000 1yr.TreasuryRate -0.488 0.000 -0.549 0.000 -0.491 0.000 -0.551 0.000 10yr.-2yr.Treasury Rate -0.726 0.000 -0.765 0.000 -0.732 0.000 -0.768 0.000 Eurodollar 0.446 0.000 0.500 0.000 0.435 0.000 0.497 0.000 LTD/TA -0.172 0.215 0.050 0.848 -0.138 0.320 0.051 0.844 LD/TC 1.974 0.000 2.030 0.000 1.907 0.000 2.032 0.000 OI/Sales -0.001 0.864 -0.002 0.518 -0.001 0.851 -0.003 0.481 Pre-tax Interest Coverage 0.000 0.988 -0.003 0.044 0.000 0.975 -0.003 0.044 Issuer Stock Volatility 75.817 0.000 75.592 0.000 76.095 0.000 75.419 0.000 Issuer Stock Return -50.578 0.000 -36.041 0.000 -50.186 0.000 -35.739 0.000 Stock Market Return -25.852 0.218 -31.281 0.130 -24.749 0.238 -30.983 0.134 Stock Market Volatility 20.256 0.004 26.952 0.000 20.352 0.004 27.142 0.000 Firm Fixed Effect No Yes No Yes Adj-Rsquare 0.661 0.771 0.662 0.771 N 15,160 15,160 15,160 15,160
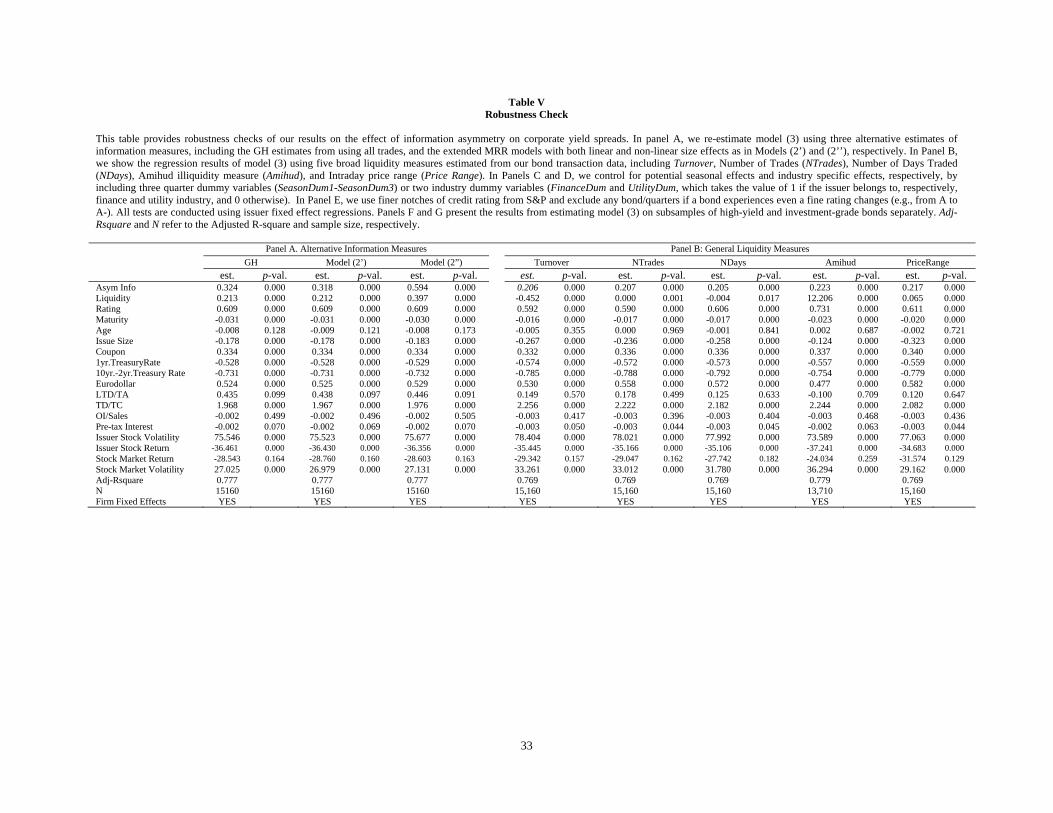
33
Table V Robustness Check
This table provides robustness checks of our results on the effect of information asymmetry on corporate yield spreads. In panel A, we re-estimate model (3) using three alternative estimates of information measures, including the GH estimates from using all trades, and the extended MRR models with both linear and non-linear size effects as in Models (2’) and (2’’), respectively. In Panel B, we show the regression results of model (3) using five broad liquidity measures estimated from our bond transaction data, including Turnover, Number of Trades (NTrades), Number of Days Traded (NDays), Amihud illiquidity measure (Amihud), and Intraday price range (Price Range). In Panels C and D, we control for potential seasonal effects and industry specific effects, respectively, by including three quarter dummy variables (SeasonDum1-SeasonDum3) or two industry dummy variables (FinanceDum and UtilityDum, which takes the value of 1 if the issuer belongs to, respectively, finance and utility industry, and 0 otherwise). In Panel E, we use finer notches of credit rating from S&P and exclude any bond/quarters if a bond experiences even a fine rating changes (e.g., from A to A-). All tests are conducted using issuer fixed effect regressions. Panels F and G present the results from estimating model (3) on subsamples of high-yield and investment-grade bonds separately. Adj-Rsquare and N refer to the Adjusted R-square and sample size, respectively.
Panel A. Alternative Information Measures Panel B: General Liquidity Measures
GH Model (2’) Model (2”) Turnover NTrades NDays Amihud PriceRange
est. p-val. est. p-val. est. p-val. est. p-val. est. p-val. est. p-val. est. p-val. est. p-val. Asym Info 0.324 0.000 0.318 0.000 0.594 0.000 0.206 0.000 0.207 0.000 0.205 0.000 0.223 0.000 0.217 0.000 Liquidity 0.213 0.000 0.212 0.000 0.397 0.000 -0.452 0.000 0.000 0.001 -0.004 0.017 12.206 0.000 0.065 0.000 Rating 0.609 0.000 0.609 0.000 0.609 0.000 0.592 0.000 0.590 0.000 0.606 0.000 0.731 0.000 0.611 0.000 Maturity -0.031 0.000 -0.031 0.000 -0.030 0.000 -0.016 0.000 -0.017 0.000 -0.017 0.000 -0.023 0.000 -0.020 0.000 Age -0.008 0.128 -0.009 0.121 -0.008 0.173 -0.005 0.355 0.000 0.969 -0.001 0.841 0.002 0.687 -0.002 0.721 Issue Size -0.178 0.000 -0.178 0.000 -0.183 0.000 -0.267 0.000 -0.236 0.000 -0.258 0.000 -0.124 0.000 -0.323 0.000 Coupon 0.334 0.000 0.334 0.000 0.334 0.000 0.332 0.000 0.336 0.000 0.336 0.000 0.337 0.000 0.340 0.000 1yr.TreasuryRate -0.528 0.000 -0.528 0.000 -0.529 0.000 -0.574 0.000 -0.572 0.000 -0.573 0.000 -0.557 0.000 -0.559 0.000 10yr.-2yr.Treasury Rate -0.731 0.000 -0.731 0.000 -0.732 0.000 -0.785 0.000 -0.788 0.000 -0.792 0.000 -0.754 0.000 -0.779 0.000 Eurodollar 0.524 0.000 0.525 0.000 0.529 0.000 0.530 0.000 0.558 0.000 0.572 0.000 0.477 0.000 0.582 0.000 LTD/TA 0.435 0.099 0.438 0.097 0.446 0.091 0.149 0.570 0.178 0.499 0.125 0.633 -0.100 0.709 0.120 0.647 TD/TC 1.968 0.000 1.967 0.000 1.976 0.000 2.256 0.000 2.222 0.000 2.182 0.000 2.244 0.000 2.082 0.000 OI/Sales -0.002 0.499 -0.002 0.496 -0.002 0.505 -0.003 0.417 -0.003 0.396 -0.003 0.404 -0.003 0.468 -0.003 0.436 Pre-tax Interest -0.002 0.070 -0.002 0.069 -0.002 0.070 -0.003 0.050 -0.003 0.044 -0.003 0.045 -0.002 0.063 -0.003 0.044 Issuer Stock Volatility 75.546 0.000 75.523 0.000 75.677 0.000 78.404 0.000 78.021 0.000 77.992 0.000 73.589 0.000 77.063 0.000 Issuer Stock Return -36.461 0.000 -36.430 0.000 -36.356 0.000 -35.445 0.000 -35.166 0.000 -35.106 0.000 -37.241 0.000 -34.683 0.000 Stock Market Return -28.543 0.164 -28.760 0.160 -28.603 0.163 -29.342 0.157 -29.047 0.162 -27.742 0.182 -24.034 0.259 -31.574 0.129 Stock Market Volatility 27.025 0.000 26.979 0.000 27.131 0.000 33.261 0.000 33.012 0.000 31.780 0.000 36.294 0.000 29.162 0.000 Adj-Rsquare 0.777 0.777 0.777 0.769 0.769 0.769 0.779 0.769 N 15160 15160 15160 15,160 15,160 15,160 13,710 15,160 Firm Fixed Effects YES YES YES YES YES YES YES YES
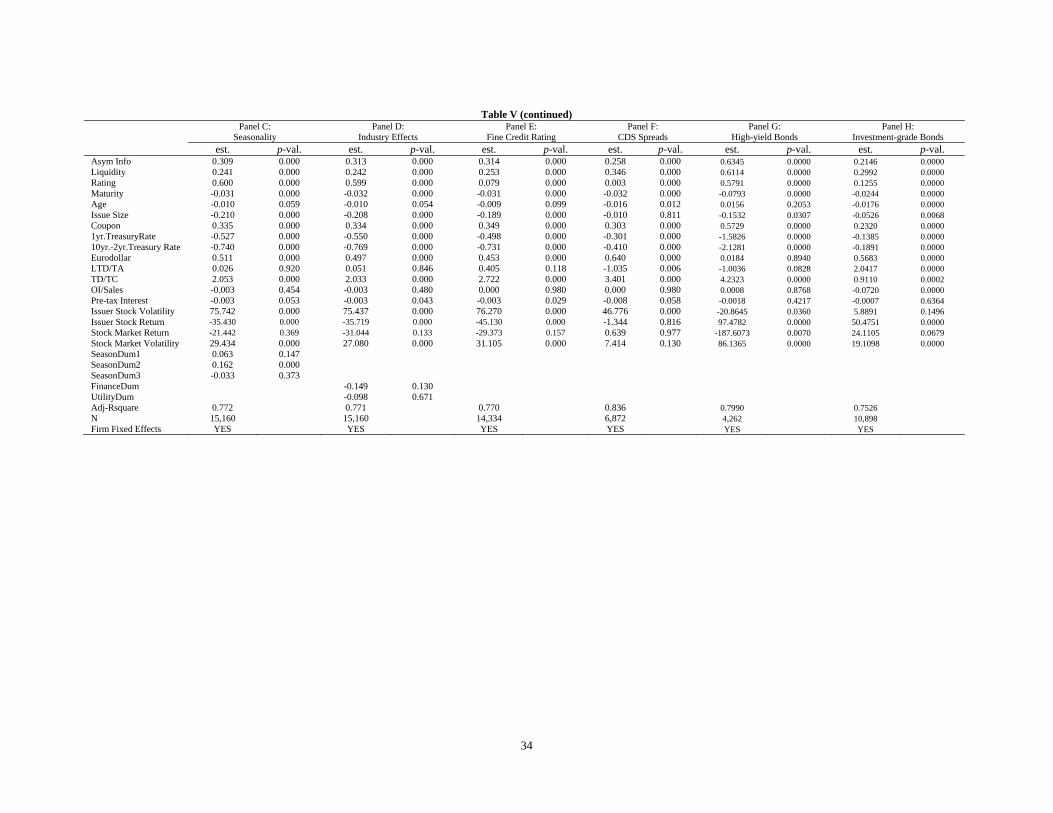
34
Table V (continued)
Panel C: Seasonality
Panel D: Industry Effects
Panel E: Fine Credit Rating
Panel F: CDS Spreads
Panel G: High-yield Bonds
Panel H: Investment-grade Bonds
est. p-val. est. p-val. est. p-val. est. p-val. est. p-val. est. p-val. Asym Info 0.309 0.000 0.313 0.000 0.314 0.000 0.258 0.000 0.6345 0.0000 0.2146 0.0000 Liquidity 0.241 0.000 0.242 0.000 0.253 0.000 0.346 0.000 0.6114 0.0000 0.2992 0.0000 Rating 0.600 0.000 0.599 0.000 0.079 0.000 0.003 0.000 0.5791 0.0000 0.1255 0.0000 Maturity -0.031 0.000 -0.032 0.000 -0.031 0.000 -0.032 0.000 -0.0793 0.0000 -0.0244 0.0000 Age -0.010 0.059 -0.010 0.054 -0.009 0.099 -0.016 0.012 0.0156 0.2053 -0.0176 0.0000 Issue Size -0.210 0.000 -0.208 0.000 -0.189 0.000 -0.010 0.811 -0.1532 0.0307 -0.0526 0.0068 Coupon 0.335 0.000 0.334 0.000 0.349 0.000 0.303 0.000 0.5729 0.0000 0.2320 0.0000 1yr.TreasuryRate -0.527 0.000 -0.550 0.000 -0.498 0.000 -0.301 0.000 -1.5826 0.0000 -0.1385 0.0000 10yr.-2yr.Treasury Rate -0.740 0.000 -0.769 0.000 -0.731 0.000 -0.410 0.000 -2.1281 0.0000 -0.1891 0.0000 Eurodollar 0.511 0.000 0.497 0.000 0.453 0.000 0.640 0.000 0.0184 0.8940 0.5683 0.0000 LTD/TA 0.026 0.920 0.051 0.846 0.405 0.118 -1.035 0.006 -1.0036 0.0828 2.0417 0.0000 TD/TC 2.053 0.000 2.033 0.000 2.722 0.000 3.401 0.000 4.2323 0.0000 0.9110 0.0002 OI/Sales -0.003 0.454 -0.003 0.480 0.000 0.980 0.000 0.980 0.0008 0.8768 -0.0720 0.0000 Pre-tax Interest -0.003 0.053 -0.003 0.043 -0.003 0.029 -0.008 0.058 -0.0018 0.4217 -0.0007 0.6364 Issuer Stock Volatility 75.742 0.000 75.437 0.000 76.270 0.000 46.776 0.000 -20.8645 0.0360 5.8891 0.1496 Issuer Stock Return -35.430 0.000 -35.719 0.000 -45.130 0.000 -1.344 0.816 97.4782 0.0000 50.4751 0.0000 Stock Market Return -21.442 0.369 -31.044 0.133 -29.373 0.157 0.639 0.977 -187.6073 0.0070 24.1105 0.0679 Stock Market Volatility 29.434 0.000 27.080 0.000 31.105 0.000 7.414 0.130 86.1365 0.0000 19.1098 0.0000 SeasonDum1 0.063 0.147 SeasonDum2 0.162 0.000 SeasonDum3 -0.033 0.373 FinanceDum -0.149 0.130 UtilityDum -0.098 0.671 Adj-Rsquare 0.772 0.771 0.770 0.836 0.7990 0.7526 N 15,160 15,160 14,334 6,872 4,262 10,898 Firm Fixed Effects YES YES YES YES YES YES

35
Table VI Informed Trading around Credit Rating Changes
This table examines the degree of information asymmetry around credit rating changes. Panel A compares the asymmetric information measures during quarters without any credit rating changes to those with one credit rating change (either an upgrade or a downgrade). For the sample of bond/quarters with one credit rating change, panel B examines the differences in the asymmetric information measures between upgrades and downgrades. In panel C, we compare the degree of information asymmetry around upgrades to that during periods without any rating change. For all panels, we report the p-values of the t-test and the Wilcoxon test for the differences in the mean and median values, respectively. Panel A: Periods with rating changes versus those without Without Rating Changes With Rating Changes T-test Wilcoxon
Test Mean Median Mean Median MRR Asym Info 7.111 3.364 8.741 4.665 0.081 0.054 GH Asym Info 6.223 3.037 8.008 3.642 0.045 0.036 N Bonds 2,514 540 N Firms 522 136 Panel B: Upgrades versus downgrades Upgrade Downgrade T-test Wilcoxon
Test Mean Median Mean Median MRR Asym Info 8.153 3.913 10.792 5.464 0.160 0.048 GH Asym Info 8.216 3.268 9.436 3.793 0.298 0.090 N Bonds 221 379 N Firms 75 89 Panel C: No rating changes versus upgrades Upgrade No Rating Changes T-test Wilcoxon
Test Mean Median Mean Median MRR Asym Info 8.153 3.913 7.111 3.364 0.0727 0.1058 GH Asym Info 8.216 3.268 6.223 3.037 0.0213 0.0525 N Bonds 221 2,514 N Firms 75 522

36
Table VII Two-Stage Least Square (2-SLS) Regression Analysis on Information Effects
This table reports the results of instrumental variable (IV) estimations based on the two-stage least squares regression method. The results from the first stage and second stage regressions are presented in Panels A and B, respectively. In the first stage, the dependent variable (Asym Info) is the asymmetry information measure estimated using the MRR model. In the second stage, the dependent variable is yield spread. We use three alternative sets of IVs (included in the first stage regressions). The first set contains two variables calculated using the credit ratings a bond receives from different rating agencies, including the (log of) number of rating agencies (N. of Agencies) and the (log of) number of agencies with the same rating (N. of Consistent Agencies). The second set of instrument variables are the (log of) number of institutional owners (N. of Institutions) and the degree of concentration measures by the Herfindahl index in institutional holding (Herf). The last set of instrument variables includes the (log of) number of analyst following (N. of Analysts) and the dispersions of earnings forecasts (Dispersion). Liquidity refers to the MRR liquidity cost measure. Bond characteristics (such as credit rating (Rating), term to maturity (Maturity), number of years since issuance (Age), the log of the total amount of par at issuance (IssueSize), and coupon rate (Coupon)), firm characteristics (such as Long-term Debt/Total Asset (LTD/TA), Total Debt/Total Capitalization (TD/TC), Operating Income/Sales (OI/Sales) and Pre-tax Interest Coverage (Pre-tax Int)), as well as macroeconomic variables (one-year Treasury rate, the difference between ten-year and two-year Treasury rates, and the difference between the 30-day Eurodollar and Treasury yields (EuroDollar)), are included as explanatory variables. We also include the mean and standard deviation of the daily excess return of the issuer’s equity (IssuerStockReturn and IssuerStockVolatility), as well as the mean and standard deviation of the daily stock market returns (StockMarketReturn and StockMarketVolatility) in each quarter. Adj-Rsquare and N refer to the adjusted R-square and sample size, respectively. Panel A: First Stage Results Panel B: Second Stage Results Instruments from
Credit Ratings Instruments from Inst.
Holdings Instruments from Analyst
Coverage Instruments from
Credit Ratings Instruments from Inst.
Holdings Instruments from Analyst Coverage
est. p-val. est. p-val. est. p-val. est. p-val. est. p-val. est. p-val. Intercept 0.096 0.023 0.062 0.121 0.115 0.032 -4.313 <.0001 -4.020 <.0001 -4.456 <.0001 N. of Agencies 0.011 0.448 N. of Consistent Agencies -0.029 <.0001
N. of Institutions -0.000 <.0001 Herf 0.087 <.0001 N. of Analysts -0.023 0.000 Dispersion 0.017 0.008 Asym Info 1.127 0.000 1.138 <.0001 2.167 <.0001 Liquidity -0.045 <.0001 -0.053 <.0001 -0.053 <.0001 1.117 <.0001 1.125 <.0001 1.616 <.0001 Rating 0.019 <.0001 0.019 <.0001 0.016 <.0001 0.410 <.0001 0.357 <.0001 0.128 0.256 Maturity 0.004 <.0001 0.004 <.0001 0.004 <.0001 -0.118 <.0001 -0.126 <.0001 -0.151 <.0001 Age 0.003 <.0001 0.003 0.000 0.005 <.0001 -0.064 <.0001 -0.076 <.0001 -0.111 0.001 Issue Size -0.056 <.0001 -0.020 0.002 -0.052 <.0001 0.647 0.000 0.648 <.0001 1.334 <.0001 Coupon 0.004 0.020 0.006 0.000 0.002 0.316 0.501 <.0001 0.563 <.0001 0.574 <.0001 1yr.TreasuryRate -0.033 <.0001 -0.030 0.000 -0.023 0.019 -0.161 0.258 -0.244 0.027 -0.049 0.844 10yr.-2yr.Treasury Rate -0.039 0.002 -0.031 0.015 -0.024 0.133
-0.251 0.207 -0.387 0.023 -0.170 0.649
Eurodollar 0.025 0.004 0.028 0.002 0.005 0.677 0.519 <.0001 0.489 <.0001 0.442 0.071 LTD/TA -0.072 <.0001 -0.032 0.068 -0.030 0.254 0.731 0.023 0.559 0.018 0.701 0.248 LD/TC 0.102 <.0001 0.058 0.001 0.043 0.064 1.482 0.000 1.733 <.0001 1.340 0.029 OI/Sales 0.000 0.846 0.000 0.796 0.002 0.319 -0.006 0.389 -0.008 0.298 -0.125 0.011 Pre-tax Interest Coverage 0.000 0.633 0.000 0.590 0.000 0.383
0.001 0.676 0.000 0.964 -0.002 0.630
Issuer Stock Return -5.456 <.0001 -5.200 <.0001 -3.152 0.005 -6.261 0.759 -17.326 0.210 -5.132 0.866 Stock Market Return -3.946 0.305 -3.127 0.421 0.407 0.934 -27.311 0.584 -40.942 0.415 -61.932 0.569 Stock Market Volatility 4.672 <.0001 5.078 <.0001 7.146 <.0001
-3.817 0.828 -4.959 0.697 -85.979 0.035
Adj-Rsquare 0.060 0.064 0.062 0.306 0.300 0.121 N 14,891 14,729 9,588 14,891 14,729 9,588

37
Table VIII Differences in Information, Liquidity, and Other Characteristics between Bonds Issued by Public versus Private Firms
This table provides summary information on bonds issued by public and private firms. In addition to the information measures estimated from the GH and MRR models, we also include broad liquidity measures (including Turnover, Amihud, Price Rang, Number of Trades, and Number of Days Traded), and other bond characteristics, such as credit rating, coupon rate, issue size, and time to maturity at issuance. We also report the p-values of the t-test and the Wilcoxon test for the differences between bonds by public and private firms. N Bonds and N Firms refer to the number of bonds and number of firms in each sub-sample, respectively. Public Firms Private Firms T-test Wilcoxon
Test Mean Median Mean Median MRR Asym Info (bp) 6.969 3.385 9.671 5.146 <0.0001 <0.0001 GH Asym Info (bp) 6.144 3.080 8.855 4.698 <0.0001 <0.0001 Turnover 0.211 0.149 0.184 0.119 <0.0001 <0.0001 Amiud 0.008 0.004 0.017 0.005 <0.0001 <0.0001 Price Range (%) 1.493 1.158 1.714 1.484 <0.0001 <0.0001 Number of Trades 367.462 195.000 303.675 165.000 <0.0001 <0.0001 Number of Days Traded 49.407 51.000 46.801 47.000 <0.0001 <0.0001 Credit Rating 3.882 3.000 4.549 5.000 <0.0001 <0.0001 Issue Size ($ Billions) 0.611 0.500 0.425 0.166 <0.0001 <0.0001 Coupon Rate (%) 6.081 6.125 6.700 6.750 <0.0001 <0.0001 Time to Maturity at Issuance (Years) 12.068 10.016 10.893 10.003 <0.0001 <0.0001 N Bonds 3,338 1,242 N Firms 715 267

38
Table IX The Impact of the Issuer’s Public Status on the Effects of Informed Trading in Bonds
This table studies whether having publicly traded stocks matters for the effect of informed trading on bond yield spreads. Regression results of Model (4) using GH and MRR information measures are presented in Panels A and B, respectively. The dependent variable is yield spread for all model specifications. Publicdum takes the value 1 if the issuer of the bond is a publicly-held firm, and 0 otherwise. Other independent variables are defined as in Table IV. In each panel, we provide four tests of Model (4) by using alternative liquidity measures. All tests are conducted using issuer fixed effect regressions. Adj-Rsquare and N refer to the adjusted R-square and sample size, respectively. Panel A: Using MRR Model Panel B: Using GH Model I. Inventory Cost II.Turnover III.Amihud IV.Price Range I. Inventory Cost II.Turnover III.Amihud IV.Price Range est. p-val. est. p-val. est. p-val. est. p-val. est. p-val. est. p-val. est. p-val. est. p-val. Asym Info 0.722 0.000 0.584 0.000 0.628 0.000 0.587 0.000 0.666 0.000 0.531 0.000 0.654 0.000 0.543 0.000 Liquidity 0.519 0.000 0.851 0.000 10.414 0.000 0.481 0.000 0.533 0.000 0.854 0.000 10.427 0.000 0.482 0.000 Rating 2.492 0.000 2.573 0.000 1.849 0.000 2.533 0.000 2.495 0.000 2.575 0.000 1.850 0.000 2.534 0.000 Maturity -0.074 0.000 -0.037 0.000 -0.042 0.000 -0.070 0.000 -0.075 0.000 -0.037 0.000 -0.042 0.000 -0.070 0.000 Age -0.059 0.000 -0.046 0.001 -0.020 0.174 -0.066 0.000 -0.059 0.000 -0.046 0.000 -0.019 0.184 -0.066 0.000 Issue Size -0.098 0.000 -0.400 0.000 -0.150 0.006 -0.628 0.000 -0.115 0.019 -0.405 0.000 -0.151 0.005 -0.633 0.000 Coupon 0.290 0.000 0.321 0.000 0.386 0.000 0.278 0.000 0.283 0.000 0.321 0.000 0.385 0.000 0.278 0.000 1yr.TreasuryRate -1.412 0.000 -1.640 0.000 -1.137 0.000 -1.398 0.000 -1.437 0.000 -1.646 0.000 -1.137 0.000 -1.402 0.000 10yr.-2yr.Treasury Rate -1.609 0.000 -1.947 0.000 -1.236 0.000 -1.662 0.000 -1.662 0.000 -1.952 0.000 -1.235 0.000 -1.665 0.000 Eurodollar 2.292 0.000 2.594 0.000 2.397 0.000 2.507 0.000 2.276 0.000 2.603 0.000 2.398 0.000 2.515 0.000 Publicdum*Asym Info -0.215 0.008 -0.230 0.004 -0.275 0.014 -0.229 0.004 -0.201 0.021 -0.208 0.017 -0.272 0.030 -0.213 0.014 Publicdum*Liquidity -0.110 0.005 -0.666 0.000 7.547 0.000 -0.208 0.000 -0.124 0.001 -0.667 0.000 7.564 0.000 -0.209 0.000 Publicdum*Rating -1.789 0.000 -1.853 0.000 -1.022 0.000 -1.813 0.000 -1.804 0.000 -1.855 0.000 -1.023 0.000 -1.814 0.000 Publicdum*Maturity 0.026 0.000 0.016 0.003 0.011 0.089 0.034 0.000 0.027 0.000 0.016 0.003 0.011 0.088 0.035 0.000 Publicdum *Age 0.041 0.004 0.044 0.002 0.015 0.340 0.057 0.000 0.044 0.002 0.044 0.002 0.015 0.344 0.058 0.000 Publicdum*Issue Size -0.014 0.654 0.107 0.057 0.062 0.329 0.200 0.000 -0.015 0.788 0.110 0.051 0.062 0.323 0.204 0.000 Publicdum*Coupon 0.060 0.040 0.036 0.225 -0.020 0.567 0.084 0.004 0.066 0.024 0.036 0.226 -0.019 0.582 0.084 0.004 Publicdum*1yr.TreasuryRate 0.803 0.000 0.978 0.000 0.452 0.000 0.787 0.000 0.825 0.000 0.981 0.000 0.452 0.000 0.789 0.000 Publicdum*(10yr.-2yr.Treas) 0.957 0.000 1.248 0.000 0.518 0.003 0.977 0.000 1.000 0.000 1.251 0.000 0.516 0.003 0.977 0.000 Publicdum*Eurodollar -0.691 0.000 -0.744 0.000 -0.693 0.000 -0.757 0.000 -0.682 0.000 -0.749 0.000 -0.692 0.000 -0.762 0.000 Adj-Rsquare 0.750 0.742 0.756 0.748 0.749 0.742 0.756 0.748 N 27,544 27,544 22,574 27,544 27,544 27,544 22,574 27,544
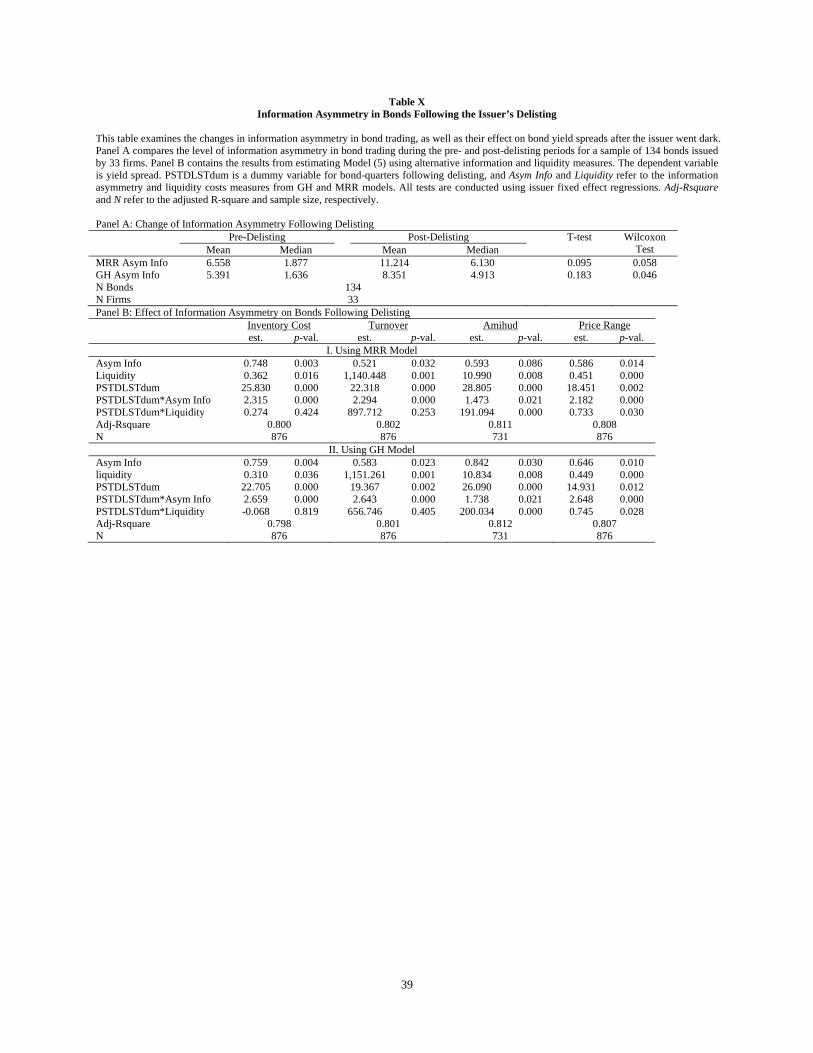
39
Table X Information Asymmetry in Bonds Following the Issuer’s Delisting
This table examines the changes in information asymmetry in bond trading, as well as their effect on bond yield spreads after the issuer went dark. Panel A compares the level of information asymmetry in bond trading during the pre- and post-delisting periods for a sample of 134 bonds issued by 33 firms. Panel B contains the results from estimating Model (5) using alternative information and liquidity measures. The dependent variable is yield spread. PSTDLSTdum is a dummy variable for bond-quarters following delisting, and Asym Info and Liquidity refer to the information asymmetry and liquidity costs measures from GH and MRR models. All tests are conducted using issuer fixed effect regressions. Adj-Rsquare and N refer to the adjusted R-square and sample size, respectively. Panel A: Change of Information Asymmetry Following Delisting Pre-Delisting Post-Delisting T-test Wilcoxon
Test Mean Median Mean Median MRR Asym Info 6.558 1.877 11.214 6.130 0.095 0.058 GH Asym Info 5.391 1.636 8.351 4.913 0.183 0.046 N Bonds 134 N Firms 33 Panel B: Effect of Information Asymmetry on Bonds Following Delisting Inventory Cost Turnover Amihud Price Range est. p-val. est. p-val. est. p-val. est. p-val.
I. Using MRR Model Asym Info 0.748 0.003 0.521 0.032 0.593 0.086 0.586 0.014 Liquidity 0.362 0.016 1,140.448 0.001 10.990 0.008 0.451 0.000 PSTDLSTdum 25.830 0.000 22.318 0.000 28.805 0.000 18.451 0.002 PSTDLSTdum*Asym Info 2.315 0.000 2.294 0.000 1.473 0.021 2.182 0.000 PSTDLSTdum*Liquidity 0.274 0.424 897.712 0.253 191.094 0.000 0.733 0.030 Adj-Rsquare 0.800 0.802 0.811 0.808 N 876 876 731 876
II. Using GH Model Asym Info 0.759 0.004 0.583 0.023 0.842 0.030 0.646 0.010 liquidity 0.310 0.036 1,151.261 0.001 10.834 0.008 0.449 0.000 PSTDLSTdum 22.705 0.000 19.367 0.002 26.090 0.000 14.931 0.012 PSTDLSTdum*Asym Info 2.659 0.000 2.643 0.000 1.738 0.021 2.648 0.000 PSTDLSTdum*Liquidity -0.068 0.819 656.746 0.405 200.034 0.000 0.745 0.028 Adj-Rsquare 0.798 0.801 0.812 0.807 N 876 876 731 876