informal regulation of industrial pollutionlo developing ...€¦ · free from the world bank, 1818...
TRANSCRIPT

POLICY RESEARCH WORKING PAPER
v ' t < '; ts - ~~~ ~~**~~ .. . -s
- ~~~~~~~~~~~~~~~Z4. &~~~~~
Informal Regulationof Industrial Pollutionlo * * _eeuae;omndsFnt-<
in Developing Countries
Evidence from Indonesia
Sheoli Pargal David Wh,eeler
e"rnmet and Agriae DivWonFdxuary 199S
POLICY RESEARCH WORKING PAPER 1416
Summary findingsPargal and Wheeler tcst a model of supply-demand lower in poorer, less-educated communities. Thus, therclations in an implicit market for environmental services intensity of pollution is far higher in such communities.when formal regulation is absent. While it would be premature to generalize from these
Thcy use plant-level data from Indoncsia for 1989-90, results, they suggest that the model of optimal pollutionbefore the advent of nationwide environmental control in environmental economics is more relevant forregulation. Treating pollution as a derived demand for developing countries than many have believed.environmental services, their model relates emissions of Community-factory interactions seem to reflectbiological oxygen demand to the price (expected cost) of environmental supply-demand considerations even whenpollution; to prices of other inputs (labor, energy, formal regulation does not exist.materials); and to enterprise characteristics that may In addition, the apparent power of informal regulationaffect pollution demand, including scale, vintage, implies that cost-effective formal systems should beownership, and efficiency. designed to complement, not supplant, community
The price of pollution is determined by the control. In particular:intersection of plant-level demand and a local * Local communities should not be forced to rely soenvironmental supply function, enforced by community heavily on visibility when judging environmentalpressure or informal regulation. Environmental supply is performance. Formal regulation should includeaffected by community income, education, the size of the publication of audited em.iissions reports from factories.exposed population, the local economic importance of * Environmental injustice may be real and important.the plant, and its visibility as a polluter. Many poor, uneducated communities may need extra
Their results are strongly consistent with the existence support from national regulators.of an informal 'pollution equilibrium." Pollution * However, appropriate regulation should strike theintensity declines witm increases in plant size, efficiency, t ight balance between equity and efficiency. Uniformand local materials prices. Older plants and publicly national standards go too far because thev eliminate allowned facilities are more pollution-intensive; the natural and legitimate 'egional diversity that is alsomultinational ownership has oo independent effect. reflected in informal arrangements.
The results also suggest that the price of pollution ishigher when plants are particularly visible and is far
This paper - a product of the Environment, Infrastructure, and Agriculture Division, Policy Research Departmnent - ispart of a larger effort in the department to understand variations in pollution across firms. Copies of the paper are availablefree from the World Bank, 1818 H Street NW. Washington, DC 20433. Please contact Elizabeth Scihaper, room N10-037,extension 33457 (22 pages). February 1995.
The Policy Research Working Paper Series disseminates the findings of work in progress to encoraage the exchange of ds aboutdewelopment suts. An obective of the series is to get the findings out quickly, even if the presentatons are less than fully poldia Thepapers cany the names of the authors and should he used and cited accordingly. The firdings, ierpretations, and colcldsions are theahors' oum and should not he attributed to the World Bank, its Executive Board of Direct or any of its men6er countries.
Produced by the Policy Research Dissemination Center

INFORMAL REGULATION OF INDUSTRIAL POLUTTIONIN DEVELOPING COUNTRIES:MVIDNC MON INDONESIA
by
Sheoli Pargal*David Wheeler
Respectively Economist and Principal Economist in the Environmant,Infrastructure and Agriculture Division, Policy Research Department,World Bank. Our thanks to Shakeb Afsah, Benu Bidant, Mainul Ruq,Mala Nettige, Nlandu MaNingi, Mead Over, and Kea Chomitz for valuablecomments. We are extremely grateful to our colleagues in BPS(Central Statistics Bureau) and BAP1DMA (National Pollution Control
Agency, Environment Ministry), Government of Indonesia, for sharingtheir time, experience and information with us. In particular, wethank Mr. Nabiel Makarim (Deputy I, BAPZDAL) and Mr. Rifa Rufiadi(BPS). Without their extremely generous assistance, this work would
not have been possible.
Please address all correspondence to Sheoli Pargal, N 10-037, TheWorld Bank, 1818 B. Street, N.W., Washington D.C. 20433; Internet:spargslaworldbank.org; Phone: 202-458-1951; Fax: 202-522-3230
XECCUTIVE SWIRARY
This paper tests a model of supply-demand relations in the implicitmarket for environmental services when formal regulation is absent. We useplant-level data from Indonesia for the period 1989-90, before the advent ofnationwide formal regulation. Treating pollution as a derived demand forenvironmental services, we develop an estimating equation which iB like aconventiorally-specified input dzemand funcLion. The dependent variable isplant-level discharge of Biological Oxygen Demand, a major water pollutant.Righthand variables include the price (expected cost) of pollution, prices ofother inputs (labor, energy, materials); and enterprise characteristics whichmay affect pollution demand, including scale, vintage, ownership, andefficiency.
In our model, the expected cost of pollution for factories can bepositive without formal regulation because of pressure (or informalregulation) by neighboring communities. Community power and preferences arerevealed in an environmental supply function - the schedule of penalties whichthe firm expects the conmunity to impose as pollution increases. Equilibriumpollution is determined by the intersection of pollution demand and supplyschedules at the factory level. The supply schedule is affected by communityincome, education, size of the exposed population, the local economicimportance of the plant, and its visibility as a polluter. The lattervariable clearly distinguisbes formal from informal regulation; whenregulators do not monitor and report emissions, communities must rely onvisible signs of damaging activity.
our econometric results are strongly consistent with the existence of aninformal 'pollution equilibrium, in Indonesia before national regulation wasinstituted. The results suggest that:
* Water pollution intensity declines significantly with increases in plantsize, efficiency and visibility to the local community.
e Production is significantly less pollution-intensive in areas wherematerials prices are high; results for wages and energy prices are inthe same direction but much weaker.
* older plants and publicly-owned facilities are more pollution intensive.Multinational ownership has no independent effect on pollutionintensity.
* Pollution intensity is far higher in poorer, less-educated communities.
Por the informal regulation hypothesis, the last result is particularlyimportant: Ceteris paribus, plants in Indonesian kabupaten (municipalities)with 25th-percentile income and post-primary schooling are estimated to havewater pollution intensity 15 times the prevailing level in kabupaten with75th-percentile income and education. An exploratory analysis of the datasuggests that much of this disparity may be due to intercommunal differencesin power, not preferences.
It would be premature to generalize from the results reported in thispaper, since they are based on data for emissions of one water pollutant inone country. However, our findings are consistent with the followingpropositions:

* The model of optimal pollution control in environmental economicsprovides a more appropriate paradigm for developing countries than manyhave believed. Community-factory interactions seem to reflectenvironmental supply-demand considerations even when formal regulationdoes not exist.
* Policies which favor competition, privatization and elimination of inputsubsidies should significantly reduce the water pollution intensity ofmanufacturing.
* Rapid improvements in cot,imunity income and education will probablysignificantly lower the water pollution intensity of manufacturing.
* The apparent power of informal regulation implies that cost-effectiveformal systems should ba designed to complement, not supplant, communitycontrol. In particular:
* Local communities shouldn't be forced to rely so heavily onvisibility when judging environmental performance. Formalregulation should include publication of audited emissionR reportsfrom factories.
* 'Environmental injustice' may be real and important. Many poor,uneducated communities may need extra support from nationalregulators.
- However, appropriate regulation should strike the right balancebetween equity and efficiency. National uniform :tandards go toofar because they eliminate all the natural and legitimate regionaldiversity which is also reflected in informal arrAngements.
E-2

1. INTRODUCTION
Under formal regulation, the government acts as an agent for the
community in controlling industrial pollution. In the absence of such an
institutional agent, a conventional analysis would assume that pollution is
costless and essentially unconstrained. However, a growing body of evidence
from Asia and Latin America suggests that this is not the case. In developing
countries where formal regulation is weak or absent, many communities appear
to have struck bargains for pollution abatement with local factories. We term
this phenomenon 'informal regulation': Acting in their own self-interest,
communities pursue levels of environmental quality which are desirable and
feasible under local conditions.
1.1 The economics of informal regulation
in broad outline, our model of informal regulation resembles the
textbook model cf optimal market-based regulation.' Communities have
implicit property rights in the local environment, and are willing to make
their environmental resources available to polluters - but at escalating
prices (or penalties) as pollution damage rises. Factories find ways to
reduce their demand for environmental resources as expected penalties
increase. Equilibrium arrangements reflect both demand- and supply-side
considerations.
However, our model differs from the standard model in its assumptions
about monitoring, regulatory instruments and enforcement. Communities must
often strike bargains with poor information about plant-level emissions and
risks. Without recourse to legal enforcement of existing regulations (if
any), they must rely on the leverage provided by social pressure on workers
and managers; adverse publicity; the threat (or use) of violence; recourse to
civil law; and pressure through politicians, local administrators or religious
leaders.
1.2 Ii'plications for environmental policy
A significant role for informal regulation would have severalimplications for environmental policy in developing countries. First, it
would suggest that the model of optimal pollution control in environmental
economics provides a more appropriate paradigm for developing countries than
many have believed.
Second, widespread informal regulation in a developing country
represents a promising foundation for decentralized regulatory policy. In the
1 See Tietenberg (1992).

textbook paradigm of environmental economics, optimal pollution loads and
charges should vary across communities because local conditions create
different marginal benefit and cost schedules for abatement. We would expect
this to be true of informal regulation as well. New formal regulatory systems
may be able to build on such local arrangements rather than replacing them at
unnecessarily high cost. The imposition of " national system of uniformstandards might, in fact. create enough deviation from locally-optimal
standards to reduce welfare in some communities.2
Third, and probably most important, community income and education may
be very important determinants of informal regulatory outcomes. Communities
with low levels of education and information may give inappropriately low
weight to pollution simply because they are not aware of the consequences.3
Factories which are large local employers may receive deferential treatment
from poor communities, even if they are heavy polluters. Finally, communities
whose citizens are mostly poor, poorly educated or members of marginalized
minority groups may have little ability to use the available channels of
informal regulation. Significance for these factors would establish a clear
case of 'environmental injustice.' To compensate, formal regulation could be
targeted particularly on pollution control problems of poor communities.
1.3 Indonesia: the test case
This paper tests the informal regulation hypothesis using Indonesian
plant-level data from several surveys conducted in 1989 and 1990. Indonesia
-provides a good test case. It is large and highly varied, in both
environmental and socioeconomic dimensions. Indonesian manufacturing has been
growing rapidly; industrial pollution is clearly a problem and, until very
2 To illustrate, suppose that community A has almost no industry (orindustrial water pollution) and is located next to a large, swiftly-flowingriver which rapidly disperses pollutants. Community B is heavilyindustrialized and located on a shallow lake which is easily contaminated.Under informal regulation, B may impose much tougher penalties on newly-arrived polluters than A. But if national regulators impose uniformstandards, factories will have no incentive to avoid B or move to A. In fact,agglomeration economies may well attract them to B. The result could behigher pollution in B than the community would have accepted under informalregulation, and much lower income/employment in A than the community wouldhave desired.
It is also true, of course, that poor information and leverage underinformal regulation might negate this result. With national enforcement ofuniform regulation, conditions in both communities could be worse-than-optimalfrom the perspective of environmental economics, but better than the availableoptimum under informal regulation.
3 It might be argued that poorly educated or uninformed communities wouldbe more alarmist, with consequent assignment of too much weight to pollution.In developing countries, however, the opposite seems generally true.Uninformed communities have no basis for judging pollution impacts which arenot visible and immediate. See Huq/Wheeler (1992) for some illustrative casesfrom Bangladesh.
2

recently, most areas have had little or no formal pollution control.
Indonesia's data collection system is also one of the most efficient and
comprehensive in the developing woL.d, permitting the construction of the
broad database which has been necessary for this exercise.
The paper is organized as fo3lows. Xn Section 2, we describe our model
of informal regulation. Section 3 specifies an appropriate regression
equation and describes the data. The results and implications are reported in
Section 4, with a summary and conclusions presented in Section 5.
2. INDUSTRIAL POLLUTION UNDER XNFORXAL REGULATION
our model of informal regulation follows convention in defining
emissions as the use of 'environmental services' - an additional production
factor in an augmented KLEM (Capital, Labor, Energy, Materials) framework.
The implicit 'price, of pollution is the expected penalty or compensation
exacted by the affected community. It is different from other input prices in
two ways. First, it may be plant-specific. Optimizing communities may
tolerate polluting factories when they provide a lot of jobs, local contracts
or tax revenues. Conversely, they may pay particular attention to plants
whose location makes them particularly easy to monitor (e.g., large, isolated
facilities) or particularly damaging to the local environment (e.g. pulp mills
immediately upstream from local fisheries or irrigated rice fields).
Secondly, the price of pollution is an expectation, not a certainty.
Plants learn about expected penalties or compensation for damage by observing
patterns of community monitoring, activism, and their effects on other
factories. Subsequent abatement decisions reflect the attempt to minimizetotal costs, including the expected cost of polluting at different levels.
2.1 Environmental supply
Informal regulation reflects local factories' acceptance of the
community's property right in the environment. Communities use their leverage
to impose penalties (costs) on firms whose emissions are judged unacceptable.
As factories use up more local environmental quality, affected communities
will impose higher costs. From the viewpoint of industry, the result is an
'environmental supply schedule', which shifts inward as average community
education levels and income increase. Field survey evidence from Southeast
Asia suggests that this schedule will depend on several factors: the level of
community organization, information, legal or political recourse, media
coverage, NGO presence, the efficiency of existing formal regulation, and the
3

opportunity cost of time.4 Many of these factors are likely to be
correlated with community income and education levels.
2.2 Environmental Damand
Faced with a community-determined environmental supply schedule, each
plant adjusts pollution to the optimal point along its pollution demand
schedule, derived from its cost minimization exercise.S Thus, potentially-
significant determinants of the environmental demand schedule include:
* Output: The KLEM framework dictates use of gross output value as the
appropriate measure for this study. Of course, we expect pollution load to
grow with output, ceteris paribus. However, most empirical studies of
relations between plant size and pollution abatement have suggested that scale
economies in abatement are the general rule. Thus, we would expect the
elasticity of pollution with respect to output to be significantly less than
one.
e Relative input prices: Pollution seems likely to be complementary to
material inputs, but its cross-price relationships with labor, capital and
energy are not clearly signed.
materials-intensive production also tends to be pollution-intensive
because the volume of waste residuals is greater. Thus, an increase in
material prices will encourage substitution toward products or
technologies which are less materials- and pollution-intensive.
Zakor has a much more complex potential relationship with pollution.
Applied econometric work on KLEM models has often suggested that K/E and
L/M are complements but that the pairs KE and LM are gross substitutes in
production.' If these relations hold, an increase in labor price will
lead to declines in the use of both labor and materials, with a decline
in pollution associated with the latter. on the other hand, labor is
also an input to pollution abatement. In this dimension, an increased
wage should lead to reduced abatement and higher pollution. The ultimate
sign of the relationship is therefore ambiguous, although our prior view
was that the direct production effect (complementarity) would dominate.
4 See Huq/Wheeler (1992) and Hartman/Huq/Wheeler (1994) for evidence fromIndonesia, Thailand, Bangladesh and India.
S This is analogous to a standard input demand function.
b See Christenson, et al. (1973).
4

Capital is not a consideration for this exercise, since we do not have
reliable capital stock data. We do not know whether or not c:nital is
complementary to pollution in production. Abatement equipment, however,
is counted as an addition to the firm'9 capital stock, so we would assume
that this would contribute to a positive relationship between the price
of capital and pollution (emissions).
Energy price increases should have a positive impact on labor, materials(and therefore pollution) if energy is a gross substitute in production.
Energy can also be an important input to abatement, with another positive
cross-price effect on pollution. In the case of air pollution, this
positive effect would be attenuated by the impact of an energy price
increase on fuel combustion. The latter is a major contributor to
industrial air emissions. Overall, we might expect the gross substitute
relation to dominate for water pollution and the fuel combustion effect
to produce overall complementarity for air pollution.
* Sector: Sectors such as wood pulping and steelmaking have the potential to
generate much higher pollution per unit of output than apparel manufacturing
or electronics assembly. Abatement itself requires factor inputs subject to
diminishing returns. Cost-minimizing firms in pollution-intensive sectors
will therefore have higher equilibrium emissions intensity, whatever the
implicit price of pollution.
= Vintage: Indonesia is still a heavy importer of production equipment from
regulated OECD economies, where pollution control has been increasingly
embodied in new process technologies. In addition, installation of end-of-pipe
abatement equipment during plant construction is cheaper than retrofitting.
With rising public concern over pollution in the 1980's, we would expect this
cost factor to dictate a stronger response from new factories. 'Green
consciousness' in some industrial societies may also drive their
internationally-oriented construction contractors to pressure Indonesian
clients toward greater abatement. For all these reasons, we would expect
newer plants to be cleaner.
* Efficiency: Well-managed firms should be more capab]e of responding to
incentives for pollution control. They should also be more profitable, with
more discretionary funds available to respond to demands for cleanup.
Finally, such firms should generate fewer waste residuals per unit of output.
We would therefore expect more efficient firms to be cleaner.
* Ownership: Almost all multinational firms in Indonesia are headquartered in
richer, more regulated economies where 'green consumerism' is an important
factor for market reputation. They also have relatively low-cost access to
5
clenn technologies developed for the firms, OECD plants. Multinationals may
also be more sensitive to their public image in Indonesia. For all these
reasons, we might expect multinationals to be cleaner than their local
counterparts.7 Public plants in Indonesia are quite likely to be older, less
efficient, and therefore more pollution intensive than their private
.ounterparts. After these factors are accounted for, however, the residual
effect of public ownership is not clear. We might expect lower pollution
intensity for public plants operating under soft budget constraints, because
they do not confront the full cost of abatement. However, national
bureaucratic control may also shield state-owned facilitLes from local
pressure.
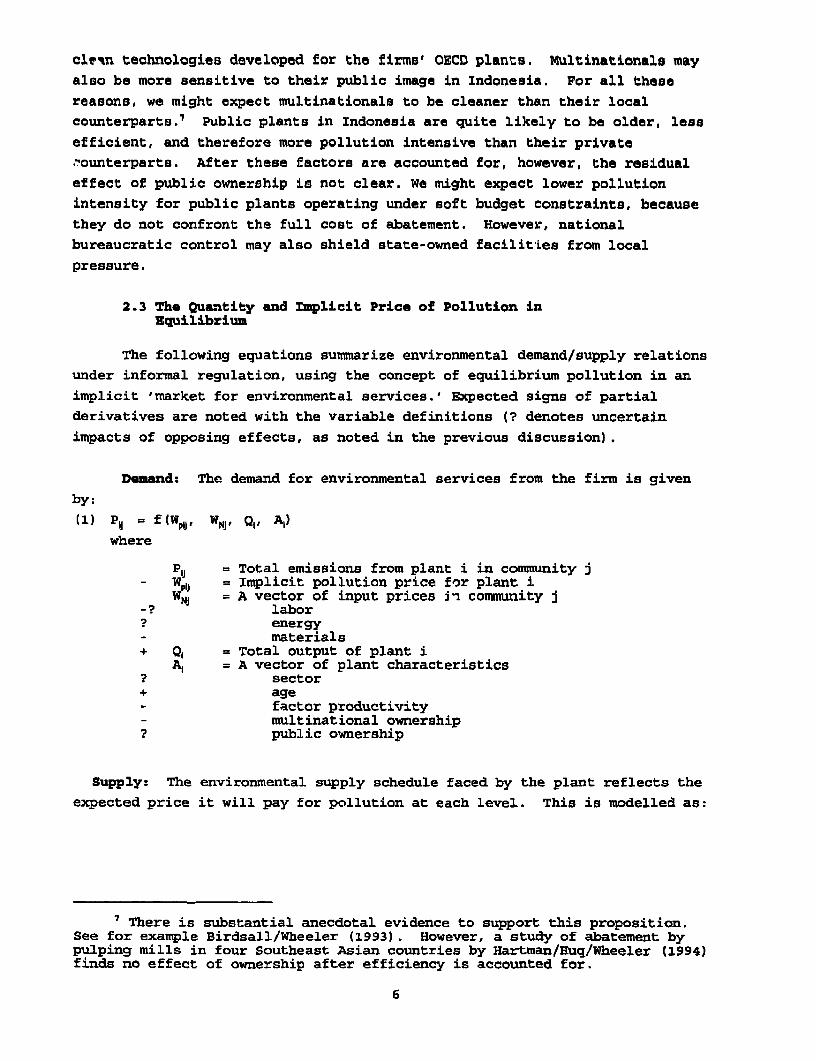
2.3 The Quantity and Implicit Price of Pollution inEquilibrium
The following equations summarize environmental demand/supply relationsunder informal regulation, using the concept of equilibrium pollution in an
implicit 'market for environmental services.' Expected signs of partial
derivatives are noted with the variable definitions (? denotes uncertain
impacts of opposing effects, as noted in the previous discussion).
Demand: The demand for environmental services from the firm is given
by:
(1) Pii = f (WPIJ, WNj, Qi, Al)where
PlJ = Total emissions from plant i in community j- = Implicit pollution price for plant i
-WNJ = A vector of input prices in community jlaborenergymaterials
+ = Total output of plant iAl = A vector of plant characteristics
? sector+ age
factor productivitymultinational ownership
? public ownership
Supply: The environmental supply schedule faced by the plant reflects theexpected price it will pay for pollution at each level. This is modelled as:
' There is substantial anecdotal evidence to support this proposition.See for example Birdsall/Wheeler (1993). However, a study of abatement bypulping mills in four Southeast Asian countries by Hartman/Huq/Wheeler (1994)finds no effect of ownership after efficiency is accounted for.
6

(2) WPQ f (Put C;, Ell aj, tl)
where
+ *P Total emissions from plant i in community jC A vector of community characteriatics
+ income+ post-primary education? EO * Share of plant i in total manufacturing employmeni in
community j. Measures a plantls economic attractiveness tothe community (+), as well as its visibility (-).
? a, . Urbanization proxied by population density. Measures plantvisibility C-) as well as the size of the affectedpopulation (+).
+ ti . Total pollution load faced by community j
Two variables have opposing signs in (2) - Eu and aJ. Plants which are big
local employers may be more valued, but they are also more visible as
polluters. Urbanized areas have larger affected populations, but the presence
of many other factories also makes it more difficult to identify polluters.
We can solve for the firm's equilibrium pollution as:
3 u f(Wtj W, W* Q1i s,, v, f1, ml, g1, nl yju aji tJ, ej)
Righthand variables for n regression equation are defined as follows, with
expected signs of estimated parameters:
Standard demand variaajles
? W1j Manufacturing wage in community J? W, - Energy price index in community J (Water +; Air -)
- W .Material input price index in community j
+ Q = Total output of plant i Co c elasticity c 1]
? s. = Sector of plant i
Firm-sDecific variables
+ v, =Age of plant i
- f, = Factor productivity of plant i
- m} = Multinational status of plant i (I if multinational)
? g1 = Public/private status of plant i (1 if public)
Informal regulation variables
? n, = Share of plant i in community j's manufacturing employment
? a, = Population density in community j
- yj = Per capita income in co;Jmunity j
- ti = Current total pollution load in community j
- ej = Post-primary schooling rate in community j
7

2.4 The Roles of Sector and Location
As previously mentioned, broadly-defined industry sectors differ greatly
in average pollution intensity of production (see Hettige, et. al. (1994)).
However, within-sector variation is also very great, and process-based
variation can be large even within sectors defined at very high levels of
disaggregation. Investors make simultaneous choices of products, processes,
abatement levels and production location, taking relative prices at different
locations into account. In general, we would expect pollution per unit of
output to be relatively price-elastic.
2.4.1 Industrial location and pollution
Plants in areas with relatively high implicit pollution prices should
have lower pollution per unit of output for two reasons. First, producers in
sectors with high potential pollution intensity will tend to lower costs by
locating elsewhere. Secondly, plants which have other reasons to locate in
areas with high pollution prices will lower costs by reducing pollution.
Thus, we would expect to observe disproportionately higher survival rates of
plants which are old, inefficient and lower-abating in poorer, less literate
areas where it is "cheaper to pollute".
The first factor explains why an appropriate plant-level pollution
equation fitted to interregional data does not need to control for industry
sector. Nevertheless, it is of interest to know how much variation in
pollution-intensity is due to each of the two factors: Cross-sector location
and within-sector abatement. This exercise will therefore estimate two
regression models, with and without sector controls. The latter will permit
an assessment o; the impact of righthand variables )n within-sector abatement.
2.4.2 Possible Endogeneity of Income and Education
Our model employs community mean income and education levels as
exogenous variables. To see why this could be wrong, consider the basic
contrast in Pigouvian and Coasian interpretations of the externality problem.
The Pigouvian version assumes a static system of property rights in which
damage from pollution is unidirectional: A factory locates in a community,
and its pollution damages local health, economic activity and ecosystems.
(Baumol, 1972). In contrast, a Coasian view assumes that the externality is
reciprocal: When polluting factories locate in communities, the damaged
parties have the option of moving away. Furthermore, other people who were
formerly unaffected by the pollution may choose to move in as property values
fall near the factory. To claim that the factory should bear the full cost of
damaging their health would, of course, be specious. In either case, the
b.sic policy prescription is clear: Both polluter aid pollutee should bear
some of the abatement cost when both are mobile (Hartman, 1982).
8
For policy, the relevance of the two perspectives seems context-
specific. When a pulp mill locates upriver from a traditional community which
has never experienced pollution, the Pigouvian perspective seems more
appropriate. In an urban area where all agents are mobile, the Coasian
approach has strong appeal.
For econometric analysis, context is also important. Within an urban
region where residential mobility is comparable to factory mobility, an
increase in polluting activity in some subregions will, by the previous
reasoning, induce a decline in their average income and education. Thus, a
model which relates pollution to residential income in one urban area is a
good target for Granger tests of causality.
In our case, however, the argument for endogeneity is far less
compelling. The units of analysis are kabupaten drawn from a broad spectrum
of urban and rural areas in Java, Sumatra and Kalimantan. Indonesia exhibits
great spatial variation in community cultures; the relative social and
economic status of kabupaten has changed little since 1975. During that
period, however, almost all of Indonesia's manufacturing has come into
existence. Therefore, in our case industrial location dynamics clearly
dominate residential location dynamics. If there is any bias in our
estimates, we are confident that it is small.
2.5 Econ otric Specification
We have no strong prior views on appropriate specification of the
estimating equation for equilibrium pollution. The basic pollution demand
equation (P = f (Wy, W,, Q)I could be derived along with other input demand
equations from a generalized cost function under the assumption of cost
minimization. The full demand system could then be estimated using a translog
or Box-Cox model. At present, however, this degree of rigor seems prematureand inappropriate for several reasons.
First, our theory of informal regulation has not previously been tested.
It would therefore seem better to start with a relatively simple and tractable
empirical exercise. Furthermore Wp is endogenous and has many determinants.
There are also many plant-specific demand-shift variables in the model. Our
sample is not large, and we know that measurement errors for the lefthand
variable, while probably normally distributed, are also quite large in some
cases. Nonlinear estimation of a multi-equation input demand system simply
seems too cumbersome to be worthwhile at this point. We therefore confine
ourselves to estimation of log-log regressions, with dummies for categorical
variables.
Heteroscedasticity across observations, often a problem with cross
section analyses, was not a significant problem in our data. We have,
however, reported White heteroscedasticity-consistent results. AlthoughL there
is fairly significant correlation between different groups of variables in our
9

dataset, multicollinearity does not appear to have been a problem for
estimation.'
3. THE DATA
This study combines Indonesian manufacturing and socioeconomic census
data with observations on plant-level water pollution measured as part of the
Environment Ministry's PROKASIH (Clean Rivers) Program during the period 1989-
1990. Our plant-level emissions data have been provided by BAPEDAL,
Indonesia's National Pollution Control Agency in the Ministry of Environment.
Data on plant characteristics and socioeconomic characteristics of communities
have been provided by BPS (Indonesia's Central Statistics Bureau). At
present, BAPEDAL and BPS do not assign common ID numbers to factories. Thus,
creation of the combined dataset for plants' emissions and other
characteristics required individual matching by name and location from
separate files provided by BAPEDAL and BPS. Plant location information in the
BPS file was in turn used to combine the plant-level data with socioeconomic
variables for surrounding sub-provincial areas (kabupaten). In this section,
we provide a more detailed discussion of data sources and quality.
3.1 The Measure of Water Pollution
For this study we focus on Biological Oxygen Demand (BOD), the most
commonly-regulated water pollutant in both industrial and developing
countries. Biological oxygen demand is associated with oxidation of organic
water pollutants by naturally-occurring micro-organisms. This process removes
dissolved oxygen from the water and can seriously damage some fish species
which have adapted to the natural dissolved oxygen level. Organic water
pollutants can also accelerate the growth of algae, which will crowd out other
plant species. The eventual death and decomposition of the algae is another
source of oxygen depletion as well as noxious smells and unsightly scum. The
most common measure for BOD is the amount (kg) of oxygen used by micro-
organisms to oxidize the organic waste in a standard sample of pollutant
during a five-day period (hence the standard term '5-day BOD'). We have used
the PROKASIH 5-day BOD measure to generate daily BOD load estimates.
PROKASIH itself was Indonesia's first nationwide program for industrial
pollution control.9 For this paper, we employ a cross-section of benchmark
' Parameter signs and magnitudes were very stable across different modelspecifications, and variance inflation factors were not unreasonably high.Exclusion of single variables in correlated sets from regressions would, ofcourse, increase the estimated effect of the remaining variables.
9 We are analyzing its impact on pollution abatement in a forthcomingpaper.
10
BOD measures taken at the beginning of PROKASIH. They reflect the
environmental performance of Indonesian factories before the institution of
nationwide formal regulation of any kind.'" It was presumed that the initial
BOD data would be subject to large stochastic reporting errors because offactory-level inexperience with appropriate sampling and measurement
techniques. However, two large-sample tests of their validity by an outside
consultant and the Environment Ministry show that they provide unbiased,
robust estimates."1 We expect the sampling errors to generate relatively
high 'unexplainable' variance in the data set, but tests of significance
should not otherwise be affected.
3.2 Plant Characteristics
our data on plant characteristics are drawn from the Annual Census of
Manufactures administered by BPS. This detailed census has been administered
by BPS since 1975, and has been subjected to frequent and rigorous checks. It
is generally considered to be one of the most reliable manufacturing datasets
available for a developing country.
Standard census data have been used for our measures of total output
value, age, and local employment share for the PROKASIH plants. The latter
variable is constructed by calculating total kabupaten manufacturing
employment from the census and dividing plant-level employment by this total.
Because we do not have sufficient data for an estimate of total factor
productivity, we have used reported value added per production employee as our
proxy.' 2 The census data also include information on the proportion of firmequity held by foreigners; the proportion of equity held by the regional and
central governments, which we have combined to get a measure of publicownership; and sector identification - used to create the following ISIC"3
10 Prior to PROKASIH, some local governments took measures against waterpollution in response to crisis situations. Most notably, the Governor ofEast Java forced several large factories to install abatement equipment in1987, when pollution of the Brantas River became extremely high during the dryseason.
11 The problem of bias is unusual in this context. Ordinarily, self-reported data on pollution would be suspected of downward bias. However,PROKASIE is a voluntary program with no formal sanctions for noncompliancewith pollution reduction agreements. Plants which are committed to pollutionreduction in a sanctionless program have an incentive to overestimate theirpollution in the first period. In any case, the validity checks show that thePROKASIH estimates exhibit neither upward nor downward bias. See Afsah (1994)for a detailed discussion of estimation problems in the PROKASIH data.
12 We calculated profits for each plant as [value added - total wage bill- interest (capital cost)] from the manufacturing census data for 1989. Thecorrelation between value added per production employee and profit perproduction employee was positive and significant. Our variable may thereforebe a reasonable proxy for productivity.
13 ISIC refers to International Standard Industrial Classification codes.
11

sector dummies: food products (ISIC 3121), spinning and weaving textiles
(3211), tanneries and leather finishing (3231), sawmills and wood mills (3311)
and pulp, paper and paperboard (3411).
3.3 Input prices
For this study, we have been able to generate kabupaten-level price
estimates for labor and energy. Materials price differences are proxied with
a very crude locational dummy variable.
Kabupaten manufacturing wage: We have computed this from 1989 census data as
the mean plant-level wage for production workers across all census plants
(manufacturing plants employing more than 20 people) in the kabupaten. The
plant-level estimates were obtained by dividing total wages and salaries paid
to production employees by the total number of production employees.
Materials price: We have no direct measure of relative materials prices by
sector. We use a Java location dummy to proxy transport cost considerations
for heavy materials in pollution-intensive sectors. Higher prices at the
factory gate should induce materials-saving and pollution reduction. Factories
on Java now import much of their heavy materials from other islands, thus
facing relatively higher transport-related costs. Higher materials costs
should reduce materials- and pollution-intensity. A second, possiblyimportant factor has to do with social and political power. In Indonesia, this
still resides disproportionately in Java. Thus, Javanese kabupaten may
collectively exert more influence on environmental performance than those on
other islands.
Energy price: We have computed a single fuel price index for energy, using
plant-level data from the 1989 manufacturing census. It is a weighted average
of prices (per million BTU) for electricity, gasoline, high speed diesel
oil(HSDO), diesel, kerosene, natural gas, coke and coal for each kabupaten.
The weights are national energy expenditure shares for each fuel.14
3.4 Community Characteristics
Our estimates for per capita expenditure, post-primary education and
population density are drawn from the SUSENAS surveys conducted by BPS in 1988
and 1990. Per caDita household expenditure was nudged to be the most reliable
14 Using 1989 manufacturing census data, we have separately computedprices for electricity and a fossil fuel index for each kabupaten. This indexis a national purchase-share-weighted average of prices (per million BTU) forgasoline, USDO, diesel, kerosene, natural gas, coke and coal. Since the t'-okabupaten indices turned out to be highly correlated, we decided to use asingle fuel price index.
12
available measure of living standards, and was used to proxy per capita
income.
3.5 Data Description
Out of a total sample of 253 plants, we have exact ownership information
on 246 plants: of these 3 are wholly foreign-owned and over 50 have some
foreign participation; 13 are comple.ely owned by the government and 178 are
private domestic firms. Factory age ranges from 0 years (2 firms) to 90 years
(2 firms), with the median age of firms being 10 years. The geographic spread
of the data is restricted to three islands - Java (189 firms), Sumatra (40
firms), and Kalimantan (24 firms) - and 8 provinces. Forty one ISIC codes or
sectors are represented in the dataset and firms range in size from 22 to
41,821 employees, with share in kabupaten employment varying from 0.02% to
91%. The kabupaten represented in the data are quite varied as well: 1990
population density ranges from 3.4 to 53,876 persons per square km., the
proportion of the population with more than a primary education varies between
6.85% and 48.5%, and mean annual per capita expenditure varies from Rp.
256,447 to Rp. 837,277 (1990 Rp.).
Mean per capita expenditure, population density (the urbanization
proxy), and the proportion of the kabupaten with more than a primary education
are significantly positively correlated in the raw data. As expected, the
locational dummy for Java is positively correlated with mean per capita
expenditure and population density but negatively associated with the
proportion of the population with higher than primary schooling. Mean
manufacturing wage in the kabupaten is positively related to the average fuel
price in the kabupaten.
4. RESULTS
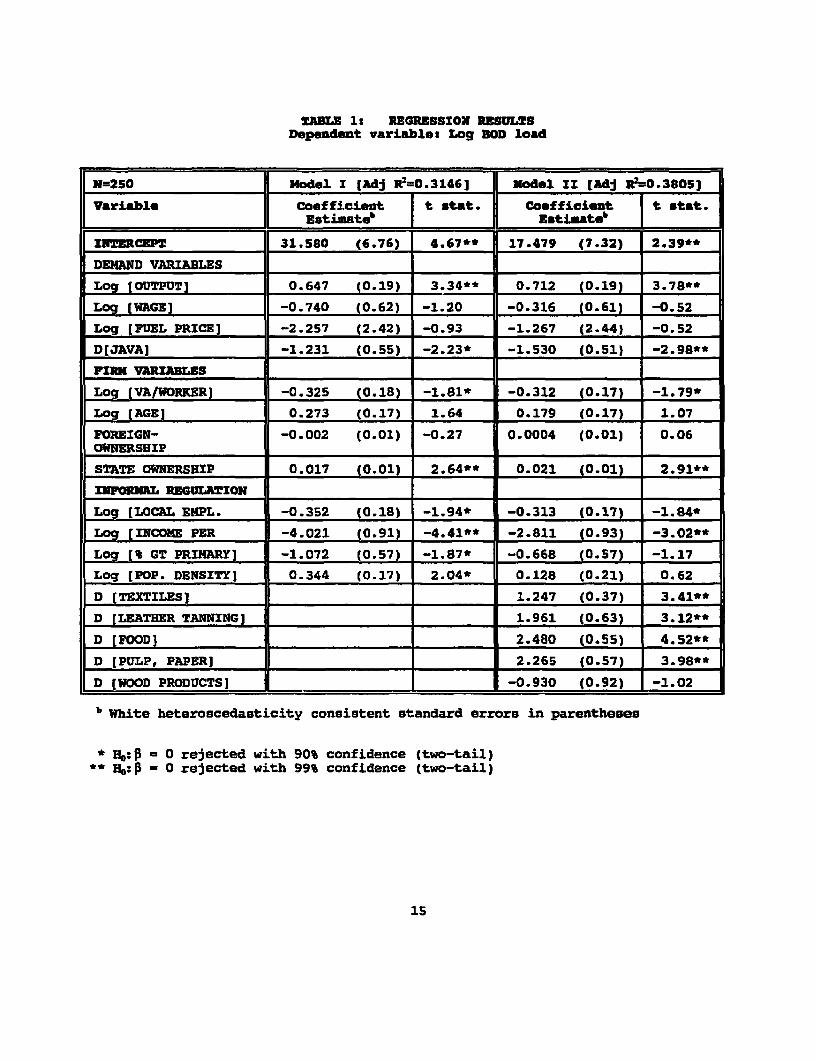
Table 1 presents the results for pollution regressions estimated with
and without sector controls. They are strongly consistent with our basic
thesis: Without any formal regulation, equilibrium emissions can still vary
strongly across firms and regions in response to differences in scale,
regional input prices, f'rm characteristics, and the degree of informal
regulation by local communities. Parameter signs and standard error estimates
are mostly stable across Models I and II.
The obser-ed pollution intensity of production at a particular plant is
the outcome of several decisions: the choice of location, product, process
technology and end-of-pipe abatement. Model I depicts the end result of all
these choices. Locational and investment decisions (the choice of sector,
site, and technology) respond to relative prices, including that of pollution
- across space, sectors, and prodution processes. The degree of end-of-pipe
13

abatement is also a response to pollution and other input prices at the
production site. As previously noted, sector dummies in Model II separate the
effects of these decisions by controlling for prior choice of location at the
sectoral level. Model II depicts the within-sector factoro that influence
abatement - and thus emissions. Predictably, the use of sector controls
reduces estimated elasticities for the five locational variables: wages, fuel
prices, population density, post-primary education and per capita income
(although the latter remains highly significant in either model). It is clear
that significant variation in the observed level of pollution emissions is
explained by the choice of technology and sector. Although we present the
results of both model specifications in Table 1, our interpretation of the
results is based on Model I since it incorporates both the locational and the
abatement response. One-tail tests would be appropriate for tests of
significance for most parameters (exceptions are energy price, firm employment
share and population density, whose net effects could be either negative or
positive). However, Table 1 applies two-tail tests to provide the most
conservative measures.
4.1 Standard Demand Variables
As expected, the estimated output elasticity of water pollution is
significantly less than one: Pollution intensity declines with scale.
specifically, the pollution intensity of production decreases by 0.35% for
each percent increase in output. The wage results suggests complementarity of
labor and water pollution. However, the high estimated wage elasticity has a
high standard error, so we could not reject hypotheses of zero or positive
elasticities at any elevated confidence level.'5 Part of this result
undoubtedly reflects straight substitution effects. Higher wages may also
reflect higher levels of technical skills on the part of the local workforce,
which might lead to "within" firm efforts to produce more efficiently and
cleanly.16 Model II suggests that much of the wage effect comes through
location, not local abatement.
Estimated energy price elasticities are negative and large, but standard
errors are again so high that we cannot reject hypotheses of zero or positive
elasticity at any elevated confidence level. The effect of location on Java
is as expected: Large, negative and highly significant. As previously noted,
we have used this as a crude proxy for relative materials prices. There may
also be some reflection of political power here, although we have introduced
separate controls for community income and education.
15 Spatial autocorrelation is a possible explanation for the low levels ofsignificance of some variables. However, the fact that the data cover plantsclong different rivers in widely separated regions makes us discountthis possibility.
16 We are indebted to Mainul Hug for this point.
14
TADLE 1: REGRESSION RES8ULSDependent variables Log DOD load
| N=250 ti odel I [Adj R2=0.3146] Model II (Adi R=0.3805]
Variable Coefficient t stat. Coefficient t stat..Btim.at. I EstiaStab
XNTERCEPT 31.580 (6.76) 4.67** 17.479 (7.32) 2.39**
DEHAND VARIABLES I 11
Log [OUTPUT] 0.647 (0.19) 3.34** 0.712 (0.19) 3.78**
Log (WAGE] -0.740 (0.62) -1.20 -0.316 (0.61) -0.52
Log (FUEL PRICE) -2.257 (2.42) -0.93 -1.267 (2.44) -0.52
D[JAVA] -1.231 (0.55) -2.23* -1.530 (0.51) -2.98**
FIRM VARIABLES
Log (VA/WORKER) -0.325 (0.18) -1.81* -0.312 (0.17) -1.79*
Log (AGE] 0.273 (0.17) 1.64 0.179 (0.17) 1.07
FOREIGN- -0.002 (0.01) -0.27 0.0004 (0.01) 0.06OWNERSHIP I
STATE OWNERSHIP 0.017 (0.01) 2.64** 0.021 (0.01) 2.91**
XNFORMAL REGULATION _ 1
Log (LOCAL EMPL. -0.352 (0.18) -1.94* -0.313 (0.17) -1.84*
Log (INCOME PER -4.021 (0.91) -4.41** -2.811 (0.93) -3.02**
Log (% GT PRIMARY] -1.072 (0.57) -1.87* -0.668 (0.57) -1.17
Log (POP. DENSITY] 0.344 (0.17) 2.04* 0.128 (0.21) 0.62
D [TEXTILES] I 1.247 (0.37) 3.41**
D (LEATHER TANNING] ) 1.961 (0.63) 3.12**
|D FOOD] I 1 2.480 (0.55) 4.52**
D [PULP, PAPER] _ _ 2.265 (0.57) 3.98**
D (WOOD PRODUCTS] _ -0.930 (0.92) -1.02
b White heteroscedasticity consistent otandard errors in parentheBes
* E6:0- 0 rejected with 90% confidence {two-tail)** E:p = 0 rejected with 99% confidence (two-tail)
15

4.2 Firm-Specific Factors
Our results suggest that firm and plant characteristics have a strong
impact on pollution intensity. More efficient plants are cleaner, as
hypothesized; oluer plants are dirtier, but the latter effect is neither as
large nor as significant as we would have supposed a priori. Pollution
intensity changes by about .3% in response to each 1% change in efficiency.
After controlling for scale, age and efficiency, foreign participation doesn't
appear to have a significant effect on pollution intensity. This confounds
the prior hypothesis, and suggests strongly that the anecdotal evidence hae
failed to distinguish foreign ownership from plant characteristics.
Such factors are, in fact, significantly associated with variations in
ownership. We have studied these relationships using the proportion of equity
held by foreigners as well as the proportion of firm equity held by the
government in a separate analysis based on the entire 1989 Census of
Manufactures.17 The results were confirmatory in some ways, and surprising in
others. Plants owned by firms with greater equity held by foreigners OR the
government are older, bigger, higher in value added per worker, and higher in
share of kabupaten manufacturing employment. Three out of four characteristics
are negatively associated with pollution intensity in the regression renults.
The residual effects (measured by the parameters for public and foreign
ownership shares) are neutral for foreign status and significantly positive
for public enterprises.
Thus, anecdotes about 'clean' multinationals may well have confused
'outsider' status with the effects of size and efficiency. Our results
suggest that big, efficient domestic firms are not significantly more
pollution-intensive than their multinational counterparts. Public
enterprises, on the other hand, present a mixed picture. Their
characteristics (except age) imply relatively clean operation, but the pure
'public' effect is extremely dirty. Thus, the posited 'shielding' effect
seems to outweigh any leverage from soft budgets.
4.3 Informal Regulation Variables
Our results for community income and education are strongly consietent
with the informal regulation hypothesis. The estimated income elasticity of
pollution reduction is highly significant and extremely large: Pollution
intensity declines 4% with each 1% increase in community income. Given a
threefold range in sample community incomes, this implies a major impact.
Income and education are obviously related: the sample correlation is 0.67.
Nevertheless, education has a separate and significant impact in Model I:
17 We used the following regression: ln Y = ab + a,F + a2P, where Yrepresents the various dimensions of interest (vintage, scale of output etc.),F refers to the proportion of equity held by foreigners and P to theproportion owned by the state and central government.
16
Pollution intenesity declines 1% with each 1% increase in community share of
residento with greater than primary education. Given the oevenfold range of
variation in the sample, the results also suggest a major, separate impact for
community education.
The results for plants' local employment share and population densLty
reflect the net impact of two forces. Plants which are bigger local employers
might get laxer treatment on pollution, and more populous areas will have more
people affected by pollutLon. These considerations would imply a positive
impact on pollution for employment status and a negative impact for population
density.1" On the other hand, bigger plants attract more attention, and
pollution from plants in crowded urban areas is harder to trace to the
source.19 These 'visibility' considerations would imply a negative impact on
pollution for employment status and a positive impact for population density.
In this case, the visibility effect seems clearly dominant. Both
results are consistent with the second interpretation above: Plants with
higher local employment shares have lower pollution intensities, ceterie
paribus; plants in more densely-populated areas are more pollution intensive.
4.4 Summary Assessment of the Results
To summarize our results, plant-level water pollution intensity (DOD
load per unit value of output) is significantly lower in firms which are
larger, more efficient, higher in local employment share, and confronted with
higher local wages and materials costs. Pollution intensity is higher in
older, publicly-owned firms. It is also higher in kabupaten which are more
urbanized, poorer and less-educated.
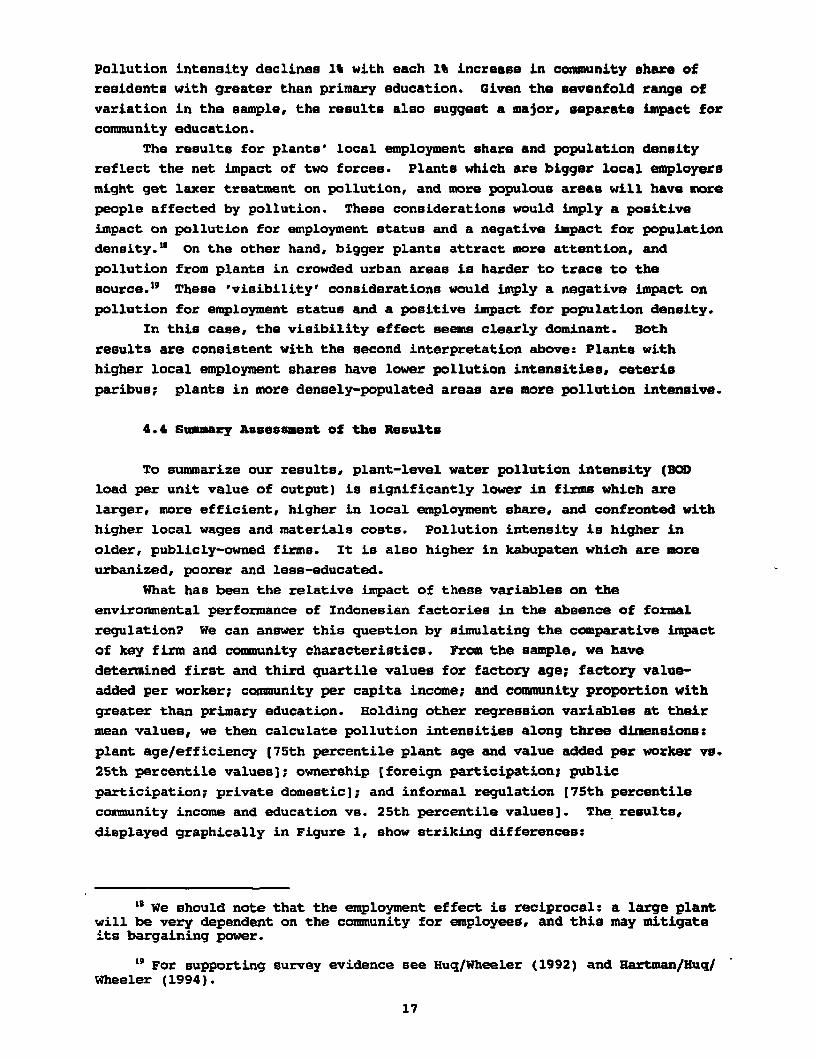
What has been the relative impact of these variables on the
environmental performance of Indonesian factories in the absence of formal
regulation? We can answer this question by simulating the comparative impact
of key firm and community characteristics. From the sample, we have
determined first and third quartile values for factory age; factory value-
added per worker; comunity per capita income; and community proportion with
greater than primary education. Holding other regression variables at their
mean values, we then calculate pollution intensities along three dimensions:
plant age/efficiency (75th percentile plant age and value added per worker vs.
25th percentile values]; ownership (foreign participation; public
participation; private domestic]; and informal regulation [75th percentile
community income and education vs. 25th percentile values]. The results,
displayed graphically in Figure 1, show striking differences:
19 We should note that the employment effect is reciprocal: a. large plantwill be very dependent on the community for employees, and this may mitigateits bargaining power.
"' For supporting survey evidence see Huq/Wheeler (1992) and Hartman/Huq/Wheeler (1994).
17
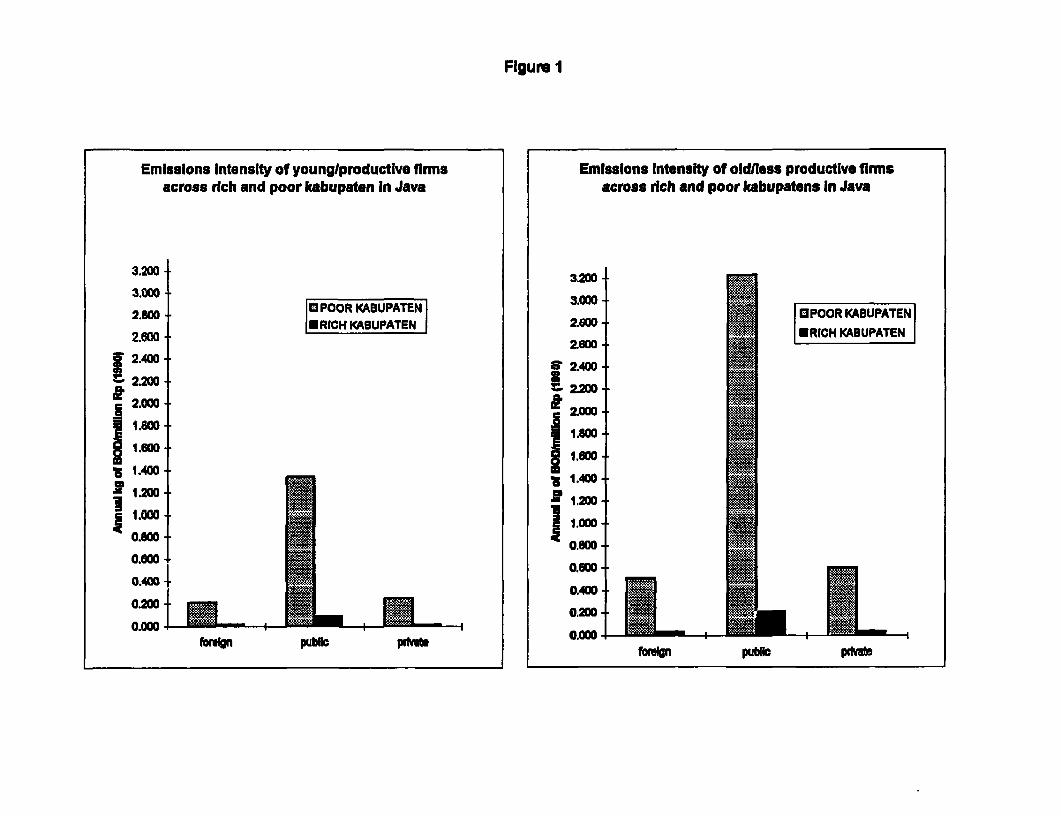
Figure 1
Emissions intensity of younglproductive finns Emissions intensity of oldlless productive finnsacross rch and poor kabupaten In Java across rich and poor kabupatens in Java
3.200320
3.000 ~~~~~~~~~~~~~3.0002.80 MiPOORRKABUPATEN l KABUPATEN
ENRICH KAUUPATEN low 'EIHKBUAE 2.6a lo00 ERICHKABUPATEN
2.400 2.00
1200~~~~~~~~~~~~~~.10
2.000 10 0
1.8. 1800
8 1.600| w 1.60
Ng ACG10404
0.200120
orgn pubic pS 0000
* Plant characteristicat An old, unproductive plant (75th percentile on age;25th percentile on value added per worker) is about 2.4 tises oore water
pollution intensive than a young and productive firm (25th percentile on
age; 75th percentile on value added per worker).
* Ownership: Public enterprises are about 5.4 times mors water pollution
intensiva than plants owned by private domestic firms. The results suggcetthat multinationals are somewhat less pollution-intensive than private
domestic firm,, but all estimates fail to pass reasonable significance
testu.
* Informal regulation: Plants in poor, less educated areas (25th percentile
on income and education) are about 15 4 times more water pollutionintensive than plants in relatively affluent, well-educated (75th
percentile) areas.
5 SUDOARY AND IKPLICArIONS
Econometric work on determinants of pollution intensity at the plant levelis scarce even in the OECD economies. As far as we know, this is the first
such study for a developing country. Our results suggest that, even in the
absence of any formal regulation, factory-level water pollution intensity in
Indonesia has been highly responsive to many variables which can be affected
by non-environmental policies.
5.1 Future Pollution Without Forzal Regulation
For several major determinants of pollution intensity, recent trends in
Indonesia are extremely hopeful. To begin with a simple but powerful
consideration, there will be no more 'old' factories. Our results indicate
that new facilities are cleaner than average existing plants. Similarly,
there are not likely to be any new state enterprises in the industrial sectow.
Deregulation and enhanced competition during the 1980's have also presumably
increased plant-level efficiency in the private sector. Post-primaryeducation, industrial wages and per capita income are advancing steadily
throughout Indonesia.
If cross-section results can be extrapolated to time series, these trend.
should be associated with an extremely large drop in the average pollutionintensity of Indonesian manufacturing, no matter what happen. in the formal
regulatory sector. Furthermore, the predicted effect does not depend on anyincreased presence of foreign, putatively 'green, firms in Indonesia. more
multinationals will certainly come, but our evidence suggests that their
environmental performance will be matched by domestic firms which are
otherwise-comparable.Of course, the basic question remains: Can we credibly extrapolate from the
cross-section results? We see no problem. for changes in plants' age,
18

efficiency and ownership. However, the extremely powerful cross-section
result for kabupaten income and education may seem suspect. As previously
noted, we are not particularly worried about estimation bias frim joint
determinatlon in pollution intensity and income/education levels. Indoneoian
manufacturing has emerged very quickly, while cross-kabupaten socioeconomic
rankings have been relatively stable.m
However, the problem of 'sorting' must still be considered. Suppose that
all plants have fixed pollutlon intensity and locate so as to minimize total
expected costs. Then 'dirty' plants will move to poor communities which
cannot effectively resist; clean plants will locate in rich communities.
Income growth in poor communities will not change this 'sorting' as long an
the distribution of income doesn't change oignificantly.21 Rich communities
will still have higher preference for environmental quality and more power to
enforce their preferences.
If 'sorting, were the dominant factor, we would have to be much loss
sanguine about the potential impact of changes in income and education on
pollution intensity. However, as we have previously noted, pollution in all
industry sectors is highly elastic to choices of products, proceses,
materials use rates and end-of-pipe abatement. In our view, the result is
therefore explained more by adjustment than sorting. However, a more
definitive answer will only be possible once we have appropriate time series
data.
5.2 Preferences or Power?
Our results suggest that pollution intensity is much greater in poor
communities because of disparities in preferences and power. How much is
attributable to each? We can draw some suggestive evidence from the
distribution of pollution intensities in poor areas. Low-income communitieswith relatively low pollution intensities may well have greater leverage
because they have cohesive ethnic or religious groups, particularly gifted
community leaders, national NGO chapters, etc. These outlier communitles have
more power, but their income-based preferences should be similar to those of
other poor communities.
We explore the potential importance of power by examining the intensity
variation of communities in the poorest quintile vs. the variation In mean
intensity between the poorest and richest quintiles. We control for firm
characteristics and 'visibility' factors in a preliminary regression.
X Casual empiricism suggests that in Indonesia the wealthy do not move;the movement of the poor is towards jobs in urban/industrial areas, leavingbehind the relatively poorer agricultural hinterland. This would tend toattenuate the observed disparity in pollution intensity across rich and poorareas. Likewise, differential location of polluting firms in poorer areaswould again reflect the power of the rich to translate their preferences intodesired environmental quality.
a We are indebted to Martin Ravallion for this point.
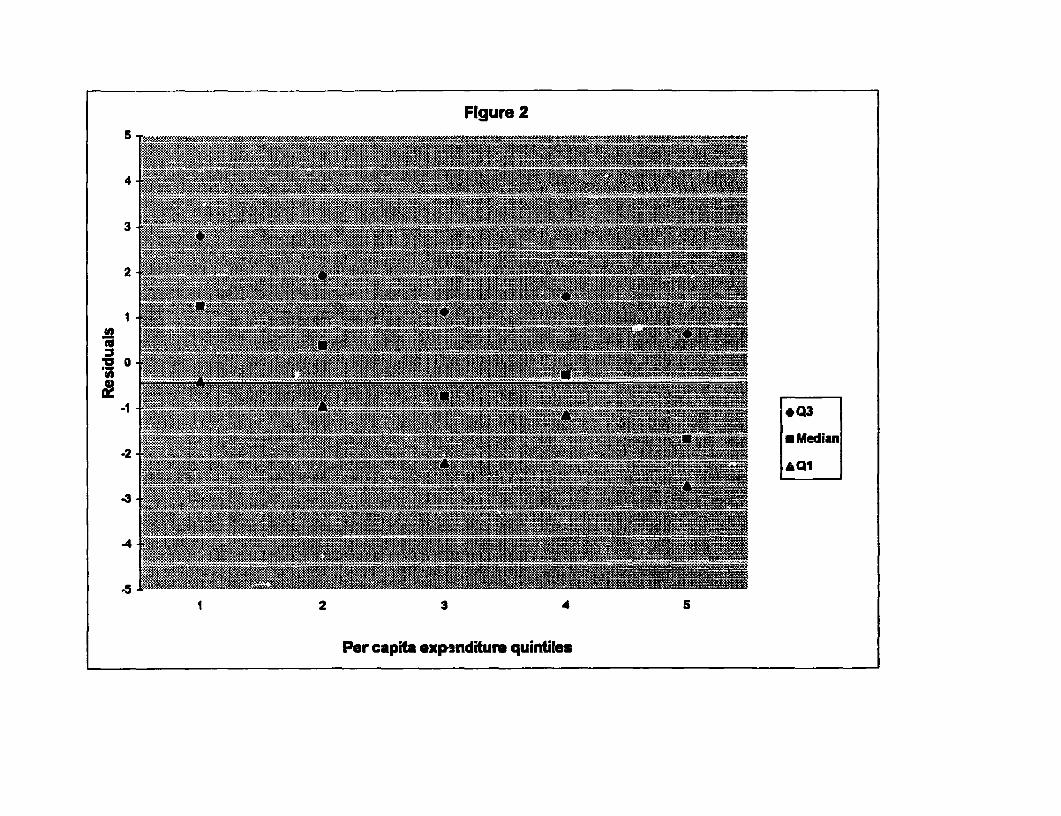
Figure 2
4-
2
1 8|1til1 v~~~~~~~~~~~~~Q3
-2 -
-4
.s__ 1 2 3 45
Per capita expinditure quintiles

Residuals are then sorted by income quintilo medians and quartiles are
dieplayed by community income group in Figure 2. The result suggest. a strongrole for power; the difference between the first and third quartiles for poor
communLties is larger than the difference between medians for the poorest and
richest communities. The "best off" poor communities appear to be much better
off than the "worst off" rich communitieo. It seeme reasonable to lnfer that
the estimated income elasticity of -4 in Model I reflects a sizable measure of
power as well ao preferences. If this is true, the national regulatory agency
could play a useful equalizing role.
5.3 Formal vs. Informal Regulation
How does the informal pollution equilibrium in Indoneeia compare with
probable conditions under formal regulatLon? A formal system might well have
the edge in priority-setting, monitoring and enforcement. National regulatoryagencies generally have technical staff members who can do scientific risk
assessment. They can impose uniform reporting requirements on factories and
use national government power to enforce the rules. However, national
agencies have revealed a strong bias toward uniform standard-setting, even incountries with great variations in geography and levels of industry
concentration. In addition, new regulatory instltutions in many developing
countries are still quite weak in technical risk assessment, data collectionand consistent enforcement.
The strengths and weaknesses of informal regulation present an interee .-g
contrast. As we have noted, poor communities may have few avenues of self-defense. In addition, our results are consistent with the 'visibility'
hypothesis: Knowing little about long-term risks, local communities will tend
to focus on visible pollution whose impact is immediate and obvious.
monitoring may focus on plants which are easy to observe rather than those
which should be observed. Our results on population density suggest such a
problem: Plants which are hidden in large, polluted complexes may face less
monitoring than plants in rural areas with few pollution problems.
However, informal regulation also has clear advantages over rigid formal
systems. Local communities often have a different perception of regulatory
benefits and costs than national agencies. They may also have a more accuratesense of local pollution problems than new agencies whose monitoring
capabilities are weak. Thus, informal regulation may yield a pattern of localenvironmental shadow prices superior to the pattern realistically achievable
under formal regulation.Since each system has clear advantages and disadvantages, we strongly
suspect that the optimal system would be a hybrid one. In such a system, thenational agency might concentrate its resources on monitoring, inspection,
resk analysis and dissemination of information to local communitLes. Local
20

communities could be empowered to mat their own standard., using the national
agency for legal nupport and enforement where necessary.
Given the preliminary nature of this work, it would be premature to push
thees ideas too forcefully. Nevertheless, our results are consistent with the
existence of a strong informal regulatory oystem in Xndonesia. If that in the
case, Indonesia may well want to incorporate the best features of this eystem
into national regulatory policy.
21

6. REFERENCES
Afsah, S., 1994, An Evaluation of Indonesia's PROKASIH 'Clean Rivers' Program,(Washington: World Bank, PRDEI)
Baumol, W., 1972, 'On Taxation and the Control of Externalities," AmericanEconomic Review, 62, pp. 307-322
Birdsall, N. and D. Wheeler, 1993, "Trade Policy and Industrial Pollution inLatin America: Where Are the Pollution Havens?", 1993, Journal ofEnvironment and Development, 2,1, Winter
Christensen, L., D. Jorgensen and L. Lau, 1973, "Transcendental LogarithmicProduction Frontiers," Review of Economics and Statistics, 55, pp. 28-45
Hartman, R., 1982, "A Note on Externalities and the Placement of PropertyRights: An Alternative Formulation to the Standard Pigouvian Results,"International Review of Law and Economics, 2, pp. 111-118
Hartman, R., M. Huq and D. Wheeler, 1994, Pollution Abatement in DevelopingCountries: A Coasian Interpretation (Washington: World Bank, PRDEI)
Hettige, M., P. Martin, M. Singh and D. Wheeler, 1994, IPPS: The IndustrialPollution Projection System, (Washington: World Bank, PRDEI)
Huq, M. and D. Wheeler, 1992, Pollution Reduction Without Formal Regulation:Evidence from Bangladesh, (Washington: World Bank, PRDEI)
Tietenberg, T., 1992, Environmental and Natural Resource Economics. New York:Harper Collins Publishers Inc.
22

Policy Research Working Paper Series
ContactTitle Author Date for paper
WPS1397 Are Private Capital Flows to Ur Dadush December 1994 J. QueenDeveloping Countries Sustainable? Ashok Dhareshwar 33740
Ron Johannes
WPS139B The Cost of Air Pollution Abatement Raymond S. Hartman December 1994 E. SchaperDavid Wheeler 33457Manjula Singh
WPS1399 How Important to India's Poor is the Marin Ravallion December1994 P. CookUrban-Rural Composition of Growth? Gaurav Datt 33902
WPS1400 Technical and Marketing Support Brian Levy with December 1994 D. EvansSystems for Successful Small and Albert Berry, Motoshige Itoh. 38526Medium-Size Enterprises in Four Unsu Kim, Jeffrey Nugent,Countries and Shujiro Urata
WPS 1401 Colombia's Small and Medium-Size Albert Berry December 1994 D. EvansExporters and Their Support Systems Jose Escandon 38526
WPS1402 Indonesia's Small and Medium-Size Albert Berry December 1994 D. EvansExporters and Their Support Systems Brian Levy 38526
WPS1403 Small and Medium-Size Enterprise Motoshige ltoh December 1994 D. EvansSupport Policies in Japan Shujiro Urata 38526
WPS1404 The Republic of Korea's Small and Lirsu Kim December 1994 D. EvansMedium-Size Enterprises and Their Jeffrey B. Nugent 38526Support Systems
WPS1405 Growth and Poverty in Rural India Martin Ravallion January 1995 WDRGaurav Dan 31393
WPS1406 Stnrctural Breaks and Long-Run Javier Le6n January 1995 R. LuzTrends in Commodity Prices Raimundo Soto 31320
WPS1407 Pakistan's Agriculture Sector Rashid Faruqee January 1995 F. WillieIs 3 to 4 Percent Annual Growth 82262Sustainable?
WPS1408 Macroeconomic Management and Jun Ma January 1995 C. JonesIntergovemmental Relations in 37754China
WPS1409 Restructuring Uganda's Debt: Kapil Kapoor January 1995 E. SpanoThe Commercial Debt Buy-Back 35538Operation
WPS1410 Macroeconomic Effects of Terms- Nikola Spatafora January 1995 J. Queenof-Trade Shocks: The Case of Oil- Andrew Wamer 33740Exporting Countries

Policy Research Working Paper Series
ContactTtle Author Date for paper
WPS1411 Income Inequality, Welfare, and Nanak Kakwani January 1995 G. EvansPoverty: An Illustration Using 85783Ukrainian Data
WPS1412 Foreign Technology Imports and Xiaoming Zhang January 1995 C. JonesEcononmic kl. rowth in Developing Hong-fu Zou 37754Countries
WPS1413 Endogenous Distortions in Product Martin Rama January 1995 S. Faionand Labor Markets Guido Tabeilini 38009
WPS1414 TheWorkdBankandLegalTechnical TheWoid Bank January1995 K MathemovaAssistance: Initial Lessons Legal Department 82782
WPS1415 China's GDP In U.S. Doliars Based Ron Ruoen January 1995 E. ORielly-Campbellon Purchasing Power Parity Chen KiW 33707
WPS1416 Informal Regulation of Industrial Sheoli Pargal February 1995 E. SchaperPollulion in Developing Countries: David Wheeler 33457Evidence from Indonesia
