influencing parameters
TRANSCRIPT

INFLUENCING PARAMETERS
RESISTANCE OF ALUMINUM ALLOYS
by
JOSEPH SIGMUND WYCECHB.C.E., University of Detroit
(1970)
Submitted in partial fulfillment
of the requirements for the degree of
Master of Science
in Civil Engineering
at the
Massachusetts Institute of Technology
(September 1971)
Signature of AuthorDepartment of
Certified by
Sivit Engin ering, (Sept, ber 1971)
Thes ~S..--SU -l .or
Accepted by ........... ... ......................Chairman, Departmental Committee on Graduate Students
SEP 27 1971
ON THE FRACTURE

ABSTRACT
INFLUENCING PARAMETERS ON THE FRACTURE
RESISTANCE OF ALUMINUM ALLOYS
by
JOSEPH SIGMUND WYCECH
Submitted to the Department of Civil Engineering on July 7,1971, in partial fulfillment of the requirements for thedegree of Master of Science.
Due to the recent use of high strength aluminum alloysfracture resistance could no longer be ignored, and aluminumalloys had to be categorized on the basis of strength andtoughness. To rate the alloys, three accepted measures oftoughness; the unit propagation energy, the notch-yield ratio,and the stress intensity factor have been used over suchvalues because they indicate correctly yielding beforefracture and can be used to scale very ductile or toughalloys. Also in scaling one alloy against the other, testingvariable such as notch geometry, notch root radius, the ratioof crack length to specimen width, and the type of test mustbe considered with regard to their similarity.
Not only have recent investigations been involved inthe merit rating of alloys but also in the understanding ofthe effects of compositional changes or the employment ofworking or heat treatment. Generally increasing alloyadditions increases strength and reduces toughness, andworking and heat treatment have the same effect dependingupon their degree. Along with compositional changes andvariable processes, quality control can prove to be benefici-al since a large amount of defects such as inclusions,intermetallic compounds, and porosity can create notch effectswhich result in a brittle state and lower toughness. Theabove is applicable to both wrought and cast alloys.
In design, toughness must be considered and can be criti-cal if thick plate is used in welded or unwelded redundantmembers. Usually thick plate exhibits a fracture resistancewhich varies through the thickness and in the longitudinaldirection with the short transverse direction having a toughnesswhich is the least for plate but may be greater than that of

the weld metal for a given yield strength. Concerning welds,the toughness of the filler metal can be greater than that ofthe parent plate, but the yield strength may be less; that is,the toughness of the filler can be greater than that of theparent plate on the basis of fracture resistance alone.
Thesis Supervisor:
Title:
Frederick J. McGarry
Professor

ACKNOWLEDGMENT
The author wishes to thank Professor Frederick J. McGarry
for his support in conducting this survey of published material
on the fracture resistance of aluminum alloys. And gratitude
must be given to the people affiliated with Project Intrex at
the Institute for their help in securing pertinent articles.

TABLE OF CONTENTS
Title Page
Abstract
Acknowledgment
Table of Contents
Introduction
Measuring Fracture Resistance
Compositional Effects
Compositional Effects upon Void Nucleationand Coalescence
Processing Effects
Fracture Resistance of Alloy Castings
Quality Control
Directional Properties of Alloy Plate
Fracture Resistance of Welds
Conclusion
Bibliography and References
Appendix A Footnotes
Appendix B Figures
Appendix C Tables
Appendix D Pertinent Articles Not Avail
Appendix E
at M.I.T.
Pertinent Articles Written inForeign Languages
able
Page
1
2
4
5
6
8
21
34
42
60
66
73
85
101
106
118
126
186
227
236

Introduction:
The rapidly advancing aerospace technology in the last
ten years has produced an increased demand for materials which
can sustain a high working load under a variety of severe
conditions such as cryogenic temperatures and corrosive envi-
ronments. One particular group of these materials are the
aluminum alloys. The aluminum alloys have an advantage over
many other materials for aerospace applications in that they
have adequate strength with a minimum of weight and that the
majority of the alloys do not exhibit brittle behavior with
decreasing temperature. But even with these inherent character-
istics there was some uncertainty of the behavior of these alloys
under the newly imposed conditions such as uses for large
support members in aircraft or space vehicles or for storage
vessels containing cryogenic liquids. Consequently research
was renewed to disclose the characteristics of these alloys
under their new operating conditions and also possibly to
quantitatively measure the fracture resistance of these alloys
for use in design.
This latter objective of the research is of interest
because the aluminum alloys were thought of as being so tough
that fracture resistance need not be considered. But this was
no longer true, for the alloys were being used in greater
thicknesses and higher strengths which inherently meant a
decrease in resistance. Thus the fracture resistance of these
alloys was seen from a new perspective, and a consequence of
6

this was an overall view of the effects of temperature,
composition, processes, and quality control on the toughness
of the aluminum alloys.
The nature of the research was such that it was conducted
on both a qualitative and quantitative level with the majority
of the work being done by the Aluminum Company of America and
Battelle Memorial Institute. Thus a disclosure of what has
been discovered would be beneficial to both the designer and
materials specialist.
The discussion will proceed with the research that has
been done in establishing proper testing methods and quanti-
tative data related to the fracture resistance of these alloys
and then will lead into the analysis of the effects of the
previously mentioned factors on the fracture resistance of
aluminum alloys.

Measuring Fracture Resistance
The simplest means of determining fracture resistance
under static loading is by measuring the elongation or reduc-
tion in cross secional area of a sample. But both these
characteristics or properties have their drawbacks in that
elongation is a measure of a material to deform locally and
uniformly which can be misleading since it is a combination
of two properties, and both elongation and reduction in area
are not correlated to strength which is critical for consider-
ing fracture resistance. Pure aluminum can be used as an
example where it deforms greatly but has little fracture
resistance because of its low strength.
To demonstrate the inability of elongation and reduction
in area in measuring fracture resistance, a comparison between
these two properties and the accepted qualitative measures of
resistance can be shown (1). These accepted measures are the
notched tensile strength to tensile yield ratio (NYR) and the
unit propagation energy (UPE), but before discussing the above
correlation between the two properties and the accepted
measures, the measures must be defined and discussed to demon-
strate their acceptance as standards.
The notch-yield ratio (NYR) as obtained from tensile
tests on notched round specimens measures the ability of a
material to deform plastically in the presence of a severe
stress raiser (2,3,4), and it categorizes a material on a
relative basis as having a high notch toughness if it has a8

notch-yield ratio greater than 1 since this shows that exten-
sive plastic deformation has taken place in the presence of a
notch before the specimen fails in tension. Thus on this
basis the NYR is of value for qualitatively comparing alloys
for their fracture resistance provided the test specimens for
the alloys considered are the same since variability in test
specimens can result in an invalid comparison.
The NYR not only has the advantage of measuring the pos-
sibility of a material to yield locally but also is a better
qualitative measure of toughness with a variety of specimen
notch geometries than the notch tensile strength (5). Figures
1 and 2 show the notch strength and notch yield ratio as a
function of various alloys and notch geometries. The plot
for the notch strength as a function of the above shows a
considerable spread for a particular alloy, but in the plot
for the NYR, the spread is minimized somewhat and there appears
to be a better correlation. There is less confusion in the
relative ratings of notch toughness for any alloy in Figure 2
over the relative rating of the same alloy in Figure 1. This
is illustrated in Figure 2 by the fact that a deep round
notch may have a higher NYR than a deep sharp notch for a
number of alloys, but this does not hold for the notch strength
as shown in Figure 1. Thus in this way the NYR is a valid
means of qualitatively rating aluminum alloys if the notch
geometry is taken into account.
The unit propagation energy (UPE) is the energy to9

propagate a crack in a Kahn type tear specimen. And it is simply
measured as the area under the load deformation curve divided
by the net sample area (see Figure 7 for specimen and proper
area of load deformation curve). The acceptance of the UPE is
derived from the fact that it is inexpensive to determine by
means of a tear test, it can be determined for any specimen
orientation within any alloy product, and can compare brittle
and very ductile alloys on a quantitative basis because there
are no test restraints on the mode of fracture, level of applied
stress, nor amount of plastic deformation. Another reason that
it is a primary measure of fracture resistance is that it takes
into account both strength and ductility of the alloy and is a
measure of conditions for crack instability.
Other tests similar to the tear test are the drop weight
tear test and the explosive tear test (6), but their use in
determining a propagation energy has not been widely accepted
possibly because the explosive tear test requires abnormal
testing conditions and the drop weight tear test is basically
a charpy impact test. The results of such a test should not be
used for merit rating or comparing aluminum alloys (7) because
the purpose of a charpy test is to determine a transition
temperature. But for aluminum alloys a transition temperature
does not exist.
Thus using the NYR as obtained from tensile tests on a
one-half inch diameter specimen, Figures 3 and 4 show that
there is a broad and not very useful relationship between
10
elongation, reduction in area, and the NYR. Figures 5 and 6
show the same correlation for elongation and reduction in area
except that the UPE is used as a basis for a comparison. The
last two figures again show a wide scattering of data points.
Thus from these experimental results, the elongation and
reduction in area of an aluminum alloy cannot be considered as
valid measures of fracture resistance.
As stated previously, the NYR and UPE are accepted as
valid measures of fracture resistance on a qualitative or rela-
tive basis. But there is a third measure, namely, fracture
toughness which is a design related, quantitative index of
fracture resistance. The first two measures have for their
purpose the screening and comparison of aluminum alloys during
development, and the third measure of resistance has been
developed for use in design based upon fracture strength rather
than a yield or plastic failure criterion.
Fracture toughness is measured in a variety of ways.
Usually tensile tests of center slotted and single edge notched
bend tests are employed. Figure 8 shows typical specimen
configurations for these tests (3,8,11). For all these test
specimens, a "thickness" and "deviation" criterion must be met
to insure measurement of toughness under plain strain conditions
in the specimen (9). That is, the thickness of the specimen
must be 2.5 times the ratio (kI c/y S) 2 and any deviation
from linearity in the load deformation curve prior to the load
used for the kI calculation must primarily represent crackc 11

extension as indicated by:
secant offset at 0.8P < secant offset at P<.5 - secant offset at P 5
where P5 is the load at secant offset of 5 per cent.
This can also be restated that the horizontal displacement of
the load deformation curve from the initial slope at a load of
80 per cent of that at the 5 per cent secant offset intercept
1shall not be more than of the displacement at the 5 per cent
secant offset intercept (8,9).
Typical load deformation curves for center notched, single
edge notched, and notch bend specimens are shown in Figures 9,
10, and 11. And if the load deformation curves conform to the
deviation criterion and the specimen to the thickness require-
ment, plane strain conditions will be exhibited, and the
fracture toughness will be of its lowest or most critical value.
But two other criteria must also be checked before the above
statement is completely valid; they are: rapid fracture must
take place at nominally elastic stresses and that all specimens
must be fatigue cracked because machine notching can lead to
higher or unconservative values of kI or fracture toughness.c
Only after all the above constraints are satisfied will the
value of k be a reliable parameter useful in design.c
Recently work has been done in correlating the three
measures of fracture resistance. The reason for this is that
in the tests determining fracture toughness not all the criteria
can be met especially maintaining a nominal elastic stress.
12

Thus the reported values of toughness for very ductile and tough
alloys are invalid, and if a general relationship can be
determined between the results of qualitative tests and fracture
toughness, a true plain strain intensity factor for a tough
alloy can be determined by simply evaluating the UPE and then
using the general relationship. This has been done (2,4,10),
and Figures 12, 13, and 14 show a direct correlation between
the critical stress intensity factor (Fig.12), the plain strain
intensity factor (Figs.13 and 14) and the unit propagation
energy. Note that the values for the stress intensity factors
are obtained by means of tensile tests on center slotted
panels and the propagation energies by Kahn type tear tests.
Also Figure 13 is essentially the same as Figure 14 except that
it employs a linear approximation whereas the latter uses a
parabola to fit the data. But neither curves differ by an
appreciable amount. Thus it is possible to determine the
toughness, kc or k, , of an aluminum alloy no matter how toughc
it is by means of a tear test, and it offers confidence in the
merit rating of the various alloys on the basis of tear test
results.
Similar conclusions using the notch yield ratio correlated
with fracture toughness have evolved (4), but the correlation
is only good for rating or comparing alloys since no direct
relationship between the NYR and kc or kI can be establishedc
with confidence because the NYR is dependent upon specimen
13
geometry and is thus variable. Also Figure 15 shows a lack of
correlation between the NYR and UPE with a NYR greater than 1.
Thus if a linear relationship holds for the fracture toughness
and UPE, there cannot be a direct correlation between the NYR
and toughness with a NYR greater than 1, and this seems to be
validated by Figure 16 except the linear extrapolation for
higher ratios is in some doubt. Thus the qualitative tests are
valuable in comparing or merit rating of alloys, but the
results of the tear test also have a direct relationship with
fracture toughness and is thus more valuable especially in
considering the inexpensiveness of the test and the few
constraints upon the testing conditions.
For merit rating of aluminum alloys and also for their
measurement of toughness, there is an important consideration,
namely, that alloys cannot be compared on the results of tests
using different specimens and/or notch configurations or similar
stress concentration factors with different specimens or notches.
Table 1 and Figure 18 show the results of tensile tests taken
on the specimens in Figure 17. Figure 18 clearly shows a
dependence of the notch yield ratio upon the theoretical stress
concentration factor which implies that data for one alloy
cannot be compared to data for another alloy with the same
concentration factors without specifying the notch geometry (12).
From Table 1 one can see that the large specimens have an
appreciable variation in notch-tensile strength or, in turn, a
14
notch-yield ratio with different notch-tip radii and corres-
ponding concentration factors, but for other specimens with a
shallow notch the implied NYR varies slightly (12). Also the
toughness of the alloy is different for various configurations
of stress concentrators. For a particular kt, one type of
specimen provides a lower notch yield ratio over another
specimen, but for varying concentration factors, the reverse is
shown in Table 1. Note that even specimen thickness has a
varied influence on the toughness of the alloy for various
stress raisers, and this is also validated by Table 2 which
shows the NYR as a function of specimen thickness as derived
from the results of a slow bend test (13). Table 2 shows the
ratio decreasing with increasing thickness thus inferring a
possible constraint on local yielding. But the calculated
plane strain concentration factor does not vary with specimen
thickness thus showing a lack of correlation between the NYR
and kI and definite plane strain conditions. But the pointc
is that for merit rating of aluminum alloys based upon the NYR
or toughness, all the above factors embedded in specimen
design must be considered in order to validly scale one alloy
against another for their fracture resistance.
Other specimen parameters which must be considered when
comparing alloys are the widths and crack lengths of the test
specimens. Figures 19 and 20 show that the calculated
1toughness k using the notch strength analysistoughness k using the notch strength analysis of a centerc
15
notch panel increases with increasing specimen width for a given
crack length and conversely decreases with decreasing crack
length of given panel width. For the particular alloy plate
tested, the ratio of highest to lowest k is about 1.5 for ac
crack length to width ratio of 0.33 indicating a toughness-
specimen configuration dependence (141. This is invalidated
somewhat by Figure 21 which shows the variation in crack
extension force, Gc, which is directly realted to toughness
with specimen width at 780 F. and -320 0 F. But these plots are
obtained by surface flow specimens which no doubt show a differ-
ent response to tensile fracture than a through crack specimen.
The discrepancy could probably be due to the difference in
crack propagation system and variability of grain structure
through which the crack is propagating. Note that for the
material of higher fracture toughness in Figure 21, the
specimen width affects the toughness more; thus for materials
of low toughness, narrower specimens can be used to obtain
satisfactory results (15). But the toughness is relatively
invariant with specimen width for the 2014-T6 alloy which does
not necessarily imply the same result for other alloys (15).
One cannot compare different alloys with various specimen
widths assuming other parameters to be the same and say that
there is a relative correlation of fracture data between alloys.
The specimen width should be taken into account along with the
crack length to width ratio despite the results of Figure 21.
16
But as stated before, the lack of correlation between Figures
20 and 21 could be based upon the differences in the testing
method and not necessarily the response of the material.
Another important aspect of comparing alloys based on
their fracture resistance is the specimen type and crack
propagation system as used in a fracture toughness test. As
mentioned previously, the fracture toughness of an alloy can
be obtained by means of tests on center slotted panels, single
notched edge tensile tests, or notch bend tests (3,16,17). Tests
using surface flaw or wedge opening specimens have been run (16)
and have shown data for the critical stress intensity factor
which varies considerably from the values obtained from the
other above named tests. Figure 22 shows the crack propagation
systems employed in the notch bend and wedge opening tests and
illustrates the propagation direction with respect to R, the
rolling direction, W, the plate width direction, and T, the
direction of plate thickness. These coordinate systems are
also used in the other specimen types. Figures 23 and 24 show
the results of toughness tests using the above specimen types
and various propagation systems. From Figure 23 the SF specimen
always yields the highest toughness for the same crack propaga-
tion system followed by, in decreasing order, the SB, SEN, and
CN specimens with the same crack propagation system. Also for
the same material and crack system the SEN and CN results are
very close, and the toughness as determined by the SB and SF
17
specimens give results which are higher than SEN and CN
specimens. The reason for the high results of the SB and SF
specimens could be due to the friction effects of the three
point loading in the SB test and the sensitivity to material
variability in the SF specimens (16). However, the overall
variability of the results in Figure 23 is probably due to the
differences in specimen type. Figure 23 also shows that there
is no strong crack orientation effect; that is, the results
from different crack propagation directions as derived with the
same specimen types are about the same even though the crack
orientation is different. But one can see from Figure 23 that
there is a strong crack propagation direction influence upon
toughness of a particular alloy with the same specimen type.
Thus the crack propagation direction is important when a com-
parison of alloys is made using any of the above tests. Figure
24 also shows results which validate this point.
Shown in Figure 25 is the effect of the root radius upon
the toughness with a "corner" characteristic of the various
graphs as the /-Y, / the root radius, reaches a value of 0.1
/ inches (18). Thus if the artificially produced cracks in the
test specimens do not have small enough radii, inaccuracies in
predicting the toughness will result. Table 3 shows the
results of tests using three accepted toughness test specimens
of various alloys. The data is obtained using the "thickness"
and "deviation" criteria as pointed out previously, and the
18

results show that the apparent toughness as determined from
the initial departure from linearity or the 5 per cent secant
offset in the SEN and NB tests agree quite well. But the
results of the CN tests are higher by 5 to 20 per cent. This
is due to the fact that the notch in the CN specimen is not
fatigue cracked and possibly the "corner" on the toughness-
root radius curve is not achieved by machine notching. Thus
the importance of achieving a sharp enough crack is the
acquisition of valid values of toughness, kI , and recent ASTMc
requirements state that all toughness specimens must be fatigue
cracked so that a root radius of less than 0.001 inches be
achieved.
Thus when making a comparison of various aluminum alloys
based upon their fracture resistance as measured by the notch
yield ratio or fracture toughness several points must be
considered:
1. The notch geometry of the various specimens along
with theoretical stress concentration factors
should be the same for the various alloy specimens.
2. The notch tip radius for each specimen notch
should be less than 0.001 inches.
3. The thickness should be greater than 2.5 (k I / )y) 2
when measuring the plain strain intensity factor.
4. The same crack length to specimen width ratio should
be maintained for each alloy specimen tested.
19

5. Any correlation of fracture resistance of one alloy
versus another must be based upon the same specimen
type; that is, if toughness of various alloys are
to be compared, results from tests on CN specimens
should only be used and not results from a variety
of tests. 2
6. The crack propagation direction is important in making
a comparison of various alloy plate because they
show a considerable degree of anisotropy,and the
same propagation directions should be maintained
for all alloy specimens so as to make a comparison
based upon toughness in a specified direction.
Thus when only considering the above qualifications is one
prepared to make a comparison of aluminum alloys based upon
tests to determine their fracture resistance.
20

Compositional Effects
For an aluminum alloy, the amount and relative proportion
of alloying elements not only have a substantial effect upon
yield strength and elongation but also fracture resistance.
Figure 26 and 27 clearly validate this by showing a probable
band of fracture toughness as given by the plane strain stress
intensity factor and the unit propagation energy versus the
yield strength. The band is given for two series of high
strength alloys; the 2xxx series which has copper as its main
alloying component and the 7xxx series which is alloyed with
zinc, magnesium, and copper. For a given yield strength, the
7xxx series has a higher toughness than the 2xxx series which
is due to the different alloying elements. And for a given
series, the toughness varies inversely with the yield strength
due to the amount and type of alloying element and the heat
treatment employed. Both series of alloys derive their
strength from the precipitates which are formed with the har-
dening elements of zinc, magnesium, and copper. And the type
and amount of precipitate that is formed is dependent upon,
again, the heat treatment. But for this present discussion
only the effects of the addition of different alloying elements
will be revealed and the effects of heat treatment will
subsequently follow.
Most of the investigation into the effects of aluminum
alloy composition on the room temperature fracture resistance
21

has been directed towards the high strength series, 2xxx and
7xxx. This is no doubt due to the fact that the 5xxx and 6xxx
series and their various tempers are relatively tough but have
a lower yield strength. Thus the aim of the investigation is
to determine the possibility of obtaining high strength alloys
with a high level of toughness. But Figures 26 and 27
illustrate that an optimum appears to be unlikely at this time.
What is important though in the results of the investigation
is that likely reasons for the inherent inverse relationship
between toughness and strength of the two series have been
published and are worthwhile discussing.
The results of the investigation show that the nature and
number of precipitates in the above heat treatable alloys is
the key to explaining how adequate fracture resistance is
derived. But first, the source and formation of these har-
dening particles must be disclosed for a better understanding
of a possible approach to achieving the above objective of
optimizing toughness and strength.
For both series the source of yield and fracture strength
is the amount of precipitate which is formed from the alloying
elements. If the solid solution 3 becomes supersaturated with
alloying elements at high temperatures, the solute formed by
the alloying elements will precipitate out of the solid
solution and form concentrations of solute as the temperature
decreases. Naturally, the amount of precipitate depends upon
the degree of supersaturation and the decreasing temperature.
If the quenching is rapid, the supersaturated state is main-
tained to room temperature after which the precipitates begin
to form until equilibrium is reached as the alloy ages naturally
or artificially.4 If the quenching is slow, the precipitates
will form without aging along grain boundaries rather than in
the matrix and will cause a reduced strength of the alloy.
The precipitates can be either found in the matrix itself or
along grain boundaries. But in general, the precipitates will
form or nucleate at sites of greater disorder and higher energy
such as grain boundaries, subgrain boundaries, and dislocations5
(19).
Close to room temperature or during the initial stages of
artificial aging at moderate temperatures, solute in the solid
solution begins to cluster together and form Guinier-Preston
(GP) zones within the matrix. This concentration of solute
causes a distorted lattice within the matrix and the zone
itself. Thus this distortion causes an impedence to dislocation
movement which means a reduced fracture resistance by creating
local stress concentrations and an increased yield strength.
As aging continues, these zones form a transition precipitate
which is different from the crystal structure of the solid
solution and the final equilibrium phase. The transition
precipitate is continuous with the solid solution; that i3,
both precipitate and solvent exhibit the same strain and are
not separated by any phase boundary. In other words, the two23

are coherent.
After prolonged aging the transition particles grow in
size and reach the equilibrium condition which means that
coherency with the solid solution is lost because the bond
between the two is broken. This results in a decrease of
yield strength and demonstrates that the heat treatable alloys
have a peak yield strength which is dependent upon the aging
conditions.
One of the major reasons that the GP zones form at low
temperatures is that there are vacancies in lattice positions
of the crystal. That is, atoms do not occupy all the expected
positions. Consequently, at these locations the solute can
concentrate to form the strengthening zones. Another inherent
characteristic of the vacancies is that they can migrate just
as dislocations and one result of this is that sites fdr
nucleation of precipitates adjacent to grain boundaries do not
exist because vacancies and dislocations have moved to the
boundaries leaving a depleted zone of nucleation sites. This
depleted zone is distinct from the grain interior and the
boundary and is termed the precipitate free zone (PFZ). The
PFZ is thought of as being a major influence upon the fracture
resistance of these high strength alloys, and it usually varies
directly with the amount of grain boundary precipitate. But
grain structures are possible with a narrow PFZ and large
amount of boundary precipitate depending upon the heat treatment
employed.

With this general introduction of the critical parameters
which control the mechanical properties of high strength
aluminum alloys, the differences in fracture resistance as a
function of yield strength for the two series can be given.
Basically, for the 2xxx series which is formed with
alloying elements of copper alone or copper and magnesium,
the precipitates are in the form of flat platelets which are
aligned with the [100] crystal planes. For the 7xxx series,
GP zones are the main dislocation barriers and are usually
spherical in shape (20). For example, two alloys of the same
yield strength, 2024-T86 and 7075-T6, have a considerable
difference in toughness as given by Figure 26. The reason
for this is that the larger precipitate platelets (500 to0
1000 A) of the 7075-T6 alloy cause dislocation pile-up which
result in an increase in local stress, possible void nuclea-
tion, and reduced toughness. Thus the difference in size of
the precipitates in the two alloy series is the reason for
the great difference in toughness.
The principle hardening elements of both series have
generally the same result upon toughness as measured by the
UPE as their amount added to the solution is increased.
Figures 28, 29, and 30 show the effects of the addition of
zinc plus magnesium, zinc, and the saturation ratio of zinc,
magnesium, and copper.6 Note that the UPE steadily decreases

with increasing saturation ratio or per cent addition until a
near zero value is reached (actually the constant UPE is esti-
mated at 50 in -lb/in2). This is no doubt due to the increased
number and size of precipitates which are formed and interfere
with dislocation mobility.
In Figure 26, the 2020-T6 alloy has the lowest toughness
and highest yield strength with compositions of 4.5 pct.
copper, 0.2 pct. cadium, and 1.3 pct. lithium. The last two
alloying elements cause a greater number of precipitates to
be formed and thus reduce the toughness even though the copper
content is the same as in the 2024 alloy without the additions.
Thus the slight additions of these alloying elements must
create mucleation sites for further precipitate growth (20,21).
Similar to the effect of additions of cadium and lithium
to the aluminum copper series is that of manganese. Manganese
when added to aluminum copper alloys containing 3 and 4.5 pct.
copper causes nucleation of precipitates. But the distinction
is that these precipitates do not form along grain boundaries
but rather at alternate sites in the matrix afforded by fine
particles of manganese containing compounds. The result is
transcrystalline fracture which implies an increased fracture
resistance (22). This has been validated up to manganese
contents of 2 pct., and any increase in this percentage will
cause grain boundary precipitation to increase and thus reduce
fracture resistance. But no results of tests using increased
26

manganese contents above 2 pct. have been reported and the above
conclusion is speculative but does seem reasonable in the light
of the previous discussion of the increasing additions of the
other alloying elements.
Note that this discussion has been restricted to the
effects of the amounts and sizes of the precipitates, and only
a brief mention has been made with respect to the effects of
the location of precipitates.
As implied previously, the grain boundaries appear to be
the preferred locations for the nucleation of precipitates.
And since increases in the number of precipitates means a
decreased fracture resistance and intercrystalline fracture,
a discussion of the nature of cracking along the grain boundary
is necessary for an understanding of the fracture process.
Figure 31 shows the effect of the area fraction of the
grain boundary precipitates upon the plane strain stress
intensity factor and the mode of fracture. This figure shows
that toughness is reduced and cracking is primarily confined
to the grain boundaries as the amount of precipitates increases.
For predominantly intercrystalline fracture and low toughness,
the amount of precipitate has little effect.
The reason that the grain boundary precipitate confines
the cracking to the boundary is that with higher concentrations
there is a difference in strength between the boundary areas and
the interior and that larger precipitates reduce the strain
27

necessary to create voids ahead of the advancing boundary crack
meaning that the cracks will not go into the grains but follow
the boundaries even though going through the former is the most
direct route (23). Also if the matrix yield strength is higher
than the grain boundary region, localized strains will occur
in the region thus increasing the likelihood of grain boundary
cracking with larger precipitates. Thus grain boundary preci-
pitates play a definite role in the fracture resistance of the
high strength alloys and even more so than the matrix
precipitates. This can be seen in Figure 30 which is derived
by using heat treatments which keep the number and size of
matrix precipitates constant and in using fine manganese
particles in an aluminum copper alloy which results in trans-
granular fracture rather than intergranular simply because the
number of boundary precipitates is reduced assuming that a
maximum of 2 pct. manganese is employed.
Also as part of the study performed on the effects of
boundary precipitates are the effects of varying the PFZ width
(23). Originally large PFZ widths were thought of as being
necessary to provide adequate fracture resistance because they
could relieve local stresses by yielding in the PFZ when narrow
bands of dislocations impinged upon the grain boundary in con-
centrated alloys. This interaction of the wide PFZ and impinging
dislocations could possibly reduce the susceptability to
boundary cracking especially if larger precipitates are present

(24). But this has not been validated by any test measuring the
accepted quantities of fracture resistance as a function of the
PFZ width. What actually has been discovered and can be seen
in Figure 32 for an Al - 6% Zn - 3% Mg alloy is that the plane
strain stress intensity factor along with the mode of fracture
is invariant with the PFZ width for a given yield stress. This
is contrary to what has been formerly proposed, but it illus-
trates the uncertainty of what role the PFZ width actually plays
in the fracture resistance of high strength aluminum alloys.
This test which is performed by means of a notch bend test on
a variety of samples under a variety of heat treatments is a
step in the right direction. But more data has to be gathered
before one can positively say that there is no correlation be-
tween the PFZ width and fracture resistance.
An important thing to recognize in the above discussion
on the effects of grain boundary precipitates and PFZ width on
fracture resistance is that sufficient resistance can only be
obtained if cracks are prevented from nucleating and propagating
in the grain boundaries. And this is the key to obtaining high
yield strengths with high toughness.
One effect of increasing additions of alloying elements to
the solid solution has been decreased toughness with cryogenic
temperatures. The reason for this is that the substitutional
atoms usually have varying atomic radii which are quite different
from the parent aluminum atoms. This difference in radii between
atoms causes a distortion in the lattice, and this distortion
becomes effective at very low temperatures (-3200 F. to -4230F.)
because the thermal energy of the atoms decreases and restricts
the movement of atoms or molecules. Thus the substitutional
elements are frozen in place and can act as dislocation barriers
which may lead to local stress concentrations, and reduced
toughness. At higher temperatures (-3200 F. to +1000F.) the
atoms or molecules can move about and cannot impede dislocation
movement. Thus the alloy remains relatively tough. But note
that this is only valid for a specific composition of alloy
within a temperature range, but if more or less of the alloying
elements are added, the toughness will decrease or increase
accordingly as pointed out previously. Thus the distorted
lattice approach to decreased toughness is only applicable for
the -320 0 F. to -4230F. range.
Figure 33 shows the effect of using substitutional elements
of varying radii upon the notched to unnotched tensile strength
which isn't a valid measure of resistance but should suffice to
show the effect of varying the substitutional atomic radii upon
the fracture resistance of a variety of aluminum alloys. Note
that the horizontal axis of the figure gives the summation of
the product of the atom per cent and the difference in effective
atomic radii between the elements and aluminum (26). And for
increasing abscissa values, the measure of resistance decreases
at the temperature of -320 0 F. The reason for this is the
dislocation pile-up due to larger substitutional particles which
are rather immobile.
A typical example of the effect of different radii can be
seen in Figure 347 by comparing the notched to unnotched tensile
ratios of 2024-T3 and 6061-T4 alloys at -423 0 F. Both of these
alloys have a drastic reduction of fracture resistance as
compared to the 2014-T6, 2024-T4, 2219-T81, 2219-T3, and 6061-T6
alloys because 2024-T3 has a highly strained lattice due to
increased alloying additions up to 8.7 pct. as compared to 6.5
pct. for the other alloys in the 2xxx series and 6061-T4 has
larger amounts in solid solution of Fe, Mg, and Si which have
large effective atomic radii as compared to aluminum. Note
that the alloy composition of 6061 is 2.7 pct. as compared to
6.5 pct. of 2014 or 2219 (see Table 4) implying an increased
toughness at -423 0F., but this is not so due to the large
effective radii of Fe, Mg, and Si which cause local stress
concentrations and reduced toughness.
Similarly other alloys can exhibit this decreased toughness
down to -423 0 F. Specifically some of the common alloys in the
5xxx and 7xxx series have been tested for their toughness down
to -423 0 F. and show that the toughness decreases considerably
from -320 0 F. to -423 0 F. for the 5xxx series alloys and from
room temperature to -423 0 F. for the 7xxx series alloys (27,28).
This can be seen in Figures 35 and 36 which show the toughness
as measured by the notch to unnotched tensile ratio as a
31
function of temperature for several alloys in both series. Note
that the toughness of the 7xxx series alloys decreases faster
with decreasing temperature than the 5xxx series. This is the
result of the 7xxx series alloys having a larger percentage of
alloying elements than the 5xxx series which is validated by
Tables 5 and 6 which show the composition of the various alloys
tested in the two series. For the 7xxx series, the amount of
Zn, Mg, and Cu added is crucial to the temperature-toughness
dependence because in Figure 36 the 7079 sheet alloy has a
greater toughness than the 7075, x7275, and 7178 alloys along
with the least amount of zinc. Apparently, of all the alloying
elements, zinc seems to have the greatest effect upon the
toughness-temperature interaction since the total amount of
alloy in the above 7xxx series is the same even though the
amount of zinc is less (see Table 6). No doubt this is a reflec-
tion of the difference in atomic size between zinc and aluminum
and also shows again the importance of alloy addition.
Consequently, both the amount and demension of the alloying
element must be considered when an aluminum alloy is required
to have a high fracture resistance in a low temperature range.
In summary, reported results show that:
1. The number and size of matrix precipitates are the key
to high yield strength of an aluminum alloy rather
than grain boundary precipitates because dislocations
are more readily found in the interior of the grains

rather than along the boundaries.
2. Increase in the number and size of grain boundary
precipitates decreases the toughness of the alloy.
3. Matrix precipitates have little effect upon toughness
as compared to grain boundary precipitates.
4. The amount and size of the precipitates are dependent
upon the degree of saturation of the alloy meaning
that increasing the amount of alloying elements in-
creases the amount of precipitate and reduces toughness
over a large range of temperatures.
5. The size of the alloying element relative to the
aluminum atom is critical for cryogenic applications,
-320 0 F. to -423 0 F. since it causes lattice distortion
which impedes dislocation mobility.
6. The PFZ width may or may not have an effect upon
fracture resistance but the small amount of data to
date seems to indicate that the width of the PFZ has
little effect upon toughness.
Thus all of the above must be considered when trying to opti-
mize both strength and toughness. And in the futurerpresent
questions such as the effect of the PFZ may be answered giving
further information towards attaining the above objectives.

Compositional Effects upon Void Nucleation and Coalescence
For the commercially available aluminum alloys, the
predominant mode of fracture is a normal or dimpled rupture.
This type of failure is the result of the formation and coales-
cence of voids formed by the cracking of inclusions or precipi-
tates or by the separation of these particles from the matrix.
Microscopically the fracture surface is pocked marked with
craters called dimples which reflect the amount of necking of
bridges between voids and also the level of toughness where
shallow dimples represent low toughness and deep dimples high
toughness. From the macroscopic point of view, the fracture
surface is normal to the direction of applied stress and appears
to be quite similar to the fracture surface of the cleavage
mode.
For this particular type of failure of the aluminum alloys,
the plane strain condition is critical since plastic deformation
is localized around the crack tip, the stress for plastic flow
is higher, and the stresses are of a triaxial nature which have
a definite effect as will be discussed subsequently (30). Under
plain strain conditions, the critical crack opening displacement
for instability, V*(c), is reduced for a given notch length and
tip radius, and the strain to fracture is less. This is com-
pletely opposite to the plane stress condition where the crack
displacement can be large and the alloy can exhibit considerable
strain and distortion before fracture.
34

As mentioned before, this type of failure, normal rupture,
is composed of void formation and coalescence. And both of
these components of failure link up to form the critical crack
opening displacement, V*(c), associated with instability.
V*(c) is the sum of the displacements at the crack tip derived
from void formation and the joining of the voids and tip
together by plastic tearing (29). Thus if there is a large
strain required to create and coalesce voids, the value of V*(c)
will be large and the alloy will be tough.
For void formation the tensile stress in the alloy must
be such as to crack the hardening particles or separate them
from the matrix. The magnitude of stress to accomplish this
is given by (29):
Myp nb
where M is a numerical constant
y is the work to crack a particle
n is the number of dislocations piled up
b is the Burger's vector8
Note that a will be lower for larger and more numerous particles
and higher for smaller and less numerous particles. (30,31,32),
and if cross slipping can occur, a screw dislocation will
follow the path of least resistance and dodge obstacles in its
way by sliding over the plane on which the obstruction lies,
and consequently dislocation pile up and n will be reduced and
35

a increased. Concerning the work of cracking, it is higher
for precipitates than for inclusions of the same configuration
since the precipitate is strongly bound to the matrix. Thus
one can expect aluminum alloys with a considerable amount of
inclusions to be less tough than the same alloys without them.
In Figure 37a the magnitude of particle fracture strength
is given as a function of the particle size and shows the inverse
relationship between the two. Figure 38 shows the results of
notched tensile tests on an aluminum 6.1 pct. Si alloy and
demonstrates that for a given failure stress the size of the
particles fractured is greater than the size of unfractured
particles thus validating the theoretical prediction of Figure
37a that increasing particle size reduces the particle fracture
strength and one is likely to find a greater number of broken
particles. Note that in a typical alloy there will be a dis-
tribution of strengthening particle sizes as given by Figure
37b and that the distribution of the average distance, X,
between these particles will be inversely proportional to N,
the number of particles having a size either greater or less
than the given particle size, p*. Thus if the particles are
smaller or larger than p*, the average distance between them
will increase, and for particles larger than p*, the particle
fracture strength, a , will decrease as average spacing between
particles increases, Figure 37d. This relationship between a
and A can be taken as the fracture strength of a particle at a
36

distance, r, from the crack tip in an aluminum alloy because
the order of spacing between the crack tip and the particle is
the same as the distance between particles (31) (see Figure 39).
In a notched condition, the longitudinal stress builds up
from the yield point at the crack tip to a higher value of
I 91 (y) at a distance from the tip and then remains constant
within the plastic zone (31). In Figure 39 high yield strength
means that small particles are cracked and voids are easily
nucleated at distances close to the crack tip. This means that
the plastic zone size is smaller and that the crack opening
10displacement, V(c), is less. Thus there will be little
plastic deformation in the area of the crack tip, and the alloy
can exhibit reduced toughness. Note that this is only the
effect of adding elements resulting in precipitates and inclu-
sions and that in plane strain conditions toughness can be
even reduced further since there is also a material restraint
to the growth and formation of the plastic zone at the head of
the crack.
Basically the above discussion has only been concerned
with the effects of alloy additions to void formation and
consequent toughness. But what about the effects of alloy
additions to void coalescence since it is also critical in
attaining adequate toughness?
To answer this, the critical crack opening displacement,
V*(c), can be used to demonstrate the variability of toughness
37

with composition. The value of V*(c) is made up of two com-
ponents, crack displacement due to void formation and void
coalescence, and it is a suitable measure of toughness11 since
a small value of V*(c) means that the crack has to open very
little before instability occurs, and a high value of V*(c)
indicates that considerable crack blunting and large plastic
deformation is occurring at the crack tip resulting in slow
crack growth and high toughness. The void coalescence displace-
ment contribution to V*(c) is a measure of the work necessary
to join the first void ahead of the crack and the crack tip.
If there is considerable displacement, the material between
the first void and the tip will stretch and yield and the void
will appear as a deep dimple on the fracture surface. Thus the
alloy will be relatively tough. And if the displacement is
small the opposite is true. Usually this mechanism of failure
occurs by a shearing process (33) and is proportional to
E (c)p where p is the crack tip radius and Es(c) is the ductile
fracture strain which is given by:
(1-n)Zn( £02b )
sin h [(1-n)(o + a ) / 27//-3xx yy
where b0 is the initial radius of a cylindrical hole
z0 is the spacing between holes
n is the strain hardening exponent whose stress-
strain curve is 0 n
and
a xx/ and a yy/ are constant transverse stress ratios
under a plain strain condition.
Thus if £0 is taken as the spacing between the first void and
the crack tip, the fracture strain and the crack opening
displacement will decrease as the void spacing, k0 = r,
decreases resulting in a lower work required for void coales-
cence and consequent reduced toughness. Note also that the
fracture strain will be reduced if the density of voids is
increased which is due to increasing the number and size of
hardening inclusions or precipitates. Thus the same parameters,
a and a , which governed void formation also affect the abilityy pto coalesce voids in the same manner; that is, increasing the
yield strength or reducing the particle fracture strength,
reduces the work to coalesce the voids formed by the particles
and reduces toughness.
For the comparison of the 2xxx and 7xxx series alloys, the
reason that the 7xxx series has a higher toughness than the
2xxx series is the increased size of the precipitates in the
aluminum copper series. In the light of the above discussion,
the larger precipitates increase dislocation pile up, reduce
the particle fracture strength, a , and increase the yield

strength. Consequently void formation and coalescence is easily
accomplished without a large fracture strain, and a reduced
toughness results relative to that of the 7xxx series. Within
each of the series, the toughness decreases as the amount of
alloying elements increases because the amount of precipitate
increases. This again results in the same mechanism of reduced
dislocation mobility, etc. and diminishes fracture resistance.
Under cryogenic conditions the 5xxx and some of the 2xxx and
6xxx series alloys have a reduced toughness at temperatures
below-320 0F. and 7xxx series alloys below ambient temperature.
The reason for this is that cross slipping of dislocations can
no longer occur and pile up intensifies and reduces the particle
cracking strength, a , which leads to increased void occurrence
and reduced toughness. At higher temperatures these alloys
allow for cross slipping of dislocations because the atoms of
the inclusions or precipitates are vibrating and moving in a
random fashion allowing dislocation movement. The result is
that the particle fracture strength is higher and the toughness
greater. Note that this is an analysis of an alloy of given
composition within a series under lower temperatures. Naturally,
alloys of the same series will have different toughness-
temperature characteristics because their compositions will
differ.
Thus the above discussion illustrates how the composition
of an alloy based upon the amount and size of inclusions or
40

precipitates which are formed by alloying additions can affect
the fracture resistance of aluminum alloys by influencing the
ease at which void formation and coalescence can occur.

Processing Effects
In trying to determine the best strength-toughness com-
binations, a metallurgist has several methods available which
he can use. These methods are basically changing the composi-
tion, employing heat treatment, or simply working the alloy to
achieve desired results. But as discussed previously, just
adding more alloying elements tends to increase strength and
decrease toughness due to the increased number and size of
zones and/or precipitates which are created during heat
treatment or working. To achieve good toughness and strength
both compositional and processing effects must be considered.
But for the present discussion only the effects of processing
will be disclosed.
The processes available are annealing, strain aging,
solution heat treatment, quenching, and natural or artificial
aging. These treatments along with their combinations have
been given special designations which are listed in Tables 7
and 8, and a distinction is made between heat treatable (2xxx,
6xxx,7xxx) and non-heat treatable alloys (lxxx,3xxx,4xxx,5xxx).
The reason for this is the fact that the non-heat treatable
alloys do not respond to the solution and aging treatments of
the heat treatable series; that is, their mechanical properties
are not enchaced by these processes.
Note in Table 7 for the strain hardened alloys, the
variation in mechanical properties is dependent upon the
42

working and/or the heating of the alloy at low temperatures or
to a partial anneal. But in Table 8 the variation of properties
of the 2xxx, 6xxx, and 7xxx series alloys depends upon heating
practices such as annealing or solution treatment, the amount
of cold work, and the type of aging. Thus these processes are
quite different for the two types of alloys and have a pronoun-
ced effect upon both strength and toughness as will be discussed
subsequently.
In order to understand what the effects of these various
processes are, one must examine each process separately with
regard to how it affects the microstructure of the heat
treatable or non-heat treatable alloys.
For the non-heat treatable alloys, there are basically
three types of processes that can be used: the as fabricated
temper, F, in which the wrought alloy is worked without consi-
dering the degree of working, the annealed temper, 0, in which
the alloy is recrystallized and no effects of working remain,
and the strain hardened tempers, Hl through H3, in which
controlled amounts of working are used to obtain desired
strengths. Of the commercial wrought alloys available, the F
temper is seldom used and only the 0 and H tempers are employed
depending upon the desired mechanical properties.
12In the strain hardened tempers, the alloy is stretched
varying amounts, and consequently the yield strength varies
directly with the amount of deformation since increased working
43

means an increased fragmentation of grains and density of dis-
locations. These increased dislocations cause immobility and
interactive stresses which result in a higher yield but lower
toughness. Thus if the alloy is worked extensively,13 the
toughness will decrease due to increasing the number of
dislocations which can pile up on dispersed hardening particles
and/or inclusions and reduce the fracture stress.
To alleviate the effects of strain hardening, annealing
can be used to recrystallize the alloy and remove all disloca-
tion concentrations either within the grain or along their
boundaries. This is done by heating the alloy to high tempera-
tures (4500 F. to 775 0 F.) for a length of time depending upon
the composition and the degree of prior cold or hot working.
Usually greater degrees of cold work result in a lower tempera-
ture and less time of annealing for recrystallization, and hot
working and greater composition result in an opposite effect.
Thus if the alloy is quenched from the annealed state, one can
expect higher toughness and lower strength than the strain
hardened condition.
This is validated by Figure 40 which shows the UPE and
yield strength as a function of temper. Note the annealed
state gives the highest toughness and lowest strength and H38
just the opposite with H38 being representative of 75 pct.
reduction in area of the alloy and a high degree of strain
hardening. Also from this figure one can see that increasing
44
the amount of work decreases the toughness by examining the UPE
for the intermediate tempers.
Some work has been done examining various alloys of the
5xxx series for their variation in toughness with decreasing
temperatures(34 through 38). Generally the result of all this
work is the same as shown in Figure 40; namely, the toughness
of the annealed or slightly worked alloy is greater than the
highly worked or hardened alloy over a range of temperatures.
Table 9 illustrates this using the notch yield ratio as a
measure of toughness for several 5xxx alloys for temperatures
down to -452 0 F. And Table 10 shows the same relationship for
different alloys of the 5xxx series but using the propagation
energy as a measure. Based on both of these tabulated measures
of toughness, the fracture resistance of the 5xxx series alloys
is very high and is about the same at -452 0 F. as it is at room
temperature indicating good application for designs where
fracture is critical rather than strength.
Some other work has been published (38,39) on the toughness
of the 5xxx series alloys, but the results are erroneous because
the inconsistent measure of toughness, the notched to unnotched
tensile strength ratio, is used. The results can be seen in
Figure 41 and show that for the same alloy the fracture
resistance over a range of temperatures can be greater for the
strain hardened rather than the annealed temper. This is
invalid not only because of the use of the notched to unnotched
45

ratio but also for the fact that the strain hardened state has
been previously shown to be less tough than the annealed
condition because of the increased number of dislocations and
possible dispersed particles. Thus, in general, the non-heat
treatable alloys will exhibit a decrease in toughness as the
amount of cold working of the alloy increases but will exhibit
a greater yield strength. And this can be reversed if the alloy
is subjected to a partial or full anneal after strain hardening.
Concerning the heat treatable alloys, working of the alloy
can be performed either prior to (T3 or T8 temper) or following
(T9 temper) aging. Usually work prior to either natural or
artificial aging of the 2xxx series alloys has a pronounced
effect because precipitation hardening is accelerated due to
the increased number of nucleation sites generated by the more
numerous dislocations. Thus for the 2024 and 2219 alloys, the
yield strength increases with cold working before aging by
increasing the amount and reducing the size of the transition
precipitates which result during aging (40). But for this
process and these alloys, toughness is sacrificed.
In the 2xxx series alloys there is one exception, 2021.
The alloy 2021 will have reduced yield strength with prior
cold work because working the alloy coarsens the coherent
transition particles which results in a lower hardening ability
(40). But this inherently means an increased toughness which
may not be so detrimental.

For the remainder of the heat treatable alloys, only the
2xxx series shows a detectable response to cold working
because the alloys of the 7xxx series fail to show any effect
of working due to their strengthening structure which mainly
consists of zones rather than precipitates (40).
A recent investigation has been made into the relationship
between the strain hardening exponent and toughness (41) of the
heat treatable alloys. Note that the strain hardening exponent,
n, as given in the equation for true stress and strain, a =
a0 n, does not vary with the amount of cold work but rather
with the initial yield strength of the alloy. This is seen in
Figure 42 which indicates a constant slope, n,14 as the
reduction in thickness increases. Note the decrease in slope
of these lines as the initial yield strength increases. Thus
the strain hardening exponent only relates to the initial
yield strength and not to the degree of working.
From Figure 42 there appears to be a correlation between
the strain hardening exponent and the yield strength, and to
try to explain the two alloy properties as being separate
influences on alloy fracture resistance may not be valid. But
work has been done with this objective in mind(41).
Specifically, the results of the investigation are
illustrated in Figure 43 and show that the fracture toughness
of a 2024-T62 alloy of 49 ksi yield strength is greater than
that of a 2024-T851 alloy with a yield strength of 65 ksi over
47

a range of thicknesses. For the tougher alloy the strain
hardening exponent is given as 0.09, and for the less ductile
alloy, the exponent is 0.045. Thus this implies that a higher
exponent for a particular alloy means a higher toughness under
both plane stress and strain conditions. But this may be
masked by the effect of the lower yield strength of the tougher
alloy.
Previously, the strain hardening exponent was found to
have an effect upon the ductile fracture strain, ci, (see
previous section) in which higher values meant an increasing
crack opening displacement and toughness. Physically this can
be interpreted as being the amount of work necessary to stretch
and pull the material between voids of an alloy which fractures
by void formation and coalescence. If the strain hardening
exponent is low, only a small increase in stress is necessary
to plastically pull or tear apart the bridge material between
the crack tip and the first void as the alloy is placed under
tension. On the other hand, if the exponent is large, more
stress is required to tear the bridge material as the material
is stretched more and more. Thus the advantage of having a
material with a good strain hardening ability is evident if the
alloy fails in the particular type of mode discussed above.
Also the yield strength must be considered, for a material with
a high yield strength usually will have a low toughness
irregardless of what the strain hardening exponent might be
48

because the alloy will fracture even before the yield stress
or hardening region is reached.
Besides showing some correlation of toughness of the heat
treatable alloys to the strain hardening exponent, recent
investigations show that various heat treatments can alter the
strength and toughness relationships for the high strength
alloys. With these treatments there appears to be more flexi-
bility in the final mechanical properties of an alloy as is
indicated by the number of tempers listed in Table 8. Basically
these treatments consist of a solution treatment and/or some
form of aging.
The purpose of solution heat treating is to raise the
temperature of the solid solution just below melting so that
the greatest degree of saturation by the hardening elements of
Zn, Si, Cu, and Mg is obtained. Consequently the strength will
be higher, and the amount of precipitation after quenching can
be controlled more readily so that the final desirable
properties are obtained.
Usually the steps in processing a heat treatable alloy
consist of solution heat treatment, quenching, and some form
of aging. For this series of procedures, the quenching should
be rapid so that the solid solution retains its supersaturated
state down to room temperature from which the alloy can age
naturally for a short period of time or else the alloy can be
subjected to a moderate temperature rise within a range of 200
49

to 400 0 F. for a period of time.
This latter form of aging is called artificial aging and
produces the highest yield strengths and lowest toughness.
The reason for this is simple since in the artificially aged
state a large number of precipitates is formed which inhibit
dislocation movement and cause dislocation pile up as the
alloy is stressed in the working condition after treatment.
The temper designations for the solution heat treatments
employing wither natural or artificial aging are T4 and T6
respectively. And the T6 temper is known as the hardest
temper or the heating process which can produce the highest
strength alloys with the lowest toughness. 15 The T4 temper
generally yields the opposite effect which can be seen in
Figure 44 for a 2014 alloy. For the 2014 alloy, if the aging
continues beyond the T6 condition, the alloy becomes soft and
its yield strength is lowered as its toughness is increased.
But this increase in toughness is not up to the level of the
underaged condition (20,42).
This is the result of annihilation of the coherent phases
which provide the hardening effects and their replacement with
equilibrium precipitates which are formed by solutes leaving
the solid solution as aging continues. Thus if tough alloys
are desired, the best method of treatment after solution
heating appears to be either underaging or severe overaging.
If the alloy is aged at higher temperatures and longer
50
periods of time (severe overaging), the toughness at room
temperature will increase (44). This has been indicated by the
measurement of the UPE for a 2020-T6 alloy at temperatures
ranging between 400 to 6000F. for to 24 hours. The results
are shown in Table 11 and Figure 45, and note in the figure
that the toughness for the various 2xxx series alloys increases
above the room temperature toughness as the temperature
increases. This could possibly mean that the alloy is coming
close to the annealed state where recrystallization occurs
with a reduced number of dislocations.
Another way in which the effects of aging upon precipita-
tion can be augmented is by a quench interruption. As the
solid solution is being cooled from the solution heat
treatment temperature, the cooling is held constant for a
period of time and then quenching resumes. The result of this
interrupted quench is the control of the number and size of
grain boundary precipitates in the 7xxx series alloys. And
this has been shown to have a definite effect upon toughness
in the above series.
Figure 46 shows that increasing the interruption time at
3300F. increases the PFZ width and also the number of boundary
precipitates. Thus to reduce the number of boundary precipi-
tates formed during final aging, the quench interruption
treatment should not be employed unless increasing the PFZ
width is found to be beneficial for increasing toughness (24).
51

But this has yet to be proved.
Thus aging of a heat treatable aluminum alloy plays a
major role in the fracture resistance of the alloy and can be
used in combination with other processes to achieve desired
results as will be seen in the following section.
Note that in Table 8 of the tempers for the heat treatable
alloys the number of treatments that can be performed varies
from just the T4 and T6 tempers. Cold work can be applied
before or after the two types of aging and an alloy can be
stress relieved to obtain desired results. Note also that the
two forms of aging do not have to follow solution heat treatment
(Tl and T5 tempers) and that cold work does not necessarily
have to accompany solution heat treatment either (TlO temper).
The effects of these various treatments on toughness and
strength have been reported and the conclusions drawn are
worthwhile discussing.
Generally for the high strength alloys of the 7xxx series,
the alloys employing a T73 or T76 temper have a lower toughness
than those alloys with a T6 type temper. The reason for this
is that even though the T73 and T76 tempers imply a higher
toughness due to overaging after solution heat treatment, their
toughness is reduced due to the amount of cold work that is
performed which is indicated by the second digits of the temper,
3 and 6 (3).
For the 2xxx series, the T3 or T4 alloys have a higher
52

toughness than those in the T6 or T8 type tempers (3,8) because
the artificial aging sequence of the latter two tempers results
in a higher yield strength as explained before. Even though
the cold working prior to natural aging in the T3 temper results
in a substantial yield strength, the increase is not as great
as the T6 or T8 temper, and thus the toughness is not reduced
as much.
There is even a difference in toughness resulting from the
use of the T3 or T4 type temper in the 2xxx series alloys. The
cause of this is the intermediate cold working of the T3
tempered alloy which increases the yield strength. This
difference can be seen in Tables 12 and 13 for a 2024 alloy
if one examines the ratio of the notched tensile strength to
the yield strength. Note that this ratio is larger for the
T4 temper over a wide range of temperatures which is reasonable
in the light of the prior discussion on the effects of working
and that the effect of the difference in specimen thickness
(0.025 in. to 0.032 in.) is negligible when considering the
relative values of the ratios.
The degree of working the alloy as indicated by the temper
also has a definite influence on the outcome of an alloy's
toughness. For example, Tables 14 and 15 show the results of
tensile tests taken on notched specimens of a 2219 alloy in the
T81 and T87 temper. The T81 temper indicates a minimal amount
of strain aging between solution heat treatment and artificial
53

aging while the T87 temper indicates a substantial degree of
strain aging between the same two treatments. Consequently
one could expect a higher yield strength and lower toughness
for the latter temper, and this is actually what appears for a
range of temperatures in Tables 14 and 15 if one examines the
notch tensile strength to yield ratio.
In summary, the application of cold work and/or artificial
aging to a heat treatable alloy will increase the yield
strength and decrease the toughness, and if no cold work is
performed and only natural aging is employed, the opposite
will be true. This does not necessarily apply to the 7xxx
series alloys because the time for these alloys to form
strengthening precipitates is long and natural aging periods
are inefficient. Thus only the tempers consisting of some
form of artificial aging are used on the 7xxx series alloys.
In trying to achieve both maximum strength and toughness,
investigations have been made upon the combined effects of
compositional changes and variable heat treatments. In
particular, the effect of varying the magnesium content and
temper of a non-heat treatable aluminum - magnesium - manganese
alloy has been published and is shown in Figure 47. Naturally
the O temper will have the highest toughness and lowest yield
strength because of the lack of lattice imperfections or
dislocations. But note that there is a maximum value of
toughness for a given magnesium content indicating that the
54

increase in alloying element causes a decrease in the energy
to propagate a crack. This might be due to the relative ease
in forming and coalescing voids due to the decreased spacing
between hardening elements or else dislocation mobility is
greatly reduced as may be the case in the H34 temper. But
this illustrates that both composition and heat treatment can
be used together to optimize the yield-toughness requirement.
Since combining changes in composition and heat treatment
or cold working seems to be a viable direction in which to
proceed in order to optimize toughness and yield strength,
research has been done in this area but little has resulted so
far except for the results published on a 7175 alloy. These
results can be seen in Figure 48 and show that the 7175 alloy
in the T66 or T736 temperl6 has a greater toughness and strength
over the conventionally used 7075 alloy in either the T6 or T73
temper (3).
Besides varying the composition and heat treatment, other
miscellaneous processes have recently evolved which show a
slight increase in yield strength along with a substantial
increase in toughness. Specifically these processes are the
premium extrusion of the 7075 alloy in the T73510 and T76510
tempers and Alcoa Process 417. For the premium extrusion, the
graphical results are given in Figure 49 and demonstrate that
this process increases toughness substantially over the conven-
tional extrusion of the 7075 alloy. The results of the Alcoa
55

417 Process are shown in Figure 50 and again show the same
achievement of increasing toughness but for a 2024-T851 alloy.
The Alcoa 417 Process appears to be propriety because no infor-
mation is available concerning the actual metallurgical steps
in the new process (3).
Also what has been found to improve toughness is the use
of pre-forging of plate before rolling (3). Notch bend tests
of specimens taken from various orientations within a pre-
forged and standard rolled plate have been performed (45,46)
and show that the plane strain stress intensity factor is greater
for the pre-forged plate rather than the standard rolled. This
published result can be seen in Table 16 or in Figures 51
through 53. And the reason for the increased toughness is
speculated to be due to the texture and the smaller and more
uniform grain structure in the pre-forged plate (45). This
texturing effect will be discussed in a following section
on anisotropy and its relation to fracture resistance of
aluminum alloys.
From the above discussion the role of processing in the
variability of the fracture resistance of aluminum alloys is
great and can be summarized as follows:
1. For the non-heat treatable alloys strain aging or
work hardening will decrease toughness but increase
the yield strength because the number of lattice
distortions and dislocations increase.

2. Annealing will have the opposite effect of strain
hardening because alloy recrystallization occurs with
the removal of dislocation concentrations.
3. For the heat treatable alloys, cold working prior to
or following aging will increase the yield strength
but decrease toughness. And this process has more
effect upon the 2xxx series alloys than any alloy in
the 7xxx series because the hardening structure of
the former series is due to precipitation rather than
zone formation in the latter series. The increased
number of dislocations offer more nucleation sites for
precipitation in the 2xxx series alloys.
4. From some recent work done on the toughness-thickness
relationship for two 2xxx series alloys, the strain
hardening exponent might be an indication of toughness.
A higher value of the exponent implies a tough alloy
and a low value, a low toughness under both plane
stress and strain conditions.
5. Artificial aging of an alloy up to peak strength yields
the lowest toughness and natural aging yields just the
contrary. If the alloy is aged beyond the peak strength,
the yield strength decreases and the toughness increases
but not up to the level of underaging.
6. Severe overaging can result in greater toughness of
an alloy at room temperature.
57
7. Control of an interrupted quench is a means of control-
ling the amount of grain boundary precipitate in a
7xxx series alloy. And this has been shown to be
related to toughness.
8. Combinations of cold working and artificial aging
yield the lowest toughness and highest yield strengths.
And alloys in the annealed state or only naturally aged
yield lower strengths but the greatest toughness.
Employing cold work with natural aging results in
intermediate levels of yield strengths and toughness.
9. Combining compositional changes and various processes
appears to be the best direction in optimizing strength
and toughness. And this has been done for a 7175 alloy
in the T66 and T736 tempers.
10. Various mechanical processes have shown that their
use can increase toughness:
a.) Premium extrusion of 7075 in specialized tempers
has increased toughness and strength over
conventional extrusions of the same alloy in the
same temper.
b.) Alcoa Process 417 increases toughness and strength
for a 2024-T851 plate alloy.
c.) Pre-forging and then rolling increases toughness
over standard rolling of plate because of textural
differences.

Thus in seeking to optimize yield strength and toughness,
the metallurgist has a variety of options available when
considering the effects of compositional changes, heat
treatment, and mechanical working.
Fracture Resistance of Alloy Castings
In the prior discussion on compositional and processing
effects, the investigation was centered on the fracrure resis-
tance of wrought alloys, and no mention was made about this
property of alloy castings. But their fracture resistance
must be considered because they are frequently used as structural
members which must sustain a load under a variety of conditions.
The reason for their increased popularity is that they can be
fabricated in a variety of configurations which are impossible
or impractical in the wrought condition. Even though the cas-
tings have this ability to take on any shape, they do not
possess the same fracture resistance as the wrought alloys.
This is made evident in Figure 54 which shows the toughness
and yield strength at four temperatures of several castings.
Note that all the differently fabricated alloys fall below the
band for the wrought alloys at all temperatures and only the
premium strength castingsl 7 are close to the strength-toughness
relationships of the wrought alloys. The difference in strength
and toughness of the two types of alloys is based upon their
microstructure with wrought alloys having a solid solution
matrix composed of grains and cast alloys, a matrix composed
of solid solution dendritesl 8 with complex binary and ternary
eutecticsl9 filling the spaces between the dendrites. Also for
the castings the amount of hardening elements (Si, Cu, Mg, Zn)
is greater than in the wrought alloys with the exception of the60
silicon bearing alloys where the amount of alloying element is
about the same. This implies a reduced toughness for the cast
alloys if one accepts the conclusion drawn from the discussion
on compositional effects.
Even though the cast alloys don't meet up to the toughness
and strength levels of the wrought alloys, they appear to show
the same effects of compositional and processing variations on
fracture resistance as for the wrought alloys (47).
The effects of both composition and processing variables
can be seen in Tables 17 through 19 and Figures 55 and 56.
Table 17 gives the tabulated compositions of the 100, 200, 300,
and 600 series castings along with their manner of fabrication
whether it be sand, permanent mold, or premium cast. Note that
the alloying percentages of the cast alloys are greater than
those of the wrought alloys of Tables 20 and 21 and that the
same heat treatments can be used for both types of alloy as
indicated by the tempers in Table 17.
With the help of these charted compositions and the
tabulated results (Table 19) of notched tensile tests of
specimens taken from permanent mold castings, one can see that
increasing the composition does decrease the toughness by
examining the notch yield ratio for the various alloys. For
example, alloys 359-T62 and 354-T62 have the lowest notch
toughness and highest strengths, and alloys A344-F and A356-T7
have the highest toughness but lowest yield strength with the
61

latter two alloys using the smallest percentage of alloying
elements and the former two, the largest percentage of the
entire 3xx series tested. Thus this seems to indicate the
same trend in the effects of compositional changes as seen in
the reported test results for the wrought alloys.
Concerning heat treatments, the cast alloys can be
subjected to solutionizing, annealing, and artificial or natural
aging just as the wrought alloys with basically the same results.
This can be verified by examining the 356-T6 or T7 alloy in the
sand or permanent mold casting process (Tables 18 and 19). For
both methods of fabrication, the 356 alloy shows a higher
notch toughness and lower yield strength for the solution heat
treated and overaged temper (T7) than for the T6 temper which
indicates solutionizing and artificial aging up to peak strength.
This is the same result which occurs when both tempers are ap-
plied to a wrought alloy.
Even if cold work is applied between solution heat treating
and aging of a cast alloy, the result is the same as for a
wrought alloy. This is shown in the test results (Table 19)
for an A356 and A357 alloy fabricated in the permanent mold or
premium cast state and using the T61 and T62 tempers. From
Table 19 the T62 temper of both alloys in both casting forms
derives a higher yield strength and lower toughness due to the
increased amount of work over the T61 temper. And again this
result can be similarly found for the wrought alloys (note
62

results of Tables 13 and 14).
Another trend of parallelism between the two types of
alloys is the effect of mechanical processing. Just as pre-
forging before rolling of plate increases toughness of the
wrought alloys, premium or permanent mold casting does the same
for the cast alloys. The alloy, A356-T61, which exhibits
about the same yield strength in the premium cast state as in
the permanent mold condition has a higher notch toughness due
to the controlled foundry practices of premium casting. If one
were to rank the different type of castings according to the
increase in fracture resistance, sand casting would be first
and premium casting last. And this illustrates the role of
mechanical processing even in cast alloys.
One other similarity between the two available types of
alloys is that additions of zinc to both produce high strength
but low toughness with decreasing temperatures (see Figures 29
and 56). This, no doubt, is due to the same response to heat
treatment for both the cast and wrought alloys.
With all these similarities between the compositional and
processing variables in the cast and wrought alloys, there are
a few differences.
One of the differences between the behavior of the two
types of alloys in the presence of a stress raiser is the
variation of toughness with temperature for the lxx series cast-
ings and the 2xxx series wrought alloys. As seen in Figure 56,the
63
lxx series alloys lose their notch toughness as the temperature
falls 20 while in Figure 34 the notch toughness remains about
the same for the majority of the 2xxx series alloys even though
both series in the cast and wrought condition have the same
principle hardeners of Cu and Mg. Another difference between
the two series is that the lxx alloys generally have a lower
yield strength relative to the other castings while the 2xxx
alloys are considered to be high strength alloys.
For the cast alloys, the 3xx series has a substantial
yield strength relative to the lxx and 2xx series in the sand
cast form. Thus one could term the alloys in this series as
being high strength cast alloys using silicon as the main
hardener. In the wrought alloys, the 4xxx series also uses
silicon for its source of strength, but the yield strength
derived by strain hardening is in the medium range relative to
the other wrought alloys. Thus the difference between the two
series in the available conditions lies in their relative
rating based upon their yield strengths.
Note that the toughness of the 3xx series cast alloys
maintain approximately their room temperature toughness down
to -320 0F. (see Figure 56). And if the 4xxx series behaves
under the presence of a stress raiser like the other medium
strength wrought alloys (5xxx series),21 the silicon bearing
wrought alloys will not decrease in toughness with temperature
either. Thus in this way the 3xx series and the 4xxx series
of the cast and wrought alloys respectively are alike.64

Basically, these are the differences and similarities
between the two available types of aluminum alloys. And the
reason for the parallelism appears to be in their similar
response to heating and mechanical treatments while their
differences must be derived by the divergence in microstructure.
Concerning the cast alloys themselves, the lxx, 2xx, and
6xx series alloys will exhibit a lowering of toughness as the
temperature drops while the 3xx series alloys will have an
invariant toughness. And the 3xx and 6xx series alloys will
have the highest yield strengths but possibly the lowest
toughness depending on the casting process and heat treatment.
Note also that permanent mold and premium strength casting
improves toughness while not reducing strength and that sand
casting tends to produce the lowest toughness due to the
coarse grain structure formed during the process.
65
Quality Control
To attain a substantial level of toughness and strength,
the amount of porosity and the number of oxide inclusions and
intermetallic compounds should be controlled for both the
production of wrought and cast alloys. And any of the above
processing variables can reduce fracture resistance substanti-
ally if present in large amounts.
Porosity is derived by the amount of hydrogen that is
dissolved in the liquid metal. And if the concentration of
hydrogen reaches a threshhold value, the porosity will be
greatly increased. At values less than the threshhold value
the resulting porosity can be eliminated by mechanical working
if the alloy is to be in the wrought condition (48). Otherwise,
large gas contents result in an inevitable porosity which will
produce microscopic notch effects that can lead to reduced
toughness.
The strength reducing action of the pores can be seen in
Figure 57. And note that initially the pore assumes a circular
shape, but as the alloy is subjected to an applied stress, the
pore will try to assimilate a lenticular form. The degree of
sharpness of the newly formed pore will depend upon the migra-
tion of atoms from the pore surface to the corner or tip or
the vacancies from the tip to the other portions of material
surrounding the pore. If the migration of atoms to the tip is
high, the tip will be blunted and the pore cannot offer any
66
local stress multiplication (49). But if the vacancy migration
from the tip is greater than the atom accumulation, a stress
concentration will occur, and the continued nucleation of
vacancies will form a void which reduces the alloy's fracture
strength as it coalesces with other voids. Thus the action of
the pore is similar to the action of adding hardening elements
which create voids by their fracture due to the stress
concentration built up by dislocation pile up.
To illustrate the effect of porosity on toughness, Figure
58 shows the variation of impact energy of an Izod type test
with hydrogen level. Note that the impact energy is not a
valid measure of toughness but can be used here to demonstrate
the effect porosity can have. Thus the figure shows that
increasing hydrogen level up to 0.18 cc/100 g of alloy decreases
toughness for both the 2 and 3 inch plate, as expected. But
for hydrogen levels greater than 0.18 cc/100 g (threshhold
value), the toughness maintains a constant low level indicating
that increased porosity cannot reduce toughness anymore because
the alloy has achieved essentially a brittle state. Also in
this figure, the threshhold value is the same for both plates
illustrating that rolling to greater thinness cannot reduce the
notch effects of the pores. Thus the only way to prevent
reduced toughness due to porosity is to maintain hydrogen
levels below the threshhold value by controlling the casting
procedure which can be seen in Table 22.22
67
The second processing variable mentioned previously is the
amount of oxide inclusions. These defects are formed by an
oxide film which develops on the surface of the molten metal
as it remains in the holding furnace and passes into ingot molds.
This oxide film is submerged in the metal as the molten mass
flows turbulently into the ingots and forms the inclusions
which can reduce toughness by creating lattice defects in the
final crystalline state. These defects reduce dislocation
mobility and can reduce toughness if present in substantial
23amounts. As in the case for controlling porosity, the amount
of defects due to oxide inclusions can be reduced by controlling
the casting operation. If the molten metal is poured through
a glass screen into the ingot, the number of inclusions will
be minimal (48). Note how much this filtering reduces the
amount of inclusions by examining the last column of Table 22
for the appropriate casting conditions.
The third processing variable, namely, the amount and
distribution of intermetallic compounds has the same effect
as increasing porosity or oxide inclusions. That is, increasing
their frequency in the matrix results in reduced toughness.
Evidence of this can be seen in Tables 23 and 24 where the
notch-yield ratio of the x7275 alloy is greater than the same
ratio for the 7075 alloy over a range of temperatures. Note
that x7275 is a pure form of 7075 with the amount of iron and
silicon reduced as is illustrated in Table 25. Iron and
68
silicon are the main elements which compose the intermetallic
compounds, and thus reducing their amount will generally
increase toughness assuming the alloy tempers to be the same.
This conclusion can be extrapolated to other series of wrought
alloys as can be verified in the results of notched tensile
tests taken on a few of the 5xxx series alloys.
For this latter series, the alloys 5083 and 5456 can be
compared. Alloy 5083 has about the same alloying content as
5456 but lower amounts of iron and silicon and a harder temper
(H38 as compared to H343) than the 5456 alloy. The result is
as expected; the 5083 alloy has a higher toughness as measured
by the notched to unnotched tensile ratio over a range of tem-
peratures. This result is shown previously in Figure 35 and
the outcome of the testing may be questionable on the basis of
the appropriate measure of toughness that is used but should
suffice for a comparison since the results are parallel to
those of adding the same elements to the x7275 alloy.
The mechanism of failure for the alloys with a large
amount of intermetallic compounds is the same as for those
alloys strengthened by hardening elements. The compounds act
as nucleation sites for voids since the dislocations which are
blocked at compounds increase the local stress which can, in
turn, crack the compound particle or separate the particle-
matrix interface. These compounds if present in substantial
numbers can also reduce not only the work necessary to create
69

voids but also to coalesce them. Just as increasing the amount
of hardening elements reduces the fracture strain and crack tip
opening displacement, the addition of intermetallic compounds
will naturally lead to relative ease of tearing the bridge
material between the crack tip and voids within the plastic
zone. This latter mechanism of failure is also dependent upon
how many voids are nucleated initially. If the number of voids
nucleated is large due to the presence of numerous intermetallic
compounds, the energy to coalesce voids will be small and the
fracture strain less because there will be less bridge material
to tear between the voids.
For alloys which fail in the ductile rupture mode, the
nucleated voids can coalesce to form dimples which are seen
microscopically on the fracture surface. The size of these
dimples indicates the toughness of an alloy. If the dimple is
deep and wide, a substantial degree of material tearing is
occurring before the alloy fractures, and consequently the
fracture resistance is adequate or at least greater than the
fracture resistance of an alloy characterized by shallow and
narrow dimples. Shallow and small dimples indicate a reduced
amount of work necessary to tear the bridge material.
Metallographic studies have shown this above analysis to
be true and indicate a dimple size for a high purity 7075-T6
alloy to be 0.4 x 10⁻⁴ inches as compared to the commercial
-47075-T6 alloy which has a dimple size of 0.2 x 10 inches (50).
70

The corresponding toughness for both alloy types is given in
Figure 59 for various specimen orientations, and indeed the
toughness of the pure alloy is greater than the commercial
alloy. Thus the correlation between dimple size and toughness
appears to be valid along with the explanation of the probable
effects of increasing compound additions.
The intermetallic compounds not only have an effect upon
the fracture resistance of wrought alloys but also cast alloys.
Iron in combination with aluminum will form hard particles
which precipitate between dendrites and dendrite arms causing
embrittlement and reduced toughness (51). The only way to
alleviate this problem is to maintain quality control, for
heat treatment cannot dissolve the iron - aluminum compounds(51).
The action of these impurity elements in the cast alloys is
believed to be very similar to that of the iron and silicon
impurities in the wrought alloys; that is, the iron - aluminum
compounds of the castings promote fracture by confining the
fracture to areas where the concentration of impurities is
the greatest.
In searching for better alloys to resist fracture, quality
control during the foundry process plays a definite role. If
the porosity of an alloy becomes considerable due to uncontrol-
led hydrogen levels in the molten metal, the toughness of the
resulting alloy will be less. If careful control is not used
in screening the molten metal before pouring into the ingots
71
for cooling, oxide inclusions will result which can reduce
toughness. And finally, if more precision is used in the
amount of alloying additions, especially iron and silicon, the
toughness of the final product can be increased by minimizing
the amount of elements that form intermetallic compounds. The
reason that the above processing variables reduce toughness if
present in substantial amounts is that they act as internal
notches which produce local stress concentrations. This
increase in local stress allows for relative ease of void
nucleation which in turn influences the final coalescence of
the voids to fracture.

Directional Properties of Alloy Plate
One of the critical properties of alloy plate is the aniso-
tropy of its fracture resistance. In the as cast condition,
the aluminum alloy is basically isotropic; that is, its
fracture resistance is the same in the three principal directions.
But as mechanical working is performed such as rolling, pressing,
or extruding, there is a reorientation of the grains according
to the direction of working. This reorientation of the grains
is the basic reason for the anisotropy of plate toughness as
will be discussed subsequently.
To identify the anisotropy of alloy plate, three principal
directions have been categorized according to the geometry and
direction of deformation of the plate. These three directions
are called the longitudinal, long-transverse, and short
transverse directions respectively.
To assist in determining the relative positions of these
directions, Figure 60 shows that the longitudinal direction
refers to a crack propagation system in which the applied
tensile stress is in the direction of rolling and the crack
propagates at right angles to the rolling direction. The
long-transverse direction differs from the longitudinal in
that the applied stress is normal to the rolling direction but
is similar with respect to the crack propagation direction
which is essentially against the grain. Note that the short
transverse direction differs from both of the above directions
73
with respect to the direction of applied stress and crack
propagation.
There has been some refinement in defining the various
crack propagation systems of an alloy plate (45). These
systems are given in Figure 61 which identifies each system
by two indices. The first index gives the direction of the
normal to the crack plane and the second, the direction of
crack propagation whether it be R, the rolling direction, W,
the direction of width, or T, the direction of thickness.
Note that the previous directions designated as longitudinal,
long-transverse, and short transverse can be identified as the
RW, WR, or TR directions respectively.
What truly makes these crack propagation systems different
is the grain direction. The mechanical working of the alloy
whether it be any of those previously mentioned causes flat,
elongated grains to be formed in the direction of working. If
a section were cut parallel to the rolling plane, microscopically
elongated grains would appear which are actually platelets
that are stacked one on top of the other. In section these
grains would appear as lines which have grain boundaries lying
parallel to the rolling surface and short boundaries which are
perpendicular to this surface and are not aligned from crystal
to crystal (52). Typical micrographs of the three principal
sections can be seen in Figure 62 and note that the transverse
section shows the least amount of grain boundary which can
74

inhibit crack propagation. Thus what really distinguishes the
three propagation systems is the manner in which the crack
moves relative to the grain structure.
For the longitudinal specimen, the crack has to separate
and tear elongated grains; whereas, for the long-transverse
direction, the crack will have a tendency to separate the grain
boundaries in the direction of grain elongation. The short
transverse direction is quite different in its manner of crack
movement from the other two directions in that the propagating
crack will separate the granular platelets themselves like
splitting wood in the direction of the grain. In other words,
what is critical for the various directions is the amount of
resolved normal stress relative to the face of the grains
(58,60). If the grain boundaries are parallel to the applied
stress such as in a longitudinal specimen, the toughness will
be high because the fracture is incurred by tangential stresses
rather than normal stresses (58). But if the grain boundaries
are normal to the applied stress, the toughness will be low
because the full normal stress which is mobilized on the
individual grains can pull the platelets apart with relative
ease in the presence of a notch. Thus one can expect the
toughness to be the least in the short transverse direction.
With these various means of designating the propagation
systems, tabulated results of toughness testing have been
recorded accordingly (3,17,25,45,53-55). Tables 3,9,12-16,
75
and 26-28 show these results and rank toughness according to
increasing values as given by the short transverse, long-trans-
verse, and longitudinal directions respectively. One exception
to this ranking is the data reported in Tables 26 and 28
which show the plane strain stress intensity factor and the
notch-yield ratio for the long-transverse direction being
comparable to the same measures for the longitudinal direc-
tion in a rolled plate. On the other hand, extruding an alloy
appears to make the toughness in the two above directions
diverse but equalizes the toughness in the two transverse
directions (see Table 26). Apparently this difference in
rolling and extruding is based upon the final grain structure
which differs.
For the extruded bar, the final grain structure consists
of a fiber texture24 with a (111)25 direction parallel to the
product axis and random crystal directions perpendicular to
this axis (56). The rolled plate differs from this in that
the texture is composed of three ideal textures (110)(112),
(112) (111), and (123) (211). But the texture of a rolled
plate can be described by the (111) planes which have a
variable orientation as disclosed by x-ray analysis (56).
A typical x-ray pole figure26 of two alloys is shown in
Figure 63. And the shaded areas represent the density of
normals or poles27 of the crystallographic (111) planes with
reference to a random orientation of normals, R, in an ideal

metal sample. The variability of the shaded areas indicates
a preferred orientation of the (111) planes which is different
from that of an extruded alloy with its texture being defined
by a (111) direction parallel to the product axis. Thus this
may be the reason for the discrepancy in toughness for the
two types of fabricated alloys in the two plate directions.
For the majority of the recorded data, the notch-yield
ratio or the stress intensity factor is determined for the
longitudinal and transverse direction with no distinction
being made between the transverse directions. Thus one
cannot immediately say that the recorded transverse fracture
data is the most critical condition since the transverse
direction is not specified. If one were to assume the
results of Table 26 to hold for all rolled plates, the
recorded transverse toughnesses would be critical if their
values were considerably less than the fracture resistance of
rolled plate in the longitudinal direction. This assumes
that the plate toughness is about the same in the longitudinal
and long-transverse directions. Thus one has to examine the
tabulated results carefully before being able to say that a
particular alloy has a specified minimum of toughness in a
definite direction.
Concerning other plate directions, work has been performed
to show the variation of specimen toughness with directions
other than the three principal directions (57,58). Basically
77

what has been done is the impact testing of notch specimens
at various angles measured from the rolling direction. This
is illustrated in Figure 64 and shows two types of specimens
cut from the plate at 150 intervals from the rolling direction,
OX. The results of these tests for an aluminum alloy, V95,28
are given in Table 29 and show that the maximum impact energy
occurs when the specimen is oriented in the longitudinal
direction. Note that as the specimens are rotated in the
plane of rolling and away from the rolling direction, the
toughness decreases to a minimum which corresponds to a trans-
verse fracture resistance. All of the oblique specimens have
a toughness which is intermediate of the maximum and minimum
of the longitudinal and transverse directions respectively.
Thus the transverse direction is critical when specifying
the fracture resistance of alloy plate.
The major reason for the above anisotropy of alloy plate
is the final texture of the product. This texture is caused
by slip in specific crystal directions (110) on restricted
planes (111). And. deformation on the (111) planes causes
rotation of grains and grain fragments into preferred
orientations relative to the working direction and the
surface of the product. Thus what results are long plate-
like grains in the direction of rolling which are stacked on
top of each other.
Not only does rolling produce reorientation of grains but
78

also extruding as mentioned before. Extruding of liquid
metal along a parting plane of a forging die cavity can cause
the grain to flow in a direction normal to the forging
surface rather than parallel to it. The result is a transverse
grain structure along the parting plane which can cause a
toughness variation (59). This is schematically shown in
Figure 65 for two crack propagation systems, and note that
for the low toughness specimen, the fracture surface exhibits
a relatively smooth topography; whereas, the high toughness
specimen is characterized by a dimpled rupture (see
micrographs in Figure 65). Note that the difference in frac-
ture mode is due to the crack propagating through the diverse
grain structure. For the low toughness direction, the crack
is splitting the platelets apart; whereas, the crack in the
tougher alloy is confined to either grain boundaries or else
actually tears grains apart in a ductile fashion. Thus this
indicates that all forms of mechanical working can result in
some sort of anisotropy which must be considered.
One other problem that may arise in the anisotropy of
alloy plate is the degree of anisotropy with plate thickness.
Results of tensile tests of center slotted panels show that
increasing plate thickness also implies a greater degree of
anisotropy (60). Table 30 and Figure 66 verify this by
showing the variation of Gc29 with thickness ranging from 1rann foM17
79

to 1 in. Note that as the thickness increases the degree of
1anisotropy changes from 82 pct. in the 16 in. gage to 25 pct.
in the 1 in. gage. This is easily identified in Figure 66.
The reason for this characteristic is that the greater
degree of working in the thinner gages causes a finer
distribution and size of insoluables and an equiaxed grain
structure (60). This equiaxed structure is derived from the
fact that the grains are also stretched in width as in length,
and the degree of width stretching determines the amount of
anisotropy (58).
As the thickness increases, the grains lose their equiaxed
structure and become elongated in the direction of working.
Similar to the elongation of the grains is the elongation of
the intermetallic compounds (60). These intermetallics act
as nuclei for voids and process zone cells ahead of a crack
tip. And tests have shown that if the inclusions are spread
further apart and/or are fewer in number, the process zone
cell will be larger along with the plastic zone ahead of the
crack tip (46,50). Usually under cases of tensile instability
the process zone size is given by:
1
k = E (2Tr)2 n
where E is the modulus of elasticity
n is the strain hardening exponent
80

kI is the plane strain stress intensity factor
and
r is the process zone size as measured from the
crack tip.
Reported data shows that for a high purity alloy, 7075-T6,
the intermetallics are fewer in number and more widely spread.
Consequently, the process zone size has been evaluated as
5.49 x 10 in. as compared to 2.85 x 10⁻⁴ in. for the
commercially available 7075-T6 with a greater number of inter-
metallics. In lieu with this increase in process zone size
has been an increase in toughness(50).
Specifically, the way this relates to the anisotropy of
the thicker plate is that the elongated inclusions exhibit a
greater spacing for crack directions parallel or cross grain,
and thus the process zone size is larger in this direction
resulting in greater toughness (46). In the short transverse
direction, the crack propagating parallel to the rolling plane
sees a greater number of inclusions of smaller size and at a
shorter distance. Thus the process zone size is reduced in
this direction along with toughness. As the material gets
even thicker, the difference in grain and inclusion orientation
is extenuated even more, and thus the degree of anisotropy is
increased.
In examining the anisotropy of alloy plate, another
characteristic was found of thick plate. This other property
81
is that the toughness of specimens taken from the center of
the plate differ from the toughness of the same specimens taken
from near the surface. But this is only true for the longitu-
dinal direction because the specimens in the transverse direc-
tions exhibit a uniform toughness with thickness (see Figures
51 through 53). The reason for the variation of toughness
with thickness in the longitudinal direction is believed to
be due to the preferred orientation of the (110) planes in
the center of the plate (46). For the center of the preforged
plate, there is a five times random count, 5R, for the (110)
plane as given by a pole figure, and for the hot rolled plate,
the center random count is 7 times, 7R.
The above random count at the center of both plates means
that the number of slip systems as determined by the density
of the (110) planes is large. And thus a crack has a greater
chance of being blunted because there is a plastic deformation
capability due to absorbtion of resolved shear stresses on
the available slip systems (46). Thus in this way texture
variation can affect the toughness of the plate and may be a
means of controlling the toughness variation with thickness.
In summary, the anisotropy of aluminum alloy plate as
determined by the longitudinal and transverse directions
must be considered in design. And for critical applications
the toughness of the plate must be based upon its minimum
fracture resistance which is in the short transverse direction
82

or could possibly be near the surface of the plate.
The reason that the short transverse cracking is critical
is that propagation occurs with normal stresses on the grains
being maximum and with the splitting of the platelets along
their parallel faces rather than cross grain or along longitu-
dinal grain boundaries.
Recent investigations have also found that different
mechanical processes affect the degree of anisotropy in differ-
ent ways. Rolling to plate usually results in longitudinal
and long-transverse toughnesses being about the same and
higher than the short transverse toughness. Extruding has a
different effect in that the long-transverse and short trans-
verse toughness is comparable but considerably less than the
longitudinal toughness. This difference in the resulting
product fabricated by the two processes is believed to be
due to the variability in texture as determined by the preferred
orientation of the (111) slip planes.
Another characteristic of alloy plate is that the degree
of anistropy increases with plate thickness. This property
is derived from the increasing elongation and orientation
with respect to the rolling direction of the grains and
inclusions as thickness increases. The elongated inclusions
are more effective in reducing the plastic deformation
capability in the short transverse direction.
Basically these are the results of the investigation in
83
in the anisotropy of alloy plate, and they must be considered
before making use of plate material for practical
applications.
Fracture Resistance of Welds
With the fabrication of large redundant members and pres-
sure vessels, welding of aluminum alloys has become critical
from the view point of fracture resistance. In the application
of welds there are basically two types; the gas metal-arc or
metal inert gas process (MIG)30 and the gas tungsten-arc or
tungsten inert gas process (TIG).31 These two processes are
readily used for the welding of the pressure vessel alloys of
the lxxx, 3xxx, 5xxx, 6xxx series and one alloy of the 2xxx
series, 2219. Usually these processes are not used for the
high strength aircraft alloys of the 2xxx and 7xxx series
because undue cracking results. The alloys used for aerospace
applications require special techniques which make them more
expensive and inconvenient.
Both types of welded alloys have substantial toughness
especially those of the 5xxx series. But work has been done
in determining the relative rating of these welds and also
to possibly quantize their toughness for use in design.
The first type of welded alloys investigated, namely, those
of pressure vessel application have been shown to be rather
tough. In fact, both tear and notch tensile tests show that
the toughness as given by the UPE and the notch-yield ratio
is greater for the weld metal than the parent plate in various
cold worked tempers (4,8). This is shown in the bar chart of
Figures 67 and 68 and Table 31. Note that the toughness of
85

the filler alloy (see Table 35 for filler designation and
composition) is generally greater than the toughness of the
parent plate of the same composition with various tempers
(Figures 67 and 68) and that even the toughness of welded
plate or sheet material with a different filler metal is
tougher than that of the base metal (see Table 31). The
reason for this fracture property is that welding anneals
the material surrounding the weld by the heat and energy
required to fuse the plate and filler metal. Thus the
toughness of the weld will be indicative of an annealed state,
and as pointed out before in the section on processing effects,
annealing causes a recrystallization which leads to the
maximum possible toughness available in an alloy. Note that
even though welding does anneal the weld area, the toughness
of the weld is not comparable to that of the annealed parent
plate (4,8,61). Figures 67 and 68 and Table 31 again validate
this point but also show that the toughness of the weld is
generally between that of the annealed parent plate and the
base metal in the various tempers. The values of toughness
for the various welds in the above table and figures is
determined at the center of the weld which is critical since
the fracture resistance appears to be the lowest there (see
Table 32).
One exception to the fracture strength of an alloy weld
of this type relative to the parent plate is that of the
86

welded alloy 6061-T6 with 4043 filler metal. Welds used in
this combination of plate and filler material usually develop
1 2fracture resistances which are between 1 and 3 of the parent
plate in the T-6 temper (4,62 through 64).
Figure 69 shows that the plain strain stress intensity
factor for the above weld is about 16 ksi T in.. These
values were taken from a surface flawed specimen which might
give higher than normal values of toughness but can be used
to show the relative rating of the weld and plate. With the
same type of flawed specimen, the relative results of plate
and weld toughness for the above combination are given in
Figure 70 and show on the basis of fracture strength that the
toughness of the 4043 weld is considerably lower than that of
the 6061-T6 plate.
One important characteristic of all these pressure vessel
welds is that their toughness does not decrease with decreasing
temperatures (4,65). This is tabulated in Tables 32 through
34 and shows that at a minimum the UPE (Table 32) and the
notch-yield ratio (Tables 33 and 34) remain nearly constant
down to -320 0F., and below -320 0 F. the measures of toughness
decrease slightly (Table 34). Overall, the welded alloys are
very tough at lower temperatures as indicated by the notch-
yield ratio which is above 1 throughout the range and the UPE
2which is generally larger than 700 in -lb./in. (4,65) except
for the 2319 and 4043 filler alloys.
87
Work has been done to quantize the toughness of these
welds for use in design. And with the aid of Figure 71, filler
alloys with a UPE of 700 should have a plane strain stress
intensity factor of 40 ksi f in. which is beyond the realm of
practical lab testing (4). But for the 2319 and 4043 alloys,
the lower UPE anticipates a k I value of possibly 30 ksi / in.
And both values of these stress intensity factors indicate a
very substantial toughness which is so large that unstable
crack propagation in these welds is not critical.
On the basis of toughness alone, the above pressure
vessel type alloys are superior to that of the parent plate.
But if strength is considered in lieu with toughness, one
finds that for a given level of sttength, the toughness of
the welded. alloy is less than that of the plate in the
wrought condition (65). This is shown in Figure 71 and note
that very few of the welded alloys approach the band of the
toughness-strength relationships for the wrought alloys. Thus
one has to decide on an optimum level of toughness and strength
when welded alloys are to be employed, and the toughness of
welds must be considered in design just as in plate in order
to produce a safe and durable product.
In summary, the welds of the pressure vessel alloys appear
to have a characteristic toughness which is greater over a
range of temperatures than that of the parent plate available
in the various cold worked tempers. This means that unstable
88

crack propagation in these welds generally need not be consi-
dered in fracture design unless the 2319 and 4043 filler alloys
are used in the as welded or heat treatable condition
respectively. But even this fracture problem with these
latter filler alloys can be alleviated either by heat treatment
as in the case of 2319 or the use of another filler as in the
case of 4043.
Even though the toughness of the above welds may be
greater than that of the parent plate, their strength levels
may be less and thus may be critical in design based upon
optimizing both toughness and strength. Usually the welded
alloys have a smaller toughness than the wrought alloys for
a given strength. Thus, again the problem of utilizing best
either toughness or strength of the welds becomes an issue
of design just as for plate or other alloy configurations
as pointed out previously. This is a dilemma one has to face
in designing for both fracture and strength and may not be
solved until future research uncovers a new material which
does not sacrifice strength for toughness.
As mentioned previously, the high strength alloys of the
2xxx and 7xxx series have welds which require more control
over the welding procedure due to cracking. Even though the
welds of these series have this undesirable characteristic,
their toughness is greater than that of the base metal (4,66).
Figure 72 and Table 36 validate this by showing the notch
89

yield ratio as being greater for the filler alloy than the
parent plate in a variety of heat treatments (4,66). The
reason for this is again due to the annealing effect of the
weld.
Note that for the three filler metals employed in the
aerospace alloys of Figure 72, the welds in the 7xxx series
alloys are less tough than those of the 2xxx and 5xxx alloys
and that even the 4043 weld of the 6061-T6 alloy is tougher
than the welds of the 7xxx series alloys using different
filler metals. As indicated in Figure 72, the aircraft
alloys of the 5xxx series appear to have the greatest tough-
ness when used with magnesium filler metals; this appears to
be the same result as indicated in the figures for the
pressure vessel alloys of the same series.
Concerning temperature variation, the NYR of welds in
the high strength alloys in all but the 7xxx series generally
remain constant with decreasing temperatures down to -320 0F.
(4,40). Table 37 shows this to be true but also indicates
that there appears to be more embrittlement of the 7xxx
series alloys when used with 4043 filler metal than any
other of the 5xxx series filler metals. The variation of
the high strength series welds with temperature is very simi-
lar to the temperature variation of toughness of the parent
plate even though the filler material of the welds is not

the same as that of the welded plate or sheet (see Figure 73).
Thus the welds of the 7xxx series alloys are expected to
decrease with decreasing temperature just as for the plate
and sheet material of the same series (see Figure 36). And
the welds of the 5xxx and 2xxx series will exhibit an
invariant toughness with decreasing temperature down to
-320 0F., and thereafter toughness decreases slightly (see
Figures 34 and 35).
No doubt the welded alloys used in aerospace applications
will have the inherent inverse relationship between
toughness and strength as shown in Figure 71 for the pressure
vessel alloys, and they will probably have a weld toughness
which is less than the parent plate for a given strength.
Thus even for the high strength alloy welds, the designer
is faced with a choice between high toughness and medium
strength or medium toughness and high strength. Thus again
the trade off must be made.
One possible direction in which optimization of weld
toughness and strength can be achieved is in the use of fil-
ler material. For example, 2319 filler material when used
with the 2219 alloy (4,67) can be made to be tougher if aging
or solution quenching and artificial aging occur after
welding (see Figure 67). Note that the latter form of
treatment improves toughness even more than just aging
after welding (see Figure 67 and Table 38) and that for the
91

2219 alloy the strength of the weld is increased also. This
can be seen in Figure 71 which shows the heat treated and
artificially aged weld as having a strength and toughness
which is greater than that of the 2219 welded alloy in just
the aged condition.
Other ways in which toughness can be improved is by
means of changing the filler alloys. Usually the filler
metals containing silicon such as 4043 and 718 (see Table
35) will have a lower toughness than those of the 5xxx
series which have magnesium as their predominant alloying
element (54,62,63). Tables 39 and 40 show that any of the
5xxx series filler alloys will improve toughness over the
silicon bearing fillers for a 6061-T6 alloy, and that even
for the high strength alloys of the 7xxx series, the magnesi-
um fillers appear to enhance toughness (see Figure 72).
One drawback to both the silicon and magnesium bearing
alloys is that they will not respond to heat treatment like
the 2319 filler alloy. That is, their toughness will remain
the same, at most, after treatment (54,65). Usually there
is a decrease in toughness with treatment for these filler
alloys (see Table 40 and Figures 67 and 72).
Concerning the use of the 5xxx filler alloys, there is
no real advantage of one filler type over another on the
basis of toughness (65). The only discernable difference
that may appear is that there is a slight decrease in
92

toughness with increasing magnesium content at room tempera-
ture as shown in Figure 67. Otherwise, one may find an
overlapping of toughness as measured by the NYR over a
range of temperatures for alloys using 5xxx series fillers
(see Figure 73).
Thus the possibility of improving welded joint
toughness and strength may lie within the confines of the
choice of filler material combined with the parent plate.
As mentioned before, the critical section of the weld
for minimum toughness is at the center (4). But there are
basically four regions in the weld area which have a
variable toughness. These four sections are the weld metal
itself, the transtion zone where filler metal combines with
the alloy plate, the heat of fusion or heat affected zone,
and the plate itself. In the order of increasing toughness,
the weld metal comes first, secondly, the transition or heat
of fusion zone, and finally the plate alone (4,62,64,68).
For the relative toughness of the center of the various welds
with respect to the heat affected zone (HAZ), Table 31 shows
a higher UPE for the HAZ than the weld center, and Figure
74 indicates the above order of toughness relative to the
weld centerline for a 6061-T6 plate. Note that for the two
types of welds in Figure 74, the plane strain stress intensity
factor is smaller at the center of the weld and remains
essentially constant at various distances within the HAZ, as
93

expected. Note also that the toughness of the transition
zone adjacent to the filler-plate boundary is either equal
to or slightly greater than the toughness at the plate cen-
terline and that the toughness of any of these locations
within the respective zones in Figure 74 is less than that
of the 6061-T6 plate which is measured as 24 ksi / in.
using a surface flaw specimen. Thus this demonstrates that
in measuring toughness of welded joints, the notch should
be located within the filler metal itself and that the
toughness of the weld may be lower than that of the base
metal, but this may not always be the case as seen in Figures
67 and 72.
One of the toughness characteristics of welds recently
studied is the dependence of toughness upon welding procedure.
Recent investigations show that welding procedure and/or
position has no effect upon fracture resistance of welds in
5083-0 plates and extrusions which were applied in the flat,
vertical, and horizontal positions by either an automatic
or semi-automatic process. Note that the 5183 welds in the
5083-0 plate have a toughness which is basically invariant
with both the welding position or method at all temperatures.
Thus the only way in which the welding process appears to
affect toughness is in the overall quality or soundness of
the weld. Variability in welding is of no consequence (68).32
94
A new type of welding process has been developed which
appears to have an advantage over the conventional MIG or TIG
welds. This new welding method is called election beam
welding (69) and employs a low travel speed, low voltage,
high amperage, and over powered type settings to achieve
desirable welds (69).
An investigation has been made into the properties of
welds using this new process. Specifically, notch tensile
specimens of 2219 sheet have been used to derive a plane
strain stress intensity factor for both the conventional
tungsten-inert gas weld and the election beam weld. Table
42 gives the results of these tests and shows that the TIG
weld produces a toughness at the weld centerline which is
less than the base metal. For this type of weld, 2319 is
used as a filler, and the results of Table 42 agree with
those of Figure 67 for the same filler and plate combination
except in the figure the UPE is the measure of toughness.
For the plate welded by the election beam process, the
as welded toughness is larger than the conventional TIG
weld. But note that a different temper is used for the
plate, T6 E46. T6 E46 is a modified T6 temper derived by
under aging and results in higher tensile properties than
the T-6 temper due to the reduced aging time and temperature
(69). If this temper is employed after election beam
welding of 2219-T42 sheet, the toughness and tensile proper-
95
ties are increased even more (see Table 42). But quenching
and distortion problems may occur in this post weld heat
treatment process. If these problems do not exist or can
be alleviated, employing the new welding process can result
in tensile strengths equivalent to base plate and a toughness
greater than that of the conventional TIG method. If the
post aging process cannot be used, the toughness will still
be larger than that of the conventional weld, and there
will be a 20 pct. increase in tensile properties over the
TIG weld. Thus this newly developed weld process has a
definite advantage over the various gas arc welds.
Of definite importance concerning welding procedures,
is the effect on toughness of repair welds. Studies of
surface flaw specimens indicate that repair welding can reduce
toughness considerably, by as much as 50 pct. according to
Figure 75. This may be of serious concern since the
objective of a repair weld is to alleviate the possibility
of failure not to increase it. But according to the study,
this latter effect is the result of repair welding. Thus
there are three possible plans of action; make sure the
initial weld is sound and adequate, have better control over
the repair welding process, or finally test more repair
weld specimens using accepted testing procedures rather
than surface flaw specimens which can possibly predict
erroneous results. Only after more tests are completed, can
96

one say that repair welding reduces toughness. But for now,
more control should be used in the application of repair
welding as possible failure remedies.
One area of weld behavior that has been overlooked so
far is that of welded alloy castings. Reported results of
notched tensile tests show that, as in the welds of the
wrought alloys, the welded castings exhibit a large toughness
which is invariant with temperature (65). This is shown in
Figure 73 and Table 43 and note that cast alloys can be
welded to wrought alloys. The welds of the two types of
alloys will develop adequate notch toughness only if the
properties of the base metals are about the same. Otherwise,
the welded joint will assume the properties of the weaker
base metal (65). Thus when welding the two types of alloys,
both base metals should have the same tensile properties and
toughness.
In comparison to the welded wrought alloys, the welds
of cast alloys have a comparable strength but lower toughness.
This is evident in Figure 71 and shows the inherent inverse
relationship of toughness and strength for the welds in the
wrought and cast alloys. Note the lower toughness for the
cast alloy welds as compared to the welded and unwelded
wrought alloys for a given strength. This relative position
of the welded cast and wrought alloys is the same as that
of the unwelded alloys. Thus welds in cast alloys do not
97
appear to be optimum on the basis of strength and toughness.
With this disclosure of the toughness of welds in
pressure vessel and aircraft alloys, several points must
be considered before these alloys are to be used in
fabricated welds:
1. On the basis of toughness, weld zone toughness is
greater than that of the base metal in either the
cold worked or heat treated tempers but is less
than the toughness of the annealed base plate.
An exception to this is the 6061-T6 plate and 4043
filler alloy and the 2219 plate with 2319 filler
alloy as welded.
2. The plane strain stress intensity factor for the
pressure vessel alloys is estimated to be 40 ksi
/ in. with the exception of as welded 2219 and
6061-T6 plate using 2319 and 4043 filler alloys
respectively. The kI value is anticipated at 30
ksi /inh for these latter two welds.
3. Concerning decreasing temperatures, the toughness
of the high strength welds of the 7xxx series alloys
drops with decreasing temperatures but the
toughness of the other types of alloy welds remains
essentially the same down to -320 0F. thereafter
decreasing slightly.

4. On the basis of both strength and toughness, the
toughness of welds in wrought and cast alloys is
less than that of the wrought base metal for a given
strength.
5. Usually filler alloys containing silicon (4043) and
magnesium (5xxx series) do not have increased
toughness as heat treatment and/or aging is employed.
6 Magnesium base filler alloys provide greater
toughness than the silicon bearing filler alloys.
And increasing the magnesium content of the filler
usually results in a slight reduction in toughness
although the toughness of the 5xxx filler alloys
is about the same with no big spread of values.
7. Heat treating and/or aging of 2319 filler alloy
results in an appreciable increase in fracture
resistance.
8. Concerning the toughness with respect to the weld
geometry, the toughness increases in the following
order according to the distance or location of the
zone from the weld centerline; the weld metal
proper, the transition zone, the heat affected zone,
and the base metal itself.
9. Welding position or procedure (automatic or semi-
automatic) has no effect on weld toughness.

10. Electron beam welding increases toughness over the
conventional weld processes.
11. Just as in wrought alloys, welded alloy castings
exhibit high notch yield ratios which decrease only
slightly with temperature below -320 0F.; otherwise,
the ratio is constant with decreasing temperatures.
12. Welds in alloy castings are lower than welds in
wrought alloys based upon toughness and exhibit
the inherent inverse relationship between toughness
and strength which is lower than the same relation-
ship for wrought alloy plate.
13. Casting alloys when welded to wrought alloys
should have comparable base metal properties so as
to insure adequate weld toughness.
With these basic discoveries outlined, the understanding
of weld behavior and properties should be close at hand.
And the critical parameters necessary for safe design are
available so that the possibility of weld failure is mini-
mized if taken into account during design.
100
Conclusion
For the optimization of fracture and yield strength
design, few alloys like x7005-T6351 of Figure 76 have been
developed. But the above discussion should aid in a
possible direction for continued study to achieve the
desired objective.
In pursuit of the above objective, many parameters
must be taken into account for the optimal alloy such as
the effect of alloying additions on the type and location
of the hardening zones or precepitates. Even mechanical
and thermal processes can alter both toughness and strength.
And for optimization of strength and fracture resistance, a
combination of compositional change and variable processes
must be used. This not only applies to the wrought alloys
but also for the alloy castings which respond similarly
to increasing alloy additions and foundry processes.
One part of the final alloy microstructure which is
critical for alloy optimization is the amount of porosity,
oxide inclusions, or intermetallic compounds. These
inherent defects if present in appreciable numbers can create
notch effects in both wrought and cast alloys which can
induce a brittle state of low fracture resistance. Even if
the composition and foundry process is closely controlled,
the quality of an alloy can make a difference in its final
101

properties. Thus precautionary measures must be taken
during the initial stages of alloy fabrication in order to
achieve a high quality alloy with the required properties.
Basically, there appears to be three influences or vari-
ables which the metallurgist can employ to achieve optimum
alloys. These are the composition of the alloy, the process
employed to achieve desirable properties, and the control of
the melting and casting of the alloy. Only if the combina-
tion of these three is taken into account, can an optimum
be obtained.
With this intention of combining the three parameters,
recent work has shown that this synthesis achieves desirable
combinations of fracture resistance and strength and should
be pursued even further to obtain alloys superior to that
of x7005-T6351.
In trying to discover the reasons for the parameter
influences upon fracture resistance and strength, a better
understanding of natural occurrences within the microstructure
has been attained. But many questions have yet to be answer-
ed such as the effect of the precipitate free zone on tough-
ness or strength and will not be answered until more testing
and research has been undertaken. But what has been
presently discovered or theorized such as the role of
dislocations and hardening zones or precipitates is a new
step in recognizing the action of properties of the
102

microstructure on the strength and fracture resistance of
aluminum alloys. The understanding of how the microstructure
is formed or changes with composition or foundry process and
how it reacts under service load is the key to developing
tougher and stronger alloys.
The explanation of the dependence of toughness and
strength on the microstructure is not the only development
in aluminum alloys within the recent years, for work has
been done to quantize this fracture resistance so as to
facilitate design based upon fracture rather than yield
strength.
Published results as indicated in Figure 27 and Table
3 show a band and listing of plane strain stress intensity
factors for a given yield strength of commercially available
high strength alloys. The intention is to be able to design
for either a critical crack size which must be detected by
various inspection techniques or for a nominal fracture
stress given a specific crack size. Note that for a yield
criterion, a specified yield point is given,and a designer
can choose the appropriate alloy within the band of Figure
27 and find the appropriate fracture resistance. This
resistance as read off the plot for various alloy tempers
and forms can be used to determine what the safe service
load can be before fracture instability accurs. And if
this nominal fracture load is less than the service load
103

which causes overall yielding, the fracture stress will
govern; otherwise, the load causing large plastic flow in
the member will be critical because fracture is very unlikely
to occur. Thus the quantized fracture resistance of the high
strength alloys allows for a two fold design and eliminates
the possibility of unstable or catastrophic failure if a
careful design is undertaken.
Other factors which are critical in design and have
been disclosed in the above discussion are the variability
of toughness in the three principal directions of alloy
plate and the toughness of welds. Both must be considered
if large, thick plate is to be fabricated into spar
components of aircraft or any other multiple redundant
structure. And usually the miniumu fracture resistance of
the plate must be taken into account. But for plate of a
given yield strength, either the toughness in the short
transverse direction or weld toughness can be critical.
Predominantly the latter governs because the toughness of
the weld is less than that of the parent plate for a given
yield strength. Thus for a safe design, the minimum toughness
must be taken into account even though cracks may be found
predominantly outside of thie weld metal or else in the
longitudinal or long transverse direction of a plate where
the fracture resistance can be larger.
104
By showing what is critical in designing for fracture
and what data is available concerning the description of an
alloy's ability to retard catastrophic fracture, the
objective of this discussion is complete. And by demonstra-
ting what properties of the microstructure are critical for
adequate toughness, the designer and/or metallurgist has
greater insight into the role of each variable and the
possible direction in which further research can be pursued.
Even though this study was unable to survey all the
available material, the highlights of published data on the
fracture resistance of aluminum alloys appears to be covered
and should be adequate to show the value of aluminum alloys
as a structural material based upon both strength and
fracture resistance.
105

Bibliography*

1. Holt, M. and Kaufman, J.G., "Indices of Fracture
Characteristics of Aluminum Alloys under Different
Types of Loading," Material Technology - An Inter-
American Approach, 1968, p. 426-436.
2. Kaufman, J.G. and Hunsicker, H.Y., "Fracture Toughness
Testing at Alcoa Research Laboratories," Fracture
Toughness Testing and Its Applications, American Society
of Testing Materials, 1965, p. 290-309.
3. Kaufman, J.G., Schilling, P.E., and Nelson, F.G.,
Fracture Toughness of Aluminum Alloys, American Society
of Metals Congress 1968, Detroit, Mich.
4. Kaufman, J.G., Nelson, F.G., and Holt, M., "Fracture
Characteristics of Welds in Aluminum Alloys," Welding
Journal, July 1966, p. 321S-329S.
5. Kaufman, J.G. and Johnson, E.W., "Notch Sensitivity of
Aluminum Alloy Sheet and Plate at -320 0 F. Based upon
Notch: Yield Ratio," Advances in Cryogenic Engineering,
Plenum Press, N.Y., 1963, vol. 8, p. 678-685.
6. Goode, R.J., "Evaluation of Materials for Hydrospace
Applications," Weld Imperfections, 1968, p. 393-426.
7. Van Horn, K.R., Aluminum, American Society for Metals,
Metals Park, Ohio, 1967, vol. 2, p. 95-97.
107

8. Kaufman, J.G., "Fracture Toughness of Aluminum Alloy
Plate from Tension Tests of Large Center Slotted Panels,"
Journal of Materials, Dec. 1967, 2,(4), p. 889-914.
9. American Society of Testing Materials Recommended
Practice for Plane Strain Fracture Toughness Testing of
High Strength Metallic Materials Using a Fatigue Cracked
Bend Specimen, Letter Ballot Draft, 1967.
10. Kaufman, J.G. and Holt, M., "Evaluation of Fracture
Characteristics of Aluminum Alloys at Cryogenic
Temperatures," Advances in Cryogenic Engineering, Plenum
Press, N.Y., 1965, vol. 10, p. 77-85.
11. Davis, R.A. and Quist, W.E., "Fracture Toughness,"
Materials Design Engineering, vol. 62, no. 5, Nov. 1965,
p. 91-97.
12. Kaufman, J.G., "Role of Theoretical Stress Concentration
Factor in Evaluating Notch Toughness," Materials Research
and Standards, vol. 7, no. 5, May 1967, p. 189-193.
13. Chu, H.P., "The Notch-Bend Strength of Titanium,
Aluminum and Copper Base Alloys in Heavy Sections,"
Journal of Basic Engineering, Dec. 1969, 91, (4), p.
830-840.
14. Kuhn, P., "Strength Calculations for Sheet Metal Parts
with Cracks," Materials Research and Standards, Sept.
1968, 8, (9), p. 21-25.
108

15. Christian, J.L., Witzell, W.E., and Hurlich, A.,
"Evaluation of the Effects of Specimen Configuration and
Testing Variables on Crack Propagation Properties,"
Advances in Cryogenic Engineering, Plenum Press, N.Y.,
1965, vol. 10, p. 86-101.
16. Davis, S.O., Tupper, N.G., and Niemi, R.M., "Effect of
Specimen Type and Crack Orientation on Fracture Toughness,"
Engineering Fracture Mechanics, June 1968, 1, (1), p.
213-233.
17. Kaufman, J.G., Nelson, F.G., and Holt, M., "Fracture
Toughness of Aluminum Alloy Plate Determined with Center
Notch Tension, Single Edge Notch Tension, and Notch
Bend Tests," Engineering Fracture Mechanics, Aug. 1968,
1, (2), p. 259-274.
18. Mulherin, J.H., Armiento, D.F., and Markus, H., "The
Relationship between Fracture Toughness and Stress
Concentration Factors for Several High Strength Aluminum
Alloys," Journal of Basic Engineering, vol. 86, no. 4,
Dec. 1964, p. 709-717.
19. Van Horn, K.R., Aluminum, American Society for Metals,
Metals Park, Ohio, 1967, vol. 1, p. 114-126.
20. Nock Jr., J.A. and Hunsicker, H.Y., "High Strength
Aluminum Alloys," Journal of Metals, 1963, 15, (3),
p. 216-224.
109
21. Knoll, A.H. and Kaufman, J.G., "Lithium in Aluminum 2020,"
Metal Progress, vol. 77, June 1960, p.80- 82 .
22. Ghate, V.B. and West, F.D.R., "The Effect of Manganese
on the Tensile Properties of Quenched and Aged Aluminum
Copper Alloys Containing 3 and 4.5 Wt. % Copper,"
Metallurgia, vol. 63, June 1961, p. 269-272.
23. Unwin, P.N.T. and Smith, G.C., "The Microstructure and
Mechanical Properties of Al - 6% Zn - 3% Mg," Journal
of the Institute of Metals, vol. 97 (9), Sept. 1969,
p. 299-310.
24. Ryum, N., Haegland, B., and Lindtveit, F., "Brittleness
and Microstructure of Some Al - Mg - Zn Alloys,"
Zeitschrift Metallkunde, vol. 58, no. 1, Jan. 1967,
p. 28-31.
25. Christian, J.L. and Watson, J.F., "Mechanical Properties
of Several 2000 and 6000 Series Aluminum Alloys,"
Advances in Cryogenic Engineering, Plenum Press, N.Y.,
1965, vol. 10, p. 63-76.
26. Christian, J.L., "Effects of Chemistry and Processing on
the Mechanical Properties of Engineering Alloys at
Cryogenic Temperatures," Metals Engineering Quarterly,
1964, 4, (3), p. 53-63.
27. Christian, J.L. and Watson, J.F., "Mechanical Properties
of Several 5000 Series Aluminum Alloys at Cryogenic
Temperatures," Advances in Cryogenic Engineering, Plenum
110

Press, N.Y., 1962, vol. 7, p. 490-497.
28. Christian, J.L. and Watson, J.F., "Properties of 7000
Series Aluminum Alloys at Cryogenic Temperatures,"
Advances in Cryogenic Engineering, Plenum Press, N.Y.,
1961, vol. 6, p. 605-621.
29. Tetelman, A.S. and McEvily Jr., A.J., Fracture of
Structural Materials, John Wiley & Sons,Inc., N.Y.,
1967,-p. 217, 329-333.
30. Low Jr., J.R., "Effects of Microstructure on Fracture
Toughness of High Strength Alloys," Engineering Fracture
Mechanics, June 1968, 1, (1), p. 47-53.
31. Tetelman, A.S., "Fundamental Aspects of Fracture with
Reference to the Cracking of Steel Weldments," Weld
Imperfections, 1968, p. 249-275.
32. Gangulee, A. and Gurland, J., "On the Fracture of
Silicon Particles in Aluminum Silicon Alloys,"
Transactions of the Metallurgical Society of the
American Institute of Mining Engineers, vol. 239, no. 2,
Feb. 1967, p. 269-272.
33. Brock, D., "Some Considerations on Slow Crack Growth in
a Commercial Aluminum - Copper Alloy," International
Journal of Fracture Mechanics, March 1968, 4, (1),
p. 19-29.
34. "Aluminum Shows Its Mettle in Cryogenic Tests," Modern
Metals, vol. 18, no. 9, Oct. 1962, p. 64.
111

35. Tellom, R., "Aluminum in Cryogenics," Light Metal Age,
vol. 18, Feb. 1960, p. 6-17.
36. Kaufman, J.G. and Bogardus, K.O., "Tensile Properties
and Notch Toughness of Aluminum Alloys at -452 0 F. in
Liquid Helium," Advances in Cryogenic Engineering,
Plenum Press, N.Y., 1968, vol. 13, p. 294-308.
37. Rice, L.P., Campbell, J.E., and Simmons, W.F., "The
Tensile Property Evaluation of One 5000 Series Aluminum
Alloy at the Temperature of Liquid Helium," Advances in
Cryogenic Engineering, Plenum Press, N.Y., 1963, vol. 8,
p. 671-677.
38. Rice, L.P., Campbell, J.E., and Simmons, W.F., "Tensile
Behavior of Parent Metal and Welded 5000 Series Aluminum
Alloy Plate at Room and Cryogenic Temperatures,"
Advances in Cryogenic Engineering, Plenum Press, N.Y.,
1962, vol. 7, p. 478-489.
39. "Can Aluminum Plate Compete for Cryogenic Jobs?" Iron
Age, vol. 188, Dec. 14, 1961, p. 116-118.
40. Mayer, L.W., Anderson, W.A., Brandt, J.L., and Kaufman,
J.G., "What Four New Aluminum Alloys Have to Offer,"
Metal Progress, 95, (5), May 1969, p. 68-72.
41. Steigerwald, E.A. and Hanna, G.L., "Influence of Work-
Hardening Exponent on the Fracture Toughness of High
Strength Materials," Transactions of the Metallurgical
Society of the American Institute of Mining Engineers,
112

Feb. 1968, 242, (2) , p. 320-326.
42. Van Horn, K.R., Aluminum, American Society for Metals,
Metals Park, Ohio, 1967, vol. 1, p. 148.
43. Ryder, D.A. and Vian, R.E., "Some Observations on 450
Fracture in a Commercial Polycrystalline Aluminum - Zinc
- Magnesium - Copper Alloy," Journal of the Institute of
Metals, 90, (10), 1961-62, p. 383-386.
44. Spuhler, E.H., Knoll, H., and Stickley, G.W., Survey of
Candidate Aluminum Materials for Supersonic Aircraft
Applications, S.A.E. paper no. 742F, Society of
Automotive Engineers, vol. 485.
45. Zinkham, R.E., "Longitudinal and Short Transverse
Fatigue and Fracture Properties of Heavy Aluminum Alloy
Plates, Produced by Forging and Rolling," Transactions
of the Metallurgical Society of the American Institute
of Mining Engineers, July 1964, 245, (7), p. 1519-1525.
46. Zinkham, R.E. and Baker, C., "Variation of Mechanical
Properties, Toughness, and Texture in Two Differently
Fabricated High Strength Aluminum Alloy Plates (7179-
T651-)," Engineering Fracture Mechanics, 1969, vol.1,
p. 495-506.
47. Kaufman, J.G. and Sicha, W.E., "Notch Toughness of Some
Aluminum Alloy Castings at Cryogenic Temperatures,"
Advances in Cryogenic Engineering, Plenum Press, N.Y.,
1966, vol. 12, p. 473-483.
113

48. Turner, A.N. and Bryant, A.J., "The Effect of Ingot
Quality on the Short Transverse Mechanical Properties
of High Strength Aluminum Alloy Thick Plate," Journal of
the Institute of Metals, 1967, vol. 95, p. 353-359.
49. Ransley, C.E. and Talbot, D.E.J., "The Embrittlement of
Aluminum Magnesium Alloys by Sodium," Institute of Metals,
Journal, vol. 88, Dec. 1959, p. 150-158.
50. Carman, C.M.-and Armiento, D.F., "Plane Strain Fracture
Toughness of High Strength Aluminum Alloys," Journal of
Basic Engineering, Dec. 1965, p. 904-916.
51. Flemings, M.C., "Premium Quality Aluminum Castings,"
Foundry, vol. 91, no. 7, July 1963, p. 60-63.
52. Bucknall, E.H., Vohra, Y.P., and Greer, J.B., "Cracking
of a Strong Aluminum Alloy Used in Aircraft Construction,"
Indian Institute of Metals, vol. 19, June 1966, p. 85-90.
53. Schwartzberg, F.R., "A Review of Cryogenic Fracture
Toughness Behavior," Advances in Cryogenic Engineering,
Plenum Press, N.Y., 1967, p. 458-472.
54. Kaufman, J.G. and Johnson, E.W., "New Data on Aluminum
Alloys for Cryogenic Applications," Advances in Cryogenic
Engineering, Plenum Press, N.Y., 1961, vol. 6, p. 637-
649.
55. Develay, R., Foure, A., Lehongre, S., Mungnier, D., and
Schroeter, D., "A Versatile Aluminum Alloy for Cryogenic
Applications, Advances in Cryogenic Engineering, Plenum
114

Press, N.Y., 1967, p. 484-495.
56. Van Horn, K.R., Aluminum, American Society for Metals,
Metals Park, Ohio, 1967, vol. 1, p. 83-84.
57. Miklyaev, P.G. and Fridman, Ya.B., "Determination of the
Anisotropy of Notch Sensitivity of Metals and the
Sensitivity to Initial Crack under Single Impact,"
Industrial Laboratory, Apr. 1967, 33, (4), p. 565-569.
58. Miklyaev, P.G . and Fridman, Ya.B,"On the Evaluation of
Mechanical Properties and the Type of Fracture of
Anisotropic Metals," Industrial Laboratory, vol. 32,
no. 2, 1966, p. 265-270.
59. Hyatt, M.V., Zahn, H.R., and McMillan, J.C., "Parting
Plane Effects of Fracture Mode and Toughness in a 7079-
T6 Die Forging," Quarterly Transactions of the American
Society of Metals, vol. 59, no. 2, June 1966, p. 342-344.
60. Zinkham, R.E., "Anisotropy and Thickness Effects in
Fracture of 7075-T6 and -T651 Aluminum Alloy,"
Engineering Fracture Mechanics, 1968, vol.1, p. 275-289.
61. Mikesell, R.P. and Reed, R.P., "The Tensile and Impact
Strength of Annealed and Welded 5086 Aluminum Down to
200K.," Advances in Cryogenic Engineering, Plenum Press,
N.Y., 1960, vol. 4, p. 101-113.
62. Metzger, G.E., "Some Mechanical Properties of Welds in
6061 Aluminum Alloy Sheet," Welding Journal, Oct. 1967,
115

p. 4575-4695.
63. Baker, W., Bryant, A.J., and Durham, R.J., "Recent
Developments in High Strength Aluminum Alloys," Journal
of the Royal Aeronautical Society, 1966 (70) (688), p.
757-763.
64. Lewis, R.E., Hays, K.E., and Watts Jr., G.H., "Imperfec-
tions in Magnesium and Aluminum Alloy Sheet Weldments,"
Weld Imperfections, 1968, p. 481-514.
65. Nelson, F.G., Kaufman, J.G., and Wanderer, E.T., "Tensile
Properties and Notch Toughness of Groove Welds in Wrought
and Cast Aluminum Alloys," Advances in Cryogenic Engineer-
ing, Plenum Press, N.Y., 1969, vol. 14, p. 71-82.
66. De Money, F.W. and Wolfe, G.C., "Tensile and Impact
Properties of 7075-T6 and 7079-T6 Plate Hard Forgings
and Tensile Properties of Plate MIG Weldments between
75 and -320 0F.," Advances in Cryogenic Engineering,
Plenum Press, N.Y., 1962, vol. 7, p. 466-477.
67. Kaufman, J.G., Nelson, F.G., and Johnson, E.W., "The
Properties of Aluminum Alloy 2219 Sheet, Plate, and
Welded Joints at Low Temperatures," Advances in Cryogenic
Engineering, Plenum Press, N.Y., 1963, vol. 8, p. 661-670.
68. Nelson, F.G., Kaufman, J.G., and Wanderer, E.T., "Tear
Tests of 5083 Plate and of 5183 Welds in 5083 Plate and
Extrusions, Advances in Cryogenic Engineering, Plenum
116

Press, N.Y., 1970, vol. 15, p. 91-101.
69. Trzil, J.P. and Hood, D.W., "Electron Beam Welding 2219
Aluminum Alloy for Pressure Vessel Applications,"
Welding Journal, Sept. 1969, 48 (9) , p. 3955-4085.
*Other additional references appear to be pertinent to the
discussion but were not available at M.I.T. or else were
written in foreign languages (see Appendix D and E
respectively).
117

APPENDIX A

Footnotes
1. Notch strength analysis:
U
u
1 + C km w
W 1 + 2a/w
2 E 1(IN)E
(necessary condition)
SN = net section stress
au = tensile strength
k = stress concentration factoru
2a = initial crack length
w = specimen width
= Neuber's constant
E = Young's modulus
E = secant modulus
119
SN
ku
m -r
<_IN
S
where
1 _ )

0 < C < 30 0 (perfectly ductile)m -
30 (brittle material)
This method gives the same results of the ratio of
fracture stress (calculated) to fracture stress
(experimental) as the fracture mechanics approach even
though smaller specimen widths can be used to maintain
the requirement SN < y thus indicating its usefulness(14).
2. The results of Table 2 show a comparison of the plain
strain intensity factor, kI , as obtained from differentc
sources and specimens. Thus in the context of the
previous discussion this may be debatable even though
there appears to be a good agreement with values of kc
3. A single crystalline phase which is solid, homogeneous
and contains two or more chemical elements.
4. After quenching of the solid solution to room temperature,
the alloy can be aged at room temperature (natural aging)
or the alloy can be aged at a moderately high temperature
for a period of time and then quenched (artificial aging).
Artificial aging accelerates the growth of precipitates.
5. A dislocation is a defect in a crystal which forms a
boundary between a distorted and undistorted section of
a crystal. There can be basically two kinds of
dislocations, an edge or screw. The edge dislocation
is formed by a partial plane of mismatched atoms which
120

has a smaller area than any other plane cut parallel to
it through the crystal. A screw dislocation relates to
the amount of lattice disturbance around the axis of a
spiral structure in a crystal. This distortion is
created by connecting former parallel planes together
in a helical ramp around the dislocation. The helix is
characterized by a pitch of one interplanar distance
and an assumed axis which is taken as the dislocation.
Note both of the above types of dislocations can be
seen separately or in combination. And both types have
a stress field associated with it which can be either
positive or negative and a high strain energy which
means that they will migrate until the total energy of
the crystal is reduced.
6. Saturation ratio =
fraction (Zn + Mg + Cu) total/(Zn + Mg + Cu)
soluable at 8600 F.
7. Note the ordinate scales for the graphs given in Figure
34 should be reversed.
8. The Burgers vector 6 defines the displacement of a
dislocation. If it is parallel to the dislocation line,
the dislocation is a screw and if it is perpendicular
to the dislocation line, it is an edge dislocation.
9. is the elastic stress concentration factor, k.•
121
10. V(c) is directly related to the plastic zone size.
4a cV(c) Y In( R + )
VrE c
where ay is the yield stress of the material
c is half the crack length
E is Young's modulus
and R is the radius of the plastic zone
11. What is meant here is that the critical crack opening
displacement, V*(c), is not a valid measure of toughness
per se but can be used to show that different materials
can be compared on a relative basis for their toughness.
12. These tempers reflect how much mechanical work has been
used to achieve a required dimension and consequent
strength. Usually the degree of hardness or working is
measured by the second digit of the temper with 9
indicating a maximum hardness or yield strength and
largest reduction of area.
13. Extensive work is usually indicated by an 8 in the
second digit of the temper designation.
14. In a = n In a Ey 0
where n is the slope of the line
and a = 0 ny 0
122

15. The reason that the T6 temper lacks toughness is due
to the increased number of coherent phases which cause
relative ease of void formation and coalescence (43).
16. The T66 temper indicates a substantial degree of cold
working after artificial aging, and the T73 temper means
that some cold work is applied after the alloy is
overaged.
17. Premium strength casting refers to a controlled
foundry practice which provides better mechanical
properties than those obtained by conventional practices.
18. A dendrite is a crystal which is shaped in a tree-like
branching pattern.
19. A eutectic is two or more intimately mixed solids which
have been formed by cooling a liquid solution. It is
also an isothermal reversible reaction.
20. One exception to this is the toughness temperature
relationship for 195-T6 which practically remains con-
stant with decreasing temperature. The reason for this
is speculated to be the nature in which the copper
alloy is present.
21. The 5xxx series wrought alloys have a considerable
toughness with temperatures down to -320 0F., but with
temperatures decreasing below -320 0 F. the toughness
drops off somewhat from the room temperature toughness.
123

22. The hydrogen level of the molten alloy is controlled by
injecting gaseous chlorine (Cl2) into the liquid for a
period of time. The longer the fluxing the less
hydrogen will be evident in the melt.
23. If the amount of oxide inclusions is considerable, a
possible brittle state can exist for the alloy just as
for the case of extensive porosity.
24. Texture refers to a definite orientation of the grains
rather than a random orientation.
25. The Miller indices within the parentheses refer to the
interc~epts of a plane with the three principal axes.
The indices are determined by the reciprocal of the
intercepts multiplied by a common denominator. For
example, a plane having intercepts 1, a , a will
1 1 1have reciprocals of 1, 1 '-- and Miller indices of (100)
26. An x-ray pole figure is a projection showing the
statistical average distribution of poles of a
specific crystalline plane in a metal, with reference
to an extended system of axes. For an istropic metal
the pole density is uniform and preferred orientation
is shown by means of increased density of poles which
are normals to the plane being investigated.
27. Poles are the normals to the surface of the planes of
interest.
124
28. The alloy V95 is composed of 2.6 pct. Mg, 1.8 pct. Cu,
6.2 pct. Zn, 0.3 pct. Mn with base Al (Russian alloy).
29. 2kG c
c E
where k is the stress intensity factorC
E is the modulus of elasticity.
30.&31.
Tungsten arc welding (TIG) refers to the use of a
tungsten electrode in an inert gas shielded weld. For
a shielded arc weld, the arc and the weld metal are
protected by a gaseous atmosphere of inert argon. The
difference between tungsten and metal arc welding (MIG)
is in the type of electrodes where the latter process
uses metal electrodes.
32. In reference to the statement that the welding process
has no effect on toughness, what is meant is that
neither automatic or semi-automatic welding affects
toughness.
125

APPENDIX B
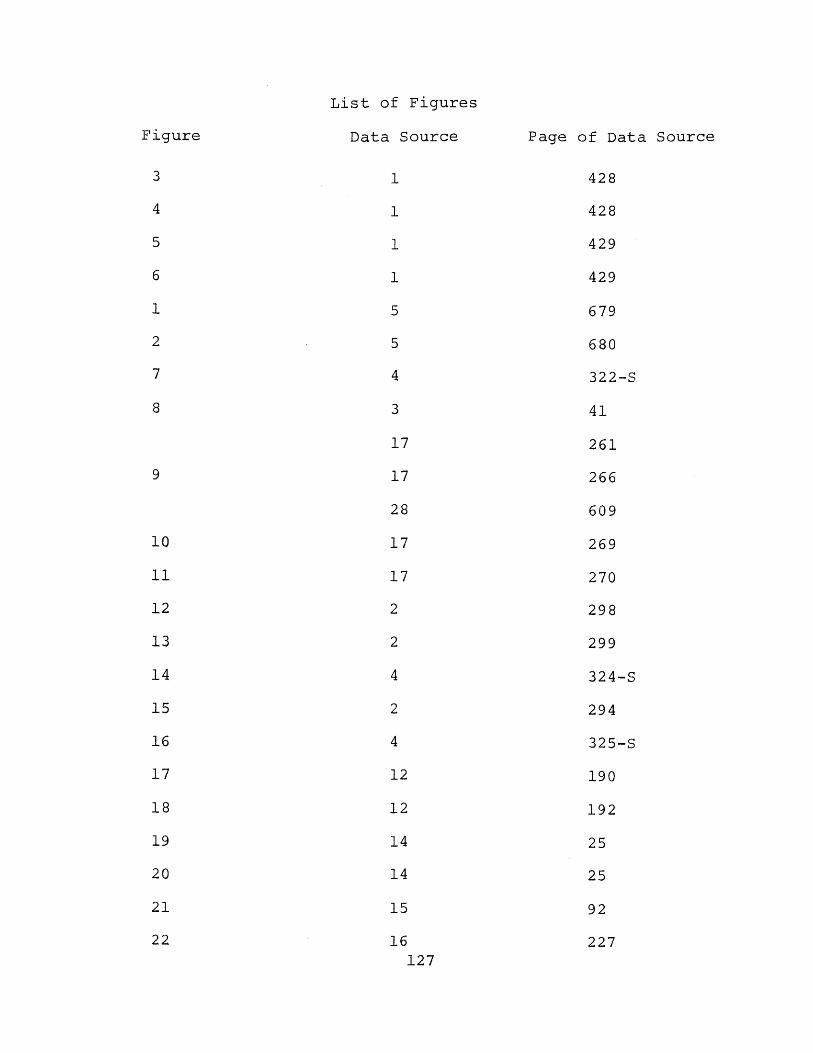
Figure
List of Figures
Data Source
1
1
17
17
5
5
4
3
17
17
28
17
17
216
127
4
2
4
12
12
14
14
15
16127
Page of Data Source
428
428
429
429
679
680
322-S
41
261
266
609
269
270
298
299
324-S
294
325-S
190
192
25
25
92
227
10
11
12
13
14
15
16
17
18
19
20
21
22

I
128
, " . .. .
igure Data Source Page of Data Source
23 16 228
24 16 229
25 18 711
26 20 218
27 3 41
28 2 304
29 2 305
30 20 221
31 23 305
32 23 305
33 26 5834 25 66
35 27 492
36 28 612
37 29 331
38 32 270
39 29 332
40 2 301
41 39 116
42 7 88
43 41 324
44 7 148
45 44 4
-- -

Page of Data Source
300
302
44
45
46
500
501
46 502
47 480
47 479
47 480
49 158
48 356
50 913
499
1520
87
83
57 565
59 343
60 281
324-S
328-S
64 501
129
46
47
48
50
51
52
53
54
55
56
60
61
62
63
68
69
Figure Data Source
--

Page of Data Source
94-S
78
328-S
70
76
502
503
74
75
130
Figure Data Source
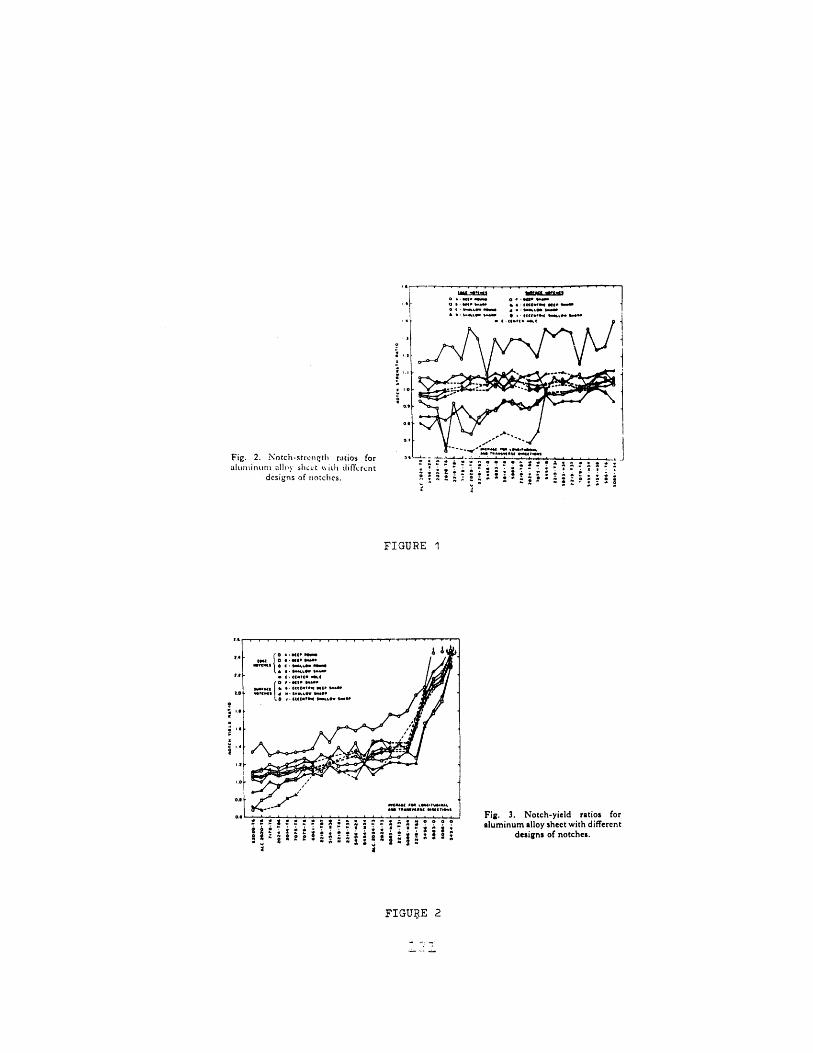
Fig. 2. Notch-strengthh ratios foraluminu gn s allod sht of r ffochc. rt
designs of notches.
FIGURE 1
1.4
1+I
L.O
~:1==: 041=::00430 0
Fig. 3. Notch-yield ratios foraluminum alloy sheet with different
designs of notches.
FIGURE 2
1.€. . . . . . . . .
I,
,,
i.,
i.,
I I

2.8
-v >, 2.4
6 2.0
1.6-J
-.2
0z 0.8
0.4
0 5 10 15 20 25 30ELONGATION IN 2-IN. (40), %
Fig. la. Notch - yield ratio vs elongationaluminum alloy plate
FIGURE 3
-- I -- 1 -T- -- T---
O
0/C
0
d
f
/
DIAGONAL THRU POINTINDICATES TRANSVERSETEST
I I i I I
0 10 20 30 40 50REDUCTION OF AREA, %
g. lb. Notch - yield ratio vsaluminum alloy plate
reduction of area
FIGURE 4
132
0o
'0-0 /
0 A-7
O W--
DIAGONAL THRU POINTINDICATES TRANSVERSETEST
1 I 1 ! L 1
3.2
2.8
I-- >-z-
0I-
U
0Z
I.6
0.8
C
I
--
'"
-
/
! ; L ! !

1600
1400
1200
1000
800
600
400
200
00 5 10 15 20
ELONGATION IN 2-IN.25 30
(40), %
Fig. 4a. Unit propagation energy vs elongation
FIGURE _5
1600
N. 1400z
J 1200z
" 1000Q
zL 800zo
600
aCor 400aI-
= 200
/0/
10 20 30 40 50REDUCTION OF AREA, %
Fig. 4b. Unit propagation energy vs reductionof area
FIGURE 6
i 1 ! I I
DIAGONAL THRU POINT 0/INDICATES TRANSVERSE / 0TEST
0
/
o/
/
0/o/
lilli
I . . I
DIAGONAL THRU POINTINDICATES TRANSVERSETEST
o//o /
/o0o0
-
Io(
I
E

Along) (b) Across wAlong weld Across weld
Wild
(C)Fusion line
Notch rodius a 0.001"
Fig. 1-Tear specimen
P MC P 3P 4PTear strength, psi = - + + bt -
Unit propagotion energy, in -Ib per sq in. energy to propogate a crackbt
Deformation, in.
Fig. 2-Representations of tear-test load deformation curves
FIGURE 7
134

SPECIMENTHICKNESS * 8
COMPACT TENSION SPECIMEN
1-jo SPAN LENGTH a _8
NOTCH -BENO SPECIMENFig. 1. Fracture toughness specimens for measuremintensity factor, K,,.
40
32' 32"
64"
Fig. la. Center-notched fracture-toughness specimen (1 0 in, thick).
FIGURE 8
135
0-
A'
-A
IINGLE -EDGE NOTCHEDTENSION SPECIMEN
ent of plane-strain stress.
7B
-
------

500, oo0
450,000
Load50,000 lb/in.
o00,000
Dsfoation*0.01 in./in.
350000Sin 14.00 in. gae length
300,000
250, O00
?00, 000
150,000
100,000
AZ65000Fg a ersnaietoddfraincre rmfacuetuhestsso etr
Fig. 7a. Representative load-deformation curves from fracture-toughness tests of center-notched tension specimens.
FIGURE 9
136
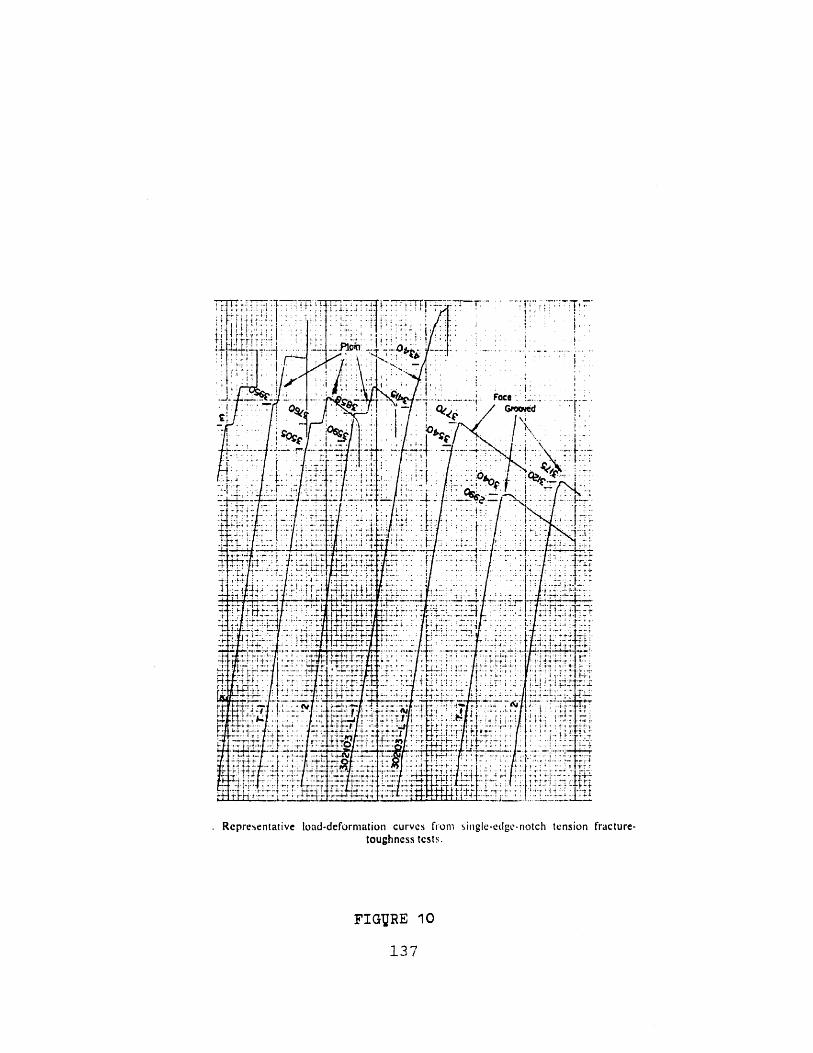
777: -:t.T T- 77-••i•• ._T r : ":.! : : : ',; .:-.l• i: *1 ' ' •!i :. :; . i
AF . i. : 1
.j . FaCe . ..:;.. . . . .-
. . .. r-t
-•:
•: ,,/• / 't, i._9ii:
.r i ... ' : !" I. I.......... I. I-
IF::: . :
" " .. .:" I - - ,I: i ,.
"--t 1 " ..m"
: , * J 4 .:-*1-7. ; .I* *-tI '· · · · :" :1 ' : :--r --
•Pf I"•-i ... ·- •:- ri-'.tt c
Representative load-deformation curves from siflgle-edlgc-notch tension fracture-toughness tests.
F:G!•E• 10
37!A'" ~iTi-47 t f :
~·: · c-e ~ ·r · :7i-. ' J
1-37I -- !·ti·I

*1
-0.004 -
Fig. 7c. Representative load-deformation curves for notch-bend fracture-toughness tests.
FIGURE 11
138
00044

0 100 200 300 400 500 600
JNIT PROPAGATION ENERGY, IN.-L8 /IN 2
-Critical Stress-Intensity Factor, KI, Versus Unit Propagation Energy.
FIGURE 12
O 100 200 300 400 500 GOOUNIT PROPAGATION ENERGY,IN.-LB./IN,2
FIG. 12-Relation Between K~u and L'nit Propagation Energy.
FIGURE' 13
139
OPEN SYMBOLS - 16 IN. WIOE FRACTURE TOUGHINESSSPECiMENS
- SOLID SYMBOLS- 2 ;N. WIOE FRACTURE TOUGHNESS -SPECIMtENS
(1) !ND!CATES TRANSVERSE OIRECTION
2014 -T6 0
2020-T6 O
2020-T6 O2024-T84
6071-76 dT
7075-TS6 7
7079-TI < -0.063-IN. ALUMINUM ALLOY SHEET 7178-TS6 •
I I I

T ..
oitched specirT
h strength oluRef 9)
established correlation
0 100 200 0 400 500 600 700 800 900 10'
iUr!i pr)((paotion energy, in-lb/in2
Fig. 3- R til~ll llshi b,,lwtwiln p)l ll, IIIr.I .II icturr t(oughness and unit propagation energy from tear tests
FIGURE 14
140
Cx
00o
S50
403
C 30
c
® 20
C
QO n
.r
·- ·~c
c
1
/·-·· -- · · ·--
L_

T 4 .D RAT2
NCT'H- Y ELD 'RATio.
!F. 20 , 4 2R
I-IN WIOE SPfMNF.
FIGURE 15
0 0.4 0.8 1.2 1.6 2.0 2.4 2.8 3.2
Notch-yield ratio ( /2-in diom round specimen, Fig. 5a)
FIGURE 16
141
CL0o0
o
u
UCio
o
r
Gac
an
GD
u,
c
'a
0
o
* Fatigue-crocked center notched specimensBased upon tests of different lots(Kic , NYR not from some lot)
/ j_v
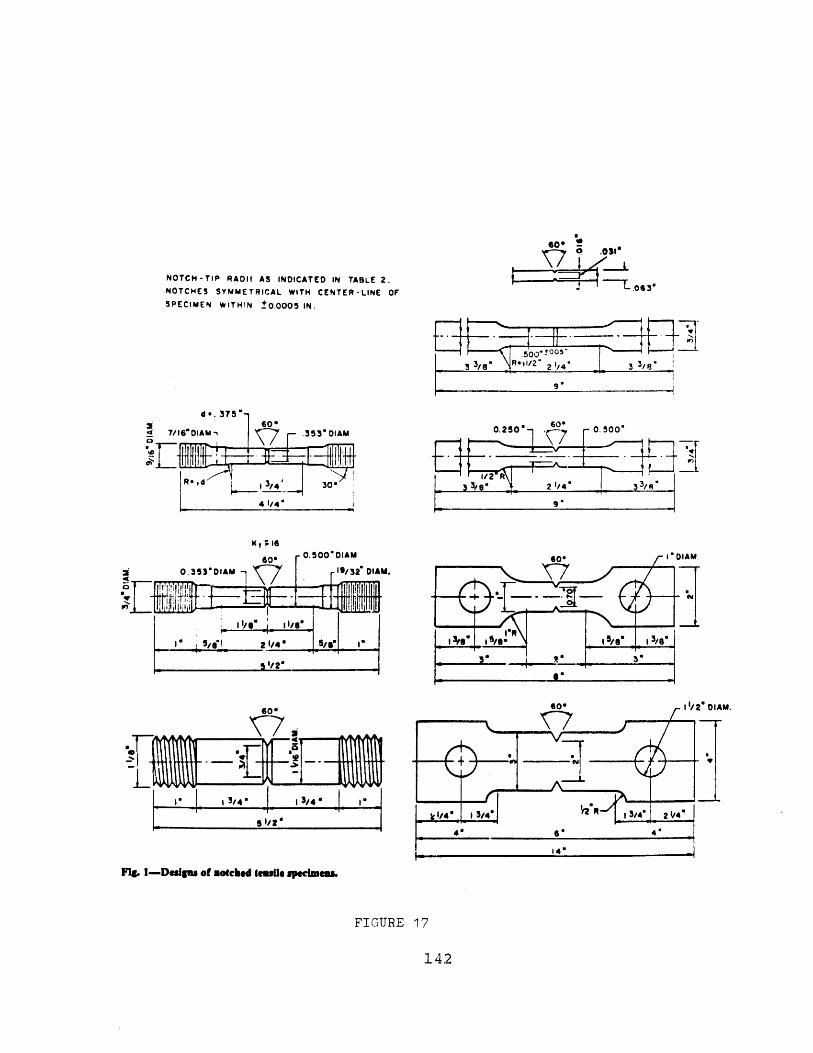
60"0eV
NOTCH-TIP RADII AS INDICATED IN TABLE 2.NOTCHES SYMMETRICAL WITH CENTER-LINE OFSPECIMEN WITHIN ±0.0005 IN.
3i< 7,,,v,,
'-I
Li
Kt 16
M.
FIg. 1-Designs of notched iesHe specimems.
FIGURE 17
142
I
.. .
M.

Round
Sheet - type
0 -jo
0.375 in. die.0. 500 in. dio.1.060 in. die.0.500 in. wide1.0 in. wide3.0 in. wide, 0.063 in. thick3.0 in. wide, 0.250 in. thick0.500 in. wide, surface notch
100
90
O 80
-
-- 9-
0 4 8 12 16 20 24
Theoretical stress concentration ftactor,notch4einslle strengths of 2024.T51 plate, transvere.
FIGURE 18
0.2 0.4 0.8 1i 02 a w
Fig. 2-Experimental and calculated K, for 2219-T87 sheet (t = 0.10 in.).Curves calculated with Cm = 0.64; o,, = 69.4 ksi: ay = 58.5 ksi.
FIGURE 19
143
£ Tensile strei.gth* Tensile vield strength
1.5-
1.4 -
1.3-
1.2
I.I-
1.0-
0.9-
U
0z
In
4,0.8-
0.7-
0.61
Flg. 2-Average
K
ksi gn.
T T I
-iNi -s-
a,
4j
I
z
-· --- -
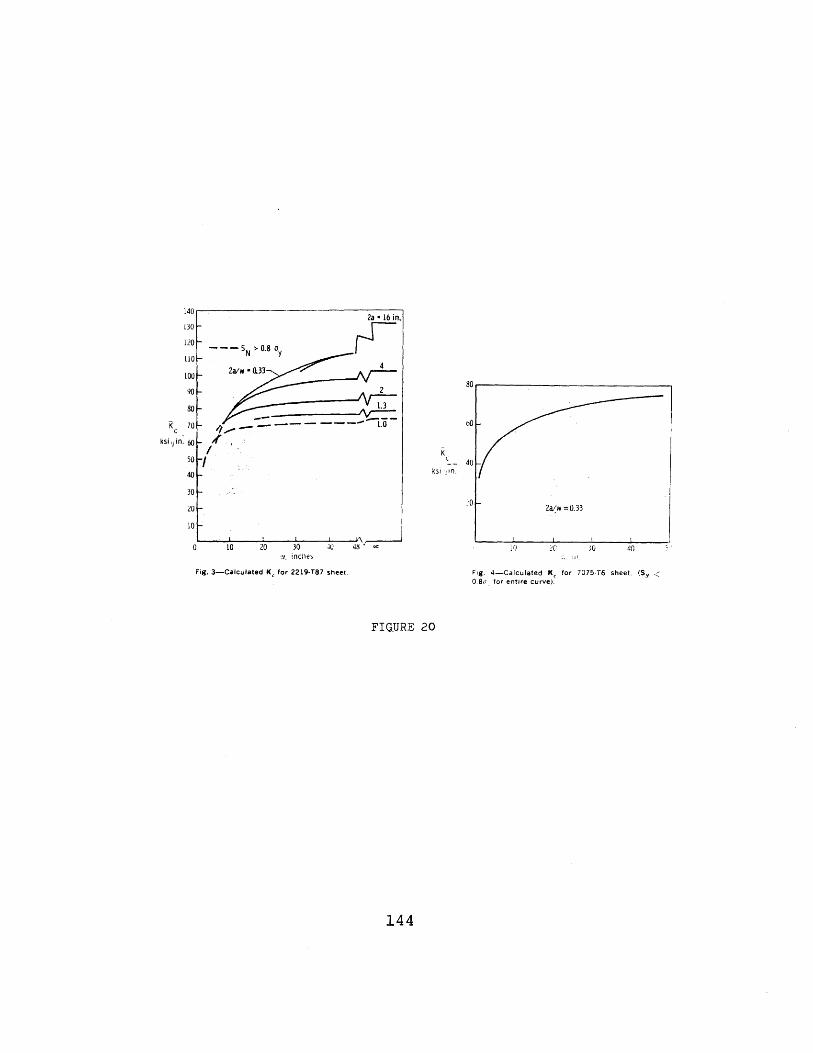
---. SN >0.80y
2a/w - 0.33--
S--- --- ' 1.3
-------- (1.0
0 10 20 30w, incles
10 48 c
K
Osi ~in.
if0 2c 30 40
Fig. 3-Calculated K, for 2219-T87 sheet Fig. 4-Calculated K, for 7075-T6 sheet. (Ss<0.8- for entire curve),
FIGURE 20
144
k
40
30
20
10
2a,/w =0.33
1Af
o"n
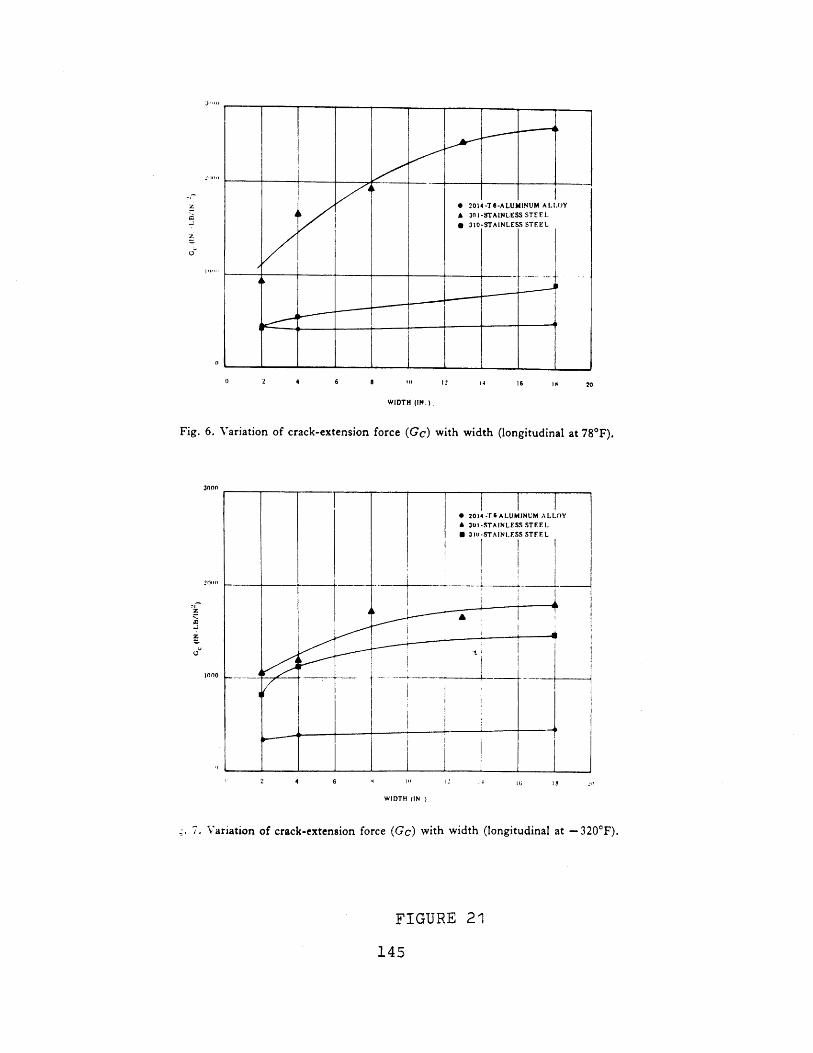
-IZ
E
Z
U
l""~i
(I
0 2 4 6 8 111 2 14 16 1$ 20
WIDTH (IN.)
Fig. 6. Variation of crack-extension force (Gc) with width (longitudinal at 780F).
300on
z
z
12
100
WIDTH (IN )
7. Variation of crack-extension force (Gc) with width (longitudinal at - 320 0F).
FIGURE 21
145
J, 1. "1
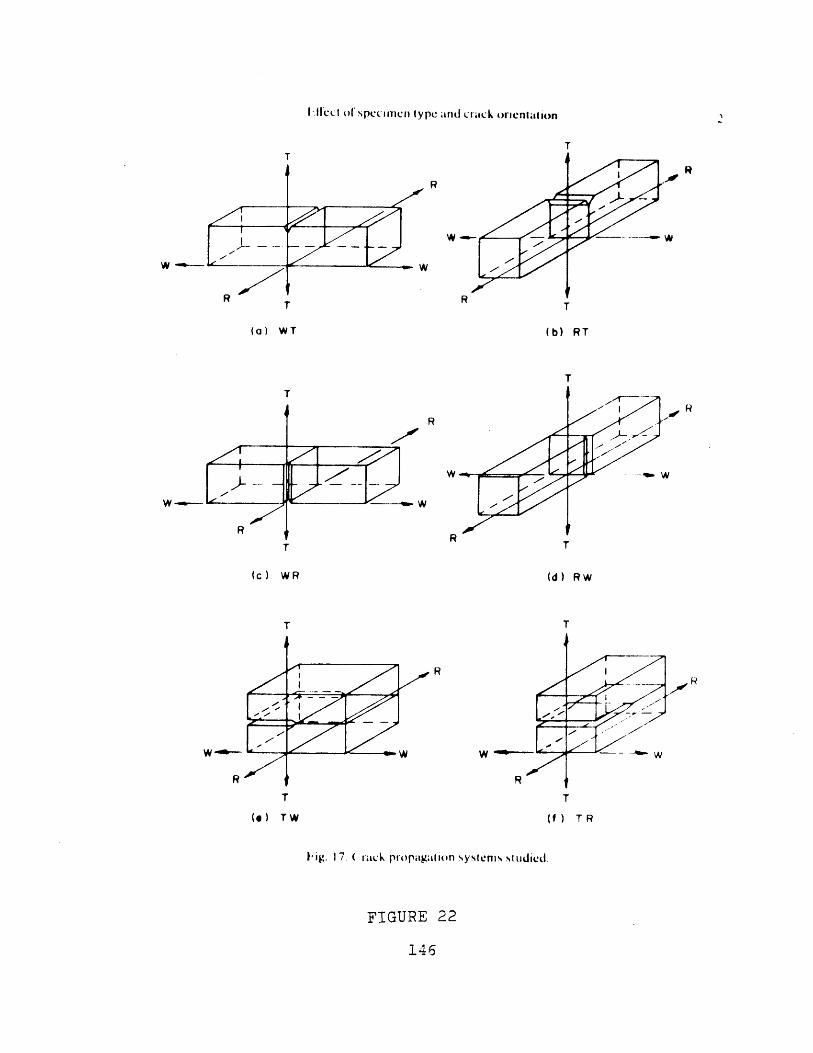
I llic of spcciincn type and crack orientation
T(1f ) TR
-ig. 17. ( irack pr"opagualion ystlcnis studied.
FIGURE 22
146
(a) WT
------ c w
(b) RT
W-
-A W
(c) WR (d) RW
RR
T
(.) rw
-- W

RT iIT I "° I
WR
I wTrI o
'l MIo
Fig. 18. Summzrx of effeict of 'pe:imen t pe and crack prop.igation %,'tem On K
F.IGURE 25
147
K(
Ksi/ )
TW
TRIo
,-'i F

KIc
Fi, 19 ariationf f A o h track propagadtion 'ygem
FIGURE 24
148
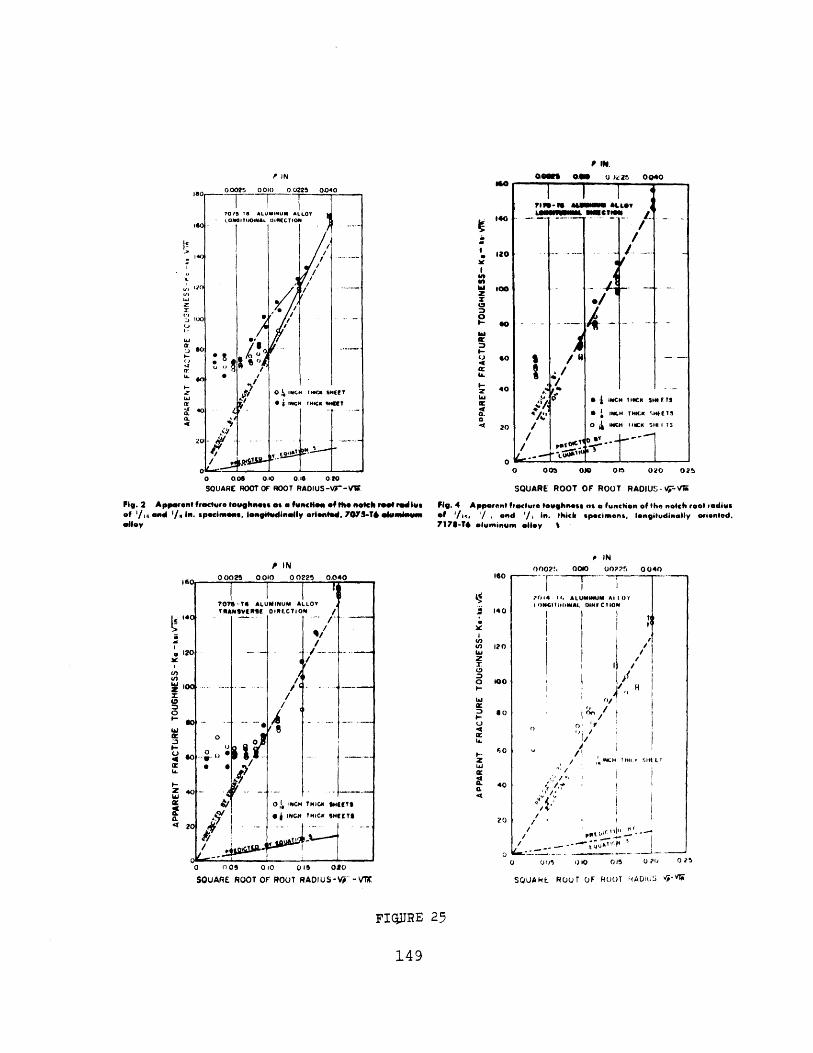
0 006 0.10 0.16 020
SQUARE ROOT OF ROOT RADIUS-VT-VW,
Fig. 2 Apparent fracture toughness as a functiel of the notch roee radiusof '/Ii and 1/m it. specimens, long•udinelly oriented, 707S-T6 eklumnmmalloy
P IN
, 0009 0,010 00225 0.040
140
S120
100
0so
2 40aL
S20
I I I 115-7•"T6 ALUNUM ALLOY d
T glAMV1r91 DIRECTION /
-- --.
I/ .
'--
k0
O( INCH THICA ISHETS
O INCHG THICI SHEETS
0
0o C**
r·
0 (10 01 0 015 00
SOUARE ROOT OF ROOT RADIUS-V~I -VTX
i'
/
SI. 040QOM 0.40 0 heas 0040
Itlf
* INLH THIxn SHILES
O (CH Issl S•I 5I4 T3
/",oftl
1
I ,
O 00 OJO 01o5 020 025
SQUARE ROOT OF ROOT RADIUS-%i-Vliv
Fig. 4 Apparent fracture toughness as a function of the notch root radiusof '/I,., '/, and '/, in. thick specimens, longitudinally oriented,7178-T6 aluminum alloy %
p IN.
so00
002!., 00QO 00775 0040
P(si14 ir, ALUMI•UM AIlloYI I()GluCIIInIAL DINECIION
Itk
11/
0/',.INCH HItI. ;%I LI
I 1-,pIot
wI'/J . 1
U 0R05 10Q 015 UD?'o 0••5
SQUAtE ROUQT OF RooT RADIUS -rv1
FIGURE 25
149
Inl
wI -/ ~LOILZYL~l----i
.. -- Lotu -
I r ~- -i I
i i 1 i 1''(/'
$' t·:'
IL= ~~----·· - -c-· -- r-
c

1200
1000
13U 800
S600
o 400a-13
o 200
0t:
7079 -T6 2020 -T47075 -6 O 2219 -147178 -T6 C 2014 -T3*X7277- T6 2024 -14
* 2219 -T81* 2219 -T370 2219 -T67e 2024 -T36'0 2024 -TSl0 2014 -T'
0 2024-7T16O 2024-TOG
S 2020-T6S ALCLAD
0 a
30 40 50 60 70 80 90XI0'TENSILE YIELD STRENGTH- psi
FIGURE 26
THICKNE~SS RAN.& :C. -- i.':.
5 i TI .. 71-T 5! . 244 -TS14 2021 .ti . 22i 9 .T;SIa o r2 -TuL c- 96se ·- Tes
S7001 -T715
7 07, - ,.51-T-5
' 707r -T7310I 7:78 -' l l!
NEF 12 \R "
PLASTELONG:TUOINIL FO PL LT i)
i : -~---~-I- f- L
I -v 70771 -T.7.7
R 176 -T<7 10
REV 13
REi 1C(3--\- \EXTRUDED SHAPES EXTRUD1r 1 AELONGITUDINAL (RW LONG-TC.Nl V I tWO) \0k
I__ I __:I r W L
O 50 60 70 .0 £0 )0 5 60 70 80 90 100
TLNSILE YIYLO S'TLi ,:-T, PIS00 I'SI
Fig. 2. P;ane-.i- rain fractur' t.ncm,sii•vss I( ) of cc:nm•-rci)a . ::m'ninumr alloy plateand extrukl d s:aj)S, cwitIr . .1- h r.on ', I ,.; , r : p, ct tension or sin-le0-edge-no:chcd tension specenlons css-:,-nti.- y within reqtirrc-n••ts of ASTM pro-posed test methods.
FIQURE 27
150
60
50
so
o o
S20
S10
o 040
I
-

12 :,
Zi PLUS Mq,%
FIGURE-M
0 2 4ZINC, %
6 9
FIGURE 29
151
2000
1600
'200
800
400
0 4
25
1.0
0 i0-
O.S
N.
z
m 2000..J
z
> 1600
zw 12002O
0 800
00z
O
60 z
40LJ
20
0
1
. i
0
~nrr~

2000
1600
1200
800
400
04 .6 8 1.0 1.2 1.4
860"F SOLID SOLUTION SATURATION RATIO
Fig. 9-Above--Unit crack propagation en-ergy values and tear strength-yield ratios forexperimental alloy series.
FIGURE 30
I25
z
I,-2.0
_w
0 0C...-
I-0
0.1
oJ I\
0O8'. Proof stress- ,3? 0-7tpsi.Figures are PFZ widths
xle .--- I
Fractur -e
0.3
0.3 I
0.6B
I 1 I
O.3
Appaeent
0.2 Fraction
Transgranular
Fracture
0.4
AREA FRACTION OF GRAIN-BIOUNDARY PRECIPITATEThe irrl of inrreai'ng fracture foughner•s loge•thr wit,h in.crrasing pr•lportions of Iransgranuilar
of grain-boundar)y prcjripilate is redlced.
FIGURE 31
152
fruactirr as the are'a fraction
s8
tsa rwt
g4
L
---

ULn win nd Smi: 1,,• AIic·tro.lrucIure ' inm Afhcinicul Pr••rthies fII Al 6" , /i 3",, 111!
u3r- . roof smi -as u- WpeeArea fracteon of gsaem-
bouedarv pieceptate 04,
KIc . I
Fracture -- 9
-I-i -I I I-I I I I
PFZ WIDTH 9 pJFrijiv. 7 Fruacti,r tlEighness and applarent froctim i of irtrunsgramtlur fructure phtiled lus a funmctin of P.F./. hit/dth.
FIGURE 32
1.3
1.2
1.1
1.0
0.,
0.7
0.4
o. :l
0. 2
01
0 .01 .02 .03 . 0 .05 .06 .07
Zglements Atom 7 x AI) effective Atomic radii (Goldschmidt)
Fig. 6. Effect of atomic radii of alloying elements on toughmess of aluminum allps.
FIGURE 33
153
KIc c
24
ks0 . n
('4
P.actsoot
Tran•g anular
0*IFracture
i -- I-
----- - 3....
*J4 1 1 41
-S, ' - -
4--
W I m m m

0 2014 - T A 104- T4 0 22t1s TS2024 - T3 . 2219 - el eit 14
Tempersture (V*)
,*tchvd(KI . G.3)Unnoth"d
Tensile Rato
100
90
N0
70
so
50
40
30
-400
& a1 - TI
-300 -200 -L" 0 .o10
strengths and notched/unnotched tensile ratiovs. temperature.
FIGURE 34
o seWs u1e
a :n*-- .].• i-ll1l
NUTCIIED
TENSILESTIUJIMTH(Ksiý rt~
NotCHEO
TENSILERATIO
TEMPERATURE (F)
Fig. 2. Notched (K t,=6.3) tensile strengths and notchedunnotched tensile ratios vs. temperature.
EIGURE 35
154
Notchoed(K
t * 6.3)TensileStrength (KSI)
Fig. 2. Notched tensile
-!

O;dp:p,0EoF·
S
E3Br:,Ooz
Temperature ('F)Fig. 3. Notched tensile strengths (ksi) and notched/unnotched tensile ratios
for 7000 series aluminum alloy sheet vs. temperature.
FIGURE 36
155
t(a)
t(6) N
(c)
t
(d)
P
p> p*
ites
Inclusions
Fig. 7.23. (.#) .•hc'm:atic variation of the frnacturrts trnith i of a hurd pa:rticle or intlusion v, with Imirticle
Six1 , . (Ib) T'y!pica:l listriblltion of particle siXz'eaboum an av'r:, i .h of piartliv.le isize p*. (c) Thelvarialion of X, the ian dlist:ane( between two particle'sof Ihie sa1 Slim' sitxh. \i a Irt Ie siz p. (1) The varil-tion of , . with . for p > I•*.
FIGURE 37
156
I
I
L

0 //
//
B /
fie /
//
-I
//
II~? POKEN PARTICLES,d, MICRONSFig. 5-Comparison of average diameters of broken and un-broken silicon particles in alloy of 6.1 pct Si.
FIGURE 38
157
15
I0
5
i I I
H
vA
oy large
ac small
es
Vi,,. 7.24. The variation of Ite' 3il9h yichl Ivc•.,,t l , , :1nd IhcIp l"'r , 1)i" :r sl vene of i llcih simll:s. ill ili u ll '11-c la h Iml:Il'lriat . fl , is
I lish i e•llc I flrI)noImI t el nolI ch li II t Ni IIhich I a.,,, = T,. ;Iltlc ;I X.i( m I en 1 ,
FIGURE 39
158

TEMPER
(INCREASING STRAIN HARDENING-' )
FIGURE 40o
159
Z
z
caX
wzwz0
a.0a',3o
a.00
uj

1.4
S1.2
1.0
II0.8
S0.8
0.6
Temperature,°FFIGURE 41
0.01 0.1 1.0Initial thicknessFinal thickness
FIGURE 42
160
1.0C.OCi

0 05 4o30 045 060 075
THICKNESS, INCHES
Fig. 7-Influence of center-notch tensile specimen thicknesson the fracture toughness of 2024 aluminum (T62 and T851
FIGURE 43
1200
1000
800
600
400
200
(20 30 40 50 60
Tensile yield strength,70 80
1000 psiFig. 24. Effects of precipitation heat treat-ment on unit crack propagation energy andyield strength of 2014, 6061 and 7075 al-loys (J. A. Nock, Jr., and H. Y. Hunsicker,Journal of Metals, 15, 216-224, 1963)
FIGURE 44
161

(SHEET 0.063 IN. THICK - TRANSVERSE DIEIICTION)OPEN SYMBOLS -TESTED AT INDICATED TEMP.
AFTER 1/2 HR. AT THAT TEMP.SOLID SYMBOLS- TESTED AT ROOM TEMP AFTER
1/2 HR AT INDICATED TEMP.
I
zUj
Cr(n~LIaJ
I-
17
:3 TEMPERATURE, F
Fig. 8 - Effect of various temperatures on the tear resist-ance of some aluminum alloys (sheet, 0.063 in. thick -transverse direction)
FIGURE 45
0.
wz02
a.ILI'_z
0 1 2 3 4
NOMINAL Mg CONTENT,
FIGURE 46
162
1600
1400
-J
z 1200
O 1000wzw
z0 800I-
z 400
40
a.00
30 o
II.-
100 II
05 6
art - -------

P. AGEING: 5men at O100 CAGEINCj. 3 hr at 180 0 C
Minimum
• I ,
TIME AT 330 0 C ,
FIGURE 47
MIN
OPEN SYMBOLS - O75-TSSOLID SYMBOLS - 7175 -T66
LONGITUDINAL (RW)
FLA
ACRPLAFLA
NGOC
"E 9OSS PARTING/NE I(TR) /
INGE
- 50 60 70 60 90 100TENSILE YIELD STRENGTH, 1000 PSI
OPEN SYMBOLS - 70t7-T73SOLID SYMBOLS - 7175 -T?36
LONGITUDINAL (RW)
FLANGE A0
WEB
ACROSS PARTING PLANE (TRIFLANGE
SO 60 70 80 90 100TENSILE YIELD STRENGTH, 1000 PSI
Plane-strain fracture toughness of 7175.T66 and T736 dieforgings.
forgings compared with that of commercial 7075.T6
FIGURE 48
163
P F Z.
WIDrH,
1O0
n
III
I
-S
0*01
60 r
F
20 K
0.
0

I I I I '
0 7075-T73T10A 7075-T76510/ TRANSVERSE
SOLID POINTS ARE PREMIUM7075-T7 TyPE PRuOUCTS
A
AVG FOR LONGITUDINALTESTS OF ExTRuEDO
SHAPES
AVG FOR TRANSVERSETESTS OF EXTRUOEDSHAPES. (FIG 2)
- I I
0 50 60 70 80 90 100TENSILE YIELD STRENGTH , 1000 PSI
Fig. 7. Plane-strain fracture toughness of premiumextruded shapes compared with that of conventionalextruded shapes.
7075-T73510 and T765107075-T73510 and T76510
FIGURE 49
50
S40
o 30o
- 20
10
040 50 60 70 80
TENSILE YIELD STRENGTH , 1000 PSI
Fig. 9. Plane-strain fracture toughness of 4-in. Alcoa 417 Process 2024-T851plate compared with that of conventional 4-in. 2024.T851 plate.
FIGURE 50
164
60
50
40
30
20
10
OPEN SYMBOL - CONVENTIONALSOLID SYMBOL - ALCOA 41? PROCMSs
L I RWI
LT (*RIA
ST I TRI
- -·
-• • • i | -
H
H
E

ISAN 10FROMTOP
IISITANCf FROM TOP
2.0 7.5 I.n
E TALP TO CENTER LINE OF SPE C S
FIGURE 51
'.4
0 ( b 10 1.5 20 2,5 i
1IISIAN(;I IHI)M IOP If tAll 10 CINIIHR LINI Of SP (.lIMIN t:N:,
FI.GURE 52
165
'IIl
I40410
1f],
TI 'F4011
01
I_ _ _ _
V)-- ·
{J
rI
I1111110 ... II• as m
I

6
T C 6 T C B T CEFT CENTER RIGHT
SPECIMEN POSITION
Fig. 7. 717)- r65 plate-shorn transvcrse yield strength. clongation and lot.hness variationof preftorged (IP') and ,landard rolled (SR).
FIGURE 53
166
a
s n'

0D
T61IFT62TS
B 8218F 0 356t7TV 2207T4 Y A356TI614 X335-TG A A356 T626 356-T4 A A356T77
T62
o -40
0
PREMIUMSTRENGTH
A C355-T60 A356.T6!( A357*T6112 Fe A357.TS2
-423*FI L
0 10 20 30 40 50 60 0 10 20 30 40 50 60TENSILE YIELD STRENGTH AT INDICATED TEMPERATURE
Fig. 5. Notch-yield ratio vs/ tensile yield strength for cast aluminum alloys at varioustemperatures.
FIGURE 54
167
A ._
0c
ua
Fig. 4. Notch-yield ratio vs.temperature fbor premniurlstrength cast aluminuri alloySIlabs. TEMPERATURE ." F
FIGURE 55
168
o0 200

0
4
C
I-Lij
0z
TEMPERATURE.- F TEMPERATURE,*F
Fig. 2. Notch-yield ratio vs. temperature for sand-cast aluminum alloy slabs.
Fig. 3. Notch-yield ratio vs.temperature for permanent
-400 -300 -200 -100 0 100 200 mold cast aluminum alloyTEMPERATURE. F slabs.
FIGURE 56
169
3.2
2.8
2.4
Cr 2.0o
-j
0z
1.2
0.8
0.4

VACAC ill
A 4 '*
:TT T z-V.::.FiW.. I' I'orc .·hi. derellop'ed t ider pl~istic-flor conditiols fit
,lr ' , tl per stit.' res'. (a) oItrtile fr 'ture': (b) brille,
fri tll4frfr s FssNied Ifull re cirtionE i fr57 er surjcffef4' rittiIslfIlfed itfif prite. f
FIGURE 57
PL A T,"
/V. PLA tE
0./
/Y OROG E
0. 2 , 3 0.
CONrENA/T Cc./ o00
FIGURE 58
170
/A -
/0
8
| I Ia
4b A

Fig. 18 Sketch showing orientation of single edge-notched specimenosin 1
3/-in-thick plate of 7075-T6 aluminum alloy
1/4 CENTER SHORT SURFACELINE LINE TRANSVERSE
1/4 CENTER SHORTLINE LINE TRANSVERSE
Fig. 19 Plane-strain fracture toughness of 7075.T6 aluminum alloys as a function of specimen location
FIGURE 59
171
G9000
S0000
40000
30000
2o000oo
10900
SURF
0-*--0 LONGITUOINAL
X5-- X LONG TRANSVER*SE
A SHOUT TRANSVERSE ..h T 77------1--ACE

%'C,
ig.4;i . Spccimren loca;tion - 7179 ~uly pl;ic.
FIGURE 60
172
f

R
(a) WT (b) RT
T
R
(C) WR (d) RW
T T
(e) Tw (f) TR
Fig. 3-Conventional crack propagation systems.
FIGURE 61
173
W
R
!
(o) WT
(b) fitI
!I
W-

)4T2*l
a. Parallel to rolled surface b.Lonitudinal section c. Transverse sec:tionFig 3--l00 (Enlarged xl. 4 in reproduction) Alloy 7075 plate, etched 0.5 pet HF
FIGUBE 62
174
tolmhg direction
'.'.,.° .. 'b t ; . . ' . '
• ,.
,, . •
·-
K-.4
4 I 3 I 4I3
Fig. 3. (111 pomle figures of 3003-H19 and 5052-H19 sheet.Densities of poles are in multiples of random concentration, R.
FIGURE 63
/. , 0 .1
L VC
Fig. 1. Orientation of the notch (crack) relativeto the plane of hot deformation: 1) notch (crack)parallel to the deformation plane (XOY); 2) notch(crack) normal to the deformation plane (XOY);OX = direction of rolling or pressing.
FIGURE 64
175
3003 - 9 m SS2 -nIS
M > 3R M > 2R < 3R O > I R < 2R
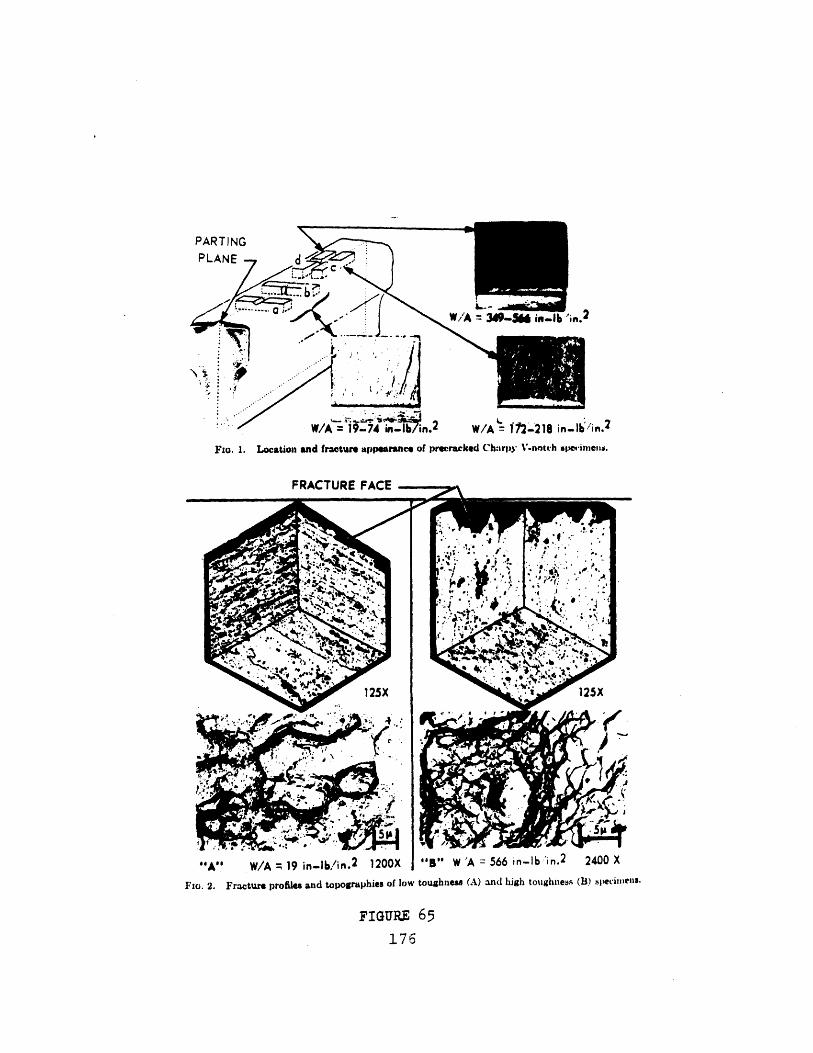
W,'A 349-51 ses.Jb 'in.2
*1
/IP - 17- 14 M-10/ in* W/ A - I .~4- Ig InlIo' in
F1o. 1. Location and fractre appearance of preeracked Ch:rp)y V.nntrh pe.inmens.
FIG. 2. Fracture profiles and topographies of low toughness (A) and high toughness (B) specimiens.
FIGURE 65
176
1
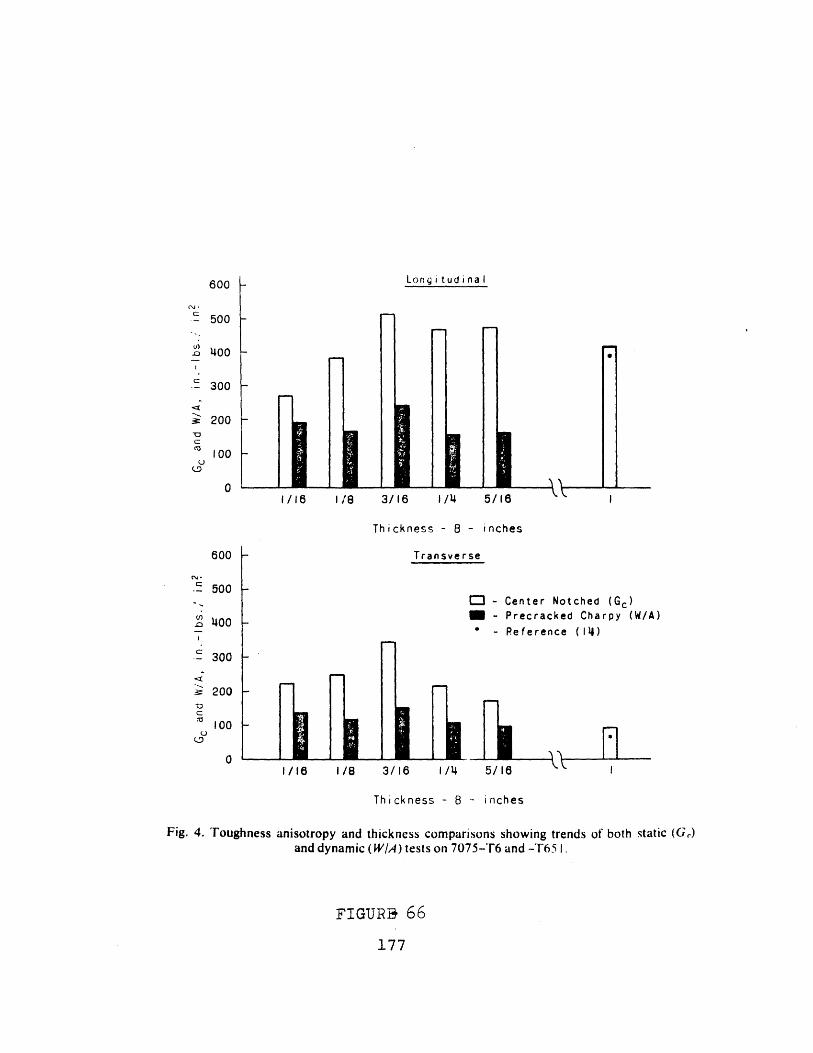
Thickness - 8 - inches
Transverse
"- - Center Notched (Gc )
- Precracked Charpy (W/A)
- Reference (14)
10
10
0
01/16 1/8 3/16 1/4 5/16
Thickness - 8 - inches
Fig. 4. 'roughness anisotropy and thickness comparisons showing trends of both static (G,)and dynamic (WI/A) tests on 7075-T6 and -T65 1.
FIGURi 66
177
600
500
400
300
200
'0
0 -
0
60
S50
S40
2CIC
c 30
UD
I/10 Iitj J/10 1/4 0/10

5052 5154 5183(5083)
5456 5556(5456)
- Comparable parent alloyin annealed temper
0 Comparable parent alloyin indicated temper
[ Filler alloy indicated
HTA - Heat treated and artificiallyaged after welding
A - Artificially aged after welding
-41100 2319 2319 4043 2319 4043
HTA A HTA
Filler alloy
7ig. 4-Ratings of aluminum alloy welds based upon unit propagation energy from tear tests
FIGURE 67
178
1400
1200
1000
800
600
400
200
| L• IL-.ý L Ld- 5- z L|- • i L- U YI -- iY L 'Y~ -'· -- YL-d. 6.%- "-4
F
E
E
r
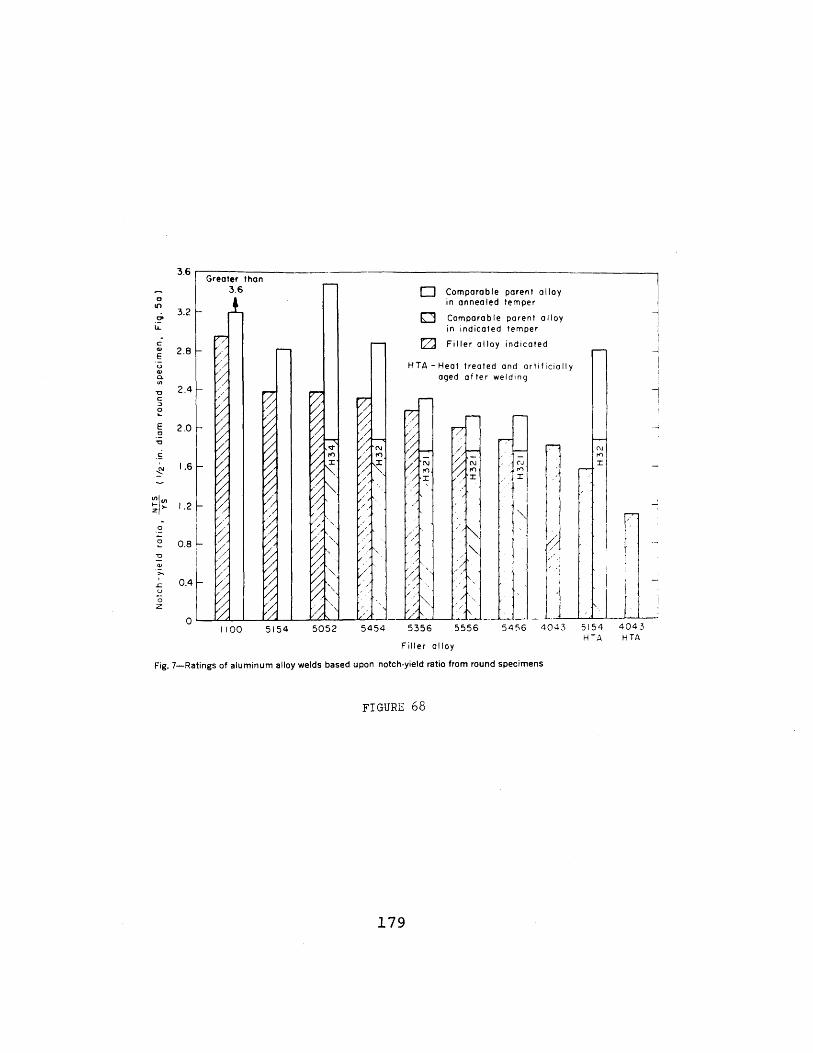
ble parent alloyed temper
ble parent alloyted temper
lay indicated
edr
1100 5154 5052 5454 5356 5556
Filler alloy
Fig. 7-Ratings of aluminum alloy welds based upon notch-yield ratio from round specimens
FIGURE 68
179
and artificiallyelding
I r'
5456 4043 5154 4043HTA HTA
~
--

Fig. 9 - Effect of Surface CrackDepth on Toughness in 6061Aluminum Sheet and Welds
kIGURE 69
CRACK DEPTH (INCHES)
FIGURE 70
180
I---zw
0-
tI
I-
41?
(WIIAI IIL*:ITII (in i

SAMO FOR WMUGHT
0 0
NOTE: OPEN SYMSOLS-wROUGHT- AS WELDEDSLASH SYMBOLS-WROUGHT - POST WELD
HEAT TREATEDSOLID SYMBOLSt-CASTING-AS WELDED
* SEE FIG.4 FOR SYMBOL ID0NTIFICATION
10 20 30 40 50 1JOINT YIELD STRENGTH, 1000 PSI
Fiu. S. Joint yield strennth ,'r. nnteci virIdO ratios for groove welds in wrought and
casting alloys at -452F.
FIGURE 71
5556 2319 4043Filler alloy
Fig. 8-Ratings of aluminum alloy welds based upon notch.yield ratio from sheet-type specimens
FIGURE 72
181
2.8
2.4
2.0
1.6
^^
-
-
1

2.0
0
a
Temperature. F
z ,
20
. 2.4
1 2
a
-400 -300 -200 -100 0 +100 -400 -300 -200 -100 0 +100
TEM9IRATURI, -F TEMPERATURI, *F
POST-WELD CAST-TO-CAST ONWROUGHT FILLEM THI1MAL CAST-TO-WVROWUT FILLER
SYMIOL ALLOY ALLOY TRATMENT STUC ALLOY COMUINATION ALLOY
0 2219- T2 2319 YES 0 A344-F/A344-F 4043a 2219- T951 2319 NO U A344-F/601l-TS 4043O 3003-11112 1100 NO * A344-PS/456-m43ti 5556A 503-0 5183 NO A 354-TS2/3S4-TU 4043A 5003- 1321 5163 No A 354- T2U/601- T 4043o 5003-M1121 SSS3 NO 354- T105435-Hl3g 55560 5003-H121 555 NO 0 C355-TSI/60sI- TO 40439 5454-132 5554 NO V C355-TSI/5456-0321I 3550O 01 - TO 4043 N0ANO A YES *0 4011 - T 5 3511 No ANO YES *
4 SLASH SYMMOLS
Fig. 4. Notch yield ratio vs. temperature for groove welds in wrought and castingalloys at R.T., - 112*, - 320*, and - 452°F.
FIGURE 73
182
0. w.Su I j amoI r
t1I.-Z ,. I0

C'IIAt'K lIZE : i.utr 041 IN. lE)VI it. a ;n IN. I1jfs;
I I I I I I I I .
- j * .m.' . .•S
A WK•D IAIIAI.I.KI. l'
I I II I I I I IA II C II E F ( II
C'tAC K LA•.ATION IN I001 TO Al W rIJmIN'
F ig. 11 - Fracture Toughn ess in an A.C.TIG Weld, "Cast" Into Backup Groove
,,--" DISrSTA XCE F.Ic. 1` M WII f' ,:lt . l:
S EI- 1.) "I .".' *
0"
.I A i"MISPE:N0 ftII' l V1 1SINVI V PASS ."no in.
AC Tit;
('C ACK SIZ: .n020-0. 642 IN lF:P;: n. n n r.5 IN. I)Nc;
0 O O
0 WF.I) PAIAI.LLL TOROIIJN.; DIll ICTION
O W•I.l) PEKPENI)ICIt.AltT(o IOf.LlNG; DlIIE(" I)N
-L - - -I I
A B CD E F (i If
CRACK lOCATION IN linnl-7a Al WPI.I,)MEN1T
Fig. 12 -Fracture Toughness in an A.C.TIG Weld, "Suspended Bead"
FIGURE 74
183
7

Fig. 14 - Effect of Surface CrackDepth on Calculated KIc in One-and Two-Pass Manual Repair Welds
- ALL WELDS POT-WELD TREATEDTO - T6 CONDITION
0- A PRLMARY WELD
a PASS MANUALREPAIR. DCSP
S3 PA DCSMANUALREPAIR, DCSP- I I I I I
0 0.01 0.02 0.03 0.04 0.05 0.06 0.07 0.06 0.09 0 .10
CRACK DEPTH AT 6061-T6 At WELD CENTER (mn.)
Fig. 15 - Effect of Surface CrackDepth on Calculated Klc in One-Pass Manual or Automatic TIGRepair Welds
U i . 0 1 11( 111 11"1 UO W. .: U-. u . 1 , 9 U 10
I RAIK l.1,111 AI I lAm.I I-. At -ý1ý6El i I.M I C I
FIG.URE 75
184
uf.
6
I I I I I I IALl. WEI. I)•D ISIO 'W.I ) 'IWIHEATE: L '1" -'1'• ('t)NI)III() N
v v 0 V PHIIIMA|RY %F.I
-) (9 U It ,..5 MANV' .
g 8 , 13 I AR l II A I
CY 1111

70
60
50
40
30
20
10
030 40 50 60 70TENSILE YIELD STRENGTH, 1000 PSI
FIGURE 76185
20

APPENDIX C

List of Tables
Table
7
7
48
Data Source
12
13
17
25
27
28
7
7
36
35
44
25
25
25
25
45
47
47
304
306
354
187
Page of Data Source
191
833
268
64
491
607
80
112&113
299
11
5
68
68
69
70
1524
474
475
476
8
9
10
12
13
14
15
16
17
18
19
20
21
22

Page of Data Source
23
24
25
26
27
28
29
30
31
32
33
34
35
28
28
28
3
53
55
57
60
8
4
65
609
607
607
43
466
492
566
280
905
323-S
323-S
325-S
74&75
321-S
457-S
471
326-S
662-663
467-S
646
96&97
401-S
77
62
66
38
39
40
41
42
43
44
67
62
54
68
69
65
188
Table Data Source

Table 2-Description of Notched Tensile Specimens and Results of Tests
Width or
Width orDiameter, In.
Specimen Type Gross Net
Round 1 0
0
1
0Sheet; edged notche*d
1
3
Sheet; surfare notched 0
Thickness,In.
Notch-TipRadius,
in.
.375 0.353 ... 0 00050.00150.004
.500 0.353 ... 0.00070.00150 0030.010
.060 0.750 ... 0.00050.00150.0030.0100.0306
.500 0.250 0.063 0.0010.00150.0050.031
.000 0.700 0.125 0.0010.00150.0030.033
.000 2.000 0.063 0.00050.0050.0320. 106
0.250 0.0C0050.0050.0100.0120.106
.500 0.031* 0.063 0.00050005
TheoreticalStress-Concen-trationFactor
1064.2
139.16.93.9
>2013105.53.3
1210.26.02.8
17.514.410.03.7
>3013.75.83.5
>3013.710.05.83.5
2.5.
Notch-Tenilfe Strength, psi
1 2 3
74 90074 50076 200
72 50076 700
84 400
'0 70052 90056 40070 20083 (M'
63 70064 20068 30075 80048 00049 90056 50071 800
38 70044 /00)53 30070 900
35 30035 20043 90065 10072 600
92 800100 000
75 40074 30075 200
73 90078 50077 40085 600
50 30049 700)51 10074 30078 100
62 50067 200
73 000
51 50050 500•51 20069 70043 10043 (0055 80068 800
34 40034 70041 40057 300
89 60096 000
* Net thickncss.
Table 3-Summary of Results of Tension Tests of Notched Specimens of Various Designs
Specimen Theoretlcal Stress-Concentration Factor, K,
Type Dimensions, In. 3.4 54 9-10 12-14
Round ........ ............ .............. ... 0.375 did 76 000 74 700 75 200 .0. 500 diu 85 400 76 800 77 100 73 3001.060 dia 81 700 72 800 58 400 51 400
Sheet-type; Edge notched ............................. '/3 by 0.063 ... 69 400 65 900 63 100I by 0. 125 70 700 54 300 49 6003 by 0.063 70 000 56 10' ) 44 8003 by 0.250 73 900 61 600 43 200 35 000
Shect-type; surface notched......................... 'I/ by 0.063 91 700 ...
Range, psi 21 700 20 700 33 900 38 350
Range, tnsik )icld strcngth +8 to +40 -14 to + 1 -34 to + 18 -46 to + 12
TABLI.: 1
189
Average
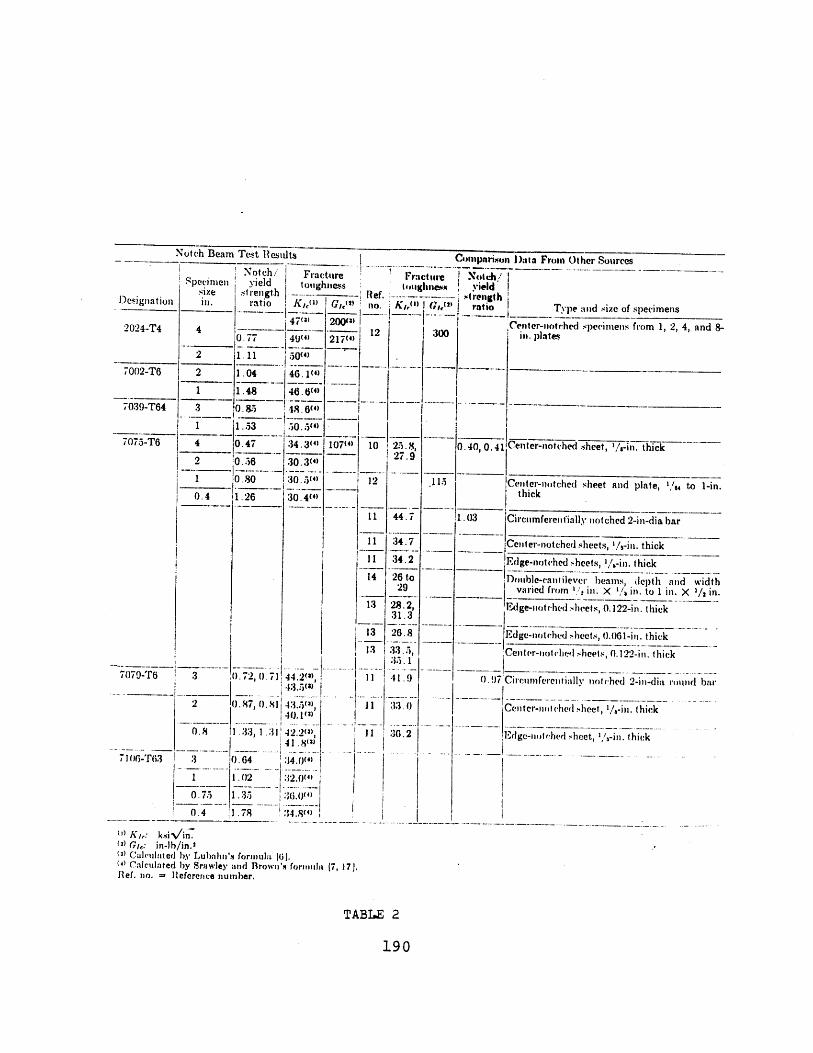
Notch Beam Test •Besults Comparison D):aa From Other SourcesI ......... " ...... ... ...
N otch/ Facture Fracture Notch ISpecimen iehld ltoghness 1t1ghIe)sM yield Isize Sriiength nor t.esignation ill. rati i K t
2024-T4 4 ----.0 77 4UJM7•.-: T ti------ -I;2 1011 504)
7002-T6 2 1.04 46.1
1 1.48 46. 60'7039-T64 3 .85 41 9.6
1 1.53 50.5")
7075-T6 4 0.47 34.3
2 0.56 !30.3(4)
1 0.80 I 30.5( )
0.4 1. 26 30.4(,)
070-T6 3 0.72, 71 44 ,
2 0.87, 0.8 43.50)l,
0.8 1 -13, 1 2.2i710l-T63 3 0.64 :14.04)
1 1.02 :12.0(4)
200(a)'
217( 12
107(4) 10
12
11
111
.1
14
13
13
13
11
11
11
0. 75 1.350.4 1.78 4.
(o Ko,: k.til/in.b) GO: in-lb/in.)() Ca'ultlnteud by Lubahn 's formula 161.() Cnalculated by Srawley and Brown's forimula (7, 17J.Ilef. no. = ]eference number.
TA
N ,uniTldGi,(11 i z) no. K I( (",( 2) ratio Type and size of specimens- ·- -- Type andsi-.e ofspecimen
S'Center-notched specimens from 1, 2, 4, and 8-300 in. plates
25 .8,27.9
44.7
34.7
34.2
26 to29
28.2,31.3
26.8
13.5,
41.9
:33.0
36.2
.115
i~ ---~-!------ -- - -------------
0.40, 0.41 Center-notched sheet, /-3 n. thick
Ceinter-notched sheet and plate, '/A, to 1i-in.thick
1.03 Circumfere,,ially niotched 2-in-dia bar
Center-notched sheets, 1/S-in. thick
Edge-notched sheets, '/6-in. thick
Doluble-cantilever beams, depth and widthvaried from '~2 il. X '/S in. to 1 in. X '/, in.
Edge-motched sheets, 0.122-in, thick
Edge-notched sheets, 0.061-in, thick
Center-i•tched sheets, 0.122-in. thick
0. .7: CircnmFleretiali notc:hed 2-itn-dia rmlldri ba:
Center-nt ched sheet, '/A-in. thick
,dgc-niiohed sheet, 1/)-in. thick
B IE 2
190
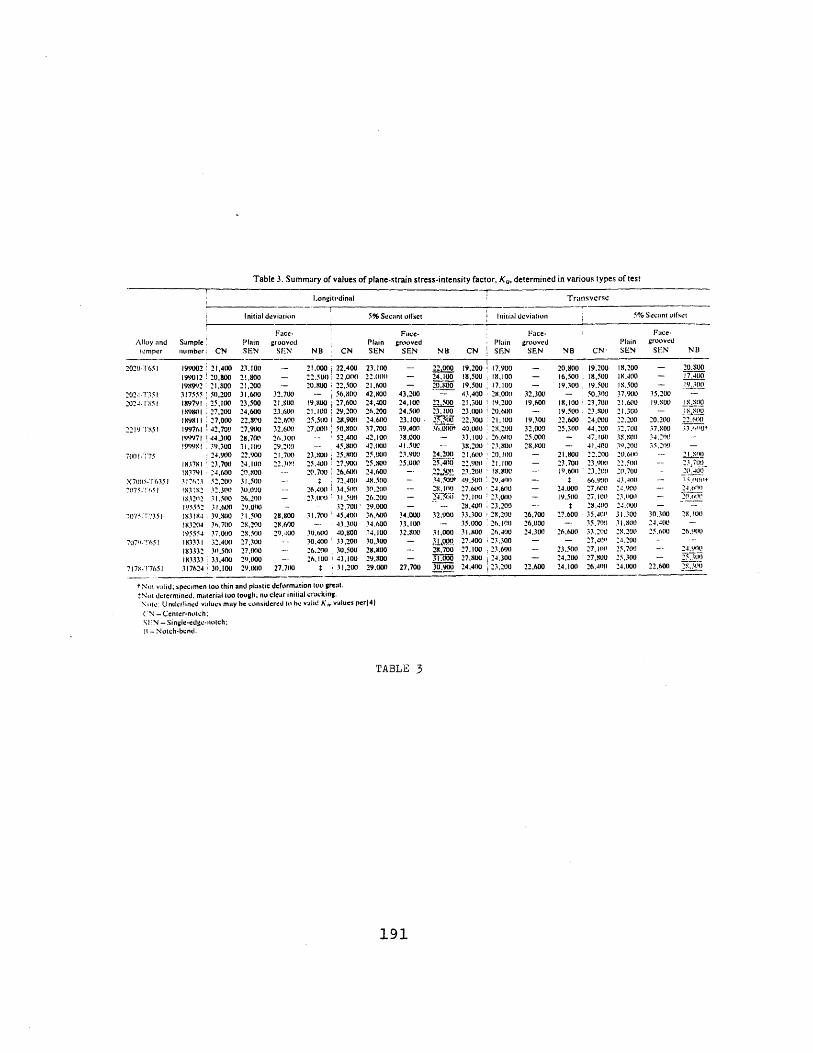
Table 3. Summary of values of plane-strain stress-intensity factor, K,, determined in various types of test
Longitudinal Transvcrse
Initial deviation 5%Secant oll'set Initial deviation 5% Secant ollffset
Face- Face- Face- Face-Alloy and Sample Plain grooved Plain grooved Plain grooved Plain grooved
ermper numberi CN SEN SEN NB CN SEN SEN NB CN SEN SEN NB CN- SEN SEN NB
2020- 1651 199002 21.400 23.100 - 21.000 22.400 23.100 - 22.000 19.200 17.900 - 20.800 19.200 18.200 - 20.S00199012 20.800 21.8001959P2 21.500 21.200
2024-T351 317555 :50,200 31.600K2024-T1s51 189791 :25.100 23.500
1898011 , 27.2100 24,600189811 27.000 22.1S'0
2219 T.s51 1997.1 42.700 27,9010199)71 .44.300 28.701'
M9991! 79.300 31,10 J700T1.75 24.9010 22.900
183781 23.700 24.1110181791 24 .600 20.8010
X70015-T6351 317623 52.200 31.,50017075-T!. 18302 32.300) 311.000
183202 31.500 26.2100195552 31.600 29.0)00
7175-'.7351 1831814 39.1800 ?1.5110183204 36,71700 28.2100195554 37.000 2..500
7079-'!651 183331 32.4(K) 27.300183332 30.500 27.0t10183333 i 33.400 29,000
7178.-!7651 317624 I 30,100 29.000
22.5010 2200010 22.010020.800 22.500 21,600
- 56.800 42.80019.800 27.600 24.40021.1001 29.201 26,20025.500 I ,900 24.610027.1)(1 50.800 37.700
52,400 42.10045,81)10 42.000
23.1 00 25.8X00 25.00025.400 27.90X 25..01)20.700 26.600 24.600
1 72.4011 48.500126.400 34..510 310.200t123.1)0 31,.5)1 26.200
32.700) 29.00031.7(00 45,400 36.600
43.300 34.600370.600 40.800 34.10030,400 33.200 30.30026.202) 30.500 28L.X0026 .100 43.100 29.800
I 31.200 29.000
43.20024.10024.518)23.10039.40038.00041.5.0023.90025.00(1(
34.00033,10032.800
27,700
24.100 18,500 M1.10020.800 19.500 17.1 00
S 4,3.400 28.001)S 21.300 19200
23.100 23.000 20.6(M003iu' 22,.300oo 21.100
3(.0l(lt 40.000 20.200- 33.100 26.60)0. 38.21100 23,80
24.200 21.6150 20.10025.4(lo 22.90) 21.1002•1.• 23.200 1•..00o34.50•tY 49.500 29.410028.1110 27.64.) 24.6001247.iu 27.100 23.000
S 28.400 23..20032.900 33.300 24.2100
.- 35.000 26.10 131,000 31.600 26.4003l !)00 27.400 23.30028.700 27.100 23.6003I.000 27.800 24,30030.900 24.400 23.200
32.30(119.600
19,30032,00025.00028.800
-.
26.70026,00024.3001
22.600
16.500 18.500 18.40019.300 19.500 18.500
- 50.300 37,901118.100 23.700 21.60019.5010 23.NOt 21.30022.600 24.000 22.2(0025.300( 44.200 32.700
- 47.1 01. 32.800- 41.400 1.21200
21.800 22.21)0 20.6•1)23.700 23,900 22.5o00lO.6(4) 23.210 20.700
t 66.90.) 43.40024.000 27.1,1 2.'.90019.50011 27.1)0 23.1t00
: 28.4100 24.00027.600 35A.40' 31.300
- 35.7001 31.M)1126.60(0 33.2:00 25.20(
- 27.40 2-4.20023.500 27.100 25.7(Y.)24.200 27.800 25.300124.100 26.4110 24.)00
35.20019.501)
20.20037.40034.21d35.21y.)
30.31)0
24.400
22.600
17.J00
2I.Y. .110
22.6o0
210.401.0
24.61t)
28.100
26.900
1.1,90025.3))21.3t4)
tNot v:tlid; specimen too thin and plasltic deformation too great.*Not decermined. material too tough; n1o clcar initial cracking.Note: Underlined values may he considered to, he valid K,, values perl4)(N - Center-notch;SIN -Single-edge-notch;II - Notch-bend.
TABLE 3
191
32.70021.1100o23.60022.60032.610026.30029.200121.,7(K)22.3t11
-.
28.50028.60029.100
27.700--
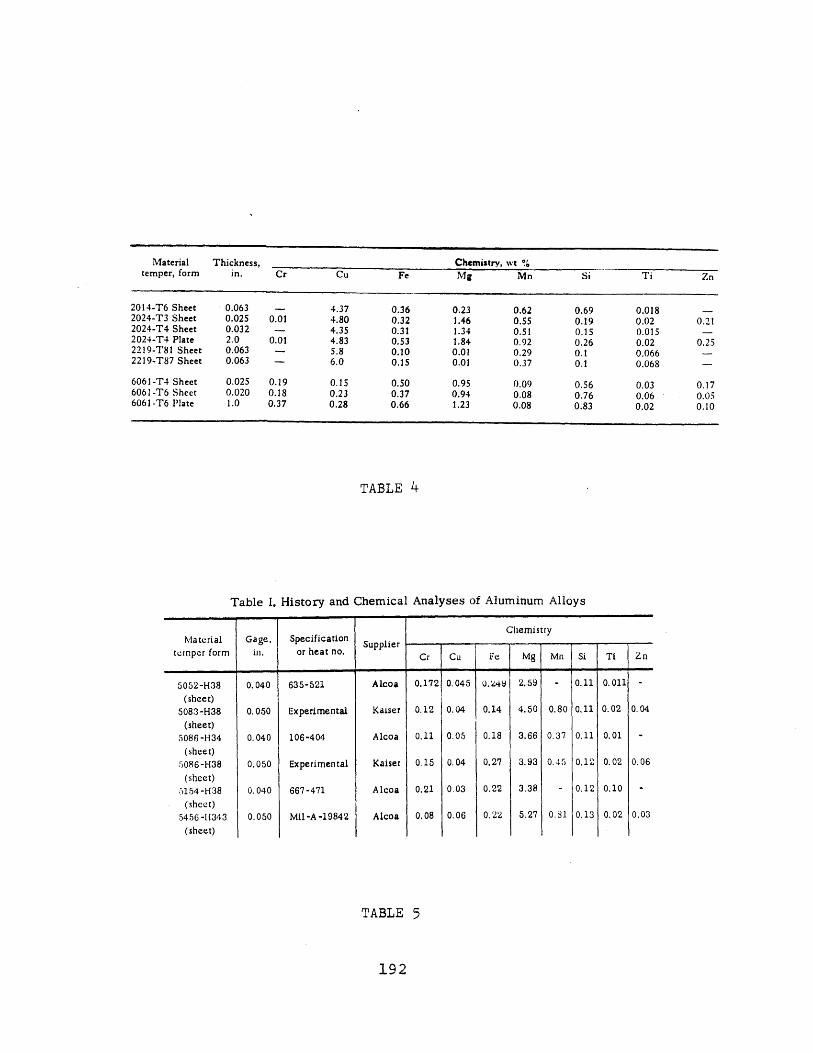
Material Thickness, Chemistry, wt %temper, form in. Cr Cu Fe Mg Mn Si Ti Zn
2014-T6 Sheet 0.063 - 4.37 0.36 0.23 0.62 0.69 0.018 -2024-T3 Sheet 0.025 0.01 4.80 0.32 1.46 0.55 0.19 0.02 0.212024-T4 Sheet 0.032 - 4.35 0.31 1.34 0.51 0.15 0.015 -2024-T4 Plate 2.0 0.01 4.83 0.53 1.84 0.92 0.26 0.02 0.252219-T81 Sheet 0.063 - 5.8 0.10 0.01 0.29 0.1 0.066 -2219-T87 Sheet 0.063 - 6.0 0.15 0.01 0.37 0.1 0.068 -
6061-T4 Sheet 0.025 0.19 0.15 0.50 0.95 0.09 0.56 0.03 0.176061-T6 Sheet 0.020 0.18 0.23 0.37 0.94 0.08 0.76 0.06 0.056061-T6 Plate 1.0 0.37 0.28 0.66 1.23 0.08 0.83 0.02 0.10
TABLE 4
Table I. History and Chemical Analyses of Aluminum Alloys
Materialtemper form
5052-H38(sheet)
5083-H38(sheet)
5086 -H34(sheet)
5086-H38
(sheet)5154 -H38
(sheet)5456 -11343
(sheet)
Gage,in.
0.040
0.050
0.040
0.050
0.040
0.050
Specificationor heat no.
635-521
Experimental
106-404
Experimental
667-471
Mil-A -19842
Supplier
Alcoa
Kaiser
Alcoa
Kaiser
Alcoa
Alcoa
Chemistry
Cr
0.172
0.12
0.11
0.15
0.21
0.08
Cu
0.045
0.04
0.05
0.04
.03
0.06
0. 249
0.14
0.18
0.27
0.22
0.22
Mg
2.59
4.50
3.66
3.93
3.38
5.27
Mn
0.80
0.37
0.45
0.81
Si
0.11
0.11
0.11
0.12
0.12
0.13
Ti
0.011
0.02
0.01
0.02
0.10
0.02
Zn
0.04
0.06
0.03
TABLE 5
192
---
Fe
I

Table I. Chemical Analyses and History of Materials
Material Temper Form Thickness, Har5dness Compositionin. 15-NL e superficial Cr Cu Fe Mn Si Ti Zn Mg
7075 T6 Sheet 0.025 63 0.23 1.47 0.32 0.04 0.15 .05 5.85 2.457079 T6 Sheet 0.080 62 0.14 0.67 - 0.18< 0.1 .056 3.70 4.267178 T6 Sheet 0.036 66 0.26 1.95 0.21 0.04 0.11 .02 6.6 3.0X7275 T6 Sheet 0.050 65 0.16 1.40< 0.1 0.04< 0.1 .035 5.95 2.947075 T6 Plate 2.5 62 0. I 1.43 0.25 0.04 0.14 .039 5.46 2.757079 T6 Billet 5.0 61 0.13 0.71 - 0.14 < 0.1 .060 3.30 4.15
TABLE 6
Table 1. Temper Designations for Strain-Hardened Alloys
Temper Description
F As-fabricated. No control over the amount of strain hardening; nomechanical property limits.
O Annealed, recrystallized. Temper with the lowest strength and great-est ductility.
H1 Strain hardened.H12, H14, H16, H18. The degree of strain hardening is indicated
by the second digit and varies from quarter-hard (H12) to full-hard (H18), which is produced with approximately 75% reduc-tion in area.
H19. An extra-hard temper for products with substantiallyhigher strengths and greater strain hardening than obtained withthe H18 temper.
H2 Strain hardened and partially annealed.H22, H24, H26, H28. Tempers ranging from quarter-hard to full-
hard obtained by partial annealing of cold worked materials withstrengths initially greater than desired.
H3 Strain hardened and stabilized.H32, H34, H36, H38. Tempers for age-softening aluminum-mag-
nesium alloys that are strain hardened and then heated at a lowtemperature to increase ductility and stabilize mechanical prop-erties.
H112 Strain hardened during fabrication. No special control over amountof strain hardening but requires mechanical testing and meetsminimum mechanical properties.
H321 Strain hardened during fabrication. Amount of strain hardening con-trolled during hot and cold working.
H323, Special strain hardened, corrosion-resistant tempers for aluminum-H343 magnesium alloys.
TABLE 7
193

The basic temper designations are as follows:
F As fabricated. Applies to wrought products that acquire sometemper from shaping processes in which no special control isexercised over the amount of strain hardening or thermaltreatment. For wrought products in this temper, there are nomechanical-property limits. Applies to castings in the as-castcondition if the alloy is also regularly produced in heattreated tempers.
O Annealed (wrought products only). Apyllies to the softest tem-per of wrought products.
W Solution heat treated. An unstable temper applicable only toalloys that age at room temperature after solution heat treat-ment. This designation is specific only when the period of nat-ural aging is indicated; for example: W(0.5 hr).
T Heat treated to produce stable tempers other than F or O. Ap-plies to wrought and cast products that are heat treated, withor without supplementary cold working to produce stabletempers.
The T is always followed by one or more digits. Numerals 1 through 10indicate specific sequences of treatments:
T1 Naturally aged to a substantially stable condition. Applies toproducts in which partial solution of alloying elements is pro-vided by elevated-temperature, rapid-cool fabrication.
T2 Annealed (cast products only). Designates a temp.r nroducedby a type of annealing treatment used to improve ductilityand increase dimensional stability of castings.
T3 Solution heat treated, cold worked, and naturally aged to asubstantially stable condition. Applies to products that arecold worked to improve strength, or in which the effect of coldwork associated with flattening or straightening is recognizedin applicable specifications. Different amounts of cold workare denoted by a second digit.
T4 Solution heat treated and naturally aged to a substantiallystable condition. Applies to products that are not cold workedafter solution heat treatment, or in which the effect of coldwork associated with flattening or straightening may not berecognized in applicable specifications.
T5 Artificially aged only. Applies to products that are artificiallyaged after an elevated-temperature, rapid-cool fabricationprocess, such as casting or extrusion, to improve strength and/or dimensional stability.
T6 Solution heat treated and artificially aged. Applies to productsnot cold worked after solution heat treatment, or in whichthe effect of cold work associated with flattening or straight-ening may not be recognized in applicable specifications.
T7 Solution heat treated and overaged. Applies to products thatare solution heat treated and artificially aged beyond thecondition of maximum strength, to provide controlled specialcharacteristics, such as dimensional stability, lower residualstresses, or improved resistance to corrosion.
TABLE 8
194
T8 Solution heat treated, cold worked, and artificially aged. Ap-plies to products that are cold worked to improve strength, orin which the effect of cold work associated with flattening orstraightening is recognized in applicable specifications. Dif-ferent amounts of cold work are denoted by a second digit.
'T'9 Solution heat treated, artificially aged, and cold worked. Ap-plies to products that are cold worked as a final operation, toimprove strength.
T10 Artificially aged and cold worked. Applies to products thatare artificially aged after an elevated-temperature, rapid-cool fabrication process, such as casting or extrusion, andthen cold worked to improve strength.
A period of natural aging may occur between the operations listed fortempers T3 through T10. Control of this period may be necessary to achievethe desired characteristics.
The following designations involving additional digits are assigned tostress-relieved tempers of wrought products:
Tx51 (a) Stress relieved by stretching. Applies to products that arestress relieved by stretching the following amounts after so-lution heat treatment: plate - 0.5 to 3% permanent set; rod,bar and shapes - 1 to 3% permanent set. This designation ap-plies directly to plate and rolled or cold finished rod and bar.These products receive no further straightening after stretch-ing. Additional digits are used in the designations for ex-truded.rod, bar, shapes and tube as follows: Tx510(a) appliesto products that receive no further straightening after stretch-ing; Tx511 (a) applies to products that receive minor straight-ening after stretching to comply with standard straightnesstolerances.
Tx52(a) Stress relieved by compressing. Applies to products that arestress relieved by compressing after solution heat treatment,to produce a nominal permanent set of 2.5%.
Tx53(a) Stress relieved by thermal treatment.
The following temper designations are assigned to some wrought prod-ucts that are heat treated by the user:
T42 Solution heat treated (b).T62 Solution heat treated and artificially aged (b).
(a) The letter x represents digits 3, 4, 6, or 8, whichever is applicable. (b) Ex-ceptions not conforming to these definitions are 4032-T62 and 6101-T62.
TABLE 8 CONT.
195

2219-T87 Plate 1 252314 L RT-112-320-423-452
2618-1651 Plate 1i 317406 L RT-18-112-320-452
3003-114 Rod 252570 L RT'-18-112-320-452
5083-0 Plat 1 Rcf. 6, 8 L RITA- 320A-423-4524:
5083-11321 I'late 1 Icf. ,, 8 L, RTA-320A-423-452+:
5454-0 l'tI 1 197127 L RT'-18-112-320-452
5454-1132 MPla 1 197133 1. RT-18-112-320-452
67,400 56,200 11.872,00( 59,900 12.083,500 67,000 14.098,600 72,400 15.297,500 73,200 15.098,100 75,100 15.562,400 57,600 10.865,900 60,500 10.068,200 62,500 10.778,000 68,700 13.387,600 72,300 15.022.900 21,100 16.824,000 21,900 15.025,300 22,300 18.536,600 25,900 32.558,100 30,100 32.046,800 20,400 19.563,000 23,000 34.085,200 25,200 32.080,800 25,800 32.048,600 34,100 15.066,100 39,700 31.590,000 41,800 30.085,800 40,500 29.035.800 16,700 24.537,200 16,600 26.538,200 16,800 29.554,300 19,400 39.573,900 24,100 34.340,900 28,900 15.742,200 28,800 19.543,700 29,200 23.061,100 34,500 32.082,300 39,400 28.6
82,300 1.2282,800 1.1591,500 1.09
102,500 1.04100,200 1.03
81,200 1.30
87,100 1.2892,000 1.1898,700 1.13
-
- -
65,100 1.1254,000 1.1661,000 0.9759,300 0.7062,300 0.77
61,100 1.2670,400 1.0672,800 0.8173,700 0.86
48,100 1.34
60,200 1.1165,600 0.8956,200 1.37
69,200 1.1377,700 0.94
Table I-continued overleaf
TABLE 9
196

Table V. Average Results of Tear Tests of Some Aluminum-Magnesium Alloys
at Room Temperature -320*F
Samplenumber Direction
171710 L.T
170115 LT
170118 L
Maximumload,
lb
12301240
1090108011151115
1300
132013451375
1425143515401560
12451220
17001605
13501350
16501580158515401810157514651450
Alloy andtmper
5154-0
5086-0
5454-0
5454-H34
5358-0
5356-H321
5083-0
5083-H113
5456-H321
5456-H321
Thicknuis,in.
0.750
0.375
0.500
0.375
0.500
0.375
0.500
0.750
0.750
0.375
0.375
0.375
0.500
0.375
0.750
0.375
0.500
0.750
Room temperature
Energy required to
Initiatea crack,in. -lb
5665
73888973
7076'7879
72724348
6662
6648
5456
4543424338385750
4442
424654484635
Propagatea crack.in. -Ib
138123
139120134117
107107120120
1111209285
148120
10566
11296
1128485818274
91
9882
9279
104837562
Totalnergy,in.-lb
194188
212197203190
177183198199
183192135113
214182
171110
166152
157127127124120112
l-II159141
142124
13412515813112197
Maximumload,
lb
15201500
1310125013451350
1800161516801660
1765170019551875
13701390
20551880
15651540
19001825185017951865177518551650
178017151965191819901810
-320'P
Energy required toInitiatea crack.in.-lb
10890
11297
101100
96108110108
103948173
8478
8652
8262
5957605757386
60
5249
524954
628242
Propagatea crack,in.-lb
202188
183157175160
190158199171
172154149127
190166
17098
148132
13310812797
11282
1271110121104
Totalenergy,Ln.-lb
308276
295252276286
2882866309279
275249220200
274244
258150
230194
192165197154169118
170
173153
0 11 162
91 140128 18292 144
114 17868 108
Chang• from room temperature value
Maximumload,
lb
+24+21
+20+16+21+21
+23
+22+24+21
+24+18+27+20
+10+14
+21+17
+16+14
+15+15+17+17+16+13+13+33
+12+13
+18+12+15
+16+18+17
SEnergy required toInitiatea crack,in. -lb
+89+38
+53+43+46+45
+37+42+41+37+43+31+88+52
+27+27
+31+14
+58+11
+30+31+43+33+50
-5-2
+20
+18+18
+24.70
.8+35+19
Propagate Totala crack, energy.in.-lb in. -lb
+47 +59+51 +41
+33 +39+22 +28+31 +36+37 +40
+78 +62+47 .+45+66 +56+43 +40
+55 +50+28 +30+62 +71+94 +77
+29 +28+39 +34
+62 +50+48 +36
+16 +38+37 +28
+18 +22+29 +30+49 +55+20 +24+36 +41+11 .6+24 i +15+21 +21
+23 +22+27 +23+19 +21+15 +12+23 +15+11 +11+51 +45
*6 +11
TABLE 9 CONT.
197
12901230
151515251710165017201550
LTL
T
L
TL.T
LT
LT
LT
LTLTLTL
T
170155
170156
170165
174303
167070
167059
167246
187245
170092
170093
170099
167058
170104
170105
167059
---------
I-- L---t q
-----

RESULTS OF TEAR TESTS OF SOME ALUMINUM-MAGNESIUM ALLOYS AT ROOM TEMPERATURE AND -320 F
__M_ __re_ _ e--n°F man F,.m 11m roemmAt.. von. %
m a k"geM 11.1 4e Propai gae q . 4 moero Im llf 1. . 0 selir d l m164w a Ube 2.0 CA _ ;2!11. Lod* * ,i M
51544112 Plain 0.10 e Le 1.335 50 97 147 1.740 93 198 291 +24 +86 +104 +9S 1.450 54 9 IS0 .755 5 0 :881 2178 +21 +61 +9I +85
S Plain 0.10 VWI L 1.230 5 138 194 1,520 106 202 I3011 +24 1+8 +46 +59T 1.240 65 123 188 .500 90 186 217 +21 +38 +51 +47
5350 Pults 4 PM 0.10 VI L 1.245 66 148 214 1.370 84 190 274 +10 +27 +28 +28T 1.220 62 0 18 1 1." 7 I1668 244 +14 +26 +38 +34
13321 Plate Plaie 020 Ve L 1.780 86 05 I11 2.055 06 170 25z +21 +30 +62 +50.1.605 45 55 112 1.30 52 91 IO +17 +13 +48 +34
S500 Plate % Pla 0.10 8v L 1.350 54 1 66$ I' m 82 148 230 +16 +52 +32 +39T 350 56 IS2 I.40 62 132 194 +14 +11 +38 +28
6H223 Plat 4 pU.N 0 0 Vee L 1.650 45 157 120 5 133 191 +15 i +29 + +29 +22T .m 44 1 L 18 I.75 $7 10 16S5 +15 +30 +28 +29
54560 PPIS "4 010 e L 1.290 44 • 147 1450 5 121 173 +12 + + +?2T 1.230 42 82 24 .390 49 104 153 +13 +17 +27 +23
4121 Put@ ) Piam 0.10 V 1. 1.120 46 is 1990 63 114 111 +16 +37 +52 +46
S.5mO ,d 62 1.110 4? 566 108 +ll +20 4 6 +-l
TABLE 10
" .able c2 - T.lar i2c ncitlle 1 u 20U-TG jh•ee + at Roolml 'I'nperature AtiLr Elevated iemlper:1ture Lxposure
L;': su · llr.'
2als2il. Yicld l.lolig
Temp. fiU, tag "trcn-th inof hr psi ;:;i 2 illn.
,uI2C
40u
401)
,0uo
.uu
u()
Oon
81.00 u77,712u:i ,uou
i 1)., l ),. ',,;W))
75,30U71,' 00
17. 1'707J.,,32)...o,llll
7.57.5o.39.09.5U11.
1l.u
Energy .e'quired to
Tear'I ear Strength Initiate Propagate
Strength. Yield a Crack, a Crack,
psi strength in.-lb i.-lb
51,500
5i; .100
.,7 .0 uu
54. J32)
U.550.750.86.1.021..
I .'8i
I ; I, c ..t . dii 2 lill... '100, h•W 'I t Illt'dt 11I1t
TABLE 11
198
Total
Elergy,
3
1920
3U
UnitPropagation
Energy,in.-lb/in."
351].SO200
3304:,0

Table III. Mechanical Properties of 2024-T3 Aluminum Alloy*
Test Prop)or- Notched Notched/temper- Elonga- tional Elastic T S. unnotchedature, Fhy. Fu, tion, linmit, modulus. (Ki 6.3), tensileCF I)irection ksi ksi ., ksi psi x 10' psi ratio
78 Longitudinal 47.4 67.9 18 37.5 10.2 60.2 0.8978 Transverse 43.9 65.8 18 31. 8 1(.3 62.9 0.96
-100 Longitudinal 48.9 70.2 21 39.8 10.5 61.2 0.87- 100 Transverse 44.5 67.8 21 35.4 10). 62.8 0.93
-320 Longitudinal 60.9 87.0 22 48.4 10.9 76.2 0.88-320 Transverse 56.1 83.4 22 43.2 11.0 74.7 0.90
-423 Longitudinal 73.1 110 17 67.5 11.4 88.8 0.81-423 Transverse 69.0 107 18 58.0 11.5 86.8 0.81
0.025-in. sheet. Aluminum Company of America, QQ-A-355.
TABLE 12
Table IV. Mechanical Properties of 2024-T4 Aluminum Alloy*
Test IPrpor- N--ched Notched/temper- F.lonas- tional Elastic T.S. unnotchedsturr. Fty, Ftu. tion. limlit, modulus, (K, - 6.3), tensileF' D)irection ksi ksi "- ksi psi x 10' psi ratio
78 I.xonitudinal 42.8 67.7 19 34.1 10.7 59.0 0.8778 Transverse 41.5 67.1 20 32.7 10.4 57.5 0.86
-100 .nnuitudinal 43.7 69.8 22 36.3 10.7 60.7 0.87-100 Transverse 42.7 68.0 24 35.4 10.7 58.9 0.87
- 320 L.n ,itudinal 54.1 84.9 27 44.3 11.2 71.9 0.85
-320 Transverse 53.6 81.8 19 43.4 11.0 68.2 (.83
-423. l.nngitudinal 73.3 107 16 59.9 11.6 88.3 0.83-423 Transverse 67.5 97.1 10 54.1 11.6 85.4 0.88
" 0.u32-in. sheet, Aluminum Company of America. QQ-A-355.
TABLE 13
199

Table VI. Mechanical Properties of 2219-T81 Aluminum Alloy*
Test Propor- Notched/ Weldtempera- Elonga- tional Elastic Notch T.S. unnotched Weldt clonga- Joint
ture, Fty, Ftu, tion, limit, modulus, (K, 6.3), tensile T.S., tion, efficiency,F Direction ksi . ksi % ksi psi x 10' ksi ratio ksi
78 Longitudinal 52.0 67.5 10 36.7 10.4 64.4 0.95 48.1 3 7178 Transverse 51.0 67.2 10 34.0 10.4 66.0 0.98 - - -
-100 Longitudinal 56.7 73.3 9 39.0 10.6 68.6 0.94 49.7 5 68-100 Transverse 54.7 72.3 10 38.4 10.4 67.0 0. 93- 320 Longitudinal 62.2 85.2 11 47.3 10.9 77.4 0.91 64.3 3 75-- 320 Transverse 61.4 84.6 12 47.8 10.S 76.1 0 90 -
-423 Longitudinal 70.6 102 15 56.4 11.5 93.4 0.92 72.4 2 71-423 Transverse 67.5 102 15 57.3 11.3 91.3 0.90
* 0.063-in. sheet, Aluminum Company of America.t Manually welded with 2319 aluminum filler metal, no post heat treatment, tested with bead in place.
TABLE 14
Table VII. Mechanical Properties of 2219-T87 Aluminum Alloy*
Test Propor- Notch Notched/ Weldtempera- Elonga- tional Elastic T.S. unnotched Weldt elonga- Joint
ture, Fty, Ftu, tion, limit, modulus, (K4 - 6.3), tensile T.S., tion, efticienc%OF Direction ksi ksi . ksi psi x 1 0 ' ksi ratio ksi
78 Longitudinal 58.2 70.7 9 42.5 10.5 69.7 0.99 51.1 2 7278 Transverse 58.6 71.1 9 41.6 10.4 69.7 0.98 - - -
-100 Longitudinal 62.4 76.4 9 43.7 10.8 74.6 0.98 49.5 4 65- 100 Transverse 62.8 76.4 9 - - 73.7 0.96 - - -
-320 Longitudinal 69.7 88.4 11 46.2 10.9 85.5 0.97 61.2 2 69-320 Transverse 70.4 89.4 11 45.2 10.8 83.7 0.94 - -
-423 I.ongitudinal 76.4 104 14 62.9 11.4 95.6 0.92 73.0 1 70-423 Transverse 7 .o 105 14 62.9 11.4 95.2 0.91 - -
* 0.063-in. sheet. Aluminum Company of America.t 'Manually welded with 2319 aluminum filler metal, no post heat treatment, tested with head in place.
TABLE 15
200

Standard Rolled Plate
Thickness.k ra c h
Orientalion ILenglh KQ a 11 ( Nand Spec. No. B IBN Width ksi v+ ksi o, (
RW-I 0.308 0.241 0.525 37.1 70.5 0.265 0.90*RW-2 0.310 0.240 0.525 34.1) 70.5 0.235 1.02RW-3 0.309 0.243 0.520 38.0 70.5 0.278 0.6')TW. 1 0.311 0.238 0.520 27.4 64.7 0.178 1.33TW.2 0.312 0.23) 0.525 25.7 64.7 0.156 1.53TW.3 0.311 0.239 0.525 24.3 64.7 0.140 1.71TR.I 0.311 0.245 0.511 18.20 64.7 0.078 3.140TR-2 0.311 0.245 0.511 15.80 64.7 0.059 4.16*TR-3 0.310 0.245 0.511 17.50 64.7 0.072 3.410
Prelorpd and Rolled Plate
Growth Rale
'last ic Zone da/dNRadius.r = Applied K
I. pu i. perI 2n (Klo / % 'r ksi \/I. cytlc
0.042 5.7 7.350.037 t.4 II .0 8.90.044 4.4 14.7 15.70.02M X.4 7.35 1.x20.024 ().(, 1 .0 8.X0.022 10.7 14.7 15.60.012 19.7 7.35 23000)9 26r. 11.0 10. 10.011 21.2 14.7 2,.4
Test specimens fatigued am of plane of notch.
RW-3 0.307 0.247 0.511 37.4 74.6 0.244 0.50 0.038 .3 14.7TW.I 0.307 0.245 0.503 11.5 67.8 0.075 3.27 0.012 20.4 7 .35TW.2 0.308 0.243 0.483 23.1 67.1t 0.116 2.10 0.018 13.2 11.0TW-3 0.307 0.245 0.483 21.5 67.8 0.122 2.42 0.016 15.2 14 7TR-I 0.307 0.240 0.511 20.10 67.8 0.088 2.73 11.014 17.0 7 .. 5TR-2 0.310 0.245 0.511 20.00 67.8 0.092 2.,7 (1.014 16.cr, I i.TR-3 0.309 0.245 0.520 19.9* 67.8 0.0186 2.850 0.013 17.) 14 7
'Candidale values of KIr Based cm 2 pet crack extension (ASTM.E24 recommended practice) *considerea valid l,. vhle if rcquirelnti inbThese values should he gealer Ihall 2.5 for a valid KIl value (ASTM•1-24 recommended practice)CMeasured over only first 0.3 ill. of prowtlhdAverage of 2 tests.
15 1
L.)14.2520.4
TABLE 16
201
7.35I' ll

Table I. Nominal Compositions of CastingTemperatures
Alloys Tested at Subzero
'l'empcrs 'Tested*
Nominal composition, element, " Permanent- Premium-Sand mold strength
Alloy Si Cu Mg Ni Zn Other cast cast castt
108 3.0 4.0 - - - - F - -A140 - 8.0 6.0 0.5 - 0.50 Mn F -
142 - 4.0 1.5 2.0 - - T77 -195 0.8 4.5 - - - - T6 - -
B218 - - 7.0 - - - F - -220 - - 10.0 - - - T4 -
X335 8.0 0.5 0.50 - - 1.0 Pb, 1.0 Bi T6 T61 -A344 7.0 - - - - - - -
354 9.0 1.8 0.50 - - - - 62C355 5.0 1.3 0.50 - - - - - T61
356 70 - 0.0 - - - T4, T6, T7, T6, T7 -T71
A356 7.0 - 0.30 - T7 -T61, T62, 1611T7
A357 7.0 - 0.50 - - 0.05 Be - '-61, T62359 9.0 - 0.60 - - - T62
A612 - 0.50 0.7 - 6.5 - F - -
* For definition of tempers, refer to ASTM Specifications 1126-65 and B108-65, ASTM Standards,Part 6 (October 1965).
t The term "premium-strength cast" is used to identify castings produced by controlled foundrypractices which provide higher properties than are usually obtained by conventional practices.
Note: Fe restricted to 0.2% maximum in alloys A344, 354, C355, A356, A357 and 359.
TABLE 17
202

Table II. Results of Tensile Tests of Smooth and Notched Specimens fromAluminum Alloy Sand Castings at Room and Subzero Temperatures
Alloy T'nsih'l:11n Tcnempra- strength,
t'IIpv r tur'e, "F p i
1RT 25,000(-112 26,200-- 32( 30,650
A 140-F WRTI 33,800-112 32,8(00- 320 36,800(?
Yieldstrecngth,
psi
18,5(1121,7(0030,250(
26,00(022,7(0032,400
Elong-ation
in 41),%f,
Reduc-tion
of area,n/0
Notch-tensile
strength,psi
NTS NTS
T'IS YS
25,200 1.0121,600 0.8221,700 0.71
29,90019,400(17,400(
0.88 1.15-0(.58 0.75- 0.47 0.54
142-T77 It' 29,801 20,400 2.1-112 32,800t 22,7100 t-320 32,800l1 26,0800 t
195-T'16 I'i 42,(00)-- 112 45,500)-320 53,700)
11218-F I T 41,200-112 41,6(10-320 37,3001-423 30,800(
27, 10032,00039,900
21,200122,30.1025,50028, 100
6.46.05.0
12.')10.03.70(.8
220-T4 IRT 34,200 31 ,f,( 2.1-112 41,611) 37,400 1.3- 320 39,600 Y(39,000 ( 0.7
29,000 0.9726,600 (0.8127,700 0.84
43,50058,000(
58,000
43,800(42,40035,50020,000
1.041.081.08
1.060.950.65
38,400 1.1227,900 0.7927,200 0.69
X335-T6 IT 37,300(-112 42,300-320 51,600
356-T4 RT 31,100 19,800 4.4- 112 36,6(H) 23,400 4.4-- 32(1 40,8(X) 27,200 2.7
356-'1'6 RT 38,600-112 43,100-320 47,500
356-T7 RT 37,800-112 41,400-320 45,100
32,600(35,800(39,200
33,70034,410038,800(
2.22.72.7
1.62.01.3*
356-T71 RT 28,800 20,200 5.0-112 32,200 22,200 4.4- 320 37,400 25,300 3.0
A356-T7 RT 37,100-112 40,001)-320 45,600
A612-F RT' 43,100(-112 45,500- 320 53,200
30,50031,70035,2(X)
34,800(41 ,000()49,0(X)
31,600 1.0237,600 1.0442,200 1.04
37,400 0.9740,000 0.9344,000 0.93
34,50038,80043,100
0.910.940.96
32,000 1.1129,600 0.9234,400 0.92
44,900 1.2141,000 1.0244,000 0.96
45,50050,80051,000
1.051.120.96
* lroke outside middle thirdt lBroke in threadsSFailed before rvachinRl 0.2% offset
TABLE 18
203
108-IF 1.360 .72(0.72
1.421.171.03
1.601.451.45
2.001.901.390.70
1.220.880.6')
23,40027,41(0032,1(10
38,20043,00045,600
1.021.020.88
1.471.291.25
1.311.241.04

Table III.Results of Tensile Tests of Smooth and Notched Specimens from Aluminum Alloy Permanent-Mold Castings at Room and Subzero Temperatures
Elong- Reduc- Notch-Alloy Tensile Yield ation tion tensile NTS NTSand Tempera- strength, strength, in 41), of area, strength, -
temper ture, "F psi psi % % psi 'I'S 'TYS
X335-T61 RTI-112-320-423
A344-F RT'-112-320
354-T62 RT-112-3201-423
356-T6 RT-112-320
356-T7 RT-112-320
A356-T61 RT'-112-320
A356-'r62 RT'-112-320-423
A356-''7 RT-112-320
359-T62 RT'-112- 320(
04 800 28 400 8 5
40,100145,70054,000
23,20026,20037,60050,10054,40061,00060,20036,80042,00045,70028,400(32,60037,30039,400141,90049,400
40,9'0045,200148,60055,000(
28,210035,410042,700(4 ,.200(52,100(157,700
29,20031,00(035,8009,700
10,(0012,100(45,50045,60048,70056,100131,10034,100(36,500
21,40024,30025,6003(1,800(132, 60035, 80(1036,70(039,,60041,4(0045, 30(121,400125,8xl M28,5(0043,2100•17,300i4J,) 5(i(3
4.65.35.0
22.219.713.3
1.11.31.30.81.03.73.24.33.73.0
4.03.74.42.13.03.03.55.45.76.41.22.0111.6
Table IV. Results of Tensile Tests of Smooth and Notched Specimens from Alum-inum Alloy Premium-Strength Castings at Room and Subzero Temperatures*
Elong- Rlduc- Notch-
Alloy Tl'ensile Yield ation tiin trensilh N'S N,'I'arld 'Temperai- strenglth, srentlth, in 41), of aire;, strvunith,
timper tIrT, I psi pst ", ",, Tpi iS 'VS
C3 55-T61 RI 43,600(1 3,300 6.4 9 52,00 1.21 1.74- 112 48,400 33,200 7.5 8 50,600 1.17 1.70- 320 54,400 39,400 5.4 6 62,700 1.15 1.59
A 3 56-T61 RIT 41,600 30,200 8.8 10 51,400 1.23 1.70112 48,200 34,800 8.9 1() 55,200 1.15 1. )
- 320 51,700 38,000 4.0 4 50,800 1.15 L.-7A357-IT1 RT 51,200 40,000 6.2 8 562100 1.1( 1.41
-112 54,400 43,400 4.0 5 5%,2110 .1.8 3 .3- 3.120 61,50 47,000 4.0 4 5,.400 0 16 1.27
.\357-'62 RT 51,2(00 44,400 2.5 4 55,4011 1 ] 1 .2-112 5100 46,700 2.1 3 .;20, 1. (4 1. 8
-320 62.200 49,300 2.5 41 ').7001 'r 1 21
* Thl' I tcrim "plrcroiir i im-srilngthil cast" is used to identify c;Uastin gs prioduci d i ,' II1trI )l.I1, Iollildilpr:n •lies hiij ( , pt id i hiighl.r properties than are usially olita'icd hv iv iiniliiil ir;al(ic.
TABLE 19
204
47,20053,40058,3OO
2X,601030,400(32,00054,20053,200(56,400157,2(1043,00041,4(1045,00035,3100(37,200139,90047,8(()47,70052,6(10
46,20049, ,0057,)000(63,301036,9)0043,9100 )47,1(01)49,710049,800111149), 8100)
1.181.181.081.231.160.851.0180.!980.)920.95
1.170.980.981.241.141.107
1.211.141.071.131 .1(01.11)
1.151.311.241.1101.080. 950.810
1.621.721.63
2.953.042.641.191.171.161.021.381.211.231.651.531.56
1.551.461.47
1.26t .211.40()1.401.721.701.651.15
1.0)1
54 700 1 12 1 61
Table I. (ompositions of Commercial Non-Heat-Treatable WroughtAluminum Alloys
S .. - N.rninai Omrplmiltii , ion:, ... -Alloy Al Si Cu Mn M Cr Z1n ()I wr
Super-Purity and Pure Aluminum
1199 ...... 99.99I 180... 99.80..1060....... 99.60
C .... .99.45 .... . . 0.02 111145 . . 99.451100 ..... 99.00
AI-Mg Alloys - General-Purpose and Structural
5005 .. Rem ... 0.85050 ........ Rem ... 1.45052 ........ Rem .. 2.5 0.255056........ Rem 0.10 5.2 0.105082 ........ Rem i.1.5508:1........ Rem 0.8 4.45 0.105086 ....... Rem 0.45 4.0 0.105154 ...... Rem 13.5 0.255454 R....... Rem 0.8 2.75 0.105456 ........ Rem 0.8 5.25 0.10
Al-Mg Alloys - Finishing and Decorative
:1002........ Rem .. . 0.15 0.12 ...5051 ......... Rem 0.05 0.05 .5 ...5252........ Rem 0.1 0.1 2.55257 ........ Rem ... 0.4 ..5357........ Rem 0.30 1.0 ..5405 ........ Rem ... 0.755457 ........ Rem 0.1 0.3 1.015557 ........ Rem 0.1 0.2 0.6 .5657 ........ Rem 0.8 .
AI-Mn and Al-Mn-Mg Alloys
:100:1 ........ Rem 1.2:10041 ....... Rem .. 1.2 1.0 ..:100 ....... Rem . 1.2 0.15 ..:10 ..... em .... I0.9 0.55040 ......... Item ... .1 1.3 0.2
Miscellaneous Alloys
404:1 ........ Item 5.2540,15 .. ..... Iem 10.01.15 .. Rem 10.0 4.0 . .
1215 ..... Item 10.0 4.0 . .. 10.04343 I m........ l m 7.5.161-13 ...lItem 4.1 0.207072 ....... Item 1.07,172 Item .1.2 .. 1.68001 ........ Item . . 1.1 Ni, 0.6 e801)8... Item 1.0 .20.0 Sn8280 ........ Item 1.5 1.0 . . 0.5 Ni, 6.2 Snri
TABLE 20
205

Table 2. Compositions of Commercial Heat Treatable WroughtAluminum Alloys
-- -- -- Nominal composition, %i - .7-.---. -Alloy Al Si Cu Mn Mt Cr Zn ()0 her
Al-Cu Alloys2011...... Rem2025 ...... em2219 ...... Rem
2014 ...... Rem2017 .... Rem2024 ...... Rem2117.. .... Rem
2EC ......Rem6053 ...... Rem6061...... Rem6066...... Rem6070 ...... Rem6101 ...... Rem6151 ...... Rem6201 ...... Rem6262 ...... Rem6351 ...... Rem6951...... Rem
5.50.8 4.5
6.30.80.3
Al-Cu-Mg Alloys
0.5 Ph, 0.5 Bi
0.15 Zr, 0.1 V
4.4 0.8 0.54.0 0.50 0.504.5 0.6 1.52.5 ... 0.30
AI-Mg-Si Alloys-Structural
0.250.90.25
0.250.25
0.90.7
0.6
0.250.20
0.25
0.09 0.50 Pb, 0.50 Bi
Al-Mg-Si Alloys-Architectural and Decorative
6063 ...... Rem 0.4 ... ... 0.7 ...6463 Rem 0.4 ... ... 0.7 ...
Al-Zn-Mg and Al-Zn-Mg-Cu Alloys- High-Strength
7001 ...... Rem 2.1 . .0 0.30 7.47075 Rem .. 1.6 ... 2.5 0.:10 5.67076 . .. Rem .. 0.6 0.5 1.6 ... 7.57079 ... I..m .m 0.6 0.20 3.3 0.20 4.3X7080. Rem . 1.0 0.35 2.25 ... 6.07178 .. . m . 2.0 .. 2.7 0.30 6.8
AI-Zn-Mg and Al-Zn-Mg-(u Alloys-Special-Purpose
... 0.45 4.0 .. 2.1 0.15 Zr, 0.15 Ti1.I 0.13 .l.1. 0.141 Zr
... 0.25 2.8 0.20 4.0 .
Miscellaneous Heat Treatable Alloys
0.2 Cd, 1.12.0 Ni
1.0 Fl , 1.00.9 Ni
TABLE 2.1
206
503:9x5180X70057039
202) .....2218 . .2618 ...41032 .....
ItemRImRem
Rtem
ItemRe.mI6-m

* Liquid metal filtered in mould through woven glaas-cloth screen.t Detected by ultrhsonic inspection and micro-examination per I-ft length of plate.
: Ultrasonic inspection difticull owing to porosily.
TABLE 22
Table II. Mechanical Properties of 7075-T6 Aluminum Alloy (0.025 in. Sheet, Kaiser Aluminum Company,of America, QQ-A-283)*
Elongation,%
Proportionallimit, ksi
Elastic modulus,psi x 106
10.5
10.6
10.8
10.2
11.0
10.6
12.5
Notch t. s.(K t = 6.3), ksi
Notched/unnotchedtensile ratio
I.CC
1.00
0.99
0.97
0.78
0.78
0.73
0.70
*Data represent averages of a minimum of three tests in the longitudinal and two tests in the transverse directions.
TABLE 23
207
Testtemp., °F
Hardness,15-NDirection
Long.
Trans.
Long.
Trans.
Long.
Trans.
Long.
Trans.
70.4
69.4
76.2
74.1
86.5
81.8
100
96.6
tu'ksi
79.5
77.6
85.1
83.2
97.2
94.9
116
112
---------
i c

Table V. Mechanical Properties of X-7275-T6 Aluminum Alloy (0.050 in. Sheet, Kaiser Aluminum Company, Experimentally)*
Test temp..OF
+ 78
- 100
- 320
- 423
Direction
Long.
Trans.
Long.
Trans.
Long.
Trans.
Long.
Trans.
Hardness,15-N
Ftyksi Ftu'ksi
86.5
83.6
85.2
83.7
96.3
96.2
114
108
Elongation,/ o Proportionallimit, ksi
Elastic modulus,
psi x 106
* Data represent averages of a minimum of three tests in the longitudinal and two tests in the transverse directions.
TABLE 24
HardnessThickness, 15-N Fe
in. superficial Cr Cu Fe
0.025 63 0.23 1.47 0.32
0.080 62 0.14 0.67 -
0.036 66 0.26 1.95 0.21
0.050 65 0.16 1.40< 0.1
2.5 62 0.in 1.43 0.25
5.0 61 0.13 0.71 -
Composition
Mn
0.04
0.18<
0.04
0.04<
0.04
0.14<
Si
0.1
0.110.1
0.14
0.14
0.1
Ti Zn Mg SpecificationTi Zn Mg
.05 5.85 2.45 QQ-A-283
.056 3.70 4.26 Experimental
.02 6.6 3.0 Mil-A-9180A
.035 5.95 2.94 Experimental
.039 5.46 2.75 QQ-A-283
.060 3.30 4.15 0-01041
TABLE 25
208
Notch ts.
(K t = 6 .3), ksi
Notched/unnotchedtensile ratio
Material
7075
7079
7178
X7275
7075
7079
Temper
T6
T6
T6
T6
T6
T6
Form
Sheet
Sheet
Sheet
Sheet
Plate
Billet
Producer
Alcoa
Kaiser
Kaiser
Kaiser
Kaiser
Alcoa

Table 2. Data Illustrating Directionality of Fracture Toughness
Plane-strain fracture toughness,K,,, psi \ in.
Product L(RW) LT(WR) ST(TR)
5.in. plate 20.800 20,600 18,5001%-in. plate 27,000 22,300 14.8001%.-in. plate 27,000 23,900 16.20031/2 X 7/2.-in. extruded bar 30,900 20,800 19.0003'/2 x 712-in. extruded bar 22.700 15,600 14,000
TABLE 26
Table IV. Plane Strain Fracture Toughness of 2219 Aluminum Alloy
Specimen geometry,in.
D 2.0, d!
D -
TV -TV -WTV
5.0, d
6, B6, B6, B6, B1, B
1.4
= 3.5
= 20.125-- 2-
= 0.125
TV 1.5, B =-- 0.125TV -6, B -B 1
IV 1, B 0.5,a - 0.25
- 6, B . 0.6
6, B :- 1.25
(;rain direction
Longitudinal
l'ransverse
Short transverse
Longitudinal
Longitudinal
Transverse
Longitudinal
Longitudinal
Transverse
Longitudinal (LS)"
Transverse
Transverse
Transverse ('1'S)
TABLE 27
209
Alloy andtemper
2014-T6517G75-T6517079-T6517075-T65117178.T6511
1'Temper
-'1T81
- '87
i\Iaterial form
5.0-in. plate
0.125-in. sheet
1.0-in. plate
1.0-in. plate
1.25-in. plate
Specimentype
NR I
SC
SC
SC
SNBJ
SC
SC
Fracture/yieldstrength ratio
0.840.810.850.820.680.650.640.600.630.630.510.521.251.211.210.870.940.890.71)0.72
Temperature.F
70-320
70-320
70-320
70-320
70-320
70-320
70-110-320-423
70-320
70-320
70-110-320-423
70-320
70-320
70-110-320-423
Fracturetoughness, K.,
10J psi n.
25.949.154.940.044.533.832.339.842.133.837.635.037.928.728.632.937.3

Table IV. Notch-Ultimate Strength and Notch-Yieldratios for AZ5G Alloy T6 Sheet (transverse and
longitudinal to rolling direction), Kt = 6.3
Temperature, Ultimate notch strength Ultimate notch strength°K Ultimate tensile strength Tensile yield strength
ratio ratio
T 1.01 1.19L 0.14 1.24
T 0.95 1.23L 0.98 1.29
T 0.85 1.23L 0.86 1.27
TABLE 28
TI'ABIE 1. Impact Strength of Parts Made from V05and VM65-1 Alloys as a Function of the Ilire timonin Which the Specimens were Cur Out and the Ori-entation of the Notch Relative to the Plane of Ioll-ing or Pressing
Angle be- an, kgf-/cmtween the [an,longitudi-nalaxisof Notc h par-Notch
Material ,ecen allel to normal to,nd the din deforma- deforma-
t ion planetion planerollin o ,spe imcn specimendeg 11, Fig. 1 2, Fig. 1
Pressedstrip 0 0.85 0.74V95 alloy 15 0.83 0.68
30 0.69 0.6645 0.64 0.60i60 0.50 0.56
75 0.37 0.4590* 0 40 0.420o 0 24 0.29
Pressed stri 0 0.81 0.64VM5-151 15 0.77 0.61
30 0.86 0.63alloy 45 0.84 0.63
60 0.80 0.6375 0.74 0.61W00 0.73 0.60901* 0.70 0.68
Rolled plate 0 0.88 0.8915 0.84 0.83
V95 alloy 30 0.78 0.7545 0.60 0.65f0o 0.56 0.5775 0.56 0.57S90* 0.47 0.53
Along the width.tAlong the thickness.
TABLE 29
210

Table 2. Fnergy and shear lip values of fracture tests on 7075-T6 and -T65 1 (Avg. 3 tests)
Center-slotted specimens Precracked charpy
Specimen Shear ShearThickness width G,, G, lip WIA lip
(in.) (in.) (in. lb/in) (in. Ib/in ) (%) (in. lb/in2) % )
L.ongitudinal
3 305"9 270 100 192 100
S 3 66 2769 88 380 73 166 52
4 3 85 431"9 112§ 515 100 241 40
" 9 11)07 468 24 155 28A 9 113 473 75 161 21It 20 83§ 416 Ot - -
Transverse
4 3 2929 222 100 137 50
A 3 62 1739 75 § 250 60 118 22
4 3 62 271'9 88 4 344 35 153 19
- 9 95 § 316 28 109 12A 9 83 § 172 27 98 10It 20 59 § 93 o0 - -
tSee reference[ (4].tEstimated from photograph in (141.§Apparent value - no fatigue crack.
TABLE 30
211
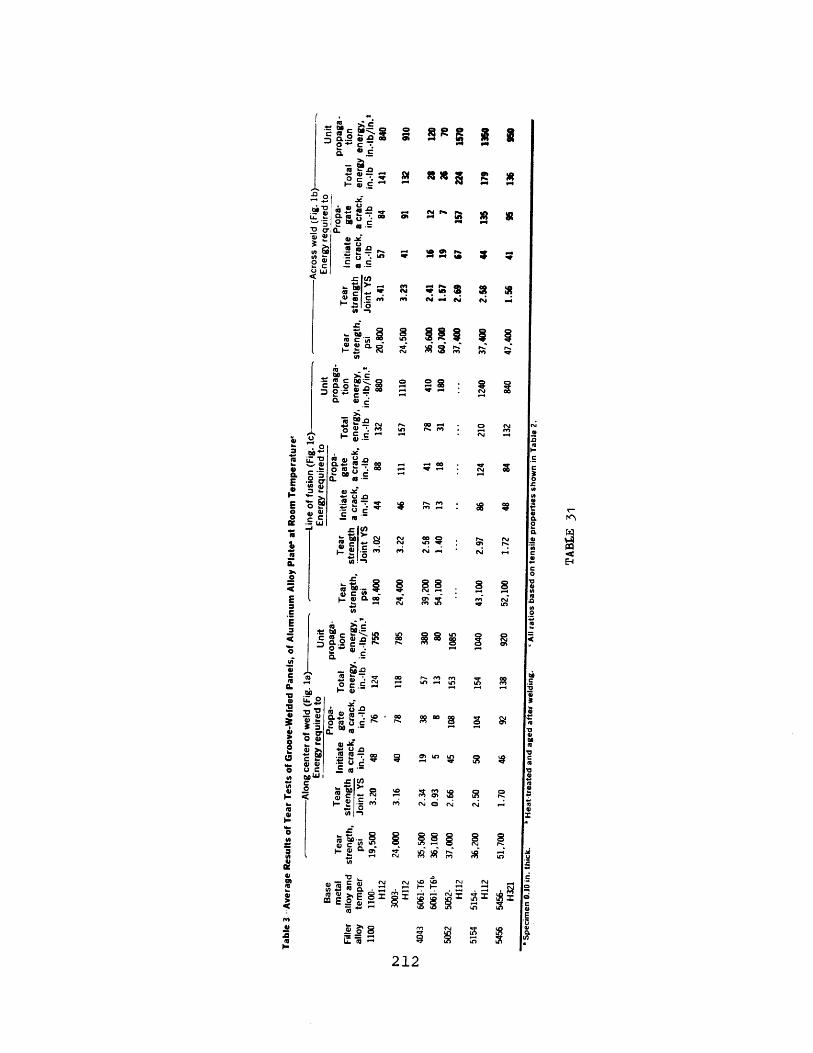
ti c to--g Sto C*
CL= 0.0 ab ~ W
0O C ~ r~. s.uQ.nni
00
iz . 0 a "t44 a
Ct
-A.e
t)O N PP
m * C tho %C- N -D
a,
I 4R C- 4 - N0 N
OC mjz -
06 CCAu LA. U 4
4 )'E *.0 -r(
0E 0a 0 E ia
-:
04 N4) r am o
E CLc cQ.2 11 oC
cl, o W C1CD L~ -4~ fLO N114)
IV CL kc C
06CP2 Aw u -- - -
c a=m0c . - A ftm S U9 r* L..O - 10. $u
g4 3 -~ 0A0
m V;4- C12
Aum t 4
44 -4 ruf,4, 44 I
a, , 8A N q
(U i 1 (' s ~ In AO(
212
0
E-43
I M
fia
I . r
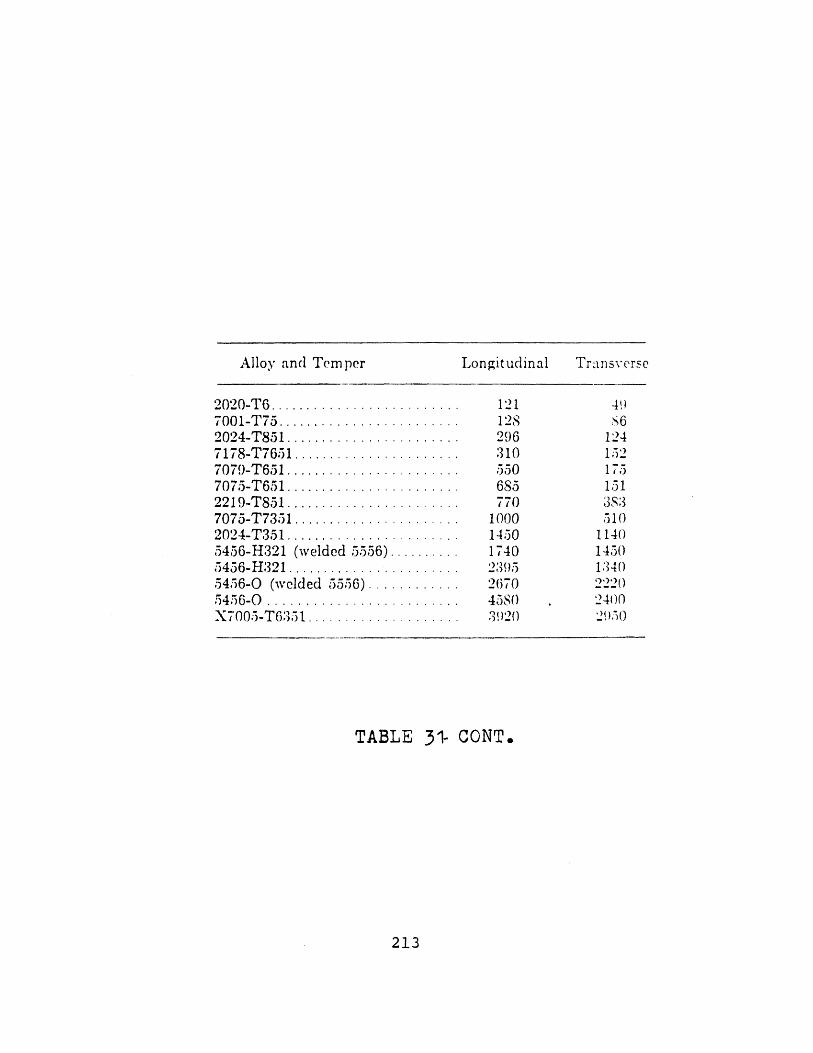
Alloy and Temper
2020-T6. ...............7001-T 75...... .........2024-T851..............7178-T7651. ... .......7079-T651.............7075-T651 ..............2219-TS51 ............7075-T7351..........2024-T351.............5456-H321 (welded 5556)5456-H321 ............5456-0 (wclded 5556) ...5456-0 ................X7005-T6:351..........
Longitudinal
121128296:310550685770
1000145017402395267045803920
Transverse
49S6
12415217515138351()
114()14501340222024002950
TABLE 31- CONT.
213

--
00).0) (0 U(
Q) m u C33 "" r.L-az 0(0r>4 M
Cj I cC co 0) CoC awC:m
ccnw >-
CD C) cn
00 000QIC,(0 0 0~OO~a C c; -'
M:r 00
(0 O CO Ca)CCL
>1 _
0. )W 0.
()0
ca0 (U(
I CL
P a~
I0 Co00ace,
W .00c7C0 CD
C (-
cc
CL cyý-zr c
V(0)l Cr 4V )~ C
-a-
(0) CLCD )
E- 2
o ooeCCo
04
0> 8
214
M b 7 (NJ - :0
CLo
Lo t-in t
a(0)-CC\( 00
a
I-o C j to~0)CLCN C'
cuc
(N CD m o C N D N CO CD0 mD CD (N CD CD 4=
CO f -: r- 00 Ln UDU-) -ý*. LOLo Lo u ul
- o O 000 D00C0D04 03 Co (N 04( Co U)4m CD 00 r- . Coo -4
n (Nl CD Com 4m 0N(M
co r- mo .- r-) 0-4 (N )(
(N tn 00 M m0m41 C O0
00 C'( CoO COrC' Co Co~
00- re) m - Comm (o mm 00re -:r Lr r fn zl r
0I (N o C=(D (N ( O
cli cl rC0
00S(N (y N O NTCO-. Co -ot n a
CoI-I-040
cli
(N t m ID •CoLn Ln 00 1- LL':) -4 C -( Co
LF U-) Lr- X-
m co 0 m Fn to to cc w
CD CD 00 -. 00
( D 0 (N -4 Q4- m r" O(N (Nm -q (N 1
Co (0000000
0 N CD (N CD C C= 4(- 00 (NO .1-T CD -fl, CD I- r- 00 r,
O, (N C( (. 0 - Co j
On CDC ( 0 Co (~
Mo a) 0~0 r- -:- C)'0 m (Dco n n = rO ýr c3 m ý
(j m r" CO N Mm - m
(N CDC=) m(
(U-
..oo
roc0
.'.C0c
or
-E4)
DCO04
10CýCD
a)
00
m
J

Table 5-Average Results of Tensile Tests of Notched Specimens"From Groove Welded Panels of Aluminum Alloy Plate at Room Temperature and -3200 Fe
Base metalFiller alloy andmetal temper1100 1100-H112
3003-H112
4043 6061-T6
6061-T61'
5052 5052-H112
5154 5052-H112
5154-H112
6061-T6
6061-T61,
5356 5086-H32
5456 5456-0
5554 5454-H32
5556 5083-H113
5456-H321
-Room Temperature- --Notch- Reduc- Notch-tensile tion of strength
strength, area, ratio,psi % NTS/TS
17,800 5 1.5322,700 6 1.41
27,500 3 1.0542,300 6 0.9832,800 5 1.13
32,100 4 1.1034,100 5 1.0533,800 3 1.3542,900 4 1.20
41,400 5 1.07
40,700 4 0.93
Notch-yieldratio,
NTS/TYS2.922.991.811.102.362.342.352.411.572.17
1.87
Notch-tensile
strength,psi
32,200
33,80047,90045,500
- 3200 FReduc- Notchtion of strength
area, ratio,% NTS/TS9 1.41
Notchyieldratio,
NTS/TYS4.03
- Ratio---NTS NYS
(-320) (-320)NTS(RT) NYR(RT)
1.81 1.38
0.87 1.86 1.230.90 1.02 1.13
0.99 2.79 1.33
45,700 6 1.00 2.76 1.42 1.18
43,000 6 0.88 2.54 1.26 1.08
48,400
48,500
0.92
0.85
39,300 5 1.16 2.30 52,800 7 0.97
42,000 5 1.02 1.97 55,800 3 0.93
45,200 5 1.01 2.01 52,400 3 0.89
2.38
1.95
2.35
2.26
2.00
Notched specimens per Fig. Is. K, 16b.Heat treated and sged after welding.All ratios based oni tensile properties shown in Table 2.
TABLE 33
215

Table II. Results of Tensile and Notch-Tensile Tests of Some Groove Welded Panels ofWrought Aluminum Alloys at Room and Subzero Temperatures
Joint Elong- Reduc- Joint Notch-Alloy Post-weld Tensile yield ation tion of effi- Location tensile RatiosProduct and Thickness, Filler thermal Temp., strength, strength,* in 4D, area, ciency,** of strength,ttemper in. alloy treatment OF psi psi % ' % failure§ psi NTS/TS NTS, JYS
Plate 2219-T62 1 2319 Yes RT 57,300 40,200 7.5-112 60,400 40,500 6.5-320 68,900 46,600 5.5-452 72,000 51,500 3.5
7 998 966 945 80
2219-T851 if 2319 No RT 32,700 26,800 2.0 5 50-112 40,800 25,000 4.0 15 57--320 51,700 28,000 3.5 10 62-452 59,600 40,200 2.5 10 62
3003-HI112 1 1100 No RT 16,100 7,600 24.0 67 100-112 19,300 8,300 26.5 66 100- 320 33,700 10,800 31.0 52 100-452 51,100 18,500 28.0 25 100
5083-0 1 5183 No RT 42,500 20,100 21.5 - 100-112 43,900 20,700 31.0 44 100- 320 58,200 22,400 19.0 20 99-452 55,300 25,200 27.0 37 69
5083-H321 1 5183 No RT 44,200 26,000 14.0 39 96-112 47,000 26,200 19.0 48 98-320 64,700 31,400 19.0 23 1100-452 66,100 35,700 9.0 14 80
1 5356 No RT 41,500 24,300 13.5 47 90- 112 43,900 27,000 14.5 52 91- 320 61,900 29,100 15.5 33 97-452 66,000 34,100 9.0 17 80
Plate 5083-H321
5454-1132
6061-T6
5556 No RT 44,400 25,600 14.0 36 97-112 46,300 26,700 18.5 46 96- 320 65,300 30,600 20.5 26 100-452 68,800 34,600 13.0 17 83
5554 No RT 33,900 17,100 18.0 42 85-112 36,000 17,400 22.0 47 86-320 54,700 22,500 29.0 29 93-452 61,400 26,100 14.5 -
4043 No RT 31,000 20,900 6.0 19 69-112 34,600 23,600 6.0 19 71- 320 44,000 25,800 5.5 12 75-452 49,100 37,600 4.5 9 63
Yes RT 43,300 35,900 11.0 44 96- 112 47,800 38,300 21.5 38 98-320 57,300 42,300 16.5 12 97-452 65,600 44,800 15.0 16 84
5356 No RT 32,700 22,600 8.0 31 73--112 37,100 24,700 9.0 36 76- 320 47,000 27,300 13.5 39 80-452 57,700 35,300 13.5 24 74
Yes RT 40,500 29,300 9.5 33 90-112 46,400 35,100 12.0 44 95- 320 57,100 33,900 20.0 29 97-452 69,100 44,500 19.0 24 89
C 63,700 1.11C 68,600 1.14C 74,800 1.09C 82,800 1.15
C 40,700 1.24C 48,300 1.18C 48,500 0.94C 52,700 0.88
C 22,700 1.41C - -C - -C 39,800 0.78
A 44,700 1.05C 49,900 1.14A 50.100 0.86B 53,900 0.98
C 54.500 1.23A 59.500 1.27A 62,400 0.96A 58,800 0.89
A 53,800 1.30A 57,300 1.31A 60,600 0.98C 57,700 0.87
A 53,700 1.21A 58,100 1.26A 60,500 0.93A 5/,900 0.84
A 39,300 1.16A - -A 52,800 0.97
47,900 0.78
C 34,000 1.10A 38,600 1.12A 39,600 0.90A 39,900 0.81
B 57,500 1.31B 61,500 1.27A 64,800 1.13A 67,200 1.02
A 46,900 1.44B 50,100 1.35B 54,100 1.15A 53,300 0.92
B - -A 57,800 1.25B 66,400 1.16A 60,800 0.88
*Offset equals 0.2% ; gauge length, 2.0 in.**Based on typical values.
tAll failures occurred through weld.§A-through weld.B-2i to 2j in. from weld.
TABLE 34
216
1.581.691.611.61
1.521.931.731.31
3.00-
2.15
2.222.412.242.14
2.102.271.9s1.o5
2.222.132.081.69
2.102.191.981.68
2.30
2.351.91
1.631.641.541.06

Table 1-Chemical Composition of Aluminum Alloys
Abbre-viatedcom-
Alloy position FormBase metal
6061 Sheet No. 1Sheet No. 2Sheet No. 3Sheet No. 4
Filler metal4043 Al5Si Wire
Rod718 AI12Si Wire
Rod5554 AI3Mg Wire5556 AIS5Mg Wire
Rod
Compositionby
-- Nominal composition, % - - analysis, %'
Mg Si Mn Cu Cr Ti Mg Si
1.0 0.6 ...
1.0 0.6 ...1.0 0.6 ...1.0 0.6 ...
... 5 .0 ...
... 5 .0 ...
,.. 12 ...
2.8 ... 0.85.2 ... 0.35.2 ... 0.8
0.25 0.250.25 0.250.25 0.250.25 0.25
... 0.1
... 0.1
... 0.1
... 0.98 0.56
... 1.04 0.51
... 1.03 0.59
... 0.87 0.68
.. 0.26 5.06... 0.24 5.31
... 0.22 11.69
... 0.30 11.10
0.1 3.25 0.040.1 5.06 0.050.1 5.01 0.05
Balance consists of Al and n•orn,.l impurities.
Table 1-Nominal Compositions of Filler Metal Alloys
-- _- Element, % --- -----
Alloy Si Cu Mn Mg Cr Ti V Zr
99.00% Al, min2319 ... 6.3 0.3 ... ... 0.06 0.10 0.18
4043 5.0 ... ... ... ...
5052 ... ... ... 2.5 0.25 ...
5154 ... .. ... 3.5 0.25 ...
5183 ... ... 0.8 4.45 0.10 0.1
5456, ... ... 0.8 5.25 0.10 ...
5556 ... ... 0.8 5.25 0.10 0.1 ...
" Filler jlloy b46 has been re.pil ced t, y "1'l•" .,fiil i, Ino longer Cormlnmer i .dll y I.y l.lble. Its InichiCi ll.i properties .re essenti;aly the ,.mllle. thi is) f % 6.
TABLE_35
217
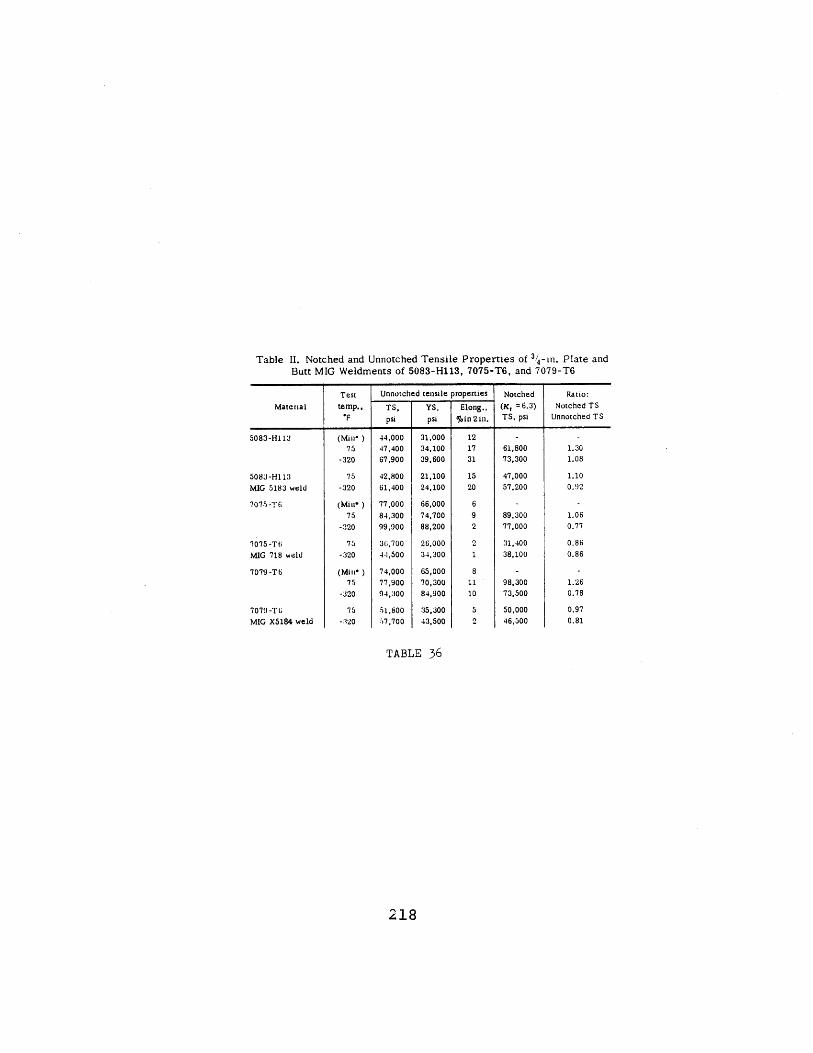
Table II. Notched and Unnotched Tensile Properties of 3/4-in. PlateandButt MIG Weldments of 5083-H113, 7075-T6, and 7079-T6
Material
5083-H113
5083-H113MIG 5183 weld
7075-T6
7075-Tt;MIG 718 weld
7079-T6
7079 -T
MIG X5184 weld
Test
temp..'F
(Min* )75
-320
75
-320
(Min*)75
-320
75
-320
(Mill* )75
-320
75
-:1320
Unnotched tensile properties
TS,
psi
44,000417,400
67,900
42,800
61,400
77,000
8.4,300
99,900
3;,700
4-1,500
74,00077,900
94,300
51,800
.57 ,700
YS,psi
31,00034,10039,600
21,100
24,100
66,000
74.700
88,200
26,00034,300
65,00070,30084,900
35,30043,500
Elong.,
%oin2in.
Notched
(Kt = 6.3)TS, psi
61,80073,300
47,000
57,200
89,300
77,000
31,400
38,100
98,300
73,500
50,000
46,500
Ratio:
Notched TSUnnotched TS
TABLE 36
218

yiU) CD0 o U0 0 00 0 ' (t 40 0 (0 JO 1 t ý ) m CMi 00 a: a) m f t'r m 0---~ mo - rmt n -r In m cu uao ooo
t.K n re) (0 r v0 40 UL nj o 0t 0 lo 414 .- J C (0 0) C0z o 00o 0r Ln c m o 00 mtr, -C)ý o oa) 0 ( c, c. ) a Cý (7 m ) n C, m C~ C: 0 C: c
C MO F-r a.CL
C: ,( c
U(=)(D CLWn
0 0 000 0 0000 00 0 0 00 000 0 00 00 00 0000 0 00 00 00 0 00 0 0m C) ) 4 C C- o C C C: , o C M 0 C) 0D (:) o CD )00 0D c CD C 0 t CD C) C D 0DC) 0DCD CD C: 0 1)' 0 )D .0 0 D c l a) f- 00 CM U ) Lo LI) - 40 C7, 40
004-C mCO L m mm LC O L at LD4W00t.0
C 0 C= = CMD cmM CD M C D - U CD CD CD) CD4 CD = 0 40 C 0 C m CD C0
0z 10 00 " 0-" 00 04 00 tot Dt0 00 %0L0 k0 00c t000 ca00 0000000000000 00
CMD C) : CD CV 00 CD CDD C C D CD 4D CD CD 40 CD 0 D CD D
CM" 4.0 , m " m .0 0 m 0) U) 0C 0 00 Cj r 4t0 4 m 0 D Co:T t U) :r to U) q.0 r- CM - ) L 0 to 40T U) t0 C U") 4
c 0 )0 00 r0 U
CD M .- to -
*P3 . U)m to I mm'n to to tl-ý t
ooooooooooom m6 1c . m mC:) (D CD C)C)C
0n 00 0= 0O 0\
000000CD C:) c) ) C CCMCM-4C3CM0al C=) CD (= C) C10 ý0 4.0 to 40 to
c CO m LI )4 CM cn -T m u0) T, -4 RO cq -o -o m a ) im CM CM 0 c Co CD -Ten n c-r r-= Co 0 m m L- )mn 0
m m 0 m0m -z) 4O 0)0)00 00) Log 00m :?Co0 CM 0 m , tW -o rCDC
C/(nCO or a 3 0 a QQ~m a,0 Co 40 10 QCO 40 0 0) 0 0 0
z 00 00 n 00 CD 00 n CD CD im m m 00 I 0000- hn4 -00 ,U00 t.0 n o COmC D C
0 CU 00 In
Z(V•
000oa 000Oooo oooooooooooooa o40 00 00a 00~ 000000000000000000000
C0 0) . m D u= 0 ( m Co D - m CD CD 1= CD CD -( 00 CD C ) 0 DCDC CD -D m 0C 0) m 0C ) 0m I) -I t) UL) CM r" : T ) LO to . t to u v O w4 U) 40 t0 I c 40 m M m 'r T m to to U) u) to Lo
a t) 0 -I) m uq 'IT C4 0 m 0 m C C CDa40m -4- 4- 4r h.C mmo mmm m
. Co mU c7 oU7 a OCco 09 )
. . C VJ ooo D - . m m oM rD m
. 0g O oO oOO O OO 00 00 0 00000000 - M C000 00 CD 000000
Myl ~ ~ ~ ~ ~ ~ 00MUCi 40nI1-~ 0Q mOOOoQ) c U)r m0 0 00)Co;-) ;Cý Cs 3 Lo-o 060)4 1 c4'; J .IC~ C,7 ,: 0-4 e mCom 10-441).. t CMCMO) a 0C o ;
U) U)0000 0 8~0 0000
0 0D CD)44 CD CDC C CD U cm m- CDC DC DCCD m m 0 CD 0, C, 2)- 9 acM4 400 CDCUC 4D=C m ) ,mUDOa)CDo,
0
a Uom Om e m m 8 m em e
= m = m CD m C= m m) m=m m m DmC m mD m cCDeM M M Ia w x 0 a m I I T II II m :I
-sama.
>E0s
0)> ( 0) 0) 0)( m 1 M m0 - -- 4 . 1,0 m m , m m 0 0= VM m m m CM c
219
a)cu
C:
(0 (
c 0do0 E-j
(V
(V~
(V-i
I
I
na,>1

clc m oD r- 0
r- Lo C=) 0r- - ýCD
CD CD C)C= C CmD 0 Q - Lri
Ul a) o-" 'T'
(,
7
w "
.:-t
5,a l _C.I)•
€
D c: cý u
0 0 0 0 0 0
T Lr) LQ - w) Lo
r,010 ~t o
Ln CY) C) -cn zr cmZ
z 222 C) 00z 0
bD bD-a )
bDc
LJc
-, >) Oi
C) C
tw
a) q) C-ccLI)LI,~!
D 00 0 0 0D
e'j ao nr m ai
U- U-, %D in UU) U.r
0 00 0 000 00 0 00
0m o mLo C j r- mCD,CD CD CD CD C)Ni c : t If MiCLi -tr rl) U-ýr L) ' L -
C)CDC)C)C)CCDC C ) DC
mC EmE em C
LL22 0" U)
2209
cLa,
cc 0
Q)
V)

a .
200-01-
000
0 I
0I.0 U~
-maU
". r- 0 -t1 N I ) n -t
m 'o <D C 00 N 0 :Delt Nýý l c3. ý - 1 4NN N0 00
Q0 aN 00 00 00 N 0
In o**: N N - N- .0
In 3 I
'ON 'O - 0 N 0 4
OnNN IN N N N N *
** N3PO - * 0 N N
~~~ *N M - - -
_ 00 N~"~V
•,,• ...• •.• • .. • .
0 o 0 0 - N
.-3F .-F o- F - F - F
NNN~
221
I N 000 00 N a A 0 00000 '- -. -:
- -0 -- - - - - -
In 0 N 00 - 0 00 NN
0n on In 0 0 * * 0
00 t 1 C4'A n 0 0 -t o lInen In C4C4 0 0 r, 10 -
E
F-
ou000
a0
z
a 'a
sbc
CP
5t;
hc: 0rEj~
7-75
j~i;s3~EE
aB
I %.C~ =
311!hS2
C.
I2
I
I

Table 10-Fracture Toughness of Weld Metal and Transition Zone
Weld-metal HeatFiller composition, % treat-
Group metal Si Mg menta1 AI5Si 1.5 0.8 AA
-Fracture toughness, in.-lb/in.---Weld metal- Transition zone
Avgh so Avgb s'
94(3) 5 297(5) 50204(2) ... 491(5) 95
AI12Si 2.9 0.9 AA 70(4) 11 184(4) 45SQ 176(2) ... 405(2) ...
3 AI5Si 3.2 0.6 AA 150(4) 34 292(8) 39
SQ 247(2) ... 489(4) 90
4 AI12Si 6.6 0.6 AASQ
86(4) 12 121(10) 46278(2) ... 337(6) 40
5 AI3Mg 0.5 1.6 AA 475(4) 32 305(8) 121SQ 640(2) ... 559(3) 89
6 AI5Mg 0.5 1.9 AA 535(2) ... 456(2)SQ 1202(2) ... 759(3) 123
7 AI5Mg 0.3 3.2 AA 620(2) ... 454(3) 10SQ 1177(2) ... 557(2) ...
;' Heat treatment after weldinii: AA--irtifici.il ;aging; SQ-solution quenching and artificidlaging.
The number of specimens included iI the a;vera•ge is given in parenthesis.Standard deviation.
TABLE 39
Pll I Samplearent retal we ICsoedit m bal, r
1100-H112 11003003-*112 11005052-H12l SOU5052-H112 502251t4-Hit2 5154544-H532 2450086-32 53565083-H113 SSS35456-0 5426
5456-4321 $151GOII-TO II(6061-TO 40430002-T6 06436061-TO 51546061-T6 1124
14"070147001141081147012147083
200S17200818174673
147084147068
147087~O14;o"
Sme-h speetme -eed pO stmaTensle Yil Elongations etU-trangth. stranoth, In 2 In.. arpsi pit ý7411600 i6 100
0 100 13 000200 n 13 0030600 14 50033600 17100
000 10 10041200 21 200
43900 21 1"44600 220026 00 1 20043200 300022004 14 M36000 27 30
Temile Redeati n
mrph,. doa. .pet · n
17 00
34 100M W31110034 10039 30041 4004200040 00
431002750042 003300042 000
No•ch Tnamile Strenjh (-360)N.ach Terlia Samnnb Room Tempv atut)
TABLE 40
222
I meeh "pememas
-SWF
ratIoiloenbeonIn 2 in..
'I
NIched speiotlmim
tadrieonof are..
16of area..
a.
Ratio •NTSi(-320)
Teamile
psi
21 60033700
45 00
2470060 OO3 710076000xW n
2340040100
41 400S140054 W57 M
51 a
0rn"th.
So0O
l230016 500s 9000
2260010 30024 700124 70022000
26 00
1900030700
Smength.p•l
32200
4350045 70043000
48400
48200
61400330O047 00
,rai.
1.41
0.06LOO0.880.970.920.930.85
0.0
0.080.0
t I
Temile Reduction

t . N . v .. r - v-
a !2r- ,. -t 4.
.Ooc N- ta 'rat . -,~ rl =.70 r r -r r
3'~ r 0l vt'T ·.- r '. '70oC. 3·- · '. -- -C 3
-C : -. -40 001~ 1-1 1 . -.0'3' 3' rC
., -. 7 z.7. n .7-
.7 4I .,~ - '·' '4, r-4 4rr.
r. -
-. r , - .4r o . r t ' 3''. _ , 3,
0 .
3.
7, 3WW0.'N r-
-t t -
oPi I
'c- -KI
P:Z~c
'O r-oc9 P ri or-s 0 ".0 - t.N --0; .0 '0 03' 0 -7C .t t rlc rl -Nr-4- EI -- - i ''-
oct 3'0 0 ,0r4'3 00 x 3 C G X4
Ný- 0 'r -- ,3 . -N o I503' 50 .r. 50N 5 ar. o. C,. =' V"C. -. I.- C.
0
kf)
cq0
$o4
_
qj"
02f) 0
ea 0
0,
eo
0 S
I-
t 3' 0'. 5.7 - 7
58 Q8 Q,V, 0
0 - '4 3
8 $E c.s c.Ct Ct
5c c.?
oio:
-r ri . -r. - ri - -r r ri -.
0a
-3 2c,re·~
z c
223
0-4to~c crc
or- '0
:•" &• •_ _ - -
-t
-00. '0
.7 -t 4-lrl -l r
-'Jr
.4 .
-3·3~
~ L
A,·-
-33
0.
El·
z , 50.
0
9t
m
0.
'J
c
c
1

- -- ? " -
ri ri " .
_r - 0 ' . '0
r- • -. 0'- r- r- v.,v'- 0
l-% ~ ~ ~ r -/ rl r~~o w
0' C
.0· '
r: t
'04
-- I -I" e4
f4P40
-t 9 "1 ;:r- '0 a .
-t , '
a' 00- 00 0Ot a. .1. "-- ,!0'.22
00 4- 4- 0~- ~, v
4-2· r , 0
00 v.'.0'*Oi 0'
4-v- 'i v-v''i0.0, 9
7-7jO' v-I -
2- '04- 4 - " -- -. 0n' 0 :2
2 0 * In -. 20 0 07 I00 0' 2 V 0' 0 2 0 OkrC 0 0'0'0 0' '00 ;: ; I 01 t -
0''0 0' v-1
II t T- I0 2r In W , -a
iN EN vi v-i ci
~~81 ~H ~~8s 8~~4- ~ 4- 9 4-
4) 4- .6 ' 0.0
20' 2 t-0II1 I -
8
0 0
Lcr Q• 1b < 0 -- ~ ~ -E -c -vi .. rvv - -- ~ - - vI -
.e 00
-1 I
C3
00g
224
.0cy
m~tJ0=•S .5
s-
c~cUifaC
:cC0C
o 1Co'~.0 Cn
S 0
S00
.- ,- .
" d• , ,• • , .1
•z,• •.•v,
- fli
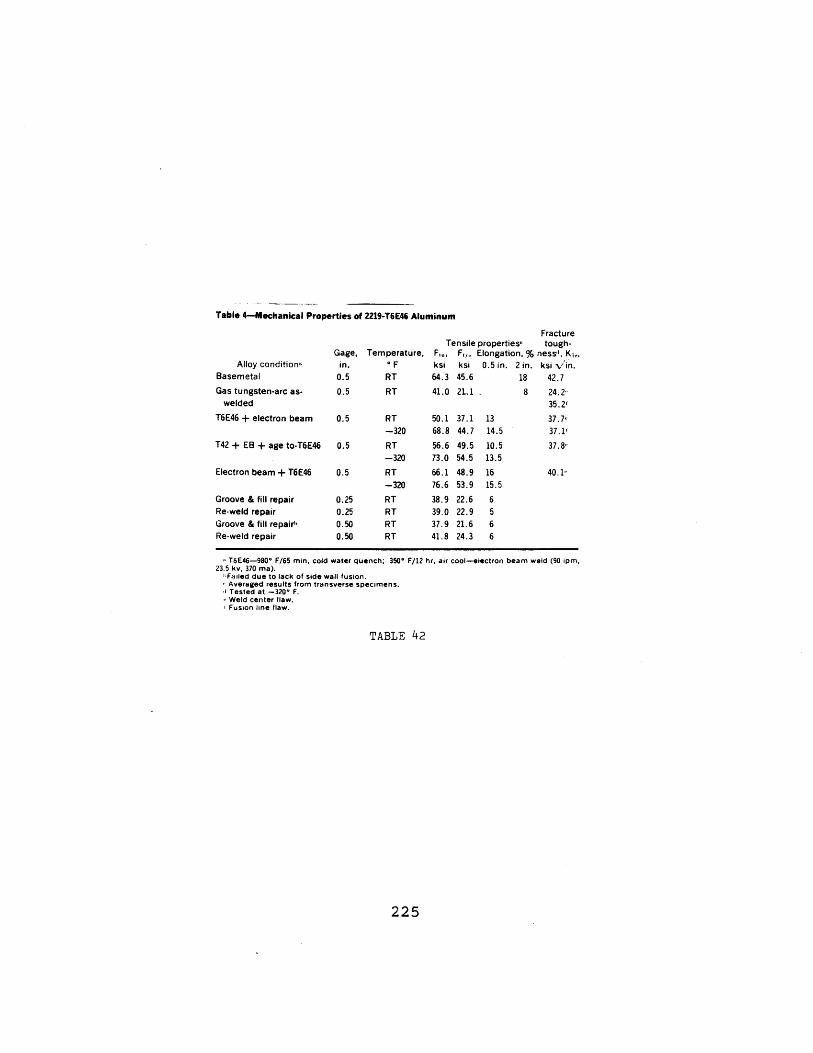
Table 4-Mechanical Properties of 2219-T6E46 Aluminum
Alloy condition'Basemetal
Gas tungsten-arc as-welded
T6E46 + electron beam
T42 + EB + age to-T6E46
Electron beam + T6E46
Groove & fill repairRe-weld repairGroove & fill repair"Re-weld repair
FractureTensile properties' tough-
Gage, Temperature, F,,,, F,,., Elongation, % ness'l , KI,,in. F ksi ksi 0.5 in. 2 in. ksi V/in.
0.5 RT 64.3 45.6 18 42.7
0.5 RT 41.0 2L1. 8 24.2"35.2'
0.5 RT 50.1 37.1 13 37.7'-320 68.8 44.7 14.5 37.1'
0.5 RT 56.6 49.5 10.5-320 73.0 54.5 13.5
0.5 RT 66.1 48.9 16-320 76.6 53.9 15.5
37.8--
40.1-
:, T6E46-980* F/65 min, cold water quench; 3500 F/12 hr, air cool-electron beam weld (90 ipm,23.5 kv, 370 ma).
I-Failed due to lack of side wall fusion.Averaged results from transverse specimens.Tested at -320U F.
, Weld center flaw.r Fusion line flaw.
TABLE 42
225

Joint Reduc- Joint Notch-Tensile yield Elong. tion effi- Location tensile Ratios
Thickness, Filler Temp., strength, strength,* in 4D, of area, ciency,t of strength,++in. alloy 0F psi psi % % % failure psi NTS/TS NTS'JYS
4043 RT 23,800 9,500 12.1 22-112 26,100 10,000 14.3 26- 320 33,500 11,500 6.4§ 9- 452 48,600 18,000 10.0 13
j 4043 RT 24,000 11,400 5.7 23-320 34,700 14,800 7.1 9-452 45,500 28,500 7.1 8
5556 RT 24,100 12,200 12.1 27-112 27,000 15,000 5.0 14- 320 33,400 16,100 5.7 8- 452 37,200 25,400 3.6 7
j 4043 TR 37,800 21,500 6.4 10-112 40,400 22,900 5.7 11- 320 48,900 24,100 5.0 8-452 55,000 38,300 4.3 7
j 4043 iRT 30,800 19;000 9.3 39-112 35,800 21,800 7.1 7--320 43,100 23,000 5.0 7-452 45,900 35,700 2.9 4
j 5556 RT 37,700 24,600 3.6 5-112 42,100 27,100 3.6 6- 320 47,600 30,400 3.6 5-452 47,700 37,600 2.9 3
4043 RTI 28,900 19,300 7.1 32- 320 44,400 23,300 7.9 19- 452 52,300 38,600 6.4 8
5556 RT 35,400 24,400 3.6 5- 320 45,600 29,300 4.3 7-452 48.300 40,800 2.9 5
B 27,500 1.15B 31,700 1.21B 38,100 1.14A 40,400 0.83B 29,300 1.22B 34,100 0.98B 36,900 0.81B 29,500 1.22B 31,100 1.15C 34,300 1.03C 36,400 0.98A 32,000 0.85A 33,000 0.82A 36,900 0.76A 42,300 0.72C 28,700 0.93A 31,500 0.88A 34,700 0.81A 37,400 0.82A 37,700 1.00A 35,700 0.85A 39,500 0.83A 41,300 0.87C 34,500 1.19A 38,900 0.88A 40,400 0.78A 40,500 1.15C 45,000 0.99C 45,500 0.94
*OtTset equals 0.2 .; gauge length 2.0-in.§A--through weld.I3-- to 2j in. from weld.C-edite of weld.
tBased on actual test data. +All failures occurred through weld.§Failed outside of gauge length. **No parent metal tests for comparison.
TABLE 43
226
Alloy and tempercombination
A344-F to A344-F
to 6061-T6
to 5456-H321
354-T62 to 354-T62
to 606 1-T6
to 5456-H321
C355-'T61 to 60bl-T61
to 5456-11321

APPENDIX D

Adsit, N.C. and Witzell, W.E., "Fracture Toughness of
Aluminum - Boron Composites," paper from Aircraft
Structures and Materials Application, Society of
Aerospace Material and Process Engineers, Azusa, Calif.,
1969, p. 391-398.
Broek, D., "The Effect of the Sheet Thickness on the Fracture
Toughness of Cracked Sheet," report, National Aerospace
Laboratory, Amsterdam, Jan. 1966, 14 p.
Broek, D., "The Effect of the Sheet Thickness on the Fracture
Toughness of Cracked Aluminum Sheet," National Aerospace
Laboratory, Amsterdam, 1966, 14 p.
Broek, D., "The Residual Strength of Aluminum Alloy Sheet
Specimens Containing Fatigue Crack or Saw Cuts,"
National Aerospace Laboratory, Amsterdam, March 1966,
8 p.
Brook, R., "Metallurgical and Test Variables," paper from
Fracture Toughness, Iron and Steel Institute Publication
121, London, 1969, 67-82.
Campbell, J.E., "Evaluation of Special Metal Properties,"
Defense Metals Information Center Review of Recent
Developments, Metal Properties Council and Defense
Metals Information Center, Battelle Memorial Institute,
Columbus, Ohio, Jan. 12, 1962, 4 p.
228

Campbell, J.E., "Low Temperatures of Metals," DMIC Review,
MPC and DMIC, Battelle Memorial Institute, Columbus,
Ohio, June 12, 1970, 6 p.
Campbell, J.E., "Mechanical Properties of
Review, Battelle Memorial Institute,
Aug. 5, 1966, 6 p.
Campbell, J.E., "Mechanical Properites of
Review, Battelle Memorial Institute,
Feb. 16, 1968, 5 p.
Campbell, J.E., "Mechanical Properties of
Review, Battelle Memorial Institute,
May 10, 1968, 6 p.
Campbell, J.E., "Mechanical Properties of
Review, Battelle Memorial Institute,
July 19, 1968, 4 p.
Campbell, J.E., "Mechanical Properties of
Review, Battelle Memorial Institute,
April 25, 1969, 8 p.
Campbell, J.E., "Mechanical Properties of
Review, Aug. 20, 1969, 6 p.
Campbell, J.E., "Mechanical Properties of
Review, Battelle Memorial Institute,
Jan. 30, 1970, 6 p.
Metals," DMIC
Columbus, Ohio,
Metals," DMIC
Columbus, Ohio,
Metals," DMIC
Columbus, Ohio,
Metals," DMIC
Columbus, Ohio,
Metals," DMIC
Columbus, Ohio,
Metals," DMIC
Metals," DMIC
Columbus, Ohio,
229

Campbell, J.E., "Mechanical Properties of Metals," DMIC
Review, Battelle Memorial Institute, Columbus, Ohio,
May 8, 1970, 6 p.
Campbell, J.E., "Mechanical Properties of Metals," DMIC
Review, Battelle Memorial Institute, Columbus, Ohio,
July 31, 1970, 5 p.
Campbell, J.E., "Plane-Strain Fracture-Toughness Data for
Selected Metals and Alloys," DMIC Report, Battelle
Memorial Institute, Columbus, Ohio, June 1969, 26 p.
Carman, Carl M., "Crack-Resistance Properties of High-Strength
Aluminum Alloys," U.S. Department of Commerce
Clearinghouse Reports, 1965, AD-629 105, 62 p.
Carman, Carl M., Fourney, J.M., and Katlin, J.M., "Plane-
Strain Fracture Toughness of 2219-T87 Aluminum Alloy at
Room and Cryogenic Temperature," U.S. Department of
Commerce Clearinghouse Reports, 1966, AD-639 944, 40 p.
Christian, Jack L., "Problems, Properties and Selection of
Structural Metals for Use in Cryogenic Environment,"
American Society for Metals, Metals Park, Ohio, 1967,
19 p.
Dolowy, J.F. Jr., "Fabrication and Processing Mechanisms
Active in Al - B Composites," TMS Paper Selection #569-6,
Metallurgical Society AIME, N.Y., 1969, 12 p.
230

Forsyth, P.J.E., "A Two Stage Process of Fatigue Crack
Growth," paper from Crack Propagation Symposium
Proceedings, vol. 1, 1961, The College of Aeronautics,
Cranfield, England, p. 76-94.
Freed, C.N., "Effect of Side Grooves and Fatigue Crack Length
on Plane-Strain Fracture Toughness," Naval Research
Laboratory, Washington, D.C., Dec. 7, 1967, 20 p.
Goode, R.J., Huber, R.W., Howe, D.G., Judy, R.W. Jr., and
Crooker, T.W., et.al., "Metallurgical Characteristics
of High Strength Structural Materials," Naval Research
Laboratory, Washington, D.C., Sept. 1967, 162 p.
Grant, N.J., "Intercrystalline Failure at High Temperatures,"
paper from Fracture, The Technology Press of the
Massachusetts Institute of Technology and John Wiley &
Sons, Inc., N.Y., 1959, p. 562-578.
Guest, P.J., "Microstructure and Plane Strain Fracture
Toughness of High-Strength Aluminum Alloys," Lawrence
Radiation Laboratory, California University, Berkley,
Oct. 1967, 57 p.
Hanson, M.P., Stickley, G.W., and Richards, H.T.,"Sharp-
Notch Behavior of Some High-Strength Sheet Aluminum
Alloys and Welded Joints at 75, -320, and -423 0F.,"
American Society of Testing Materials, Symposium on
Low Temperature Properties of High-Strength Aircraft and
231
Missile Materials, 1960, 1661, 3-15; discussion, 16-22.
Hickey, C.F. Jr., "Mechanical Properties of Titanium and
Aluminum Alloys at Cryogenic Temperatures," ASTM
Preprint, #78, 1962, 12 p.
Hunter, M.S. and McMillan, J.C., "Fractography and Micro-
structure of Aluminum Alloy 7075-T651 and T7351,"
ASTM paper #47, Race Street, Philadelphia, 20 p.
Hunter, M.S. and McMillan, J.C., "Fractography and Micro-
structure of Aluminum Alloys 7051-T651 and 7075-T7351,"
paper from Electron Fractography, ASTM STP, #436, Race
Street, Philadelphia, 1968, p. 196-211.
Hyatt, M.V. and Quist, W.E., "The Influence of Heat
Treatment and Composition on the Stress Corrosion,
Fatigue, and Fracture Properties of 7075 Type Aluminum
Alloys," paper from Proceedings of the Air Force
Materials Laboratory Conference on Corrosion of Military
and Aerospace Equipment, Nov. 1967, p. 827-877.
Irwin, G.C., "Effects of Size and Shape on Fracture of Solids,"
paper from Properties of Crystalline Solids, ASTM STP
#238, American Society for Testing Materials, Philadel-
phia, 1961, p. 118-128.
Jackson, L.C., McClure, G.M., and Kasuba, J.A., "Some Design
Aspects of Fracture in Flat-Sheet Specimens and
Cylindrical Pressure Vessels," DMIC,Battelle Memorial
232

Institute Memo #174, Aug. 9, 1963, 24 p.
Judy, R.W. Jr., Goode, R.J., and Freed, C.N., "Fracture
Toughness Characterization Procedures and Interpreta-
tions to Fracture-Safe Design for Structural Aluminum
Alloys," Naval Research Laboratory, Washington, D.C.,
March 31, 1969, 29 p.
Kaufman, J.G. and Holt, M., "Fracture Characteristics of
Aluminum Alloys," Technical Paper No. 18, 1965,
Aluminum Company of America, Pittsburgh, Pa., 48 p.
Kaufman, J.G., "Fracture Characteristics of Aluminum Alloy
Plate in Tension Tests of Large Center Slotted Panels,"
ASTM paper no. 49, ND, Race Street, Philadelphia, 33 p.
Kovacs, W.J. and Low Jr., J.R., Intergranular Fracture in an
Al - 15 Wt.% Z n Al:loy, Carnegie Mellon University,
Pittsburgh, Pa., Feb. 1970, 239 p.
Kuhn, P. and Figge, E.I., "Unified Notch Strength Analysis
for Wrought Aluminum Alloys," National Aeronautics and
Space Administration Technical Note 1259, May 1962, 76 p.
Newman Jr., J.C., "Fracture of Cracked Plates under Plane
Stress," National Aeronautics and Space Administration,
Langley Research Center, Langley Station, Va., 1967,
34 p.
Paris, P. and Erdogan, F., "A Critical Analysis of Crack
Propagation Laws," American Society of Mechanical
Engineers Paper no. 62-WA-234, 1962, 7 p.
233

Paris, P., "Crack Propagation Caused by Fluctuating Loads,"
American Society of Mechanical Engineers, Paper no.
62-MET-3, 1962, 8 p.
Porter, D.E., "Fracture Toughness of Precipitation Hardening
Aluminum Alloys," Lawrence Radiation Lab., Calif. Univ.,
Berkeley, Apr. 1969, 135 p.
Ryder, D.A. and Smale, A.C.,"A Metallographic Study of
Tensile Fractures in Aluminum Copper and Aluminum -
Copper - Zinc - Magnesium Alloys,"Fracture of Solids,
1962, 1963, p. 237-259.
Schwartzberg, F.R., Keys, R.D., and Kiefer, T.F., Cryogenic
Alloy Screening, Martin Marietta Corp., Denver, Colo.,
Feb. 1970, 233 p.
Schwartzberg, F.R., Keys, R.D., and Kiefer, T.F., "Fracture
Behavior of Two New High-Strength Aluminum Alloys,"
WESTEC Technical Paper no. W9-19.1, American Society
for Metals, Metals Park, Ohio, 1969, 13 p.
Crack Propagation Symposium,Proceedings, 2 vol., The College
of Aeronautics, Cranfield, England, 1961, 566 p.
"Design Properties as Affected by Cryogenic Temperatures,"
Defense Metals Information Center, Battelle Memorial
Institute, DMIC Memo 81, Jan. 24, 1961, 18 p.
"Material Selection for Crack Resistance," paper from Crack
Propagation Symposium,Proceedings, vol. 2, The College
234
of Aeronautics, Cranfield, England, 1961, p. 442-466.
"Mechanical Property Data 7178 Aluminum T76 Sheet," Battelle
Memorial Institute, Columbus, Ohio, 1969, 8 p.
"Recent Research on the Properties of Aluminum Alloys,"
Mechanical World and Engineering Record, vol. 141, Dec.
1961, p. 413-415.
"A Review and Comparison of Alloys for Future Solid Propel-
lant Rocket-Motor Cases," Defense Metals Information
Center, Battelle Memorial Institute, Memo no. 184, 1963,
40 p.
235

APPENDIX E

Foreign References
French
Develay, R., "Medium and High Strength Aluminum Alloys and
Their Behavior at Low Temperature," Revue de l'Aluminium,
no. 339, Feb. 1966, p. 193-216.
Gadeau, R., "Cryogenic Al Alloys," Revue de l'Aluminium, no.
304, Dec. 1962, p. 1355-1369.
Gobin, P. and Montuelle, J., "Brittleness of Zinc-Rich Al -
Zn and Al - Zn - Mg Alloys," Memoires Scientifiques de
la Revue de Metallurgie, vol. 56, Nov. 1959, p. 617-624.
Mercier, J., "Potentialities of AG4-Type [Aluminium] Alloys
at Very Low Temperatures," Revue de l'Aluminium, 1962,
(295), p. 193-198.
German
Barry, W.G. and Young, G.M., "Extrusion Alloy Alcan 505 HO,"
Aluminium, vol. 38, May 1962, p. 299-303.
Brennan, P., "Change of Mechanical Properties of Cold Rolled
Al Mg Sheets Stored at Room Temperature," Aluminium,
vol. 36, Oct. 1960, p. 589-594.
Dubsky, J., "Effect of Warm Aging on the Mechanical and
Electrical Properties of Butt Cold Pressure Welded
Copper Aluminum Alloys," Elektrie, vol. 18, no. 10,
Oct. 1964, p. 73-75.
237

Honsel, H. and Zimmermann, P., "Influence of Gas Content on
Cast Aluminum Alloys," Aluminium, vol. 36, March 1960,
p. 130-137.
Kaufman, J.G. and Holt, M., "Fracture Behavior of Aluminum
Alloys," Aluminium, Jan. 1970, 46, (1), p. 103-115.
Kochendorfer, A., "Strength and Deformation Properties of
Metals at Low Temperatures," Zeitschrift fur Metallkunde,
vol. 51, Feb. 1960, p. 73-80.
Scharf, G., "The Influence of the Composition on the
Extrudability and the Properties of Al Mg Si 0 Alloys,"
Zeitschrift fur Metallkunde, vol. 55, no. 12, Dec. 1964,
p. 740-744.
Zinkham, R.E., Dedrick, J.H., and Jackson, J.H., "Fracture
Toughness Testing of Al - Zn - Mg - Cu Alloys,"
Proceedings, 5th International Light Metal Conference,
Leoben, 1968, Dusseldorf, Germany, 1969, p. 129-140.
Italian
Mori, L., "The Effect of Temperature on the Impact Strength
of Some [Aluminium] Alloys," Alluminio, 1962, 31, (6),
p. 295-303.
Japanese
Tukui, T., "Notch Toughness and Fracture Characteristics of
Structural Al - Zn - Mg Alloy Welds," Journal of the
Japanese Institute of Light Metals, May 1970, 20, (5),
238

p. 222-233.
Takeuchi, K. and Tanaka, E., "Mechanical Properties of
Aluminum Alloys at Low Temperatures," Sumitomo Light
Metal Technical Report, 1961, 2, (3), p. 78-81.
Russian
Panin, A.V., "The Possibility of Brittle Fracture of
Aluminum Alloy Welded Joints," Avtomat Svarka, no. 1i,
Jan. 1967, p. 38-41.
Vorobev, G.M., Goldstein, R.M., and Mauritz, I.I., "Effect
of Alloys on Basic Mechanical Properties of Silumin,"
Tsvetney Met, no. 3, 1965, p. 83-86.
239