influence of principals leadership styles …...influence of principals leadership styles on...
TRANSCRIPT

INFLUENCE OF PRINCIPALS LEADERSHIP STYLES ON TEACHERS
JOB SATISFACTION IN PUBLIC SECONDARY SCHOOLS IN
KIAMBU SUB-COUNTY, KIAMBU COUNTY, KENYA
Gakobo Margaret Nyiha
A Research Project Submitted in Partial Fulfillment of the Requirements
for the Award of Degree of Master of Education in Educational
Administration
University of Nairobi
2015

ii
DECLARATION This research project is my original work and has not been presented for the
award of a degree in any other university
___________________
Gakobo Margaret Nyiha
E55/83952/2012
This research project has been submitted for examination with our approval as
university supervisors.
__________________
Mr. Edward Kanori
Lecturer
Department of Educational Administration and Planning
University of Nairobi
__________________
Dr. Mugambi
Lecturer
Department of Educational Administration and Planning
University of Nairobi

iii
DEDICATION
This project is dedicated to my husband Mr. Nahashon Ngugi and our children
Evelyne, Tracy and Stephanie for their support. I left them unattended when I went to
work on it.

iv
ACKNOWLEDGEMENT
First and foremost I acknowledge God for being with me. I also acknowledge with
sincere appreciation the support and input of my supervisors, Mr. Edward Kanori and
Dr. Mercy Mugambi who has journeyed with me through this research work. I also
acknowledge with love my family, University of Nairobi lecturers, library staff and
all those whose efforts have made this project a reality.

v
TABLE OF CONTENTS
Title Page
Declaration ............................................................................................................... ii
Dedication ............................................................................................................... iii
Acknowledgement ................................................................................................... iv
Table of Contents ......................................................................................................v
List of Tables ........................................................................................................... ix
List of Figures ......................................................................................................... xi
Abbreviations and Acronyms ................................................................................. xii
Abstract ................................................................................................................. xiii
CHAPTER ONE
INTRODUCTION
1.1 Background to the Study .................................................................................. 1
1.2 Statement of the Problem ................................................................................. 7
1.3 Purpose of the Study ........................................................................................ 7
1.4 Objectives of the Study .................................................................................... 7
1.5 Research Questions .......................................................................................... 8
1.6 Significance of the Study ................................................................................. 8
1.7 Limitations of the Study ................................................................................... 9
1.8 Delimitations of the Study ............................................................................. 10
1.9 Basic Assumption of the Study ...................................................................... 10
1.10 Definitions of Significant Terms.................................................................. 10
1.11 Organization of the Study ............................................................................ 11

vi
CHAPTER TWO
LITERATURE REVIEW
2.1 Introduction .................................................................................................... 13
2.2 Leadership and Job Satisfaction ..................................................................... 13
2.3 Democratic Leadership Style and Teachers Job Satisfaction ........................ 14
2.4 Autocratic Leadership and Teachers Job Satisfaction ................................... 16
2.5 Laissez- Faire Leadership and Teacher‟s Job-Satisfaction ............................ 17
2.6 Transformational Leadership Style and Teacher Job Satisfaction ................. 19
2.7 Summary of Literature Review ...................................................................... 20
2.8 Theoretical Framework .................................................................................. 21
2.9 Conceptual Framework .................................................................................. 23
CHAPTER THREE
RESEARCH METHODOLOGY
3.1 Introduction .................................................................................................... 24
3.2 Research Design ............................................................................................. 24
3.3 Target Population ........................................................................................... 25
3.4 Sample Size and Sampling Procedure ........................................................... 25
3.5 Research Instruments ..................................................................................... 27
3.6 Validity of the Instruments ............................................................................ 27
3.7 Reliability of the Instruments ......................................................................... 28
3.8 Data Collection Procedures ............................................................................ 29
3.9 Data Analysis Techniques .............................................................................. 29
3.10 Ethical Considerations ................................................................................. 30

vii
CHAPTER FOUR
DATA ANALYSIS, PRESENTATION AND INTERPRETATION
4.1 Introduction ....................................................................................................31
4.2 Questionnaire Return Rate .............................................................................31
4.3 Demographic Information ..............................................................................32
4.4 Leadership Behaviors .....................................................................................37
4.4.1 Democratic Leadership and Teachers Job Satisfaction ............................37
4.4.2 Autocratic Leadership Style and Teachers Job Satisfaction .....................40
4.4.3 Laissez faire Leadership Style and Teachers‟ Job Satisfaction ................43
4.4.4 Transformational Leadership Style and Teachers Job Satisfaction ..........47
4.5 Teachers Job Satisfaction Survey ...................................................................51
4.6 Correlations and Statistics ..............................................................................59
CHAPTER FIVE
SUMMARY, CONCLUSIONS AND RECOMMENDATIONS
5.1 Introduction ....................................................................................................64
5.2 Summary of the Study ....................................................................................64
5.3 Conclusions ....................................................................................................72
5.4 Recommendations ..........................................................................................73
5.5 Suggestions for Further Studies .....................................................................74
REFERENCES ...................................................................................................75

viii
APPENDICES
Appendix I: Introduction Letter ...........................................................................78
Appendix II:Questionnaire for Principals ............................................................79
Appendix III: Questionnaire for Teachers ............................................................83
Appendix IV: Research Permit .............................................................................88
Appendix V: Research Authorization .................................................................89

ix
LIST OF TABLES
Table Page
Table 3.1: Proportional Sample Size of Teachers per School ................................ 26
Table 4. 1: Questionnaire Return Rate .................................................................... 31
Table 4. 2: Distribution by Age .............................................................................. 33
Table 4. 3: Principals Highest Academic/Professional Qualification ..................... 34
Table 4. 4: Distribution of Teachers by Experience at Present School .................. 35
Table 4. 5: Principals Distribution by Teaching Experience .................................. 35
Table 4. 6: Distribution of Teachers by Responsibility in School .......................... 36
Table 4. 7: Category of Schools involved in the Study .......................................... 36
Table 4. 8: Principals Response on Democratic Leadership Styles ........................ 38
Table 4. 9: Teachers Perception on Principals Democratic Style of Leadership .... 39
Table 4. 10: Principals Response on Autocratic Leadership Style ......................... 41
Table 4. 11: Teachers Perception on Principals Autocratic Behavior .................... 42
Table 4. 12: Principals Response on Laissez Faire Leadership Style ..................... 44
Table 4. 13: Teachers Perception on Principal‟s Laissez Faire Leadership Style .. 46
Table 4. 14: Principals Responses on Transformational Leadership Style ............. 48
Table 4. 15: Teachers Perception on Principals‟ Transformational Leadership ..... 50
Table 4. 16: Teachers Working Conditions ............................................................ 52
Table 4. 17: Teachers Pay And Promotion ............................................................. 53
Table 4. 18: Teachers Working Relationships ........................................................ 54
Table 4. 19: Teachers Recognition ......................................................................... 56

x
Table 4. 20: Teachers Satisfaction on Administration and Supervision ................. 58
Table 4. 21: Correlation of Democratic Leadership with Teachers Job Satisfaction.60
Table 4. 22: Correlation of Autocratic Leadership with Teachers Job Satisfaction.61
Table 4. 23: Correlation of Laissez Faire Leadership with Teachers Job Satisfaction
............................................................................................................................... ..62
Table 4. 24: Correlation of Transformational Leadership with Teachers Job Satisfaction
................................................................................................................................ .63

xi
LIST OF FIGURES
Figure Page
Figure 2.1: Conceptual Framework ........................................................................ 23
Figure 4. 1: Distribution by Gender ........................................................................ 32
Figure 4. 2: Distribution of Teachers by Professional Qualification ...................... 34

xii
ABBREVIATIONS AND ACRONYMS
JSQ Job Satisfaction Questionnaire
KCSE Kenya Certificate of Secondary Education
KEMI Kenya Educational Management Institute
KTTC Kenya Teachers Training College
LBDQ Leader Behavior Description Questionnaire
NACOSTI National Commission for Science and Technology and
Innovation
SPSS Statistical Package for the Social Science
TSC Teachers Service Commission

xiii
ABSTRACT
The purpose of this study was to investigate the influence of principals‟ leadership
styles on teachers‟ job satisfaction in public secondary schools in Kiambu Sub-
County. The objectives of the study included, to establish how democratic
leadership style influence teachers job satisfaction in public secondary schools in
Kiambu Sub-County. To examine the influence of autocratic leadership style on
teachers‟ job satisfaction in public secondary schools in Kiambu Sub-County. To
determine how laissez-faire leadership style influence teachers job satisfaction in
public secondary schools in Kiambu Sub-County. To establish how
transformational leadership style influence teachers job satisfaction in public
secondary schools in Kiambu Sub-County. This study adopted a descriptive survey
design where the target population for this study was all the 427 teachers and
principals in all the 28 public secondary schools in Kiambu Sub County. The study
purposely sampled 11 principals using simple random sampling and 128 teachers
using stratified random sampling from mixed day schools, girls‟ boarding schools
and boys‟ boarding schools. To collect data, a set of structured questionnaires were
used as an interview guide. Before the actual data collection, piloting of
questionnaires was done in two secondary schools in Kiambu sub county. To
establish the reliability of the instrument, the researcher used the test-retest where
the second test administration was done one week after the first one. The study
therefore concluded that the principals exercised a high level of democratic
leadership. The principals rarely practice laissez faire leadership style as they are
concerned about group performance. The principals practice transformational
leadership by giving encouragement to members of staff to initiate new and
creative ideas to benefit school and the rest of staff members. On job satisfaction
the working conditions are relatively good. However the teachers were not happy
with salary and benefits. The teachers were also not happy with issues to deal with
training, in-service courses and recommendation for study leave by principals. On
administration and supervision issues of concern to teachers included job appraisal
practices employed by principals. The study recommends improvement of working
conditions and provision of transport to teachers by the school vehicles. The
principals should encourage and offer equal opportunities for training, seminars/
in-service courses and give recommendations for teachers to attend. The principals
should actively improve on communication, by giving feedback on inquires and on
a timely basis and improve on job appraisal practices to be competitive and fair.
The researcher suggests the following areas for further study, given the scope and
limitations of this study, the study should be carried again in some other sub
counties for comparative purposes. The study also recommends that aspects of
promotion prospects such as advancement opportunities, opportunity for inservice
training and opportunity for growth should be enhanced. The study recommends
that there is need for school administration to come up with modalities of
improving job satifaction so that teachers job satifaction can be enhanced.
Principals should enhance their supervisory support to enhance teachers job
satisfaction.

1
CHAPTER ONE
INTRODUCTION
1.1 Background to the Study
Different scholars have argued that there is no precise definition for
describing the complex phenomenon of leadership. According Ciulla (2004),
leadership is the inspiration on mobilization of others to undertake collective
action in pursuit of common good. Therefore school leadership is a process of
encouraging and helping teachers and learners to work enthusiastically
towards realization of schools and educational objectives (Ciulla,2004).
Spector (1997) defines job satisfaction as an extent to which people like or
dislike their jobs. According to Miskel (2008), job satisfaction is that
emotional state resulting from appraisal of one‟s job or experience.
Significant indicators of job satisfaction which emerged from a study done by
Mwamwenda (1995) in Transei included positive relationship between
teachers and principals, results and achievements and the fact that teaching is
culturally considered to be fine and challenging profession. Olando (2008)
contends that low levels of job motivation and job satisfaction leads to
strikes, slowdowns, absenteeism and employee turn-over. North house (2010)
believed that “a teacher‟s job satisfaction may serve to influence their morale,
motivation and general willingness to maximize their teaching potential”.
Teachers who are not satisfied with their jobs may result in bad teaching or
learning process and school effectiveness will consequently be negatively
impacted.

2
Leadership styles exhibited by a school principal affect school climate,
learning situations and levels of professional and job satisfaction among
teachers (Ingolo, 1991). According to Clerk (2000) leadership style is the
manner and approach in which a leader provides direction, implements plans
and motivates people so as to meet organizational goals. According to
Okumbe (1998) leadership styles to be considered in this study are
democratic, autocratic, laissez faire and transformational leadership.
Numerous researchers on school effectiveness have demonstrated some form
of association between effective schools and the type of leadership practiced
by their principals. Hallinger and Liethwood (1994), Liu (2004) carried out
research on determinants of job satisfaction and found that loyalty to one‟s
employer and job longevity are important as compared to compensation,
benefits and supervision for Mexican-American and vice versa for the non-
Hispanic. A study to identify effective leadership styles in education sector of
Pakistan by Modley and Larochelle (1995), manifested that transformational
leadership was more successful in Pakistan in enhancing job satisfaction.
A study by Morris and Feldman (2003) in Palestine industrial sector showed
that autocratic leadership style was more frequently used than
transformational leadership while laissez faire was considered as the least
commonly occurring leadership style. The latter is more frequent among
leaders with low educational background. Moreover, transformational
leadership was found to encourage satisfaction, willingness to apply extra

3
effort and effectiveness among employees. A study on the organizational
culture, leadership modes, and employee job satisfaction at electric cable
companies in Taiwan, Chen (2008) found that transformational leadership
modes tend to be more acceptable to employees and affect employee job
satisfaction level and innovativeness.
A study carried out in Western Kentucky by Kirk (2012) reveal positive
correlation between transformational leadership style and teacher job
satisfaction. More over the study illustrated weak, negative correlations
between laissez faire leadership style and teacher job satisfaction. Concerning
the dimension of transformational, a research carried out by Bogler (2001) &
Kormaz (2007) found that transformational leadership is significantly
correlated with teacher job satisfaction. A study done by Bogler in Israel
(2001) showed that teachers prefer to work with a principal who exhibits
transformational type of behavior. In a survey of 244 nursing school faculty
members Chen (2008) found that Taiwanese nursing directors were more
transformational leaders than transactional or laissez-faire ones. The results
also indicated that the nursing faculty members were moderately satisfied
with their jobs and felt that the heavy workloads as opposed to the directors‟
leadership styles were possible reasons for their dissatisfaction with their
jobs.
A study carried out in Pakistan by Mohamed (2013) showed that in relation
to other styles, transformational leadership style has a stronger negative effect
on extrinsic job satisfaction while laissez-faire has negative effect on overall

4
job satisfaction. A study carried out by United States Education Department
(1997) found that teachers job satisfaction is strongly associated with
participation and influence in decision making and influence on school
policy, (Bogler, 1999). A study carried out in Malysia by Mohd (2012)
supported Lumsden (1998) who found that if teachers received support from
their principal and from local parents, if they were involved in the decision
making process, and if they worked within a positive school climate and
culture they were likely to succeed and remain in the profession. In the same
study teachers needed to feel included in the decision making process and
wanted to know that their opinions are valued.
A study in Pakistan by Muhammed (2015) concluded that leadership style
and job satisfaction exist, however it varies in its degree with reference to
different leadership styles and different aspects (intrinsic, extrinsic and
overall job satisfaction). Achua (2001) conducted a study on the principals‟
leadership styles and teachers‟ job performance in senior secondary schools
in Ondo State, Nigeria. Teachers‟ job performance was found to be at a
moderate level in the schools. The significant relationship found in this study
between the autocratic leadership style and teachers‟ job performance is value
added.
Differences in leadership styles used by principals have been raised in
performance of schools in which some perform better while others perform
poorly. Frequent conflict between teachers and principals, poor attendance of
lessons, teachers truancy with no apparent reason, teachers persistence

5
behavior in drinking alcohol during working hours are said to be related to
principals leadership style. Research has indicated that job satisfaction of
teachers is highly correlated with teachers‟ retention (Shann, 1998) and
teacher job satisfaction also has been linked to teacher attrition through the
effectiveness of the principals‟ leadership (Marlow, 1997). Mosadegn and
Mohammadian (2006) pointed out that job satisfaction is influenced by many
organization contextual factors, ranging from salaries, job autonomy, job
security, workplace flexibility to leadership. Today many teachers feel
dissatisfied with their jobs because of increased accountability and stress,
heavy, workloads, poor pay and working conditions, a negative school
atmosphere and specifically perceived inadequate principal support (Metlife,
2001, Popham, 2004).
Despite the Kenyan government‟s commitment to improving terms and
conditions of teachers, Schools have been faced with increased cases of
teacher shortage and low morale especially in secondary schools (Okumbe,
1998). Nzuve (1999) says that the leadership style a manager has should
influence the employees such as teachers to accept willingly their direction
and control. In Kenya issues relating to teacher motivation and enhancement
of the job performance have been addressed in various forums such as trade
unions meetings and public commissions. It has been pointed out that there is
need to improve the working conditions of teachers especially the pay
package. Okumbe (1992) in his study found that teachers were only slightly
satisfied in the job factors of working conditions, the work environment,
6
security, recognition, the work content and supervision.
It is argued that effective leadership has a positive influence on the
performance of teachers. (Charlton, 2000). Most school principals are not
effective in their leadership behavior because they treat teachers as tools
believing that teachers can be treated anyhow. In response to this, teachers do
not handle their work properly (Mwangi, 2013). In highly effective schools
which have reversed a trend of poor performance and declining achievement,
the principal sets the pace leading and motivating pupils and staff to perform
to their highest potential (Bush and Oduor, 2006). It is therefore not
surprising that there is pressure mounted by stakeholders on effective
leadership among principals in Kenya which increases job satisfaction among
teachers in public secondary schools, with particular attention to public
secondary schools in Kiambu, sub-county. The relationship between
principals leadership style and teachers job satisfaction has been a subject of
controversy by many researchers (Adeyemi, 2006). The controversy has been
centered whether or not the style of leadership of principals influence job
satisfaction among teachers which is subject of the study.
Following the release of K.C.S.E. results 2014, many principals have been
transferred and deployed to other schools in Kiambu County. Specifically
three principals from Kiambu-Sub-County have been redeployed owing to
poor leadership in their respective schools (T.S.C Staffing Office, Kiambu
Sub-.20 County 2015).Therefore there is need to carry out the study on the
influence of principals‟ leadership styles on teachers‟ levels of job

7
satisfaction which may be having a negative impact on school effectiveness.
1.2 Statement of the Problem
In the recent past, there has been a widespread teacher‟s turnover in
secondary school in Kiambu sub-county despite the fact that Kiambu sub-
county is highly developed and productive area. Statistics at Kiambu
Teachers Service Commission unit showed that the rate of teachers‟ turnover
rose from 12 percent in 2011 to 15 percent in 2012. In 2013, teacher‟s
turnover rose to 20 percent thus portraying a worrying trend. According to
Armstrong (2009) high turnover is a mark of low level of job satisfaction.
The area environment is conducive for working and not the reason for the
high turnover and therefore there is need to carry out the study on influence
of principals‟ leadership styles on teachers‟ job satisfaction in public
secondary schools in Kiambu sub-county.
1.3 Purpose of the Study
The purpose of this study was to investigate the influence of principals‟
leadership styles on teachers‟ job satisfaction in public secondary schools in
Kiambu Sub-County.
1.4 Objectives of the Study
i. To establish how democratic leadership style influence teachers job
satisfaction in public secondary schools in Kiambu Sub-County.
ii. To examine the influence of autocratic leadership style on teachers‟ job
satisfaction in public secondary schools in Kiambu Sub-County.

8
iii. To determine how laissez-faire leadership style influence teachers job
satisfaction in public secondary schools in Kiambu Sub-County.
iv. To establish how transformational leadership style influence teachers job
satisfaction in public secondary schools in Kiambu Sub-County.
1.5 Research Questions
i. How does democratic style of leadership influence teachers‟ job
satisfaction in public secondary schools teachers in Kiambu County?
ii. How does autocratic leadership style influence teachers‟ job satisfaction
in public secondary schools in Kiambu Sub-County?
iii. How does laissez-faire leadership style influence teachers‟ job
satisfaction in public secondary schools in Kiambu Sub-County?
iv. How does transformational leadership style influence teachers‟ job
satisfaction in public secondary schools in Kiambu Sub-County?
1.6 Significance of the Study
The research findings from this study could assist in making school principals
more cognizant of their own leadership ability and style and assist them in
developing their own leadership capacity to support teachers in adequately
managing the increased demands placed on them thus improving levels of
teacher job satisfaction. The findings may also help Teachers Service
Commission to improve terms and working conditions of the teachers in
order to increase teachers‟ levels of job satisfaction. It may also be useful to
Kenya Educational Management Institute (KEMI) as they train schools

9
managers on the leadership styles suited for schools. The study may help
other researchers in this area in identifying the areas that require further
research so as to fill the information gap and also to add to the pool of
currently existing knowledge.
1.7 Limitations of the Study
According to Best ad Kahn (1998), limitations are conditions beyond the
control of the researcher that may place restrictions on the conclusions of the
study and their applications to other situations. This includes cases of
exaggerated feedback or outright mis-information; it was difficult for the
researcher to control the attitude of the respondents as they respond to the
questionnaire. However, the respondents were assured of the confidentiality
of their identities.

10
1.8 Delimitations of the Study
These are boundaries of the study (Best & Kahn, 1998). The study was
carried out in Kiambu Sub-County only on sampled public schools. Although
there are other workers in the school, only teachers and principals provided
information. The study excluded teachers from private schools because they
have different management systems from public schools.
1.9 Basic Assumption of the Study
The study was based on the following assumptions
ii. That the respondents had the information the researcher was seeking and
provided the researcher with honest information.
iii. The respondents gave true information which was free from any external
influence.
iv. That the prospective respondents would cooperate with research team.
1.10 Definitions of Significant Terms
The following are the definitions of significant terms:
Autocratic leadership refers to giving full empowerment to the leaders with
minimal participation from the follower.
Democratic leadership refers to a situation where there is equal work among
leaders and followers.
11
Job satisfaction refers to how people feel about their jobs and different
aspects of their jobs.
Leadership style refers to the perceived behavior that a person exhibits when
attempting to influence the activities of others.
Laissez-faire-leadership refers to a leadership style in which leaders are
hands-off and allow group members to make decisions.
Principal refers to the chief executive of schools and may be called the head
teacher.
Public secondary schools refer to four years post primary school which is
developed equipped and provided with staff out of public funds by the
government and parents.
Teacher attrition refers to a component of teacher turn over in which
teachers exit the teaching profession altogether due to natural event such as
retirement death and/or resignations.
Transformational leadership refers to leaders that do support or emphasize
empowerment within their teachers.
1.11 Organization of the Study
The study comprises of five chapters. Chapter one contains background
information of the study, the statement of the problem, purpose of the study,
objectives of the study, research questions, significance of the study,
delimitations of the study, assumptions of the study, definitions of key terms

12
and organization of the study. Chapter two contains review of related
literature, leadership and job satisfaction, how democratic leadership style
influences teachers‟ job satisfaction, how autocratic leadership style
influences teachers job satisfaction, how laissez faire leadership style
influences teachers job satisfaction, how transformational leadership style
influences teachers job satisfaction. It also contains theoretical framework
and conceptual framework. Chapter three highlights methodology of the
study. This include research design, target population, sample size and
sampling procedure, research instruments, validity and reliability of research
instruments, data collection procedure, data analysis and ethical
considerations. Chapter four consists of data analysis, presentation and
interpretation. Chapter five consists of summary of the study, conclusions and
suggestions of further research.

13
CHAPTER TWO
LITERATURE REVIEW
2.1 Introduction
This chapter presents some of the research studies and review that have been
carried out on worker‟s attitudes towards work depending on the environment
which they are subjected to. The literature review pays attention to how
democratic leadership style, autocratic leadership style, laissez faire leadership
style and transformational leadership style influences teachers job satisfaction. It
also presents theoretical and conceptual frameworks.
2.2 Leadership and Job Satisfaction
A study carried out by Richards (2003) examines long-term teacher/principals
relationship and job satisfaction. Teachers who have worked for long periods of
time with the same principal tend to be able to work closely with that principal.
The teachers come to feel comfortable with their principal and her/his leadership
style, and this long-term interaction can improve the level of satisfaction for the
teachers and principal.
Heller (1993), take conflicting view point. He discusses a situation where the
leadership between a principal‟s leadership style and teacher‟s job satisfaction
may not be as much of a factor in a school setting. In some cases, when teachers
are least satisfied with the financial aspect of teaching and the most satisfied with
their co-workers, Heller (1993), did not find that job satisfaction was related to

14
the principals leadership style. Instead, teachers job satisfaction was related to
principals overall friendliness, warmth, support and rapport with the teachers. Job
satisfaction was also dependent on the individual followers‟ personality traits.
This coincides with Hersey and Blahcard‟s (1988) research stating that the theory
of leadership should be based on specific situations and on follower
characteristics, not on an overall style. Unfortunately, this research did not
include an overview of autocratic and transformational leadership styles in their
studies.
Autocratic leadership leads to lower levels of job satisfaction, while democratic
leadership leads to higher level of job satisfaction (Ajuoga, 2000). The level of
job satisfaction under laissez faire is also less than under democratic leadership
(Bass, 1990). Extensive research supports the claim that job satisfaction is
positively related to participative decision making and to transformational
leadership (Maeroff, 1988, Ross miller, 1992).
2.3 Democratic Leadership Style and Teachers Job Satisfaction
Decentralization of authority, participatory planning and mutual communication
are some of the main features of democratic leadership. However, as Oyetunyi,
(2006) points out, the major point is sharing; the manager shares decision making
with the subordinates. He/she invites contributions from the subordinates before
making a decision, but retains the final authority to make decisions
(consultative).The principal may seek discussion and agreement with teachers
over an issue before a decision is taken by consensus or may allow teachers to

15
take a vote on an issue before a decision is taken. Using this style is not a sign of
weakness; rather it is a sign of strength that one respects the employee‟s ways of
thinking. However, the concern expressed by Dubrin (1998) is that participate
style of leadership wastes time due to endless meetings and may lead to
confusion and lack of direction, therefore not appropriate for use in times of
crisis when the situations demands on the spot decision (Oyetunyi, 2006).
Savery (1994) found that democratic leadership style related positively to
employees job satisfaction and commitment in federal organizational in Western
Australia, while in contrast, Rad & Yarmohammadiann (2006) found no
relationship between leadership behaviour and employees job satisfaction in
Isfahan University Hospital in Iran, where participative leadership style was
prevalent. Morris (2003) and Spector (1997) carried out a study on local
authorities employees in Britain and found that employees were likely to be
satisfied by their ability to harness and input into work planning, opportunity to
show initiative, ability to have a say in management decisions, a feeling that their
local authority kept them well informed and that any change was well
communicated to them on time. Most studies (Okumbe, 1992; Njue, 2003;
Musila, 2010) attribute teacher‟s job satisfaction to the school Principal‟s
leadership styles. In a study carried out by Njue (2003) on job satisfaction among
secondary school teachers in Nairobi province, teachers were found to be highly
demotivated by the job factors including work environment and working
conditions.

16
2.4 Autocratic Leadership and Teachers Job Satisfaction
Autocratic leadership refers to a system that gives full empowerment to the
leaders with minimal participation from the followers. Yuki (1994) found that
autocratic leaders tend to have the following five characteristics; they do not
consult members of the organization in the decision making process, the leader
set all policies, the leader predetermine the methods of work, the leader
determine the duties of the followers, and the leader specifies technical and
performance evaluations standards. In this case the teacher has a feeling that
he/she is not appreciated thus losing job satisfaction. In an open climate, when
principals are perceived as democratic managers who maintain open channels of
communication with the staff, teachers would be more satisfied with their job as
compared to schools where principal exhibit a harsh and authoritative attitude
(Kottkamp, Mulhern & Hoy, 1987).
Autocratic leaders create a situation where subordinates who do not want to
realize the importance of work are forcefully led to work (Mullins, 2002).
According to Mullins (2002), autocratic leaders supervise subordinates very
closely to ensure compliance and completion of work in the designated time.
Leadership is meant to be effective even where the situation seem harsh so as to
drive organizational intentions towards goal achievement. Research findings by
Kasule (2007) on the effect of leadership styles on teacher productivity in private
secondary schools in Wakiso District indicate that autocratic leaders usually

17
emphasize „authority‟ as a means of having the work done. Principals generally
emphasize it, since it reaps results very quickly as subordinates work under
pressure to meet deadlines. Another study by Storey (1993), however, noted that
head teachers, who use authority to get things done, are too strict in the formality
by which things are done. This hinders teacher creativity especially in instances
where creativity and planning are imperative to anchor academic programmes in
schools. Autocratic leadership leads to lower levels of job satisfaction, while
democratic leadership leads to higher level of job satisfaction (Ajuoga, 2000).
2.5 Laissez- Faire Leadership and Teacher’s Job-Satisfaction
Laissez- Faire leadership is defined by Kornmaz (2007) as being a style of
leadership where leaders refuse to make decisions, are not available when
needed, and choose to take no responsibility for their lack of leadership ability.
Bass (2003) label the laissez-faire leader as not clarifying goals and standards
that the followers must achieve or basically having no expectations for the
followers in the organization. Laissez-faire leadership may occur due to the
avoidance of leadership behavior altogether, which enables the followers to
ignore assignments and expectations. The laissez-faire leader exudes an attitude
of indifference as well as non-leadership approach towards the followers and
their performance.
According to Korkmaz (2007) this leadership style actually decreases the
commitment levels of teacher to stay at a particular school. Bass & Avolio (1995)
also asserted that there is no transaction or transformation of any kind with the
follower because laissez-faire leaders do nothing to affect either the followers or

18
their behaviors. However laissez-faire style is described by Zerras & Lassiter
(2007) as most effective style especially where followers are mature and highly
motivated.
In a study examining the effectiveness of laissez-faire and the degree of
employee satisfaction with the leadership style in the public banking sector,
Siranathan (2002) found that laissez-faire leadership was highly and positively
correlated with extra effort, effectiveness and satisfaction. Contingent rewards
were also positively related to the outcome measures but less than to the
transformational scale ratings. However, management by exception (Active and
passive) and laissez faire were strongly and negatively correlated with the
outcome. Furthermore, Erkutlu and Chafra (2006) found that laissez-faire
leadership style in a boutique hotel led to negative results in organizational
performance such as low satisfaction, high stress, and low commitment by
followers.
Karugu (1980) conducted a study of the relationship between laissez faire
leadership style and job satisfaction by teacher co-ordinators. This study was
conducted in Michigan public schools. This study used the leader behavior
description questionnaire (LBDQ) and the job satisfaction questionnaire (JSQ) to
determine the link between leadership process and job satisfaction. The study
found a significant negative attitude between the style and job satisfaction. There
were non-significant leadership perceptions of vocational education
administrators and teacher co-ordinators.

19
2.6 Transformational Leadership Style and Teacher Job Satisfaction
Bass (1985) categorize the revised model of transformational leadership into four
qualities; idealized influence, inspirational motivation, individual consideration
and intellectual stimulation. With respect to educational leadership
transformational leader ultimately effect change through a bottom up approach
and several studies conclude that they have positive influence regarding teacher
perceptions of the school wide working environment, organizational change, and
student learning (Hallinger, 2003). Transformational leaders must provide
accommodating leadership and offer guidance to followers in order to help them
adopt to the ever-changing world of education (Bass, Avolio, Jung, Berson,
2003). Marks and Printy (2003) proposed that scholars of education are
proponents of transformational leadership because of its focus on identification
and solution of the problem as well as increased collaboration among
stakeholders with the goal of improvement of the organization. They must
influence stakeholders by encouraging teachers to take part in the collaborative
process of making shared decision. A research done by Masood (2006) examined
the perspectives of teachers and found substantial evidence of a positive
correlation with regard to principal influence and the job satisfaction of teachers,
their willingness to follow the principal and positive perceptions of their
principals‟ effectiveness.
Critics of the transformational leadership theory, however, argue that there is
little or no instructional focus (Marks and Printy, 2003), which does not give the

20
principal the necessary tools to actively lead issues regarding curriculum,
instruction and assessment. For that reason, many critics contend that
instructional leadership is actually far superior when compared to
transformational leadership (Robinson, Kannapel, Cilijarati, William &
Oettinger, 2008). Additionally few research studies identify which specific
behaviors of the school principal are associated with transformational leadership.
Bogler (2001) examined transformational leadership and teacher job satisfaction
in several schools in Israel and discovered that a positive relationship existed
between the transformational leadership style of the school principal and job
satisfaction of teachers. Nguni (2006) also examined the effects of
transformational leadership style of the school principal and job satisfaction
among teachers in Tanzania and discovered that transformational leadership
characteristics of the principal do indeed positively affect job satisfaction levels
of teachers. Similarly, Kormaz (2007) examined several school variables from a
sample of high school teachers in Turkey. The results from this study indicate
that teachers who perceived their principals as a transformational leader
experienced higher levels of job satisfaction.
2.7 Summary of Literature Review
A number of studies have been presented in this chapter on job satisfaction. For
example Karugu (1980), Hall (1999), Ngalyuka (1985), Okemwa (2004); and
Ngumi (2003), concur that teachers stay on the job if physical, social and a

21
security dimensions associated with conditions of work were satisfactory. Mutie
(1993) found that teachers are only marginally satisfied with their jobs which
agree with Mwangi (2005) who found tutors in Kenya Teacher Training College
(KTTC) were not satisfied with their job. The study was however conducted in
teachers training college among tutors. Okemwa (2004) established that majority
of teachers in Borabu Division of Kisii County, were moderately satisfied with
their job and that teachers‟ age, teaching subject orientation, and teaching
experience each significantly and uniquely determined job satisfaction among
teachers. These studies were carried out in other areas and concentrated on
demographic variables and not on leadership styles hence this study will establish
how leadership styles influence teachers‟ job satisfaction in Kiambu sub-county.
2.8 Theoretical Framework
The study was be guided by Herzberg two factor theory by Fredrick Herzberg
(cited in Okumbe 2007). The theory states that job satisfaction and job
dissatisfaction are caused by different and independent set of factors, the
motivators and the hygiene factors. Herzberg found that the factors causing job
satisfaction (and presumably motivation) were different from those causing job
dissatisfaction. He developed the motivation-hygiene theory to explain these
results. He called the satisfiers motivators and the dissatisfiers hygiene factors,
using the term “hygiene” in the sense that they are considered maintenance
factors that are necessary to avoid dissatisfaction but that by themselves do not
provide satisfaction. Motivators at the work place, according to Herzberg,

22
Schultz, Bagrain, Potgieter, Viedge and Werner, (2003), are level of recognition,
pleasure of performance, increased responsibility and opportunities for
advancement and promotion.
These hygiene factors include level of supervision, job status, work
circumstances, service conditions, remuneration and interpersonal relationships
(Herzberg in Hoy & Miskel, 1996). The two- factor theory is significant in that
both motivators and hygiene factors play a role in the performance of the
individual. Herzberg theory is related to this study in that just as in any
organization, teacher‟s job satisfaction will be determined by internal factors in
the school environment which include the principals‟ leadership style. Different
leadership styles used by the principals will elicit different levels of job
satisfaction among the teachers.

23
2.9 Conceptual Framework
The conceptual framework for this study is presented in the figure 2.1
Figure 2. 1: Conceptual Framework
The conceptual framework shows the relationship between the principals
leadership styles and teachers job satisfaction. The framework shows how
different leadership styles will have different effects on teachers‟ job satisfaction.
The leadership styles are in play when the principals manages teachers welfare
which either leads to high or low teachers job satisfaction.
Democratic
Leadership
High Job
Satisfaction
Administrative
Process
Autocratic
Leadership
Laissez Faire
Leadership
Transformational
Leadership
High Job
Satisfaction
Low Job
Satisfaction
Low Job
Satisfaction

24
CHAPTER THREE
RESEARCH METHODOLOGY
3.1 Introduction
This chapter covers: research design, target population, sample size and sampling
procedure, research instruments, validity of the research instruments, reliability
of the research instruments, data collection procedures, data analysis techniques
and ethical considerations.
3.2 Research Design
According to Ngechu (2001), a research design is a plan showing how problems
under investigation are solved. The study was carried out using descriptive
survey design. Descriptive survey design is one that allows a researcher to collect
information through interviewing or administering a questionnaire to a
representative sample drawn from the target population (Orodho, 2009). The
design was chosen because through it, the researcher was able to collect and
analyze data as it exists in the field without manipulating any variables (Mugenda
& Mugenda, 2003). The researcher was able to collect data in order to answer
questions concerning the current status of the subjects of the study and assess
attitudes and opinions about events, individuals or procedures (Gay, 1993).

25
3.3 Target Population
Orodho (2004) defines population as all the items or people under consideration
for this study. The target population consisted of all teachers and principals in all
the 28 public secondary schools in Kiambu Sub County (Kiambu Sub County
Education Office, 2015). The choice of teachers and principals was based on the
fact that the variables under investigation were particular to them and no other
party could provide this information. The study comprised of a target population
of 28 principals and 427 teachers of public secondary school in Kiambu Sub-
County.
3.4 Sample Size and Sampling Procedure
Sampling is the process of selecting a subset of cases in order to draw
conclusions about the entire set (Orodho, 2004). Wiersma (1995) described a
sample as a small population of the target population selected systematically for
the study. Sampling is important because one can learn something about a large
group by studying a few of its members thus saving time and money. To
determine the sample size the researcher adapted the recommendation of 10 to
30% of the universe which is seen as representative and can be generalized to the
population Mugenda & Mugenda (2003).The researcher used the higher limit of
30% of the population. The sample was therefore comprised of the 11 principals
of the sampled schools which is 30 percent of the 28 schools and 128 teachers
which is 30 percent of the total population of 427 teachers. Stratified sampling
was used to identify the sample schools. The schools were grouped into three
strata depending on whether they are day or boarding schools, that is, mixed day

26
schools and girl‟s boarding schools or boy‟s boarding schools. Proportional
allocation of teachers and principals using 30 percent per school category was
used to select teachers and principals from each secondary school in the area.
In order to identify specific teachers and principals to be included in the study,
the researcher used simple random sampling. In selecting of principals from each
category, the researcher wrote down all the names of the schools in each school
category on pieces of paper and randomly selected 11 principals from 6 mixed
schools, 3 from girls boarding and 2 from boys boarding. In selecting the
teachers the researcher wrote small pieces of papers bearing „Yes‟ equal to the
required sample size and „No‟ for other teachers. The papers were then folded
and placed in a bowl. Then each teacher was kindly requested to randomly pick
one paper. Those with „YES‟ papers made the sample for the study.
Table 3. 1: Proportional Sample Size of Teachers per School
School No. of No. of Sample size Total
category Schools teachers (n) per category 30% of n
Mixed day 6 178 12 54
schools
Girls boarding 3 158 21 47
schools
Boys 2 91 18 27
boarding
schools
Total 11 427 71 128

27
3.5 Research Instruments
The tool for data collection was a structured questionnaire. A questionnaire is a
research instrument that gathers data over a large sample (Kombo & Tromp,
2006). Questionnaires were used to gather information and data from the 24
respondents /teachers and principals from various schools. Questionnaires are
ideal for survey study Mugenda & Mugenda (2003) and are widely used in
education to obtain information about current conditions and practices and to
make enquiries about attitudes and opinions quickly and in precise form. The
principals and teachers questionnaires had two parts. Part one dealt with
demographic information of the respondents while part two dealt with items on
leadership styles and job satisfaction.
3.6 Validity of the Instruments
Validity means ascertaining the accuracy of the instruments by establishing
whether the instruments focus on the information they are intended to collect.
Borg and Gall (1989) point out that there are four main types of validity that is,
content validity, predictive validity, concurrent validity and construct validity.
Content validity is the degree to which the sample of an instrument represents the
content that the instrument is designed to measure. Content validity was ensured
through a systematic examination of the items in the questionnaire to ensure that
all the variables were well addressed. The expertise of the two supervisors was
also sought for additional input. A pilot study was conducted to discard
inappropriate question items. The pilot data was analyzed and the results used to

28
modify and improve the questionnaire before rolling it out to the sampled
population.
3.7 Reliability of the Instruments
Mugenda & Mugenda (2003) defines reliability as a measure of the degree to
which a research instrument yields consistent results or data after repeated tests
when administered a number of times. To enhance the reliability of the
instruments a pilot study was conducted. The researcher used test re test method
where the instrument was administered to the respondents, the researcher then
analyzed the results and after two weeks the instruments were administered. The
aim of pre-testing was to gauge the clarity and relevance of the instrument items
so that those items found to be inadequate for measuring variables were
discarded while some were modified to improve the quality of the research
instruments. This ensured that the instrument captured all the required data.
Pearson‟s product moment correlation coefficient formula was used to establish
the coefficient of 0.81.
r = NΣxy – (Σx) (ΣY)
NΣ(x)2
– (Σx)2 (NΣ(x)
2 –ΣY
2
According to Mugenda and Mugenda (2003) a co efficient of 0.70 or more shows
that there is high reliability of data and may be used to determine the reliability
of the instrument.

29
3.8 Data Collection Procedures
The researcher sought a research permit from National Commission for Science
and Technology and Innovation (NACOSTI). The researcher then proceeded to
report to the Kiambu Sub-County director of education and thereafter wrote
letters to the principals to be allowed to do the study. The researcher then visited
the selected schools, created rapport with the respondents, explained the purpose
of the study and then administered the questionnaires. The respondents were
assured about the confidentiality of their identities. The questionnaires were
administered and collected immediately after they were filled in.
3.9 Data Analysis Techniques
Kombo & Tromp (2006) define data analysis as the interpretation of collected
raw data into useful information. The researcher first checked on the data
collected for completeness. The data was then categorized and coded for easy
processing. All the data was entered into and analyzed by the Statistical Package
for the Social Science (SPSS).Prior to statistical analysis, data cleaning and
handling of missing values was performed and typing errors corrected. Pearson
moment correlation coefficient was used to determine the relationships between
principals leadership styles/autocratic, democratic, laissez faire and
transformational and teachers job satisfaction. Quantitative data was analyzed
using descriptive statistics. Descriptive statistics are indices that describe a given
sample, for example, measures of central tendency and measures of dispersion. In
this study, mean and standard deviation were used to compute quantitative
analysis.

30
In this case the quantitative data was presented in the form of frequency tables,
pie charts, percentages and bar graphs.
3.10 Ethical Considerations
Since the research involved human beings the researcher ensured that ethical
requirements were upheld in the study. The researcher informed and explained to
the respondents the purpose of the study in which they were asked to participate
and the benefits expected from the study. The researcher requested the
respondents to answer the questionnaires on their own free will. The respondents
were also asked not to write their names or that of the school on the
questionnaires.

31
CHAPTER FOUR
DATA ANALYSIS, PRESENTATION AND INTERPRETATION
4.1 Introduction
This chapter presents data analysis, presentation and interpretation. The purpose
of this study was to investigate the influence of principals‟ leadership styles on
teachers‟ job satisfaction in public secondary schools in Kiambu Sub-County
Kenya. The data was analyzed using SPSS where frequencies and percentages
guided the researcher to interpret the data. The chapter is divided into sections
based on the research questionnaires. This included, to establish how
democratic leadership style influence teachers job satisfaction in public
secondary schools in Kiambu Sub-County. To examine the influence of
autocratic leadership style on teachers‟ job satisfaction in public secondary
schools in Kiambu Sub-County. To determine how laissez-faire leadership style
influence teachers job satisfaction in public secondary schools in Kiambu Sub-
County. To establish how transformational leadership style influence teachers
job satisfaction in public secondary schools in Kiambu Sub-County.
4.2 Questionnaire Return Rate
Table 4. 1: Questionnaire Return Rate
Return Rate Sample Size Response Return Rate (%)
Head teachers 11 11 100
Teachers 128 80 62.5

32
4.3 Demographic Information
The distribution of principals and teachers on gender was presented by Figure 4.1
Figure 4. 1: Distribution by Gender
Figure 4.1 presents distribution of teachers and principals by gender where most
teachers were female and most principals were female. This is an indication that
school teaching in Kiambu sub-county is dominated by women. It‟s important
to note that the gender ratio as per government regulations has been achieved.
This should be evident in the quality of decisions made and the leadership
regimes adopted among schools in Kiambu sub-county.
The distribution of principals and teachers responses on age were presented on
table 4.2

33
Table 4. 2: Distribution by Age
Teachers Age Bracket Principals
Frequency Valid
Percent
Frequency Valid
Percent
Below 25 years 2 2.5 - -
26-36 years 41 51.3 - -
36-45 years 3 3.8 5 45.5
Over 45 years 34 42.5 6 54.6
Total 80 100 11 100
On distribution by age majority of the principals were aged over 45 years as
shown on table 4.2 while majority of teachers were clustered around 26-36
years. Majority of teachers were between the age of 26 to 36 years. This
indicates that the principals were purposely selected from older teachers with a
lot of experience as shown in table 4.2.

34
The distribution of teachers and principals by professional qualification was
presented in figure 4.2.
Figure 4. 2: Distribution of Teachers by Professional Qualification
Figure 4.2 shows majority of teachers had degrees in education B.Ed academic
qualification. This implies that the schools had highly qualified teachers.
Table 4. 3: Principals Highest Academic/Professional Qualification
Frequency Valid Percentage
B.Ed 8 72.7
B.Sc with PGDE 3 27.3
Total 11 100
For principals academic and professional qualification all had bachelor‟s degree
in qualification with most of them having bachelor of education while a few had
bachelors of sciences with a post graduate diploma in education as presented in
table 4.3.

35
The distribution of teachers and principals in terms of experience was presented
by table 4.4.
Table 4. 4: Distribution of Teachers by Experience at Present School
Frequency Valid
Percentage
Less than 2 years 26 32.5
Three - five years 7 8.7
Six - ten years 47 58.8
Total 80 100
Table 4.4 presents teachers experience at current school where majority had 6 to
10 years of experience. This implies that teachers had stayed long in the same
school.
Table 4. 5: Principals Distribution by Teaching Experience
Frequency Valid Percentage
11-15 years 3 27.3
16-20 years 3 27.3
Twenty years and above 5 45.5
Total 11 100

36
The study sought to find out the principals level of teaching experience where
majority had over 20 years of teaching experience.
Table 4. 6: Distribution of Teachers by Responsibility in School
Frequency Valid
Percentage
Class teacher 31 38.75
Games teacher 2 2.5
Senior teacher 33 41.25
Deputy principal 14 17.5
Total 80 100
Concerning teachers‟ responsibility in school most teachers were senior
teachers and class teachers as presented in table 4.6.
Table 4. 7: Category of Schools Involved in the Study
Frequency Valid Percentage
County mixed day 4 36.4
County girls day 1 9.1
County girls boarding 2 18.2
County boys boarding 1 9.1
Extra county boys boarding 3 27.3
Total 11 100.0

37
Table 4.7 presents categories of schools involved in the study where most
schools visited were boarding schools.
4.4 Leadership Behaviors
The leadership styles / behaviors used in this study were categorized as
democratic, autocratic, laissez faire and transformational and their influence on
teachers‟ job satisfaction was presented below.
4.4.1 Democratic Leadership and Teachers Job Satisfaction
This study sought to establish the influence of democratic leadership styles on
teachers‟ job satisfaction in public secondary schools in Kiambu sub-county,
Kenya. In order to achieve this, the study used a likert scale as follows; 1-
Always, 2- Often, 3-Occassionally, 4 Seldom, 5 Never. These enabled the
tabulation and interpretation of the responses from the research instrument. The
main statistics derived are mean, and standard deviation. The mean illustrated
the extent to which the respondents agreed or disagreed with the statements put
forth. The mean ranges between 1 to 5 where, if the mean is closer to one, it
means strong agreement with the variable, while the lower the standard
deviation the more the consensus on the level of agreement. Where 1 is
Always and 5 is never. This is well elaborated in the table and narratives below
which show the respondents and the statistics.

38
Table 4. 8: Principals Response on Democratic Leadership Styles
Mean
Standard
Deviation
I am friendly and easy to dialogue with. 1.73 0.47
I am a good listener to your group despite holding
divergent opinion with them in discussion. 1.36 0.50
I show understanding of staff view point though
holding divergent view point with them.
1.91 0.70
I patiently encourage staff to frankly express fully
viewpoints.
1.91 0.70
I express confidence in staff members regardless
disagreeing with them.
2.18 0.75
I genuinely share information with staff members. 2.27 0.79
I encourage the members of staff to openly express
their feelings.
1.82 0.87
I give room to group members to present their view
points before stating my stand. 2.09 0.94
Table 4.8 presents principals response on democratic leadership style where
majority of the principals often show understanding of staff view point though
holding divergent view point with them with a mean of 1.91. They often
patiently encourage staff to frankly express fully their viewpoints with a mean
of 1.91 and often encourage the members of staff to openly express their
feelings with a mean of 1.82. The principals often express confidence in staff
members despite disagreeing with them with a mean of 2.18, and often give

39
room to group members to present their view points before stating their stand
with a mean of 2.09. This resonates with democratic leadership style that leads
to higher level of job satisfaction (Ajuoga, 2000).
Table 4. 9: Teachers Perception on Principals’ Democratic Style of
Leader ship
Mean
Standard
Deviation
Is friendly and easy to dialogue with 2.38 0.97
Is a good listener to the group 2.75 1.03
Shows understanding of teachers viewpoints though
holding divergent view point with them 2.90 1.00
Is patient and encourages staff to frankly and express
fully view points 2.84 1.07
Expresses confidence in staff members regardless
disagreeing with them 2.79 0.98
Genuinely shares information with staff members 2.73 0.98
Encourages staff members to openly express their
feelings 2.83
1.10
Table 4.9 illustrates teacher‟s perception on their principals‟ behavior where
majority of teachers agreed that their principals are often friendly and easy to
dialogue with a mean of 2.38 and a standard deviation of 0.97. They also agreed
that principals express confidence in staff members despite disagreeing with
them with a mean of 2.79 and genuinely shares information with staff members
with a mean of 2.73, with a good number of principals doing it occasionally. This
indicates that there is disparity in teachers‟ responses especially on whether the
40
principal is a good listener to the group, shows understanding of teachers‟
viewpoints, is patient and encourages staff to frankly and express fully view
points, and encourages staff members to openly express their feelings.
4.4.2 Autocratic Leadership Style and Teachers Job Satisfaction
This study sought to establish the influence of autocratic leadership style on
teachers‟ job satisfaction in public secondary schools in Kiambu sub-county,
Kenya. In order to achieve this, the study used a likert scale as follows; 1-
Always, 2- Often, 3-Occassionally, 4 Seldom, 5 Never. These enabled the
tabulation and interpretation of the responses from the research instrument. The
main statistics derived were mean and standard deviation. The mean illustrated
the extent to which the respondents agreed or disagreed with the statements put
forth. The mean ranges between 1 to 5 where, if the mean is closer to one,it
means strong agreement with the variable, while the lower the standard
deviation the more the consensus on the level of agreement. Where 1 is Always
and 5 is never. This is well elaborated in the table and narratives below which
show the respondents and the statistics.

41
Table 4. 10: Principals Response on Autocratic Leadership Style
Mean
Standard
Deviation
I expect the best from staff. 1.00 -
I expect high quality from self. 1.27 0.47
I initiate, direct goals for the staff. 1.27 0.47
I suppress new ideas from members of staff. 3.36 1.03
I pass the back to others for failure or mistakes for low
performance in school or stalled projects. 4.00 1.00
Table 4.10 presents the influence of autocratic leadership on teachers‟ job
satisfaction. Majority of principals indicated that they always expect the best
from staff with a mean of 1, and always expect high quality from themselves
with a mean of 1.27 and a standard deviation of 0.47. In contrast the principals
indicated that they always initiate direct goals for the staff with a mean of 1.27
and standard deviation of 0.47 which is autocratic in nature. Principals enforce
the vision and goals to the teachers to follow which is not democratic in nature
and occasionally suppress new ideas from members of staff. These findings are
similar to Masood (2006) who examined the perspectives of teachers and found
substantial evidence of a positive correlation with regard to principal influence
and the job satisfaction of teachers. The willingness to follow the principal leads
to positive perceptions of their principals‟ effectiveness.

42
Table 4. 11: Teachers Perception on Principals’ Autocratic Behavior
Mean
Standard
Deviation
Expects the very best from staff 1.50 0.84
Expect high quality work from members of
staff 1.95 1.04
Has high opinion over what staff does 2.48 0.93
Suppresses new ideas from members of staff 3.23 0.73
Blames failure or mistakes for low
performance
on staff
3.09 1.08
Table 4.11 illustrates teacher‟s perception on their principals‟ behavior where
the majority of teachers agreed that the principals always expect the very best
from staff with a mean of 1.50 and a standard deviation of 0.84. Majority
agreed that principals have high opinion over what staff does with a mean of
2.48 and a standard deviation of 0.93. However in contrast majority of teachers
indicated that the principals occasionally suppresses new ideas from members of
staff with a mean of 3.23 and occasionally blames failure or mistakes for low
performance on staff with a mean of 3.09. This indicates that the principals
practice some level of autocratic leadership by suppressing new ideas from
members of staff and occasionally blaming failure or mistakes for low
performance on staff which lowers teachers‟ job satisfaction.

43
4.4.3 Laissez Faire Leadership Style and Teachers’ Job Satisfaction
This study sought to establish the influence of Laissez faire leadership style on
teachers‟ job satisfaction in public secondary schools in Kiambu sub-county,
Kenya. In order to achieve this, the study used a likert scale as follows; 1-
Always, 2- Often, 3-Occassionally, 4 Seldom, 5 Never. These enabled the
tabulation and interpretation of the responses from the research instrument. The
main statistics derived were mean and standard deviation. The mean illustrated
the extent to which the respondents agreed or disagreed with the statements put
forth. The mean ranges between 1 to 5 where, if the mean is closer to one,it
means strong agreement with the variable, while the lower the standard
deviation the more the consensus on the level of agreement. Where 1 is Always
and 5 is never. This is well elaborated in the table and narratives below which
show the respondents and the statistics.

44
Table 4. 12: Principals Response on Laissez Faire Leadership Style
Mean
Standard
Deviation
I pay no attention to individual interest in their work
place
4.09 1.30
I am less concerned about group performance towards
attainment of schools goals
4.36 0.92
I am unconcerned with staff‟s welfare 3.6 1.6
I govern the group through non-intervention in what
they are doing
4.18 0.98
I do not supervise teachers in their teaching/learning
assignment
4.55 0.93
I avoid at all costs interfering with group‟s work 2.82 0.98
I enhance discipline owing to non-provision of structure
to staff in doing work
3.45 1.63
I have no belief in self and others attaining 4.64 0.92
My contribution in the staff serve as basis for
suggestions or questions
2.18 0.60
Table 4.12 presents principals response on laissez faire leadership style.
Majority of principals seldom are less concerned about group performance
towards attainment of schools goals with a mean of 4.36 and a standard
deviation of 0.92, they seldom govern the group through non-intervention in
what they are doing with a mean of 4.18 and standard deviation of 0.98. The
principals indicated that they supervise teachers in their teaching/learning
assignment with a mean of 4.55 and have belief in self and others attaining
goals with a mean of 4.64. However in contrast they occasionally avoid at all
45
costs interfering with group‟s work with a mean of 2.82 and also agreed that
contributions from the staff serve as basis for suggestions or questions with a
mean of 2.18 and a standard deviation of 0.60. This indicates that principals
rarely practice laissez faire leadership style as they are concerned about group
performance, govern the group through intervention, and they supervise
teachers in their teaching/learning assignment even though they occasionally
avoid at all costs interfering with group‟s work. Hence this concurs with
Korkmaz (2007) who stated that this leadership style actually decreases the
commitment levels of teachers to stay at a particular school. However in
contrast Zerras & Lassiter (2007) described laissez-faire as most effective style
especially where followers are mature and highly motivated.

46
Table 4. 13: Teachers Perception on Principal’s Laissez Faire Leadership
Style
Mean
Standard
Deviation
Pays attention to individuals interests in their work place
3.56 0.99
Is less concerned about group performance towards
attainment of school goals
3.91 1.03
Is unconcerned with staff welfare
3.47 1.28
Governs the group through non-intervention in what they
are doing
3.65 0.91
Does not supervise teachers in the teaching/learning
assignments
3.41 1.40
Avoids at all costs interfering with group's work
3.15 1.18
Has no belief in self and others attaining quality
performance towards attainment of school goals
3.66 1.19
Gives room to group members to present their view points
before stating a stand
2.70 1.13
Allows staff contributions/suggestions and further
questions
2.73 1.17
Table 4.13 illustrates teacher‟s perception on their principal‟s behavior where
majority of teachers indicated that principals seldom pay attention to
individual‟s interests in their work place with a mean of 3.56 and a standard
deviation 0.99. They seldom govern the group through non-intervention in what
they are doing with a mean of 3.65 and a standard deviation 0.91. However
teachers also indicated that principals occasionally gives room to group
members to present their view points before stating a stand with a mean of 2.70
47
and a standard deviation of 1.13 and allows staff contributions/suggestions and
further questions with a mean of 2.73 and a standard deviation of 1.17.
4.4.4 Transformational Leadership Style and Teachers Job Satisfaction
This study sought to establish the influence of transformational leadership style
on teachers‟ job satisfaction in public secondary schools in Kiambu sub-county,
Kenya. In order to achieve this, the study used a likert scale as follows; 1-
Always, 2- Often, 3-Occassionally, 4 Seldom, 5 Never. These enabled the
tabulation and interpretation of the responses from the research instrument. The
main statistics derived were mean and standard deviation. The mean illustrated
the extent to which the respondents agreed or disagreed with the statements put
forth. The mean ranges between 1 to 5 where, if the mean is closer to one,it
means strong agreement with the variable, while the lower the standard
deviation the more the consensus on the level of agreement. Where 1 is Always
and 5 is never. This is well elaborated in the table and narratives below which
show the respondents and the statistics.

48
Table 4. 14: Principals Responses on Transformational Leadership Style
Mean
Standard
Deviation
I have high opinion of what staff do 1.45 0.52
I give encouragement to members of staff to initiate new
and creative ideas to benefit school and the rest of staff
members
1.64 0.50
I am a risk taker (try new adventurous ideas in dealing
with situations)
1.45 0.52
I am open to criticism by members of staff 2.36 0.67
I treat everybody consistently 2.00 0.89
I accept I can error like any other staff members 1.73 0.65
I welcome staff to question matters related to school
affairs 2.00 0.77
I am patient with progress being made by the staff
towards goals attainment
1.73 0.47
I allow the staff members to take centre stage in
discussion in staff meetings and information meetings
2.00 0.63
I insist that staff members work through divergent point
of views with non-suppression of them
2.18 0.75
I use „we‟ or „our‟ and not „I‟ principals or my school,
staff 1.27 0.47
I am impartial to all members of staff 2.00 0.45
I acknowledge all members‟ efforts towards attainment
in school affairs
1.55 0.52
I readily accept even unwarranted blame or mistake in
the school
2.55 0.82
I allow staff to reach at a decision as a collective whole 1.91 0.70
I give opportunity to any staff member to make a
decision 1.82 0.60

49
Table 4.14 presents principals responses on transformational leadership where
majority indicated that they always give encouragement to members of staff to
initiate new and creative ideas to benefit school and the rest of staff members
with a mean of 1.64 and standard deviation of 0.50. Majority indicated that they
are risk takers (try new adventurous ideas in dealing with situations) with a
mean of 1.45 and a standard deviation of 0.52. Majority of principals strongly
agreed that they are patient with progress being made by the staff towards goals
attainment with a mean of 1.73 and a standard deviation of 0.47. In addition
majority indicated that they occasionally readily accept even unwarranted blame
or mistake in the school with a mean of 2.55 and a standard deviation of 0.82.
This indicates that principals in great extent practice transformational leadership
by giving encouragement to members of staff to initiate new and creative ideas
to benefit school and the rest of staff members and are risk takers (try new
adventurous ideas in dealing with situations).
This concurs with Bogler (2001) and Nguni (2006) who discovered that a
positive relationship existed between the transformational leadership style of the
school principal and job satisfaction of teachers. However in contrast
transformational leadership has been criticized by (Marks and Printy, 2003) who
argue there is little or no instructional focus, which does not give the principal
the necessary tools to actively lead issues regarding curriculum, instruction and
assessment and hence back instructional leadership over transformational
leadership.

50
Table 4. 15: Teachers Perception on Principals’ Transformational
Leadership
Mean
Standard
Deviation
Gives encouragement to members of staff to initiate new
and creative ideas to benefit school and the rest of staff
members. 2.35 0.96
Is a risk taker try new adventurous ideas in dealing with
situations. 2.73 1.24
Treats everybody consistently 2.65 0.92
Accepts that he/she can err like any other staff member 3.11 0.98
Welcomes staff to question matters related to school
affairs 3.00 1.01
Is patient with progress being made by the staff towards
goal attainment 2.83 0.87
Allows the staff members to take center stage in
discussions in staff meetings and informal meetings. 2.58 0.92
Insists that staff members work through divergent point of
views with non-suppression of them. 2.74 1.04
Uses 'the' 'our' and not 'I' principals or 'my.....school staff' 2.43 1.26
Is partial to all members of staff. 2.78 0.98
Acknowledge all members efforts towards attainment in
school affairs. 2.35 0.81
Readily accepts even unwanted blame for failure of
mistake in the school. 3.04 0.91
Allows staff to reach at a decision as a collective whole 2.65 1.09
Initiate, direct goals for the school. 2.23 0.89
Gives opportunity to any staff member to make a decision 2.88 1.11

51
Table 4.15 illustrates teachers‟ perceptions on principal‟s behavior. Majority of
teachers indicated that principals are occasionally patient with progress being
made by the staff towards goal attainment with a mean of 2.87 and occasionally
allows the staff members to take center stage in discussions in staff meetings
and informal meetings with a mean of 2.58. The teachers also indicated that
principal‟s often acknowledge all members efforts towards goal attainment in
school affairs with a mean of 2.35. In addition the principals often initiate and
direct goals for the school with a mean of 2.23. This indicates that the principals
utilise transformational leadership to a greater extent.
4.5 Teachers Job Satisfaction Survey
This study sought to establish the influence of principal‟s leadership styles on
teacher‟s job satisfaction in public secondary schools in Kiambu sub-county,
Kenya. In order to achieve this, the study used a likert scale as follows; 1-Very
satisfied, 2- Somewhat satisfied, 3-Undecided, 4 Dissatisfied, 5 Very
dissatisfied. This enabled the tabulation and interpretation of the responses from
the research instrument. The main statistics derived were mean and standard
deviation. The mean illustrated the extent to which the teachers were satisfied or
dissatisfied with the statements put forth. The mean ranges between 1 to 5 in
which case, when the mean is closer to one, it means very satisfied with the
variable, while the lower the standard deviation the more the consensus on the
level of satisfaction. This is well elaborated in the table and narratives below
which show the respondents and the statistics.

52
Table 4. 16: Teachers Working Conditions
Mean
Standard
Deviation
Amount of teaching load allocated to you per week 2.21 1.04
Availability of staff houses provided to you by the
school
3.10
1.35
Special services provided to you such as free lunch and
tea provided to you by the school 2.80 1.22
Extent to which you are provided with materials and
equipment 2.26 0.98
The pupil teacher ratio in classrooms in the school 2.73 1.17
Availability of transport facilities provided to you by
the school 3.95 1.18
The spelling out of your job description by the
principals
2.44 1.10
Table 4.16 illustrates the statements on working conditions as per the teachers in
the study.
With regard to working conditions, majority of the teachers reported that they
were somewhat satisfied with the amount of teaching load allocated to them per
week with a mean of 2.21. The standard deviation however shows a lot of
disparity in that there is a level of discontent with a standard deviation of 1.04.
Other variables such as special services provided by the school such as free
lunch and tea provided by the school with a mean 2.80; extent to which teachers
are provided with materials and equipment with a mean 2.26; the pupil teacher
ratio in classrooms in the school with a mean 2.73; and the spelling out of their
job description by the principals with a mean 2.44, caused some satisfaction to

53
the teachers. On availability of transport facilities provided by the school,
majority of teachers were dissatisfied with a mean of 3.95. This indicates that
working conditions are relatively good even though there was no consensus on
the level of satisfaction, with significant numbers admitting that they are
dissatisfied. This is in line with findings by Karugu (1980), Hall (1999),
Ngalyuka (1985), Okemwa (2004); and Ngumi (2003), who concurred that
teachers stay on the job if physical, social and a security dimensions associated
with conditions of work were satisfactory.
Table 4. 17: Teachers Pay and Promotion
Mean
Standard
Deviation
Salary 3.78 1.22
Opportunities for promotion 3.30 1.02
Benefits (health insurance, Life
insurance etc) 3.84 1.01
Job security 2.45 1.32
Recognition for work accomplished 3.01 1.32
Table 4.17 illustrates the statements on teachers‟ pay and promotion. The
teachers gave varied opinions on this question. As expected majority of teachers
were not satisfied with salary with a mean of 3.78 and benefits (health
insurance, Life insurance etc) with a mean of 3.84. There was high disparity and
undecided teachers on whether they were satisfied with recognition for work

54
accomplished with a mean of 3.01 and opportunities for promotion with a mean
of 3.30. However the teachers were somewhat satisfied with job security with a
mean of 2.45. This indicates that teachers were not happy with salary, benefits
and a significant number of teachers were not happy with recognition and
opportunities for promotion.
Table 4. 18: Teachers Working Relationships
Mean
Standard
Deviation
Relationship with other teachers 1.81 0.86
Relationship with the principals 2.29 0.90
Relationships with other subordinates 2.13 0.83
Use of skills and abilities 1.95 0.87
Opportunities to improve your skills and talents 2.34 1.07
Opportunity to learn new skills 2.43 1.16
Support for additional training and education 3.34 1.09
The extent to which teachers in your school are
recommended for further education and training 3.43 0.99
The information availed to you by the principals on
available training opportunities 3.29 1.15
The encouragement and assistance you receive from
your principals to participate in service course and
seminars related to your job 3.25 1.08
The willingness of the principals to assist you acquire
study leave 3.39 1.07
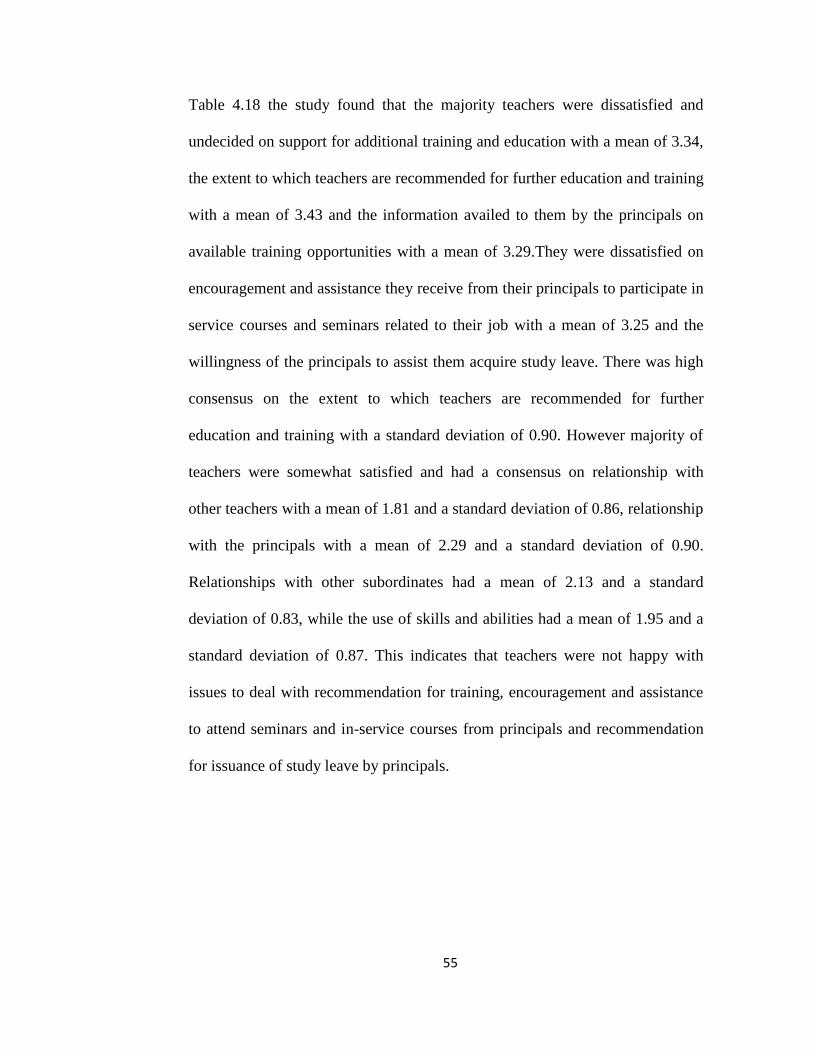
55
Table 4.18 the study found that the majority teachers were dissatisfied and
undecided on support for additional training and education with a mean of 3.34,
the extent to which teachers are recommended for further education and training
with a mean of 3.43 and the information availed to them by the principals on
available training opportunities with a mean of 3.29.They were dissatisfied on
encouragement and assistance they receive from their principals to participate in
service courses and seminars related to their job with a mean of 3.25 and the
willingness of the principals to assist them acquire study leave. There was high
consensus on the extent to which teachers are recommended for further
education and training with a standard deviation of 0.90. However majority of
teachers were somewhat satisfied and had a consensus on relationship with
other teachers with a mean of 1.81 and a standard deviation of 0.86, relationship
with the principals with a mean of 2.29 and a standard deviation of 0.90.
Relationships with other subordinates had a mean of 2.13 and a standard
deviation of 0.83, while the use of skills and abilities had a mean of 1.95 and a
standard deviation of 0.87. This indicates that teachers were not happy with
issues to deal with recommendation for training, encouragement and assistance
to attend seminars and in-service courses from principals and recommendation
for issuance of study leave by principals.

56
Table 4. 19: Teachers Recognition
Mean
Standard
Deviation
The way your job performance is acknowledged in the
school
2.96 1.17
The way your views are taken by the principals 2.83 0.99
Your involvement in decision making on matters
pertaining the school and teachers
2.91 1.06
Your involvement in choosing the kind of incentives to
be given in the school
3.24 1.07
The personal satisfaction that you derive from your
teaching job
2.30 1.31
The extent to which you are allowed to make job-
related decisions
2.71 1.24
The authority to you to carry out the job specified to
you
2.39 1.27
The level of challenge you attach to your job 2.59 1.11
Variety of job responsibilities 2.74 0.95
Table 4.19 presents teachers satisfaction on recognition.
Majority of teachers were somewhat satisfied and others undecided on the way
their views are taken by the principals with a mean of 2.83 and a standard
deviation of 0.99. They were also somewhat satisfied and undecided on variety
of job responsibilities with a mean of 2.74 and a standard deviation of 0.95. The
rest of the variables had little consensus reached upon by teachers and had a
disparity where majority of teachers were satisfied with the level of challenge
they attach to their job, the extent to which are allowed to make job-related

57
decisions and the personal satisfaction that they derive from their teaching job.
However the majority of teachers were dissatisfied with involvement in
choosing the kind of incentives to be given in the school with a mean of 3.24.
This indicates that most teachers were unsure about recognition. In addition
most were dissatisfied with level of involvement in choosing the kind of
incentives to be given in the school. These findings are in line with
transformational leadership proponents, who reckon that this leadership style
must provide accommodating views in leadership and offer guidance to
followers in order to help them adopt to the ever-changing world of education
(Bass, Avolio, Jung, Berson, 2003). Furthermore, Marks and Printy (2003)
proposed that scholars of education are proponents of transformational
leadership because of its focus on identification and solution of the problem as
well as increased collaboration among stakeholders with the goal of
improvement of the organization, in this case the schools.

58
Table 4. 20: Teachers Satisfaction on Administration and Supervision
Mean
Standard
Deviation
The type of feedback you receive from principals 2.70 1.06
The supervisory procedures used by the principals to
evaluate your work 2.68 1.05
The extent to which the principals allow you to
make independent decisions related to your work 2.54 1.19
Job performance appraisal practices employed to
principals 2.71 1.09
Degree of independence associated with your work
roles 2.28 0.94
Adequate opportunity for periodic changes in duties 2.99 1.02
Provision of chance to lead 2.68 1.12
Table 4.20 illustrates teachers‟ satisfaction with administration and supervision
where majority of teachers indicated that they are somewhat satisfied with
degree of independence associated with their work roles with a mean of 2.28
and a standard deviation of 0.94. Majority of teachers were satisfied with the
supervisory procedures used by the principals to evaluate their work with a
mean of 2.60. They were also satisfied with the extent to which the principals
allow them to make independent decisions related to their work with a mean of
2.54. They were undecided on adequate opportunity for periodic changes in
duties with a mean of 2.99. Half of the teachers were dissatisfied with job
performance appraisal practices employed to principals with a mean of 2.71 and

59
the type of feedback they receive from principals with a mean of 2.70. This
indicates that there were huge disparities with no consensus as regards to issues
relating to provision of chance to lead, and adequate opportunity for periodic
changes in duties. Other issues of concern to teachers include job appraisal
practices employed by principals and the feedback received from principals.
On supervision autocratic leaders have been known to create such situations
where subordinates who do not want to realize the importance of work are
forcefully led to work (Mullins, 2002). Mullins (2002), also found that
autocratic leaders supervise subordinates very closely to ensure compliance and
completion of work in the designated time. Leadership is meant to be effective
even where the situation seem harsh so as to drive organizational intentions
towards goal achievement. This findings contrast well with those of Karugu
(1980), Hall (1999), Ngalyuka (1985), Okemwa (2004); and Ngumi (2003),
who emphasized job nature, social and a security dimensions associated with
conditions of work
4.6 Correlations and Statistics
The study used person product moment correlation to investigate the effect of
independent variables on the dependents variable. The strength of the
relationship is indicated by the correlation coefficient: r and is measured by the
coefficient of determination: r2 the significance of the relationship is expressed
in probability levels: p (e.g., significant at p =.05). This tells how unlikely a

60
given correlation coefficient, r, will occur given that no relationship exist in the
population. Note that the smaller the p-level, the more significant the
relationship but the larger the correlation, the stronger the relationship.
Table 4. 21: Correlation of Democratic Leadership with Teachers’ Job
Satisfaction
Job
Satisfaction
Democratic
Leadership
Job satisfaction
Pearson
Correlation 1.00 .258
*
Sig. (1-
tailed) 0.01
N 80 80
Democratic leadership
Pearson
Correlation .258
* 1
Sig. (1-
tailed) 0.01
N 80 80
*. Correlation is significant at the 0.05 level (1-tailed).
Table 4.22 illustrates Pearson product moment correlation coefficient results for
the relationship between principals democratic leadership style and teachers job
satisfaction. From the table above the democratic leadership style positively
influence (0.26) teachers job satisfaction. This is because of democratic
leadership style highly involves teachers in decision making hence positively
influence their job satisfaction.

61
Table 4. 22: Correlation of Autocratic Leadership with Teachers’ Job
Satisfaction
Job Satisfaction Autocratic
Leader Ship
Job satisfaction
Pearson
Correlation 1 -0.039
Sig. (1-tailed)
0.365
N 80 80
Autocratic leader
ship
Pearson
Correlation -0.039 1
Sig. (1-tailed) 0.365
N 80 80
Table 4.22 illustrates Pearson product moment correlation coefficient results for
the relationship between principals autocratic leadership style and teachers job
satisfaction. From the table above the autocratic leadership style negatively
influence (-0.039) teachers job satisfaction. This is because autocratic leadership
styles are highly detested by teachers.

62
Table 4. 23: Correlation of Laissez Faire Leadership with Teachers’ Job
Satisfaction
Job Satisfaction Laissez Faire
Leadership
Job satisfaction
Pearson
Correlation 1 -0.044
Sig. (1-tailed)
0.349
N 80 79
Laissez faire
leadership
Pearson
Correlation -0.044 1
Sig. (1-tailed) 0.349
N 79 79
Table 4.23 illustrates Pearson product moment correlation coefficient results for
the relationship between principals laissez faire leadership style and teachers job
satisfaction. From the table above the laissez leadership style negatively
influence (--0.044) teachers job satisfaction. This is because laissez faire
decreases teachers commitment levels since the principal is showing less
concern or encouragement.

63
Table 4. 24: Correlation of Transformational Leadership with Teachers’
Job Satisfaction
Job
Satisfaction
Transformational
Leadership
Job satisfaction
Pearson
Correlation 1 .300
**
Sig. (1-
tailed) 0.003
N 80 80
Transformational
leadership
Pearson
Correlation .300
** 1
Sig. (1-
tailed) 0.003
N 80 80
**. Correlation is significant at the 0.01 level (1-tailed).
Table 4.24 illustrates Pearson product moment correlation coefficient results for
the relationship between principals transformational leadership style and
teachers job satisfaction. From the table above the laissez leadership style
positively influence (0.300) teachers job satisfaction. This is because
transformational leadership encourages involvement and creativity.
64
CHAPTER FIVE
SUMMARY, CONCLUSIONS AND RECOMMENDATIONS
5.1 Introduction
This chapter discusses the summary of the study, conclusions, recommendations
and suggestions for further study. The purpose of this study was to investigate
the influence of principals‟ leadership styles on teachers‟ job satisfaction in
public secondary schools in Kiambu Sub-County.
5.2 Summary of the Study
The objectives of the study included, to establish how democratic leadership
style influence teachers job satisfaction in public secondary schools in Kiambu
Sub-County. To examine the influence of autocratic leadership style on
teachers‟ job satisfaction in public secondary schools in Kiambu Sub-County.
To determine how laissez-faire leadership style influence teachers job
satisfaction in public secondary schools in Kiambu Sub-County. To establish
how transformational leadership style influence teachers job satisfaction in
public secondary schools in Kiambu Sub-County.
This study adopted the descriptive survey design where the target population for
this study was all 427 teachers and principals in all the 28 public secondary
schools in Kiambu Sub County. The study purposely sampled 11 principals
using simple random sampling and 128 teachers using stratified random

65
sampling from mixed day schools, girls‟ boarding schools and boys‟ boarding
schools.
To collect data, a set of structured questionnaires were used as an interview
guide. Before the actual data collection, piloting of questionnaires were done in
two secondary schools in Kiambu sub county. To establish the reliability of the
instrument, the researcher used the test-retest where the second test
administration was done one week after the first one. The researcher sought
authorization to conduct the research from the National Council of Science and
Technology and the District Commissioner Kiambu sub county. The study
generated both qualitative and quantitative data. Pearson moment correlation
coefficient was used to determine the relationships between principals leadership
styles/autocratic, democratic, laissez faire and transformational and teachers job
satisfaction. Quantitative data was analyzed using descriptive statistics. In this
study, mean and standard deviation were used to compute quantitative analysis.
In this case the quantitative data was presented in the form of frequency tables,
pie charts, percentages and bar graphs.
Findings on democratic leadership style shows that majority of the principals
indicated that they often show understanding of staff view point though holding
divergent view point with them with a mean of 1.91, they often patiently
encourage staff to frankly express fully viewpoints with a mean of 1.91 and
often encourage the members of staff to openly express their feelings with a
mean of 1.82. The principals often express confidence in staff members despite
disagreeing with them with a mean of 2.18, and often give room to group

66
members to present their view points before stating their stand with a mean of
2.09. On the other hand majority of teachers agreed that their principals often
are friendly and easy to dialogue with a mean of 2.38 and a standard deviation
of 0.97. They also agreed that principals genuinely shares information with
staff members with a mean of 2.73 though a good number of principals do it
occasionally.
On autocratic leadership majority of principals indicated that they always expect
the best from staff with a mean of 1, and always expect high quality from
themselves with a mean of 1.27 and a standard deviation of 0.47. In contrast the
principals indicated that they always initiate direct goals for the staff with a
mean of 1.27 and standard deviation of 0.47. On the other hand majority of
teachers agreed that the principals always expect the very best from staff with a
mean of 1.50 and a standard deviation of 0.84. Majority agreed that principals
have high opinion over what staff does with a mean of 2.48 and a standard
deviation of 0.93. However majority of teachers indicated that the principals
occasionally suppress new ideas from members of staff with a mean of 3.23 and
occasionally blames failure or mistakes for low performance on staff with a
mean of 3.09.
On laissez faire majority of principals rarely are less concerned about group
performance towards attainment of schools goals with a mean of 4.36 and a
standard deviation of 0.92. They rarely govern the group through non-
intervention in what they are doing with a mean of 4.18 and standard deviation
of 0.98. The principals indicated that they supervise teachers in their

67
teaching/learning assignment with a mean of 4.55 and have belief in self and
others attaining goals with a mean of 4.64. However in contrast they
occasionally avoid at all costs interfering with group‟s work with a mean of 2.82
and also agreed that contribution in the staff serve as basis for suggestions or
questions with a mean of 2.18 and a standard deviation of 0.60. On the other
hand majority of teachers indicated principals seldom pays attention to
individual‟s interests in their work place with a mean of 3.56 and a standard
deviation 0.99 and seldom governs the group through non-intervention in what
they are doing with a mean of 3.65 and a standard deviation 0.91. However
teachers also indicated that principals occasionally gives room to group
members to present their view points before stating a stand with a mean of 2.70
and a standard deviation of 1.13 and allows staff contributions/suggestions and
further questions with a mean of 2.73 and a standard deviation of 1.17.
Findings on transformational leadership style shows that majority of principals
indicated that they always give encouragement to members of staff to initiate
new and creative ideas to benefit school and the rest of staff members with a
mean of 1.64 and standard deviation of 0.50. Majority indicated that they are
risk takers (try new adventurous ideas in dealing with situations) with a mean of
1.45 and a standard deviation of 0.52. Majority of principals strongly agreed
that they are patient with progress being made by the staff towards goals
attainment with a mean of 1.73 and a standard deviation of 0.47. In addition
majority indicated that they occasionally readily accept even unwarranted blame
or mistake in the school with a mean of 2.55 and a standard deviation of 0.82.

68
On the other hand majority of teachers indicated that principals are occasionally
patient with progress being made by the staff towards goal attainment with a
mean of 2.87 and occasionally allows the staff members to take center stage in
discussions in staff meetings and informal meetings with a mean of 2.58. The
teachers also indicated that principals often acknowledge all members efforts
towards attainment in school affairs with a mean of 2.35. In addition the
principals often initiate direct goals for the school with a mean of 2.23.
On the job satisfaction the study established that with regard to working
conditions, majority of the teachers reported that they were somewhat satisfied
with the amount of teaching load allocated to them per week with a mean of
2.21. The standard deviation however shows a lot of disparity showing that
there is a level of discontent with a standard deviation of 1.04. Other variables
like special services provided such as free lunch and tea provided by the school
with a mean 2.80; extent to which teachers are provided with materials and
equipment with a mean 2.26; the pupil teacher ratio in classrooms in the school
with a mean 2.73; and the spelling out of their job description by the principals
with a mean 2.44 caused some satisfaction to the teachers. However there was
disparity in their responses and significant discontent on availability of transport
facilities provided to them by the school with a mean of 3.95.
On pay and promotion majority of teachers were not satisfied with salary with a
mean of 3.78 and benefits (health insurance, Life insurance etc) with a mean of
3.84. There was high disparity and undecided teachers on whether they were
satisfied with recognition for work accomplished with a mean of 3.01, and

69
opportunities for promotion with a mean of 3.30. However the teachers were
somewhat satisfied with job security with a mean of 2.45.
On working relationships majority teachers were dissatisfied and others
undecided on support for additional training and education with a mean of 3.34,
the extent to which teachers are recommended for further education and training
with a mean of 3.43. The information availed by the principals on available
training opportunities with a mean of 3.29, the encouragement and assistance
received from the principals to participate in service course and seminars related
to their job with a mean of 3.25 and the willingness of the principals to assist
them acquire study leave. There was high consensus on the extent to which
teachers are recommended for further education and training with a standard
deviation of 0.90. However majority of teachers were somewhat satisfied and
had a consensus on relationship with other teachers with a mean of 1.81 and a
standard deviation of 0.86 and relationship with the principals with a mean of
2.29 and a standard deviation of 0.90. Relationships with other subordinates had
a mean of 2.13 and a standard deviation of 0.83, while the use of skills and
abilities with a mean of 1.95 and a standard deviation of 0.87.
On recognition majority of teachers were somewhat satisfied and others
undecided on the way the teachers‟ views are taken by the principals with a
mean of 2.83 and a standard deviation of 0.99. They were also somewhat
satisfied and undecided on variety of job responsibilities with a mean of 2.74
and a standard deviation of 0.95. The rest of the variables had little consensus
reached upon by teachers and had a disparity where majority of teachers were

70
satisfied with the level of challenge they attach to their job, the extent to which
they are allowed to make job-related decisions and the personal satisfaction that
they derive from their teaching job. However the majority of teachers were
dissatisfied with involvement in choosing the kind of incentives to be given in
the school with a mean of 3.24.
On administration and supervision majority of teachers indicated that they are
somewhat satisfied with degree of independence associated with their work
roles with a mean of 2.28 and a standard deviation of 0.94. Majority of teachers
were satisfied with the supervisory procedures used by the principals to evaluate
their work with a mean of 2.60, though there were disparities in their responses.
They were also satisfied with the extent to which the principals allow them to
make independent decisions related to their work with a mean of 2.54. They
were undecided on adequate opportunity for periodic changes in duties with a
mean of 2.99. Half of the teachers were undecided and dissatisfied with job
performance appraisal practices employed by principals with a mean of 2.71 and
the type of feedback they receive from principals with a mean of 2.70.
The study therefore concluded that the principals exercised a high level of
democratic leadership which positively influences teachers‟ job satisfaction.
The principals rarely practice laissez faire leadership style as they are concerned
about group performance. The principals practice transformational leadership by
giving encouragement to members of staff to initiate new and creative ideas to
benefit school and thus improving teachers‟ job satisfaction. On job satisfaction
the working conditions are relatively good. However the teachers were not

71
happy with salary, and benefits. The teachers were also not happy with issues to
do with training, in-service courses from principals and recommendation for
study leave by principals. On administration and supervision issues of concern
to teachers included job appraisal practices employed by principals.
The study recommends improvement of working conditions and provision of
transport for teachers by school vehicles. The principals should encourage and
offer equal opportunities for training, seminars/ in-service courses and offer
assistance such as recommendations to attend. The principals should actively
improve on communication by giving feedback on inquires on a timely basis
and improve on job appraisal practices to be competitive and fair. The
researcher suggests the following areas for further study. This study should be
carried again in some other sub counties for comparative purpose. The study
also recommends that aspects of promotion prospects such as advancement
opportunities, opportunity for inservice training and opportunity for growth
should be enhanced. The study recommends that there is need for school
administration to come up with modalities of improving job satifaction so that
teachers job satifaction can be enhanced. Principals should enhance their
supervisory support to enhance teachers job satisfaction. For further research a
study should be carried out in other sub-counties. A study should also be carried
out on how teachers demographic variables influence teachers‟ job satifaction.
A study on how learners characteristics influence teachers job satifaction should
also be carried out.
72
5.3 Conclusions
The study concluded that the principals exercised a high level of democratic
leadership which enhances teachers‟ job satisfaction. The principals were good
listeners to the group, shows understanding of teachers viewpoints, are patient
and encourages staff to be frank and express their view points, they also
encourages staff members to openly express their feelings. On autocratic
leadership the study concluded that some principals are autocratic especially
when it came to directing goals of the staff and occasionally suppressing new
ideas from members of staff and occasionally blaming failure or mistakes for
low performance on staff thus which negatively influences teachers job
satisfaction.
The principals rarely practice laissez faire leadership style as they are concerned
about group performance, govern the group through intervention and supervise
teachers in their teaching/learning assignment even though occasionally avoid at
all costs interfering with group‟s work. This negatively influences teachers‟ job
satisfaction. The principals to a great extent practice transformational leadership
by giving encouragement to members of staff to initiate new and creative ideas
to benefit school and the rest of staff members and are risk takers (try new
adventurous ideas in dealing with situations). This positively influences
teachers‟ job satisfaction.
On job satisfactions, the working conditions are not good even though there was
no consensus on the level of dissatisfaction but with significant numbers

73
admitting that they are dissatisfied. The teachers were not happy with salary,
benefits and a significant number of teachers were not happy with recognition
and opportunities for promotion. The teachers were not happy with issues to do
with recommendation for training, encouragement and assistance to attend
seminars and in-service courses from principals and recommendation of study
leave by principals. In addition most were dissatisfied with level of involvement
in choosing the kind of incentives to be given in the school. On administration
and supervision there were disparities with no consensus as regards to issues
relating to provision of chance to lead, and adequate opportunity for periodic
changes in duties. Other issues of concern to teachers included job appraisal
practices employed by principals and the feedback received from principals.
5.4 Recommendations
Based on the findings of the study the following were the recommendations.
1. The study recommends that aspects of promotion such as advancement
opportunities, opportunity for in-service training and opportunity for growth
should be enhanced.
2. The study recommends that there is need for school administration to come
up with modalities of improving job satisfaction so that teachers‟ job
satisfaction can be enhanced. Principals should also enhance their
supervisory support to enhance teachers‟ job satisfaction.

74
3. The study also recommends that some aspects of reward system such as
fringe benefits, recognition by school administration, rewards for job well
done should be enhanced in the school.
4. The principals should actively improve on communication, giving feedback
on inquires on a timely basis and improve on job appraisal practices to be
competitive and fair.
5.5 Suggestions for Further Studies
The researcher suggests the following areas for further study.
The study should be carried out in some other districts for comparative purpose
A study should also be carried out on how teachers demographic variables
influence teachers‟ job satifaction
A study on how learners characteristics influence teachers job satifaction should
also be carried out.

75
REFERENCES
Achua, R. (2001). This complex thing, leadership, in police leadership in the
twenty first century. Winchester: Waterside press:204-222.
Adelabu, M.A. (2005). Teachers motivation and incentive in Nigeria.
Ajuoga, M.A. (2000). Impact of instructional materials on the job satisfaction of
selected schools in Kisumu District in Kenya. An unpublished master‟s
dissertation, Makerere University: Kampala.
Bass B, & Riggio, R.E. (1997). Transformational leadership (2nd
ed) Mahwah,
Nj Lawrence Ev/baum.
Bass, B.M & Yammarino, F.J. (1990). Adding to contingent reward behavior.
The augmenting effect of charismatic leadership. Group and organizational
studies, vol.15. Pp 381-394.
Best, J & Kahn, (1993). Research in education. New York: Prentice Hall Inc.
Bush & Oduro, (2006). New principals in Africa: Preparation, induction and
practice. Journal of educational administration, 44 (4), 359-375.
Charlton, G. (2000). Human habit of highly effective organizations. Pretoria:
Van Schaik Publishers.
Chen, K.J &Chen, S.I (2008). Personal traits and leadership styles of Taiwan‟s
higher educational institution in innovative operations. Journal of American
Academy of Business, Cambridge vol. 12, No 2, pp 145-150.
Choon, K.L. (2001). Gender differences in leadership styles and job satisfaction
perceptions of principals and teachers. Malaysia: International Islamic
University.
Ciulla, J.B. (2004). Leadership and the problems of bogus empowerment in
ethics, the heart of leadership. Edited by Praeger.Page 59-82.
Cole, G. (2002). Organizational behavior; theory and practice. p. 143 UK:TJ
International, Padstow, Cornwall.
76
Gay, H.L. (1993). Educational research: competences for analysis and
application.
Hallinger, P. & Leithwood, J. (1994). Assessing the instructional management
behavior of principals: elementary school journal, 86 (2), 217-247.
Herzberg, F, Mausner, B and Snyderman, BB (1959). The motivation to work
New York: John Wiley & Sons, Inc.
Leithwood, K. & Jantzi, D. (2000). The effects of different source of leadership
on student engagement in school. New York, N.Y. Falmer, London, Groom
Helm.
Maicibi, N.A. (2005). Pertinent issues in employees management. M Kampals P.K.
Graphics (4) Ltd. Management training manual 2006. Guidelines to enhance the
governance and management of schools in Uganda Kampala: Ministry of
Education and Sports.
Modley, F & Lurochelle, D.R. (1995). Transformational leadership and job
satisfaction. Nursing Management 26 (a), 64-68.
Mosedegh Rad, A.N. & Yarmohammadian, M.H. (2006). A study of relationship
between managers’ leadership style and employees’ job satisfaction. Leadership
in health services, vol19.No. 2 pp xi-xxviii.
Mugenda, & Mugenda, (2003). Research methods; Quantitative and qualitative
approach. Nairobi: Acts Press.
Mumo, D.K. (2000). Job satisfaction of tutors in technical training institutes in
Nairobi province. M.ED Thesis Kenyatta University.
Mutie, E.K. (1993). Facet and overall satisfaction of secondary school administration
and teachers in Kitui County Kenya. Unpublished Med Thesis, University of
Saskathewah, Saskatoon Canada.
Mwangi, W.J. (2013). Leadership effectiveness of headteachers and how it affect the
performance of secondary schools in Gatanga Division, Thika County.
Unpublished MEd. Kenyatta University.
Ngalyuka, J.M. (1985). An investigation of job satisfaction of the mathematics and
science teachers in secondary schools in Muranga County. Unpublished M.Ed
Thesis Kenyatta University.

77
Norwthhouse, P.G. (2004). Leadership theory and practice (3rd
ed) California: Sage
publication, Inc.
Nzuve, S.N. (1999). Elements of organizational behavior. Nairobi: University of
Nairobi Press.
Okumbe, J.A. (1992). Levels of job satisfaction among graduate teachers in Siaya
and Kisumu districts Unpublished PhD Thesis, Kenyatta University.
Okumbe, J.A. (2007). Educational management theory and practice. Nairobi
University Press.
Oyetunyi, C.O. (2006). The relationship between leadership styles and school
climate: Botswana secondary schools. Unpublished PhD. Thesis University of
South Africa.
Rad, A.M.M & Yarmohammadian, M.H. (2006). A study of relationship between
managers’ leadership style and employees’ job satisfaction leadership in health
service, Vol 19 (2): 11-28.
Savery, L.K. (1994). The influence of the perceived styles of leadership on a group
of workers on their attitudes to work. Leadership and organizational
development journal, 15 (4) 12-18.
Spector (P.E) (1997). Job satisfaction: Application, assessment, causes and
consequences. California. Sage publication, Inc.

78
APPENDICES
APPENDIX I:
INTRODUCTION LETTER
University of Nairobi,
School of Education,
Department of Educational Planning,
P.O Box 92 Kikuyu,
Date:___/___ /2015.
The Principal
_________________________ Secondary School
Dear Sir/Madam,
REF: PARTICIPATION IN RESEARCH
I am a student pursuing Masters of Educational Administration at the University
of Nairobi.
I am undertaking a research on the “Influence of Principals Leadership Styles
on Teachers Job Satisfaction in Public Secondary Schools in Kiambu Sub-
County”. Kindly and honestly read the instructions and fill in the questionnaire.
The findings of this study will not be used for any other purpose other than the
academic research while the identity of the respondents will be kept
confidential. Thank you for your cooperation.
Yours sincerely
Gakobo Margaret Nyiha

79
APPENDIX II
QUESTIONNAIRE FOR PRINCIPALS
This study is an investigation into the influence of principals‟ leadership styles
on teachers‟ job satisfaction in public secondary schools in Kiambu sub-county,
Kenya. You are requested to participate in this study by filling in this
questionnaire. Your identity will be kept confidential.
Kindly give us as honest answers as possible. Indicate the correct option by
inserting a tick (√) in appropriate box provided.
Part A: Demographic Information
1. What is your gender? Female Male
2. What is your age? Below 24 years 26-30 years 31-35 years
36-40 years 41-45 years
46-50years 51 and above
3. What is your highest academic/professional qualification? BED
BA with PGDE Diploma in education
M.Ed Bsc with PGDE SI EAACE/KCE/KCSE/KACE
If any other specify……………………………………………………………
4. What is your teaching experience in years? Below 1yr 2-5yrs
6-10yearsrs 11-15years 16-20years 20 years and over
5. What is the category of your schools? County mixed day
County girls day County boys day
County girls boarding County boys boarding
Extra county girls boarding Extra county boys boarding

80
If any other, specify
……………………………………………………………………..
Part B: Perception of Principals Own Behavior
Please indicate by putting a tick √ in appropriate column to which the following
statements will apply to your leadership behavior in your school.
Key
1-Always, 2- Often, 3-Occassionally, 4 Seldom, 5 Never
Leader
Leadership Behavior Perceptions
1 2 3 4 5
I am friendly and easy to dialogue with
I am a good listener to your group despite
holding divergent opinion with them in
discussion
I show understanding of staff view point though
holding divergent view point with them
I patiently encourage staff to frankly express
fully view points
I express confidence in staff members regardless
disagreeing with them
I genuinely share information with staff
members
I encourage the members of staff to openly
express their feelings
I give room to group members to present their
view points before stating my stand
1 2 3 4 5

81
I expect the best from staff
I expect high quality from self
I initiate, direct goals for the staff
I suppress new ideas from members of staff
I pass the back to others for failure or mistakes
for
low performance in school or stalled projects
1 2 3 4 5
I pay no attention to individual interest in their
work place
I am less concerned about group performance
towards attainment of schools goals
I am unconcerned with staff‟s welfare
I govern the group through non-intervention in
what they are doing
I do not supervise teachers in their
teaching/learning assignment
I avoid at all costs interfering with group‟s work
I enhance discipline owing to non-provision of
structure to staff in doing work
I have no belief in self and others attaining
My contribution in the staff serve as basis for
suggestions or questions
1 2 3 4 5
I have high opinion of what staff do
I give encouragement to members of staff to
initiate new and creative ideas to benefit school
and the rest
of staff members

82
I am a risk taker (try new adventurous ideas in
dealing with situations)
I am open to criticism by members of staff
I treat everybody consistently
I accept I can err like any other staff members
I welcome staff to question matters related to
school affairs
I am patient with progress being made by the
staff towards goals attainment
I allow the staff members to take centre stage in
discussion in staff meetings and information
meetings
I insist that staff members work through
divergent point of views with non-suppression
of them
I use „we‟ or „our‟ and not „I‟ principals or my
school, staff
Am impartial to all members of staff
I acknowledge all members‟ efforts towards
attainment in school affairs
I readily accept even unwarranted blame or
mistake
in the school
I allow staff to reach at a decision as a collective
whole
I give opportunity to any staff member to make
a decision

83
APPENDIX III
QUESTIONNAIRE FOR TEACHERS
You are kindly requested to fill this questionnaire. Your participation will help
gather information on the influence of principal‟s leadership style on teachers‟
job satisfaction in public secondary school in Kiambu sub-county.
Kindly answer all questions as honestly as possible. Your name and that of
institution is not required. This will help to ensure maximum confidentiality.
Put a tick (√) in the spaces provided
1) What is your gender Male Female
2) What is your age bracket? Below 25 years 26-36 years
36-45 years Over 45 years
3) What is your highest professional qualification?
Diploma teachers B.Ed M.Ed
Any other ……………………………………………………………
4) How long have you been in your present school? Less than 2 years
3-5years 6-10years Above 10 years
5) What responsibility do you hold in school? Class teacher
Games teacher Senior teacher
Deputy principal
Others
specify…………………………………………………………………..

84
Part B: Teachers Job Satisfaction Survey
Using the scale shown above, rate your level of satisfaction with the following
aspects of your job.
Key 1) very satisfied 2) Somewhat satisfied 3) Undecided 4) Dissatisfied 5)
Very dissatisfied
Statement Working Conditions 1 2 3 4 5
1 Amount of teaching load allocated to you
per week
2 Availability of staff houses provided to
you by the
school
3 Special services provided to you such as
free lunch
and tea provided to you by the school
4 Extent to which you are provided with
materials and equipment
5 The pupil teacher ration in classrooms in
the school
6 Availability of transport facilities
provided to you by
the school
7 The spelling out of your job description
by the principals

85
Pay and Promotion 1 2 3 4 5
8 Salary
9 Opportunities for promotion
10 Benefits (health insurance. Life
insurance, etc)
11 Job security
12 Recognition for work accomplished
Work Relationships 1 2 3 4 5
13 Relationship with other teachers
14 Relationship with the principals
15 Relationships with other subordinates
16 Use of skills and abilities
17 Opportunities to improve your skills and
talents
18 Opportunity to learn new skills
19 Support for additional training and
education
20 The extent to which teachers in your
school are recommended for further
education and training
21 The information availed to you by the
principals on available training
opportunities
22 The encouragement and assistance you
receive from your principals to participate
in-service course and seminars related to
your job
23 The willingness of the principals to assist
you acquire study leave

86
Recognition
24 The way your job performance is
acknowledged in the school
25 The way your views are taken by the
principals
26 Your involvement in decision making on
matters pertaining the school and teachers
27 Your involvement in choosing the kind of
incentives to be given in the school
28 The personal satisfaction that you derive
from your teaching job
29 The extent to which you are allowed to
make job-related decisions
30 The authority to you to carry out the job
specified to you
31 The level of challenge you attach to your
job
32 Variety of job responsibilities
Administration and Supervision 1 2 3 4 5
33 The type of feedback you receive from
principals
34 The supervisory procedures used by the
principals to evaluate your work
35 The extent to which the principals allows
you to make independent decisions
related to your work
36 Job performance appraisal practices
employed to principals

87
37 Degree of independence associated with
your work roles
38 Adequate opportunity for periodic
changes in duties
39 Provision of chance to lead

88
APPENDIX IV
RESEARCH PERMIT

89
APPENDIX V
RESEARCH AUTHORIZATION