influence of bottom topography on the circulation at the continental
TRANSCRIPT

INFLUENCE O F BOTTOM TOPOGRAPHY ON T H E CIRCULATION AT
THE CONTINENTAT, SHELF OFF NORTHERN NORWAY
SVEIN SUNDBY
Institute of Marine Research, Brrgen, Nor\vay
ABSTRACT
SUNDBY, S. 1984. Influence of bottom topography on the circulatio~~ at the continental shelf off
northern Norway. FiskDir. Skr. Ser. HauUnders., 17: 501-.5l.Y. The three banks Svcinsgrunnen, Malangsgrunnen and Nordvesthanken, which lie-off the coast of
northern Norway, are separated by troughs. Synoptic hydrographic surveys and data from satellite-tracked buoys drogued in the mixed layer, show that the botton topography strongly influences the distribution of water masses and current pattern. Coastal water above the banks circulates in a clockwise direction, while Atlantic water intruding in the troughs circulates in a anticlockwise dii ection. This circulatiol~ pattern influences the transport and spreading of cod eggs from the spawning grounds which are sited between the banks and the coastlinr. The eggs are, for the most part, distributed throughout the Coastal water on the banks, while only small numbers are found in the Atlantic water in the troughs. The circulatio~l in the investigated area probably
f'dvours mixing vf the Goastal and Atlantic water masses. Moderately stratified concitions occur i11 the period from J u n e to September. During this period, the influence of the bottom topography seems to be less prollounced. Howrver, Atlantic water does flow into thc trough Malangsdjupet during stratified conditions.
INTKODUCTIOK
The continental shelf topography off northern Norway is dominated by a number of relatively small and well-defined banks separated by troughs (Figs. 1 and 2 ) . The topography is thus cxpected to influence the circulation of the Coastal current. In this area the Coastal current is an important carrier of pelagic eggs and larvae, and consequently the bottom topography may also influence the transport and spreading of eggs and larvae.
EIDE (1979) clearly den~onstrated the influence of the larger Haltenbanken a t the Norwegian contincntal shelf off mid-Norway. The bank induces a Taylor column reaching the surface during relatively homogenous conditions, while the upper layers during summer stratification are released from the 'Taylor column bclo~v. The aim of this study is to investigate whether the bottom topography of the area, shown in Fig. 2, also influences the general circulation

Fig. 1. The coast of northern Norway. The investigated a:ea is within the frame
16' 1 7 O 19'
Fig. 2. Bottom topography of the continental shelf within the investigated area (depths in meters). Banks: A) Sveinsgrunnen, B) Malangsgrunnen, C) Nordvesthanken. Troughs: I) Andfjorddjupet, 11) Malangsdjupet, 111) Malangsgrunnrn-Nordvestbanken Trough, IV) Tromserflaket Trough.

of the area. However, it must be stated that both topography and the general oceanographic conditions are somewhat different from those a t Haltenbanken. This is discussed later.
The large-scale features of the hydrography off the coast of rlorthern Norway during summer are described by LJBEN (1962). The general current features are described by SETRE and I A J ~ E N (1971). SUNDBY (1976) has described the general hydrographic conditions of the Coastal current off riorthern Norway in more detail. KISLYAXOV (1964) has studied the general circulation of the Atlantic current and the Norwegian current at Trornsaflaket and in the
adjacent coastal waters. 'These investigations are all too large-scaled, hobvever, to reveal the possible influence of the bottom topography of the continental shelf on the hydrographic and current conditions. Current measurements have been made with moored Aanderaa current meters at three positions of the inner part of Malangsgrulinen during the years 1973-1975 (SETRE 1973, EIDE 1974, 1975, 1976). Like the other measurements, these do not reveal effects of the bottom topography.
TOPOGRAPHY
The contiental shelf topography between Andaya and Fugl~ya , off the coast of northern Norway (Figs. 1 and 2), consists of three banks separated by throughs. Outside, the shelf edge siopes steeply towards the deep basin of the Norwegian Sea. Thc southernmost bank, Sveinsgrunnen (A), is the shallowest, with a mean depth of 61 m. Malangsgrunnen (B) is somewhat deeper, with a mean depth of 91 n1. 'The norhernmost bank, Nordvestbanken (C), is the deepest, with a mcarl depth of 139 m. Malangsgrunnen is relatively flat, while Sveinsgrunnen and Nordvestbanken slope sliglitly towards the shelf edge.
The four troughs, Andfjorddjupet ( I ) , Malangsdjupet ( I I ) , Malangsgrun- nen-Nordvestbalikcn Trough ( I I I ) , and Trornsaflaket Trough (IV) have sills close to the shelf edge. The sill depths vary from 230 to 270 m. All three banks are partially separated from the coastlille by small and narrow trenches. The shaded arcas in Fig. 2 indicate shallow waters with depths varying between 0 and 20 m. 1,argc parts of this area colltain vast numbers of skerries. The border of this shaded area probably acts as a secondary coastline for the coastal current.
MATERIALS 7. I hc hydrographic data arc mainly taken from the b u r quasisynoptic surveys
indicated in Table 1. L)uring the same cruises, Juday net hauls were also made, from 50 m depth to the surface, to sample cod eggs and larvae. O n three of the surveys, two ARGOS-buoys were also released, drogued with a sail at 30-m
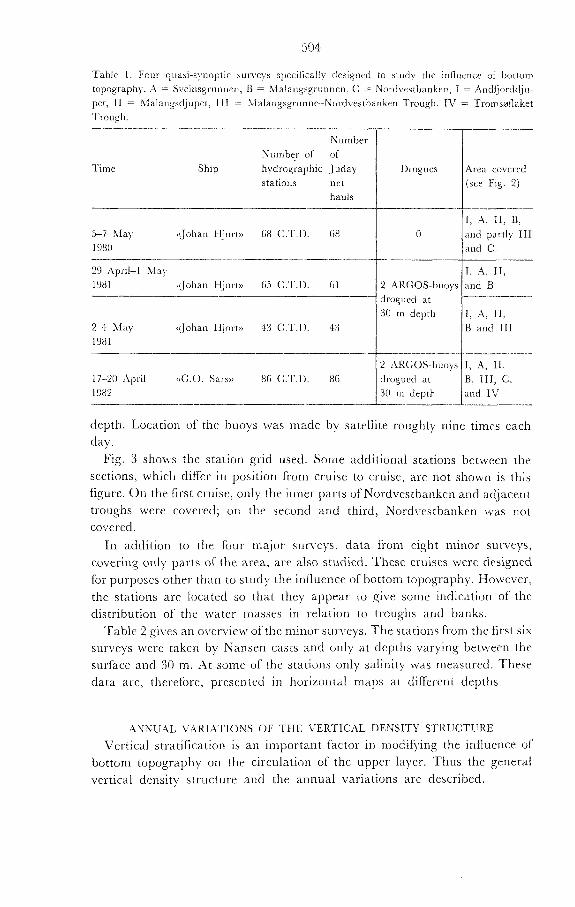
7 7 lable 1. Four quasi-synoptic surveys specificaliy rlesigritd to study tlie influence of' bottom topography. A = Sveinsgrunnen, B = Malangsgruiinen. C = Nordvestbanken, I = A~~dfjorddjil- pet, I1 = Malangsdjuprt, 111 = Slalanga~runiie-Nordveslhanken Trough, IV = 'rromsaflaket Trough.
5-7 May <<,Johan I-!jortx 68 C.T.1). ti8 1980
Number Xurnher. of of
Time Ship hydrographic Juday statior~s net
hauls
2 ARGOS-buoya dnd B drogued at 30 ni depth ::- i~ A, 11,
Drogues
0
17-20 April ( (G.0 . Sam) 86 C:.T.L). 86 dri~gi~ed at E, 111, C, 1982
-- --
Area covered (see Fig. 2)
r. .4> 11, B, m d partly I11 rind C:
depth. Location of the buoys was made by satellite rouglily nine times each day.
Fig. 3 shows the station grid used. Sorne additional statiorls between the sections, which differ in position from cruise to cruisr, are not shown is this figure. O n the first cruise, only tllc inner parts of Nordvestbanken and adjacent trougkis were covered; on the second and third, Nordvestbankcn was not covered.
In addition to the four major surveys, data from eight minor surveys, covering only parts of thc area, are also studied. These cruises were designed for purposes other than to study the influence of bottom topography. However, the stations are located so that they appear to give sorrie indication of the distribution of the water masses in relation to troughs and banks.
'Table 2 gives an overview of the niinor surveys. The stations from the first six surveys were taken by Nansen casts and only at depths varying between the surface and 30 m. At some of the stations only salinity was measured. These data arc, tllcrcforc, h resented in horizolltal maps at diffcrent depths.
ANSU.*\I, VARTI-\TIC)SS OF THE VERT1C:AL DEXSITY S'T1CUC:TUKE
Vertical stratification is an important factor in modifying the inflncnce of bottom topography on tlie circulation of the upper layer. Thus tile general vertical density structure and the annual variations are described.

Fig. 3. Station grid used for thr major cruises. In addition to these Gxcd stations, some stariuns were taken inbetween the sections for each cruisr.
'Yable 2. Eight quasi-synoptic minor surveya. A = Sveinsgrunnen, B = Malangsgru~lnen.
C = Kordx-esthaitkrn 1 = Antiljosd~ljupct, I1 = Malangsdjuprt. 111 = hfalangsgrunnen- Nusdvestbanhcn Trough, IV = Tsorns0flakct Trough. -- --
Number of hydro- Area covered
9-10 &lay 1974
14 April 1975 10-11 hfay 1975
22-25 June I975
31 July-1 Augiist 1975 12-13 October 1975 19-21 Marc11 1980
Ship
cc,Johan H.jost>)
&.O. Sars)) ($Jol~an Hjostn
ccG.0. Sars,) ( ( G . 0 Sass))
e G . 0 . Sars)) c(G.0. Sass))
graphic stations (see Fig. 2)
20 Kanserl casts
13 Nansen casts 1 1 Nanseri casts 12 Nansen casts
12 Xansen casts 9 Nansen casts
7 C.T.D.
I , A, 11, B, and 111 I A, 11, and B '4, 11, B, and I11 A, 11, R , 111 anrl Cl 4 , 11, B, 111 dnd C A, 11, B, I11 and C, 11, B, and pdttly 111, C and I \ '

There exists no fixed hydrographic station to show the annual variations of the vertical density structure within the investigated area. However, at Eggum farther south and at Ingray to the north (Fig. 1) long time series records of hydrography exist. Both stations describe well the Coastal water off northern Norway. Fig. 4 shows isopleths of the squared Brunt-Vaisala frequency, N L , from Eggum for the mean year (1936-82) and from Ingray for the mean year (193643 and 1968-82). The figure indicates that the stability in general decreases from south (Eggum) to north (Ingray). During winter, the stability is very low throughout the water column (N2<3 x Stratification starts in June, reaching maximum values of N2 = 2-3x los4 ss' in Juli for the upper 20 m. The stability thcn rapidly drops, reaching ccwinter conditions)) already in early October. Thus the summer stratification is of shorter duration than farthrr south at the Nor\vegian continental shelf.
Fig. 4. Isopleths of the squarecl Brunt-Vaisala frequency, N', for tile mean year for the fixed stations Eggum and I n g q (positions ofthcse statiorls arc shown in Fig. 1) .

The four major surveys were all conducted in the middle period of spring (Table I ) . At this time of year, the vertical conditions are relatively homogeneous. Only at some few nearshore stations is a slight temperature increase observed in the upper 5-10 m. Five of the eight minor surveys were also conducted at a time of year when homogeneous conditions prevailed; namely, in October, March, April, and May. One survey was conducted towards the end of June. At that time, the upper layer was only weakly stratified. Only the two cruises of 31 July-l August 1975 and 19 August 1982 (Table 2) were conducted during well-developed stratified conditions.
THE FOUR MAJOR SURVEYS
HYDROGRAPHY
The four major surveys were all conducted at nearly the same time of year, within a three-week period in April or May. Therefore, the general hydrographic conditions are expected to be similar for all four surveys. Characteristic features of the season are the following. The static stability of the water column is low. The squared Brunt-Vaisala frequency, N ~ , was approximately 1 - 2 x 1 0 ~ ~ sp2 from sea surface to the bottom. The density gradient was largest from 30 to 50 m depth.
Fig. 5 shows some density profiles for each of the sections for each survey. Only at the innermost stations of section d (Fig. 3) was a significant stratification of the upper 30 m observed. Here the squared Brunt-Vaisala frequency, N2, reached 2-4X10-~ s - ~ . I t is evidently a local feature due to outflow of low-salinity fjord water.
There is a strong relation between salinity and temperature of the Coastal water at this time of the year. Fig. 6 shows temperature-salinity or T-S plots for all stations for each of the years. Three types of water are present:
1. Northern Norwegian Coastal water, NNC, which is found close to the coast. 2. Atlantic water, A, with the core just outside the shelf break. 3. Norwegian Sea deep water, ND, which is present in the deep basin of the
Norwegian Sea.
The water mass representcd by the line A-ND only occurs at greater depths off the shelf break. Inside the shelf break the water mass A-NNC is present. Because of the close relationship between temperature and salinity, the horizontal distribution patterns of temperature and salinity are roughly similar. Therefore, only maps of the temperature distribution are presented.
Figs 7, 8, 9 and 10 show the temperature distribution at 20 m depth for the four synoptic surveys. The distributi,on at this depth is a good representation of the hydrography of the upper 50 m. As already mentioned, Nordvestbanken (area C in Fig. 2) was fully covered only in 1982. All situations show similar

Fig. 5. Density profiles, o,, Sor selectcd stations in the sections b; c, d , and r (see Fig. 3) for synoptic surveys in May 1980, May 1981 and April 1982.

Fig. 6. 'r'empcrature-salinity characteristics ofwater masses during winter off northern Norway. 0: Northrrn Norwegian Coastal water (NNC), x: Atlnlltic watrr (A), o: Norlvegian Sea Deep water (ND).
features. The cold Coastal water spreads out over the banks, and the warmer Atlantic water intrudes into the intervening troughs. The main front between the Atlantic and Coastal water masses is located at the s h ~ l f brrak. However, it also intrudes into the troughs. In particular, at the northern edge of Sveinsgrurlnen (A in Fig. 2), which faces Malangsdjupet (I1 in Fig. 2), the front was strong during the surveys, indicating a strong inflow of Atlantic watrr in Malai-tgsdjupet.
Fig. 7. Temperature distributio~l at 2 0 m Fig. 8. Temperature distribution at 201n depth, 5-7 May 1980. depth, 29 April-1 May 1981.
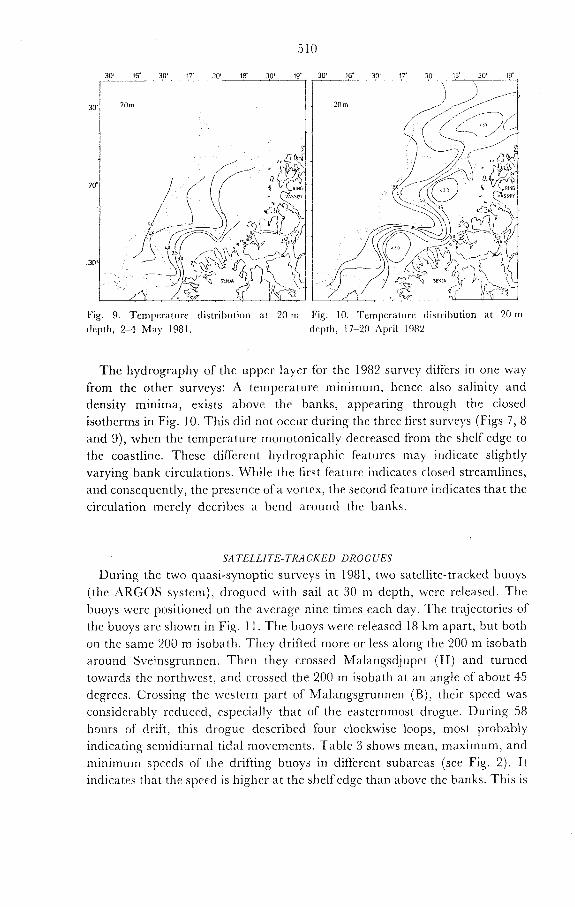
Fig. 9. Temperature distribution at 20 m Fig. 10. Ternperature distribution at 20 m
depth, 211 May 1981. depth, 17-20 April 1982
The hydrography of thc uppcr layer for the 1982 survey differs in one way from the other surveys: A tcmpcraturc minimum, hence also salinity and density minima, exists abovc the banks, appearing through the closed isotherms in Fig. 10. This did not occur during the three first survcys (Figs 7, 8 and 9), when the temperature monotonically decreased from the shelf edge to the coastline. These diffcrcnt hydrographic fcaturcs may indicate slightly varying bank circulations. While the first fcaturc indicates closed streamlines, and consequently, the presence of a vortcx, the second fcaturc indicates that the circulation merely decribcs a bend around the banks.
SA TELLITE-TRACKED DROGLIES
During the two quasi-synoptic survcys in 1981, two satellite-tracked buoys (the ARGOS system), drogucd with sail at 30 m dcpth, were released. The buoys wcrc positioned on the avcragc nine times each day. The trajectories of the buoys arc shown in Fig. 1 1 . The buoys were released 18 km apart, but both on the same 200 m isobath. Thcy drifted more or less along thc 200 m isobath around Sveinsgrunncn. Then they crossed Malangsdjupct (11) and turned towards the northwest, and crossed the 200 m isobath at an angle of about 45 dcgrres. Crossing the western part of Malangsgrunncn ( R ) , their spced was considerably reduced, especially that of the eastcrnmost drogue. During 58 hours of drift, this drogur described four clockwisc loops, most probably indicating scmidiurnal tidal movements. Table 3 shows mean, maximum, and minimum spccds of the drifting buoys in different subareas (see Fig. 2). It indicates that the spced is higher at the shelf edge than above the banks. This is

Fig. 11. Trajectories of t\vo ARGOS-buoys, 30 Fig. 12. Trajectories of two April-4 May 1981 ARGOS-buoys, 19-23 April 1982
Table 3. Mean, maxirnuln and minimum speeds, cmls, ofdrifting buoys 30 April-4 May 1981, and hours of drift within the subareas. A = Sveinsgrrlnnen, I1 = Malangsdjupet, and B = Malangsgrwinen,
I Subarea
Buoy num- ber
* lndlcate ~ ~ r e ~ l d u a l ~ ~ dr~ftlng speed, I e fluctuat~ons due to tldal movements arc snbtracted
particularly clear at Malangsgrunnell (B). Here the residual current of buoy 1 was only 7 cm/s, while the speed of buoy 2 farther out towards the shelf edge was 21 cm/s. One radartracked drifting buoy, which J h a s released at the shelf edgr to the west of Malangsgrunnen (B) during the recovery of the two satellite buoys, drifted northwards a t a speed of about 40 cmls. This indicates a considerable current shear between the sl-relf edge and the banks, I t is also noted that the trajectories appearing in Fig. 11 are remarkably parallel to the temperature and salinity isolines of the upper layer (Figs 8 and 9).
During the survey in 1982, two satellite-tracked drogues were released 18 km apart at the southern edge of Nordvestbanken. They were drogued a t 30 m depth. The trajectories are shown in Fig. 12, and Table 4 shows drift velocities of the buoys. The drift patterns are similar to those of the first experiment with
respcct to thc bottom topography (Fig 1 I ) . ' fhe I)uoys dr~f ied around the bank, arld the trajectoljes In Fly. 10 arp parallel to the isotllerrns I I o ~ e \ e r , the scmidiurnal clockwise loops arc nlorc pronounced hcrc. As shown in Table 4 , the sprcd is lower than during the first drift cxpc~irncr-tt (Tahle 3).
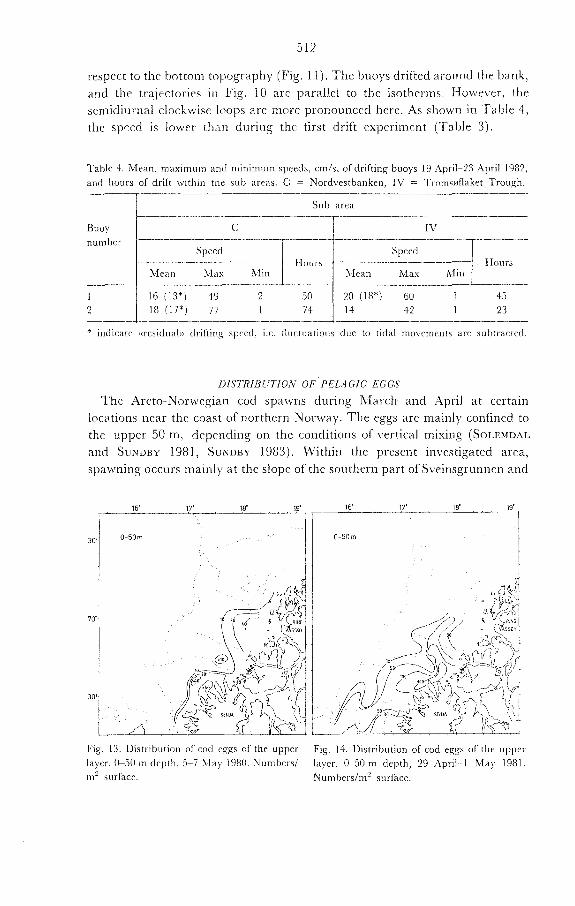
Tahle 4. Mean, maximum a ~ ~ d minimum spceds, cm/s. of drifting buoys 19 April-23 April 1982, and Ilours of drift Tcithin the sub arcas. C = Nordvestbanken, IV = Trcmsmflak~t Trough.
---7- --
Sub area
- -- --.--
S,c.,d ---I- r-
Speed r---- 1 16 (13') 43 2 yy (18') 60 1 45 ;",A 2 1 42 1 23
- ' indicate nresidu;il)) drifting spertl, i.e. fluctuations tl11c to tidal movemcnts are suhtracted.
IIISTRIBL'TIOiV Ofi PELAGIC EGGS
'The Arcto-Norwegian cod spawns during Marcli ancl April at certain location3 near the coast of northern Norway. The eggs are mainly confined to the upper 50 m, clependl~lg on the conclitioris of vertical mixing (SOLEMDAL and SUNDBY 198 1 , SUXDBY 1983). 'CVitltin the preser~t investigated area, spawning occurs n ~ a l i ~ l y at the slope of the so~ttltern part of Sveinsgrunncn and
Fig. 13. Distribution of cod eggs of the upper Fig. 14. Distribution of cod eggs of the upper layer. @iiO m drptli, 5-7 ;\fay 1980. Numl>ers/ layer, 6 5 0 n~ depth, 29 :ipril-I ;\,fay 1981. m' s~~r facc . Nunibers/m2 surface.

Fig. 15. Distribution of cot1 eggs of the uppei. Fig. 16. Distrih~~tion ot'rod and hntldock eggs of layer, &50 m depth, 2-4 h3ay 1981. T r ~ l n l x r s / t h p rrppes !ayrr, 0-50 m tiepth, 15--17 April 198%. rn? surface. ~ u r n b r r s / ~ i ~ ' sr~rface.
between Malangsgrunnen and thr coast. TIlc shadings in Fig. 2 indicate the main spawning grouncls of cod. Spawning occurs to a lesser extent in a larger area along the slopes of the hartk, but the precise loc.atio~t of the spa~vnir~g varies from one year to the next.
Figs 13, 14, 15 and 16 show the clistrihution of pelagic eggs from the four surveys. 111 Figs 13, 14 and 15 all stages of the eggs are includcd, hence sorrie may be as old as 20-days. IHowever, the greater ntlmbcr are younger than 7 days. In Fig. 16 only eggs younger tila11 7 days are inclucled. This figure contains two separate fields of egg distribution. Cod eggs liave been identified in tlie nearshore field, which spreads out above the banks. Most of these are believed to corne from the two spawning grounds shaded in Fig. 2. 'The other egg field, extending alo:lg the shelf edge, is deterlainecl by electroforctic techniques to contain rnainly c g ~ s of haddock (JARLE h l f o ~ ~ , personal communication). The haddock spawns a t thc shelf edge off northcrn Norway. Tllc exact locations of haddock spawrlin,g are not known, but tllr stage of the eggs in this particular case indicnt~s that spawning occurred at the locations of highest concentration, i.e., at tllc western cdge of A4alangsgrunnen. In Figs 13: 14 and 15 orlly cod egzs are believrcf to he prese~it. The main features of the cod egg distribution are simila~r in all four cases: the distribution spreads out in the Coastal water, above the banks, while close to the shore, in the troughs, it is contracted. This indicates a circulation of the upper layer corresponding to that of the water rnasses (Figs 7-10) and the trajectories of the ARGOS-buoys (Fig. 11).

THE EIGHT MINOR SURVEYS
Five of the surveys were conducted during relatively homogeneous condi- tions. The horizontal distributions of salinity or temperature are shown in Figs 17, 18, 19, 20 and 2 1. Because of the sparseness of stations, the isolines are much more uncertain in these cases than for the major surveys. However, the results from these surveys also indicate that the water above the banks is less saline and colder than the water above the troughs.
Fig. 1 7 . Salinity at 10 n~ depth, 9-10 May 1974 Fig. 18. Temperature at 20 m depth, 14 April 1975.
Fig. 19. Salinity at 5 m depth, 10--11 May 1975. Fig. 20. Salinity at 5 m depth, 12-13
October 1975.

Fig. 21. Temperature at 20 nl depth, I S 2 1 March 1980.
Figs 22, 23 and 24 show the horizontal distributions of salinity from the surveys during summer conditions. Fig. 22 shows the distribution a t 5 m depth on 22-25 June 1975. Only moderate stratification was developed a t that time. Again, only the station a t the mouth of Malangen (see Fig. 1 ) shows stratification which occurs in the upper 20 m.
Fig. 23 shows the salinity distribution at 5 m depth 31 July - 1 August 1975. Stratification was dcvcloped as shown by the vertical density profiles in Fig. 25.
Fig. 22. Salinity at 5 ni dcpth, Fig. 23. Salinity at 5 ni depth, 22-25 Junr 1975. 31 July-1 August 1975.

Fig. 21. Sali~iicy ;ti 20 r n depth, 19 Al~gus t 1982.
r - 3 l i le $cl~!zrcLF B ? i : l ? ~ t'aisalii I'i.cclue~~cy of the ripper- 50 rn is 1-3X 10-' s-'. This vaiiie col-respol-tc!s v,veli u~iili tliosc of' thc rilean ycar s1iow11 ill Fig. 4. Ncvei-iheicss, more saiirie waier is also picuelit fbr [lit: stratified situatiorl above h%aiar;gstiji,ipct ( I1 iii Fig. 2) s h ~ ~ v i i i g t l i t i.;rrsence oi' Atlantic water.
r-5- I he last survey, oil 19 Arigusi 1982, was also co~lducteti during well- stratified coniititioi~s, as .;ho\z:n i r k Fig. 25. The squared Brunt-Vaisala fr-. cyuency is 2--4x 10-" s-'. Fig, 7,i si~otvs the salirrity distrihutiotl at 20 n1 depth.
It iridicates intrusion iif incir-c saliiit ~ a t c r in ilndfjorcldj~~pet ( I in Fig. 2) and Iklalangsdjupet (ll iti Fig. 2). I-ior+-cver, this also secms t o flush the western part of hlalrrngsgrunncn (B it1 Fig. 2 ) .
Fig 23. i)eiisit) pririiics. 0,; i ~ , i iiic-ictcii sia:i<ilts ;st aiii.\c,)s during str:~tiGril coliditiolts
A ] 'Ji ji!ly-1 .'iiigiti~ liliii. i i ) l c J ~ i r ~ g i ~ s i lilAi '

51 7
DISCUSSION
The results from the presented surveys, denionstrate that the distribucion of the water rilasses a i d the horizontal circulatiorl tliroughout the water colunln are highly influenced by the bottom ropograplly. 'The features seen1 to be permanent during the homogeneous corlditioris which occur in the period from Octotjer to May. However, the features are defifillitely not identical for the diKerent surveys. The intrusion of the Atlantic water into Malangsdjupet (I1 in Fig. 2) was stronger during the major cruises of 1980 and 1982 (Figs 7 and 10) than during those of I98 1 (Figs 8 and 9). The intrusion of Atlantic water into Andfjord?jupet ( I in Fig. 2) also seems to vary. I t is nmst probably caused by short tinre variatioiis. Tliis is supporccd by the results frorn the two major surveys of 19131, wliicli were conducted with arl interval of only two days. The intrusion of Atlantic water into Andfjorddjupct ( I ) al~cl Malatigscijupet ( I l ) increased during this period of time. This is also confirn~ed by the trajectories of the drifting buoys. Buoy no. 1, wliich crossed hfalangsdjupet (11) on 1 May, had a straighter trajectory across hlalangsdjrrper than buoy no. 2 wliich crossed h.Ialangsdjupet on the 3 May.
The variatioris described above niay contribute to the mixing of' Atlantic and Coastal watcr niasses. I n gCl-leral, the ten~perature of the Coastal water dccrcases nortkirvards during tlle winter. I-Ioweker, in rhe investigated area it iricreases with nortlierliness. This appears i~iost clearly in Fig. 10. I t rnay be causecl partly by the or~tllow of colcl water fr.oni Andfjordell, but mainly it must be due to mixir~g of Atlantic and Coastal water.
A1thougl.l fcw data are available for stratified cotiditiorls, which occur from Junc to September., these data indicate that Atlantic water irtvariably intrudes into lklalangscljupet (I1 in Fig. 2) . However, the inflow of Atlantic water into the Ma1aiigsgruiincr1-Word\~estl,anken Trough is less regular (111 in Fig. 2). During the survey 31 July-1 .4ugust 1975 (Fig. 23) this inflow was slight, but during the survey 19 August 1982 thc inflow was pronounced. There are also winter situations where the Atlantic inflow into the Malangsgru~~nen- Worilvestbarikcn Trough is sl igl~t , I t must therefore be concluded that the iriflo~l of Atlantic water into this trongh is less stable than the Atlantic inflow into Malangscljupet.
As ~winted out in thc Introduction, E ~ U E (197Qj lias demonstrated tlre infiuer~ce of the obstacle I-ialtenbankcn off the 111id-Norwegian coast. f l e discussed the L:oiiditio~rs f i~ r a topographically trapped vortex aho1.e the bank. For the l~ornogeneous case, closecl strearr~liiies will fbrm wlren the dimer~sioriless product h,R-' of the fi-actional height, ll,, of the obstacle and the inverse Kossby nu~nber , R-', exceeds a number between 2 and 4, depending upon the shape of the obstacle. This was outlineti by HUPPEK?. (1975). For Haltenhan- ken E ~ D E (1979) estimated h,R-' to about 50. For Sveinsgrunner~, Malaiigs- grunnen, and Nordvestbanken the nui~lber is respectively about 13, 11 and 9.
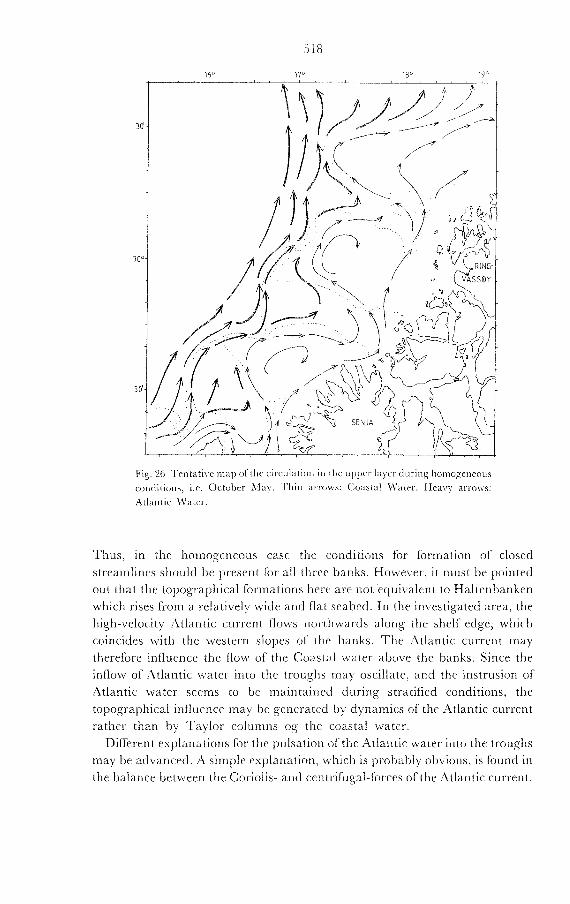
Fig. 26 Tcntativc , nap o f t l ~ c rirculation in the upper laycl- d i ~ r i n g homogeneous conditions, i.c. 0ctobe1--1lay. 'l'liin arroivs: <:oastal M'atrs. Heavy arroxvs:
Atlantic M'ater-.
Thus, in the homogeneous case t l ~ c conditions for formation of closed streamlines should he present I'or all rhrec banks. However, it 111ust be pointed out that thc topographical formations here are riot equivalent to Haltcrlbanken which rises fi-om a relatively wide and flat seabcd. In the il~vestigated area, the high-velocity Atlaritic current flows northwards alorig the shelf edge, which coirlcides wit11 the western slopes of the banks. The Atlalltic current may therefore infiucncc the flow of the C:oastal water above thc hanks. Sirice the inflow of Atlantic watrr into the troughs ma): oscillate, arlcl the iristrusioil of Atlantic water seclrls to bc maititaincci during stratified conditiol~s, the topographical influence may be generatccl by dynalnics of the Atlantic current rather than by Taylor colull~lrs og the coastal water.
DifTercnt cxplanatiorls for the pulsatiol~ of the Atlarltic water into the troughs may be advanced. 4 siiriplc explatiation, which is probably obvious, is found in the balance between the Coriolis- and centrifugal-forces of the Atlantic current.

I n this case the current velocity along the shelf edge and the current velocity into the troughs should vary inversely. The cha.racteristic shelf-edge speed is about 50 cmls which corresponds to a radius of the inertia.] circle of about 4 km. The radii of curvatures of the banks vary from 3 to 5 knl. 'Fhus, the speed of the shelf current could he an jnlporta~lt parametre clescrihing intrusioli into the troughs.
Based on the hydrograpic data, thc current drogues, and data on cod eggs, a tentative rriap of the nlean current circulation of the upper layer is drawn (Fig. 26). These features represent the period froin October to June. During stratified collditions from June to Septe~nber it is expected. that the topographically dependent current features zre less prolaounced. However, the inflow of Atlantic water into Malangsdju~rtet also seerns to he present, fi-om tllc bottom to surfjce, during summer.
REFERENCES
EIDE, L.1 1974. Current nleasuremcnts on Malangsgr~lnnen. Report 2. Rii~er and Hnrbour Lnhornfogr, UiziuersiQ o f T:ondheim, Tmndlreirn 1974: 1-6. 137 figs. [In Norwegian].
EIIIE, L.I. 1975. Current measurements on hlalangsgrunnen. Report 3. River and Harbour Lnboraloy, Uiiiuersiti, of Troridlieim, Tmndllpirn 1975: 1--6. 155 figs. [In Norwegian].
EIDE, L.I. 1976. Current measurements or1 hlalangsgrunr~en. Report 4. River nndHni-hour Lnbo:nfol)l', Uniorrsi[v of Trotidlleim. Trondlirirn 19761--3. 26 figs. [In Norwegian].
EIDE, L.1. 1979. Evidence of a topograpllicnlly trapped vortex on the Norwegian continental shelf. Deep Sen Res., 26 (6.4): 601-621.
HLIPPERT, H.E. 1975. Some remarks on thc initiation of inertial Taylor columns. J. Fluid h-fech., 67: 397-412.
KISI.YAKO~, A.G. 1964. The horisontal circulation of the waters on the border between the Xorwegian Sea and the Barents Sea. ?ici<~ pabar. nnuchno-isled. Inst. nzorsk. 916. Khoz. Okeano~gi.. 16: 183-194. [In Russian].
I.JBEN, R. 1962. The waters of the ~ ~ r s t e r n and northern coasts of Norway in July-August 1957. FiskDir. Skr. .Ye?-. HnzjUndr):r. 13(2): 1-39.
SOLEMDAL., P. and SLINDBY, S. !981. Vertical distributioil of pelagic fish eggs in relation to species, slx~\vning behaviour anti wind conrlitions. Cbrrn. , t i c ~ f . Ir~i . G u n . E ~ p l o r . Sen. 1981 (G:77): 1-27. [Mimeo.]
S ~ J N D B Y , S. 1976. Oseanog-rafiske forhold i omr;idet Mala1~gsgrunne1~--Fug1mybankenTromsmfla- ket. En oversikt. Fisken og Hnuel Ser. B, 1976 ( I ) : 1-53.
SUNDBY, S. 1983. A one-dimensional model for the vertical distribution of pelagic fish eggs in the mixed layer. Dee/) ,Sen Res., 30 ((if\): 645--661
SETRE, H:J. 1973. Current measurerneuts on Malangsgrunnrn. Report I. Rii~er nnd IiTorbour Lnborn foy , 111iiuersip o f Troridheirn, Trondheinz 1973:l-6. 42 figs.
SATRE; R. and I,JBEN, R. 1971. Tlir Norwegian coastal current. Proc. of t h e j r s t inter~lational co~ference on port nrld ocean etzgineering under Arctic conditions. U~l iue~ .r i~v of Trondheim, 1971: 514-536.
Received 21 Nwrnlber 1903 Printed 28 August 1981