inflation report - mnb.hu · the evolution of the hungarian price index was essentially in line...
TRANSCRIPT

INFLATIONREPORT
2018M A R C H

‘... wise is the man who can put purpose to his desires.’
Miklós Zrínyi: Th e Life of Matthias Corvinus

INFLATIONREPORT
2018M A R C H

Published by the Magyar Nemzeti Bank
Publisher in charge: Eszter Hergár
H-1054 Budapest, Szabadság tér 9.
www.mnb.hu
ISSN 2064-8723 (print)
ISSN 2064-8774 (on-line)

Pursuant to Act CXXXIX of 2013 on the Magyar Nemzeti Bank, the primary objective of Hungary’s central bank is to achieve
and maintain price stability. Low inflation ensures higher long-term economic growth and a more predictable economic
environment, and moderates the cyclical fluctuations that impact both households and companies.
In the inflation targeting system in use since August 2005, the Bank has sought to attain price stability by ensuring an
inflation rate near the 3 per cent medium-term target. The Monetary Council, the supreme decision-making body of the
Magyar Nemzeti Bank, performs a comprehensive review of expected developments in inflation every three months, in order
to establish the monetary conditions consistent with achieving the inflation target. The Council’s decision is the result of
careful consideration of a wide range of factors, including an assessment of prospective economic developments, the
inflation outlook, financial and capital market trends and risks to stability.
In order to provide the public with a clear insight into how monetary policy works and to enhance transparency, the Bank
publishes the information available at the time of making its monetary policy decisions. The Report presents the inflation
forecasts prepared by the Directorate Economic Forecast and Analysis, the Directorate Monetary Policy and Financial
Market Analysis, the Directorate for Fiscal and Competitiveness Analysis and the Directorate Financial System Analysis, as
well as the macroeconomic developments underlying these forecasts. The forecast is based on the assumption of
endogenous monetary policy. In respect of economic variables exogenous to monetary policy, the forecasting rules used in
previous issues of the Report are applied.
The analyses in this Report were prepared under the direction of Barnabás Virág, Executive Director for Monetary Policy
and Economic Analysis. The Report was prepared by staff at the MNB's Directorate Economic Forecast and Analysis,
Directorate Monetary Policy and Financial Market Analysis, Directorate for Fiscal and Competitiveness Analysis and
Directorate Financial System Analysis. The Report was approved for publication by Márton Nagy, Deputy Governor.
The Report incorporates valuable input from other areas of the MNB and the Monetary Council's comments.
The projections are based on information available for the period ending 23 March 2018.

CONTENTS
INFLATION REPORT • MARCH 2018 5
Contents
The Monetary Council’s key findings related to the Inflation Report ...................................................................................... 7
1. Inflation and real economy outlook ................................................................................................................................... 11
1.1. Inflation forecast ......................................................................................................................................................... 11
1.2. Real economy forecast ................................................................................................................................................ 13
1.3. Labour market forecast ............................................................................................................................................... 17
2. Effects of alternative scenarios on our forecast ................................................................................................................. 23
3. Macroeconomic overview .................................................................................................................................................. 25
3.1. Evaluation of international macroeconomic developments ....................................................................................... 25
3.2. Analysis of the production and expenditure side of GDP ........................................................................................... 33
3.3. Labour market ............................................................................................................................................................. 37
3.4. The cyclical position of the economy .......................................................................................................................... 38
3.5. Costs and inflation ....................................................................................................................................................... 39
4. Financial markets and interest rates .................................................................................................................................. 43
4.1. Domestic financial market developments................................................................................................................... 43
4.2. Credit conditions of the financial intermediary system .............................................................................................. 47
5. Balance position of the economy ....................................................................................................................................... 49
5.1. External balance and financing ................................................................................................................................... 49
5.2. Forecast for Hungary’s net lending position ............................................................................................................... 51
5.3. Fiscal developments .................................................................................................................................................... 53
6. Special topics ...................................................................................................................................................................... 57
6.1. Effect of digital technological progress on inflation developments ............................................................................ 57
6.2. Evaluation of the central bank’s forecasts for 2017.................................................................................................... 61
7. Breakdown of the average consumer price index for 2018 ............................................................................................... 66
List of charts and tables .......................................................................................................................................................... 67
List of boxes Box 1-1: Assumptions applied in our forecast ........................................................................................................................ 19
Box 3-1: Factors behind EUR appreciation ............................................................................................................................. 31
Box 3-2: Inflation trends at the beginning of the year remain moderate .............................................................................. 41
Box 4-1: Impact of the global rise in yields and the new central bank programme on Hungarian yields .............................. 45


THE MONETARY COUNCIL’S KEY FINDINGS RELATED TO THE INFLATION REPORT
INFLATION REPORT • MARCH 2018 7
The Monetary Council’s key findings related to
the Inflation report In the Council’s assessment, in parallel with the pick-up in domestic demand, Hungarian economic output is close to its
potential level. Growth of the Hungarian economy will pick up further in 2018, then, according to the current projection, it
will slow down gradually from 2019. The inflation target is expected to be achieved in a sustainable manner by the middle
of 2019.
Global economic output continued to expand in recent months, while global inflation remained at a moderate level,
similar to that of last year. Increases in price levels were below the inflation targets in most countries. In the past quarter,
prices of risky assets temporarily decreased, due to rising interest rate expectations.
Growth in the global economy, and particularly in the euro area, continued in the fourth quarter of 2017, and strong global
economic activity may persist in the coming years as well. Cyclical factors also play a role in the improving euro area
economic growth, although the long-term economic outlook involves high uncertainty due to low productivity growth,
persistently high unemployment rates in some regions and non-performing loans in the banking system. GDP growth in the
United States is expected to pick up in 2018, while the Chinese economy continues to grow dynamically. Exhibiting high
volatility, global oil prices were in the USD 60–70 band, and underlying global inflation developments still show no stable
upward trend.
In the first quarter, risk appetite declined on the money and capital markets. Market sentiment was influenced by
favourable macroeconomic data, the US tax reform and the resulting rise in inflation and interest rate expectations. As a
result of rising interest rate expectations, developed and emerging market yields generally rose, particularly in the longer
segment of the yield curve. At the beginning of February, there was a substantial fall in major stock market indices,
accompanied by rising volatility in prices. Nevertheless, on the whole US stock price indices were above December levels,
while the Japanese and developed European stock price indices closed the period below their initial level. In parallel with
the declines on the equity market, risk indicators and the volatility of asset prices also rose, while the emerging bond market
EMBI Global index returned to the level observed early in the period. In the foreign exchange market, the euro continued
to appreciate against the US dollar on the whole.
In line with the moderate inflation expectations, the accommodating monetary policy environment is likely to remain in
the euro area. Starting from January 2018, the European Central Bank is continuing its net asset purchases at a reduced
volume until September 2018, or beyond if necessary. Net asset purchases may continue until the Governing Council sees
a sustained adjustment in the path of inflation consistent with its inflation aim. On the other hand, the March
communication no longer contains the statement that if the outlook becomes less favourable, the Governing Council is
ready to extend the programme. Market participants expect the first interest rate hike to occur in the second quarter of
2019. In March 2018, the US Fed raised the base rate to the band of 1.5–1.75 percent. The interest rate path priced in after
the interest rate hike has not changed significantly.
The Central and Eastern European region continued to be the economic growth centre of the European Union. Inflation
typically decreased in the countries of the region in the past months, with rates moving in the lower half of the tolerance
bands. The Czech and the Romanian central banks raised their key policy rates, and market participants anticipate further
tightening. By contrast, decision-makers at the Polish central bank left monetary conditions unchanged in the past quarter
and according to the central bank's communication they may remain unchanged looking ahead.
In line with our December expectation, in a sustainable manner, inflation will reach the 3 percent level consistent with
price stability, by the middle of 2019.
In the past period, inflation decreased moderately to reach 1.9 percent in February. The evolution of the Hungarian price
index was essentially in line with the projection presented in the December Inflation Report. The decline in core inflation,
which has been ongoing since September 2017, continued bringing this indicator to 2.4 percent in February. The decline in
the prices of this product group in the past period was primarily attributable to the fall in the price index of industrial goods.

MAGYAR NEMZETI BANK
8 INFLATION REPORT • MARCH 2018
According to the current projection, inflation will once again remain in the lower half of the tolerance band in the coming
months. Over the forecast horizon, we expect core inflation to rise gradually, while the underlying inflation trends will
develop moderately as expected earlier. Over the medium term, buoyant domestic demand and rising wage growth point
to an increase in domestic core inflation. On the other hand, the cost effect of the dynamic wage increase is mitigated by
several factors collectively. The reduction of the social contribution tax realised as part of the multi-year wage agreement,
the corporate income tax cut in 2017 and the gradual reduction of the shadow economy all moderate the impact of wage
increases on inflation. In addition, inflation prospects in the euro area are persistently moderate, and households’ inflation
expectations have also stabilised at historically low level, which on the whole also slows the rate of domestic price increases.
Looking ahead, the price dynamics of non-core inflation items correspond to our December forecast. As a result of the
appreciation of the euro against the US dollar, EUR-denominated oil prices, which fundamentally influence domestic fuel
prices, remained essentially unchanged compared to our December assumption, and looking ahead, the market pricing
anticipates a gradually declining path. Based on the projection in the March Inflation report, in line with our earlier
expectation, inflation will sustainably reach the 3-percent level consistent with price stability by the middle of 2019.
The Magyar Nemzeti Bank has revised up its 2018 growth forecast. According to the current projection, this year we
expect economic growth to be more dynamic than last year, but the pace of expansion will gradually decelerate from
2019. Productivity and competitiveness will play an increasingly important role in terms of growth.
Based on the data received since the December Inflation Report, we expect more favourable consumption and investment
processes and slightly stronger growth in exports, as a result of which, we anticipate higher growth in the short run
compared to the forecast in the December Inflation Report.
In 2018, we expect economic growth to be even faster than in 2017, which – according to the current projection – will be
followed by a gradual deceleration. Looking ahead, growth is still supported by the expansion in domestic demand. The
growth in consumption is fostered by the dynamic increase in real wages, the high net financial assets and the second-
round effects of the upturn on the housing market. The rise in household consumption is also supported by strengthening
consumer confidence. In the first half of the forecast horizon, investments are expected to continue expanding dynamically,
supported by stronger underlying corporate investment trends, the pick-up on the housing market, the low interest
environment, the major rise in loans to SMEs resulting from the central bank programmes, and the rise in the absorption
of EU funds. In the second half of the forecast horizon, investment at the level of the national economy may decline due to
the large-scale corporate investments being incorporated into the base, the phase-out of the EU transfers and the
weakening of the housing market cycle resulting from the resetting of the VAT rate on new housing transactions, in
accordance with the effective tax regulations. As a result of the favourable outlook for global economic activity, we expect
stronger growth in external demand compared to our December assumptions, which will also be supported by economic
policy measures in the United States and the rising intensity of external trade. In addition, growth in Hungary's export
market share is also supported by the development of new industrial capacities.
In the Council's assessment, GDP growth will reach 4.2 percent in 2018, and then, according to the current projection,
growth will gradually decelerate from 2019. In parallel with economic growth, the unemployment rate will also continue to
decrease moderately. As a result of the pick-up in domestic demand, output is close to its potential level, and therefore, in
terms of economic growth, productivity and competitiveness will become increasingly important in the longer term.
Both corporate and household lending rise dynamically over the forecast horizon.
Outstanding corporate and household loans will increase dynamically in the coming years. With buoyant economic growth
and a persistently negative real interest rate environment, a continued rise in lending is expected to take place. The
Hungarian economy is still in the early, ascending phase of the new lending cycle, and lending is unlikely to reach its
equilibrium level even at the forecast horizon. Annual growth in overall corporate lending is currently close to the upper
edge of the band of 5–10 percent, which is deemed sustainable by the MNB. The outstanding borrowing of SMEs is rising
at an even higher rate, also supported by banks' commitments related to the Market-based Lending Scheme. The sound
structure of the pick-up in household loans is guaranteed by the debt cap regulation. Within new housing loans, there was
a rise in the ratio of loans with interest fixed for longer than one year, which contributes to the improvement in financial
stability. In the fourth quarter of 2017, the share of Certified Consumer-Friendly Housing Loan products also grew

THE MONETARY COUNCIL’S KEY FINDINGS RELATED TO THE INFLATION REPORT
INFLATION REPORT • MARCH 2018 9
continuously. The cyclical impact of lending by the banking sector on economic growth is neutral, i.e. no procyclical or
countercyclical impact can be observed.
In 2018, as a result of vigorous domestic absorption, the current account surplus will continue to decrease. However, the
rise in the absorption of EU transfers offsets the decrease in the external trade surplus, and thus net lending will remain
at a relatively high level. From 2019, in parallel with the slower expansion of domestic demand, the decrease in the
current account surplus will stop. Owing to the substantial net lending, Hungary's external vulnerability will continue to
decrease over the forecast horizon.
In 2018, the falling trade surplus resulting from the buoyant growth in domestic demand will entail a decline in the current
account balance. However, net lending will remain largely unchanged, as this is offset by the rising absorption of EU
transfers. In the second half of the forecast horizon, in addition to the slower rise in domestic absorption, due to the ongoing
fast growth in exports resulting from the major FDI inflow, the decline in the current account balance will come to an end.
In the coming years, the absorption of EU transfers may make a substantial contribution to net lending, which will amount
to around 4 percent of GDP. In line with the high net lending, the decline in Hungary's net external debt may continue,
supporting a further decrease in external vulnerability.
Based on preliminary financial account data, the budget deficit in 2017 amounted to 1.9 percent of GDP, which was in line
with the MNB's expectations and fell short of the statutory target of 2.4 percent of GDP. According to our deficit forecast
for 2018, the deficit may correspond to the 2.4-percent target set for this year, followed by a gradually declining deficit
path to roughly 2 percent in 2019 and 2020. The government debt ratio in 2017 decreased by more than 2 percentage
points. The favourable debt ratio trends are supported by the strong economic growth and the decline in the general
government's interest expenses. The decrease in the government debt ratio will continue over the entire forecast horizon,
thereby complying with both EU and Hungarian fiscal rules.
Money market trends in the Central and Eastern European region were mostly determined by the measures taken by the
region’s central banks and events in the developed markets. In line with the yield increase observed in the developed
markets, long-term interbank and government securities market yields in the region also rose. Hungarian long-term
interbank and government securities market yields declined substantially until mid-January as a result of the central
bank's communication and the new MNB instruments, which was later adjusted partially by the upward pressure on
global yields and the reduction of speculative positions on the forint interest rate swap market.
In the Hungarian interbank market, short-term BUBOR fixings have not changed substantially since mid-December, but the
5-year section of the interbank forward yield curve shifted upwards by roughly 30 basis points in line with the increase in
international yields. A similar increase was also observed in the government securities market during the quarter. Auctions
during the past period were characterised by strong demand. Hungarian long-term spreads rose in parallel with the increase
in international yields observed at the beginning of the year. Taking a longer horizon, however, spreads compared with the
euro area and regional yields declined. During the period, the exchange rate of the forint against the euro appreciated
slightly. Euro area monetary conditions – as the key determinants of domestic monetary policy – are expected to remain
accommodative according to market forecasts.
The macroeconomic outlook is surrounded by both upside and downside risks.
In addition to the baseline projection in the March Inflation Report, the Monetary Council also considered two alternative
scenarios. The alternative scenario that assumes more moderate global inflation features a deceleration of the global
economy, resulting in a slower rise in external inflation, and therefore in a domestic inflation path below the baseline
scenario, while it slightly curbs GDP growth. As a result of the scenario assuming faster wage growth, economic growth will
be stronger and inflation will be higher than the forecast in the baseline scenario. In addition to the key scenarios, in terms
of other possible risks, the Monetary Council also discussed scenarios which assume a faster rise in developed market yields,
weaker-than-expected investment activity and faster-than-expected growth in Hungary's export market share.
The inflation target is expected to be achieved in a sustainable manner by the middle of 2019. In the Council’s assessment,
maintaining the base rate and the loose monetary conditions at both the short and long ends for an extended period is
necessary to achieve the inflation target in a sustainable manner.
MAGYAR NEMZETI BANK
10 INFLATION REPORT • MARCH 2018
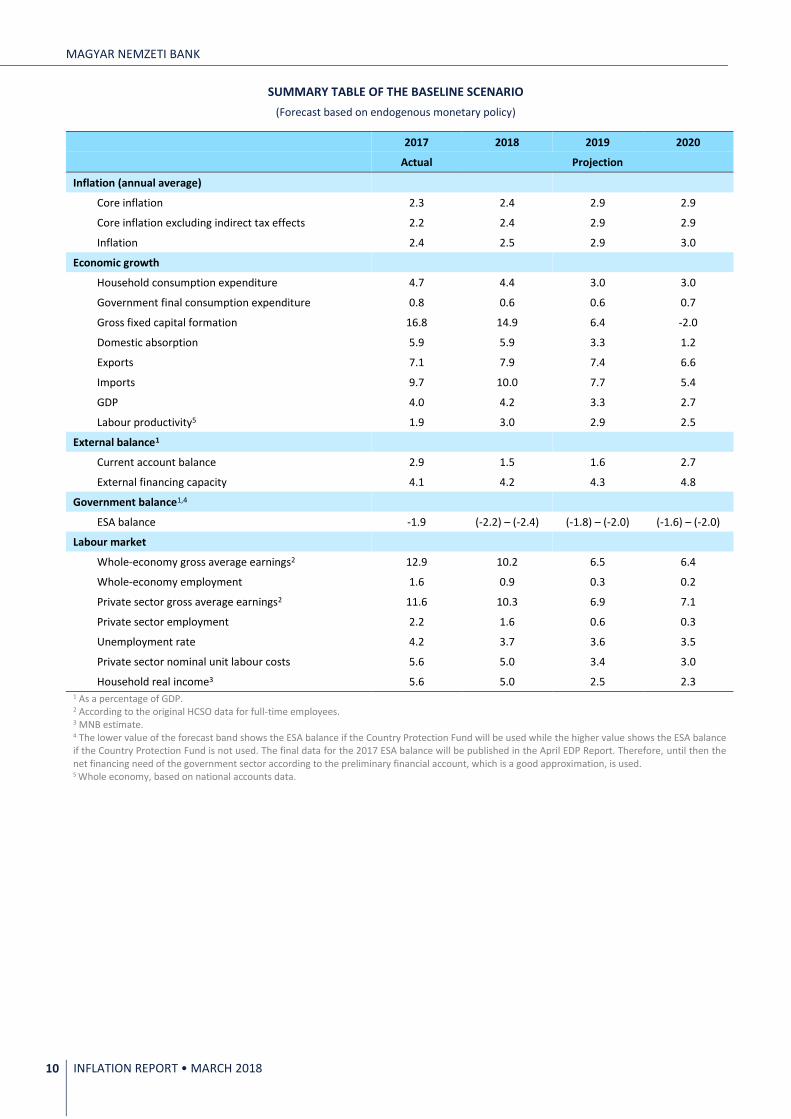
SUMMARY TABLE OF THE BASELINE SCENARIO
(Forecast based on endogenous monetary policy)
2017 2018 2019 2020
Actual Projection
Inflation (annual average)
Core inflation 2.3 2.4 2.9 2.9
Core inflation excluding indirect tax effects 2.2 2.4 2.9 2.9
Inflation 2.4 2.5 2.9 3.0
Economic growth
Household consumption expenditure 4.7 4.4 3.0 3.0
Government final consumption expenditure 0.8 0.6 0.6 0.7
Gross fixed capital formation 16.8 14.9 6.4 -2.0
Domestic absorption 5.9 5.9 3.3 1.2
Exports 7.1 7.9 7.4 6.6
Imports 9.7 10.0 7.7 5.4
GDP 4.0 4.2 3.3 2.7
Labour productivity5 1.9 3.0 2.9 2.5
External balance1
Current account balance 2.9 1.5 1.6 2.7
External financing capacity 4.1 4.2 4.3 4.8
Government balance1,4
ESA balance -1.9 (-2.2) – (-2.4) (-1.8) – (-2.0) (-1.6) – (-2.0)
Labour market
Whole-economy gross average earnings2 12.9 10.2 6.5 6.4
Whole-economy employment 1.6 0.9 0.3 0.2
Private sector gross average earnings2 11.6 10.3 6.9 7.1
Private sector employment 2.2 1.6 0.6 0.3
Unemployment rate 4.2 3.7 3.6 3.5
Private sector nominal unit labour costs 5.6 5.0 3.4 3.0
Household real income3 5.6 5.0 2.5 2.3 1 As a percentage of GDP. 2 According to the original HCSO data for full-time employees. 3 MNB estimate. 4 The lower value of the forecast band shows the ESA balance if the Country Protection Fund will be used while the higher value shows the ESA balance if the Country Protection Fund is not used. The final data for the 2017 ESA balance will be published in the April EDP Report. Therefore, until then the net financing need of the government sector according to the preliminary financial account, which is a good approximation, is used. 5 Whole economy, based on national accounts data.
INFLATION AND REAL ECONOMY OUTLOOK
INFLATION REPORT • MARCH 2018 11
1. Inflation and real economy outlook
1.1. Inflation forecast
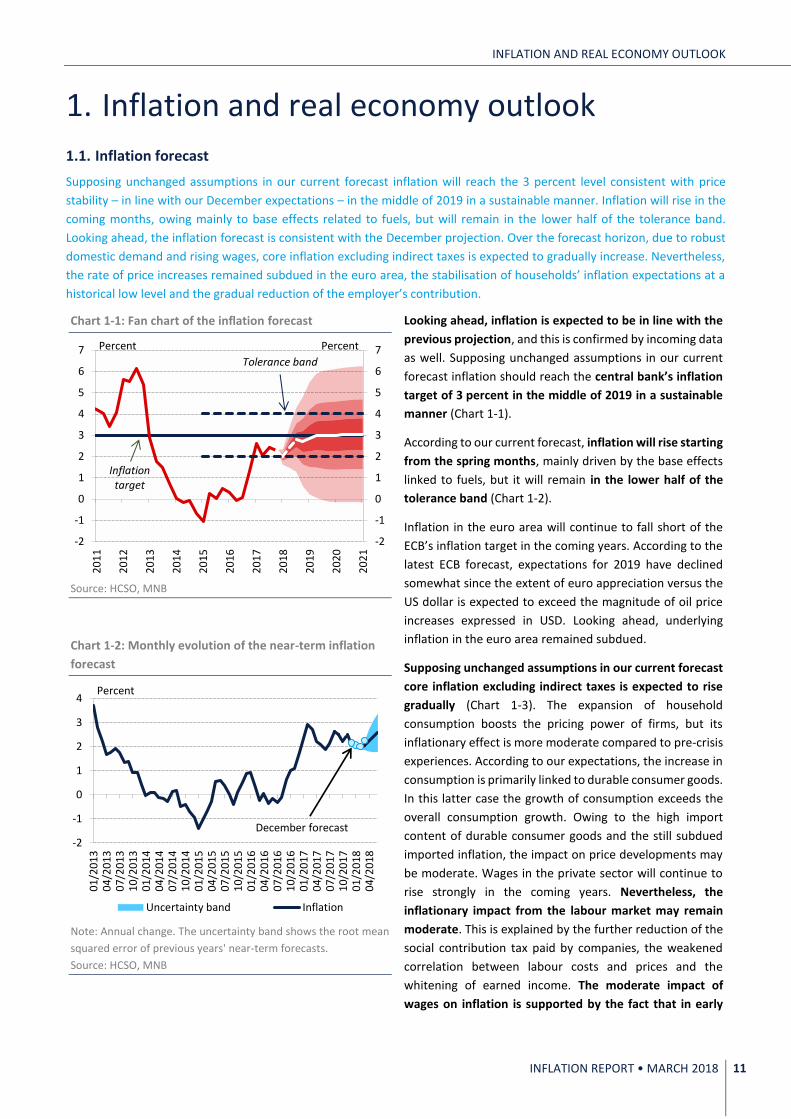
Supposing unchanged assumptions in our current forecast inflation will reach the 3 percent level consistent with price
stability – in line with our December expectations – in the middle of 2019 in a sustainable manner. Inflation will rise in the
coming months, owing mainly to base effects related to fuels, but will remain in the lower half of the tolerance band.
Looking ahead, the inflation forecast is consistent with the December projection. Over the forecast horizon, due to robust
domestic demand and rising wages, core inflation excluding indirect taxes is expected to gradually increase. Nevertheless,
the rate of price increases remained subdued in the euro area, the stabilisation of households’ inflation expectations at a
historical low level and the gradual reduction of the employer’s contribution.
Chart 1-1: Fan chart of the inflation forecast
Source: HCSO, MNB
Chart 1-2: Monthly evolution of the near-term inflation
forecast
Note: Annual change. The uncertainty band shows the root mean
squared error of previous years' near-term forecasts.
Source: HCSO, MNB
Looking ahead, inflation is expected to be in line with the
previous projection, and this is confirmed by incoming data
as well. Supposing unchanged assumptions in our current
forecast inflation should reach the central bank’s inflation
target of 3 percent in the middle of 2019 in a sustainable
manner (Chart 1-1).
According to our current forecast, inflation will rise starting
from the spring months, mainly driven by the base effects
linked to fuels, but it will remain in the lower half of the
tolerance band (Chart 1-2).
Inflation in the euro area will continue to fall short of the
ECB’s inflation target in the coming years. According to the
latest ECB forecast, expectations for 2019 have declined
somewhat since the extent of euro appreciation versus the
US dollar is expected to exceed the magnitude of oil price
increases expressed in USD. Looking ahead, underlying
inflation in the euro area remained subdued.
Supposing unchanged assumptions in our current forecast
core inflation excluding indirect taxes is expected to rise
gradually (Chart 1-3). The expansion of household
consumption boosts the pricing power of firms, but its
inflationary effect is more moderate compared to pre-crisis
experiences. According to our expectations, the increase in
consumption is primarily linked to durable consumer goods.
In this latter case the growth of consumption exceeds the
overall consumption growth. Owing to the high import
content of durable consumer goods and the still subdued
imported inflation, the impact on price developments may
be moderate. Wages in the private sector will continue to
rise strongly in the coming years. Nevertheless, the
inflationary impact from the labour market may remain
moderate. This is explained by the further reduction of the
social contribution tax paid by companies, the weakened
correlation between labour costs and prices and the
whitening of earned income. The moderate impact of
wages on inflation is supported by the fact that in early
-2
-1
0
1
2
3
4
5
6
7
-2
-1
0
1
2
3
4
5
6
7
20
11
20
12
20
13
20
14
20
15
20
16
20
17
20
18
20
19
20
20
20
21
Percent Percent
Inflation target
Tolerance band
-2
-1
0
1
2
3
4
01
/20
13
04
/20
13
07
/20
13
10
/20
13
01
/20
14
04
/20
14
07
/20
14
10
/20
14
01
/20
15
04
/20
15
07
/20
15
10
/20
15
01
/20
16
04
/20
16
07
/20
16
10
/20
16
01
/20
17
04
/20
17
07
/20
17
10
/20
17
01
/20
18
04
/20
18
Percent
Uncertainty band Inflation
December forecast

MAGYAR NEMZETI BANK
12 INFLATION REPORT • MARCH 2018
Chart 1-3: Decomposition of the inflation forecast
Source: HCSO, MNB
Table 1-1: Details of the inflation forecast
2018 2019 2020
Core inflation 2.4 2.9 2.9
Contribution to inflation 1.7 2.0 2.0
Non-core
inflation
Unprocessed
food 3.6 4.0 5.4
Fuel and market
energy 4.4 4.3 3.3
Regulated prices 0.9 1.6 2.3
Total 2.5 2.9 3.2
Contribution to inflation 0.8 0.9 1.0
Inflation 2.5 2.9 3.0
Note: Due to rounding, the sum of contributions may differ from
the aggregated value.
Source: MNB
2018 the price index of labour-intensive services remained
basically unchanged.
Looking ahead, inflation in non-core items shows subdued
dynamics and is basically in line with our December
forecast (Table 1-1). Fuel prices in Hungary are
fundamentally influenced by oil prices in EUR. These prices
remained essentially unchanged versus the December
assumption due to the appreciation of euro against the
US dollar. Looking ahead, futures prices point to a gradually
declining path. In accordance with the long-term trend,
prices of unprocessed food will gradually rise over the
forecast horizon. Based on our assumptions, regulated
energy prices will not change until the end of the forecast
horizon, and only minor price changes are expected in the
case of non-energy regulated prices.
-2-101234567
-2-101234567
2011 2012 2013 2014 2015 2016 2017 2018 2019 2020 2021Indirect tax effectNon-core inflation excluding indirect taxesCore inflation excluding indirect taxesInflation (percent)Inflation target
Percentage point Percentage point
Tolerance band

INFLATION AND REAL ECONOMY OUTLOOK
INFLATION REPORT • MARCH 2018 13
1.2. Real economy forecast
Supposing unchanged assumptions in our current forecast in 2018, we expect economic growth to be even faster than in
2017, which will be followed by a gradual deceleration. Subsequently, based on the current assumptions, we anticipate
that growth will gradually decelerate from 2019. Over the short term, stronger domestic demand driven by the rise in
investments and household consumption will continue to play a major role in Hungary’s economic growth. Investments are
expected to expand substantially until 2019 supported by the individual large-scale investments, stronger underlying
corporate investment developments, a pick-up in the housing market and the utilisation of EU funds. Consumption growth
is fostered by the dynamic increase in real wages, high levels of net financial assets and the second-round effects of housing
market upturn. The rise in household consumption is also supported by the historically elevated level of consumer
confidence. Due to the high import demand of domestic absorption items, net exports will contribute negatively to
economic growth in the short run. In the second half of the forecast horizon, in parallel with weakening cyclical factors,
economic growth is expected to gradually decelerate. This year, the fiscal demand will stimulate economic growth, but
based on our technical assumptions by the second half of the forecast horizon, the effects of government measures
supporting growth will fade, and at the same time the demand-tightening effect of fiscal policy will be dominant. With
respect to Hungary’s industrial sector, as the new capacities built in recent years start production, the expansion of
industrial exports is expected to accelerate this year. As a result of the positive global growth outlook, external demand is
expected to pick up, supporting the expansion of Hungarian exports. In parallel with stronger domestic demand, output
was close to its potential level at the end of 2017. In terms of economic growth, productivity and competitiveness will
become increasingly important in the longer term.
Chart 1-4: Fan chart of the GDP forecast
Source: HCSO, MNB
Chart 1-5: Contributions to annual changes in GDP
Source: HCSO, MNB
Supposing unchanged assumptions in our current forecast
in 2018, we expect economic growth to be even faster
than in 2017, which will be followed by a gradual
deceleration. GDP is projected to expand at rates of
4.2 percent, 3.3 percent and 2.7 percent in 2018, 2019 and
2020, respectively (Chart 1-4). Over the short run, rising
domestic demand will continue to play a major role in
Hungarian growth, with investment and household
consumption growth as the key factors (Chart 1-5).
Total investments will expand substantially until 2019, as
a result of the simultaneous pick-up in investment activity
by all three sectors. Looking ahead, the investment rate
may remain steadily above 20 percent. However, as cyclical
factors weaken, investment activity is expected to decline
at the end of the forecast horizon (Chart 1-5).
Supposing unchanged assumptions in our current forecast
business investment is projected to continue rising over the
short run. Underlying investment developments in the
corporate sector are strengthening considerably, in line
with the changes in domestic demand and the low interest
rate environment (Chart 1-6). According to our forecast, the
increase in outstanding SME loans will be within the
sustainable 5–10 percent range (Chart 1-8). Looking ahead,
EU funds will also support business investment, the
majority of which focuses on economic development.
Large-scale investment projects and capacity expansions
may also boost investment in the corporate sector. The
large-scale investment projects will support the expansion
of Hungarian GDP not only directly, but also through
second-round effects. As the large-scale investment
-3
-2
-1
0
1
2
3
4
5
6
-3
-2
-1
0
1
2
3
4
5
6
20
10
20
11
20
12
20
13
20
14
20
15
20
16
20
17
20
18
20
19
20
20
20
21
Percent Percent
Actual HCSO data MNB nowcast
MNB forecast
-6-4-202468
-6-4-202468
20
13
20
14
20
15
20
16
20
17
20
18
20
19
20
20
Net exportsChanges in inventoriesGross fixed capital formationActual final consumption of governmentFinal consumption of householdsGDP (percent)
Percentage point Percentage point

MAGYAR NEMZETI BANK
14 INFLATION REPORT • MARCH 2018
Chart 1-6: Evolution of investment rate by sectors
Source: HCSO, MNB
Chart 1-7: Actual utilisation of EU funds
Source: MNB
Chart 1-8: Annual changes in lending to non-financial
corporations and SMEs
Note: Transaction-based, year-on-year data.
Source: MNB
projects are incorporated into the base, and the EU funds
available to companies taper off, a correction in business
investment is expected in 2020.
We expect public investment from EU funds to expand at
the beginning of the forecast horizon, supported by the
upswing in actual absorption. In 2017, a major portion of
pay-outs was related to advance payments, and therefore
last year the rise in investment financed by EU funds was
slower than expected. Accordingly, effective absorption is
projected to be faster this year. It is not anticipated that
advance payments and their absorption, to be realised
later, will have an impact on the total fiscal and real
economy effect of the funds available in the EU’s
programming period between 2014 and 2020. They only
influence their distribution across the years. If our
assumptions prove correct, the start of the large-scale
investment in Paks is not expected to raise the GDP-
proportionate level of the public investment path until
2020. From 2020 onwards, however, a downturn in the
effective absorption of EU funds is projected, which will
result in more subdued public investment (Chart 1-7).
Supposing unchanged assumptions in our current forecast
in line with the upturn on the housing market, household
investment is expected to increase until the end of 2019,
supported by government programmes. The high number
of home building permits and the substantial increase in the
construction of new homes also indicates acceleration in
household investment activity. According to the prevailing
tax laws, the VAT on the purchase of homes will return to
its original level after 2019. Consequently, the upturn on
the housing market is expected to come to a halt. With the
slowdown in the housing market in 2020, household
investment will decline.
We expect household consumption to continue expanding
over the forecast horizon, and consequently consumption
will remain a key factor behind economic growth. The
increase in households’ consumption expenditure is
strongly supported by rising income that is due to
administrative measures at the beginning of this year and
improving underlying trends. In part, the winter-related
utility cost reduction announced for this year raises
households’ disposable income (as it means additional
savings for households), and the previously announced
pension premiums also contribute to consumption
growth. The previously accumulated high levels of net
financial assets also support the expansion of consumption
(the development of households’ net financial assets is
discussed in Chapter 3). Consumption is also driven by the
historically high level of consumer confidence and the
0
5
10
15
20
25
20
00
20
01
20
02
20
03
20
04
20
05
20
06
20
07
20
08
20
09
20
10
20
11
20
12
20
13
20
14
20
15
20
16
20
17
20
18
20
19
20
20
Corporate sector Households Government
As a percentage of GDP
1
2
3
4
5
6
7
1
2
3
4
5
6
7
2016 2017 2018 2019 2020
Actual utilisation GFS expenditure
As a percentage of GDP As a percentage of GDP
-10-8-6-4-202468101214
-10-8-6-4-202468
101214
20
09
20
10
20
11
20
12
20
13
20
14
20
15
20
16
20
17
20
18
20
19
20
20
PercentPercent
SME sector Corporate sector

INFLATION AND REAL ECONOMY OUTLOOK
INFLATION REPORT • MARCH 2018 15
Chart 1-9: Annual change in the level and components of
personal disposable income
Note: Annual change.
Source: MNB
Chart 1-10: Evolution of households' consumption,
investment and financial savings rates as a percentage of
disposable income
Source: HCSO, MNB
second-round effects of the housing market boom. An
expansion in consumption is also supported by the fact that
households’ consumption spending continues to fall short
of the levels warranted by the underlying income trends.
Due to postponed consumption demand, the household
sector still has a substantial recovery potential, which is
mainly reflected in higher consumption of import-intensive
durable goods. At the end of the forecast horizon, the
expansion in household consumption is projected to
decelerate, as a result of more moderate income growth
(Chart 1-9).
Looking ahead, we expect that households will increase
their consumption-to-income ratio, while real income
developments will decelerate. According to the latest
financial accounts data, households have accumulated
more savings than previously forecasted (Chart 1-10),
therefore supporting future home purchases. According to
our current projections, the savings rate will develop
around the 2017 level. However, in line with an increase in
the propensity to consume, the savings rate will decline
from its currently high level from 2019 and then stabilise in
2020, in parallel with lower household investment.
On the whole, the short and medium-term expectations for
growth in Hungary’s main trading partners have been
revised upwards, and stronger growth is expected on
external markets in the coming years. As a result of the
favourable prospects for economic growth, we expect a
more rapid expansion in external demand. The more
favourable global growth expectations are mainly
attributable to spillover effects from the infrastructure
investment programme and the corporate tax reduction
announced by the Trump Administration and the recent
increase in external trade intensity. However, there are also
downside risks to global growth (asset overvaluation on the
capital market, the outcome of Brexit negotiations which
influence European prospects and a rising tide of
protectionist measures). In parallel with the improvement
in international economic activity and the more favourable
external demand conditions, Hungary’s industrial value
added and exports should continue to grow. In recent
years and this year, substantial new capacities have been
built in Hungary’s industrial sector, and when these start
production, the expansion of industrial exports is expected
to gain a new momentum. Supposing unchanged
assumptions in our current forecast, with the development
of new export capacities, the growth rate of exports will
consistently exceed the rate of increase in Hungary’s
external demand, and thus Hungary’s export market share
will improve further (Chart 1-11). The strengthening
-8-6-4-202468
10
20
07
20
08
20
09
20
10
20
11
20
12
20
13
20
14
20
15
20
16
20
17
20
18
20
19
20
20
Percentage point
InflationOther IncomeFinancial transfersEmploymentNet average earningsPersonal Disposable Income (%)
80
82
84
86
88
90
92
94
-2
0
2
4
6
8
10
12
20
02
20
03
20
04
20
05
20
06
20
07
20
08
20
09
20
10
20
11
20
12
20
13
20
14
20
15
20
16
20
17
20
18
20
19
20
20
Financial savings rate
Investment rate
Consumption rate (right axis)
Percent Percent

MAGYAR NEMZETI BANK
16 INFLATION REPORT • MARCH 2018
Chart 1-11: Changes in export market share
Note: Annual change.
Source: HCSO, MNB
Chart 1-12: Annual change in labour productivity
Note: Employment for production of GDP, national accounts data.
Source: HCSO, MNB
domestic demand factors (consumption, investment)
significantly boost import dynamics, and therefore we
expect net exports to contribute negatively to economic
growth this year and the next. In the second half of the
forecast horizon, net exports will contribute positively to
economic growth due to the favourable economic activity
on external markets, the upswing in industrial production
and the lower import requirement stemming from slower
domestic absorption.
In 2017, agricultural performance contributed negatively to
GDP growth. Assuming an average performance by the
sector, agriculture may slightly raise growth this year.
Potential growth will stand at about 3 percent, primarily
due to the expansion of private sector investment and the
improving labour market activity. At the same time,
demographic developments increasingly represent an
effective constraint to employment growth, and thus at
the end of the forecast horizon, the participation rate
no longer contributes to potential growth. Our forecast
points to an improvement in labour productivity
(Chart 1-12). The favourable interest rate environment,
improving lending and the reduction in the relative
price of capital (as compared to labour) are all factors
which will stimulate investment activity. Recovering
private investments boost productivity not only
through the installation of sophisticated equipment
and the construction of modern industrial facilities, but
also through the adoption of the knowledge necessary
for the production of higher value added. The
announced large-scale investments and the capacity
expansion of the supplier network generate positive
feedback in the services sector of higher value added
(information and communication, finance, logistics,
marketing). In the rising phase of the business cycle,
economic growth and increasing labour productivity
typically reinforce each other, and therefore looking ahead
we expect productivity to improve even more (Kaldor–
Verdoorn Law).
-20
-15
-10
-5
0
5
10
15
20
-20
-15
-10
-5
0
5
10
15
20
20
02
20
03
20
04
20
05
20
06
20
07
20
08
20
09
20
10
20
11
20
12
20
13
20
14
20
15
20
16
20
17
20
18
20
19
20
20
PercentPercent
Export market share
Exports
Import-based external demand
-6
-4
-2
0
2
4
6
-12
-8
-4
0
4
8
12
20
05
20
06
20
07
20
08
20
09
20
10
20
11
20
12
20
13
20
14
20
15
20
16
20
17
20
18
20
19
20
20
Total (right axis) Industry Services
Percent Percent
INFLATION AND REAL ECONOMY OUTLOOK
INFLATION REPORT • MARCH 2018 17
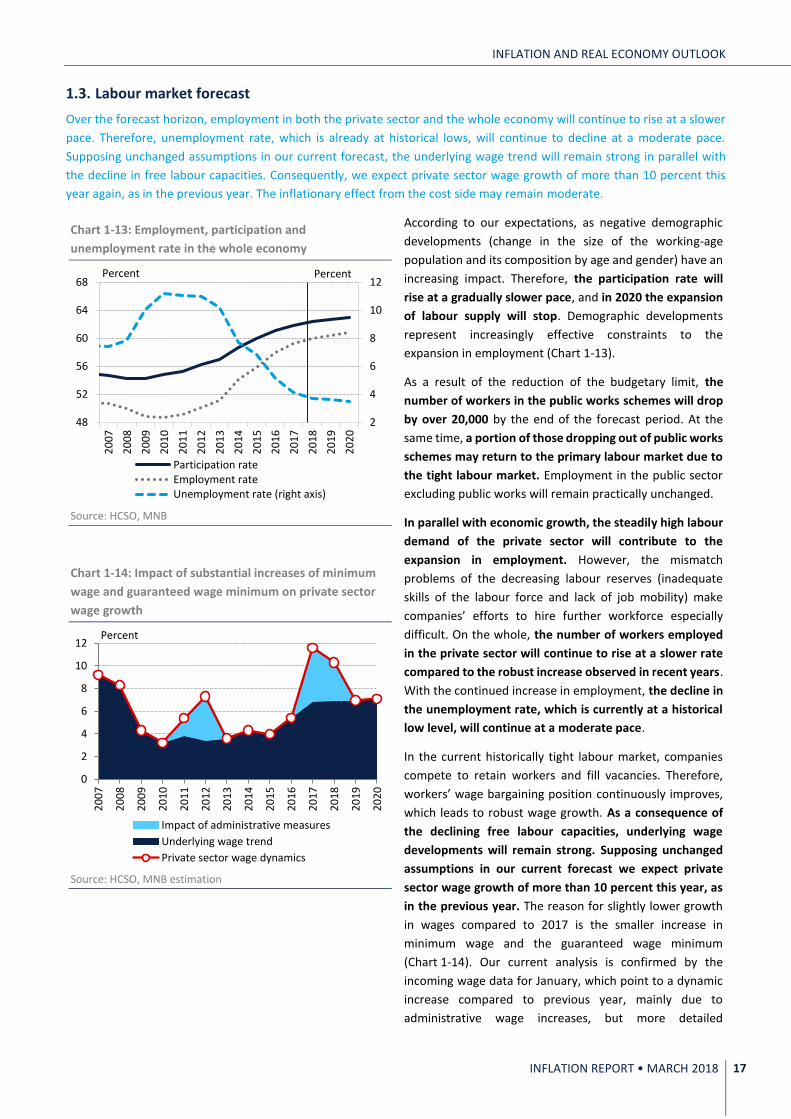
1.3. Labour market forecast
Over the forecast horizon, employment in both the private sector and the whole economy will continue to rise at a slower
pace. Therefore, unemployment rate, which is already at historical lows, will continue to decline at a moderate pace.
Supposing unchanged assumptions in our current forecast, the underlying wage trend will remain strong in parallel with
the decline in free labour capacities. Consequently, we expect private sector wage growth of more than 10 percent this
year again, as in the previous year. The inflationary effect from the cost side may remain moderate.
Chart 1-13: Employment, participation and
unemployment rate in the whole economy
Source: HCSO, MNB
Chart 1-14: Impact of substantial increases of minimum
wage and guaranteed wage minimum on private sector
wage growth
Source: HCSO, MNB estimation
According to our expectations, as negative demographic
developments (change in the size of the working-age
population and its composition by age and gender) have an
increasing impact. Therefore, the participation rate will
rise at a gradually slower pace, and in 2020 the expansion
of labour supply will stop. Demographic developments
represent increasingly effective constraints to the
expansion in employment (Chart 1-13).
As a result of the reduction of the budgetary limit, the
number of workers in the public works schemes will drop
by over 20,000 by the end of the forecast period. At the
same time, a portion of those dropping out of public works
schemes may return to the primary labour market due to
the tight labour market. Employment in the public sector
excluding public works will remain practically unchanged.
In parallel with economic growth, the steadily high labour
demand of the private sector will contribute to the
expansion in employment. However, the mismatch
problems of the decreasing labour reserves (inadequate
skills of the labour force and lack of job mobility) make
companies’ efforts to hire further workforce especially
difficult. On the whole, the number of workers employed
in the private sector will continue to rise at a slower rate
compared to the robust increase observed in recent years.
With the continued increase in employment, the decline in
the unemployment rate, which is currently at a historical
low level, will continue at a moderate pace.
In the current historically tight labour market, companies
compete to retain workers and fill vacancies. Therefore,
workers’ wage bargaining position continuously improves,
which leads to robust wage growth. As a consequence of
the declining free labour capacities, underlying wage
developments will remain strong. Supposing unchanged
assumptions in our current forecast we expect private
sector wage growth of more than 10 percent this year, as
in the previous year. The reason for slightly lower growth
in wages compared to 2017 is the smaller increase in
minimum wage and the guaranteed wage minimum
(Chart 1-14). Our current analysis is confirmed by the
incoming wage data for January, which point to a dynamic
increase compared to previous year, mainly due to
administrative wage increases, but more detailed
2
4
6
8
10
12
48
52
56
60
64
68
20
07
20
08
20
09
20
10
20
11
20
12
20
13
20
14
20
15
20
16
20
17
20
18
20
19
20
20
PercentPercent
Participation rateEmployment rateUnemployment rate (right axis)
0
2
4
6
8
10
12
20
07
20
08
20
09
20
10
20
11
20
12
20
13
20
14
20
15
20
16
20
17
20
18
20
19
20
20
Percent
Impact of administrative measures
Underlying wage trend
Private sector wage dynamics

MAGYAR NEMZETI BANK
18 INFLATION REPORT • MARCH 2018
Chart 1-15: Decomposition of real unit labour cost growth
in the private sector
Source: HCSO, MNB
Chart 1-16: Annual changes in gross average wages and
labour cost in the private sector
Source: HCSO, MNB
information on underlying wage developments will be
included in the wage data for March. According to our
forecast, taking into account direct and spillover effects, the
measures included in the wage agreement boost underlying
wage developments by 3-4 percentage points. Over the
rest of the forecast horizon, the expansion of real labour
costs will be in line with the rise in productivity
(Chart 1-15).
The effect of wage dynamics on labour costs is reduced by
the fact that the social contribution tax on firms will be cut
by a further 2.5 percentage points this year, and therefore
the inflationary effect from the cost side may remain
moderate. In line with the wage agreement, after 2018 the
social contribution tax will decline in four more steps by
2 percentage points in each step, depending on the rise in
real wages. According to our forecast, in 2019 Q4, real
wages in the private sector will increase by more than
6 percent compared to 2018 Q1. Consequently, the next
reduction in contributions may take place in 2020 Q2
(Chart 1-16).
-9
-6
-3
0
3
6
9
12
20
07
20
08
20
09
20
10
20
11
20
12
20
13
20
14
20
15
20
16
20
17
20
18
20
19
20
20
EmploymentValue addedPrivate sector deflatorCompensation per employeeReal unit labour cost
Percentage points
20
07
20
08
20
09
20
10
20
11
20
12
20
13
20
14
20
15
20
16
20
17
20
18
20
19
20
20
0
2
4
6
8
10
12
Gross average wages Compensation per employee
Percent

INFLATION AND REAL ECONOMY OUTLOOK
INFLATION REPORT • MARCH 2018 19
Box 1-1: Assumptions applied in our forecast
Hungary is a small, open economy, and as such our forecasts for the most important macroeconomic variables are
fundamentally influenced by developments in external factors and changes in the related assumptions. The purpose of
this brief presentation of the changes in the external assumptions is to make our forecasts more transparent (Table 1-2).
Table 1-2: Main external assumptions of our forecast
Note: Annual average in the case of oil prices. * Growth rate of Hungary’s 21 most important export partners, weighted by share in
exports.
Source: CBT, Bloomberg, OECD, Consensus Economics, MNB, ECB
Exhibiting high volatility, global oil prices were in the USD 60–70 band. Brent crude oil prices started rising gradually at
the end of last year, was around USD 70 in January. After that, in February the price declined to USD 65 on average
accompanied by significant volatility, which also continued in March. The mutually opposing effects of geopolitical
tensions in the Middle East, furthermore the record high US production and the stronger-than-expected rise in crude stocks
are behind the volatile development of oil prices. The implementation rate of the end-November 2017 OPEC agreement
is now at a historic high, but more than half of the production cut is offset by the expansion in US production, which rose
to a 50-year high at the end of last year, reaching 10 million barrels per day, where it still stands. According to the February
report by the International Energy Agency (IEA), the oil market may be balanced this year, but this may be influenced by
such important factors like the increase in US shale oil production, driven by further decreasing marginal costs accompanied
by rising oil prices and increasing efficiency, as well as the development of the economic situation in Venezuela. The
evolution of Hungarian fuel prices depends on oil prices expressed in EUR. Based on futures prices, oil prices expressed in
EUR essentially remained unchanged compared to our assumption in December, due to the weakening of the US dollar
against the euro, and looking ahead a gradually declining path is projected. With respect to the EUR/USD cross rate, a
stronger euro is expected over the forecast horizon as compared to our December assumption.
In its latest forecast, the European Central Bank continues to project that price dynamics will fall short of its inflation
target over the entire forecast horizon. The primary reason behind the persistently low inflation is that energy prices are
undermining underlying inflation trends. The ECB has revised its inflation forecast for 2019 slightly downwards due to the
inflationary impact of EUR appreciation, which is expected to exceed the rise in oil prices. Over the forecast horizon, euro
area inflation will rise from the average 1.4 percent projected for 2018–2019 to 1.7 percent in 2020, mainly due to rising
demand and cost-side effects from the tightening labour market (stronger nominal wage growth), as well as labour
shortages in some parts of the euro area. The effects of non-core inflation items will basically offset each other from the
second half of the forecast horizon: while the oil futures slope downward, energy taxes and the price changes of
unprocessed food will lead to an increase in inflation.
As a result of favourable international prospects for economic activity, we expect a stronger expansion of external demand
than in our December assumptions. On the whole, the short and medium-term forecasts for global economic output have
been revised upwards, suggesting more robust international economic activity. However, there are also downside risks to
global growth outlook (asset overvaluation on the capital market, the outcome of Brexit negotiations which influence
European prospects and a rising tide of protectionist measures), thus European growth is surrounded by high uncertainty.
All in all, as a result of favourable prospects for economic activity, we expect more buoyant expansion in external demand
than in our December assumptions.
December Actual December Actual December Actual 2018 2019 2020
EUR/USD 1.19 1.23 1.19 1.23 1.19 1.23 3.4% 3.4% 3.4%
Oi l (USD/barrel ) 61.7 65.1 59.0 61.4 57.4 58.6 5.5% 4.1% 2.1%
Oi l (EUR/barrel ) 52.0 52.9 49.8 49.9 48.4 47.7 1.7% 0.2% -1.4%
Food prices
Wheat (USD/bushel ) 4.63 4.80 5.24 5.40 5.55 5.61 3.7% 3.1% 1.1%
Maize (USD/bushel ) 3.69 3.79 4.03 4.07 4.17 4.20 2.7% 1.0% 0.7%
Euro area inflation (%) 1.4 1.4 1.5 1.4 1.7 1.7 0.0 pp. -0.1 pp. 0.0 pp.
GDP growth of Hungary's main trading partners*(%) 2.6 2.9 2.5 2.6 2.4 2.5 0.3 pp. 0.1 pp. 0.1 pp.
ChangeTechnical assumptions
2018 2019 2020
MAGYAR NEMZETI BANK
20 INFLATION REPORT • MARCH 2018
Based on futures prices, in the case of wheat and maize slightly higher price increases are expected compared to the
assumptions in the December Inflation Report.
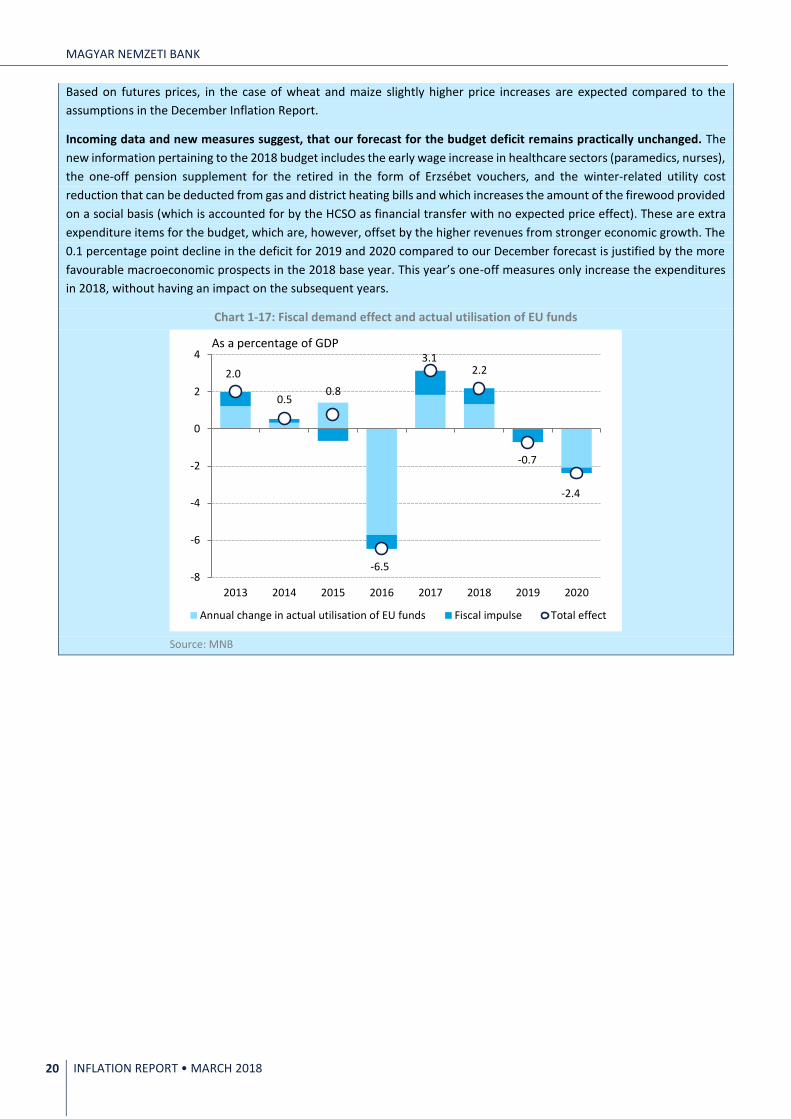
Incoming data and new measures suggest, that our forecast for the budget deficit remains practically unchanged. The
new information pertaining to the 2018 budget includes the early wage increase in healthcare sectors (paramedics, nurses),
the one-off pension supplement for the retired in the form of Erzsébet vouchers, and the winter-related utility cost
reduction that can be deducted from gas and district heating bills and which increases the amount of the firewood provided
on a social basis (which is accounted for by the HCSO as financial transfer with no expected price effect). These are extra
expenditure items for the budget, which are, however, offset by the higher revenues from stronger economic growth. The
0.1 percentage point decline in the deficit for 2019 and 2020 compared to our December forecast is justified by the more
favourable macroeconomic prospects in the 2018 base year. This year’s one-off measures only increase the expenditures
in 2018, without having an impact on the subsequent years.
Chart 1-17: Fiscal demand effect and actual utilisation of EU funds
Source: MNB
2.0
0.50.8
-6.5
3.12.2
-0.7
-2.4
-8
-6
-4
-2
0
2
4
2013 2014 2015 2016 2017 2018 2019 2020
Annual change in actual utilisation of EU funds Fiscal impulse Total effect
As a percentage of GDP

INFLATION AND REAL ECONOMY OUTLOOK
INFLATION REPORT • MARCH 2018 21
Table 1-3: Changes in projections compared to the previous Inflation Report
2017 2018 2019 2020
Actual
Projection
December Current December Current December Current
Inflation (annual average)
Core inflation 2.3 2.5 2.4 2.8 2.9 2.9 2.9
Core inflation excluding indirect tax effects
2.2 2.5 2.4 2.8 2.9 2.9 2.9
Inflation 2.4 2.5 2.5 2.9 2.9 3.0 3.0
Economic growth
Household consumer expenditure 4.7 3.8 4.4 3.0 3.0 3.0 3.0
Government final consumption expenditure
0.8 0.7 0.6 0.8 0.6 0.7 0.7
Gross fixed capital formation 16.8 12.0 14.9 4.1 6.4 -2.0 -2.0
Domestic absorption 5.9 4.7 5.9 2.8 3.3 1.2 1.2
Exports 7.1 7.8 7.9 7.3 7.4 6.6 6.6
Imports 9.7 8.9 10.0 7.2 7.7 5.4 5.4
GDP 4.0 3.9 4.2 3.2 3.3 2.7 2.7
Labour productivity5 1.9 3.2 3.0 2.9 2.9 2.5 2.5
External balance1
Current account balance 2.9 1.4 1.5 1.8 1.6 2.8 2.7
External financing capacity 4.1 3.9 4.2 4.6 4.3 4.9 4.8
Government balance1,4
ESA balance -1.9 (-2.2)-(-2.4) (-2.2)-(-2.4) (-1.9)-(-2.1) (-1.8)-(-2.0) (-1.7)-(-2.1) (-1.6)-(-2.0)
Labour market
Whole-economy gross average earnings2
12.9 9.6 10.2 6.5 6.5 6.4 6.4
Whole-economy employment 1.6 0.6 0.9 0.3 0.3 0.2 0.2
Private sector gross average earnings2
11.6 8.7 10.3 6.9 6.9 7.1 7.1
Private sector employment 2.2 1.6 1.6 0.6 0.6 0.3 0.3
Unemployment rate 4.2 4.0 3.7 3.9 3.6 3.7 3.5
Private sector nominal unit labour cost
5.6 3.4 5.0 3.5 3.4 3.0 3.0
Household real income3 5.6 4.1 5.0 2.5 2.5 2.3 2.3
1 As a percentage of GDP. 2 According to the HCSO data for full-time employees. 3 MNB estimate. 4 The lower value of the forecast band shows the ESA balance if the Country Protection Fund will be used while the higher value shows the ESA balance if the Country Protection Fund is not used. The final data for the 2017 ESA balance will be published in the April EDP Report. Therefore, until then the net financing need of the government sector according to the preliminary financial account, which is a good approximation, is used. 5 Whole economy, based on national accounts data, nominal index.

MAGYAR NEMZETI BANK
22 INFLATION REPORT • MARCH 2018
Table 1-4: MNB baseline forecast compared to other forecasts
2018 2019 2020
Consumer Price Index (annual average growth rate, %)
MNB (March 2018) 2.5 2.9 3.0
Consensus Economics (March 2018)¹ 1.7 – 2.6 – 3.5 2.5 – 3.0 – 3.9
European Commission (February 2018) 2.8 2.9
IMF (October 2017) 3.2 3.0 3.0
OECD (November 2017) 2.7 3.4
Reuters survey (March 2018)¹ 2.3 – 2.5 – 2.7 2.5 – 2.9 – 3.5 3.0 – 3.1 – 3.2
GDP (annual growth rate, %)
MNB (March 2018)⁵ 4.2 3.3 2.7
Consensus Economics (March 2018)¹ 2.7 – 3.7 – 4.5 2.0 – 2.9 – 3.6
European Commission (February 2018) 3.7 3.1
IMF (October 2017) 3.4 2.8 2.6
OECD (November 2017) 3.6 2.8
Reuters survey (March 2018)¹ 3.5 – 3.9 – 4.5 2.8 – 3.3 – 3.6
Current account balance³
MNB (March 2018) 1.5 1.6 2.7
European Commission (November 2017) 3.3 3.2
IMF (October 2017) 4.2 3.2 2.3
OECD (November 2017) 2.5 0.8
Reuters survey (March 2018) 2.3 – 4.3 – 5.5 2.1 – 4.0 – 5.6
Budget balance (ESA 2010 method)3,4
MNB (March 2018) (-2.2) – (-2.4) (-1.8) – (-2.0) (-1.6) – (-2.0)
Consensus Economics (March 2018)¹ (-1.6) – (-2.4) – (-3.0) (-1.6) – (-2.3) – (-3.0)
European Commission (November 2017) -2.6 -2.3
IMF (October 2017) -2.9 -2.7 -2.7
OECD (November 2017) -2.7 -2.4
Reuters survey (March 2018)¹ (-2.3) – (-2.4) – (-2.8) (-1.6) – (-2.2) – (-2.8)
Forecasts on the size of Hungary's export markets (annual growth rate, %)
MNB (March 2018) 4.8 4.2 4.1
European Commission (November 2017)² 5.2 4.8
IMF (October 2017)² 4.9 4.6 4.4
OECD (November 2017)² 4.8 4.5
Forecasts on the GDP growth rate of Hungary's trade partners (annual growth rate, %)
MNB (March 2018) 2.6 2.5 2.4
Consensus Economics (March 2018)² 2.7 2.3
European Commission (February 2018)² 2.7 2.5
IMF (January 2018)² 2.6 2.3 2.1
OECD (March 2018)² 2.6 2.4 1 For Reuters and Consensus Economics surveys, in addition to the average value of the analysed replies, we also indicate the lowest and the highest values to illustrate the distribution of the data. 2 Values calculated by the MNB; the projections of the named institutions for the relevant countries are adjusted with the weighting system of the MNB, which is also used for the calculation of the bank’s own external demand indices. Certain institutions do not prepare forecast for all partner countries. 3 As a percentage of GDP. 4 The lower value of the forecast band shows the ESA balance if the Country Protection Fund will be used while the higher value shows the ESA balance if the Country Protection Fund is not used. The final data for the 2017 ESA balance will be published in the April EDP Report. Therefore, until then the net financing need of the government sector according to the preliminary financial account, which is a good approximation, is used. Source: Consensus Economics, European Commission, IMF, OECD, Reuters poll

EFFECTS OF ALTERNATIVE SCENARIOS ON OUR FORECAST
INFLATION REPORT • MARCH 2018 23
2. Effects of alternative scenarios on our forecast
In addition to the baseline projection in the March Inflation Report, the Monetary Council highlighted two alternative
scenarios. The alternative scenario that assumes lower global inflation represents lower inflation and growth paths than in
the baseline scenario. According to the scenario assuming faster wage growth, domestic economic growth will be more
robust and inflation will be higher than the forecast in the baseline scenario. Along with the highlighted scenarios, the
Monetary Council discussed other risks, including scenarios featuring a faster rise in yields on advanced markets, lower-
than-expected investment activity, and a stronger-than-anticipated expansion in Hungary’s export market share.
Chart 2-1: Impact of alternative scenarios on the inflation
forecast
Source: MNB
Chart 2-2: Impact of alternative scenarios on the GDP
forecast
Source: MNB
More moderate global inflation
Among the major global central banks, the Fed and the ECB
have started to gradually reverse their loose monetary
policy stance or the preliminary communication on this. At
the same time, the price-depressing effect of globalisation
and technological progress and the impact of the subdued
rise in real wages in advanced economies suggests
continued, persistently loose international price
developments.
According to the assumptions in the alternative scenario,
if subdued real wage growth in the advanced economies
and less favourable-than-anticipated European growth
developments materialise, the major central banks will
need more time than previously indicated to sustainably
reach their inflation target. As a result of weaker-than-
expected global economic growth, lower external inflation
curbs the rise in domestic inflation more than in the
baseline scenario, and the subdued growth in Hungary’s
export markets restrains domestic growth (Charts 2-1, 2-2
and 2-3). In such a situation, achievement of the inflation
target is ensured by maintaining loose monetary
conditions for a longer period.
Faster wage growth
In the baseline scenario, against the backdrop of declining
free labour capacity, the underlying wage trend remains
strong this year. Consequently, on the whole we
anticipate more than 10 percent wage growth in 2018,
similar to last year. The slightly lower wage growth
compared to 2017 can be attributed to the lower minimum
wage and guaranteed minimum wage increases than last
year. In January, gross average earnings in the national
economy rose by 13.8 percent (12.7 percent without public
works employment), and by 13.2 percent in the private
sector year-on-year. Nevertheless, according to our
assumptions, the double-digit wage increase over the
course of this year may continue to rise even further going
-2
-1
0
1
2
3
4
2013 2014 2015 2016 2017 2018 2019 2020 2021
Percent
Base scenario
More moderate global inflation
Faster wage growth
1
2
3
4
5
2013 2014 2015 2016 2017 2018 2019 2020 2021
Percent
Base scenario
More moderate global inflation
Faster wage growth

MAGYAR NEMZETI BANK
24 INFLATION REPORT • MARCH 2018
Chart 2-3: Risk map: effect of alternative scenarios on the
baseline forecast
Note: The risk map presents the average difference between the
inflation and growth path of the alternative scenarios and the
baseline forecast on the monetary policy horizon. The red marker
means tighter monetary policy and the green markers mean
looser monetary policy than the baseline forecast.
Source: MNB
forward. The March wage data will provide important new
information in this regard.
In our alternative scenario, in the tight labour market
environment, corporations increase wages more than
expected. In 2017 Q4, slightly over 450,000 workers could
be identified as labour slack in the economy. At the same
time, demographic developments increasingly represent an
effective constraint to the expansion in employment.
Looking ahead, the size of the economically active
population will increase at a gradually diminishing pace in
the coming years, and then by 2020 the expansion is
expected to stop. In our alternative scenario, the dynamic
pay increases may have a substantial inflationary impact. In
addition, intense wage growth may be incorporated into
expectations, and therefore the process may persist longer
than expected. In the case of faster wage growth than in
the baseline scenario, higher disposable income boosts
households’ consumption and investments, exerting a
positive impact on economic growth. Corporate costs will
rise more than in the baseline scenario, which, in parallel
with the increasing domestic demand, will result in higher
prices (Charts 2-1, 2-2 and 2-3). Achievement of the
inflation target is ensured by a monetary policy that is
tighter than in the baseline scenario.
Other risks
Along with the scenarios highlighted above, the Monetary
Council also considered three additional alternative
scenarios. The risk scenario assuming a faster rise in yields
on the advanced markets points towards higher inflation
and stronger domestic and external economic growth. In
the case of lower-than-expected investment activity,
growth is forecast to be lower than in the baseline scenario,
without any significant inflationary impact. Since Hungary’s
export market share expands faster than expected,
domestic economic growth is more robust than assumed in
the baseline scenario, without exerting a major impact on
inflation.
-0.6
-0.4
-0.2
0.0
0.2
0.4
0.6
-0.6 -0.4 -0.2 0.0 0.2 0.4 0.6
GD
P g
row
th
Inflation
More moderate global inflation
Faster wage growth
Faster increase in developed market yields
Lower-than-expected investment activity
Faster-than-expected increase in export market share
Most relevant scenarios identified by Monetary Council
MACROECONOMIC OVERVIEW
INFLATION REPORT • MARCH 2018 25
3. Macroeconomic overview
3.1. Evaluation of international macroeconomic developments
The global economy and in particular the euro area continued to grow in 2017 Q4, with the Central and Eastern European
region remaining the European Union’s growth centre. Although global inflation accelerated somewhat last year, it
remained moderate. Based on data from early 2018, the price index in the euro area decreased once again. In addition to
the Fed’s gradual interest rate increases, the Bank of England may start tightening monetary conditions somewhat earlier
and to a somewhat larger extent, while monetary conditions in the euro area may remain loose for a longer time. The
monetary policy divergence of central banks in the CEE region continued. The Czech and the Romanian central banks raised
their policy rates, while the decision-makers in the Polish central bank left monetary conditions unchanged in the past
quarter.
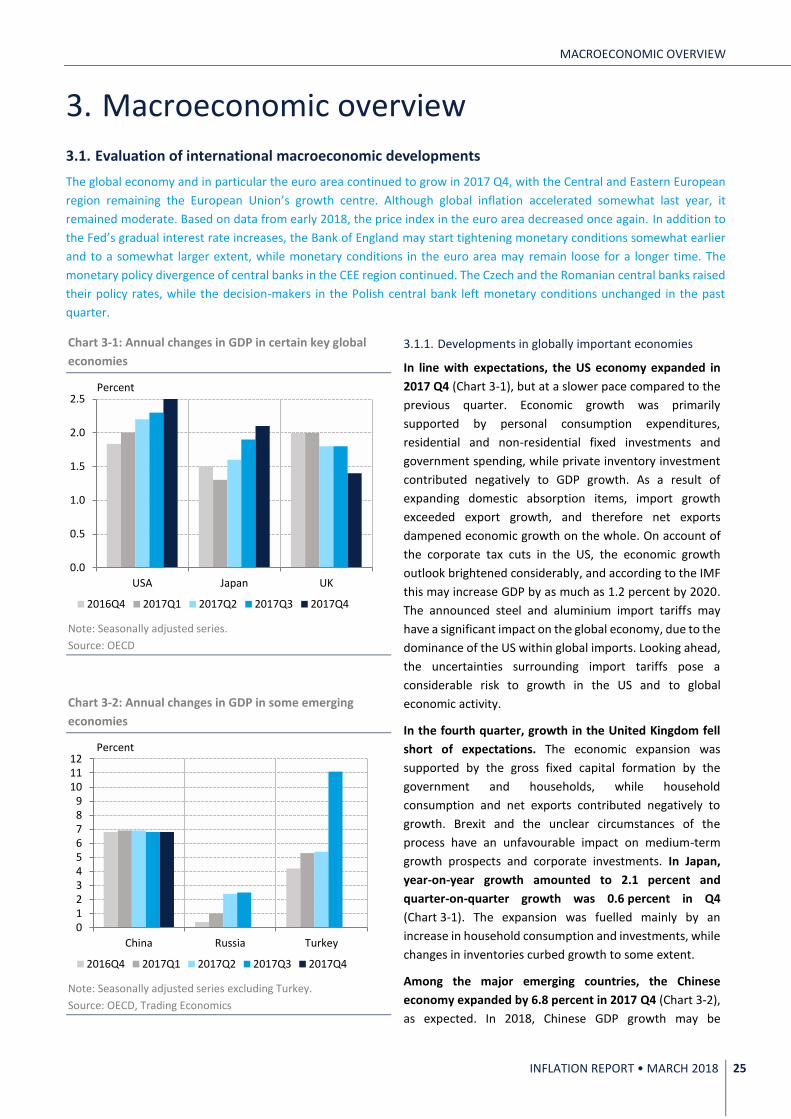
Chart 3-1: Annual changes in GDP in certain key global
economies
Note: Seasonally adjusted series.
Source: OECD
Chart 3-2: Annual changes in GDP in some emerging
economies
Note: Seasonally adjusted series excluding Turkey.
Source: OECD, Trading Economics
3.1.1. Developments in globally important economies
In line with expectations, the US economy expanded in
2017 Q4 (Chart 3-1), but at a slower pace compared to the
previous quarter. Economic growth was primarily
supported by personal consumption expenditures,
residential and non-residential fixed investments and
government spending, while private inventory investment
contributed negatively to GDP growth. As a result of
expanding domestic absorption items, import growth
exceeded export growth, and therefore net exports
dampened economic growth on the whole. On account of
the corporate tax cuts in the US, the economic growth
outlook brightened considerably, and according to the IMF
this may increase GDP by as much as 1.2 percent by 2020.
The announced steel and aluminium import tariffs may
have a significant impact on the global economy, due to the
dominance of the US within global imports. Looking ahead,
the uncertainties surrounding import tariffs pose a
considerable risk to growth in the US and to global
economic activity.
In the fourth quarter, growth in the United Kingdom fell
short of expectations. The economic expansion was
supported by the gross fixed capital formation by the
government and households, while household
consumption and net exports contributed negatively to
growth. Brexit and the unclear circumstances of the
process have an unfavourable impact on medium-term
growth prospects and corporate investments. In Japan,
year-on-year growth amounted to 2.1 percent and
quarter-on-quarter growth was 0.6 percent in Q4
(Chart 3-1). The expansion was fuelled mainly by an
increase in household consumption and investments, while
changes in inventories curbed growth to some extent.
Among the major emerging countries, the Chinese
economy expanded by 6.8 percent in 2017 Q4 (Chart 3-2),
as expected. In 2018, Chinese GDP growth may be
0.0
0.5
1.0
1.5
2.0
2.5
USA Japan UK
Percent
2016Q4 2017Q1 2017Q2 2017Q3 2017Q4
0123456789
101112
China Russia Turkey
Percent
2016Q4 2017Q1 2017Q2 2017Q3 2017Q4

MAGYAR NEMZETI BANK
26 INFLATION REPORT • MARCH 2018
Chart 3-3: Global inflation developments
Note: Percentage change on the same period of the previous year,
based on data from 43 developed and emerging countries.
Source: OECD
Chart 3-4: Inflation targets of central banks and actual
inflation
Note: The blue lines represent the inflation control range in
Australia, Canada and New Zealand, while in other countries they
mark a permissible fluctuation band. In Canada and New Zealand
the mid-point of the target band is accentual, which is marked by
empty diamond.
Source: OECD, FRED, National Institute of Statistics Romania
somewhat lower according to analysts’ expectations.
Economic growth slowed down in Russia in the fourth
quarter, but in 2017 the annual GDP figures were higher
than the weak results posted in earlier years.
Although global inflation accelerated marginally last year,
it remained moderate (Chart 3-3). In line with that,
inflation was below the central bank targets in most
developed countries (Chart 3-4). Against the backdrop of
relatively high volatility, oil prices were in the USD 60–70
band.
At the Fed’s January meeting, the FOMC left the policy
rate unchanged, before raising it by 25 basis points to the
band of 1.50–1.75 percent in March, in line with
expectations. Jerome H. Powell was sworn in in February,
and analysts expect him to continue the earlier monetary
policy practices. Based on the Summary of Economic
Projections published concurrently with the decision in
March, FOMC members are divided as to whether two or
three more 25-basis point increases are appropriate for this
year. In addition to the interest rate increases, the balance
sheet normalisation programme continues (Chart 3-5).
According to expectations based on market pricing, the Fed
may increase interest rates two more times this year
(Chart 3-6).
In the past quarter, the Bank of Japan did not change
monetary conditions, continuing to align its Quantitative
and Qualitative Easing Programme with the 0-percent
long-term yields. The central bank maintained its annual
purchase rate target amounting to a total of JPY 80 trillion
necessary to reach the yield target, and continues to pay
minus 0.1 percent interest on commercial banks’ excess
reserves. The commitment to overshoot the inflation
target has remained part of the central bank
communication.
The decision-makers of the Bank of England left the
monetary conditions unchanged in the past quarter.
Inflation is expected to remain around 3 percent in the
short term on account of the higher oil prices expressed in
GBP. Inflation gradually moderates along the forecast path,
but remains slightly over the 2-percent target, which is
attributable to rising import prices due to the earlier
depreciation of the sterling. If economic developments are
broadly in line with the February projections, a somewhat
earlier and somewhat greater tightening may be necessary
compared to what was expected in November, in order to
sustainably achieve the target. The outlook is uncertain due
to Brexit; therefore, the central bank will react to
-1
0
1
2
3
4
5
6
-1
0
1
2
3
4
5
6
2010 2011 2012 2013 2014 2015 2016 2017 2018
PercentPercent
20-80 percentile Median
0
2
4
6
8
10
12
0
2
4
6
8
10
12
USA
Euro
are
a
Jap
an UK
Swed
en
No
rway
Can
ada
Au
stra
lia
Ne
w Z
eal
and
Cze
ch R
ep.
Hu
nga
ry
Po
lan
d
Ro
man
ia
Ru
ssia
Turk
ey
Ch
ina
PercentPercent
Inflation (2017 Q4) Inflation target
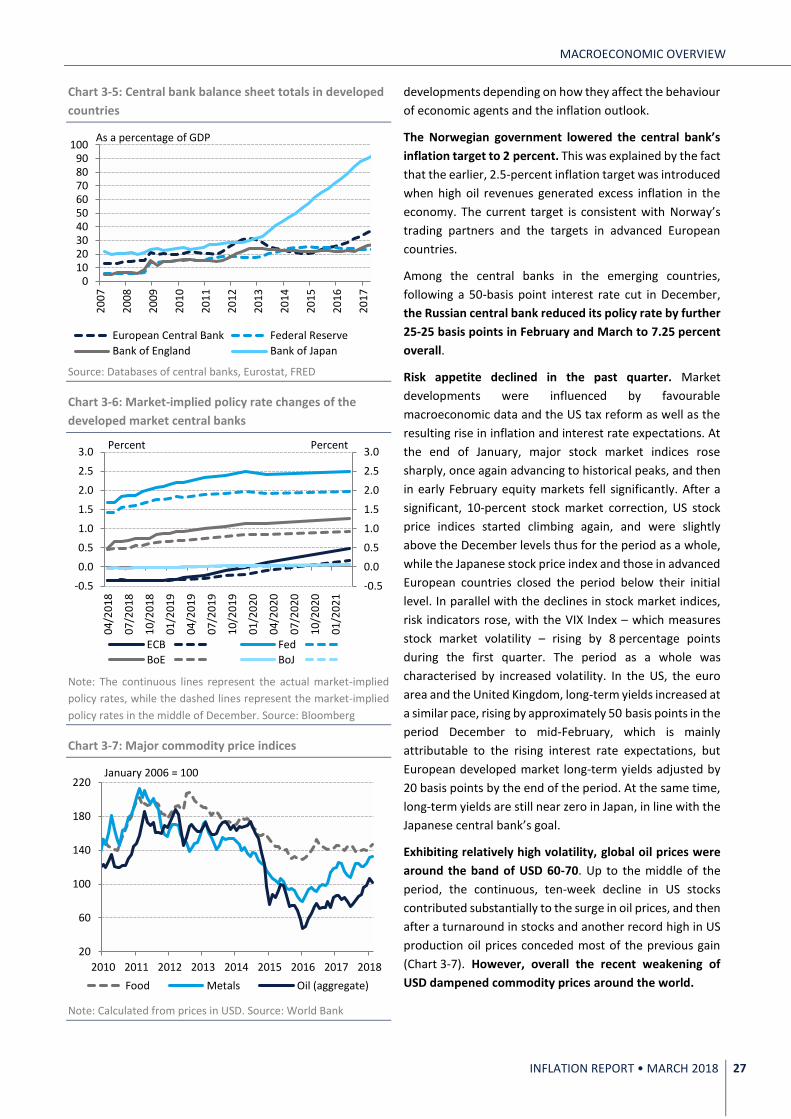
MACROECONOMIC OVERVIEW
INFLATION REPORT • MARCH 2018 27
Chart 3-5: Central bank balance sheet totals in developed
countries
Source: Databases of central banks, Eurostat, FRED
Chart 3-6: Market-implied policy rate changes of the
developed market central banks
Note: The continuous lines represent the actual market-implied
policy rates, while the dashed lines represent the market-implied
policy rates in the middle of December. Source: Bloomberg
Chart 3-7: Major commodity price indices
Note: Calculated from prices in USD. Source: World Bank
developments depending on how they affect the behaviour
of economic agents and the inflation outlook.
The Norwegian government lowered the central bank’s
inflation target to 2 percent. This was explained by the fact
that the earlier, 2.5-percent inflation target was introduced
when high oil revenues generated excess inflation in the
economy. The current target is consistent with Norway’s
trading partners and the targets in advanced European
countries.
Among the central banks in the emerging countries,
following a 50-basis point interest rate cut in December,
the Russian central bank reduced its policy rate by further
25-25 basis points in February and March to 7.25 percent
overall.
Risk appetite declined in the past quarter. Market
developments were influenced by favourable
macroeconomic data and the US tax reform as well as the
resulting rise in inflation and interest rate expectations. At
the end of January, major stock market indices rose
sharply, once again advancing to historical peaks, and then
in early February equity markets fell significantly. After a
significant, 10-percent stock market correction, US stock
price indices started climbing again, and were slightly
above the December levels thus for the period as a whole,
while the Japanese stock price index and those in advanced
European countries closed the period below their initial
level. In parallel with the declines in stock market indices,
risk indicators rose, with the VIX Index – which measures
stock market volatility – rising by 8 percentage points
during the first quarter. The period as a whole was
characterised by increased volatility. In the US, the euro
area and the United Kingdom, long-term yields increased at
a similar pace, rising by approximately 50 basis points in the
period December to mid-February, which is mainly
attributable to the rising interest rate expectations, but
European developed market long-term yields adjusted by
20 basis points by the end of the period. At the same time,
long-term yields are still near zero in Japan, in line with the
Japanese central bank’s goal.
Exhibiting relatively high volatility, global oil prices were
around the band of USD 60-70. Up to the middle of the
period, the continuous, ten-week decline in US stocks
contributed substantially to the surge in oil prices, and then
after a turnaround in stocks and another record high in US
production oil prices conceded most of the previous gain
(Chart 3-7). However, overall the recent weakening of
USD dampened commodity prices around the world.
0102030405060708090
100
20
07
20
08
20
09
20
10
20
11
20
12
20
13
20
14
20
15
20
16
20
17
European Central Bank Federal Reserve
Bank of England Bank of Japan
As a percentage of GDP
-0.5
0.0
0.5
1.0
1.5
2.0
2.5
3.0
-0.5
0.0
0.5
1.0
1.5
2.0
2.5
3.0
04
/20
18
07
/20
18
10
/20
18
01
/20
19
04
/20
19
07
/20
19
10
/20
19
01
/20
20
04
/20
20
07
/20
20
10
/20
20
01
/20
21
PercentPercent
ECB Fed
BoE BoJ
20
60
100
140
180
220
2010 2011 2012 2013 2014 2015 2016 2017 2018
Food Metals Oil (aggregate)
January 2006 = 100

MAGYAR NEMZETI BANK
28 INFLATION REPORT • MARCH 2018
Chart 3-8: Annual changes in euro-area GDP
Note: Seasonally and calendar adjusted series. Periphery countries
(Portugal, Italy, Greece, Spain), Core countries (Belgium, Germany,
France, Netherlands, Austria).
Source: Eurostat
Chart 3-9: Unemployment rate of the eurozone
Note: *Average of the first three quarters.
Source: Eurostat
3.1.2. Developments in the euro area
In 2017 Q4, economic growth in the euro area continued
(Chart 3-8). The economy of Germany, Hungary’s most
important trading partner, expanded by 2.9 percent year-
on-year. Government investments, exports and stable
household consumption were the main contributors to
growth. Growth in the euro area’s core countries exceeded
that of the periphery, primarily supported by the continued
substantially expansion of the Dutch and Austrian
economies, in addition to Germany’s economic
performance. The Austrian economy expanded at a rate of
3.6 percent, while the Dutch economy posted growth of
3.1 percent in year-on-year terms. Peripheral economies
expanded slightly less in the fourth quarter. Greece
recorded its highest rate since the crisis, with year-on-year
growth of 1.9 percent. The buoyant expansion continued in
Spain and Portugal as well, which was primarily supported
by the steadily brisk consumption.
Forward-looking economic indicators were favourable in
the past period (Chart 3-11). The business confidence
index capturing the euro area outlook (EABCI) declined
slightly, while expectations regarding the German economy
(Ifo) weakened in February. The companies surveyed are
less optimistic about the business outlook. By historical
standards, however, both indicators are at high levels.
Cyclical factors also play a role in the robust economic
growth of the euro area, although the long-term economic
outlook involves high uncertainty due to low productivity
growth, persistently high unemployment rates (Chart 3-9)
and non-performing loans in the banking system.
Euro area inflation declined in early 2018 and stood at
1.1 percent in February. It remains below the central bank
target in most Member States. Overall, core inflation did
not change considerably and was at 1.2 percent in
February, continuing to point to a moderate level. 5-year
inflation expectations 5 years ahead remained moderate in
the euro area and still fall short of the ECB’s inflation target.
At its March meeting, the European Central Bank left the
key interest rates unchanged. The central bank reduced
the monthly asset purchases to EUR 30 billion in January,
which will continue until the end of September 2018, or
beyond that if necessary (Chart 3-5). After its March
decision, the Governing Council still expects that the ECB’s
policy rates will remain at the current levels for an
extended period of time, and well past the horizon of the
net asset purchases.
Market participants are now focused on the date of the
ECB’s first interest rate hike and the end of the asset
0.0
0.5
1.0
1.5
2.0
2.5
3.0
Euro area Core countries Peripherycountries
Percent
2016Q4 2017Q1 2017Q2 2017Q3 2017Q4
0
5
10
15
20
25
20
00
20
01
20
02
20
03
20
04
20
05
20
06
20
07
20
08
20
09
20
10
20
11
20
12
20
13
20
14
20
15
20
16
20
17
*
Percent
Total (age of 15-74) Young (age of 15-24)

MACROECONOMIC OVERVIEW
INFLATION REPORT • MARCH 2018 29
Chart 3-10: Business climate indices for Germany and the
euro area
Source: European Commission, Ifo
Chart 3-11: Evolution of the output gap in the euro area
Source: European Commission
Chart 3-12: Annual changes in GDP in CEE countries
Note: Seasonally and calendar adjusted series. In the case of
Slovakia, only seasonal adjustment.
Source: Eurostat
purchases. Market expectations regarding the first interest
rate hike have shifted to the first half of 2019 (Chart 3-6).
Overall, EUR appreciation versus USD has continued on the
currency markets, and only the US labour market data
boosted the US dollar somewhat at the middle of the
period. At the end of the period, the EUR/USD exchange
rate stood at 1.25, representing a 5-percent depreciation of
USD against EUR over the past quarter. Regional currencies
showed varying movements against the euro: while the
forint and the Czech koruna strengthened moderately, the
Polish zloty and the Romanian leu weakened slightly.
3.1.3. Developments in the CEE region
Similar to past quarters, the CEE region proved to be the
centre of the European Union’s growth at the end of 2017
(Chart 3-12). The Czech economy expanded at a rate of
5.2 percent, which was slightly higher than in Q3. In 2017
Q4, GDP in Slovakia grew by 3.5 percent year-on-year,
while growth of 4.3 percent was registered in Poland.
Looking at the region as a whole, growth was mainly
supported by domestic demand. The Romanian economy
continued its outstanding expansion. In the last quarter of
2017 the Romanian economy expanded by 7 percent year-
on-year, but looking ahead, the economy may return to a
more sustainable growth path, and thus the growth rate
may decelerate further.
With the exception of Romania, inflation typically
decreased in the countries of the region during the past
months, declining to the lower parts of the tolerance
bands around the various inflation targets (Chart 3-13). In
the Czech Republic, last year’s above-target inflation fell to
1.8 percent. In Romania, inflation breached the upper
bound of the tolerance band to reach 4.7 percent. In
accordance with this, the Romanian central bank expects
steeply rising inflation going forward. By contrast, in Poland
inflation was at 1.5 percent in February, which is below the
inflation target. Core inflation in the Czech Republic did not
change substantially, while it rose in parallel with the
increase in inflation in Romania, and continued to be
moderate in Poland.
Of the central banks in CEE countries, the decision-makers
of the Czech central bank made a unanimous decision at
their February meeting to raise the policy rate by 25 basis
points to 0.75 percent. The overnight lending rate was
increased by 50 basis points to 1.5 percent, while the
overnight deposit rate remained unchanged at
0.05 percent. According to the central bank’s projections,
at least one more interest rate increase can be expected
during the year, most likely in the second half. The Czech
central bank revised its inflation projections slightly
-2.0
-1.5
-1.0
-0.5
0.0
0.5
1.0
1.5
2.0
2.5
3.0
-20
-15
-10
-5
0
5
10
15
20
25
30
2011 2012 2013 2014 2015 2016 2017 2018
Percent
Ifo business climate EABCI (right axis)
Points of standard deviation
-4
-2
0
2
4
20
07
20
08
20
09
20
10
20
11
20
12
20
13
20
14
20
15
20
16
20
17
Eurozone IMF
As a percentage of potential GDP
0
1
2
3
4
5
6
7
8
9
CzechRepublic
Slovakia Poland Romania
Percent
2016Q4 2017Q1 2017Q2 2017Q3 2017Q4

MAGYAR NEMZETI BANK
30 INFLATION REPORT • MARCH 2018
Chart 3-13: Inflation targets of central banks, inflation,
and economic agents' expectations
Note: Analyst's expectations relate to annual average in 2018.
Source: OECD, National Institute of Statistics Romania, Consensus
Economics
downwards and its growth forecast slightly upwards. Based
on the projections, inflation may be above target this year
and will then gradually decrease and stabilise around the
target over the monetary policy horizon. During the past
quarter, the Polish central bank’s decision-makers did not
change monetary conditions. The president of the Polish
central bank underlined that the base rate may remain
unchanged until 2020. Similar to November, the inflation
path was revised downwards in the March projection,
while growth may be higher than projected in the earlier
forecast. According to the decision-makers, inflation may
be consistent with the target over the monetary policy
horizon, as projected. As a result, the current level of the
base rate contributes to sustainable growth and the
macroeconomic balance. The decision-makers of the
Romanian central bank decided to raise the interest rate
by 25 basis points in both January and February. Overall,
in response to the higher-than-expected inflation, the
policy rate was raised to 2.25 percent. According to the
central bank’s forecast, inflation may continue to grow in
the months ahead and then decelerate once again for the
remainder of 2018. Compared to the previous forecast, the
inflation path rose considerably over the short run, and it is
still higher than the central bank’s target over the forecast
horizon.
-2
-1
0
1
2
3
4
5
Hungary CzechRepublic
Poland Romania
Percent
2016 2017Actual Analysts' expectationsInflation target

MACROECONOMIC OVERVIEW
INFLATION REPORT • MARCH 2018 31
Box 3-1: Factors behind EUR appreciation
Between January 2017 and March 2018, the EUR exchange rate against the US dollar appreciated by approximately
18 percent, moving from 1.04 to 1.23. In addition, the euro’s nominal effective exchange rate index (weighted against the
trading partners) appreciated by around 6 percent in 2017 (Chart 3-14). To a large extent, this appreciation of the euro can
be attributed to the substantially improved economic prospects of the euro area. In his assessment, ECB president Mario
Draghi mentioned the increased sensitivity of market participants to the ECB’s communication alongside the economic
developments in the euro area as the basis for the euro’s strengthening.
Chart 3-14: Changes in the euro’s nominal effective exchange rate
Note: The nominal effective exchange rate is an exchange rate index generated using
export weights. The drop in the indicator shows the relative weakening of the euro,
while its increase reflects the currency’s relative appreciation.
Source: Eurostat
Since mid-2017, the explanatory power of EUR-specific factors with respect to the EUR/USD exchange rate has
considerably increased (Chart 3-15). The euro’s nominal effective exchange rate exhibited substantial strengthening in
2017.
90
92
94
96
98
100
102
104
106
108
110
90
92
94
96
98
100
102
104
106
108
110
01
/20
11
09
/20
11
05
/20
12
01
/20
13
09
/20
13
05
/20
14
01
/20
15
09
/20
15
05
/20
16
01
/20
17
09
/20
17
2010=100
Nominal effective exchange rate of the euro
2010=100

MAGYAR NEMZETI BANK
32 INFLATION REPORT • MARCH 2018
Chart 3-15: Decomposition of the changes in the EUR/USD exchange rate into EUR and USD-specific components
Note: A rise means an appreciation of the euro against the US dollar. The decomposition
was prepared on the basis of the nominal effective exchange rates of the euro and the
US dollar (weighted average of export partners’ foreign exchange rates). Accordingly,
USD-specific euro strengthening was considered to constitute the changes that did not
take place against other currencies (i.e. the US dollar weakened against all other currencies).
In the case of EUR-specific euro strengthening, the euro appreciated against all other currencies
(i.e. the exchange rate of the US dollar against other currencies remained unchanged).
Source: Bloomberg
The factors supporting EUR strengthening can be mainly attributed to the positive outlook for European economic
growth, decreasing uncertainties and rising investor confidence. In response to the substantial economic outlook, the
strengthening of the EUR exchange rate may also reflect expectations regarding the faster normalisation of the ECB’s
monetary policy. The market anticipates the ECB’s first interest rate increase sooner than the previously expected mid-
2019, sometime in the second quarter of 2019. Based on decision-makers’ earlier communication, the ECB may achieve its
inflation target in 2020. The positive climate in the euro area is supported by the pricing-out of uncertainties after formation
of the German government. Furthermore, the mitigation of fears surrounding Brexit and the high level of the Purchasing
Managers’ Index and other sentiment indicators also point towards appreciation of the euro. Nonetheless, the rising
uncertainties in the wake of the Italian elections and the potential strengthening of protectionism in US economic policy
may dampen market sentiment.
The euro’s appreciation against the US dollar is also supported by several interrelated developments, including the record-
high levels of speculative positions for the euro. According to market analysts, another factor pointing towards EUR
appreciation is that the proportion of euro assets in the central banks’ foreign reserves is underweighted around the
world as compared to the pre-crisis levels, while US dollar assets are relatively overweighted. Many analysts deem it
likely that the allocation may be restructured to achieve the appropriate diversification effect. This could have supported
strengthening of the euro in 2017 and may continue to do so.
The European Commission and analysts’ expectations with respect to the future development of the exchange rate seem
to be in harmony. The European Commission anticipates a rate of 1.23, i.e. a figure close to the current one, for this year
and next year on average, while the median of analysts’ expectations for end-2018 is 1.22–1.23, with a substantial
dispersion of the expected values.
0%
2%
4%
6%
8%
10%
12%
14%
16%
0%
2%
4%
6%
8%
10%
12%
14%
16%
01
/20
17
02
/20
17
03
/20
17
04
/20
17
05
/20
17
06
/20
17
07
/20
17
08
/20
17
09
/20
17
10
/20
17
11
/20
17
12
/20
17
USD-specific change EUR-specific change EUR/USD

MACROECONOMIC OVERVIEW
INFLATION REPORT • MARCH 2018 33
3.2. Analysis of the production and expenditure side of GDP
According to the HCSO, in 2017 Q4 the gross domestic product increased by 4.4 percent year-on-year and rose 1.3 percent
compared to the previous quarter. The expansion of the economy was still supported by growing domestic demand, mainly
underpinned by investment and consumption. On the production side, GDP growth is attributable to the performance in
services, construction and industry. On the expenditure side, the main factor contributing to economic growth was
consumption.
Chart 3-16: Contribution to annual changes in GDP
Source: HCSO
Chart 3-17: Development of consumption components,
annual changes
Source: HCSO
According to the HCSO, in 2017 Q4, the gross domestic
product increased by 4.4 percent year-on-year and rose by
1.3 percent compared to the previous quarter. As before,
economic growth was supported by domestic demand
through continued expansion in investment and
consumption. In parallel with the higher import
requirement stemming from rising domestic demand, the
contribution of net exports to growth was negative
(Chart 3-16).
In 2017 Q4, household consumption continued to expand,
as in previous years. At the end of last year, the volume of
household consumption increased by 5.6 percent in annual
terms and thus accelerated compared to the previous
quarter. The rise in spending on durable and semi-durable
goods, which have a high recovery potential, continued to
exceed the aggregate expansion in consumption.
Consumption of durable goods rose 8.9 percent, while
expenditure on semi-durable goods expanded by
11.3 percent in Q4 (Chart 3-17). The rise in households’
consumption expenditure was supported by the strong
improvement in underlying income trends as well as by
historically high household confidence and net financial
wealth. The January data on retail sales volume also reflect
an increasingly dynamic rise in consumption, as they
indicate growth of 7.8 percent.
The financial assets and net financial savings of
households at current prices also continued to accumulate
in Q4. The increase in households’ willingness to build or
purchase homes resulted in higher savings. Accordingly, the
net financial savings rate rose compared to the beginning of
the year. In the fourth quarter, households’ net savings
expanded to 5.3 percent of GDP, marking an increase of
1 percentage point compared to the end of last year
(Chart 3-18). Households’ net financial assets were higher
than nominal GDP at the end of last year and are well above
the regional average.
Although households’ outstanding loans decreased by
HUF 14 billion in Q4 as a result of credit transactions, their
volume increased by 2.7 percent year-on-year. The rise is
attributable to the large-scale principal repayments on
loans taken out earlier and the substantial expansion in new
credit. The volume of household loan contracts increased
-8-6-4-202468
-8-6-4-202468
2010 2011 2012 2013 2014 2015 2016 2017Net exportsChanges in inventoriesGross fixed capital formationGovernment consumptionFinal household consumptionGDP at market prices (percent)
Percentage point Percentage point
-10
-5
0
5
10
15
20
2011 2012 2013 2014 2015 2016 2017
Domestic consumption expenditureDurable goodsSemi-durable goods
Percent

MAGYAR NEMZETI BANK
34 INFLATION REPORT • MARCH 2018
Chart 3-18: Net financial savings of households
Note: Seasonally adjusted series
Source: HCSO
Chart 3-19: Decomposition of the growth in tourism
nights at accommodation establishments
Source: HCSO
Chart 3-20: Developments in retail sales, income and the
consumer confidence index
Source: HCSO
by 41 percent on average in annual terms, and within that
new housing loans rose by 39 percent, despite unchanged
supply conditions, while personal loans expanded by
47 percent in 2017. In parallel with the cyclical upswing on
the housing market, the robust demand continues to be
supported by the family home creation allowance (CSOK),
which is linked to 16 percent of new housing loans. Banks
have relaxed lending standards in the consumer credit
segment, suggesting continued expansion in consumer
credit in the context of a rise in real wages and retail sales
volume.
In line with a rise in domestic demand, market services
contributed significantly to economic growth in Q4. Value
added increased in each of the market services sectors,
while public services declined in year-on-year terms.
Administrative services made the strongest growth
contribution, along with trade, accommodation services
and hospitality, but the contributions from the ICT,
transportation and storage and real estate transactions
sectors were also significant. The number of overnight
stays rose by 6.6 percent year-on-year in Q4 (Chart 3-19)
this expansion was mainly attributable to a rise in the
number of nights spent by resident guests, but non-resident
tourism demand also increased.
In contrast to the developments seen in H1, both public
consumption and in-kind social benefits received from the
government rose considerably in Q4.
In 2017 Q4, investment at the level of the national
economy expanded by 14.4 percent, borne by growth in a
wide range of sectors (Chart 3-21). In the case of
companies producing goods and providing services for the
domestic market, the expansion was primarily supported by
rising investment in the hospitality and financial sectors.
The large manufacturing sector was the main contributor to
the growth in investments of companies producing for
external markets. In parallel with capacity-expanding
investments in the automotive industry, the subsector’s
investment activity continued to increase at the end of last
year. Investment activity in this sector was more subdued
than before, which was mainly due to developments in
other subsectors (manufacture of rubber and plastic
products, manufacture of wood and wood products,
metalworking). Investment in the public sector (healthcare,
administration, education) and sectors closely related to
the public sector (energy, transportation) also expanded
considerably, with contributions from the boom in projects
implemented from the 2014–2020 EU programming period,
investment from own funds as well as the low base value.
0
20
40
60
80
100
120
0
2
4
6
8
10
12
19
96
19
97
19
98
19
99
20
00
20
01
20
02
20
03
20
04
20
05
20
06
20
07
20
08
20
09
20
10
20
11
20
12
20
13
20
14
20
15
20
16
20
17
Net financial savings Net financial wealth (right axis)
Percentage of GDP Percentage of GDP
-5
0
5
10
15
-5
0
5
10
15
2012 2013 2014 2015 2016 2017Number of domestic guest nights
Number of foreign guest nights
Total number of guest nights (%)
Percentage point Percentage point
-70
-60
-50
-40
-30
-20
-10
0
10
-5
0
5
10
15
2013 2014 2015 2016 2017 2018
Bal
ance
ind
icat
or
An
nu
al c
han
ge (
per
cen
t)
Retail salesReal net wage billConsumer confidence (right axis)

MACROECONOMIC OVERVIEW
INFLATION REPORT • MARCH 2018 35
Chart 3-21: Annual change of investments
Source: HCSO
Chart 3-22: Annual changes in lending to non-financial
corporates and SMEs
Note: Data for corporate loans total are based on transactions. For
SME loans, estimated transactions are applied from Q4 2013.
Source: MNB
Chart 3-23: Evolution of housing starts and building
permits
Note: Seasonally adjusted data. Source: HCSO
In line with the buoyant investment activity, the strong
increase in construction output continued in Q4.
The substantial expansion in investments is also reflected
in corporate lending flows. Lending to non-financial
corporations rose by 10 percent in 2017 Q4. Lending to the
SME sector in the narrow sense grew by 11.4 percent, while
lending to the SME sector including the self-employed rose
by 11.8 percent at the end of last year (Chart 3-22). Banks
further eased corporate credit terms, citing the improved
economic outlook and stronger price competition among
banks. Based on banks responses, in addition to the Market-
based Lending Scheme’s commitments maintained for
2018, the favourable dynamics in corporate lending are also
supported by the increased demand for mainly long-term
loans. The financing requirement may also rise among
construction firms as a result of more and more
investments in office and home projects.
Households’ investment activity increased further in Q4,
and the substantial expansion in home-building continued
in parallel with the favourable demand conditions. In line
with the building permits issued earlier, the number of
completions increased sharply, with a year-on-year
expansion of over 35 percent. Thus, a total of 14,389 new
homes were completed last year, representing a
44 percent rise compared to 2016. Despite the slowdown
in the number of building permits issued at the end of the
year, around 38,000 home building permits were issued
over the course of last year, marking a 20.4-percent
increase over 2016 (Chart 3-23). On account of the strong
demand, house prices continued to rise in the period under
review, driven by price changes for both used and new
homes (Chart 3-24). However, taking into account the
composition effect, a slowdown was observed in price
dynamics for used homes in recent quarters, due to the fact
that the share of homes outside of Budapest, which are
typically sold at a lower price, rose in the number of
transactions.
Net exports curbed growth in the Hungarian economy at
the end of the year. Despite the end-of-year slowdown in
industrial production, the expansion in the export of goods
exhibited a substantial increase in Q4, in parallel with a drop
in the sector’s own inventories (Chart 3-25). Growth in
Hungary’s exports was also supported by the buoyant
upswing in the external demand. In parallel with the
dynamic surge in domestic demand items (household
consumption, investments), the import of goods exhibited
growth of over 10 percent in Q4. Services exports’ massive
expansion continued in the last quarter of the year. The
major increase in Hungary’s services exports in recent
-30
-20
-10
0
10
20
30
2015 2016 2017
Corporate GovernmentGovernment-related HouseholdTotal investments (%)
Percentage point
-10
-5
0
5
10
15
20
25
-10
-5
0
5
10
15
20
25
20
08
20
09
20
10
20
11
20
12
20
13
20
14
20
15
20
16
20
17
PercentPercent
SME sector (MFI)Corporate sector (MFI)SME sector with self-employed (MFI)
The preferred 5-10 percentage lending annual growth rate in SME sector.
0
2000
4000
6000
8000
10000
12000
14000
16000
18000
20
02
20
03
20
04
20
05
20
06
20
07
20
08
20
09
20
10
20
11
20
12
20
13
20
14
20
15
20
16
20
17
Home constructions Building permits
Volume

MAGYAR NEMZETI BANK
36 INFLATION REPORT • MARCH 2018
Chart 3-24: Annual change of house prices
Note: Seasonally adjusted annual change.
Source: HCSO, MNB
Chart 3-25: Evolution of the trade balance
Note: Seasonally adjusted, 4-quarter cumulated values, in 2005
prices.
Source: HCSO
quarters was linked to insurance and other business
services exports, along with tourism and transportation
services. At the end of last year, services imports exhibited
subdued growth, and therefore the balance of services
increased considerably. In parallel with the increase in the
import requirement stemming from the expanding
domestic demand, the annual growth in total exports was
exceeded by the rise in imports, and therefore net exports
restrained economic growth in Q4. At the end of last year,
relative foreign trade prices, i.e. the terms of trade, did not
change significantly.
Agricultural performance fell short of the historically
favourable level in 2016, curbing last year’s economic
growth by 0.3 percentage points. Based on the available
data, output from the production of plants and animals was
below the 2016 levels. Among the major cereals, maize and
barley yields fell substantially year-on-year, while wheat
yields fell moderately.
As a result of the lower agricultural performance compared
to last year and the high base from the previous year, the
change in inventories considerably lowered economic
growth in the fourth quarter.
-20
-10
0
10
20
20
08
20
09
20
10
20
11
20
12
20
13
20
14
20
15
20
16
20
17
Used dwellingsNew dwellingsMNB real house price index
Percent
-1500
-1000
-500
0
500
1000
1500
2000
2500
3000
20
02
20
03
20
04
20
05
20
06
20
07
20
08
20
09
20
10
20
11
20
12
20
13
20
14
20
15
20
16
20
17
Goods balance Services balance
Trade balance
HUF Billions
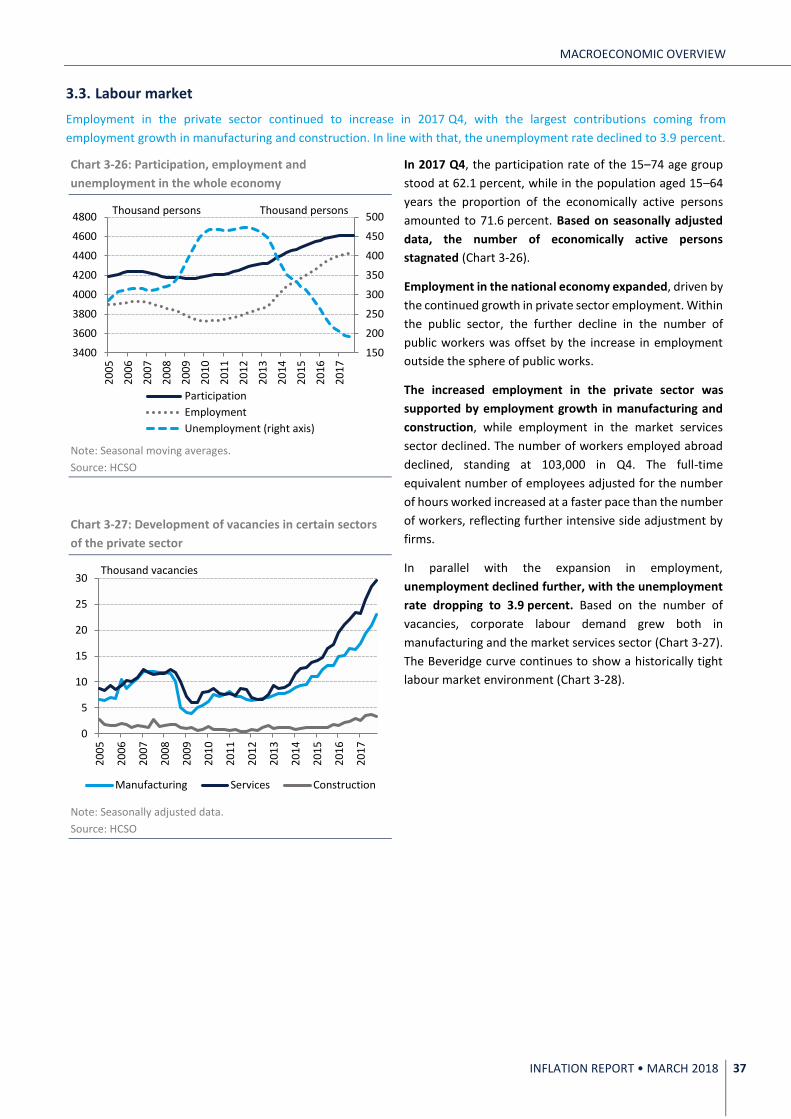
MACROECONOMIC OVERVIEW
INFLATION REPORT • MARCH 2018 37
3.3. Labour market
Employment in the private sector continued to increase in 2017 Q4, with the largest contributions coming from
employment growth in manufacturing and construction. In line with that, the unemployment rate declined to 3.9 percent.
Chart 3-26: Participation, employment and
unemployment in the whole economy
Note: Seasonal moving averages.
Source: HCSO
Chart 3-27: Development of vacancies in certain sectors
of the private sector
Note: Seasonally adjusted data.
Source: HCSO
In 2017 Q4, the participation rate of the 15–74 age group
stood at 62.1 percent, while in the population aged 15–64
years the proportion of the economically active persons
amounted to 71.6 percent. Based on seasonally adjusted
data, the number of economically active persons
stagnated (Chart 3-26).
Employment in the national economy expanded, driven by
the continued growth in private sector employment. Within
the public sector, the further decline in the number of
public workers was offset by the increase in employment
outside the sphere of public works.
The increased employment in the private sector was
supported by employment growth in manufacturing and
construction, while employment in the market services
sector declined. The number of workers employed abroad
declined, standing at 103,000 in Q4. The full-time
equivalent number of employees adjusted for the number
of hours worked increased at a faster pace than the number
of workers, reflecting further intensive side adjustment by
firms.
In parallel with the expansion in employment,
unemployment declined further, with the unemployment
rate dropping to 3.9 percent. Based on the number of
vacancies, corporate labour demand grew both in
manufacturing and the market services sector (Chart 3-27).
The Beveridge curve continues to show a historically tight
labour market environment (Chart 3-28).
150
200
250
300
350
400
450
500
3400
3600
3800
4000
4200
4400
4600
4800
20
05
20
06
20
07
20
08
20
09
20
10
20
11
20
12
20
13
20
14
20
15
20
16
20
17
Participation
Employment
Unemployment (right axis)
Thousand persons Thousand persons
0
5
10
15
20
25
30
20
05
20
06
20
07
20
08
20
09
20
10
20
11
20
12
20
13
20
14
20
15
20
16
20
17
Manufacturing Services Construction
Thousand vacancies

MAGYAR NEMZETI BANK
38 INFLATION REPORT • MARCH 2018
3.4. The cyclical position of the economy
According to our estimates, Hungarian output was around its potential level in 2017 Q4. The closing of the Hungarian output
gap is suggested by the buoyant domestic demand and the rising capacity utilisation of domestic production units, but
Hungary’s growth was still curbed slightly by the cyclical position of the country’s external markets.
Chart 3-28: Development of the Beveridge-curve
Note: The private sector vacancy ratio indicates the ratio of private
sector vacancies to active workers. Seasonally adjusted data.
Source: MNB calculation based on HCSO data
Chart 3-29: Uncertainty band of the output gap
Note: The edge of the uncertainty band shows one standard
deviation.
Source: MNB
According to our estimates, Hungarian output was close to
its potential level in 2017 Q4 (Chart 3-29). The gradual
closure of the output gap observed last year was strongly
influenced by the robust domestic demand. The level and
development of the domestic output gap was also
influenced by the cyclical position of Hungary’s key trading
partners. Estimates show that at the end of last year, the
euro-area output gap was slightly open, and it is expected
to close during 2018 (Chart 3-11).
The closing of the Hungarian output gap is indicated by the
fact that the majority of surveys capturing corporate
business sentiment and capacity utilisation increased
further, as seen in the recent past. Similar to previous
quarters, based on companies’ responses, labour supply
was a bottleneck. In the case of the industrial sector, the
ratio of companies saying that the workforce was a limiting
factor of production was near historically high levels in
2017 Q4.
The historically low unemployment rate also implies that
the utilisation of the labour factor increased considerably
in the past period and it is also high in a historical
comparison. The significant expansion in employment and,
in parallel with that, the decline in the unemployment rate
contributed to better capacity utilisation in the past years
(Chart 3-28).
0.2
0.4
0.6
0.8
1.0
1.2
1.4
2 4 6 8 10 12
Pri
vate
sec
tor
vaca
ncy
rat
io (
%)
Unemployment rate (%)
2017Q4
2005Q1
2008Q4
68
72
76
80
84
88
92
-6
-4
-2
0
2
4
6
20
07
20
08
20
09
20
10
20
11
20
12
20
13
20
14
20
15
20
16
20
17
Output gapTrend industrial capacity utilisation (right axis)
As a percentage of potential GDP Percent

MACROECONOMIC OVERVIEW
INFLATION REPORT • MARCH 2018 39
3.5. Costs and inflation
In recent months, inflation was around the lower boundary of the tolerance band, dropping to 1.9 percent in February.
Core inflation continued its fall since September 2017, reaching 2.4 percent in February. According to HCSO data, the value
of the index for 2017 as a whole was 2.4 percent. Underlying inflation indicators, which capture longer-term trends in
inflation, still fall short of core inflation and are at around 2 percent. As a result of the historically tight labour market
environment and the direct and spillover effects of the measures in the wage agreement, gross average earnings in the
private sector increased by 12.3 percent year-on-year in Q4.
Chart 3-30: Annual change in gross average wages in the
private sector
Note: Seasonally adjusted data.
Source: HCSO
Chart 3-31: Decomposition of the annual change in
nominal unit labour cost in the private sector
Note: Seasonally adjusted data.
Source: MNB calculation based on HCSO data
3.5.1. Wages
In 2017 Q4, gross average earnings in the private sector
rose by 12.3 percent year-on-year (Chart 3-30). In addition
to the historically tight labour market environment, the
strong wage dynamics were supported by the direct and
spillover effects of the measures in the wage agreement at
the beginning of the year. In the sectors with above-average
earnings, wage dynamics of 10 percent were observed,
while in the sectors with below-average earnings, wage
dynamics of 15 percent were recorded. In January 2017,
gross average earnings in the private sector rose by
13.2 percent year-on-year. Regular average earnings rose
similar to January of last year and increased significantly
on a monthly basis which could be explained by the impact
of administrative wage increases at the beginning of the
year. The wage dynamics in sectors with below-average
earnings were still significantly higher than in sectors with
above-average earnings. The impact of the strong wage
dynamics on labour costs was mitigated by the cut in the
social contribution tax rate. In 2017 Q4, the annual growth
rate of unit labour costs was similar to that in the previous
quarter, thanks to the stable dynamics of the average
labour cost and productivity (Chart 3-31).
3.5.2. Producer prices
Agricultural producer prices rose year-on-year in recent
months. This was mainly attributable to the roughly
30 percent average rise in the producer price of eggs at the
end of last year – and to a lesser degree to the end-2017
increase in the producer prices of milk –, due to the general
drop in supply on the international market as a result of
insecticide contamination. Prices of seasonal products
exhibited a moderate overall decline, as the drop in the
prices of potatoes and vegetables was partly offset by an
increase in the price of fruits. The producer price of cereals
rose, mainly due to quality problems concerning last year’s
harvest, which was lower than in 2016.
Domestic industrial sales prices and the prices of consumer
goods increased year-on-year.
0
2
4
6
8
10
12
14
16
18
20
05
20
06
20
07
20
08
20
09
20
10
20
11
20
12
20
13
20
14
20
15
20
16
20
17
20
18
Percent
Gross average wages in the private sector
Regular average wages in the private sector
-8
-4
0
4
8
12
2010 2011 2012 2013 2014 2015 2016 2017
Percent
EmploymentValue addedCompensation per employeeNominal unit labour cost

MAGYAR NEMZETI BANK
40 INFLATION REPORT • MARCH 2018
Chart 3-32: Inflation and underlying inflation indicators
Source: MNB calculation based on HCSO data
Chart 3-33: Services inflation
Note: Adjusted for indirect tax effects. Percentage change
compared to last December.
Source: MNB calculation based on HCSO data
Chart 3-34: Inflation of market services
Note: Highly labour-intensive market services include
accommodation, catering, education, healthcare and personal care
services. Source: MNB calculation based on HCSO data
3.5.3. Consumer prices
In recent months, inflation was around the lower
boundary of the tolerance band, dropping to 1.9 percent
in February, which was mainly caused by a drop in fuel
prices due to base effects (Chart 3-32). Core inflation
continued its fall since September 2017 to reach 2.4 percent
in February. Based on HCSO data, the index value for 2017
as a whole was 2.4 percent.
Indicators capturing longer-term inflation trends (the
inflation of demand-sensitive and sticky-price products)
remained unchanged overall in the past months. The
indicators remained around 2 percent and still fall short of
core inflation.
Price increases of industrial goods were restrained in the
past months. Within this product group, the seasonally
adjusted prices of durables declined, primarily owing to the
price developments of used cars, while the prices of non-
durable industrial goods remained practically unchanged.
Prices of industrial goods continue to be influenced by the
mutually opposing effects of moderate import prices and
the steady pick-up in domestic demand.
Inflation in market services declined in recent months,
standing at 1.8 percent in February, influenced by the cuts
to the VAT rate in January. Disregarding the effects of the
January tax changes, the prices of market services observed
in recent months increased by 0.9 percent overall in
February compared to December 2017, which slightly
exceeds the price increases in the past year (Box 3-2 and
Chart 3-33).
Despite the robust wage growth experienced last year, the
rise in consumer prices in this sector still did not accelerate
significantly. Higher price increases compared to previous
years were only observed in the case of some highly labour-
intensive services, such as accommodation and restaurant
services. The price dynamics of these services did not
change significantly in the past months (Chart 3-34).
Seasonally and tax-adjusted consumer prices of food
increased in recent months. The rise was principally caused
by the approximately 20-percent increase in egg prices in
December, which was corrected at the beginning of the
year as supply grew. In January 2018, the VAT rate for
unprocessed food, namely fish and pork offal, was cut.
In line with the unchanged oil prices expressed in forints,
fuel prices were basically steady in the winter months. The
annual inflation of this product group dropped in the past
period overall, in line with the base effects stemming from
price increases in December 2016 and the beginning of last
-2
0
2
4
6
8
20
10
20
11
20
12
20
13
20
14
20
15
20
16
20
17
20
18
Percent
Core inflation excluding indirect tax effectDemand sensitive inflationSticky price inflationInflation
0
0.5
1
1.5
2
2.5
3
3.5
Jan
uar
y
Feb
ruar
y
Mar
ch
Ap
ril
May
Jun
e
July
Au
gust
Sep
tem
ber
Oct
ob
er
No
vem
ber
Dec
em
ber
Percent
2013 2014 2015 2016 2017 2018
0
1
2
3
4
5
6
20
09
20
10
20
11
20
12
20
13
20
14
20
15
20
16
20
17
20
18
Less labour intensive Highly labour intensive
Market services
Percent

MACROECONOMIC OVERVIEW
INFLATION REPORT • MARCH 2018 41
Chart 3-35: Inflation expectations in the region
Source: MNB calculations based on European Commission data
year. There were no major price changes in the case of
regulated prices in the past months.
In recent months, both inflation and core inflation were
practically in line with our December forecast.
3.5.4. Inflation expectations
Hungarian households’ inflation expectations are still at
moderate levels, indicating the anchoring of
expectations. Expectations in Hungary were in line with the
expectations observed in the countries of the region, which
were characterised by steadily low inflation in the past as
well (Chart 3-35). During the period under review, inflation
expectations in the countries of the region remained at low
levels.
The price expectations of the retail sector did not show any
major change in the past period, in line with the inflation
developments.
Box 3-2: Inflation trends at the beginning of the year remain moderate
No acceleration in inflation developments was observed at the beginning of this year, similarly overall to what was seen
at the beginning of last year. Early in the year, inflation was shaped by the VAT cuts implemented in January, the repricing
characteristic of market services and base effects mainly related to fuels. The indicator most often used to analyse
underlying inflation trends is core inflation, the development of which was broadly subdued at the beginning of the year.
Among core inflation items, in the case of market services corporate repricing is important because of the intense wage
growth seen last year, while price developments in industrial goods are influenced by the robust domestic demand and
the low imported inflation, which offset each other. This box analyses how these effects shaped inflation developments
at the start of the year.
Among the products affected by the VAT cut, similar to last year, no price decrease was observed in January in the case of
restaurant services, which in our opinion is attributable to the emerging effects of the strong wage growth (Table 3-1). This
may have been influenced by the tourism development contribution imposed on restaurant service providers, also effective
from January. In the case of the Internet, the price change may have been in line with the VAT rate reduction, while in the
case of fish and pork offal, the price decrease was practically identical to the formerly observed pass-through.
Table 3-1: Pass-through rates of the VAT cuts
Source: MNB calculation
Core inflation was influenced by the opposing monthly, tax-adjusted price dynamics of industrial goods and market
services in recent months. The industrial goods price index fell, due to base effects and subdued imported inflation
(Chart 3-36).
0
2
4
6
8
10
12
2010 2011 2012 2013 2014 2015 2016 2017 2018
Percent
RO SK PL CZ HU
Product groupFormer VAT rate
(percent)
New VAT rate
(percent)
Pass-through of VAT decrease
(percent)
2016 Pork 27 5 100
Food (poultry, eggs , mi lk) 27 and 18 5 52
Internet 27 18 100
Catering services 27 18 0
Food (fi sh, pork offa l ) 27 5 51
Internet 18 5 100
Catering services 18 5 0
2017
2018

MAGYAR NEMZETI BANK
42 INFLATION REPORT • MARCH 2018
Chart 3-36: Decomposition of the inflation of industrial goods
Note: Tax-adjusted annual changes.
Source: MNB calculation based on HCSO data
Based on the pricing practices of enterprises, developments at the beginning of the year dominate movements in market
services inflation. Disregarding the impact of the VAT cuts, prices in this product group were marginally higher than last
year overall, which was influenced by the price increases for several products, such as healthcare, restaurant services and
vehicle repairs (Chart 3-37). Within market services, the sector’s consumer prices do not show a substantial increase,
despite last year’s significant wage growth. This is supported by the development of the price index of labour-intensive
services, such as accommodation and restaurant services. Although price increases were larger in the case of this group
than in previous years, no major changes were observed at the beginning of this year, just like in the recent period. The
inflation of highly and less labour-intensive services developed in line with the change in the market services price index.
Chart 3-37: Inflation composition of market services in the beginning of 2018
Note: Annual inflation data in the beginning of the year. Red tiles indicate the negative,
greenish-blue tiles the 0.0–2.5 percent, light blue tiles the 2.5–5.0 percent, dark blue
tiles the more than 5 percent inflation among the subgroups of the market services.
Source: MNB calculation based on HCSO data
-1.0
-0.5
0.0
0.5
1.0
1.5
2.0
2.5
3.0
3.5
4.0
4.5
2010 2011 2012 2013 2014 2015 2016 2017 2018
Durables Non-durables Traded goods (percent)
Percentage point
Telecommu-nication
services
Can-teen,
coffee

FINANCIAL MARKETS AND INTEREST RATES
INFLATION REPORT • MARCH 2018 43
4. Financial markets and interest rates
4.1. Domestic financial market developments
International investor sentiment temporarily underwent a significant deterioration in the past quarter. In spite of the
correction, the VIX index, which measures stock market volatility, closed 8 percentage points higher than the average value
from the previous months. At the same time, the emerging bond market EMBI Global Index returned to its level observed
at the beginning of the period. The appreciation of the euro against the US dollar continued, with only US labour market
data providing temporary support for USD.
During the period, domestic money market developments were mainly determined by the rise in long-term yields in the
developed markets. In line with that, long-term yields in the region – including Hungarian yields as well – increased. At the
same time, as a result of the central bank communication and the new monetary policy tools, compared to long-term euro
yields, an overall decline in Hungarian spreads took place in the past half year. Developments in exchange rates varied
across the region: the forint and the Czech koruna appreciated somewhat, while the Polish zloty and the Romanian leu
depreciated modestly against the euro.
Chart 4-1: Components of 5-year Hungarian CDS spread
Note: The decomposition method used can be found in the MNB
Bulletin: Variance decomposition of sovereign CDS spreads,
Kocsis–Nagy (2011). Source: Bloomberg
Chart 4-2: Exchange rates in the region
Note: Changes compared to the beginning of 2012. Positive values
mean an appreciation of the currency. Source: Bloomberg
4.1.1. Hungary’s risk perception
There were favourable changes in Hungary’s risk
indicators compared to mid-December (Chart 4-1).
International factors contributed to the decline in the
Hungarian credit risk spread. In a historical comparison, the
Hungarian 5-year sovereign CDS spread remained at a low
level during the period as a whole, finally closing at 85 basis
points. As a result of global effects, spreads declined in the
countries of the region, similarly to the developments
observed in Hungary.
The global increase in yields was also reflected in the
Hungarian long-term yields. Nevertheless, as a result of the
new monetary policy instruments, during the past half year
an overall decline took place in the spreads on forint
interbank and government bond yields compared to ten-
year euro yields.
4.1.2. FX market developments
On the whole, the exchange rate of the forint against the
euro showed a slight appreciation of around 0.7 percent,
and the Czech koruna also strengthened modestly, while
the Polish zloty and the Romanian leu depreciated to some
extent (Chart 4-2). As of mid-December, the exchange rate
of the forint moved between the levels of EUR/HUF 308 and
315. In the first half of the period under review, the forint
appreciated, and then weakened close to its level observed
at the beginning of the period, but started to strengthen
again from early March. Favourable macro fundamentals
contributed to the appreciation of the forint. The slight
weakening of the Polish zloty was attributable to the
expectations concerning the deceleration in inflation.
0
100
200
300
400
-150
-100
-50
0
50
03
/20
13
06
/20
13
09
/20
13
12
/20
13
03
/20
14
06
/20
14
09
/20
14
12
/20
14
03
/20
15
06
/20
15
09
/20
15
12
/20
15
03
/20
16
06
/20
16
09
/20
16
12
/20
16
03
/20
17
06
/20
17
09
/20
17
12
/20
17
03
/20
18
Country-specific componentExternal componentHungarian CDS spread (right axis)
Basis points Basis points
-12%
-9%
-6%
-3%
0%
3%
6%
9%
12%
15%
-12%
-9%
-6%
-3%
0%
3%
6%
9%
12%
15%
03
/20
12
08
/20
12
01
/20
13
06
/20
13
11
/20
13
04
/20
14
09
/20
14
02
/20
15
07
/20
15
12
/20
15
05
/20
16
10
/20
16
03
/20
17
08
/20
17
01
/20
18
EUR/CZK EUR/PLN EUR/HUF

MAGYAR NEMZETI BANK
44 INFLATION REPORT • MARCH 2018
Chart 4-3: HUF-denominated government securities held
by non-residents
Note: The chart shows the stock of T-bills and T-bonds and the
amount of government securities held by non-residents; retail
securities are not included. Source: MNB
Chart 4-4: Yields of benchmark government securities
Source: Government Debt Management Agency (ÁKK)
Chart 4-5: 10-year government benchmark yields in CEE
countries
Source: Bloomberg
4.1.3. Government securities market and changes in yields
Non-residents’ HUF-denominated government securities
holdings increased in the past quarter (Chart 4-3).
Following a practically continuous decline since 2015, non-
residents’ HUF-denominated government securities
holdings first stabilised and then remained steady at around
HUF 3,500 billion in 2017 H2. The holdings have increased
by roughly HUF 80 billion since mid-December, while the
ownership ratio of non-residents ownership has remained
close to 21.5 percent.
Demand in the primary market of government securities
was strong. In the case of longer-term securities, ÁKK
often accepted higher amounts than what had been
announced. Short-term treasury bill yields remained
practically unchanged, while long-term auction yields
tracked the international rise in yields and increased
significantly, by 40–65 basis points.
The government securities secondary market yield curve
became steeper as a result of a rise in long-term yields. In
line with auction yields, short-term secondary market yields
remained practically unchanged, while the longer section of
the yield curve shifted upwards by 20–35 basis points. In
line with the introduction of the new central bank
instruments and the central bank’s communication,
Hungarian long-term yields declined considerably from
September until mid-January, which was partly offset by the
impact of the global increase in yields and the decline in
speculative positions in the HUF interest rate swap market.
The 10-year yield stood at 2.49 percent at the end of the
period.
During the past quarter, Hungarian short-term interbank
yields continued to decline somewhat, while in the middle
and longer segments, similarly to the government securities
market yields, there were major increases, and thus the
interbank yield curve also became steeper.
Increases in long-term benchmark yields varied across the
region (Chart 4-5). While the ten-year forint yield rose by
35 basis points compared to the mid-December level, ten-
year benchmark yields in the region increased to a lesser
extent in the past quarter. Compared to their levels at the
beginning of the period, Czech and Slovak long-term yields
were 25 basis points and 15 basis points higher,
respectively. On the whole, the Polish ten-year benchmark
yield remained practically unchanged, although in the
middle of the period it was still 25 basis points higher,
similarly to the Czech yields. At the end of the period the
Polish yields were moderated by declining inflation
expectations.
20232629323538414447
2600290032003500380041004400470050005300
03
/20
12
09
/20
12
03
/20
13
09
/20
13
03
/20
14
09
/20
14
03
/20
15
09
/20
15
03
/20
16
09
/20
16
03
/20
17
09
/20
17
03
/20
18
Percent
Forint-denominated stock of non-residentsPercentage of total amount outstanding (right axis)
HUF Billions
-1012345678910
-10123456789
10
03
/20
12
06
/20
12
09
/20
12
12
/20
12
03
/20
13
06
/20
13
09
/20
13
12
/20
13
03
/20
14
06
/20
14
09
/20
14
12
/20
14
03
/20
15
06
/20
15
09
/20
15
12
/20
15
03
/20
16
06
/20
16
09
/20
16
12
/20
16
03
/20
17
06
/20
17
09
/20
17
12
/20
17
03
/20
18
PercentPercent
3-month 3-year 10-year
0
1
2
3
4
5
0
1
2
3
4
5
01
/20
15
04
/20
15
07
/20
15
10
/20
15
01
/20
16
04
/20
16
07
/20
16
10
/20
16
01
/20
17
04
/20
17
07
/20
17
10
/20
17
01
/20
18
PercentPercent
Hungary Czech RepublicPoland Slovakia

FINANCIAL MARKETS AND INTEREST RATES
INFLATION REPORT • MARCH 2018 45
Box 4-1: Impact of the global rise in yields and the new central bank programme on Hungarian yields
Long-term yields on the developed markets increased considerably in the past half year. The US ten-year interbank yield
rose by roughly 75 basis points, while the government securities yield increased by 65 basis points. Long-term yields in the
euro area also climbed, although to a lesser extent, rising by around 15 basis points (Chart 4-6).
The gradual increase in yields on major developed markets is partly attributable to rising inflation expectations. Against
the backdrop of favourable macroeconomic data, US and euro area 5-year forward 5-year inflation expectations also rose
compared to September 2017. The increase in US expectations was also influenced by the further tightening of the labour
market, and the latest US inflation figures also pointed towards that direction. This caused a visible increase in major central
banks’ future interest rate paths: market expectations regarding the Fed’s three-year interest rate target surged by almost
100 basis points, while those for the ECB’s rose by 45 basis points in half a year. The rise in interest rate expectations led to
higher long-term yields.
Chart 4-6: Development of 10-year government benchmark yields
Source: Bloomberg
Yield increases in developed markets around the world caused a more muted and differentiated rise in emerging market
yields. In the 10-year segment, since early September 2017, long-term interbank yields in the region and the BRICS
countries (Brazil, Russia, India, China and South Africa) climbed by approximately 15–30 basis points, i.e. the change
amounted to less than half of the yield increase in the USA. Ten-year government bond yields in the BRICS countries rose
by 30 basis points, while government bond yields in the region rose by around 50 basis points, which also fell short of the
roughly 65-basis point increase in US yields. In the case of the BRICS countries, yields climbed sharply in late October and
early November 2017, and then stagnated and adjusted slightly. The further yield increases in the US did not impact these
major emerging markets. Although regional yields increased slightly more dynamically than those in BRICS countries, their
rise was still lower than in the USA.
The development of Hungarian yields has gradually diverged from regional and euro area developments since the
autumn of 2017. While yields started to increase in the other markets of the region and the euro area in September,
Hungarian long-term interbank and government bond yields contracted significantly until mid-January, which was
fundamentally attributable to the MNB’s monetary policy communication and its new instruments. However, after this,
from mid-January, an adjustment was observed due to the global rise in yields and the elimination of speculative positions
on the forint interest rate swap market. Yet in contrast to the rise in regional and euro area yields, Hungarian ten-year
yields are still below the September levels, by 30 basis points in the case of interbank yields and 45 basis points in the case
of government bond yields. In line with the aim of the new monetary policy instruments, Hungarian long-term yields have
declined as compared to international yields, and therefore, even taking into account the adjustment in the last two
-120
-80
-40
0
40
80
-120
-80
-40
0
40
80
04
/09
/20
17
18
/09
/20
17
02
/10
/20
17
16
/10
/20
17
30
/10
/20
17
13
/11
/20
17
27
/11
/20
17
11
/12
/20
17
25
/12
/20
17
08
/01
/20
18
22
/01
/20
18
05
/02
/20
18
19
/02
/20
18
05
/03
/20
18
19
/03
/20
18
Basis pointsBasis points
EUR USDBRICS average Regional average (PLN, CZK, RON)HUF

MAGYAR NEMZETI BANK
46 INFLATION REPORT • MARCH 2018
months, the yield spread of the forint interbank and government securities transactions diminished substantially, by
50-60 basis points, since September 2017, as compared to ten-year euro yields (Chart 4-7).
Chart 4-7: Development of the 10-year forint/euro interest rate swap and government benchmark yield spreads
Source: Bloomberg
50
100
150
200
250
300
50
100
150
200
250
300
01
/09
/20
17
15
/09
/20
17
29
/09
/20
17
13
/10
/20
17
27
/10
/20
17
10
/11
/20
17
24
/11
/20
17
08
/12
/20
17
22
/12
/20
17
05
/01
/20
18
19
/01
/20
18
02
/02
/20
18
16
/02
/20
18
02
/03
/20
18
16
/03
/20
18
Basis pointsBasis points
10-year forint/euro government benchmark yield spread
10-year forint/euro interest rate swap yield spread

FINANCIAL MARKETS AND INTEREST RATES
INFLATION REPORT • MARCH 2018 47
4.2. Credit conditions of the financial intermediary system
In 2017 Q4, corporate credit conditions eased in all company size categories, while in the case of household loans it was
mainly the conditions of consumer loans which were eased by banks. The interest rate level of corporate loans declined in
all product categories according to both currency and the amount of loan. The APR level of unsecured consumer loans
increased slightly, while the annual percentage rate of charge on housing loans declined during the quarter. A further
decline in the one-year forward-looking real interest rate was observed in the period under review.
Chart 4-8: Smoothed interest rates and spreads on
corporate loans by denomination
Note: Interest rates smoothed by the 3-month moving average.
The spread is the 3-month moving average of spreads on the
3-month BUBOR and EURIBOR, respectively. Loans with floating
interest rates or with up to 1-year initial rate fixation. Since
January 2015, money market transactions are excluded.
Source: MNB
Chart 4-9: Changes in credit conditions in the corporate
and household sectors
Note: Net percentage balance of respondents tightening/easing
credit conditions weighted by market share. Forecast for 2017 H2.
Source: MNB based on banks' responses
4.2.1. Corporate credit conditions
The average interest rate level of both corporate forint
and FX loans declined in 2017 Q4. The interest rate on new,
market-based corporate forint loan contracts – excluding
money market transactions – decreased by 0.3 percentage
point in the case of small-amount loans and by
0.9 percentage point in the case of large-amount loans in
the period under review. The average interest rates on low
and high-amount EUR-denominated loans fell by 0.2 and
0.1 percentage point, respectively (Chart 4-8). The decrease
in the latter interest rate is attributable to a decline in
spreads. A decline of 0.2 percentage point was observed in
spreads on small-amount forint loans, while a larger drop of
0.8 percentage point was seen in spreads on high-amount
forint loans.
Credit conditions eased in each company size category.
Based on responses to the Lending Survey, in net terms,
16 percent of banks eased their conditions in the micro and
small enterprises segment, while 8 percent indicated easing
for medium-sized and large companies (Chart 4-9). Banks
justified the easing with a further increase in market
competition. The easing was mostly reflected in the fees
charged and in the spreads. Looking ahead, in net terms, 20
percent of the banks envisaged further easing for the next
half year, which may continue to be justified by the changes
in competition. For 2018 H1, banks plan to reduce fees in
the case of loans to large and medium-sized enterprises,
while for small and micro enterprises they envisage
increasing the maximum amount of credit limits.
4.2.2. Household credit conditions
The spread on housing loans continued to decline during
the quarter. The APR on newly granted housing loans
declined by 0.3 percentage point to 4.5 percent in the
period under review (Chart 4-10). In terms of interest
conditions, the APR level of both variable-rate loans and
loans with interest rates fixed for more than one year
decreased. Regarding the interest rate spreads on housing
loans, it was only in the case of loans fixed for a period of
1–5 years where a 20 basis points fall was observed, and
thus the average level of the interest rate spread declined
to 4.2 percentage points by the end of the year. Within
consumer loans, the average annual percentage rate of
0
1
2
3
4
0
3
6
9
12
15
18
21
24
20
07
20
08
20
09
20
10
20
11
20
12
20
13
20
14
20
15
20
16
20
17
Percent
Interest rate of EUR-denominated loans
Interest rate of HUF-denominated loans
Interest rate spread of EUR-denominated loans (right axis)
Interest rate spread of HUF-denominated loans (right axis)
Percentage points
-60
-40
-20
0
20
40
60
80
-60
-40
-20
0
20
40
60
80
2010 2011 2012 2013 2014 2015 2016 2017 2018
Easi
ng
Tig
hte
nin
g
Housing loans Consumer loansCorporate loans
Percent Percent

MAGYAR NEMZETI BANK
48 INFLATION REPORT • MARCH 2018
Chart 4-10: Smoothed annual percentage rate of charge
(APRC) and spreads of housing and consumer loans
Note: For housing loans with floating or up to 1-year interest rate
fixation the reference rate is the 3-month interbank rate, for over
a year fixation the 3-year IRS.
Source: MNB
Chart 4-11: Forward-looking real interest rates
Note: * Based on the one-year forward-looking inflation
expectations of analysts calculated by the MNB using the 1-year
zero coupon yield and the Reuters poll. **Based on the one-year
forward-looking inflation expectations of analysts calculated by
the MNB using deposit rates with maturity up to 1 year and the
Reuters poll.
Source: MNB, Reuters poll
charge on general purpose mortgage loans declined by
0.4 percentage points to 5.75 percent, while the APR level
of unsecured consumer loans rose by 15 basis points to
14.1 percent in Q4.
Banks eased the conditions on consumer loans. In Q4, in
net terms, 5 percent of the banks participating in the
Lending Survey eased conditions on housing loans
(Chart 4-9). However, looking at the specific conditions,
many institutions indicated easing: in net terms, 59 percent
of the respondent banks reduced the spread between the
lending rate and the costs of funds in the case of less risky
loans. Respondent banks primarily mentioned housing
market developments and the favourable liquidity situation
of the bank as factors supporting the easing. In net terms,
18 percent of the banks eased conditions on consumer
loans, which was reflected in the reduction of spreads and
the increase in the maximum payment-to-income ratio. In
2018 H1, 20 percent and 14 percent of banks plan to ease
the conditions of housing loans and consumer loans,
respectively. In 2017 Q4, a strong uptrend in Certified
Consumer-Friendly Housing Loans product was observed:
their share within new housing loans already reached
40 percent in December, and by the end of the year the
value of certified housing loans granted by banks amounted
to a total HUF 25 billion.
4.2.3. Changes in real interest rates
The one-year forward-looking real interest rate reached a
new historical low by the end of the year (Chart 4-11). In
2017 Q4, on the basis of the yield estimated from
government securities market yields, the real interest rate
level reduced by inflation expectations declined by 6 basis
points compared to the previous quarter, thus standing at
–2.7 percent at the end of the period. The real interest rate
calculated on the basis of deposit rates decreased to a
greater extent, standing at –2.6 percent in December 2017.
0
1
2
3
4
5
6
7
0
5
10
15
20
25
30
35
20
07
20
08
20
09
20
10
20
11
20
12
20
13
20
14
20
15
20
16
20
17
Percent
Housing loans
Other consumer loans
Housing loans spread (right axis)
Percentage points
-3-2-1012345678
-3-2-1012345678
20
07
20
08
20
09
20
10
20
11
20
12
20
13
20
14
20
15
20
16
20
17
PercentPercent
1-year real interest rate based on zero coupon yield*1-year real interest rate based on deposit rates**

BALANCE POSITION OF THE ECONOMY
INFLATION REPORT • MARCH 2018 49
5. Balance position of the economy
5.1. External balance and financing
The net lending of the Hungarian economy fell to 4.1 percent of GDP in 2017, while the current account balance declined
to 2.9 percent of GDP. The decrease is mainly attributable to the decline in the trade surplus, which is primarily linked to
the expansion of domestic demand items. Nevertheless, the decline in the country’s net lending was partly offset by the
rising level of EU funds utilisation, which was reflected in the improving transfer balance. The income balance deficit
continued to increase as foreign companies’ profits surged. On the financing side, debt outflows continued, while net FDI
increased. The reduction of the country’s net external debt was principally due to the drop in the government’s net external
debt, but to a lesser extent companies’ net external debt also shrank. Thus, by the end of 2017, net external debt declined
to 13.1 percent of GDP and gross external debt dropped to 60.1 percent of GDP, which was attributable to GDP growth as
well as transactions.
Chart 5-1: Changes in net lending and its components
Note: Cumulated four-quarter values, as a percentage of GDP.
Source: MNB
Chart 5-2: Structure of net lending
Note: The financing requirement calculated by a bottom-up
method corresponds to the total of the external financing
requirement and the BOP balance of statistical errors and
residuals.
Source: MNB
5.1.1. Developments in Hungary’s external balance
position
In 2017, Hungary’s net lending decreased to 4.1 percent of
GDP, while the current account surplus dropped to
2.9 percent (Chart 5-1). As a result of expanding domestic
demand, external balance indicators fell, but the
accelerating utilisation of EU funds restrained the reduction
in net lending. The trade surplus diminished significantly on
account of the expanding imports related to stronger
domestic absorption, and temporarily subdued exports due
to the factory shutdowns in the summer. Along with the
balance of goods and services, the income balance also
fostered a drop in the current account balance, which was
mostly attributable to the expansion of the profits of
foreign-owned companies, while interest paid to non-
residents continued to fall. The rising transfer balance was
linked to the increasing utilisation of funds from the EU’s
new programming period, albeit the level is still lower than
two years ago.
5.1.2. Developments in financing
Based on developments on the financing side, Hungary’s
net external debt continued to decrease, while its net FDI
increased (Chart 5-2). Net lending calculated from the
financial account was subdued in Q4: debt-type funds
decreased by EUR 2.1 billion, while FDI rose by
EUR 1.3 billion. However, net FDI inflows were surpassed by
capital-in-transit flows on the inflow and outflow sides. The
pace of the reduction in net external debt in Q4 exceeded
what was observed in the previous quarter. The net
external debt of the general government consolidated with
the MNB was considerably reduced due to the increasing
utilisation of EU funds, and the increasing FX liquidity placed
by the banks at the MNB.
-8-6-4-202468101214
-8-6-4-202468
101214
2008 2009 2010 2011 2012 2013 2014 2015 2016 2017
Percent Percent
Transfer balance
Income balance
Balance of goods and services
Net lending
Current account
-4
-3
-2
-1
0
1
2
3
4
-4
-3
-2
-1
0
1
2
3
4
2008 2009 2010 2011 2012 2013 2014 2015 2016 2017
EUR BillionsEUR Billions
Transactions related to derivativesDebt generating financingNon-debt generating financingNet borrowing (financial account side)Net borrowing (current and capital account side)

MAGYAR NEMZETI BANK
50 INFLATION REPORT • MARCH 2018
Chart 5-3: Decomposition of net lending by sectors
Note: Four-quarter cumulation, as a percentage of GDP.
Source: MNB
Chart 5-4: Development of net external debt by sectors
Note: Excluding intercompany loans, as a percentage of GDP.
Source: MNB
The sectors’ savings approach shows that the net
borrowing of the corporations’ increased, while the
government’s borrowing decreased. The four-quarter net
borrowing of the general government relative to GDP
decreased slightly, and thus remained low, which is
supported mainly by the tax revenues collected on account
of the rise in consumption and employment. The increasing
borrowing of companies is mainly related to rising
investments. Households’ net savings continued to increase
in the context of rapid wage growth, amounting to
5.2 percent of GDP.
By the end of 2017, Hungary’s net external debt had
declined to 13.1 percent of GDP (Chart 5-4). As the
combined result of the substantial outflows of debt
liabilities and GDP growth, Hungary’s net external debt fell
by another 2.1 percentage points. The reduction in the debt
ratio was mostly influenced by the decline in the net
external debt of the government. In addition to this, the net
external debt of the corporate sector relative to GDP also
fell slightly. In addition to net debt, gross external debt
contracted significantly, falling by 3.5 percentage points
and amounting to 60.1 percent in GDP terms at the end of
2017. Therefore, Hungary’s external vulnerability continued
to decrease in 2017.
-10-8-6-4-20246810
-10-8-6-4-202468
10
2008 2009 2010 2011 2012 2013 2014 2015 2016 2017
PercentPercent
Corporate sector
Government
Households
Net lending (financial account side)
-20
30
80
130
-10
0
10
20
30
40
50
60
70
2008200920102011201220132014201520162017
PercentPercent
CorporationsBanking systemGovernmentNet external debtGross external debt (right axis)

BALANCE POSITION OF THE ECONOMY
INFLATION REPORT • MARCH 2018 51
5.2. Forecast for Hungary’s net lending position
Looking ahead, the net lending of the economy will remain relatively high. While compared to 2017 the current account
surplus will fall to one half in 2018, the net lending position will stabilise, in line with the higher absorption of EU funds. The
decrease in the current account is primarily related to the significant decline in the trade balance, which is mainly
attributable to an increase in import-intensive investment and a pick-up in household consumption. From 2019, as a result
of a slowdown in import growth and the commissioning of newly built capacities, the deterioration in the current account
will come to an end. Over the forecast horizon, the deficit of the income balance will be around 5 percent of GDP. Looking
at the savings of sectors, in line with the expansion in lending and consumption, households’ net financial savings will
slightly and gradually decline, but will remain significant. The net borrowing of the general government will temporarily
increase in 2018, which is partly explained by tax cuts. In relation to an increase in corporate investment, the net savings of
the sector will remain at a low level in 2018, followed by gradual improvement in 2019 and 2020, in conjunction with an
upturn in exports and the still strong consumption. As a result of the considerable external position, external debt indicators
are expected to decline, contributing to Hungary’s lower external vulnerability.
Chart 5-5: Evolution of net lending
Note: As a percentage of GDP* The sum of the balance of the
current transfers and the capital account balance
Source: MNB
The net lending of the economy will remain relatively
high over the forecast horizon (Chart 5-5). At the
beginning of the forecast horizon, in line with an expansion
in import-intensive investments and an increase in
household consumption, the balance of goods and services
will decline considerably. In 2018, in parallel with an
increase in domestic absorption items, and contrary to
previous periods, the developments in the terms of trade
will also reduce the trade surplus. In 2019 the deterioration
in the current account balance will stop. At the same time,
the deterioration in net lending will be offset by a rise in
the inflow of funds belonging to the 2014–2020 EU budget
cycle, as a result of which the transfer balance surplus will
increase to 3 percent of GDP. The trade balance will
gradually improve in 2020, in which the start of production
of previously built new capacities may play an important
role, resulting in an expected pick-up in exports and an
increase in Hungary’s share in the global market. In
addition, slower growth in domestic absorption also leads
to an improvement in net exports. Overall, net lending will
be relatively high over the forecast period. As a result of
contrasting effects of various factors, the deficit on the
income balance will be around 5 percent of GDP during the
entire forecast horizon. A rise in the deficit on the income
balance is suggested by the increase in the profits of
foreign-owned companies as a result of the favourable
economic environment, and by the decline in the wage
incomes of those working temporarily abroad. This is partly
offset by an improvement in the interest balance in line
with the decline in external debt.
The net borrowing of the general government will rise
temporarily in 2018, while the financing capacity of the
private sector will remain at a high level (Chart 5-6). As a
result of favourable labour market conditions and
significant pay rises, households’ income position will
improve, in parallel with an increase in consumption over
-8
-4
0
4
8
12
16
-8
-4
0
4
8
12
16
20
08
20
09
20
10
20
11
20
12
20
13
20
14
20
15
20
16
20
17
20
18
20
19
20
20
PercentPercent
Transfer balance*Income balanceBalance of goods and servicesNet lending (current and capital account)Current account

MAGYAR NEMZETI BANK
52 INFLATION REPORT • MARCH 2018
Chart 5-6: Changes in the savings of sectors
Note: As a percentage of GDP. * Net financial saving of households
does not contain the pension savings of those who return to the
public pension system. The official net saving is different from the
data in the chart. ** We expect that ‘Net errors and omissions’
(NEO) will return to the historical average.
Source: MNB
the forecast horizon. Consequently, households’ net
financial savings will decline slightly, but remain significant.
In accordance with the expansion of investment, net
corporate savings will remain at low levels in 2018–2019.
Subsequently, the net borrowing of the sector is expected
to decrease as a result of continued strong consumption,
absorption of EU transfers and acceleration in export
dynamics. The net borrowing of the general government
will temporarily exceed 2 percent of GDP in 2018, which is
partly attributable to tax cuts (social contribution tax,
targeted VAT cuts) and partly to the loss of revenues from
the tax credit for growth and land sales. The borrowing
requirement of the general government will gradually
improve in the second half of the forecast period as a result
of a rise in tax revenues due to economic growth and a
further decline in interest expenditures.
The still considerable net lending position will contribute
to a decline in external debt indicators. Net lending will
decline at the beginning of the forecast period, but will
continue to contribute to the decrease of the external debt
indicators of the economy and thus to lowering external
vulnerability.
-10
-6
-2
2
6
10
-10
-6
-2
2
6
10
20
08
20
09
20
10
20
11
20
12
20
13
20
14
20
15
20
16
20
17
20
18
20
19
20
20
PercentPercent
CorporationsHousehold sector*Government (ESA balance)Net lending (real economy side)Net lending (financial account side)**
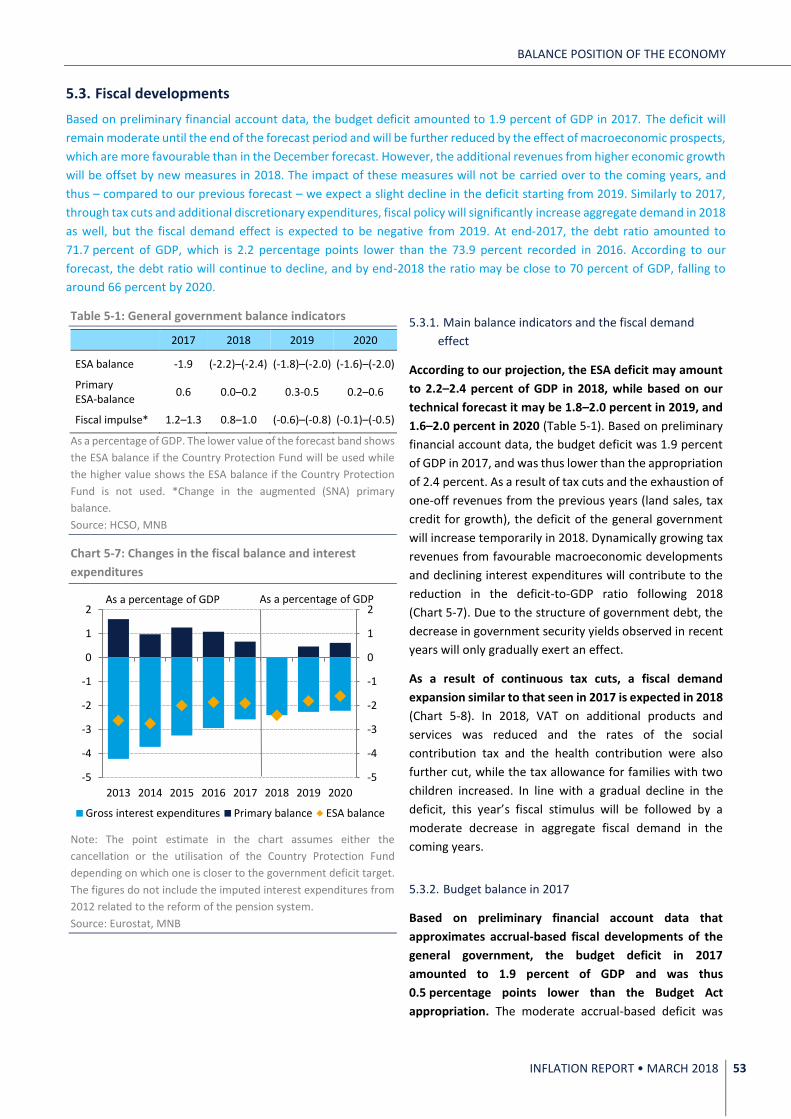
BALANCE POSITION OF THE ECONOMY
INFLATION REPORT • MARCH 2018 53
5.3. Fiscal developments
Based on preliminary financial account data, the budget deficit amounted to 1.9 percent of GDP in 2017. The deficit will
remain moderate until the end of the forecast period and will be further reduced by the effect of macroeconomic prospects,
which are more favourable than in the December forecast. However, the additional revenues from higher economic growth
will be offset by new measures in 2018. The impact of these measures will not be carried over to the coming years, and
thus – compared to our previous forecast – we expect a slight decline in the deficit starting from 2019. Similarly to 2017,
through tax cuts and additional discretionary expenditures, fiscal policy will significantly increase aggregate demand in 2018
as well, but the fiscal demand effect is expected to be negative from 2019. At end-2017, the debt ratio amounted to
71.7 percent of GDP, which is 2.2 percentage points lower than the 73.9 percent recorded in 2016. According to our
forecast, the debt ratio will continue to decline, and by end-2018 the ratio may be close to 70 percent of GDP, falling to
around 66 percent by 2020.
Table 5-1: General government balance indicators
2017 2018 2019 2020
ESA balance -1.9 (-2.2)–(-2.4) (-1.8)–(-2.0) (-1.6)–(-2.0)
Primary ESA-balance
0.6 0.0–0.2 0.3-0.5 0.2–0.6
Fiscal impulse* 1.2–1.3 0.8–1.0 (-0.6)–(-0.8) (-0.1)–(-0.5)
As a percentage of GDP. The lower value of the forecast band shows
the ESA balance if the Country Protection Fund will be used while
the higher value shows the ESA balance if the Country Protection
Fund is not used. *Change in the augmented (SNA) primary
balance.
Source: HCSO, MNB
Chart 5-7: Changes in the fiscal balance and interest
expenditures
Note: The point estimate in the chart assumes either the
cancellation or the utilisation of the Country Protection Fund
depending on which one is closer to the government deficit target.
The figures do not include the imputed interest expenditures from
2012 related to the reform of the pension system.
Source: Eurostat, MNB
5.3.1. Main balance indicators and the fiscal demand
effect
According to our projection, the ESA deficit may amount
to 2.2–2.4 percent of GDP in 2018, while based on our
technical forecast it may be 1.8–2.0 percent in 2019, and
1.6–2.0 percent in 2020 (Table 5-1). Based on preliminary
financial account data, the budget deficit was 1.9 percent
of GDP in 2017, and was thus lower than the appropriation
of 2.4 percent. As a result of tax cuts and the exhaustion of
one-off revenues from the previous years (land sales, tax
credit for growth), the deficit of the general government
will increase temporarily in 2018. Dynamically growing tax
revenues from favourable macroeconomic developments
and declining interest expenditures will contribute to the
reduction in the deficit-to-GDP ratio following 2018
(Chart 5-7). Due to the structure of government debt, the
decrease in government security yields observed in recent
years will only gradually exert an effect.
As a result of continuous tax cuts, a fiscal demand
expansion similar to that seen in 2017 is expected in 2018
(Chart 5-8). In 2018, VAT on additional products and
services was reduced and the rates of the social
contribution tax and the health contribution were also
further cut, while the tax allowance for families with two
children increased. In line with a gradual decline in the
deficit, this year’s fiscal stimulus will be followed by a
moderate decrease in aggregate fiscal demand in the
coming years.
5.3.2. Budget balance in 2017
Based on preliminary financial account data that
approximates accrual-based fiscal developments of the
general government, the budget deficit in 2017
amounted to 1.9 percent of GDP and was thus
0.5 percentage points lower than the Budget Act
appropriation. The moderate accrual-based deficit was
-5
-4
-3
-2
-1
0
1
2
-5
-4
-3
-2
-1
0
1
2
2013 2014 2015 2016 2017 2018 2019 2020
Gross interest expenditures Primary balance ESA balance
As a percentage of GDPAs a percentage of GDP

MAGYAR NEMZETI BANK
54 INFLATION REPORT • MARCH 2018
Chart 5-8: The fiscal demand effect
Note: As a percentage of GDP. The fiscal demand effect
corresponds to the change in the augmented (SNA) primary
balance. The fiscal impulse contains the effect of EU funds to the
extent of the co-financing. The positive prefix indicates demand
expansion, while the negative prefix implies demand restraint.
Source: MNB
Table 5-2: Decomposition of the change in the 2018 ESA
balance forecast (compared to the previous Inflation
Report)
Economic developments
Measure and other
I. Central government revenues
0.3 0.0
Payment by economic units 0.1
Taxes on consumption 0.2
Taxes on labour 0.1
II. Central government expenditures
0.0 -0.4
Net own expenditures of budgetary organisations
-0.2
Advance wage raise in
healthcare -0.1
Winter-related utility cost
reduction -0.1
One-off pension vouchers -0.1
III. Other effects 0.0 0.1
Other 0.1
Total (I.+II.+III.) 0.3 -0.3
Note: As a percentage of GDP. The positive and negative prefixes
indicate deficit-reducing and deficit-increasing effects,
respectively. The sum of partial data may differ from the
aggregated values because of the rounding.
Source: MNB
realised in conjunction with a 5.5 percent cash-based
deficit of the central sub-system. The difference between
the accrual-based and cash-based deficits was primarily
caused by the advance payments of EU funds, a substantial
surplus of local governments and some other accrual-
based adjustments.
5.3.3. Budget balance in 2018
According to our forecast, the ESA deficit in 2018 will be
2.2–2.4 percent of GDP which is in line with our
December projection (Table 5-2). Measures announced
since the December Inflation Report include advance wage
raises in healthcare (emergency medical staff, nurses)
brought forward from November, one-off pension
supplements granted in the form of Erzsébet vouchers as
well as winter-related utility cost reduction deductible
from the gas and district heating bills and an increase of
the social firewood allocation. The total impact of these
newly announced additional expenditures is estimated to
amount to some 0.3 percent of GDP, which, however, is
offset by the rise in tax revenues resulting from favourable
macroeconomic prospects.
Our projection for the 2018 deficit is in line with the
2.4 percent appropriation (Table 5-3). Regarding
consumption taxes (primarily VAT revenues), our forecast
is below this year’s appropriation, which might mainly be
attributable to the differences in the estimates concerning
the whitening of the economy. At the same time this is
compensated by the lower net expenditure level of central
budgetary organisations, because the high ratio of
advance payments within the disbursements of EU funds
indicates that the actual utilisation of funds to be taken
into account in accrual accounting will fall short of the
appropriation. This year the rate of social contribution tax
and the upper rate of the health contribution decline by
another 2.5 percentage points; these revenues are
expected to be in line with the appropriation.
5.3.4. 2019 and 2020 fiscal balances
Due to the lack of budget acts available, for 2019 and
2020 we prepare technical forecasts, which show a
gradually declining deficit. The budget deficit may decline
to 1.8–2.0 percent of GDP in 2019 and to 1.6–2.0 percent
in 2020. The rise in tax revenues stemming from high
economic growth is the primary factor contributing to the
decline in the general government deficit. According to our
forecast, in line with the wage agreement, the social
contribution tax rate will be reduced by a further
-1.0
-0.5
0.0
0.5
1.0
1.5
-1.0
-0.5
0.0
0.5
1.0
1.5
2013 2014 2015 2016 2017 2018 2019 2020
As a percentage of GDP As a percentage of GDP
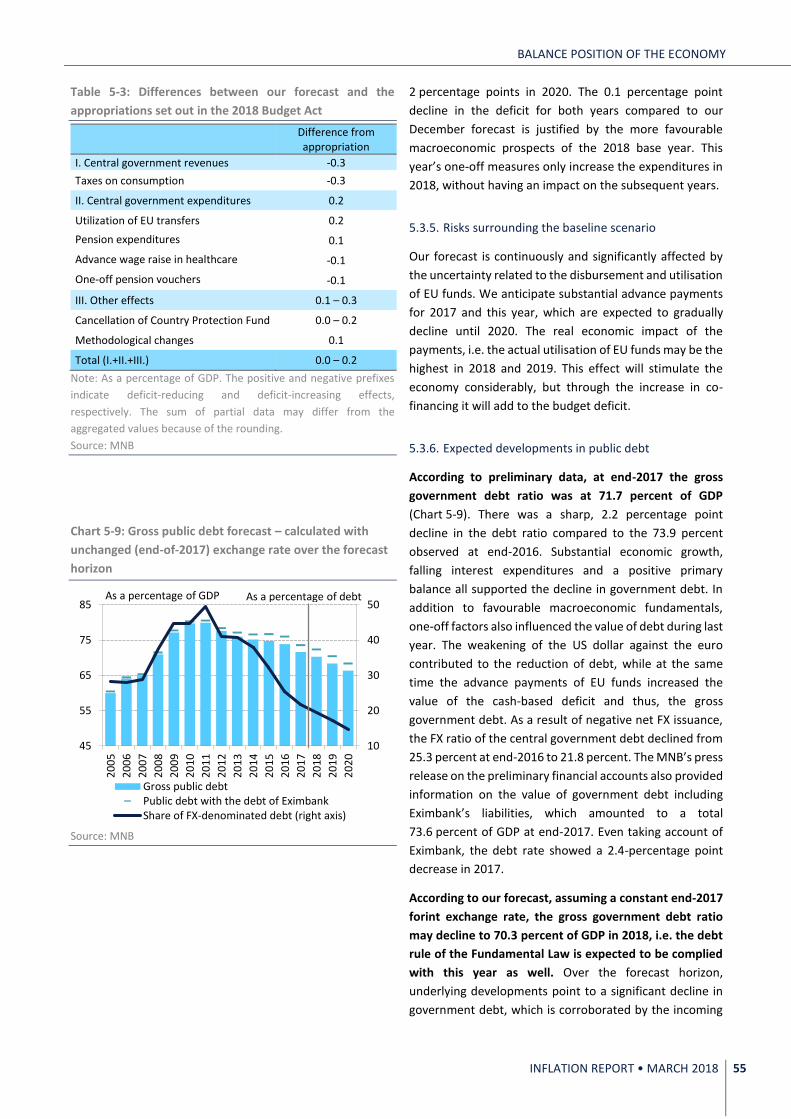
BALANCE POSITION OF THE ECONOMY
INFLATION REPORT • MARCH 2018 55
Table 5-3: Differences between our forecast and the
appropriations set out in the 2018 Budget Act
Difference from appropriation
I. Central government revenues -0.3
Taxes on consumption -0.3
II. Central government expenditures 0.2
Utilization of EU transfers 0.2
Pension expenditures 0.1
Advance wage raise in healthcare -0.1
One-off pension vouchers -0.1
III. Other effects 0.1 – 0.3
Cancellation of Country Protection Fund 0.0 – 0.2
Methodological changes 0.1
Total (I.+II.+III.) 0.0 – 0.2
Note: As a percentage of GDP. The positive and negative prefixes
indicate deficit-reducing and deficit-increasing effects,
respectively. The sum of partial data may differ from the
aggregated values because of the rounding.
Source: MNB
Chart 5-9: Gross public debt forecast – calculated with
unchanged (end-of-2017) exchange rate over the forecast
horizon
Source: MNB
2 percentage points in 2020. The 0.1 percentage point
decline in the deficit for both years compared to our
December forecast is justified by the more favourable
macroeconomic prospects of the 2018 base year. This
year’s one-off measures only increase the expenditures in
2018, without having an impact on the subsequent years.
5.3.5. Risks surrounding the baseline scenario
Our forecast is continuously and significantly affected by
the uncertainty related to the disbursement and utilisation
of EU funds. We anticipate substantial advance payments
for 2017 and this year, which are expected to gradually
decline until 2020. The real economic impact of the
payments, i.e. the actual utilisation of EU funds may be the
highest in 2018 and 2019. This effect will stimulate the
economy considerably, but through the increase in co-
financing it will add to the budget deficit.
5.3.6. Expected developments in public debt
According to preliminary data, at end-2017 the gross
government debt ratio was at 71.7 percent of GDP
(Chart 5-9). There was a sharp, 2.2 percentage point
decline in the debt ratio compared to the 73.9 percent
observed at end-2016. Substantial economic growth,
falling interest expenditures and a positive primary
balance all supported the decline in government debt. In
addition to favourable macroeconomic fundamentals,
one-off factors also influenced the value of debt during last
year. The weakening of the US dollar against the euro
contributed to the reduction of debt, while at the same
time the advance payments of EU funds increased the
value of the cash-based deficit and thus, the gross
government debt. As a result of negative net FX issuance,
the FX ratio of the central government debt declined from
25.3 percent at end-2016 to 21.8 percent. The MNB’s press
release on the preliminary financial accounts also provided
information on the value of government debt including
Eximbank’s liabilities, which amounted to a total
73.6 percent of GDP at end-2017. Even taking account of
Eximbank, the debt rate showed a 2.4-percentage point
decrease in 2017.
According to our forecast, assuming a constant end-2017
forint exchange rate, the gross government debt ratio
may decline to 70.3 percent of GDP in 2018, i.e. the debt
rule of the Fundamental Law is expected to be complied
with this year as well. Over the forecast horizon,
underlying developments point to a significant decline in
government debt, which is corroborated by the incoming
10
20
30
40
50
45
55
65
75
85
20
05
20
06
20
07
20
08
20
09
20
10
20
11
20
12
20
13
20
14
20
15
20
16
20
17
20
18
20
19
20
20
Gross public debtPublic debt with the debt of EximbankShare of FX-denominated debt (right axis)
As a percentage of debtAs a percentage of GDP

MAGYAR NEMZETI BANK
56 INFLATION REPORT • MARCH 2018
revenues of previously advanced EU funds in 2019 and
2020. As a result of growth and moderate deficit, the debt
ratio may decline by 1.4 percentage points this year and
2 percentage points annually in 2019 and 2020, coming
close to 66 percent by the end of the forecast period. Due
to lower FX maturities, FX debt may decline somewhat
slower than in the previous years, but still contribute to the
further reduction of Hungary’s external financial
vulnerability. By end-2018, the FX ratio of the central
government debt may decline to around 19 percent.

SPECIAL TOPICS
INFLATION REPORT • MARCH 2018 57
6. Special topics
6.1. Effect of digital technological progress on inflation developments
The relationship between the unemployment rate and inflation, i.e. the so-called Phillips curve, has been a cornerstone
of economic thinking that developed in recent decades. Recently, the flattening of the Phillips curve was observed, as a
result of which the inflationary impact of the domestic business cycle decreased considerably. This is confirmed by the fact
that during the crisis the weak demand environment did not result in deflation, despite the projections of the theoretical
models, and the post-crisis upswing also did not cause a substantial acceleration in price dynamics. In addition, even though
the speed of recovery from the crisis varied widely across the economies, no divergence can be observed in inflation
despite the different labour market cycles (Chart 6-1).
Chart 6-1: Standard deviations of unemployment rates and inflation rates in the EU
Source: Eurostat, MNB
As cyclical factors become marginal, researchers and analysts increasingly focus on evaluating the inflationary effects of
structural changes (e.g. globalisation, demographic developments, etc.). One of the structural changes that may affect
inflation is digitalisation, or technological progress. Digitalisation presents new opportunities and poses new challenges at
the same time. Consumer behaviour towards products and services as well as people’s attitude towards innovation are
being transformed. From the perspective of central banks, one of the most crucial issues is to what extent digitalisation
is able to explain the current, globally subdued inflation developments, and what should be expected looking ahead.
From the perspective of companies, today’s digitalisation technologies, such as mobile technology, big data analysis, cloud
storage, sensors, digital platforms and automation, may bring about a huge transformation in the traditional operation of
companies, and the way firms cooperate with their suppliers and serve consumers. The question is what pricing strategy
businesses will follow in this environment characterised by rapidly evolving technologies, and how the digital
transformation will affect the related supply chains. Although quantitative results are still uncertain and it is difficult to
study them independent from other factors (e.g. globalisation), according to the companies surveyed on this topic, the
disinflationary impact of digitalisation may stem from falling costs and downward price competition.1
1 For more on the Canadian corporate survey on this topic, see Dong et al. (2017): “Digital Transformation in the Service Sector: Insights
from Consultations with Firms in Wholesale, Retail and Logistics”, Bank of Canada Staff Analytical Note, 2017–19.
-5
0
5
10
15
20
25
2004-2012 2013-2017 2004-2012 2013-2017
Unemployment rate Inflation rate
Percent
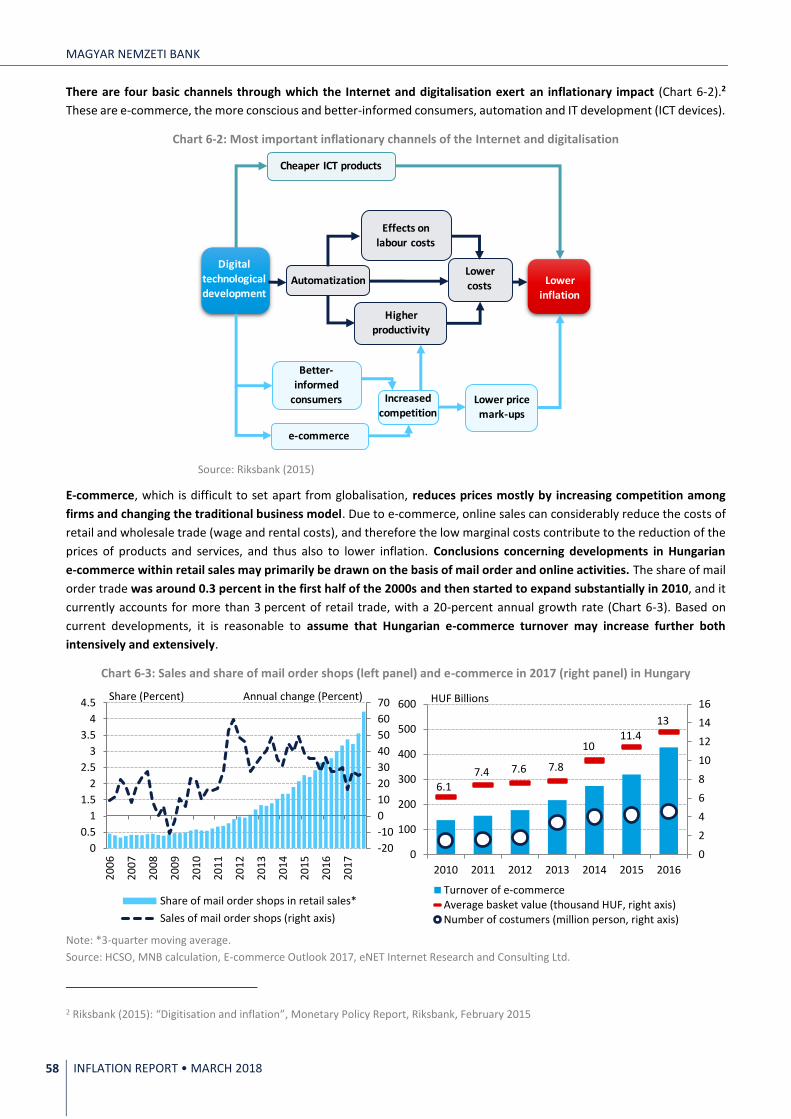
MAGYAR NEMZETI BANK
58 INFLATION REPORT • MARCH 2018
There are four basic channels through which the Internet and digitalisation exert an inflationary impact (Chart 6-2).2
These are e-commerce, the more conscious and better-informed consumers, automation and IT development (ICT devices).
Chart 6-2: Most important inflationary channels of the Internet and digitalisation
Source: Riksbank (2015)
E-commerce, which is difficult to set apart from globalisation, reduces prices mostly by increasing competition among
firms and changing the traditional business model. Due to e-commerce, online sales can considerably reduce the costs of
retail and wholesale trade (wage and rental costs), and therefore the low marginal costs contribute to the reduction of the
prices of products and services, and thus also to lower inflation. Conclusions concerning developments in Hungarian
e-commerce within retail sales may primarily be drawn on the basis of mail order and online activities. The share of mail
order trade was around 0.3 percent in the first half of the 2000s and then started to expand substantially in 2010, and it
currently accounts for more than 3 percent of retail trade, with a 20-percent annual growth rate (Chart 6-3). Based on
current developments, it is reasonable to assume that Hungarian e-commerce turnover may increase further both
intensively and extensively.
Chart 6-3: Sales and share of mail order shops (left panel) and e-commerce in 2017 (right panel) in Hungary
Note: *3-quarter moving average.
Source: HCSO, MNB calculation, E-commerce Outlook 2017, eNET Internet Research and Consulting Ltd.
2 Riksbank (2015): “Digitisation and inflation”, Monetary Policy Report, Riksbank, February 2015
e-commerce
Automatization
Digital
technological development
Lower
inflation
Cheaper ICT products
Effects on labour costs
Lower costs
Higherproductivity
Better-
informed consumers Increased
competitionLower price mark-ups
0
0.5
1
1.5
2
2.5
3
3.5
4
4.5
20
06
20
07
20
08
20
09
20
10
20
11
20
12
20
13
20
14
20
15
20
16
20
17
-20
-10
0
10
20
30
40
50
60
70Annual change (Percent)Share (Percent)
Share of mail order shops in retail sales*
Sales of mail order shops (right axis)
6.17.4 7.6 7.8
1011.4
13
0
2
4
6
8
10
12
14
16
0
100
200
300
400
500
600
2010 2011 2012 2013 2014 2015 2016
Turnover of e-commerceAverage basket value (thousand HUF, right axis)Number of costumers (million person, right axis)
HUF Billions
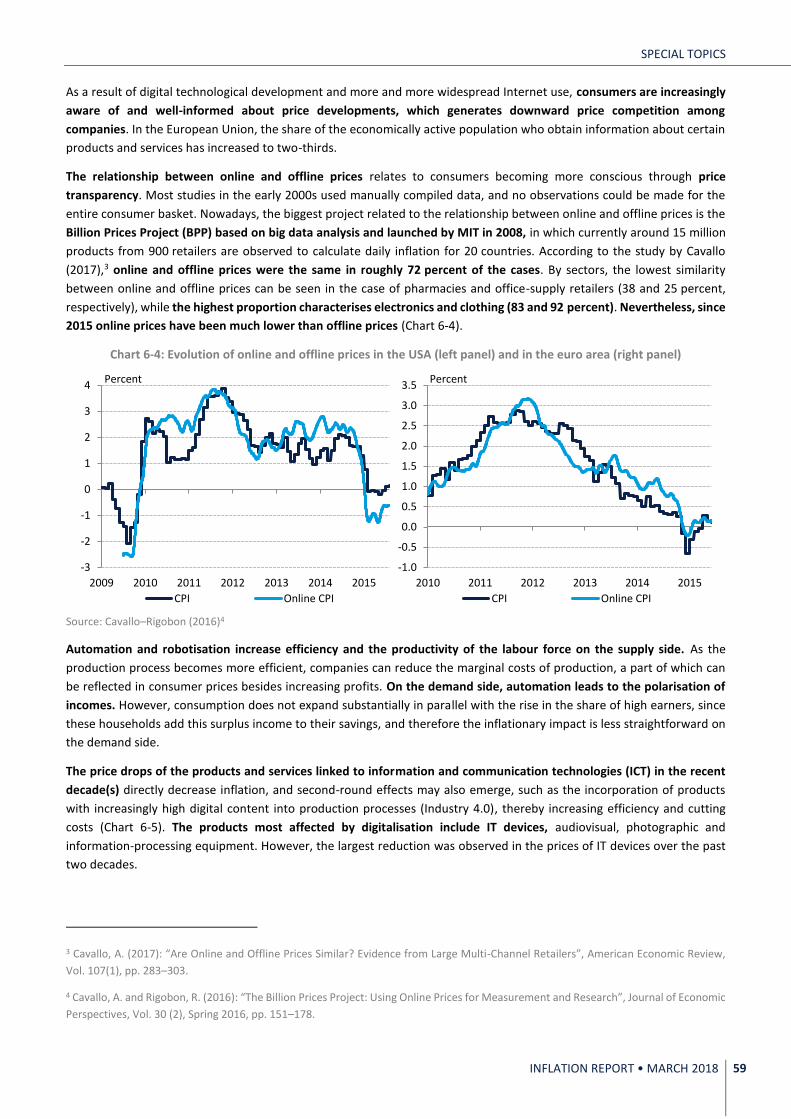
SPECIAL TOPICS
INFLATION REPORT • MARCH 2018 59
As a result of digital technological development and more and more widespread Internet use, consumers are increasingly
aware of and well-informed about price developments, which generates downward price competition among
companies. In the European Union, the share of the economically active population who obtain information about certain
products and services has increased to two-thirds.
The relationship between online and offline prices relates to consumers becoming more conscious through price
transparency. Most studies in the early 2000s used manually compiled data, and no observations could be made for the
entire consumer basket. Nowadays, the biggest project related to the relationship between online and offline prices is the
Billion Prices Project (BPP) based on big data analysis and launched by MIT in 2008, in which currently around 15 million
products from 900 retailers are observed to calculate daily inflation for 20 countries. According to the study by Cavallo
(2017),3 online and offline prices were the same in roughly 72 percent of the cases. By sectors, the lowest similarity
between online and offline prices can be seen in the case of pharmacies and office-supply retailers (38 and 25 percent,
respectively), while the highest proportion characterises electronics and clothing (83 and 92 percent). Nevertheless, since
2015 online prices have been much lower than offline prices (Chart 6-4).
Chart 6-4: Evolution of online and offline prices in the USA (left panel) and in the euro area (right panel)
Source: Cavallo–Rigobon (2016)4
Automation and robotisation increase efficiency and the productivity of the labour force on the supply side. As the
production process becomes more efficient, companies can reduce the marginal costs of production, a part of which can
be reflected in consumer prices besides increasing profits. On the demand side, automation leads to the polarisation of
incomes. However, consumption does not expand substantially in parallel with the rise in the share of high earners, since
these households add this surplus income to their savings, and therefore the inflationary impact is less straightforward on
the demand side.
The price drops of the products and services linked to information and communication technologies (ICT) in the recent
decade(s) directly decrease inflation, and second-round effects may also emerge, such as the incorporation of products
with increasingly high digital content into production processes (Industry 4.0), thereby increasing efficiency and cutting
costs (Chart 6-5). The products most affected by digitalisation include IT devices, audiovisual, photographic and
information-processing equipment. However, the largest reduction was observed in the prices of IT devices over the past
two decades.
3 Cavallo, A. (2017): “Are Online and Offline Prices Similar? Evidence from Large Multi-Channel Retailers”, American Economic Review,
Vol. 107(1), pp. 283–303.
4 Cavallo, A. and Rigobon, R. (2016): “The Billion Prices Project: Using Online Prices for Measurement and Research”, Journal of Economic
Perspectives, Vol. 30 (2), Spring 2016, pp. 151–178.
-3
-2
-1
0
1
2
3
4
2009 2010 2011 2012 2013 2014 2015
Percent
CPI Online CPI
-1.0
-0.5
0.0
0.5
1.0
1.5
2.0
2.5
3.0
3.5
2010 2011 2012 2013 2014 2015
Percent
CPI Online CPI

MAGYAR NEMZETI BANK
60 INFLATION REPORT • MARCH 2018
The role of external factors has increased in Hungarian inflation developments. Along with global factors, digitalisation
may also play a role in the subdued nature of Hungarian inflation, which falls short of the central bank’s target, however,
quantifying these effects is fairly difficult and uncertain.
Chart 6-5: Distribution of the monthly changes of the core inflation excluding indirect tax effects and audio, video
equipment (2000–2017)
Note: The chart shows the distribution of the monthly changes of the core inflation excluding indirect tax effects and audio, video
equipment between February 2000 and December 2017 before and after 2009. For example the 0.0–0.1 percent monthly change has
to be interpreted in a way that while between 2000–2009 11 percent of the monthly core inflation changes were in the range of 0.0–0.1
percent, this ratio rose to 27 percent after 2009. In the case of audio, video equipment the 0.0–0.1 percent monthly change means that
while between 2000–2009 7.5 percent of the monthly changes of the product group were in the range of 0.0–0.1 percent, this ratio
declined to 1.9 percent after 2009.
Source: HCSO, MNB
As a result of the rise in the proportion of households with broadband Internet access, consumers started to become more
conscious after 2009, and there are more opportunities for online price comparison. The inflationary impact of digitalisation
was examined using core inflation excluding indirect taxes and the tax-adjusted monthly changes to some products most
exposed to technological progress. The analysis of core inflation excluding indirect taxes is reasonable because of the fact
that there are many volatile factors in overall inflation that are typically influenced by cost-side effects and the decisions of
authorities. Filtering out the direct inflationary impact of these items enables the analysis of the underlying trends in
Hungary. Digitalisation, in parallel with the global economic crisis and the moderation of the inflationary environment, may
partly affect the distribution of the monthly changes in core inflation excluding indirect taxes, which shifted towards left,
i.e. more moderate price changes, or sometimes even price decreases, after 2009. At the product level, the monthly price changes of the product groups included in the analysis show that partly due to digitalisation and higher technological content, the large monthly price changes seen before 2009 have disappeared or become subdued (Table 6-1).
Table 6-1: Standard deviations of the monthly prices changes of those product groups, which are mainly affected by
digitalisation
Standard deviation of monthly price change (percentage points)
Television Audio, video equipment
Computer, camera, telephone
Recording media Mobile phone and Internet
before 2009 0.5 0.8 1.5 0.5 1.4
after 2009 0.5 0.5 0.4 0.4 0.6 Source: HCSO, MNB
Just like globalisation, the process of digitalisation is one of today’s structural changes that may substantially influence
certain countries’ price dynamics. According to recent studies, today’s low inflation environment falling short of the
central banks’ targets is partly due to technological progress, which may pose a new challenge to monetary policy. Based
on the examination of Hungarian data, the distribution of inflation shifted to the left after 2009 overall, and an important
difference as compared to core inflation excluding indirect taxes is that in the case of these product groups, the proportion
0
5
10
15
20
25
30
35
(-0
.4)–
(-0
.3)
(-0
.3)–
(-0
.2)
(-0
.2)–
(-0
.1)
(-0
.1)–
0.0
0.0
–0.1
0.1
–0.2
0.2
–0.3
0.3
–0.4
0.4
–0.5
0.5
–0.6
0.6
–0.7
0.7
–0.8
0.8
–0.9
0.9
–1 1–
before 2009 after 2009
Relative frequency
Percent
Median before 2009: 0.35Median after 2009: 0.15
0
5
10
15
20
25
–(-1
)
(-0
.9)–
(-0
.8)
(-0
.7)–
(-0
.6)
(-0
.5)–
(-0
.4)
(-0
.3)–
(-0
.2)
(-0
.1)–
0.0
0.1
–0.2
0.3
–0.4
0.5
–0.6
0.7
–0.8
0.9
–1
before 2009 after 2009
Relative frequency
Percent
Median before 2009: 0.31Median after 2009: -0.63

SPECIAL TOPICS
INFLATION REPORT • MARCH 2018 61
of negative price changes, i.e. monthly price decreases, has increased. In the past roughly one decade, price reductions
have become more common in the case of the analysed technical and technological devices and services.
6.2. Evaluation of the central bank’s forecasts for 2017
The purpose of this analysis is to present the accuracy of the fulfilment of our forecasts for the values of the key
macroeconomic variables in the previous calendar year. In addition, we also examine how the central bank’s forecasting
performance relates to that of market analysts. The first forecast for the variables examined for 2017 was prepared in
December 2015. Overall, the 2017 inflation was more or less in line with the forecast, while economic growth, and the wage
and employment dynamics were higher.
6.2.1. Inflation
Our forecasts projected inflation of around 2.5 percent for 2017 over the whole period. Core inflation excluding indirect
taxes was expected to gradually increase, which was supported by rising demand due to the favourable income
developments and the easing precautionary motives. However, on account of the weakened relationship between labour
costs and prices (flattened Phillips curve) after the crisis, a moderate inflationary impact of wage outflows was expected.
It was projected that the inflationary impact from the labour market may remain moderate even in the context of higher
wage dynamics due to administrative measures, since the upward pressure on costs exerted by the measures would be
mitigated by the reduction of the social contribution tax and the corporate tax as well as the whitening effect. Over the
whole period, a subdued external inflation environment was expected.
The minor changes in the projections for 2017 were mainly caused by the developments of the assumptions regarding
oil prices (Chart 6-6). After the announcement of excise duty increases (tobacco, gas oil, petrol) and VAT cuts (Internet,
eggs, fresh milk, poultry, restaurant services), it was estimated that the inflationary effects of the measures would offset
each other overall, which was confirmed by nowcasting.
Chart 6-6: Development of oil price assumptions
Source: Bloomberg
All in all, our inflation forecasts for 2017 were more accurate than market analysts' forecasts over the whole period. Our
projections were higher than the median of the market analysts participating in the Reuters survey, and stable at around
2.5 percent (Chart 6-7).
25
30
35
40
45
50
55
60
2015 2016 201712.2015 03.2016 06.2016 09.201612.2016 03.2017 06.2017 09.201712.2017 Actual
EUR/barrel

MAGYAR NEMZETI BANK
62 INFLATION REPORT • MARCH 2018
Chart 6-7: 2017 inflation forecasts by the MNB and the market
Note: The band shows the range of the forecasts by the economists involved in the Reuters survey.
Source: Reuters, HCSO, MNB
6.2.2. Economic growth
Economic growth in 2017 was higher than forecast by the central bank, but market projections also typically
underestimated the extent of growth. The fact that growth was higher than forecast by the central bank was linked to the
impact of raising the minimum wage and the guaranteed minimum wage in 2017 on wage outflows and thus household
consumption. The MNB’s average forecast error for the entire horizon was smaller than the forecast error in the market
analysts’ median.
Chart 6-8: 2017 growth forecasts by the MNB and the market
Note: The band shows the range of the forecasts by the economists involved in the Reuters survey.
Source: Reuters, HCSO, MNB
In 2016, we expected balanced growth in the Hungarian economy for 2017. Our expectations showed that growth would
be significantly influenced by strengthening domestic demand, in which the expansion in consumption and private
investments would play a key role. This year’s steady increase in household consumption was linked to the positive income
1.0
1.5
2.0
2.5
3.0
3.5
12
/20
15
03
/20
16
06
/20
16
09
/20
16
12
/20
16
03
/20
17
06
/20
17
09
/20
17
12
/20
17
Percent
Reuters median MNB forecast Actual
1.5
2
2.5
3
3.5
4
4.5
1.5
2.0
2.5
3.0
3.5
4.0
4.5
20
15
/12
20
16
/03
20
16
/06
20
16
/09
20
16
/12
20
17
/03
20
17
/06
20
17
/09
20
17
/12
PercentPercent
Range of Reuters forecasts Reuters median
MNB forecast Actual
SPECIAL TOPICS
INFLATION REPORT • MARCH 2018 63
trends, the expansion of retail lending and the significant rise in net financial assets. The increasing investments in the
national economy were also influenced by greenfield FDI and government investments rising in parallel with the inflow of
European Union funds. Stemming from the import-intensive nature of the growth in domestic demand items, net exports
were expected to contribute negatively to growth.
At the end of 2016, our growth forecast was revised significantly upwards (Chart 6-8). This was warranted by several
factors:
• in our revised forecast, due to the impact of raising of the minimum wage and the guaranteed minimum wage on
earned income, household consumption was expected to expand more dynamically than previously anticipated;
• the 2017 measures increased the fiscal demand effect, which supported economic growth;
• lending, which expanded as a result of the Growth Supporting Programme and the reduction of the bank levy, and
the capacity-expanding investments of the sectors closely linked to the automotive industry both supported the
more dynamic growth in investments.
The detailed figure published at the beginning of 2018 by HCSO with regard to the 2017 economic growth was slightly
higher than our forecast, due to the following factors:
• in parallel with the favourable international economic activity, the dynamics and thus also the growth contribution
of Hungarian exports increased at the end of the year more than expected, despite not being warranted by
industrial developments;
• as a result of revising down agricultural performance in 2016, last year’s agricultural performance hampered
growth less than previously expected.
All in all, the central bank’s real economy projections were usually higher than the median of market expectations, and
closer to the future actual data.
6.2.3. Labour market
In our forecast, it was expected that the labour demand of the private sector would rise in parallel with economic growth,
but companies’ efforts to increase their headcount are heavily influenced by the fact that the available labour reserves are
increasingly limited not only from a quantitative perspective but also a qualitative perspective. Therefore, our projections
for 2017 estimated that the rise in the number of employees in the private sector will decelerate.
Until the end of 2016, our projections for the employment growth in the private sector in 2017 substantially
underestimated the actual data, however, since early 2017 they have been near the actual data (Chart 6-9). On account
of the stronger-than-expected employment data in 2016, our forecast for 2017 was significantly modified.

MAGYAR NEMZETI BANK
64 INFLATION REPORT • MARCH 2018
Chart 6-9: MNB projections for the private sector’s headcount index in 2017
Source: HCSO, MNB
Our forecasts estimated that due to the tight labour market environment, increasing wage competition would evolve both
among companies and sectors in order to fill open positions and to keep the current workforce, therefore gradually
strengthening wage growth was forecast for 2017.
At the beginning of the period, as a result of productivity dynamics, which were more subdued than prior to the crisis, and
the low inflation expectations, only moderately strengthening nominal wage dynamics of around 5 percent were expected
for 2017. The reported March 2016 wage data (companies typically raise regular wages in March) pointed towards
stronger nominal wage dynamics than expected, which was reflected in our June 2016 forecast. After the wage agreement
was announced in November 2016, it was estimated that the administrative measures may boost the private sector’s
nominal wage dynamics by 2.5 percentage points more than our earlier forecast, also taking into account direct and
spillover effects. The March 2017 wage data showed that the spillover effect of the substantial increase of the minimum
wage and the guaranteed minimum wage (on the wages of those not earning the minimum wage or the guaranteed
minimum wage, to avoid wage compression) was larger than expected, which was confirmed by the wage data later in the
year. According to our nowcasting, taking into account direct and spillover effects, the administrative measures ultimately
supported underlying wage trends by nearly 5 percentage points in 2017.
Overall, our projections for private sector wage dynamics in 2017 substantially underestimated the actual data over the
whole period, but they came closer and closer to it (Chart 6-10).
1.0
1.2
1.4
1.6
1.8
2.0
2.2
2.4
1.0
1.2
1.4
1.6
1.8
2.0
2.2
2.4
12
/20
15
03
/20
16
06
/20
16
09
/20
16
12
/20
16
03
/20
17
06
/20
17
09
/20
17
12
/20
17
PercentPercent
Actual MNB forecast

SPECIAL TOPICS
INFLATION REPORT • MARCH 2018 65
Chart 6-10: MNB projections for the private sector’s wage index in 2017
Source: HCSO, MNB
4
5
6
7
8
9
10
11
12
4
5
6
7
8
9
10
11
12
12
/20
15
03
/20
16
06
/20
16
09
/20
16
12
/20
16
03
/20
17
06
/20
17
09
/20
17
12
/20
17
PercentPercent
MNB forecast Actual

MAGYAR NEMZETI BANK
66 INFLATION REPORT • MARCH 2018
7. Breakdown of the average consumer price
index for 2018 Table 7-1: Decomposition of inflation to carry-over and incoming effects (percentage points and percent respectively)
Effect on CPI in 2018
Carry-over
effect Incoming
effect Yearly index
Administered prices 0.0 0.1 0.1
Market prices 0.7 1.7 2.4
Indirect taxes and government measures
0.2 -0.2 0.0
CPI 0.9 1.6 2.5 Note: The tables show the decomposition of the yearly average change of the consumer price index. The yearly change is the sum of so-
called carry-over and incoming effects. The carry-over effect is the part of the yearly index, which can be explained by the preceding
year's price changes, while the incoming effect reflects the changes in the recent year. We decomposed these indices to the sub-
aggregates of the consumer price index and calculated the inflationary effects of changes in the indirect taxes, administered prices, and
market prices (not administered prices excluding indirect tax effects). The subgroups may not sum to the aggregate figure due to
rounding.
Source: MNB
Table 7-2: Detailed decomposition of our inflation forecast into carry-over and incoming effects
(percentage points and percent respectively)
2018
Average
carry-over effect
Carry-over indirect
tax effect
Average incoming
effect
Incoming indirect
tax effect
Yearly index
Food 0.9 0.0 2.6 -0.1 3.4
non-processed 0.3 0.0 3.6 -0.3 3.6
processed 1.3 0.0 2.0 0.0 3.3
Traded goods 0.6 0.0 0.4 0.0 1.0
durables -0.4 0.0 0.2 0.0 -0.2
non-durables 1.0 0.0 0.5 0.0 1.5
Market services 0.5 0.0 2.6 -0.6 2.5
Market energy 6.8 0.0 1.2 0.0 8.0
Alcohol and Tobacco 0.9 1.9 1.8 0.0 4.6
Fuel 1.5 -0.5 3.1 0.0 4.1
Administered prices -0.3 0.0 1.2 0.0 0.9
Inflation 0.7 0.2 1.8 -0.2 2.5
Core inflation 0.7 0.3 1.6 -0.2 2.4
Note: The tables show the decomposition of the yearly average change of the consumer price index. The yearly change is the sum of so-
called carry-over and incoming effects. The carry-over effect is the part of the yearly index, which can be explained by the preceding
year's price changes, while the incoming effect reflects the changes in the recent year. We decomposed these indices to the sub-
aggregates of the consumer price index and calculated their inflationary effects. The subgroups may not sum to the aggregate figure due
to rounding.
Source: MNB

LIST OF CHARTS AND TABLES
INFLATION REPORT • MARCH 2018 67
List of charts and tables List of charts
Chart 1-1: Fan chart of the inflation forecast ......................................................................................................................... 11
Chart 1-2: Monthly evolution of the near-term inflation forecast ......................................................................................... 11
Chart 1-3: Decomposition of the inflation forecast ................................................................................................................ 12
Chart 1-4: Fan chart of the GDP forecast ............................................................................................................................... 13
Chart 1-5: Contributions to annual changes in GDP ............................................................................................................... 13
Chart 1-6: Evolution of investment rate by sectors ................................................................................................................ 14
Chart 1-7: Actual utilisation of EU funds ................................................................................................................................ 14
Chart 1-8: Annual changes in lending to non-financial corporations and SMEs..................................................................... 14
Chart 1-9: Annual change in the level and components of personal disposable income....................................................... 15
Chart 1-10: Evolution of households' consumption, investment and financial savings rates as a percentage of disposable
income .................................................................................................................................................................................... 15
Chart 1-11: Changes in export market share .......................................................................................................................... 16
Chart 1-12: Annual change in labour productivity ................................................................................................................. 16
Chart 1-13: Employment, participation and unemployment rate in the whole economy ..................................................... 17
Chart 1-14: Impact of substantial increases of minimum wage and guaranteed wage minimum on private sector wage
growth .................................................................................................................................................................................... 17
Chart 1-15: Decomposition of real unit labour cost growth in the private sector ................................................................. 18
Chart 1-16: Annual changes in gross average wages and labour cost in the private sector .................................................. 18
Chart 1-17: Fiscal demand effect and actual utilisation of EU funds ...................................................................................... 20
Chart 2-1: Impact of alternative scenarios on the inflation forecast ..................................................................................... 23
Chart 2-2: Impact of alternative scenarios on the GDP forecast ............................................................................................ 23
Chart 2-3: Risk map: effect of alternative scenarios on the baseline forecast ....................................................................... 24
Chart 3-1: Annual changes in GDP in certain key global economies ...................................................................................... 25
Chart 3-2: Annual changes in GDP in some emerging economies .......................................................................................... 25
Chart 3-3: Global inflation developments .............................................................................................................................. 26
Chart 3-4: Inflation targets of central banks and actual inflation .......................................................................................... 26
Chart 3-5: Central bank balance sheet totals in developed countries ................................................................................... 27
Chart 3-6: Market-implied policy rate changes of the developed market central banks ....................................................... 27
Chart 3-7: Major commodity price indices ............................................................................................................................. 27
Chart 3-8: Annual changes in euro-area GDP ......................................................................................................................... 28
Chart 3-9: Unemployment rate of the eurozone .................................................................................................................... 28
Chart 3-10: Business climate indices for Germany and the euro area ................................................................................... 29
Chart 3-11: Evolution of the output gap in the euro area ...................................................................................................... 29
Chart 3-12: Annual changes in GDP in CEE countries ............................................................................................................. 29
Chart 3-13: Inflation targets of central banks, inflation, and economic agents' expectations ............................................... 30
Chart 3-14: Changes in the euro’s nominal effective exchange rate...................................................................................... 31
Chart 3-15: Decomposition of the changes in the EUR/USD exchange rate into EUR and USD-specific components .......... 32
Chart 3-16: Contribution to annual changes in GDP .............................................................................................................. 33
Chart 3-17: Development of consumption components, annual changes ............................................................................. 33
Chart 3-18: Net financial savings of households .................................................................................................................... 34
Chart 3-19: Decomposition of the growth in tourism nights at accommodation establishments ......................................... 34
Chart 3-20: Developments in retail sales, income and the consumer confidence index ....................................................... 34
Chart 3-21: Annual change of investments ............................................................................................................................ 35
Chart 3-22: Annual changes in lending to non-financial corporates and SMEs ...................................................................... 35
Chart 3-23: Evolution of housing starts and building permits ................................................................................................ 35

MAGYAR NEMZETI BANK
68 INFLATION REPORT • MARCH 2018
Chart 3-24: Annual change of house prices ............................................................................................................................ 36
Chart 3-25: Evolution of the trade balance ............................................................................................................................ 36
Chart 3-26: Participation, employment and unemployment in the whole economy ............................................................ 37
Chart 3-27: Development of vacancies in certain sectors of the private sector .................................................................... 37
Chart 3-28: Development of the Beveridge-curve ................................................................................................................. 38
Chart 3-29: Uncertainty band of the output gap .................................................................................................................... 38
Chart 3-30: Annual change in gross average wages in the private sector .............................................................................. 39
Chart 3-31: Decomposition of the annual change in nominal unit labour cost in the private sector .................................... 39
Chart 3-32: Inflation and underlying inflation indicators ....................................................................................................... 40
Chart 3-33: Services inflation.................................................................................................................................................. 40
Chart 3-34: Inflation of market services ................................................................................................................................. 40
Chart 3-35: Inflation expectations in the region .................................................................................................................... 41
Chart 3-36: Decomposition of the inflation of industrial goods ............................................................................................. 42
Chart 3-37: Inflation composition of market services in the beginning of 2018 .................................................................... 42
Chart 4-1: Components of 5-year Hungarian CDS spread ...................................................................................................... 43
Chart 4-2: Exchange rates in the region ................................................................................................................................. 43
Chart 4-3: HUF-denominated government securities held by non-residents ........................................................................ 44
Chart 4-4: Yields of benchmark government securities ......................................................................................................... 44
Chart 4-5: 10-year government benchmark yields in CEE countries ...................................................................................... 44
Chart 4-6: Development of 10-year government benchmark yields ...................................................................................... 45
Chart 4-7: Development of the 10-year forint/euro interest rate swap and government benchmark yield spreads ............ 46
Chart 4-8: Smoothed interest rates and spreads on corporate loans by denomination ........................................................ 47
Chart 4-9: Changes in credit conditions in the corporate and household sectors ................................................................. 47
Chart 4-10: Smoothed annual percentage rate of charge (APRC) and spreads of housing and consumer loans .................. 48
Chart 4-11: Forward-looking real interest rates ..................................................................................................................... 48
Chart 5-1: Changes in net lending and its components .......................................................................................................... 49
Chart 5-2: Structure of net lending ......................................................................................................................................... 49
Chart 5-3: Decomposition of net lending by sectors .............................................................................................................. 50
Chart 5-4: Development of net external debt by sectors ....................................................................................................... 50
Chart 5-5: Evolution of net lending ........................................................................................................................................ 51
Chart 5-6: Changes in the savings of sectors .......................................................................................................................... 52
Chart 5-7: Changes in the fiscal balance and interest expenditures ...................................................................................... 53
Chart 5-8: The fiscal demand effect ....................................................................................................................................... 54
Chart 5-9: Gross public debt forecast – calculated with unchanged (end-of-2017) exchange rate over the forecast horizon
................................................................................................................................................................................................ 55
Chart 6-1: Standard deviations of unemployment rates and inflation rates in the EU .......................................................... 57
Chart 6-2: Most important inflationary channels of the Internet and digitalisation .............................................................. 58
Chart 6-3: Sales and share of mail order shops (left panel) and e-commerce in 2017 (right panel) in Hungary ................... 58
Chart 6-4: Evolution of online and offline prices in the USA (left panel) and in the euro area (right panel) ......................... 59
Chart 6-5: Distribution of the monthly changes of the core inflation excluding indirect tax effects (2000–2017) ................ 60
Chart 6-6: Development of oil price assumptions .................................................................................................................. 61
Chart 6-7: 2017 inflation forecasts by the MNB and the market ........................................................................................... 62
Chart 6-8: 2017 growth forecasts by the MNB and the market ............................................................................................. 62
Chart 6-9: MNB projections for the private sector’s headcount index in 2017...................................................................... 64
Chart 6-10: MNB projections for the private sector’s wage index in 2017 ............................................................................ 65

LIST OF CHARTS AND TABLES
INFLATION REPORT • MARCH 2018 69
List of tables
Table 1-1: Details of the inflation forecast ............................................................................................................................. 12
Table 1-2: Main external assumptions of our forecast ........................................................................................................... 19
Table 1-3: Changes in projections compared to the previous Inflation Report ..................................................................... 21
Table 1-4: MNB baseline forecast compared to other forecasts ............................................................................................ 22
Table 3-1: Pass-through rates of the VAT cuts ....................................................................................................................... 41
Table 5-1: General government balance indicators ............................................................................................................... 53
Table 5-2: Decomposition of the change in the 2018 ESA balance forecast (compared to the previous Inflation Report) ... 54
Table 5-3: Differences between our forecast and the appropriations set out in the 2018 Budget Act ................................. 55
Table 6-1: Standard deviations of the monthly prices changes of those product groups, which are mainly affected by
digitalisation ........................................................................................................................................................................... 60
Table 7-1: Decomposition of inflation to carry-over and incoming effects (percentage points and percent respectively)... 66
Table 7-2: Detailed decomposition of our inflation forecast into carry-over and incoming effects (percentage points and
percent respectively) .............................................................................................................................................................. 66

Mátyás Hunyadi(23 February 1443 – 6 April 1490)
He ruled from 1458 to 1490 as King of Hungary, and had been Czech king from 1469 and Prince of Austria from 1486. Hungarian tradition regards him as one of the greatest Hungarian kings whose memory is preserved in many folk tales and legends. He is also known as Matthias Corvinus, King Matthias the Just or officially as Matthias I, but commonly he is simply denoted as King Matthias.
His father, János Hunyadi, the regent of Hungary, was one of the most outstanding military leaders and strategists in the country’s medieval history who triumphed at the Battle of Nándorfehérvár in 1456. Matthias’ mother was Erzsébet Szilágyi, and he had an elder brother, László Hunyadi. The future king was brought up by his mother and nurse until the age of six, and was subsequently placed under the supervision of his tutors. János Hunyadi did not have a chivalrous education in mind for his son: first, it was a Polish humanist, Gergely Szánoki who introduced him to the realm of knowledge, then this task was assigned to János Vitéz. Mátyás was brought up and educated in a humanistic spirit to become a versatile and curious-minded person who had been taught canon and constitutional law, arts and Latin. In addition to Hungarian, he also spoke German and Czech.
After the death of László V, his uncle, Mihály Szilágyi, and the armed forces supporting Hunyadi exercised pressure to have Matthias crowned as King of Hungary on 24 January 1458. Even in the early years of his reign Matthias had troubles both with the magnates of the country and Emperor Frederick III of the Holy Roman Empire. As the king was still a minor, parliament appointed Mihály Szilágyi to act as regent on his behalf. However, Matthias did not tolerate any guardianship and pushed his uncle to the background who devised a plot against the king in response. Returning from battle with the Turks, the king had the rebels captured and he imprisoned his uncle in the castle of Világos.
Upon his ascension to the throne the annual income of the treasury hardly exceeded 110 to 120 thousand forints. During his rule spanning thirty-two years the king managed to multiple revenues from taxes. Considering the average of the taxes levied, less the revenues from the Czech and Austrian provinces, this yearly amount approximated 628,000 forints and may as well reached 900,000 gold forints in the most prosperous years. This was still much less than the annual revenue of the western powers of the age. In order to raise the low income of the treasury, reform-like and comprehensive financial actions were needed. Matthias recognised that a centralised, nationwide financial system was the only solution to the problem, and that the royal revenues had to be directed to a single person, the treasurer. The reforms of Matthias were adopted by parliament and his decrees were promulgated on 25 March 1467.
We can get a glimpse of the cultural life in the royal court, which represented the elite of European civilisation at the time, at the partly reconstructed Royal Palace in Visegrád. The most distinguished pieces of the cultural legacy of Matthias are the Corvinian books, richly illustrated volumes of the former royal library.

INFLATION REPORT
March 2018
Print: Pauker–Prospektus–SPL consortium
H-8200 Veszprém, Tartu u. 6.

mnb.hu©MAGYAR NEMZETI BANK
H-1054 BUDAPEST, SZABADSÁG SQUARE 9.