inflation and growth in the 1980s - st. louis fed · chapter 1 inflation and growth in the 1980s...
TRANSCRIPT

CHAPTER 1
Inflation and Growth in the 1980s
IN THE 1980s THE UNITED STATES will confront a variety ofstubborn problems that have developed during the past 15 years.Chief among these problems is one that is shared by most other in-dustrial countries—the persistence of large wage and price increases,even in the face of high unemployment and slack production. Thisproblem poses the single most important challenge to U.S. economicpolicy—reducing inflation while maintaining a reasonably prosperousand growing economy.
Many other problems are themselves closely related to inflation,either as cause or as consequence. Our Nation's productivity growthhas virtually halted in recent years. The era of cheap energy hasended, the world has grown vulnerable to supply disruptions, and thecourse of domestic inflation and unemployment has become closelydependent on economic and political developments in the oil-richbut politically unstable Middle East. Meanwhile, the struggle to find aproper balance between a clean, healthy, and safe environment, onthe one hand, and satisfactory economic growth with lower inflation,on the other, will continue. All of these developments, together withthe growing interdependence of the world economy, have set inmotion major changes in economic structure, occupational skill re-quirements, and industrial location that will continue to pose sizableadjustment problems to many industries, communities, and workers.
While the magnitude of these economic challenges is cause for se-rious concern, it does not warrant pessimism. During the 1970s theU.S. economy performed quite well in many important respects. Overthat decade our country outperformed most other major countries inproviding jobs for its people (Table 1). Employment grew almost 25percent as the American economy created jobs not only for millionsof youths entering the labor market for the first time but also for mil-lions of women, who found job opportunities in growing numbers.This performance continued through the last years of the decade atan increased pace. While the growth in the number of employed per-sons was temporarily interrupted by the recession of 1980, the basicperformance was virtually unparalleled.
293 3 3 - 5 4 0 0 - 81 - 3 :QL 3
Digitized for FRASER http://fraser.stlouisfed.org/ Federal Reserve Bank of St. Louis

TABLE 1.—Changes in employment in major industrial countries, 1970-80
[Percent change]
CountryTo 1980 first quarter from
GermanyFranceUnited Kingdom.JapanUnited States
Note.—Data are for civilian employment.
Sources: Department of Labor (Bureau of Labor Statistics) and Organization for Economic Cooperation and Development.
Some of the rapid job creation was associated with the low rate ofproductivity growth, but production also increased rapidly. As shownin Table 2, the growth of industrial production in the United States,both during the decade as a whole and in the last years of thedecade, compared favorably with that of other large industrial coun-tries.
TABLE 2.—Changes in industrial production in major industrial countries, 1970-80
[Percent change]
CountryTo 1980 first quarter from
Germany.FranceUnited Kingdom.Japan....United States.
Sources: Board of Governors of the Federal Reserve System and Organization for Economic Cooperation and Development.
Whatever the problems of the American economy, they do notarise from an inability to generate large increases in jobs and produc-tion. But if the challenges raised by chronic high inflation, energyand environmental problems, ebbing productivity growth, and struc-tural readjustment are not faced, the potential for further growth willnot be realized.
In recent years the United States has successfully begun to tacklesome of its most difficult problems. After years of inaction followedby several years of vigorous debate, and with some painful sacrifices,we have put into place the major elements of an energy programwhich is already paying dividends in the form of greater energy con-servation and improved supply prospects. After decades in which thedocumented evidence about the greater productivity and efficiency tobe gained from economic deregulation had been ignored, this Nationfinally acted during the past 4 years to deregulate its airline, trucking,and railroad industries, and major elements of its financial industry.And during the 1980 recession the executive branch and the Con-gress showed their willingness to maintain the restraint and discipline
30Digitized for FRASER http://fraser.stlouisfed.org/ Federal Reserve Bank of St. Louis

needed to control inflation by resisting strong pressures for a hastyand potentially inflationary fiscal stimulus.
As this Report will have several occasions to point out, there are nosimple and clear-cut answers to the complex economic problems con-fronting our country. Many of them will yield only gradually to per-sistent efforts pursued on many fronts. In some cases where ourknowledge is particularly uncertain, we may have to try several ap-proaches before finding an effective solution. Nevertheless, the will-ingness to tackle difficult problems which this country has shown inthe last several years provides a reason to temper concern about theseriousness of our economic problems with a belief that they can bemet successfully.
The first two chapters of this Report examine the major economicchallenges identified above and discuss appropriate policies to dealwith them. In most instances the Administration has already madespecific policy recommendations, and these are reflected here. But insome cases the chapters identify and evaluate additional policy op-tions on which decisions would have been made had this Administra-tion continued in office. The third chapter of this Report examines theNation's general economic performance in 1980 and the outlook for1981 and 1982, while the fourth chapter turns to issues pertaining tothe international economy.
Chapter 1 addresses the broad problem of reducing inflation whileachieving satisfactory growth in employment, output, and productiv-ity. It considers selected aspects of both demand-side and supply-sidemeasures. After discussing the history and causes of inflation, thechapter outlines the role and the limitations of demand managementpolicies, examines the special problems of setting and carrying outanti-inflationary monetary policies in a world of high inflation andfrequent economic disturbances, and evaluates the potential useful-ness of a tax-based incomes policy as a method for reducing infla-tion. The remainder of the chapter is devoted to supply-side policiesand pays particular attention to two subjects: first, the importance ofincreasing the share of the Nation's output devoted to capital forma-tion and the macroeconomic policies necessary to achieve that goal;and second, the integration of supply-oriented tax reductions withoverall policies of demand restraint.
Chapter 2 deals with major problems in particular sectors or mar-kets. Specifically, it covers six major topics: energy, regulation, bank-ing, agriculture, the labor market, and the generic problems of struc-tural adjustment among industries confronting economic change.Broadly speaking, the policy measures discussed in Chapter 2 areaimed at increasing supply and productivity by improving the effi-ciency with which particular markets work and adjust to change. Like
31Digitized for FRASER http://fraser.stlouisfed.org/ Federal Reserve Bank of St. Louis

the macroeconomic policies examined in Chapter 1, these too are ameans of reducing inflation and speeding economic growth.
INFLATION
The Nation has for some time now experienced inflation thatwould have been unimaginable in earlier days. Although people'slives and the course of business may not, at first glance, appear radi-cally different from what they were in 1960 before the recent infla-tion began, inflation has taken a very real toll. The uncertainty it hasbrought with it cannot be measured, but the consequent anxiety hastorn at the fabric of our society. People feel less able to mark theirprogress and fear that the next round of inflation will leave thempoorer. In a number of ways—such as introducing cost-of-living ad-justments into wage contracts and indexing the benefits of social wel-fare programs—institutions have evolved to compensate for some ofthe uncertainty. But these institutions may sometimes only heightenthe arbitrary redistribution of income brought on by inflation—redis-tribution that society often finds undesirable and unfair. In additionto these painful effects, moreover, inflation reduces the Nation'sprospects for growth. The reduction may not appear dramatic, but itimpairs the efficiency of the free-enterprise system and discouragescapital investment, innovation, and risk-taking.
Rising prices, it should be remembered, are not in the aggregatesynonymous with a reduction in real income. When prices rise, some-one receives the additional revenues. And for the economy as awhole, rising prices have gone together with rising money incomes.But a wage or salary increase comes infrequently and in a large lump,while prices tend to increase all the time. Furthermore, a pay in-crease may be viewed as uncertain and as a reward for effort, butprice increases seem entirely beyond a consumer's control. As aresult, a recent wage increase may be forgotten when the grocery billrises. Thus rising prices are often treated as something that directlylower real incomes, even when in fact for the Nation as a whole theydo not. Of course, the resulting anxiety is no less real.
But when the country pays sharply higher prices to foreign oil pro-ducers, that does indeed lower its real income. We are poorer be-cause we receive less oil than we did previously for the same amountof money. That would be true whether or not general inflation fol-lowed increases in the price of oil. The induced inflation, in the formof generally higher wages, salaries, and prices, is not the cause of thereal income decline—the Nation's higher oil bill is.
A similar phenomenon occurs when growth in productivity slows.Slower productivity growth leads to a slower rise in real incomes. A
32Digitized for FRASER http://fraser.stlouisfed.org/ Federal Reserve Bank of St. Louis

decline in productivity growth may be accompanied by an unchangedpace of wage and salary increases, in which case inflation will rise.But a slackening of productivity growth may also result in lower wageincreases and an unchanged inflation rate. In either case the sameslowdown in the growth of real income would have occurred. It wasnot caused by inflation.
Although some of the simpler notions that associate inflation withreal income loss are wrong, high and rising rates of inflation doindeed weaken the Nation's macroeconomic performance. Inflationcan contribute to slower growth in productivity by discouraging in-vestment in two ways. First, some evidence suggests that when infla-tion increases, not only do people's expectations of future inflationrise, but their expectations tend to become much more uncertain. Inthis climate, expectations depend less on fact and more on opinion,rumor, and subjective perceptions. Innovative investments and otherhigher-risk economic activities, the seedbeds of future productivitygrowth, seem even riskier and are less likely to be undertaken. Mean-while, businesses and households devote increasing effort to shield-ing themselves from the effects of inflation, often by speculating innonproductive assets. Second, as discussed later in this chapter, theinteraction between inflation and the tax system can indirectly dis-courage business investment and also affect the types of assetschosen, thereby distorting investment decisions and resulting in aless productive capital stock.
In a market economy the structure of relative prices and costs, andthe yardstick of business profits, provide signals to businesses aboutwhat to produce, what inputs to buy, and when to buy them. Thesystem responds to changes in those signals—changes in the price ofaluminum relative to copper, of glass relative to tin, and in wages rel-ative to prices. But in a period of high inflation, with a consequentincrease in uncertainty, it is much more difficult to distinguish signalsfrom random events. It is hard to know to what extent particularwage and price increases simply represent general inflation or areconveying a "real" message. As a consequence, it is easier to makewrong decisions. Inefficiencies grow, and productivity falls.
The uncertainty created by inflation also obstructs the conduct ofeconomic policy. To the extent that high and rising inflation un-hinges expectations from reality, the connection between economicpolicies and their results is attenuated, and the difficulties of policy-making are increased. Inflation itself is then more difficult to control.There is a temptation for macroeconomic policy to make announce-ments and take measures to impress the markets, but the intangiblegains so purchased tend to evaporate rapidly.
Digitized for FRASER http://fraser.stlouisfed.org/ Federal Reserve Bank of St. Louis

Uncertainty is in large part to blame for the damage done by infla-tion. In addition to causing serious worry among individuals planningtheir economic futures, uncertainty interferes with the efficient oper-ation of markets and thereby lowers the productive potential of theeconomy. Although measures to cure inflation may themselves bepainful, over the longer term a reduction in inflation will yield re-wards in terms of increased productivity growth and real income.
UNDERSTANDING INFLATION
To understand our persistent inflation, it is necessary to lookbeyond the commonly cited price statistics. Such statistics as the con-sumer price index (CPI), the various producer price indexes, and thenational income account deflators are specialized measures of infla-tion, each with its own idiosyncrasies. They may be sharply influ-enced by fluctuations in food and energy prices or in mortgage inter-est rates and therefore sometimes exaggerate and sometimes under-state the fundamental trend of inflation. As an example, in July 1980the consumer price index showed inflation at zero while the producerprice index (PPI) for finished goods showed inflation at an annualrate of almost 20 percent. It is therefore useful to construct measureswhich better reveal the true course of inflation.
Charts 1 and 2 present two different statistical series which togeth-er approximate the basic trend, or "underlying rate," of inflation.The underlying rate is the rate of inflation which today's economywould tend to perpetuate if supply and demand remained roughly inbalance and no special factors came into play, such as a large rise inoil or food prices.
Since payments to labor are estimated to account for almost two-thirds of total production costs, prices over the longer term tend tomove in conjunction with changes in unit labor costs. Chart 1 showsa special measure of that change—the rate at which wages and fringebenefits are increasing minus the trend of growth in productivity.Chart 2 is a version of the price index for personal consumption ex-penditures calculated by the Department of Commerce. It excludesthe volatile components of food and energy. Each series tells basical-ly the same story.
34Digitized for FRASER http://fraser.stlouisfed.org/ Federal Reserve Bank of St. Louis

Chart 1
Standard Unit Labor Costs
PERCENT CHANGE FROM 4 QUARTERS EARLIER^
-2 1...1...1...I...I...I...I...I...I...I...I...I...I..I1...I...I...I...1...I...1...I...1 9 6 0 6 2 6 4 6 6 6 8 7 0 7 2 7 4 7 6 7 8 8 0
^PERCENT CHANGE IN RATIO OF COMPENSATION PER HOUR TO CYCLICALLY ADJUSTEDPRODUCTIVITY, PRIVATE NONFARM BUSINESS, ALL PERSONS, UNREVISED.
SOURCES: DEPARTMENT OF LABOR AND COUNCIL OF ECONOMIC ADVISERS.
Chart 2
Price Index for Personal ConsumptionExpenditures Excluding Food and Energy
PERCENT CHANGE FROM 4 QUARTERS EARLIER-!/
1 0
. . . I , . . I . . , ! , . . I , , . I . . . I . . . I . . , ! , . . I . , , I . . . I . , . I . . . I . . . I . . . ! . , , I . . . h u h . . I n . I66 68 70 72 741960 62 78 80
J/PERCENT CHANGE IN FIXED-WEIGHT PRICE INDEX. DATA ARE PRELIMINARY AND SUBJECT
TO REVISION.
SOURCE: DEPARTMENT OF COMMERCE.
35Digitized for FRASER http://fraser.stlouisfed.org/ Federal Reserve Bank of St. Louis

Over the past 15 years the underlying rate of inflation has risenfrom about 1 percent in the first half of the 1960s to 9 or 10 percentnow. The increase has not been steady. Instead, there have beenthree major episodes. Each period began with a sharp increase in theunderlying rate and ended with the rate falling only part way to itsoriginal level. Thus, each new inflationary period has started from ahigher underlying level than its predecessor.
The first jump in the underlying inflation rate came during theVietnam war, when a large rise in both military expenditures andoutlays for Great Society programs was financed for several yearswithout a tax increase. This led to a very large Federal budget deficitsuperimposed on an economy already operating at a high level. Theresult was a classic example of an excess of demand over supply. Theunderlying inflation rate rose from about 1 percent in the 1961-65period to 4 or 5 percent by 1969. By the end of the decade theforces pushing up the inflation rate receded as taxes were belatedlyraised and Vietnam war outlays declined. Although the economy en-tered a recession in 1970, the underlying rate of inflation continuedat about 4 to 5 percent until wage and price controls were intro-duced in August 1971. For a short period the controls held down in-flation in prices but did not reduce the growth in costs.
Another inflationary episode began in late 1973 as the result oftwo major developments. A poor crop year worldwide caused a sharpsurge in food prices, and the Arab oil embargo at the end of 1973was followed by a threefold increase in world oil prices. Although thefull impact of the increase in world oil prices was muted in theUnited States by price controls on domestically produced oil, energyprices and the prices of energy-using products increased sharply. Ag-gregate demand grew sharply in 1972 and early in 1973. A world-wide boom led to a major inventory buildup and a widely based ac-celeration of raw materials prices in 1973-74. Finally, the distortionsand inequities brought on by wage and price controls created irresist-ible pressures for easing the controls in 1973 and eliminating themin 1974. When this occurred, there was a burst of price and wageincreases.
When this burst receded, the U.S. economy entered its worst reces-sion in 40 years. While the underlying rate of inflation fell back fromits late 1974 peak, it did not fall to its starting point. Aside from brieffluctuations, it settled down in the 6 to 7 percent range from 1976through 1978.
The most recent inflationary episode was triggered when the Orga-nization of Petroleum Exporting Countries (OPEC) raised oil pricesin 1979 and early 1980. Relative to the size of the U.S. economy, therecent price increase was larger than the 1973-74 increase. By the
36Digitized for FRASER http://fraser.stlouisfed.org/ Federal Reserve Bank of St. Louis

end of 1974 the world price of oil had tripled from about $4 toabout $12 per barrel, thereby adding about $18 billion to our bill forimported oil, or roughly 1.4 percent of gross national product(GNP). Since the price of domestically produced petroleum (which atthat time accounted for about two-thirds of the petroleum used inthe United States) was restrained by controls, the average U.S. priceremained lower than prices throughout the rest of the world. Still,domestic oil prices almost doubled, so that the total increase in con-sumer costs was almost 3 percent of GNP.
During the most recent shock the price of imported oil rose fromabout $15 per barrel at the end of 1978 to $35 at the close of 1980.This added about $50 billion to the cost of the oil we now importinto the United States, or about 2 percent of GNP. Since domesticcrude oil prices were in the process of being decontrolled during thisperiod, the price of domestic oil increased by about $15 per barrel,adding another $60 billion to the oil costs paid by consumers.
The forces of inflation during this period were also strengthenedto some extent by the behavior of aggregate demand. There wassome acceleration of wages in 1978 as unemployment fell sharply.And for a time in late 1978 and early 1979, there appeared to be someexcess demand in product markets.
Spurred by these developments, inflation surged in 1979 and early1980. As measured by the CPI—which was also heavily influenced bysharp increases in mortgage interest rates—inflation reached annualrates of 15 to 20 percent in the first quarter of 1980. By the spring of1980 the forces that had given rise to this inflationary episode sub-sided, and the economy entered a brief recession. The measured in-flation rate receded from its peak, but the underlying rate appears tohave leveled off in the 9 to 10 percent range, up several notchesfrom the 6 to 7 percent level at which the period had started.THE SOURCES OF INFLATION
The chief problem with respect to inflation is not the sporadic de-velopments that generate inflationary impulses. Instead, it is theratchet-like nature of the inflationary process which makes it resistantto downward pressures. Chart 3, which shows year-to-year changes inthe consumer price index since 1913, captures the essence of the in-flation problem of the past two decades. The size of the inflationarybursts of recent years has not been out of line with those which oc-curred earlier in the century, but recent inflation has had an upwardbias and has fluctuated around a rising trend line. An understandingof the "causes" of inflation must therefore encompass not only thevarious factors that give rise to particular inflationary episodes butalso the reasons why inflation has developed a ratchet-like character.
37Digitized for FRASER http://fraser.stlouisfed.org/ Federal Reserve Bank of St. Louis

Chart 3
Changes in Consumer Prices Since 1913
PERCENT CHANGE
25
1 1 i i 1 1 1 1 1 I i i 1 1 I i i 1 1 1 1 1 1 i 1 1 i 1 1 I i i 1 1 1 1 1 1 i E i 1 1 i 1 1 1 i i 1 1 i 1 1 1 1 1 1 i I i 1 1 i I i i i 1 1
-5 -
-10 "
-151910 1920 1930 1940 1950 1960 1970 1980
NOTE: PERCENT CHANGE FOR 1980 IS FROM DECEMBER 1979 TO NOVEMBER 1980 ATASEASONALLY ADJUSTED ANNUAL RATE.
SOURCE: DEPARTMENT OF LABOR.
The Role of Aggregate Demand in Creating Inflation
The inflation rate which occurs in any given year is a composite ofthe individual wage and price decisions made by millions of busi-nesses, unions, and workers. Those decisions are influenced by thestrength of demand relative to supply. As demand (or spending)—onthe part of consumers, business, and government—declines relativeto supply, there is pressure on workers to moderate their wage de-mands lest employment fall, and on producers to restrain prices forfear of losing sales. The converse also holds true: the smaller thenumber of unemployed people and the lower the amount of unusedindustrial capacity, the greater the upward pressure on wages andprices. Some evidence also suggests that a rapid rise in demand cangenerate upward pressure on both wages and prices, even if the levelof demand is not excessive. In general, if demand is in rough balancewith supply, the underlying rate of inflation for the economy as awhole will remain basically unchanged, even though prices and wagesin individual sectors may fluctuate in response to conditions in par-ticular markets. If excess demand exists, or if the rate of increase indemand is very large, the underlying rate of inflation will tend torise. If aggregate demand falls below supply, some downward pres-sure will be exerted on inflation.
Expectations about the future state of aggregate demand are alsoan important determinant of inflation. Wage decisions and many
38Digitized for FRASER http://fraser.stlouisfed.org/ Federal Reserve Bank of St. Louis

price decisions cannot easily be reversed. Wages are often set for atleast a year, and under most major union contracts they are set for 3years. There are also many advantages to both buyers and sellers inavoiding frequent product price changes. As a consequence, decision-makers have to think not only about market conditions at present butalso about what they are likely to be in the future. Thus, both currentand expected,aggregate demand influence the rate of inflation. More-over, a firm's decisions today about what wages to offer or whatprices to set for any future period will be conditioned by its expecta-tions about the wages its competitors will pay and the prices its com-petitors will charge, and by the incomes that will be earned by itscustomers. In short, today's inflation rate is strongly influenced bywhat people expect it to be tomorrow.
It was excess aggregate demand during the Vietnam war that droveup the underlying rate of inflation from 1 percent to 4 or 5 percentby the end of the 1960s. Although increases in oil and food priceswere the principal causes of the next two inflationary surges, pres-sures from aggregate demand again played an identifiable role. Themost troublesome feature of the inflation of the past 15 years, how-ever, has been the fact that after each of the three inflationary epi-sodes the underlying rate of inflation did not fall back to its earlierlevel. To what extent was this outcome a demand-related phenom-enon?
TABLE 3.—Selected indicators of declining demand pressures
[Percent, except as noted]
Item
1969 peak ys 1970recession
1968 1to
1969 IV
1970 1to
1971 IV
1973 peak ys 1975recession
1973 Ito
1974 (I
1974 HIto
1976 IV
1980 peak ys 1980recession
1979 \to
1980 I
1980 IIto
1980 IV *
Average level:
Manufacturing weekly overtime (hours)
Unemployment rate: Total
Males 20 years and over
Vendors reporting slower delivery
Manufacturing capacity utilization:Primary processing industriesAdvanced processing industries
Change during period:3
Producer prices for crude materials excluding food andfue l 4 . . . . . *
Unemployment rate (percentage points)..
3.6
3.52.1
59
88.185.9
4.3
— .3
2.9
5.53.9
49
82.676.9
1.6
2.4
3.7
4.93.3
86
91.984.2
37.0
- . 2
2.9
7.75.9
43
79.376.3
2.7
2.6
3.3
5.94.2
60
87.583.9
26.1
.3
2.7
7.56.4
2 38
2 76.12 78.3
11.8
1.3
1 Preliminary.2 fourth quarter 1980 not available; November used as fourth quarter average.3 Change from quarter preceding start of period shown.4 Annual rates. Data prior to 1973 from series seasonally adjusted by Council of Economic Advisers.
Note.—Based on seasonally adjusted data, except vendor performance.
Sources: Department of Labor (Bureau of Labor Statistics), Board of Governors of the Federal Reserve System, PurchasingManagement Association of Chicago, and Council of Economic Advisers.
39Digitized for FRASER http://fraser.stlouisfed.org/ Federal Reserve Bank of St. Louis

At the end of each inflationary episode the economy entered a re-cession—in 1970-71, in 1974-75, and in 1980. Unemployment rosesteeply, and substantial amounts of idle capacity appeared (Table 3).The failure of inflation to fall back to earlier levels is therefore notattributable to excess demand. On the other hand, there clearlywould have been some level of demand low enough to have causedbusiness and labor to moderate the increase in wages and prices sub-stantially so as to return to the earlier level of inflation. But for rea-sons discussed later, the rate of wage and price increase has becomerelatively insensitive to a moderate degree of economic slack. As aconsequence, the cost of the necessary restraint—in terms of addi-tional unemployment, idle capacity, and lost income, production, andinvestment—would have been extremely high.
Federal Budget Deficits as a Cause of Inflation
The Federal budget balance at any given time is an importantfactor in determining the level of current aggregate demand in theeconomy. If the Federal budget is in deficit, total spending—privateand public—will be higher than it would be if taxes had been raisedor spending had been cut to produce a balanced Federal budget. Anytax or spending measure that turned a budget deficit into a balancedbudget would tend to reduce demand relative to supply and putdownward pressure on the inflation rate. Furthermore, since busi-nesses make wage and price decisions at least partly in the light ofwhat they expect market conditions to be, announcements of futurebudget policies have a strong effect on current economic conditionsand on the rate of inflation. Thus budget deficits can contribute toinflation both by being a part of current aggregate demand and byContributing to expectations about future aggregate demand.
The existence of important relationships between Federal budgetpolicy and aggregate demand that in turn affect inflation does not,however, support the simple view that budget deficits cause inflationand that inflation could be eliminated if Federal deficits were elimi-nated. Federal deficits are not the sole—or even the primary—deter-minant of aggregate demand. The Federal deficit is likely to be larg-est when private demand is weak, incomes are low, and inflationarypressures from the private demand side are absent. That is the situa-tion in a recession. In the second column in Table 4, which showsthe Federal budget deficit as a percentage of GNP, the effects of re-cession in 1958, 1970-71, 1974-75, and 1980 show up as large in-creases in the deficit in the fiscal years during and immediately afterthe recession. Conversely, a truly inflationary budget may exhibit asmall deficit, or even a surplus, as a result of an inflation-caused in-crease in Federal revenues. In 1969, as inflation was surging, the
40Digitized for FRASER http://fraser.stlouisfed.org/ Federal Reserve Bank of St. Louis

Federal budget achieved a surplus. In 1974, when another inflation-ary surge occurred, the deficit was quite small.
TABLE 4.—Governmental surplus or deficit and gross national product, 1958-80
[Amounts in billions of dollars]
Year
19581959
I960....196119621963...1964...
1965...1966....1967....1968Z
1969«.
19701971....1972....1973....1974....
197519761977...1978..1979
1980 \
•••" •••••
Fiscal years—unifiedbudget
Federal surplus ordeficit ( - ) 1
Amount
- 2 . 9- 1 2 . 9
.3- 3 . 4- 7 . 1- 4 . 8- 5 . 9
- 1 . 6- 3 . 8- 8 . 7
-25 .23.2
- 2 . 8- 2 3 . 0-23 .4- 1 4 . 9- 6 . 1
- 5 3 . 2- 7 3 . 7-53 .6- 5 9 . 2- 4 0 . 2
- 7 3 . 8
As percentof GNP
- 0 . 7- 2 . 7
.1- . 7
- 1 . 3- . 8
- 1 . 0
- . 2- . 5
- 1 . 1- 3 . 0
.4
- . 3- 2 . 2- 2 . 1- 1 . 2
- . 4
- 3 . 6- 4 . 5- 2 . 9- 2 . 8- 1 . 7
- 2 . 9
Calendar years—government sector, national income andproduct accounts
Federal surplus ordeficit ( - )
Amount
- 1 0 . 3- 1 . 1
3.0- 3 . 9- 4 . 2
.3- 3 . 3
.5- 1 . 8
- 1 3 . 2- 6 . 0
8.4
-12 .4- 2 2 . 0- 1 6 . 8
- 5 . 6-11 .5
- 6 9 . 3- 5 3 . 1-46 .4- 2 9 . 2- 1 4 . 8
- 6 2 . 3
As percentof GNP
- 2 . 3-.2
.6- . 7-.7
.1- . 5
.1- . 2
- 1 . 7- . 7
.9
- 1 . 2- 2 . 0- 1 . 4- . 4- . 8
- 4 . 5-.3.1-2 .4- 1 . 4- . 6
- 2 . 4
Federal and State and localsurplus or deficit ( - )
Amount
-12 .6- 1 . 6
3.1- 4 . 3- 3 8
.7- 2 . 3
.5- 1 . 3
- 1 4 . 2- 6 . 0
9.9
-10.6"-19 .4
- 3 . 37.8
- 4 . 7
- 6 3 . 8-36 .5- 1 8 . 3
- . 2- 1 1 . 9
- 3 4 . 8
As percentof GNP
- 2 . 8-.3
.6- . 8-.7
.1- . 4
.1- . 2
- 1 . 8_ J1.0
- 1 . 1- 1 . 8- . 3
.6- . 3
- 4 . 1- 2 . 1- 1 . 0
.0
.5
- 1 . 3
' Includes off-budget outlays.2 A 10-percent income tax surcharge was introduced in July 1968—thus entering calendar year 1968 but fiscal year 1969.3 Preliminary.Sources: Department of Commerce (Bureau of Economic Analysis), Department of the Treasury, and Office of Management and
Budget.
If government budget deficits are the cause of inflation, it shouldmake no difference whether the deficit occurs at the Federal, State,or local level. For example, the Federal revenue-sharing program,which grants Federal tax revenues to State and local governments,has the effect of reducing State and local deficits (or increasing theirsurpluses) by increasing the Federal deficit. If the program wereeliminated, but both levels of government continued to tax the sameamount and maintain the same level of services, the Federal deficitwould be reduced—but the total deficit, and its inflationary conse-quences, would be unchanged. In fact, principally because the Stateand local governments accumulate funds to pay employee pensioncosts, their budgets usually show a surplus. As the figures in the finalcolumn in Table 4 show, the combined budgets of Federal, State,and local governments have either showed a surplus or a very smalldeficit during the past two decades, except during recessions and for2 years when Federal spending on the Vietnam war was at its peak.
41Digitized for FRASER http://fraser.stlouisfed.org/ Federal Reserve Bank of St. Louis
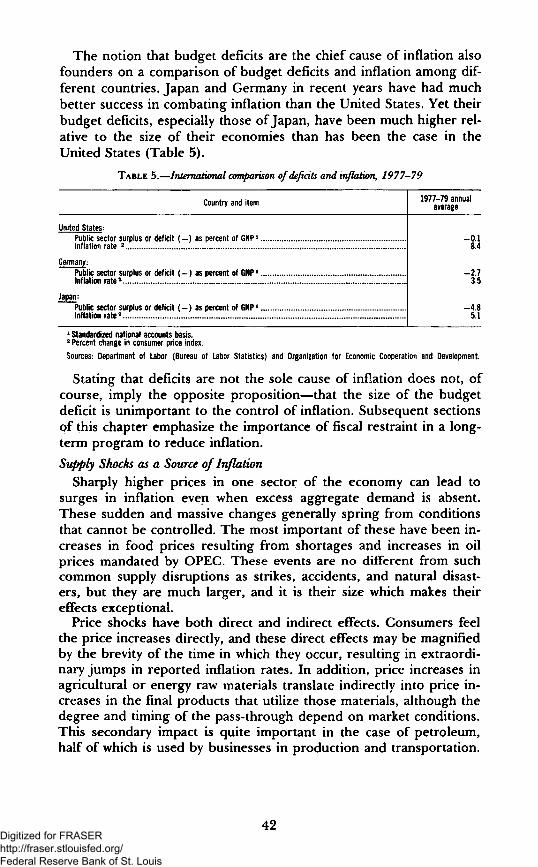
The notion that budget deficits are the chief cause of inflation alsofounders on a comparison of budget deficits and inflation among dif-ferent countries. Japan and Germany in recent years have had muchbetter success in combating inflation than the United States. Yet theirbudget deficits, especially those of Japan, have been much higher rel-ative to the size of their economies than has been the case in theUnited States (Table 5).
TABLE 5.—International comparison of deficits and inflation, 1977-79
Country and item
United States:Public sector surplus or deficit ( - ) as percent of GNP1.. .Inflation rate 2 .
Germany:Public sector surplus or deficit (—) as percent of GNP1
Inflation rate2
Japan:Public sector surplus or deficit (—) as percent of GNP1
Inflation rate2
avc9 annualrage
- 0 . 18.4
- 2 . 73.5
- 4 . 85.1
1 Standardized national accounts basis.a Percent change in consumer price index.
Sources: Department of Labor (Bureau of Labor Statistics) and Organization for Economic Cooperation and Development.
Stating that deficits are not the sole cause of inflation does not, ofcourse, imply the opposite proposition—that the size of the budgetdeficit is unimportant to the control of inflation. Subsequent sectionsof this chapter emphasize the importance of fiscal restraint in a long-term program to reduce inflation.
Supply Shocks as a Source of InflationSharply higher prices in one sector of the economy can lead to
surges in inflation even when excess aggregate demand is absent.These sudden and massive changes generally spring from conditionsthat cannot be controlled. The most important of these have been in-creases in food prices resulting from shortages and increases in oilprices mandated by OPEC. These events are no different from suchcommon supply disruptions as strikes, accidents, and natural disast-ers, but they are much larger, and it is their size which makes theireffects exceptional.
Price shocks have both direct and indirect effects. Consumers feelthe price increases directly, and these direct effects may be magnifiedby the brevity of the time in which they occur, resulting in extraordi-nary jumps in reported inflation rates. In addition, price increases inagricultural or energy raw materials translate indirectly into price in-creases in the final products that utilize those materials, although thedegree and timing of the pass-through depend on market conditions.This secondary impact is quite important in the case of petroleum,half of which is used by businesses in production and transportation.
42Digitized for FRASER http://fraser.stlouisfed.org/ Federal Reserve Bank of St. Louis

As an abrupt increase in the price of an important commoditytranslates into an increase in the cost of living, pressure builds forwage gains to match the new inflation. Some gains take place auto-matically where wages are linked to prices through cost-of-livingclauses in union contracts. Additional acceleration occurs as new con-tracts are negotiated. As businesses observe the rising wage-pricespiral, they are likely to expect a higher future level of inflation. Theyare then somewhat more likely to grant larger wage increases, bothin the belief that rising inflation will make it possible to pass throughincreases in higher prices and in order to avoid losing workers.Through this process, a sharp increase in food or oil prices can leadto a rise in the underlying inflation rate.
The magnitude of the inflationary process set in motion by an oil-price increase or some other supply shock depends on the state ofthe economy. The more prosperous the economy and the lower theunemployment level, the more likely it is that the initial increase inprices will lead to higher wage increases and a higher underlying in-flation rate.
In addition to their inflationary consequences, supply shocks alsocreate recessionary forces. The very large increases in oil prices in1974 and 1979 not only spurred inflation but simultaneously de-pressed aggregate demand. They were therefore largely responsiblefor the recessions of 1974-75 and 1980. After paying sharply higherprices for petroleum products, consumers had less to spend on othergoods and services. But those who received the revenues from higheroil prices—foreign and domestic oil producers—increased their de-mands for U.S. exports and investment goods only gradually. On bal-ance, therefore, aggregate demand and spending fell, leading tolower output and reduced employment.
Such a simultaneous increase in inflation and unemploymentbrought on by supply shocks creates a dilemma for economic policy.If monetary and fiscal policies produce additional aggregate demandto "compensate" for the recessionary forces set in motion by asupply shock, there is likely to be a large induced rise in inflation. If,on the other hand, no effort is made to compensate, aggregatedemand will fall. But given the relative insensitivity of wage and pricedecisions to moderate slack in the economy, some increase in the un-derlying inflation rate is nonetheless likely. Only sharply restrictivemonetary and fiscal policies, which strengthen the forces leading torecession, can prevent an increase in the underlying inflation rate.While recessionary forces came into play in 1974 and 1980, the slack-ening of aggregate demand was not sufficient to avoid anotherupward ratcheting of the inflation rate.
43Digitized for FRASER http://fraser.stlouisfed.org/ Federal Reserve Bank of St. Louis

The Role of Declining Productivity Growth
Over the past decade—and perhaps since the mid-1960s—the rateof productivity growth in the United States has slackened. (A latersection of this chapter examines this trend in more detail.) Thisslackening has been an unwelcome development, since productivitygrowth can offset the effects of rising wages on business costs andprices. When productivity growth slows but increases in wages con-tinue, the rate of increase in costs and prices rises. While short-termvariations in productivity growth may not be recognized in settingprices, a longer-lasting slowdown in productivity will be reflected inhigher prices. Once prices begin to rise in response to this pressure,another round of wage demands is stimulated as workers try to offsetthe increased cost of living. This raises the underlying inflation rateyet again.
The Downward Insensitivity of Wages and Prices
If wages and prices were sensitive to a moderate degree of slack inthe economy, careful control of aggregate demand through monetaryand fiscal policy could bring rising inflation to a halt quickly and at amodest cost. True, mistakes in policy might occur from time to time,and supply shocks over which the government has no control wouldstill take place. But inflation could be brought down relatively quicklyand easily if it did not have—as it has now—a large degree of inertia.
Before World War II, and perhaps in the immediate postwar years,wages and prices were more sensitive in a downward direction. (SeeChart 3, for example.) Several careful economic studies show that inthat earlier period a moderate or short-lived slackening of aggregatedemand tended to reduce the rate of inflation significantly. Thosewho have compared that earlier era with more recent times differ intheir views as to precisely why things have changed, but the basiccauses are clear.
During the past several decades the vast majority of firms, laborunions, and workers have come to expect that expansionary govern-ment policies will be applied sooner or later to reverse recessionarytendencies in the economy. Since current wage and price decisionsare strongly influenced by what workers and firms think the futurewill hold, the expectation of stimulus removes much of the motiva-tion for moderating wage and price behavior. Businesses and unionshave also developed a growing tendency to turn to government forrelief, often with some success, when their high prices and wageslead them into competitive difficulties. All of these factors have weak-ened the incentive for businesses and workers to restrain their wageand price demands, even in the face of softening markets. These ac-tions do not depend on specific knowledge about future government
44Digitized for FRASER http://fraser.stlouisfed.org/ Federal Reserve Bank of St. Louis

policies but are based on the widespread view that "the governmentwon't allow things to get too bad."
Prior to World War II, however, popular expectations were differ-ent. The Federal Government had historically played little role insmoothing the economic cycles, and substantial depressions as wellas mild recessions occurred periodically. Up until the 1930s therewas no unemployment insurance, social security, or deposit insuranceto ameliorate the consequences of economic downturns. When mar-kets started to weaken, there was no reason to believe that any sup-port—in the aggregate or for individuals—woul<j be forthcomingfrom the government. As a consequence, wages and prices quicklysubsided as businesses and workers scrambled to survive. The cycle,furthermore, was self-reinforcing. Because inflation often led to aslump, followed by a speedy reduction in inflation, businessmen andothers came to expect that inflation would not last long; this expecta-tion itself moderated their behavior with respect to wages and prices.
After World War II, however, the United States and other industri-al countries decided that the costs of this kind of painful adjustmentwere too high. Thus, countercyclical policy was founded. The successof that policy, and the existence of various programs of income sup-port to protect individuals in case of unemployment, have changedthe character of expectations. In the new environment the appear-ance of slack markets, idle capacity, and higher unemployment leadsto far less moderation in wage and price increases. Downward flexi-bility has not disappeared, but it has diminished.
Current wage and price behavior has deep-seated structural originsand is not based solely on current expectations about governmentalbehavior. Since most large wage contracts run for 2 or 3 years, therate of wage increase in any particular year will have been deter-mined in part by negotiations in earlier years under different condi-tions. In addition, the expiration dates of multiyear wage contractsfor different industries are staggered, and the wage increases negoti-ated in any industry will be influenced to some extent by the size ofearlier increases won by unions in other industries. Moreover, theprospect of further inflation over the life of these contracts has led tothe inclusion of cost-of-living clauses, which provide wage increaseseven when markets are slack. Although union contracts cover lessthan one-quarter of the civilian labor force, the partial insulation ofthese contracts from current economic events has some effect on thewages that nonunion firms must pay.
Quite apart from the existence of written contracts, there aremutual advantages to both firms and workers from wage-setting prac-tices that are relatively insensitive to economic slack. In complicatedmodern societies the costs of acquiring information about alternative
45333-5U0 0 - 81 - 4 : QL 3Digitized for FRASER
http://fraser.stlouisfed.org/ Federal Reserve Bank of St. Louis

job opportunities are very high for workers, and the costs of traininga skilled work force are very large for businesses. Both workers andfirms see benefits in establishing long-term relationships. One wayfor a firm to attract and hold a skilled work force is an implicit agree-ment not to engage in extensive wage-cutting during periods of weakmarkets. As a consequence, many firms are unwilling to take a chanceof losing out in the labor market by being among the first to reducewage increases.
Other institutions besides those of wage-contracting contribute tothe downward insensitivities of prices and wages. In the case ofprices, the downward pressure that would normally be exerted bycompetitive forces in slack markets is significantly muted in large oli-gopolistic industries by market strategy considerations and variousforms of administered prices. Finally, government intervention in in-dividual markets through regulation, which may fix wages, the priceor quality of the product, or the conditions under which productiontakes place, adds further rigidity.
Some of the economic institutions and practices that contribute towage and price rigidity themselves evolved in response to expecta-tions that government economic policy would continue to be sup-portive. Although the persistent application of demand restraint islikely to reduce them, they should not be expected to disappeareasily or quickly.
Downward wage and price rigidity makes the costs of reducing in-flation through monetary and fiscal restraint quite large. It is difficultto estimate the costs with precision, but representative econometricstudies suggest that reducing inflation by 1 percentage point wouldrequire a sacrifice of $100 billion in lost output (in 1980 pYices) anda one-half percentage point rise in the unemployment rate over aperiod of about 3 years. Most of the costs would be incurred in thefirst half of the period. These statistical estimates, however, are basedon historical relationships. There has never been a period of sustainedeconomic restraint in recent times from which direct evidence ofthe costs could be drawn. The possibility that they would growsignificantly smaller if restraint persisted is discussed later in thischapter.
In sum, it is the costs imposed on society when demand restraintclashes with the downward insensitivity of wages and prices thatmakes it so difficult to reduce inflation by applying monetary andfiscal restraint. Viewed in this perspective, the central problem ofeconomic policy is not how to reduce inflation. If that were the onlyobjective, a sufficiently draconian level of demand restraint could befound to do the job. The real issue is twofold: How large are thecosts society is willing to bear to realize the benefits of lower infla-
46Digitized for FRASER http://fraser.stlouisfed.org/ Federal Reserve Bank of St. Louis

tion, and can policies be designed to lower those costs so that infla-tion can be reduced faster with smaller losses in output and employ-ment?
MANAGING AGGREGATE DEMAND
Monetary and fiscal policy must be designed to prevent aggregatespending that is so high or growing so fast relative to the Nation'sproductive capacity that it encourages a speedup in the rate at whichwages and prices are rising—i.e., an increase in inflation. To play arole in lowering the underlying inflation rate, growth in aggregatedemand must be further restrained to a point where firms and work-ers reduce the rate at which they raise wages and prices.
This section starts by specifying a policy of demand managementthat aims at a gradual reduction of inflation in a world where the in-flation rate is highly resistant to downward pressures. Particular at-tention is paid to the problem of establishing the credibility of anti-inflation policies so as to influence popular expectations in a favora-ble way. The section then considers some of the special problems ofmanaging monetary policy in a period of high inflation and frequenteconomic disturbances.
BROAD PRINCIPLES
Three broad principles, discussed at length in last year's Report,can guide monetary and fiscal policy as it seeks to reduce inflationwhile providing for reasonable growth:
First, monetary and fiscal policy should aim for a long-term reduc-tion in the growth of nominal GNP (aggregate spending). That re-duction should not be abrupt, or it will produce large decreases inemployment and production while reducing inflation only modestly.But the restraint must be maintained, since wages and prices tend toresist the downward pressure.
Second, the pace of nominal GNP growth will undoubtedly need tofluctuate along a declining trend. Realistically, even if there is a de-crease in the inflation rate in 1981, for example, some rise in nomi-nal GNP growth will be required to accommodate a modest recoveryfrom the 1980 recession. A policy of fiscal and monetary restraint toproduce a long-term reduction in the growth rate of nominal GNPmay thus need to be adjusted from time to time to take account ofshort-term changes in economic conditions. But several cautions arerequired. Unless clearly warranted and carefully explained, shorter-term adjustments to economic policy can threaten the credibility oflonger-term restraint. Moreover, because an increase in inflationonce underway is so very hard to eliminate, an inflationary mistaketakes much longer to reverse than its opposite. The risks that policy-
47Digitized for FRASER http://fraser.stlouisfed.org/ Federal Reserve Bank of St. Louis

makers face are not symmetrical and, as a consequence, uncertaintymust be resolved in favor of caution.
Third, no matter how well designed, monetary and fiscal policiescannot prevent large outside shocks to the economy from imposingsome damage on employment, price stability, or growth. A practicalapproach would be to "accommodate" the direct inflationary effectof external price shocks but restrain aggregate demand sufficiently tominimize the indirect inflationary effects that would result if individ-uals attempted to raise wages and other incomes to "catch up" withhigher prices. Without huge costs in terms of lost production, howev-er, it would probably be impossible to restrain demand sufficiently toeliminate all induced increases in inflation. In these circumstances avoluntary incomes policy may be able to make a significant contribu-tion. This seems to have occurred in 1979, when the response ofwages to the large rise in inflation was substantially muted.
Because the rate of increase in wages and prices tends to resistdownward pressures, a policy of continued restraint on the growth ofaggregate demand sufficient to induce a decline in inflation will meansustained slack in the economy and will result in a period of relative-ly slow growth in production and employment. This outlook could beimproved if it were possible to change the behavior of wages andprices so that they responded to demand restraint more rapidly andby larger amounts.
THE ROLE OF EXPECTATIONS AND THE CREDIBILITY OF DEMAND
RESTRAINT
Earlier in this chapter the downward resistance of wage and priceinflation was attributed in part to a widespread expectation that ex-pansionary government policies will rather quickly be applied to re-verse recessionary tendencies. If firms and workers became con-vinced that the government meant business, that the markets fortheir products would not be supported by easier money or fiscalstimulus, and that they could continue raising wages and prices onlyat their own peril, their decisions about wage demands and pricingpolicies would undoubtedly be affected. The downward "stickiness"of wage and price inflation would be eased.
Does the government need to put the economy through one ormore prolonged periods of economic slack in order to demonstratethe firmness of its anti-inflation commitment? Or can it avoid thatnecessity by somehow convincing the Nation in advance of its determi-nation? Some observers have suggested, for example, that the gov-ernment could show its resolve by announcing a target path fornominal GNP or for money supply growth (or both) and by commit-ting itself to pursuing those targets whatever the consequences forunemployment and production. The target path would permit pro-
48Digitized for FRASER http://fraser.stlouisfed.org/ Federal Reserve Bank of St. Louis

duction and employment to grow only if they were accompanied bysignificant reductions in wage and price inflation. But simply an-nouncing a set of targets does not guarantee that they will steadfastlybe pursued in the face of mounting losses in employment, profits,and sales. Indeed, the tougher the targets and the greater thedemand restraint they seem to require, the less likely they are to becredible, for their success will rely on an uncharacteristic willingnesson the part of the Administration, the Congress, and the public toaccept large reductions in employment and production rather thanabandon the targets.
The mere announcement of government intentions is, therefore,unlikely to produce a significant change in wage and price behavior.The actual experience of persistent demand restraint, followed by asubstantial number of individual firms and unions pricing themselvesout of the market, would almost certainly be necessary before thecredibility of the policy was established. In addition, the govern-ment would have to refuse pleas for trade restrictions, subsidies, orother relief for those who failed to moderate their wage and priceincreases.
Even if firms and workers became convinced that the governmentwas determined to persist in its demand restraint regardless of theconsequences, to what extent would they respond with a greater will-ingness to cut wage and price increases, especially if the demand re-straint were moderate instead of very severe? The answer woulddepend in part on whether they expected inflation or production tofall first. If individual firms believed that demand restraint was syn-onymous with lower inflation, they would undoubtedly restrain theirown wage and price increases, since they would be reluctant to getfar out of line with the wages and prices of other firms and indus-tries. But given the downward insensitivity of wages and prices expe-rienced over the past several decades, demand restraint might at thepresent time lead instead to expectations of lower output. It is not atall clear, therefore, how sharply wages and prices would respond to amoderate decline in demand even if it was expected to last for a longwhile.
Equally important, strong structural components of wage and pricestickiness discussed earlier in this chapter would remain. These struc-tural factors are, in the near term, independent of expectations. As aconsequence, other measures would also have to be pursued as ameans of speeding a reduction in inflation and raising the growth ofproduction and employment in th£ face of continued demand re-straint.
The foregoing discussion suggests that one of the most criticalquestions in designing anti-inflation policies is determining the
49Digitized for FRASER http://fraser.stlouisfed.org/ Federal Reserve Bank of St. Louis

extent to which the downward stickiness of wage and price inflationhas been due to popular expectations rather than to structural fac-tors. While there is no clear-cut answer to this question at themoment, it is surely true that expectations about the persistence ofgovernment policies of demand restraint affect the responsiveness ofwages and prices. To the extent that the credibility of governmentpolicies can be strengthened, the reduction in inflation will comemore quickly and the social costs will be reduced. The fact of persis-tence in an anti-inflation policy—as happened in 1980, when no fiscalstimulus was offered and a restrictive monetary policy was main-tained in the face of a weakening economy—should gradually help tomodify business and worker behavior. But it would be imprudent toexpect entrenched expectations to be changed quickly.
MONETARY POLICY
The Federal Reserve bears a substantial share of the responsibilityfor carrying out aggregate demand management. As discussed above,the monetary authorities must first confront the question of the ap-propriate degree of economic restraint. The problem is to achievethe proper balance in order to reduce inflationary pressures at aminimum cost in lost jobs and production. Formulating and imple-menting policies to achieve this balance in a period characterized bywide fluctuations in economic and financial conditions confronts themonetary authorities with a number of serious additional challenges.While these problems are generally technical in nature, the mannerin which they are resolved can have a significant impact on thedegree of monetary restraint.
Monetary policy can exert no direct control over aggregatedemand. It must exert its influence indirectly, that is, by affectingactual and expected conditions in the money and credit markets. Thelinkages between what it can control (the cost and availability of bankreserves), its intermediate indicators of conditions in the money andcredit markets (the monetary aggregates and interest rates), and itsultimate goals (the impact on real growth and prices) are imperfectand often are not directly observable, even after the fact. In evaluat-ing these linkages, the monetary authorities must rely on predictedrelationships based on economic theory and historical experience,and there is plenty of room for slippage. These technical problemscreate considerable uncertainty for the makers of monetary policy.
A related issue is that the effectiveness of the monetary authoritiesin bringing down inflation depends on how firms and individuals per-ceive monetary policy. Private sector expectations of the likely suc-cess of monetary policy influence its actual success. Consequently, itis important that the monetary authorities demonstrate that they havechosen a strategy that will achieve their anti-inflation objectives.
50Digitized for FRASER http://fraser.stlouisfed.org/ Federal Reserve Bank of St. Louis

Moreover, their actions must indicate that they have the technical ca-pability to meet these objectives while responding forcefully to newsituations and to any divergence between desired and actual develop-ments.
In recent years the debate on these issues has focused on the Fed-eral Reserve's target growth ranges for monetary aggregates and onthe process of setting and implementing these targets. The targetsare defined in terms of the narrow measures of the money stock(formerly M-l and now M-1A and M-1B, which include currency andvarious types of checkable deposits), the broader measures of themoney stock (M2 and M3, which include currency and checkable de-posits as well as time and savings deposits and other deposit-like in-struments), and bank credit. The Federal Reserve has used monetarygrowth targets internally since the early 1970s, and since 1975 it hasannounced them publicly in testimony before the Congress.
In October 1979 the Federal Reserve modified its procedures forimplementing monetary policy in order to give greater emphasis tokeeping the growth of the aggregates within the target ranges, even ifthat meant more variation in interest rates. By this change, the Fed-eral Reserve was widely perceived as having established the realiza-tion of its targets as a benchmark for measuring the performance ofmonetary policy.
While the notion of monetary targeting may appear quite straight-forward, in practice there are a number of questions that must be re-solved in carrying out a targeting strategy. Among these, three inparticular deserve attention here:
• How should the Federal Reserve set its monetary growth targets,both in terms of choosing particular measures of money andchoosing numerical targets?
• What is the appropriate monetary policy response when the rela-tionships among economic variables, on which the initial targetswere set, appear to shift?
• How rigidly should the Federal Reserve adhere to its longer-rungrowth ranges over the short run?
Choosing the Appropriate Measure of Money
Debate over selection of the appropriate measure by which toguide monetary policy must take into account the tradeoff betweenthe ability of the Federal Reserve to control any monetary aggregateand the influence of that aggregate on overall demand. For example,the monetary base, composed of currency held by the public plusbank reserves, is probably the easiest for the Federal Reserve to con-trol. But studies have shown that the relationship between the mone-tary base and aggregate demand is not very close. The narrow meas-
51Digitized for FRASER http://fraser.stlouisfed.org/ Federal Reserve Bank of St. Louis

ures of the money stock (M-1A and M-1B) are somewhat harder tocontrol but in general have been more closely tied to aggregatedemand. Some economists argue that a broader measure of themoney stock, such as M-2, has the most stable relationship with ag-gregate demand, but the very breadth of this measure—including asit does a mixture of the liabilities of several types of financial institu-tions—makes it rather difficult to control.
A related issue is how the various measures of the money stockshould be defined. The rapid evolution of the financial markets inrecent years (see the discussion in Chapter 2) has blurred the his-torical distinctions between the types of financial instruments andrendered somewhat ambiguous what should be treated as "money."These developments have been partly responsible for the recent in-stabilities in the relationship among the narrow monetary measures,economic activity, and interest rates—instabilities commonly referredto as shifts in money demand.
In light of these considerations, the Federal Reserve has chosen toconsider a family of monetary aggregates to impart a needed degreeof flexibility. Thus, while a narrow aggregate like M-1B has been ac-corded primary emphasis, there may be periods when it provides anuncertain guide for monetary policy. At such times the Federal Re-serve may put more emphasis on the broader measures of the moneystock, such as M-2.
Setting Numerical Targets
Once the Federal Reserve determines which monetary aggregatesto target, numerical target ranges must be set to achieve the appro-priate degree of aggregate demand restraint. The targeting proce-dure could, for example, begin by determining the appropriate pathfor nominal GNP that would be consistent with a gradual decline ininflation. Abstracting from cyclical variations in real economic expan-sion, a steady reduction of inflation would imply a gradual decline innominal GNP growth.
Given this objective, the monetary authorities would need to esti-mate growth rates for the monetary aggregates that would satisfy theneeds of an economy moving along the presumed declining path ofnominal GNP. These would then become the basis for choosing thetarget growth ranges. Over the past two decades a given growth rateof the narrow measures of money has, on average, financed a 2 to 3percentage point faster rate of expansion of nominal GNP, althoughthe pattern has varied from year to year. This relationship suggeststhat the goal of a gradual decline in the growth of nominal GNP wouldbe consistent with a gradual lowering in the target ranges, althoughnot necessarily every year.
52Digitized for FRASER http://fraser.stlouisfed.org/ Federal Reserve Bank of St. Louis
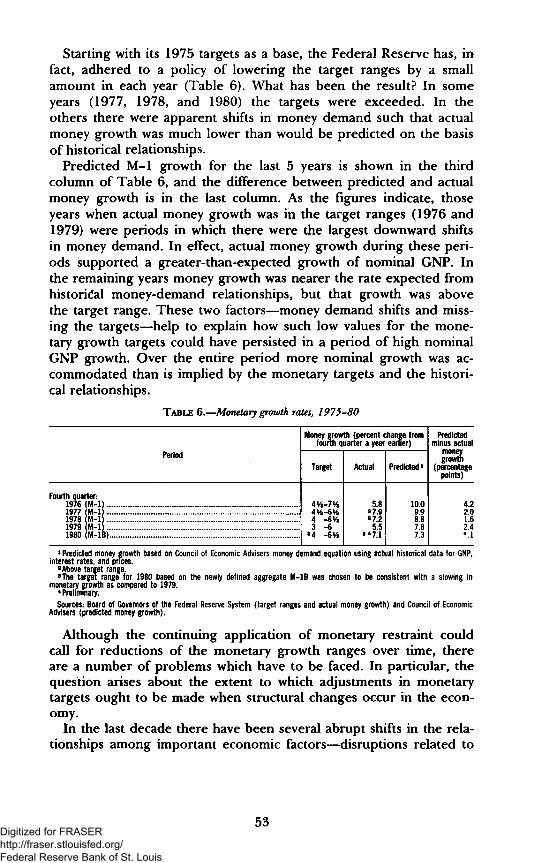
Starting with its 1975 targets as a base, the Federal Reserve has, infact, adhered to a policy of lowering the target ranges by a smallamount in each year (Table 6). What has been the result? In someyears (1977, 1978, and 1980) the targets were exceeded. In theothers there were apparent shifts in money demand such that actualmoney growth was much lower than would be predicted on the basisof historical relationships.
Predicted M-l growth for the last 5 years is shown in the thirdcolumn of Table 6, and the difference between predicted and actualmoney growth is in the last column. As the figures indicate, thoseyears when actual money growth was in the target ranges (1976 and1979) were periods in which there were the largest downward shiftsin money demand. In effect, actual money growth during these peri-ods supported a greater-than-expected growth of nominal GNP. Inthe remaining years money growth was nearer the rate expected fromhistorical money-demand relationships, but that growth was abovethe target range. These two factors—money demand shifts and miss-ing the targets—help to explain how such low values for the mone-tary growth targets could have persisted in a period of high nominalGNP growth. Over the entire period more nominal growth was ac-commodated than is implied by the monetary targets and the histori-cal relationships.
TABLE 6.—Monetary growth rates, 1975-80
Period
Money growth (percent change fromfourth quarter a year earner)
Target Actual Predicted1
Predictedminus actual
growth(percentage
points)
Fourth quarter:1976 M-l1977197819791980
M-l ..M-l ....M-l! ..M-lfe)..
4%6Vfe4 -GYz3 -6
3 4 -6Vfe
5.82 7.9= 7.2
5.52*7.1
10.09.9
7.87.3
4.22.01.62.4
1 Predicted money growth based on Council of Economic Advisers money demand equation using actual historical data for GNP,interest rates, and prices.
2 Above target range.3 The target range for 1980 based on the newly defined aggregate M-1B was chosen to be consistent with a slowing in
monetary growth as compared to 1979.* Preliminary.Sources: Board of Governors of the Federal Reserve System (target ranges and actual money growth) and Council of Economic
Advisers (predicted money growth).
Although the continuing application of monetary restraint couldcall for reductions of the monetary growth ranges over time, thereare a number of problems which have to be faced. In particular, thequestion arises about the extent to which adjustments in monetarytargets ought to be made when structural changes occur in the econ-omy.
In the last decade there have been several abrupt shifts in the rela-tionships among important economic factors—disruptions related to
53Digitized for FRASER http://fraser.stlouisfed.org/ Federal Reserve Bank of St. Louis

jumps in oil and food prices as well as to shifts in money demand.The problem for the Federal Reserve is how, if at all, to adjust mon-etary growth targets in response to these changes. This requires anevaluation of the likely direct impact of monetary and credit condi-tions on economic activity, as well as an assessment of how alteringthe monetary targets would affect wages and prices.
Response to Supply-Side Shocks
When the economy experiences a supply shock such as the recentsurge in oil prices, the initial results are likely to be a reduction inaggregate demand and a rise in unemployment and inflation. As dis-cussed earlier, the Federal Reserve can respond in several ways. Atone extreme, the response would aim at accommodating the shockcompletely, thus restoring real aggregate demand to its level beforethe shock and avoiding any rise in unemployment. At the other ex-treme, the response would attempt to offset fully both the direct andindirect inflationary effects. The intermediate position suggested ear-lier would be to accommodate the direct effects of the price shockbut seek to minimize indirect effects.
If the latter strategy were adopted, the monetary targets necessaryto pursue it would be identical to those prevailing before the shockonly by pure chance. Some adjustment would almost invariably be re-quired, but whether the appropriate response entailed greater or lessmonetary growth than the original target ranges would depend onconditions prevailing in the economy at the time as well as on thecomplex dynamic responses of wages and prices after the shock.Moreover, the monetary authorities must remember that their credi-bility may be damaged if this strategy were to entail an upward ad-justment in targets. Such a consideration may lead to a less accom-modative position than analysis based strictly on aggregate demandconditions would warrant.
Changes in Money Demand
Shifts in money demand confront the monetary authorities with adifferent set of problems. Here the appropriate policy response isclear in theory. For example, money-demand shifts have at times inrecent years resulted in sudden reductions in the amount of moneynecessary to support a given amount of economic activity. Holding topredetermined monetary targets in the face of such shifts wouldmean a more accommodative policy than previously intended. Alter-natively, by reducing monetary growth targets commensurate with thedemand shift, an unchanged degree of monetary restraint would bemaintained.
Although the response is clear in theory, in practice there aremany problems. It is difficult for the Federal Reserve to know until
54Digitized for FRASER http://fraser.stlouisfed.org/ Federal Reserve Bank of St. Louis

well after the fact whether the money-demand relationship haschanged permanently. If one could observe money, interest rates,and nominal GNP contemporaneously, one could judge whetherthese developments were roughly in line with historical patterns. Ifthey appeared to be out of line, a shift in demand might be suspect-ed. Two problems in ascertaining a shift are the long delay beforedata on GNP are available, and the frequent revisions subsequentlyundergone by both GNP and money data. Another problem is thatthe "normal" demand for money cannot be estimated precisely, sothat even with timely data it may take several quarters before theshift becomes evident.
Suppose that a money-demand shift is suspected of having oc-curred, but its magnitude is uncertain. How should the monetary au-thorities adjust the targets in a way that maintains a steady degree ofmonetary restraint? First, the targets for the narrow aggregates mightbe adjusted by shifting the midpoints of the longer-run target rangesaccording to the "best guess" of how the structural shift will affectthe growth rate. Second, if the impact of the structural change is un-certain, the upper and lower bounds of the growth range may haveto be widened to reflect that uncertainty. Third, if—as in the past—the broader money measures do not appear to be affected as muchby the structural changes, more emphasis could then be put on thebroader aggregates in guiding monetary actions. At such times therelatively greater stability of the relationship of the broader aggre-gates to income and interest rates may give the monetary authoritiesa somewhat better measure of monetary stringency. The risk inmaking these adjustments is that the public may lose sight of whysuch changes are being made—interpreting them as mere tinkeringor as devices aimed at loosening monetary restraint. Thus, the mone-tary authorities stand to lose credibility unless they can convince thepublic of the need for such adjustments when they are appropriate.Problems of Short-Run Variability
Once the annual numerical targets have been set, and adjusted formajor supply shocks or shifts in money demand if necessary, the nextquestion is how rigidly the targets should be followed during theyear. It is important to recognize that random and temporary fluctu-ations will inevitably occur, affecting both the demand and supplysides of the financial markets. Empirical evidence suggests, however,that deviations from a desired money growth path lasting as long as aquarter do not destabilize aggregate demand if they are subsequentlycorrected. Hence, rigid adherence to a longer-run target over periodsas short as a month or a quarter would require wide fluctuations ininterest rates, which could disrupt the economy unnecessarily. Inview of the importance of preserving Federal Reserve credibility, it is
55Digitized for FRASER http://fraser.stlouisfed.org/ Federal Reserve Bank of St. Louis

essential for the public to understand that such short-run deviationsare not nearly as consequential as they are sometimes made out tobe.
The problem for the Federal Reserve is to distinguish these tempo-rary disturbances from more permanent shifts in economic relation-ships for which some response may be necessary. Since the monetaryauthorities cannot determine until well after the fact whether a diver-gence in money growth is permanent or self-correcting, they must es-tablish short-run procedures that partially accommodate temporarydisturbances but respond with increasing intensity to systematictrends. The current procedures for implementing the longer-rungrowth target ranges include setting short-run money targets periodi-cally during the year and managing reserves on a day-to-day basis tomeet those targets. These procedures are designed to achieve aproper balance between avoiding unnecessary disturbances in themoney markets and responding in a timely fashion to sustainedmovements of actual money growth away from the desired path.
In practice, this process is subject to a number of slippages, bothin the relationship between reserves and money and in the actualcontrol of reserves. Because different components of the moneystock are subject to different reserve requirement ratios—and someare subject to no reserve requirements-r-the ratio of reserves tomoney can vary unpredictably when funds are shifted among types ofdeposits and among institutions. This hinders short-run monetarycontrol. Changes in reserve requirements and reserve coverage asso-ciated with the Depository Institutions Deregulation and MonetaryControl Act of 1980, discussed in Chapter 2, should reduce the vari-ation in the money-reserve ratio, but only gradually. Until this transi-tion period is completed, the variation in this crucial ratio will contin-ue.
Even if the linkage between money and reserves were perfectlystable and predictable, the Federal Reserve would still need to beable to control total reserves. Current problems in forecasting thevarious uncontrollable factors affecting reserves, in reserve account-ing procedures, and in the management of the discount windowmake it difficult to achieve the target for total reserves. The FederalReserve is working to improve its forecasting techniques and is con-sidering other reforms that would increase its control over reserves.
Thus, one should not expect the Federal Reserve to adhere rigidlyto its annual monetary targets in every period during the year. Tem-porary and largely self-correcting disturbances will inevitably lead toshort-run deviations, but these deviations should have few permanenteconomic consequences. The current targeting process of the Federal
56Digitized for FRASER http://fraser.stlouisfed.org/ Federal Reserve Bank of St. Louis

Reserve provides some flexibility in the face of such temporary dis-turbances, even with unchanged annual monetary targets.
Conclusions
One of the major lessons that emerges repeatedly in the precedingdiscussion is the need for understanding, by the public generally andthe financial community in particular, of the complexities of mone-tary policy. Monetary targeting provides an invaluable tool to in-crease monetary discipline, to communicate Federal Reserve inten-tions, and to evaluate performance. But the advantages of a semi-automatic rule to guide the monetary authorities are not absolute. Ina world where economic and financial markets are subject to majorand unpredictable changes, deviations from the Federal Reserve's an-nounced intention to reduce steadily the annual target ranges maysometimes be necessary. Targets, once set, may occasionally have tobe modified. And allowing short-run deviations of actual from target-ed money growth may be called for if care is taken not to let thempersist. But if the public interprets occasional necessary changes inthe longer-run monetary target ranges, or short-run deviations ofactual money growth from those targets, as evidence that the FederalReserve has lessened its determination to fight inflation, the mone-tary authorities will be put in an untenable position. If they fail tomake the adjustment in the monetary targets that is called for by amajor change in economic circumstances, or if they attempt to avoidall short-run deviations of actual from targeted money growth, mone-tary policy may produce unwanted results. If, on the other hand, theydo change the targets or allow temporary deviations, their actions maybe misunderstood by the public and their credibility consequentlyimpaired. The monetary authorities will face this problem once againin 1981, as is discussed in Chapter 3.
INCOMES POLICIES
Even if they are followed with persistence and acquire a credibilitythat favorably affects expectations, monetary and fiscal restraints arelikely to reduce inflation only slowly and at significant cost in lostoutput and employment. Incomes policies attempt to lower thesecosts. By directly influencing the setting of wages and prices, incomespolicies seek to decrease the inflation and increase the growth ofoutput and employment that result from any given degree of demandrestraint. A tight monetary target, for example, is compatible eitherwith a small reduction in inflation and zero economic growth or alarger reduction in inflation and positive economic growth. By per-suading workers and employers to accept lower pay and price in-
57Digitized for FRASER http://fraser.stlouisfed.org/ Federal Reserve Bank of St. Louis

creases, an incomes policy tries to make the second combination pos-sible.
Incomes policies range from the informal pressure on a few largecorporations and unions exerted by the Kennedy Administration tothe formal review of price and wage increases by the Council onWage and Price Stability (CWPS) to even more formal schemes basedon the tax system, examined in detail below. While mandatory wageand price controls are the extreme form of an incomes policy, thediscussion in this chapter is confined to voluntary forms, that is,forms which do not involve legal prohibition of excessive wage andprice increases.
An effective incomes policy encourages various groups in society toaccept lower wages and prices for the goods and services they supplyin the expectation that the wages and prices they pay will also belower. An incomes policy that gains widespread support can meetthese expectations. Workers agree to lower their wage demands, andthus unit labor costs rise more slowly. Firms moderate their price in-creases, and therefore workers* costs of living rise more slowly. Theimplicit agreement made among government, workers, and firms totake simultaneous actions to slow the wage-price spiral through themechanism of the incomes policy is thus successful principally to theextent that people believe it will be successful.
To have a lasting influence on inflation, an incomes policy must domore than lower the current rate of increase in wages and prices. Itmust also lower expectations about the future rate of inflation. Work-ers must believe that they can achieve their real wage demands withlower nominal wage gains, and firms must believe that large nominalwage gains or other cost increases will be hard to pass on into prices.While our knowledge about the formation of expectations leavesmuch to be desired, it does suggest that a short-lived reduction ininflation may be insufficient to change expectations sharply. To besuccessful in lowering inflationary expectations, therefore, an in-comes policy probably has to be in effect for more than a single year.
Even more important, an incomes policy will have no hope of alasting effect unless it is accompanied by monetary and fiscal re-straint. If there is excess demand in labor and product markets, or ifmonetary and fiscal policies create expectations of excess demand,the basic tenet of an incomes policy is destroyed. Individual employ-ers or groups of workers cannot then assume that their own modera-tion will be matched by moderation from others.
Although incomes policies can help to reduce inflation, they alsotend to create losses of economic efficiency. Ideally, economic policyseeks to lower the average rate of wage and price increase while leav-ing individual wages and prices to adjust freely around that average
58Digitized for FRASER http://fraser.stlouisfed.org/ Federal Reserve Bank of St. Louis

in response to circumstances in particular markets. In reality, ofcourse, an incomes policy cannot operate on a statistical average butmust deal with the wages and prices of individual firms. Therefore,incomes policies inevitably discourage to some extent movements inprices and wages relative to each other. Over time, the failure of rela-tive prices to adjust in response to changing conditions leads tomounting losses of economic efficiency. The more rigid and manda-tory in character the incomes policy, and the longer it is kept inplace, the greater will be the efficiency costs.
This Administration has judged the benefits of a relatively flexibleand voluntary incomes policy to be significantly greater than its costs.In late 1978 the Administration set forth voluntary standards for payand price increases as the centerpiece of an incomes policy. This sec-tion of Chapter 1 briefly reviews that program, and then evaluates awide range of measures known as tax-based incomes policies (TIPs)under which tax penalties or rewards are employed as a means of in-ducing moderation in wage and price increases.
THE PAY AND PRICE STANDARDS
For the past 2 years the Administration's incomes policy has cen-tered on the voluntary pay and price standards. Administered byCWPS, this program applied to firms of all sizes, but only large firmswere asked to submit data on pay and either prices or margins. Thestandards set by CWPS were designed to reflect the structures of dif-ferent industries. Compliance was encouraged by appealing to firmsand workers to restrain price and pay increases in the public interest.CWPS also used public opinion and the threatened loss of govern-ment contracts to encourage compliance.
Although the standards were voluntary and were in place duringthe difficult period of the 1979 OPEC oil price explosion, theyappear to have played a role in moderating inflation. Studies byCWPS and the Council of Economic Advisers have estimated thatannual wage increases were 1 to IV2 percentage points lower during1979 than they would have been without the standards. The conse-quent reductions in labor costs also appear to have been passed onto consumers through lower price increases. A more recent evalua-tion of the pay and price standards by CWPS suggests that the pro-gram continued to have a moderating effect in the second year.
After 2 years of operation there seems to be general agreementthat the current pay and price standards could not continue to be ef-fective if simply extended in their present form. Workers and firmsno longer appear to be willing to moderate wage and price rises inthe expectation that the standards will restrain inflation.
59Digitized for FRASER http://fraser.stlouisfed.org/ Federal Reserve Bank of St. Louis

TAX-BASED INCOMES POLICIES
One way of strengthening a voluntary standards program would beto supplement it with a tax-based incomes policy, or a TIP. Such apolicy would use the tax system to provide tangible incentives tofirms and workers to slow the rate of inflation.
As the discussion in this section later concludes, the most effectivekind of TIP would be one that rewarded employees of firms whoserate of wage increase was below the standard. Such a program wouldsignificantly reinforce the spirit of cooperation used in other volun-tary forms of incomes policies without creating as many distortions asa mandatory program. Firms and workers that agreed to moderatetheir price and wage increases would be making less of a sacrificeunder a TIP than under other voluntary programs. And in sectors ofthe economy in which relative prices and wages were too low, a TIPwould allow adjustments. The most serious distortions in relativeprices and wages that develop under mandatory controls would beavoided under a TIP.
Several years ago the Carter Administration proposed to the Con-gress one particular version of a TIP—the "real wage insurance*'program—but the proposal was not acted upon by the Congress, andin fact was not subjected to widespread public discussion and debate.TIPs continue to represent an important untried innovation in thearea of anti-inflation policy. While TIPs may impose administrativeand efficiency costs, those costs appear to be far less than would beincurred by reducing inflation solely through restraining aggregatedemand.
Various kinds of TIPs have been suggested. Under a pay TIP, forexample, the government would set a standard for pay increases overthe coming year. Groups of workers whose average pay increase didnot exceed the standard would be in compliance. In one version ofthe pay TIP, firms whose wage increases exceeded the standardwould be assessed a tax penalty. In another version, all workers in acomplying group would receive a tax credit, including individualswithin the group whose pay raises were above the standard. Similarly,a price TIP would provide penalties or rewards to firms on the basisof their average price increases relative to a set of standards.
In virtually all versions of the TIP it is the average rate of wage orprice increase within the firm that is compared with the standard forpurposes of determining tax penalties or rewards. With this ap-proach, firms are able to change the relative pay and prices of sub-groups of workers and products. Merit pay plans and promotionsthat give individual pay raises in excess of the standard can still beused to encourage productivity.
60Digitized for FRASER http://fraser.stlouisfed.org/ Federal Reserve Bank of St. Louis

Although the flexibility of TIPs makes them attractive, using thetax system to reduce inflation poses serious administrative problems.These problems present the major obstacles to designing an effectiveTIP program. The following sections discuss issues of design in somedetail, and a Technical Appendix to this chapter examines otherproblems in measuring average pay increases.
Several choices must be made in designing a TIP. First, should itdispense rewards or levy penalties? Second, should receiving thepenalty or reward depend only on being above or below the standard(a "hurdle" TIP), or should the size of the penalty or reward begraduated in accordance with the difference between the standardand the actual pay or price increase (a "continuous" TIP)? Third,should the TIP be a permanent or a temporary program? Finally,should the TIP apply to pay, to prices, or to both? These choices re-quire striking a balance among equity, efficiency, administrative ease,and effectiveness in reducing inflation. The next section discusses thefirst three choices in the context of a pay TIP, and presents estimatesof the cost and effect of a specific pay TIP. Another section discussesprice TIPs.
Varieties of Pay TIPs
For several reasons, a reward pay TIP is probably preferable to apenalty pay TIP. A reward TIP encourages workers to cooperate witha voluntary incomes policy by compensating them for acceptinglower nominal pay increases than they would otherwise receive. Apenalty TIP, whether levied on firms or on individuals, will tend toundercut the spirit of cooperation necessary for a successful incomespolicy. This is especially true because incomes policies are oftenthought to be more effective in restraining pay increases than inlimiting price or profit increases. In addition, although lower rates ofincrease in wage rates and unit labor costs eventually result in lowerprice increases, the effect is not immediate. In the short run, wagesmay increase more slowly but prices might not. Workers would there-fore be more willing to cooperate with an incomes policy that partial-ly compensated them for accepting, at least in the short run, lowerreal incomes than they would have earned in the absence of a TIP.Since a reward TIP provides such compensation, at least in part ifnot in full, it would be both more equitable and more acceptable toworkers than a penalty TIP.
Furthermore, a penalty TIP has other drawbacks. If levied againstfirms, it might increase the rate of inflation. Some of these firmswould be able to pass on the cost of the TIP penalty to consumers,especially if the above-standard increase were industry-wide. Someprices therefore would rise as a result of the TIP. Levying the penaltyon individuals rather than firms raises different objections. Such a
333-5H0 0 - 81 - 5 : QL 3 61Digitized for FRASER http://fraser.stlouisfed.org/ Federal Reserve Bank of St. Louis

penalty TIP would occasionally penalize employees who receivedlittle or no pay increase but who worked for firms with large averagepay raises. For such individuals, a penalty TIP would add injury toinsult and would be perceived as very unfair.
A penalty TIP would raise government revenues, which could bereturned to the private sector through offsetting tax cuts. By con-trast, a reward TIP would cost the Federal Government a substantialamount in forgone tax revenues. In practice, this means that areward TIP would only be feasible when tax cuts were being consid-ered. Since inflation and economic growth tend to drive up averageeffective tax rates, however, periodic tax reductions will be feasibleif the share of Federal spending in GNP is kept from rising.Therefore, the key budgeting issue posed by a reward TIP is its ef-fectiveness, compared to other forms of tax reduction, in meetingeconomic goals.
One difficult problem that must be addressed in designing a TIP isthe administrative burden it would impose on private firms and onthe government. A TIP limited to a few thousand large firms withcomputerized personnel records would have much smaller public andprivate administrative costs than a TIP that included millions of smallfirms.
But limiting a pay TIP to large firms seems very unlikely to securethe kind of support needed to enact and operate a successful in-comes policy. A limited reward TIP would be vigorously opposed byworkers in small firms, who would argue, rightly, that they werebeing deprived of a potential tax cut. But a limited penalty TIPwould tend to reduce the real income of workers in large firms andwould be vigorously opposed by large firms and large unions.
A second issue in the design of a pay TIP is whether the penalty orreward should be a single amount based only on the wage increasebeing above or below the standard (hurdle TIP), or whether it shouldbe graduated according to the difference between the standard andthe actual increase (continuous TIP). A hurdle TIP only encouragesfirms and workers to have pay raises below the standard. It providesno direct incentive to lower pay raises that were already below thestandard or, realistically, to reduce pay raises that were far above thestandard. In contrast, a continuous TIP whose penalty or reward de-pended on the difference between the standard and the actual payraise would provide an incentive to lower all pay increases. Loweringa pay raise that was above the standard would result in a smaller pen-alty. Lowering a pay raise that was already below the standard wouldmean a larger reward.
The main advantage of a hurdle TIP is administrative. Under ahurdle TIP, firms that expected to grant pay raises above the stand-
62Digitized for FRASER http://fraser.stlouisfed.org/ Federal Reserve Bank of St. Louis

ard or that thought the administrative costs of compliance were toohigh would not be required to keep records. In contrast, under acontinuous TIP that penalized firms or workers above the standardas well as rewarded those below, all firms would have to keep de-tailed records and would have to file additional schedules with theirtax returns.
A reward-only continuous TIP would eliminate record-keeping re-quirements for noncomplying firms, and, as emphasized above, itwould also be more equitable than a continuous TIP that includedpenalties. Such a TIP could offer tax credits, for instance, of 3, 2, or1 percent of earnings, to employees of firms with average pay raisesthat did not exceed 50 percent, 75 percent, or 100 percent of thestandard. However, even this simple continuous TIP would probablygenerate more disputes than a hurdle TIP, since firms would have in-centives to understate their pay increases to appear to be in a lowerbracket. Under a hurdle TIP, only firms near the standard would facesuch incentives.
The final major issue in designing a TIP is whether it should bepermanent or temporary. The answer seems to be that a permanentTIP would not be feasible because of the distortions it would createby discouraging changes in relative wages. A TIP might introducefurther distortions as people changed their behavior to circumventthe intent of the policy while remaining technically in compliancewith the standard. For a while the distortions created by a carefullydesigned TIP would probably be small. But as relative prices andwages wandered farther from equilibrium levels, the distortionswould become larger and the effects on inflation smaller. The eco-nomic costs from the distortions of an effective temporary TIP wouldbe acceptable when balanced against the larger costs of relying solelyon demand restraint to lower inflation. Because the distortions wouldbuild up over time, however, the costs of a permanent TIP wouldeventually exceed benefits.
On balance, given all the foregoing economic and administrativeconsiderations, a temporary hurdle TIP—a tax credit to groups ofworkers whose average pay increase does not exceed a specifiedstandard—seems superior to the other variants. Because keeping rec-ords and complying with the standard would be voluntary in this typeof TIP, firms that found the administrative costs too high couldchoose not to participate. As with all forms of TIPs, relative wagechanges could still occur in response to economic and other develop-ments, although increases in excess of the standard would "cost"workers the TIP tax credit. The efficiency costs would be small atfirst, but over time the distortions of the TIP would rise and its effec-tiveness would fall.
63Digitized for FRASER http://fraser.stlouisfed.org/ Federal Reserve Bank of St. Louis

Together with a "jawboning" campaign aimed at producing wide-spread compliance with the standard by lowering expectations of in-flation, such a TIP could lower the rate of inflation. Without jawbon-ing, the cost of inducing compliance among workers with anticipatedpay raises far above the standard would be prohibitive. Even workerswho expected pay raises near the standard might be reluctant to sac-rifice part of a pay raise that might be built into future wages in ex-change for a small tax credit that only lasted for 1 or 2 years. Themajor appeal of wage moderation is that if everyone cooperates byaccepting a smaller wage increase, the lower nominal wage gains willbe matched by lower price increases. Real wages will not fall, but in-flation will. A TIP alone cannot provide sufficient economic incen-tives to make a low wage increase more attractive than a large one.However, with public appeals to moderation and clear evidence offiscal and monetary restraint, a TIP can contribute to slowing the in-flationary spiral.
Costs and Effects of a Reward Pay TIP
The preceding discussion concluded that the most desirable typeof pay TIP would be a temporary hurdle type that provided a rewardfor keeping pay raises below the standard. To examine the possibleusefulness of such a TIP in dampening inflation, the Council of Eco-nomic Advisers attempted to estimate the costs and effects of areward TIP open to all employees, public and private. The rewardwas assumed to be a fixed percentage of wage income, up to themaximum social security wage base of $29,700. It was also assumedto be taxable and to be refundable to workers whose income tax lia-bility was less than the reward. The average rate of wage increase inthe absence of a TIP was assumed to be 9.7 percent.
The probability that a group of workers would accept a wage in-crease at or below the standard was assumed to depend upon thesize of the reward and the relationship of the group's potential wageincrease to the standard. The smaller the potential wage increase rel-ative to the standard and the greater the reward, the higher the prob-ability of compliance. The results of this estimating procedure obvi-ously depend very heavily on the specific relationships used to calcu-late the probabilities of compliance for various groups of workers.Since there is no historical experience on which to base these rela-tionships, the estimates presented below are simply examples basedupon a considered judgment of the issues.
The costs, effects, and compliance rates that would result from var-ious combinations of standards and rewards were estimated underthe assumptions mentioned above. Illustrative combinations of stand-ards and rewards at two levels of cost to the Federal budget are pre-sented in Table 7. These estimates suggest three things. First, for a
64Digitized for FRASER http://fraser.stlouisfed.org/ Federal Reserve Bank of St. Louis

given standard, as the reward and the cost rise, so does the reductionof wage inflation. Second, there is some tradeoff between standardand reward. That is, a program with a high standard and a lowreward may cost the same as a program with a lower standard andhigher reward. Third, for a given budgetary cost, a low-standard, high-reward combination tends to be more effective in reducing wageinflation than a high-standard, low-reward combination. The selectionof that combination may create a problem of credibility. A TIP that isrelatively effective in restraining pay increases for a given cost willtend to have lower compliance rates than a program with a higherstandard and lower reward but which has less of the desired effect oncompensation. This happens because higher standards put morepeople in compliance who do not have to modify their wage behav-ior.
TABLE 7
Standard — Reward(percent)
$12 billion budgetary cost:2
7 — 2Y27y2 _ 2V*8 - 2 .
$16 billion budgetary cost:2
7 - 37y2 - 2%.8 - 2V2 .
.—Estimated effects and compliance rates of various pay
Compliance rate(percent)*
50 255 961.8
54.659.865.3
TIPs
Effect onwage inflation
(percentagepoints)
- 0 9387
- . 7 9
-1 .09-1 .01
- .91
1 Percent of workers in establishments that have an average pay raise less than or equal to standard.2 Net tax expenditure less reduction in Federal compensation. Federal Government pay increase assumed to comply with
standard—reduced from assumed economy-wide wage increase in absence of pay TIP.Source: Council of Economic Advisers.
A TIP should be judged not only on its initial impact, but on itsfull effect over a 2- or 3-year period. A TIP continued for 2 yearswith a reduced pay standard in the second year could make a signifi-cant contribution to lowering inflation.
PRICE TIPS
Experience with incomes policies here and abroad, including thepay and price standards, suggests that a pay TIP is easier to adminis-ter and likely to cause fewer distortions than a price TIP. Neverthe-less, a price TIP may be a necessary complement to a pay TIP be-cause restraints on pay alone, even with a reward TIP, might appearinequitable. Furthermore, a price TIP could speed up the effect of apay TIP by shortening the lag between the lowering of pay increasesand their effect on price increases.
It would be unrealistic to set a single price standard for all firms.Productivity growth among industries varies substantially, as dochanges in the prices of raw materials and other costs of production.
65Digitized for FRASER http://fraser.stlouisfed.org/ Federal Reserve Bank of St. Louis

Recognizing this, CWPS in 1978 established a price decelerationstandard which called for all firms to reduce the rate of their averageprice increases in the program year by one-half percentage pointbelow their increases in a base period. Systematically different move-ments in productivity and other cost elements among firms and in-dustries should be at least roughly reflected in their base year experi-ence. CWPS found, however, that it had to permit firms to devisevarious ways of adjusting for uncontrollable cost increases and had toprovide separate standards for certain industries, like retailing andfood processing.
For several reasons, prices are more difficult to measure than pay.In some industries, such as wholesale and retail trade, prices for thesame item vary from week to week. Some firms also give quantity dis-counts, so that prices for the same item vary from customer to cus-tomer. Even if the price of each item did not fluctuate, a small storewith only a few employees may sell thousands of different products.Such a firm might have little trouble with the paperwork necessaryfor a pay TIP, but a price TIP would probably be beyond its adminis-trative capabilities.
Furthermore, a price TIP would face problems posed by new prod-ucts and quality change in old products. Since new products do nothave old prices, no price increase can be calculated for them. In-stead, a price standard might have to be based on the firm's averagemarkup over input costs or on the prices of similar products sold bythe same firm or other firms. A related issue is the treatment of qual-ity changes. Disregarding these changes might be the best solutionfor a temporary price TIP, even though doing so would tend to dis-courage innovation. Alternatively, a program that exempted goodswhose quality had changed, and therefore allowed price increasesabove the standard, would encourage minor product changes that didnot really increase quality. Finally, products whose quality improvedcould be treated like new products, with price increases based onaverage markup or on the price changes of similar goods.
A price TIP would have to allow firms to pass through to con-sumers certain increases in the cost of their inputs. For instance,a utility company could not be expected to keep price increasesbelow a TIP standard for long if the price of the oil it used to gener-ate electricity suddenly doubled. To treat the utility fairly, a priceTIP would have to allow the firm to raise electricity prices to coverthe increased cost of oil. The problem in designing a price TIP is todecide which costs should be granted exemptions, while still encour-aging firms to substitute cheaper inputs for more expensive ones.
Given the greater complexity of devising a workable price stand-ard, a price TIP should probably levy penalties and be confined to
66Digitized for FRASER http://fraser.stlouisfed.org/ Federal Reserve Bank of St. Louis

large firms. Even among large firms it may be desirable to exemptindustries like retailing, in which competition is likely to keep averageprices in reasonable relationship to costs. Market forces also make itunlikely that exempting small firms and competitive industries wouldlead to substantial inequities or to a failure to pass on to consumersthe benefits of wage moderation.
CONCLUSIONS
There are no costless ways to reduce inflation. Using demand re-straint alone imposes very large costs of forgone output and unem-ployment for modest reductions in inflation. A successful TIP canshift more of the effect of demand restraint from output to pricesand thus can cut substantially the costs of reducing inflation. Al-though a TIP would itself impose administrative and efficiency costson the economy, the costs for a short period of time would be small.They would surely be outweighed by the benefits in reduced inflationand lower unemployment that a TIP would bring.
It is useful to distinguish between two broad types of TIP, each ofwhich would have quite different economic objectives. The first wouldbe a continuous TIP that would be made a permanent part of the taxcode and that would set graduated rewards and penalties accordingto the size of a firm's wage (and possibly price) increases. Such a TIPwould be an attempt to make a major and permanent change in themarket system so as to encourage less inflationary wage and price be-havior on the part of individual firms. This chapter has suggestedthat the administrative problems and the distortions introduced intothe wage structure would tend to grow over time, while the effect oninflation would decline. Thus, the costs of a permanent wage TIPwould soon exceed its anti-inflationary benefits.
A second form would be a temporary hurdle TIP based on rewardsfor wage moderation and would be part of a broad public campaignfor voluntary restraint in wage and price increases. The objective ofsuch a TIP, perhaps applied for 2 successive years, would be to pro-vide several downward shocks to the inflationary process, in effect re-versing some of the upward shocks which contributed to today's in-flation rate. Although such a TIP would also involve administrativecosts and distortions in labor-market behavior, these costs would ini-tially be far less than the benefits of the TIP in shortening the periodof restraint and slow growth needed to reduce inflation.
As emphasized earlier, a TIP cannot substitute for demand re-straint. The latter must also be present; otherwise, any gains pro-duced by a TIP are likely to vanish quickly under the pressure ofexcess demand. Since a reward TIP would reduce budget revenueslike any other tax cut, it must fit into a budget plan that makes taxcuts possible. But if the growth of Federal spending is restrained, pe-
67Digitized for FRASER http://fraser.stlouisfed.org/ Federal Reserve Bank of St. Louis

riodic tax reductions will be both feasible and necessary in the yearsahead as inflation and economic growth push taxpayers into higherbrackets and raise average effective tax rates.
TIPs are novel, and most people are unfamiliar with either the op-portunities they present or the difficulties they pose. It is thereforehighly unlikely that a TIP could take effect in 1981. But itwould be useful for the public in general, and the Congress in partic-ular, to begin evaluating the pros and cons of TIPs so that when thetime comes for the next round of Federal tax cuts a TIP program willbe seriously considered.
INCREASING INVESTMENT, SUPPLY, AND PRODUCTIVITY
Economic policy must place greater emphasis on supply-orientedmeasures during the decade of the 1980s for a number of reasons.First, an increase in the growth of aggregate supply, and especially inthe growth of productivity, can raise the growth of output and em-ployment that is consistent with a steady reduction in inflation.Second, reducing this country's vulnerability to higher oil importbills will require a substantially increased investment in alternativeenergy sources over the next 10 years. Finally, even if inflationwere not a problem, a speedup in the lagging rate of productivitygrowth would be essential to maintain the historic advance in ourstandard of living.
The remainder of the chapter summarizes what has been happen-ing to productivity in the United States and briefly examines some ofthe reasons why the rate of productivity growth has declined. It alsoexamines the need to increase the share of national resources allo-cated to capital formation and the Administration's response to thatneed. Finally, it discusses the relationship between demand- andsupply-side policies, and suggests how they must be integrated.PRODUCTIVITY
Advances in productivity are the foundation of advances in ourstandard of living. Increases in output per worker lead to increases inreal income. Healthy increases in productivity can free the fundsneeded to improve the conditions of disadvantaged groups whilelessening the need for sacrifice elsewhere. Thus, when productivitygrowth declines, these other advances also are delayed. But expecta-tions of a rising living standard persist. They perpetuate demands forreal income gains which can no longer be met and which lead to in-flationary increases in wages and to growth in government spending.
Since the mid-1960s, the growth rate of labor productivity hasbeen declining from its postwar highs. In recent years the decline hasbeen so marked as to pose a major challenge to public policy. Be-
68Digitized for FRASER http://fraser.stlouisfed.org/ Federal Reserve Bank of St. Louis

cause declining productivity growth brings with it prospects forslower improvement in our standard of living and contributes to in-flation, a program to stimulate productivity growth must be a key-stone of economic policy.
Table 8 summarizes the postwar history of growth in productiv-ity. The data show a gradual worsening of the productivity decline astime has passed, with the last few years showing sharp declines. Whilejust completed revisions of the data may change the magnitude andtiming of the slowdown, its existence and its costliness are unarguable.
TABLE %.—Labor productivity growth, 1948-80
[Percent change per year]
Sector 1948 to1965
1965 to1973
1973 to1979
1978 IV to 1979 III to1979 IV 1980 III
Private business sector..
Nonfarm
3.2
2.6
0.8
.6
-0.9
-1.1
- 0 . 1
.1
Note.—Data relate to output per hour for atl persons.Source: Department of Labor, Bureau of Labor Statistics.
Some of the decline in productivity results from the way we meas-ure it. In particular, productivity measurement counts as an input thecosts of governmental and private actions to ensure a cleaner envi-ronment, a healthier workplace, and safer consumer products, but itdoes not count the benefits of these actions as forms of output.
It is difficult to interpret measures of productivity such as those inTable 8 without first distinguishing between changes caused by thebusiness cycle and changes caused by longer-term factors. Because itis costly to hire or to fire, businesses typically do not reduce theirwork force proportionally when demand slackens or increase it pro-portionally when demand is expanding. Chart 4 presents the recenthistory of productivity growth after correction for these cyclical influ-ences. As the chart vividly shows, productivity grew very slowlyduring most of the years since 1973, and on several occasions actual-ly declined.
It would not be surprising to discover that the slowdown has manycauses. Measured productivity growth is a distillation of a number ofchanges and influences. Many researchers have been in agreementthat a number of factors have contributed in roughly equal magni-tude to the slowdown. These factors have been discussed in past Re-ports. In addition to increased governmental regulation, particular at-tention has focused on increases in energy prices, declines in the rateof growth of capital relative to labor, and decreases in spending on
69
Digitized for FRASER http://fraser.stlouisfed.org/ Federal Reserve Bank of St. Louis

Chart 4
Productivity Adjusted for Cyclical Variation
PERCENT CHANGE FROM 4 QUARTERS EARLIER
-1
- 2 I • •. I . • i I • • • I • . . Ii • . I • i • I . . . I i . . I .i. I M ) I i • i L i > I • i • I • i i I
1965 66 67 68 69 70 71 72 73 74 75 76 77 78 79 80
NOTE.—DATA ARE FOR PRIVATE NONFARM BUSINESS, ALL PERSONS.
SOURCE: COUNCIL OF ECONOMIC ADVISERS.
research and development. But there has also been widespreadagreement that a large portion of the slowdown has not yet been ex-plained.
INVESTMENT NEEDS
One of the causes of the decline in productivity growth has beenthe decline in growth of the capital stock relative to the labor force.Because a rising'share of capital formation has been devoted to ad-justments to cope with higher energy prices and to complying withenvironmental and safety regulations, a diminishing fraction of in-vestment has been available to effect gains in productivity. Althoughthese developments may not have been the primary causes of theproductivity slowdown, increasing capital formation would neverthe-less be an effective way of reversing the slowdown. Many of the fac-tors affecting productivity cannot be directly or immediately influ-enced by the government, but economic policy—especially taxpolicy—can influence the pace of capital formation.
As a general rule, an increase in the amount of capital invested perworker is associated with an increase in output per worker—i.e., inincreased productivity. There are two reasons for this. First, process-es that generate more output per worker usually require more capitalper worker, and second, increasing the ratio involves putting newercapital into place. The newer capital is likely to* embody more ad-
70Digitized for FRASER http://fraser.stlouisfed.org/ Federal Reserve Bank of St. Louis

vanced technology and will therefore increase the efficiency of thecapital stock.
During the decade of the 1960s the capital-labor ratio grew at anaverage rate of about 3 percent per year; over the last 5 years, how-ever, the ratio has remained roughly constant. This development hasbeen due to both the slower growth in the capital stock and to themore rapid growth in employment and hours worked (Table 9). The1974-79 deceleration in the growth of capital is somewhat at oddswith the rough stability in the investment share of GNP over thesame period and requires some explanation. A greater share of in-vestment is now being spent on relatively short-lived assets. Theratio of investment in equipment to investment in nonresidentialstructures has increased in recent years. The result is that each dollarof gross investment now yields less net investment because the capitalstock is depreciating more rapidly.
TABLE 9.—The investment share, and growth in the capital-labor ratio, 1949-79
Period
1949-59
1959-69 ....
1969-74
1974-79
Real business fixedinvestment aspercent of real
GNP1
9.1
9.8
10.5
10.3
Percent change, average annual rate(end of year to end of year)
Net capitalstock
(nonresi-dential) s
4.0
4.6
4.2
3.0
Employ-ment3
1.1
1.6
1.2
3.1
Hours3
0.7
1.2
.5
2.8
Capital-employ-
mentratio
2.9
3.0
2.9
- . 1
Capital-hoursratio
3.2
3.3
3.7
.2
1 Average annual investment-GNP ratio, in percent.2 Net fixed nonresidential business capital, 1972 dollars, end of year.3 For private business, all persons. End of year calculated as average of year's fourth quarter and following year's first
quarter.Sources: Department of Commerce (Bureau of Economic, Analysis) and Department of Labor (Bureau of Labor Statistics).
To restore the growth of the capital stock per worker to that of the1960s would require that the share of investment in GNP rise by atleast 1 percentage point from its recent average of about 10 Vz per-cent. Such a development should, at a minimum, restore the produc-tivity growth lost from this source. Further improvement would re-quire yet more investment.
Apart from the necessity of improving the productivity growth rate,there are other reasons why future economic policy should encour-age increased investment. Last year's Report discussed these needs indetail. The average age of the capital stock at the end of 1979 was7.1 years. This suggests that much of our plant and equipment wasput in place when oil prices were much lower than they are now.Higher energy prices have shortened the service life of older and lessenergy-efficient capital and made it in the national interest to speedup its replacement. The magnitude of these investments is difficult to
71Digitized for FRASER http://fraser.stlouisfed.org/ Federal Reserve Bank of St. Louis

estimate, but it could represent perhaps another 1 percent of GNPper year.
Additional investment requirements arise from the need to contin-ue domestic production of oil, coal, and natural gas at sharply higherinvestment costs per unit of energy produced, and to expand the in-vestment devoted to alternative energy sources. Conservatively esti-mated, they amount to about another one-half percent of GNP.
During the late 1960s and early 1970s, before the first surge in oilprices, real business fixed investment averaged about lOVfe percent ofGNP. In 1978-79, the investment share averaged slightly higher,around 10% percent, probably reflecting additional investment in theenergy industries. On the basis of a rough judgment, continuation ofinvestment in the neighborhood of 10y2 percent of GNP would meetthe "normal" requirements of a moderately growing economy andhold the capital stock per worker approximately constant, as it hasbeen in the past 5 years. But it would not provide for an expansionof capital per worker or for the Nation's increased needs for energyinvestment.
Meeting these objectives will require substantial additional invest-ment. Since the growth of aggregate demand and total GNP will beconstrained in the years immediately ahead by the need to reduce in-flation, the extra investment cannot come from additional GNPgrowth but will have to displace consumption or government spend-ing, the other major components of GNP. According to the estimatespresented earlier, the share that investment takes in total output willhave to rise substantially from a normally expected lOVa percent orso to 12V2 to 13 percent, and the combined share of consumptionand government spending will have to fall by a correspondingamount.
It is virtually certain that such a large increase in the investmentshare will not be forthcoming without deliberate government poli-cies. The major elements of such a policy lie in a combination ofFederal tax measures and expenditure control. In the future, Federalpersonal tax receipts will take a steadily increasing share of personalincome as inflation pushes taxpayers into higher brackets. As oilprices are decontrolled, revenues will be transferred from purchas-ers—who will pay the higher prices—to the Federal Governmentthrough the windfall profits tax. For both of these reasons the ratioof taxes to GNP will tend to rise and the growth of consumption willbe depressed. If Federal expenditures are controlled so that theirshare of GNP does not rise, periodic tax reductions will be possible.Indeed, they will be necessary to prevent even moderate economicgrowth from being choked off. If a sizable fraction of those tax re-ductions are of a kind which concentrate on encouraging investment
72Digitized for FRASER http://fraser.stlouisfed.org/ Federal Reserve Bank of St. Louis

rather than restoring the growth of consumption, the share of invest-ment in GNP can be raised. Of course, if the share of Federal ex-penditures in GNP is not merely stabilized but reduced, the room forincreasing the investment share of GNP through investment-orientedtax cuts will be even larger.
Within this framework, tax reductions designed to increase theshare of investment in GNP must meet two requirements: They mustincrease the demand for investment goods, and simultaneously theymust increase saving—i.e., they should not increase consumption.These two requirements are closely related, but they are not thesame. There are a number of measures that might seek to increasesaving but have little if any effect on the volume of business invest-ment. Forgoing tax cuts, letting effective tax rates increase, and cre-ating a large Federal budget surplus, for example, would appear tobe one way of increasing national saving. Although such a policywould make possible a decline in interest rates, it would also create asubstantial fiscal drag, reduce economic growth and private saving,and probably yield no increase in business investment spending.Conversely, measures that increase investment demand withoutmaking room for it with an increase in saving will yield an excessivegrowth in total demand and renewed inflationary pressure. Both as-pects of the problem are important. Given the determinants of in-vestment, what tax policies can best increase the demand for invest-ment goods? What form of tax reductions are most likely to be chan-neled into saving rather than consumption?
INVESTMENT DETERMINANTS AND INFLATION
Expectations about future growth are critical in determining thevolume of investment demand for the economy as a whole. But theessence of the earlier discussion was that investment needs to in-crease by more than the amount that would be associated simply witha normal expansion of output. A number of factors influence theamount of capital that firms want to use to produce a given amountof output. Chief among them are the attractiveness of the return oncapital investment as compared with other uses of investors' funds,the perceived riskiness of corporate investment, and the cost andavailability of capital.
One lesson that has been learned in recent years is the deleteriouseffect of inflation on investment. High inflation rates increase theperceived riskiness of investment, and this increased uncertaintymakes planning for future capital needs more difficult. The informa-tion about relative demand that is contained in price changes be-comes clouded when inflation is high. In addition, increasing rates ofinflation are ordinarily accompanied by the expectation of sharply
73Digitized for FRASER http://fraser.stlouisfed.org/ Federal Reserve Bank of St. Louis

higher interest rates and monetary stringency. The expected slowingof growth in demand reduces the incentive to add capacity.
But by far the most important effect of inflation on investment isits impact on tax accounting provisions and depreciation allowances.Depreciation is a cost of earning income from fixed capital assets.This cost is the reduced value of the asset due to use, aging, and ob-solescence. The depreciation allowed for tax purposes is based onthe historical cost of an asset. When inflation occurs, allowable de-preciation is reduced relative to the cost of replacing the asset attoday's price. Inflation therefore raises the tax on capital and reducesthe rate of return on investment, and this problem worsens as therate of inflation increases.
The inflation-induced increase in the tax on income from businessplant and equipment is partly offset by the inflation-induced reduc-tion in the tax burden of borrowers. Firms are allowed to charge thefull value of their interest payments against income, even though aportion of these higher interest payments amounts to the repaymentof real capital to lenders. The effect on the return to investment ofthis "excess" deduction varies with the proportion of investment thatis debt-financed. It also varies with the extent to which inflation isreflected in interest rates. Since an important part of investment isnot debt-financed, it is clear that inflation's tax-increasing impact onthe value of depreciation allowances outweighs the tax-decreasingimpact of excess deductions on the return to business investment.
Some have suggested that the inflation-induced distortion of taxdepreciation could be corrected by indexing the value of existingbusiness assets to allow replacement—rather than historical—cost de-preciation. But indexing the value of assets would ignore the interestrate offset described in the prior paragraph. Moreover, as with all in-dexing schemes its administrative and accounting problems would bequite severe, and almost any simple index imaginable would intro-duce distortions of its own. For these and other reasons, indexing isnot an attractive means of correcting the inflation-induced distortionin depreciation allowances.
TAX MEASURES TO INCREASE INVESTMENT
Policymakers have three principal measures to influence investmentthrough the tax system: changes in depreciation allowances, changesin the investment tax credit, and changes in the corporate income taxrate.
Since the effect of inflation in depressing the value of depreciationis such an obvious factor in the recent decline in after-tax rates ofreturn on capital assets, the liberalization of depreciation allowancesis an attractive way to enhance investment. It not only provides anoverall incentive for investment but, if carefully designed, it can also
74Digitized for FRASER http://fraser.stlouisfed.org/ Federal Reserve Bank of St. Louis

correct some of the distortions in investment that accompany infla-tion. Under proposals for accelerated depreciation, the allowable de-preciation on capital assets would be increased. This would permitfirms to write off their capital purchases faster. The changes wouldaffect two determinants of business investment. First, they would in-crease the after-tax yield of capital investment, and thus its attractive-ness. Second, they would increase business cash flow and therebysupply a portion of the funds needed to finance additional invest-ment.
Increases in the investment tax credit would have a similar impacton investment incentives. The investment tax credit reduces the pur-chase price of eligible equipment. It thus provides a direct incentiveby raising net return and by increasing after-tax cash flow.
A reduction in corporate income tax rates, on the other hand, in-fluences investment by increasing after-tax profits. This tends to be aless effective stimulus to investment than either accelerated depreci-ation or increases in the investment tax credit because it has a small-er impact on the net return from new purchases of capital assets. Inaddition, depreciation liberalization or an increased investment taxcredit are only available to a firm to the extent it invests, but a cor-porate tax reduction would be available whether investment is under-taken or not.
The President's Economic Revitalization Program contains severalelements that would significantly improve the outlook for businessinvestment by offering direct incentives to invest in new plant andequipment as well as support for business cash flow. The two majorinvestment incentives in the program are expansion in the coverageof the investment tax credit and a simplified and liberalized form ofdepreciation allowances.
The proposed changes in the investment tax credit would allowfirms to claim full credit for all equipment purchases, even short-lived assets that currently are allowed only a portion of the tax credit.In addition, the investment tax credit would be made partiallyrefundable. Under the current law, the credit can be used to offsetthe first $25,000 of tax liabilities plus up to 70 percent (rising to 90percent by 1982) of liabilities in excess of $25,000. But the proposedchange would allow firms to claim 30 percent of the value of thecredit even if they had no tax liabilities for the year. In this way,firms with substantial investment needs but with little or no currentearnings would be supported in their efforts to rejuvenate andexpand their capital assets. Among these are both younger and small-er firms that are just beginning to grow and larger industries under-going transition, such as autos and steel.
75Digitized for FRASER http://fraser.stlouisfed.org/ Federal Reserve Bank of St. Louis

The proposal for tax depreciation—the Constant Rate Depreciation(CRD) proposal—would allow firms to accelerate depreciation onnew equipment and new structures. Under this proposal, the rate ofdepreciation allowable over the life of the typical capital asset wouldbe roughly 40 percent larger. In addition, the CRD proposal wouldgreatly simplify depreciation accounting.
The President's proposed depreciation reforms share certaincommon features with two recent tax proposals: the bill reported bythe Senate Finance Committee last fall, and the so-called "10-5-3"proposal. Both proposals would liberalize depreciation allowances byshortening the tax life of capital investments. Both would also sim-plify business accounting by significantly reducing the number ofasset categories that firms would have to keep track of. There are im-portant differences, however. In the President's proposal the reduc-tions in tax life have been designed so that there would be, on aver-age, a similar increase in depreciation allowances across all kinds ofassets. The "10-5-3" proposal provides very large increases in theallowed depreciation for longer-lived assets but little or no change inthe depreciation allowed for many shorter-lived assets. The tax lifefor structures would be reduced from an average 30-35 years to just10 years, but, for example, automobile purchases would be allowed alifetime of 3 years, exactly the same as under current tax laws. Be-cause the "10-5-3" proposal would grant uneven benefits acrossasset types, the demand for investment goods would be significantlyskewed from what would be dictated by economic considerationsalone. In addition, the "10-5-3" proposal includes a complex phase-in schedule that may have the perverse effect of delaying capital in-vestment.
Late in the last session of the Congress, the Senate Finance Com-mittee reported a tax bill which also included a depreciation propos-al. The Committee's bill would have established a limited number ofasset classes with shorter tax lives than under current law. While theCommittee's proposal differed from the open-end accounting of de-preciation embodied in the President's proposal, its impact on thevalue of depreciation and on investment incentives would have beencloser to that of the President's approach than is the "10-5-3" pro-posal.THE IMPACT OF THE ADMINISTRATION'S INVESTMENT INCENTIVES
The investment tax credit and depreciation proposals in the Eco-nomic Revitalization Program would reduce the cost of capital tofirms by roughly 5 percent and increase corporate cash flow by $9billion during 1981 through reduced tax liabilities. By 1985 the in-creases in cash flow would total nearly $30 billion annually. It is an-ticipated that business fixed investment will be 5 to 10 percent
76Digitized for FRASER http://fraser.stlouisfed.org/ Federal Reserve Bank of St. Louis

higher than it would otherwise be by the end of 1982, with smalleradditional gains thereafter.
These estimates are derived from statistical relationships which linkbusiness investment demand not only with investment incentives,such as accelerated depreciation or increases in the investment taxcredit, but also with expected capacity needs and demands foroutput. According to the historical experience which underlies theseestimates, increases in investment demand can be affected by acceler-ated depreciation even when capacity utilization is relatively low—asit is forecast to be over the near term (Chapter 3). Indeed, the recenthistorical evidence offers additional support for the view that invest-ment spending could proceed at a rapid pace without extraordinarytightness in industrial capacity. During 1976, the first full year ofgrowth following the 1974-75 recession, real business fixed invest-ment grew 5.3 percent despite the relatively low (79.5 percent) rateof manufacturing capacity utilization during that year. In the follow-ing year, growth in real business fixed investment was 11.9 percent,while the utilization rate rose to only 81.9 percent.
SAVING
Any increase in the investment share of GNP must be accompaniedby a corresponding increase in the saving share of GNP. Total na-tional saving comes from three sources: individuals save out of theirpersonal income; businesses retain, and thereby save, some of theirprofit income; and governments save when they run a budget sur-plus, or dissave when they run a budget deficit. It is total nationalsaving that supports total investment. A portion of saving flows intoresidential investment, investment in inventories, and net foreign in-vestment. The remainder is available to finance business purchases ofplant and equipment.
The Federal Government has numerous policy options for chang-ing the level of national saving and thereby supporting a higher levelof aggregate investment. But it is important to realize that no onesector works in isolation. A given sector's increase in saving may bepartially or fully offset by another sector's dissaving.
Personal tax cuts designed to increase specific types of saving, suchas an increase in the amount of tax-free interest from passbook sav-ings accounts, are likely to be the least effective ways to increase totalsaving. They will increase the flow of saving into those instrumentswhose after-tax returns have been raised, but they will do so primar-ily at the expense of those forms of household saving whose after-taxreturns have not been raised. They will reshuffle personal saving butincrease its amount very little.
General reductions in personal tax rates would increase personalincome, which would itself lead to higher saving. In addition, the
3 3 3 - 5 4 0 0 - 8 1 - 6 : QL 3 77Digitized for FRASER http://fraser.stlouisfed.org/ Federal Reserve Bank of St. Louis

higher after-tax return on saving may induce still further increases insaving. This is more likely to occur if the personal tax cuts are direct-ed at higher-income individuals who tend to save relatively more oftheir additional after-tax income. But there is substantial evidencethat, in any case, the personal saving rate responds very little tochanges in rates of return or in the tax structure. A large part of thepersonal tax reduction would therefore go toward increasing con-sumption.
The most effective avenue at the disposal of the Federal Govern-ment to increase the volume of saving is to reduce taxes on businessincome. Cuts in business taxes would lower government saving, but alarge part of the tax cut would flow into business saving. Businessafter-tax cash flow would be increased. In time, part of the increasedcash flow would lead to higher corporate dividends. A very largepart, however, would be allocated to an increase in retained earn-ings—i.e., saving. Evidence suggests, for example, that corporationssave more than 50 cents from every additional dollar of after-taxincome. Furthermore, some portion of any dividend increase wouldfind its way into personal saving. By contrast, giving the tax cut di-rectly to households would have a smaller effect on saving becausehouseholds are likely to save a much smaller fraction of every dollar ofadditional disposable income.
It seems wise, then, to focus government efforts on the sector mostlikely to allocate a large part of any tax relief to saving—business. Abusiness tax cut would result in relatively large saving, and incentivesto expand investment demand would simultaneously be improved. Itis this approach that lies at the heart of the President's Economic Re-vitalization Program.
THE INTEGRATION OF DEMAND-SIDE AND SUPPLY-SIDEPOLICIES
Tax reductions which induce additional saving and investment willcontribute to faster productivity growth, and this in turn will helpreduce inflation. A number of critical questions arise, however, in de-termining the appropriate type, magnitude, and timing of any tax re-ductions. First, what kind of an increase in productivity might reason-ably be expected from investment-oriented tax cuts of various sizes,and what would be the associated reduction in inflation? Second, towhat extent would the improvements in productivity and othersupply-creating aspects of a tax reduction offset the increase in ag-gregate demand they would cause? More generally, how would taxcuts aimed at increasing supply fit into the framework of fiscal re-straint that is required to reduce inflation?
78Digitized for FRASER http://fraser.stlouisfed.org/ Federal Reserve Bank of St. Louis

EXPECTED PRODUCTIVITY GAINS
Although the effect on investment from a given loss of tax rev-enues would vary with the form of the reduction (accelerated depre-ciation, larger investment tax credit, or lower corporate income taxrates), the evidence suggests that each dollar of reduction in annualbusiness taxes might, at the outside and after several years, generateslightly more than a dollar in business fixed investment. To increaseinvestment by 10 percent, a business tax reduction of at least $30 bil-lion—or about 1 percent of GNP—would be necessary. This largervolume of investment, maintained from 1981 through 1985, wouldincrease the capital stock by about 5 percent after allowing for depre-ciation. On the basis of the historical relationships between outputand capital, such an addition to the capital stock might generate atotal increase in the level of productivity of at most 1.5 percent by1985, or about 0.3 percent per year. In view of the declining rate ofproductivity growth which the Nation has experienced in recentyears, however, this small improvement would be significant.
Such a rise in the productivity growth rate would not be likely toinduce a faster rise in money wage demands. Therefore, since thegrowth of unit labor costs is equal to the increase in compensationper hour minus the rate of growth in productivity, the faster produc-tivity growth rate should lead to a slower rise in costs and prices. Inturn, a slower rise in prices would help to reduce the growth ofwages, leading to a still further slowdown of inflation. All told, an in-vestment-oriented tax cut amounting to about 1 percent of GNPmight produce a 0.3 percentage point rise in productivity growth thatwould translate, after several years, to just over one-half percentagepoint reduction in the inflation rate.
DEMAND VERSUS SUPPLY RESPONSES TO TAX CUTS
Tax reductions have two principal effects. On the one hand, indi-viduals and firms will buy more goods and services. As a tax cut isspent and respent throughout the economy, the resulting increase innominal GNP will exceed the original tax cut. As a result of this mul-tiplier process, aggregate demand will rise by more than the tax cut.But tax cuts also increase the supply of goods and services. Sincelower tax rates allow individuals and firms to keep a larger fraction oftheir income after taxes, the lower rates affect incentives to work, tosave, and to invest the savings, increasing potential GNP.
Although the magnitude of the multiplier varies according to thenature of the tax cut, aggregate demand typically rises by about twicethe size of a reduction in taxes. Thus, a tax cut equal to 1 percent ofGNP will increase aggregate demand by about 2 percent. To matchthe increase in demand, a 2 percent increase in supply would also be
79Digitized for FRASER http://fraser.stlouisfed.org/ Federal Reserve Bank of St. Louis

required. To the extent that its supply response is less than the addi-tional demand it creates, any tax reduction adds to the pressures ofdemand on the rate of inflation.
But there are two ways in which such tax cuts can be made whilestill restraining demand. First, tax reductions may offset increases inother taxes. As discussed earlier, inflation pushes taxpayers intohigher tax brackets, so that the average effective tax rate—the ratioof tax revenues to GNP—rises. Consumption is depressed and eco-nomic growth reduced. In the years ahead, periodic tax reductionswill therefore be both possible and necessary to keep aggregatedemand from falling. Second, a tax reduction accompanied by Feder-al spending reductions of roughly the same magnitude will notchange aggregate demand; hence, even if the supply response to atax cut is smaller than the demand response, inflationary pressureswill not be generated.
Thus, it is clear that the design and timing of supply-oriented taxcuts depend importantly on the specific relationship between thedemand-side and supply-side responses. If such tax reductions fail togenerate enough supply to offset the additional demand theycreate—and the evidence discussed below suggests this to be thecase, particularly for personal tax reductions—they must then be in-tegrated like any tax cut into policies of demand management.
THE SUPPLY-SIDE RESPONSE TO PERSONAL TAX CUTS
A 10 percent reduction in marginal tax rates on individuals (ap-proximately a $30-billion personal tax cut in 1981) would increasethe total demand for goods and services by $60 billion, or 2 percentof GNP. It could also lead to increases in individual work and savingin response to the lower tax rates and thereby increase potentialGNP. How much of the increase in demand would be matched bysuch increases in supply?
The Supply of LaborThe additional production that results from lowering taxes on
labor income depends both on changes in the quantity of labor sup-plied (i.e., the total number of hours worked) and on changes in theaverage productivity of labor.
Higher after-tax wages make work more attractive. This encouragesnew entrants to join the labor force and those already employed towork longer hours. Since after-tax incomes have risen, however,people can also afford to work less—to take longer vacations or toshorten their workweeks. Whether the former effect would or wouldnot exceed the latter effect is hard to predict. A preponderance ofthe evidence suggests that for adult men the two effects approximate-ly offset each other; that is, a cut in income taxes increases the
80Digitized for FRASER http://fraser.stlouisfed.org/ Federal Reserve Bank of St. Louis
supply of adult men in the work force only slightly, if at all. Women,on the other hand, and particularly married women, respond muchmore strongly to higher wages. In the past, the number of adultwomen in the work force may have increased by as much as 1 per-cent for every 1 percent increase in take-home pay. Although womenare more responsive to changes in their wages than are men, menstill outnumber women in the labor force and on average earn sub-stantially more. Therefore, a reduction in personal income tax rateswould increase the total supply of labor only slightly.
Whether an increase in the labor supply would be accompanied byan increase in productivity is uncertain. While most business invest-ment enhances productivity, an increase in the labor supply wouldnot improve productivity unless it increased the average quality ofwork performed or the intensity of effort. Productivity might actuallyfall as the supply of labor increased if the additional labor supplyconsisted, on balance, of less skilled or less experienced workers.
Alternatively, some have argued that the increased supply of laborfrom high-income, high-productivity workers would outweigh the in-creased supply from other workers, so that the average productivityof the labor force would rise. This could happen if high-productivityworkers were more sensitive to a given percentage change in after-tax earnings, or if the tax reduction represented a larger percentagechange in their take-home pay. Since high-income workers are asmall fraction of the labor force, these influences would have to belarge to alter total productivity significantly. Studies of high-incomeworkers generally do not find them much more responsive to equalpercentage increases in after-tax income. However, a 10 percentacross-the-board reduction in tax rates would also mean a larger per-centage increase in the after-tax earnings for these workers becausetheir households are in high marginal tax brackets. A 10 percent taxcut is, therefore, likely to produce a somewhat larger change in thesupply of high-income workers. Still, even in high-income householdsit is in fact second-income earners—generally those who have lowerproductivity—who are apt to be the most responsive to lower taxrates.
Balancing the two opposing forces—the lack of experience of newworkers and the possibility of a greater-than-average influx of higher-income workers—it seems unwise to assume that the average produc-tivity of the labor force will be improved by a personal tax cut.
Taking all the relevant factors into account, the limited response ofthe supply of labor and of productivity to a 10 percent reduction inpersonal income tax rates is likely to produce an increase in potentialGNP of perhaps 0.2 percent to at most 0.6 percent. This result fol-lows in part from evidence suggesting that such a tax cut would
81Digitized for FRASER http://fraser.stlouisfed.org/ Federal Reserve Bank of St. Louis

induce an increase in labor supply between 0.3 and 1.0 percent. Ac-cording to past relationships between labor and production, such anincrease in labor supply would lead to the modest increase in poten-tial GNP mentioned above.
The Supply of Saving
A reduction in personal income tax rates increases both the incomeout of which an individual worker can save and the after-tax returnto saving. It would also tend to discourage borrowing by reducingthe value of the income tax deduction for interest payments. If theincreases in personal saving find their way into additional businessinvestment, productivity will rise.
Most empirical studies have concluded that changes in personalincome tax rates would have only a small effect on personal saving.At best, a 10 percent reduction in tax rates would increase personalsaving less than 3 percent. This means that the saving rate—the aver-age share of personal saving in disposable income, which over thelast 5 years has averaged 5.7 percent—would rise by no more than0.2 percentage point. The additional saving would at most be equiva-lent to only about 0.2 percent of GNP.
Even if every dollar of personal saving that resulted from a 10 per-cent tax cut were invested in business plant and equipment—andsome, in fact, would flow into housing—the effects on output and onproductivity would be small. If the tax cut and the higher saving con-tinued for 5 years, the additional saving and investment would in-crease potential GNP by less than 0.3 percent and lead to a negligi-ble increase in the annual rate of productivity growth.
This examination of likely responses thus suggests that even underthe most optimistic circumstances, a 10 percent reduction in tax rateswould not induce enough additional work, saving, or investment tooffset more than a fraction of the 2 percent increase in aggregatedemand that would accompany the tax cut.
BUSINESS TAX CUTS
It was pointed out earlier that a tax cut that liberalized the busi-ness depreciation allowance or increased the investment tax creditcould, after a time, have a fairly substantial effect on the Nation'sproductive potential. Such a tax cut, amounting to 1 percent of GNP,could raise potential output by perhaps \xk percent over a 5-yearperiod.
This would still be less than the 2 percent rise in aggregatedemand that would also be generated, however. More important, theincrease in demand would come relatively quickly, most of it withinlVa to 2 years. The increase in supply, on the other hand, wouldoccur very gradually. As a consequence, the tax cut would tend to
82Digitized for FRASER http://fraser.stlouisfed.org/ Federal Reserve Bank of St. Louis

increase demand pressures, especially in the years immediately fol-lowing it. While tax reductions that are effective in raising investmentare essential in a long-term strategy to promote economic growth,business tax cuts, like personal tax cuts, must be designed to fit intoan overall framework of fiscal restraint.
CONCLUSIONS
This analysis of the macroeconomic effects of Federal tax reduc-tions suggests several conclusions for the development of fiscalpolicy:
First, specific investment-oriented tax reductions for business arelikely to increase saving, investment, and productivity by a muchmore significant degree than cuts in personal income taxes.
Second, productivity-oriented tax reductions will yield improvementsin the inflation rate that are helpful and significant, but still relativelymodest in the context of a 10 percent underlying inflation rate.
Third, the supply response, while a critically important feature ofany tax reduction, will be substantially less than the demand re-sponse, particularly in the short run.
Fourth, since reductions in both business and personal taxes will in-crease demand faster than supply, they must be designed and carriedout in ways that are consistent with the demand restraint needed toreduce inflation.
It is sometimes alleged that the potentially inflationary effects of alarge tax cut can be avoided if the Federal Reserve steadfastly pur-sues its goal of keeping the growth of the monetary aggregateswithin tight targets. But if taxes are reduced while the Federal Re-serve pursues an unchanged monetary policy, aggregate demand willnevertheless increase, especially in the short run. The increase indemand would lead to a rise in interest rates that would dampen theincrease in aggregate demand but not eliminate it. Additional infla-tionary pressure would then result.
A very large tax cut unaccompanied by the necessary spending cutswould lead to both an increase in inflation and a sharp rise in inter-est rates. Some, and perhaps all, of the stimulus to investment fromtax reductions would be undone by the higher interest rates and thegreater uncertainty engendered by a new round of inflation.
Monetary restraint is an absolutely essential element of inflationcontrol and reduction. Tax measures focused on increasing supplycan make a significant contribution. But there will be a continuingneed for careful and prudent fiscal policies to restrain demand. Inrecent years the Nation has come to appreciate the potential value ofsupply-oriented tax policies. In the process of learning some neededlessons about supply-side economics, however, the Nation cannot
83Digitized for FRASER http://fraser.stlouisfed.org/ Federal Reserve Bank of St. Louis

afford to forget its hard-learned lessons about the need for demand-side restraint.
The three central elements of a macroeconomic policy to reduceinflation and advance the Nation's prospects for healthy economicgrowth have been set forth in this chapter: maintaining a persistentand prudent course of demand restraint; putting in place an im-proved incomes policy using tax incentives to induce wage modera-tion; and increasing the share of the Nation's output going to invest-ment. The next chapter deals with the challenge of inflation andgrowth at the level of individual markets and sectors. It concentrateson measures to increase the economy's flexibility and capacity for ad-justing to change.
Carrying out these policies will require patience and, in the inter-im, some sacrifice. But if they are followed with persistence theypromise a substantial payoff in improved economic performance.
TECHNICAL APPENDIX TO CHAPTER 1
MEASURING PAY INCREASES UNDER A TIP
Once the basic features of a pay TIP have been chosen, severalproblems in the measurement of average pay increases must besolved. These problems arise from changes in the composition of afirm's work force, from fringe benefits, and from multiyear unioncontracts with cost-of-living adjustments. Resolving these problemsrequires striking a balance among administrative convenience, equity,efficiency, and the effect on inflation.
COMPOSITION OF THE WORK FORCE
Like any well-designed tax, a successful TIP must use a measure ofaverage pay increase that is unambiguous, that alters behavior in un-desirable ways as little as possible, and that is fair in its treatment ofdifferent types of firms and workers. The simplest indicator of aver-age pay—total wages received by a group of workers divided by thetotal number of hours they work—is a poor measure because itchanges both with hourly wage rates and with the number of over-time hours. Even if wage rates increased by less than the TIP stand-ard, an increase in the average amount of overtime, paid at a premi-um, could put the group out of compliance. Using this measurewould therefore discourage overtime work, an undesirable distortion.A better measure would use straight-time wages divided by straight-time hours, with adjustments to reflect changes in the length of thestandard workweek or the size of the overtime premium.
Because of possible changes in the composition of the group, how-ever, a simple measure of straight-time wages divided by straight-
84Digitized for FRASER http://fraser.stlouisfed.org/ Federal Reserve Bank of St. Louis

time hours also has drawbacks. For example, during a recession afirm may grant a pay raise far below the TIP standard and also layoff large numbers of low-seniority workers. Because low-seniorityworkers tend to have below-average wages, the remaining workerswill have higher wages than the original group. Consequently, thismeasure of wage change may well show that the increase in averagepay exceeded the standard even if no individual worker received sucha large raise. Conversely, when firms hire additional low-seniority,low-wage workers during expansion, the group may appear to be incompliance even if all continuing workers receive pay raises abovethe standard.
This measure is also affected by changes in the skill-mix of thework force. If a firm increases the proportion of low-wage, lessskilled workers in its work force, the measure will show a calculatedwage increase less than the "true" wage increase. A decrease in theproportion of less skilled workers will show just the opposite. Be-cause of these features, the measure also discriminates in favor ofgrowing firms and against declining firms, since new workers are, onaverage, likely to be paid less than those already on the payroll.
More important, this measure introduces an element of uncertain-ty. A firm could agree with its workers to grant pay increases thatmet the standard—citing the TIP reward as an offsetting factor—andthen unexpectedly discover at the end of the year that small changesin the composition of the work force had put the group out of com-pliance. Firms and workers who had negotiated small pay raises inanticipation of receiving a TIP reward or avoiding a penalty mightfind themselves above the standard, while others who had ignoredthe standards could be surprised to find themselves in compliance.An unpredictable measure is not only unfair; it also will have lesseffect, since firms and workers will tend to ignore the standard ifthey cannot be sure that small pay raises will result in compliance.
Data collected by the Bureau of Labor Statistics from a largesample of establishments suggest that significant changes in the com-position of a firm's work force are common. As Table 10 shows, 22percent of the workers in the motor vehicle industry were in estab-lishments that experienced an increase in their calculated straight-time hourly earnings of more than 13 percent between December1978 and December 1979. During this period the United Auto Work-ers' contract, which covered a majority of the workers in these estab-lishments, provided for an increase of about 11 percent, includingcost-of-living adjustments (COLAs). Therefore, most of the establish-ments with increases in calculated average hourly earnings largerthan this must have experienced a change in the composition of theirwork force.
85Digitized for FRASER http://fraser.stlouisfed.org/ Federal Reserve Bank of St. Louis

TABLE 10.—Distribution of workers by percentage change in average establishment wage, selected
manufacturing industries, December 1978 to December 1979
Percentage change in average establishment wage
Less than 0 .
0 to 6.9
7 0 to 9 9
10.0 to 12.9
13.0 to 19.9.. . . .
20 and over
Allmanufacturing Motor vehicles Food
processing
Percent distribution
5.1
18.6
27.4
25.4
17.2
6.3
5.9
7.8
19.3
44.8
13.7
8.5
8.5
24.8
28.6
17.8
13.2
7.1
Source: Department of Labor, Bureau of Labor Statistics.
Additional evidence suggesting large shifts in the composition ofthe work force is provided by the percentage of workers in establish-ments who experienced actual declines in their average nominalwage. For all manufacturing, 5.1 percent of workers were in estab-lishments that reported declining money wage rates, and 8.5 percentof those in food processing were in establishments that reportednominal wage declines. It is hard to believe that such a large percent-age of workers were in establishments that actually cut the averagenominal wage for their entire work force during a period in whichthe CPI rose by 13.3 percent.
Clearly, a satisfactory measure of wage changes will be one that isnot affected by systematic changes in work force composition. Theproblem can be solved either by a wage index or by a measure thatcounts only the hours and payroll for those workers who were withthe firm throughout the year. A wage index, like a price index, com-bines the wage rates for specific types of jobs into one measure. Theweights used reflect the percentage of a firm's workers in each skillor seniority level. A wage index reflects the "true" average pay in-crease for all employees and is not affected by changes in composi-tion or seniority. Such an index would be relatively easy to constructfor many firms. Union contracts already set wage rates for specificjobs. Some large nonunion firms and many States and local govern-ments also have pay scales that list the salary levels of workers ineach job category and seniority step.
These union and nonunion pay scales could be used with the baseperiod percentages of workers in each job category to calculate afirm's average pay raise, just as a price index is used along with abase period market basket of goods to measure price increases. Toensure that the firms did not give raises above the standard by pro-moting workers, rates of promotion above past experience would beincluded in the calculation of pay raises. Doing so, of course, may
86Digitized for FRASER http://fraser.stlouisfed.org/ Federal Reserve Bank of St. Louis

reintroduce the problem of changing skill mix if the additional pro-motions reflect an upgrading of skills.
Nonunion firms that do not have pay scales could calculate theiraverage pay raise from the wages and hours of those workers whocontinued to work for the firm throughout the year. Such a measurewould not be affected by changes in the composition of the workforce, since the wage rates of former or new employees would notenter into the calculation. Because firms generally hire new workersat the bottom and retire or lose workers from the top, the averagepay raise for continuing workers will exceed the average pay raise forall workers in a firm with stable composition but high turnover.Therefore, measures for continuing workers must be adjusted toallow for promotions.
MEASURING FRINGE BENEFITS
A critical element in the measurement of pay increases is the treat-ment of fringe benefits. The cost of a given package of fringe bene-fits can increase for either of two reasons: because the package hasbecome more generous (the employer is buying more services for theemployees) or because the price of a given set of services has risen.For example, an employer who adds dental benefits onto the healthinsurance provided for employees would increase the cost of healthinsurance by improving the package of benefits. Health insurancepremiums might also rise for a given set of benefits simply becausemedical care in general becomes more expensive.
Which increases in the costs of fringe benefits should the TIP in-clude as increases in compensation? One approach is to include allincreases in the cost of fringe benefits, both those that reflect higherprices for a fixed package as well as those that reflect improvementsin the package. This would treat each dollar paid in fringe benefitsexactly like a dollar paid in cash wages. Such an approach, however,would require extensive work to evaluate the cost of all benefits. Al-though determining the cost of fringe benefits purchased from otherorganizations, such as medical insurance, would be simple, determin-ing the cost of other fringes, like unfunded pension benefits, wouldbe more difficult. Another drawback is that firms and workers mightobject to being ruled out of compliance for cost changes they couldnot control, such as the cost of employer health plans.
An alternative treatment would be to exclude fringe benefits com-pletely from the calculation of a group's average pay raise. Thiswould involve the fewest administrative problems. It would, however,provide a strong incentive for firms to give all increases above thestandard in the form of fringes rather than cash, since the groupwould be in compliance as long as cash remuneration did not in-crease by more than the standard. This would defeat the purpose of
87Digitized for FRASER http://fraser.stlouisfed.org/ Federal Reserve Bank of St. Louis

the TIP and would also distort the structure of labor compensationfor a long period.
A compromise solution would be to include only the cost of im-provements in benefit packages. For example, the cost of new medi-cal benefits would be charged against the standard but increases inthe cost of existing benefits would not. This would reduce the diffi-culty of estimating the costs of some types of fringes without creatingan incentive to divert all pay increases above the standard into bene-fit improvements. Although fringes would still be treated more gen-erously than cash wages, this compromise would eliminate a certainamount of paperwork.
MULTIYEAR CONTRACTS
A third problem in measuring wage increases is the evaluation ofnew multiyear union contracts. A TIP will have its greatest effect onthe wage settlement if the firm and union know when they are bar-gaining whether the contract's provisions are in compliance with thestandard. For this reason, and to prevent firms and unions from post-poning large wage increases to the later years of a contract in orderto be in compliance during the first year, the entire contract wouldhave to be evaluated in advance. Since most major union contractsinclude COLAs, evaluating wage increases in new multiyear contractsrequires predicting future price inflation. (A TIP can have no directeffect on pay increases in existing multiyear union contracts. There-fore, they can be evaluated at year-end like the pay increases of non-union workers.)
Because the number chosen will affect expectations and thus willaffect the success of the TIP, there may could be a temptation to usean overly optimistic prediction of future price increases. If this oc-curred, union workers with COLAs would often be judged to be incompliance but then receive wage increases above the standard be-cause the actual price increase exceeded the prediction used to evalu-ate the COLA. This would seem unfair to firms and workers who donot have COLAs and, if substantial, would set in motion catch uppressures on the part of nonunion workers that could increase infla-tion in subsequent years. To some extent, these considerations arecounterbalanced by the fact that union workers would have to re-strain their wage increases for a 2- or 3-year contract period in orderto be in compliance with a TIP that may only last 1 year.
88Digitized for FRASER http://fraser.stlouisfed.org/ Federal Reserve Bank of St. Louis