inferences and weight of evidence - icrp garnier-laplace establishing...inferences and weight of...
TRANSCRIPT
inferences and weight of evidence
October 22-24, 2013 – Abu Dhabi, UAE
GARNIER-LAPLACE Jacqueline*, ALONZO Frédéric and ADAM-GUILLERMIN ChristelleInstitute for Radioprotection and Nuclear Safety,
IRSN/PRP-ENV/SERIS, Cadarache, France*ICRP C5 2013-2017 [email protected]
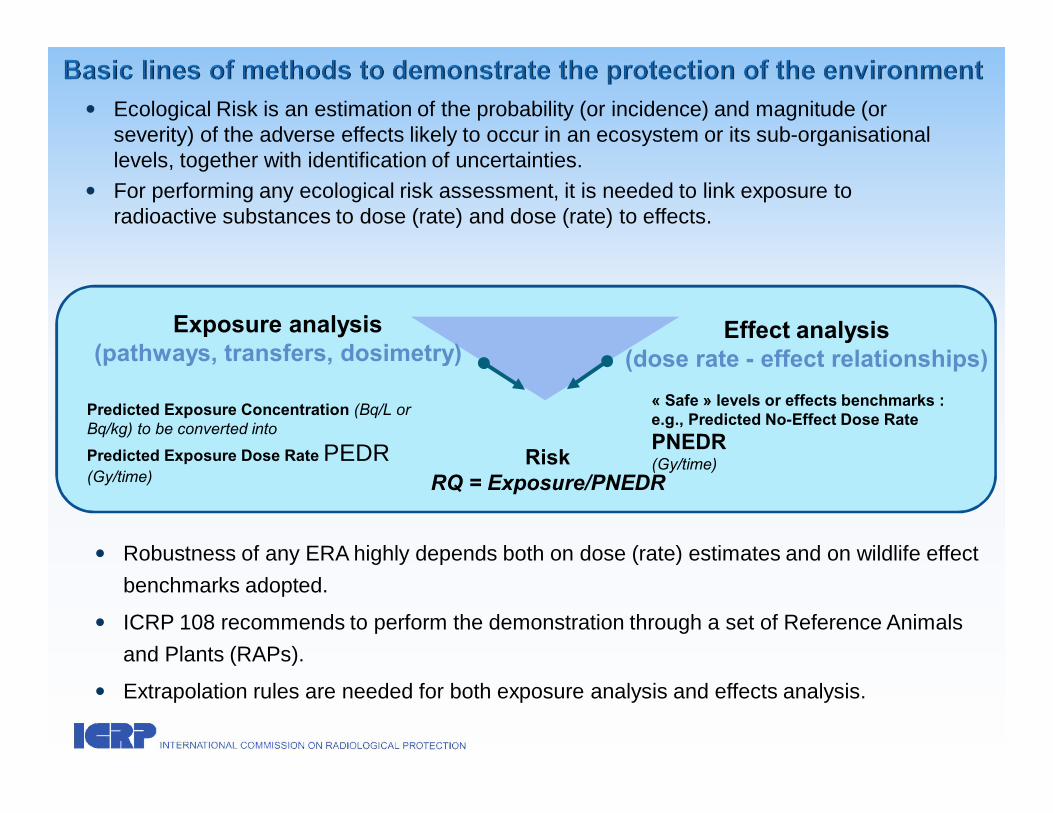
� Ecological Risk is an estimation of the probability (or incidence) and magnitude (or severity) of the adverse effects likely to occur in an ecosystem or its sub-organisational levels, together with identification of uncertainties.
� For performing any ecological risk assessment, it is needed to link exposure to radioactive substances to dose (rate) and dose (rate) to effects.
Exposure analysis(pathways, transfers, dosimetry)
Effect analysis(dose rate - effect relationships)
Predicted Exposure Concentration (Bq/L or Bq/kg) to be converted into
Predicted Exposure Dose Rate PEDR(Gy/time)
« Safe » levels or effects benchmarks : e.g., Predicted No-Effect Dose Rate PNEDR(Gy/time)
� Robustness of any ERA highly depends both on dose (rate) estimates and on wildlife effect benchmarks adopted.
� ICRP 108 recommends to perform the demonstration through a set of Reference Animals and Plants (RAPs).
� Extrapolation rules are needed for both exposure analysis and effects analysis.
RiskRQ = Exposure/PNEDR

� ERICA, PROTECT and EMRAS II Effect Group have prepared data and proposed a methodology for deriving “the Predicted No-Effect Dose Rate” (PNEDR of 10 µGy/h -0.24mGy/d): dose rates below this value are unlikely to have any population effects – to screen away such exposure situations
� UNSCEAR has published recommendations - e.g., 100 µGy/h – 2.4 mGy/d to the most exposed individuals would have unlikely effects on most terrestrial communities
� ICRP has proposed Derived Consideration Reference Levels for RAPs – bands of low probability of effects (i.e. where there is likely to be some chance of deleterious effects on individual RAP) as Points of Reference.
Garnier-Laplace et al., JER 2010
Garnier-Laplace et al., ES&T 2006; Larsson, JER 2008; Andersson et al., JER 2009
UNSCEAR, 2008
ICRP 108, 2008
� All benchmarks are based on analysis of various dose (rate)- response relationships for a variety of species from plants, invertebrates and vertebrates wildlife groups and of biological endpoints covering mortality, morbidity, reproduction and mutation.
� Several methods have been used for this analysis of dose(rate)-response relationships
� per species representative of a family of species (ICRP approach),
� per sets of species representative of the biodiversity existing among a larger assemblage, a wildlife group or an ecosystem (UNSCEAR, ERICA-PROTECT),
� All based on extrapolations.

Responses (nature, intensity) to radiation exposure vary:
� From one type of radiation to another (up to ca. x50)
� From acute to chronic exposure (ca. 1-2 orders of magnitude); from one single generation to mutiple generations
� Among cell types and tissues
� Among biological endpoints (reproduction recognized as the most sensitive endpoint)
� Among life stages (embryos, larvae, juveniles most sensitive)
� Among levels of biological organisation
� Among species (up to 6 orders of magnitude)
� From lab to field
Ecosystem:structure & function
Communities:Populations of species
Species:Population
Individual (sub)

1 2 … maxp max-1…p-1
S1 S2 Sp-1 Smax-1Sp
fp fmaxfmax-1
è Number of age classes
è Survival rates
è Fecundity rates (adults)
(all life stages)
▌ Simplified representation of life cycle and population by age classes
hatchingor birth
maturity
EGGSTAGE
JUVENILESTAGE
ADULTSTAGE
è 3 life stages defined: egg, juvenile and adult
▌ Principle : For a given species, combining individual dose-response curves to infer the population level by using Leslie matrices
▌ Parameters for the Leslie matrices
0 0 … fp fp+1 … fmax-1 fmax
S1 0 0 0 0 0 0 00 S2 0 0 0 0 0 00 0 … 0 0 0 0 00 0 0 Sp 0 0 0 00 0 0 0 Sp+1 0 0 00 0 0 0 0 … 0 00 0 0 0 0 0 Smax-1 Smax
Transition matrix
N(t+∆)= x N(t)

Effect on fecundity
Applied as a reductionin fecundity rates
fp fmaxfmax-1
Change in endpoint
Dose rate
EDR10
Effect on survival
Applied as a reductionin survival rates
in juvenile and adult stages
Change in endpoint
Dose rate
EDR10
Effect on hatching
Applied as a reductionin survival rates
in egg stage
Change in endpoint
Dose rate
EDR10
hatchingEGG
STAGEJUVENILE
STAGEADULTSTAGE
S1 S2 Sp+1 Smax-1Sp
Selection and application of radiation effects to the population(e.g., chronic external gamma irradiation)
1 2 … maxp max-1…p-1
maturity

maturityhatching
EGGSTAGE
JUVENILESTAGE
ADULTSTAGE
S1 S2 Sp+1 Smax-1Sp
1 2 … maxp max-1…p-1
fp fmaxfmax-1
è Combine observed effects among several individual (fitness-related) endpoints
è Model population growth rate λ and individual reproductive rate R0 (number of offspring per individual over a lifetime ) at any dose rate
è Predict dose rates causing population extinction (λ≤1)
èMolecular, cellular and histological damages were not integrated…
è For a species, allow a comparison between radiosensitivity at the individual level and radiosensitivity at the population level

� Population-level effects depend both on:� how key biological functions are affected by radiotoxicity at the organism
level and � how population dynamics respond to such effects.
� The same level of effect could have different consequences for the population depending on the impaired individual endpoint and on life history strategies.
� The most influential individual endpoint for population dynamics is not necessarily the most radiosensitive.
� A modeling exercise on various species demonstrated three types of situations where the most radiosensitive individual endpoint is :
(1) an overestimation of the population radiosensitivity.Or (2) a good proxy of the population radiosensitivity.Or (3) an underestimation of the population radiosensitivity.
Alonzo et al., JER 2008; Massarin et al., ES&T 2010; Lance et al., STOTEN 2012; STAR D5.2 2012

0 0 … fp fp+1 … fmax-1 fmax
S1 0 0 0 0 0 0 00 S2 0 0 0 0 0 00 0 … 0 0 0 0 00 0 0 Sp 0 0 0 00 0 0 0 Sp+1 0 0 00 0 0 0 0 … 0 00 0 0 0 0 0 Smax-1 Smax
A terrestrial mammal Mus musculusUnisexualGestation time 0.6 monthsLifespan 28 months5.4 litters/y of 7 young EDR10= 980 µGy/h
EDR10= 2200 µGy/h
EDR10= 2800 µGy/h
EDR10= 26 µGy/h
Ex1: The most radiosensitive individual endpoint is an overestimation of the population radiosensitivity
Combined consequences for individual R0 and population λ
R0-loEDR= 340 µGy/h
λ-loEDR= 140 µGy/h
Effect on fecundity
Effect on hatching
Effect on survival
STAR D5.2 2012

0 0 … fp fp+1 … fmax-1 fmax
S1 0 0 0 0 0 0 00 S2 0 0 0 0 0 00 0 … 0 0 0 0 00 0 0 Sp 0 0 0 00 0 0 0 Sp+1 0 0 00 0 0 0 0 … 0 00 0 0 0 0 0 Smax-1 Smax
A terrestrial mammal Mus musculusUnisexualGestation time 0.6 monthsLifespan 28 months5.4 litters/y of 7 young EDR10= 980 µGy/h
EDR10= 2200 µGy/h
EDR10= 2800 µGy/h
EDR10= 26 µGy/h
Ex1: The most radiosensitive individual endpoint is an overestimation of the population radiosensitivity
Combined consequences for individual R0 and population λ
R0-loEDR= 340 µGy/h
λ-loEDR= 140 µGy/h
Effect on fecundity
Effect on hatching
Effect on survival
Dose rates giving the lowestsignificant changes in R0 and λ are higher than the lowest individualEDR10 by a factor ca. 13 and 5 respectively.
Population is protected whenindividuals are protected
ICRP DRCL Reference rat
0.1-1 mGy/d or 4-40 µGy/his appropriate for individual level
1-10 mGy/d or 40-400 µGy/his appropriate for population level

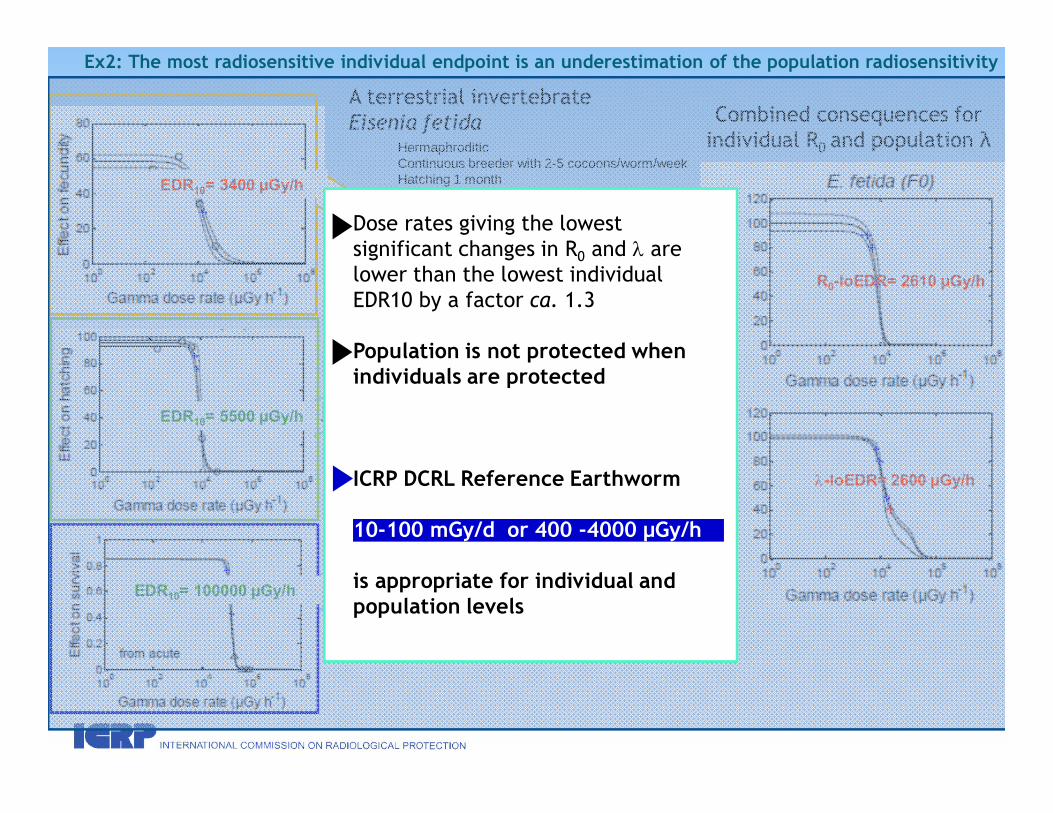
A terrestrial invertebrate Eiseniafetida
HermaphroditicContinuous breeder with 2-5 cocoons/worm/weekHatching 1 monthMaturity 3 monthsLifespan 20 months
EDR10= 5500 µGy/h
Ex2: The most radiosensitive individual endpoint is an underestimation of the population radiosensitivity
Combined consequences for individual R0 and population λ
R0-loEDR= 2610 µGy/h
λ-loEDR= 2600 µGy/h
0 0 … fp fp+1 … fmax-1 fmax
S1 0 0 0 0 0 0 00 S2 0 0 0 0 0 00 0 … 0 0 0 0 00 0 0 Sp 0 0 0 00 0 0 0 Sp+1 0 0 00 0 0 0 0 … 0 00 0 0 0 0 0 Smax-1 Smax
Effect on fecundity
Effect on hatching
Effect on survival
EDR10= 3400 µGy/h
EDR10= 100000 µGy/h
STAR D5.2 2012
0 0 … fp fp+1 … fmax-1 fmax
S1 0 0 0 0 0 0 00 S2 0 0 0 0 0 00 0 … 0 0 0 0 00 0 0 Sp 0 0 0 00 0 0 0 Sp+1 0 0 00 0 0 0 0 … 0 00 0 0 0 0 0 Smax-1 Smax
A terrestrial invertebrate Eisenia fetida
HermaphroditicContinuous breeder with 2-5 cocoons/worm/weekHatching 1 monthMaturity 3 monthsLifespan 20 months
EDR10= 5500 µGy/h
Ex2: The most radiosensitive individual endpoint is an underestimation of the population radiosensitivity
Combined consequences for individual R0 and population λ
R0-loEDR= 2610 µGy/h
λ-loEDR= 2600 µGy/h
Effect on fecundity
Effect on hatching
Effect on survival
EDR10= 3400 µGy/h
EDR10= 100000 µGy/h
Dose rates giving the lowest significant changes in R0 and λ are lower than the lowest individual EDR10 by a factor ca. 1.3
Population is not protected when individuals are protected
ICRP DCRL Reference Earthworm
10-100 mGy/d or 400 -4000 µGy/h
is appropriate for individual and population levels

� Laboratory data have been preferably used since laboratory conditions offer a robust way to characterize cause-effects relationships
� This was adopted for the EC-funded ERICA-PROTECT suite to derive screening benchmarks consistently with the approach applied for chemicals where laboratory tests have been the main basis of benchmarks until now.
� However, laboratory and semi-field tests constitute a too simplistic way to represent the complex nature: they generally ignore inter-individual and inter-species interactions, variety of routes of exposure and variety of responses from all species.
� Field data are representative of “real world” but they always document on-going or past changes;
� Field observed effects may be caused or modified by simultaneously occurring stressors (issue of confounding factors).
Inter-species extrapolations and lab to field extrapolation issues
Res
pons
e
Dose rate
Hormetic model
EDR10
10% effect on responsecompared to control(Dose rate = 0)
0
10
20
30
40
50
60
70
80
90
100
1 10 100 1000 10000 100000 1000000
Percentage of Affected Fraction (%)
Cap
ra h
ircus
Sus
cro
fa
Rat
tus
norv
egic
usM
us m
uscu
lus
Oph
ryot
roch
a di
adem
a
Ple
uron
ecte
s pl
ates
sa
Poe
cilia
retic
ulat
aN
eant
hes
aren
aceo
dent
ata
Sol
anum
tube
rosu
m
Can
is fa
mili
aris Viti
s vi
nife
raP
inus
rigi
daP
orce
llio
scab
er
Abi
es b
alsa
mea
Ory
zias
latip
esO
ncor
hync
hus
tsha
wyt
scha
Pis
um s
p.D
ahlb
omin
u sp
.E
isen
ia fe
tida
Laru
s rid
ibun
dus
Phy
sa h
eter
otro
pha
Gal
lus
dom
estic
us.
Triti
cum
sp.
Pin
us b
anks
iana
Mer
cena
ria m
erce
naria
.D
aphn
ia m
agna
Fago
pyru
m e
scul
entu
a.
Hor
deum
sp.
Cal
linec
tes
sapi
dus.
Dap
hnia
pul
ex.
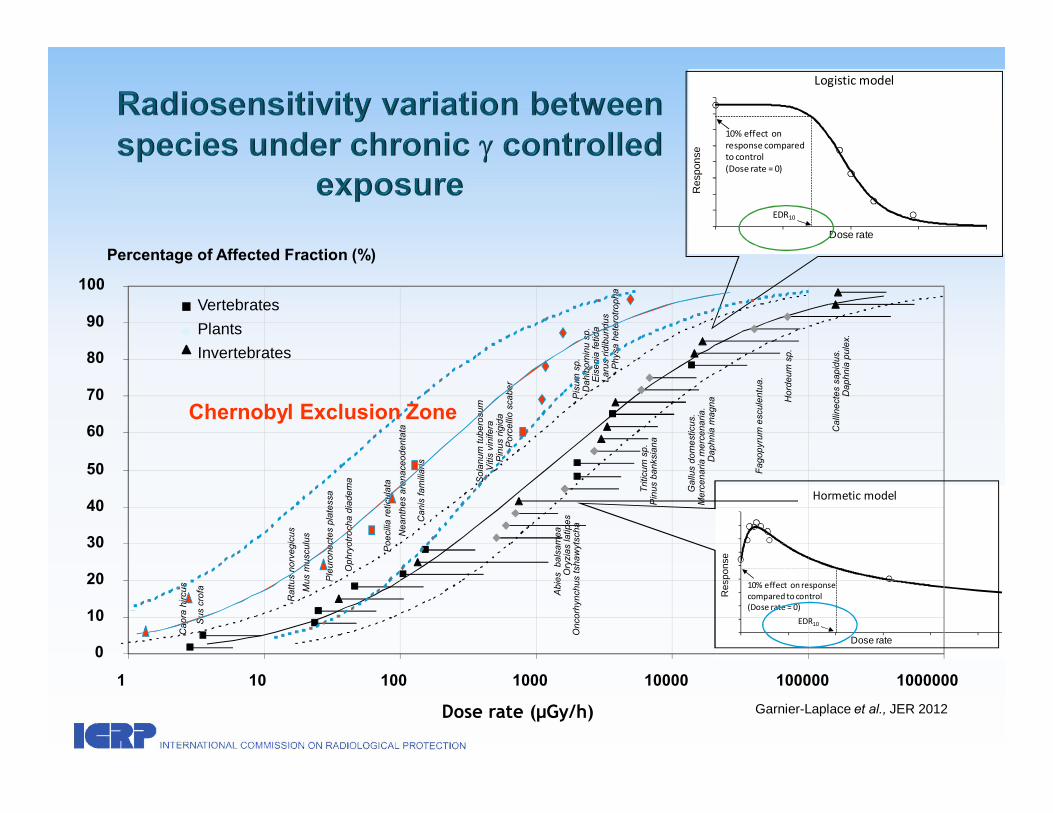
VertebratesPlantsInvertebrates
Dose rate (µGy/h)R
espo
nse
Dose rate
Logistic model
10% effect onresponse compared to control(Dose rate = 0)
EDR10
Chernobyl Exclusion Zone
Garnier-Laplace et al., JER 2012

� Predicting radiological consequences at the population level in wildlife species requires knowledge on:� exposure conditions,� life history characteristics of the organism exposed,� integration over time of a time-dependent absorbed dose,� and combination of dose-response relationships on impaired individual endpoints.� Multigenerational effects need to be studied.
� Research on primary mechanisms of interactions between ionising radiation and living organisms (from biomolecules up to populations) is still needed.
Conclusion, Perspectives
Effects on energy budget� Advanced biology-based models such as DEBtox will be used to analyse radiation effects as dynamic processes in organisms� DEB describes how individuals acquire and
use energy based on simple rules for metabolism.
� DEBTox is a biology-based model describing how toxicants accumulate over time in exposed organisms and alter energy acquisition and allocation to growth and reproduction. Consequences for survival,
growth and reproduction

Phot
o by
Jea
n-M
arc
Bon
zom
, IR
SN
http://www.radioecology-exchange.org

www.icrp.org