inequality, well-being and inclusive growth · this section of the gap analysis considers the...
TRANSCRIPT
PIN – 04
Evidence Review
Inequality, Well-being and Inclusive Growth
Dr Leaza McSorleyGlasgow Caledonian University [email protected]
www.productivityinsightsnetwork.co.uk
www.productivityinsightsnetwork.co.uk
www.productivityinsightsnetwork.co.uk
2
About PIN The Productivity Insights Network was established in January 2018 and is funded by the Economic and Social Research Council. As a multi-disciplinary network of social science researchers engaged with public, private, and third sector partners, our aim is to change the tone of the productivity debate in theory and practice. It is led by the University of Sheffield, with co-investigators at Cambridge Econometrics, Cardiff University, Durham University, Glasgow Caledonian University, SQW, University of Cambridge, University of Essex, University of Glasgow, University of Leeds and the University of Strathclyde. The support of the funder is acknowledged. The views expressed in this report are those of the authors and do not necessarily represent those of the funders.
www.productivityinsightsnetwork.co.uk
www.productivityinsightsnetwork.co.uk
3
Table of Contents Introduction .............................................................................................................................. 4 Well-being, inequality, inclusive growth and productivity .......................................................... 4 Well-being and productivity ...................................................................................................... 5 Inequality and productivity........................................................................................................ 8 Inclusive growth and productivity ........................................................................................... 10 Measures of productivity in the context of well-being, inequality and inclusive growth ............ 11 Conclusion ............................................................................................................................. 13 Bibliography ........................................................................................................................... 14
www.productivityinsightsnetwork.co.uk
www.productivityinsightsnetwork.co.uk
4
Introduction The UK’s Productivity Puzzle has gained increased prominence over the past few years as politicians, business, and policy-makers seek to better understand the underlying factors affecting UK productivity, why the UK performs relatively weakly to comparator countries, and to seek new ways to boost the UK economy as it enters another period of economic transition and uncertainty as it leaves the EU. From the literature, focused mainly on advanced European economies and the US, the current thinking on the drivers of weak productivity are: • Mismeasurement (Coyle 2017) - this is particularly identified as an issue for the UK due the
relative size of the UK’s service sector. The view being that services are not measured as effectively as tangible goods. • Weak investment - related to the financial crisis, and longer term structural changes • Hysteresis - “a long-term effect of recession on output due to reduced capital accumulation,
scarring effects on workers through job loss, and disruptions to economic processes underlying technological progress” (Bryson and Forth 2016: 167). • Long tail of low productivity firms - the US literature refers to low productivity firms as ‘zombie
firms’ i.e. firms that are surviving but under more competitive circumstances would have gone out of business due to their low productivity and lack of competitiveness. In the UK this divergence of productivity has clear sectoral and geographical dimensions • Technological and digital diffusion - the rate of adoption of new technologies across
industries and within firms • Business concentration - in the US the rise of the ‘superstar’ firm and their monopsonistic
power are viewed to be skewing the productivity distribution • Declining business dynamism (Furman 2017) - also linked to this is a less ‘dynamic’ and
less mobile workforce, showing reluctance to change jobs post-recession • A shift towards less productive sectors - this requires further detailed analysis for the UK to
identify the sectors in which the new jobs have been created (self-employment, distribution) versus the jobs that were lost during the recession (financial services, construction, public sector) • Reduced productivity in a few key high GVA sectors (McKinsey 2018) • Secular stagnation - a predominantly US phrase to explain stagnating economic growth and
stagnating wages (Stansbury and Summers 2018). Well-being, Inequality, Inclusive Growth and Productivity This section of the gap analysis considers the evidence on the links between well-being, inequality, inclusive growth and productivity. In the UK the slowdown in productivity growth has been accompanied since the financial crisis by stagnating real wages, rising income and wealth inequality, and austerity. The OECD (2016: 5) highlights that going forward for OECD countries “there is no guarantee that the benefits of higher levels of growth, or higher levels of productivity in certain sectors, when they materialise, will be broadly shared across the population as a whole. On the contrary, there is a risk of a vicious cycle setting in, with individuals with fewer skills and poorer access to opportunities often confined to operate in low productivity, precarious jobs”. This ‘vicious cycle’ thereby may undermine efforts to improve productivity and economic growth, and risk further polarisation of the benefits of improved productivity.
www.productivityinsightsnetwork.co.uk
www.productivityinsightsnetwork.co.uk
5
This poses an important question for productivity research. Can the distribution of productivity gains contribute to reducing inequalities, improving societal well-being and delivering inclusive growth? As with the income level of a country it is the distribution of that income that provides a more detailed picture of living standards, quality of life and the broader welfare of the economy. Economists such as Picketty 2014, Atkinson 2015 and Stiglitz 2012 have brought attention to the inequalities of income and wealth. This gap analysis seeks to identify what we know about productivity and inequality and what further research is needed. Well-Being and Productivity Firstly, the concept of well-being will be examined, followed by analysis of current evidence on the direct links between productivity and well-being. The literature on well-being is sizeable. However, specific studies relating to productivity and well-being are lacking. Studies have tended to focus on employee well-being within the firm and how this affects firm-level productivity. This management literature is covered elsewhere within other gap analysis of themes, such as work and employment and management practices within firms. This gap analysis concentrates on economic, regional and labour market well-being. The concept of well-being has become common place in recent years due to critiques of the limitations of GDP as a measure of economic and societal advancement (Coyle 2017, Stiglitz et al 2011). Broader measures of economic welfare such as the United Nations Human Development Index (HDI) have been collating data on indices covering life expectancy, education as well as income per capita since 1990. The HDI was established to shift the focus of development economics from national accounting to people-centred policies (UN 2016). Recently the OECD launched their Regional Well-Being tool, a multi-dimensional framework measuring material conditions (jobs, income, and housing), quality of life indicators (including health, education and environment) and subjective well-being (community and satisfaction), which provides regional data for 395 regions and is based on the OECD better Life Index. The EU also publishes Quality of Life Indicators as well as Europe 2020 indicators measuring employment, environmental and poverty and social exclusion data. Critics may question the usefulness of such multi-dimensional well-being indicators. Given the range of multi-dimensional indicators there may be competing objectives and subjective measures of what improvement is. The ‘dashboard’ approach to welfare indicators may present difficulties in interpreting what constitutes improvement. If several indicators are improving and several other worsening, what constitutes improvement? Is one indicator viewed as being more important than another? Also, critics question whether there are tradeoffs between indicators. This identifies an important gap in well-being research: the need for further policy relevant studies on well-being and productivity. Future studies should provide practical evidence-based research findings which policy-makers, industry, employers and workers can implement. Nonetheless, data from the most recent OECD Better Life index shows us that on average the UK performs relatively well compared to other OECD countries across a range of well-being indicators. The UK’s employment rate at 74% in 2016 is above the OECD average of 67%, and long-term unemployment is lower. Personal safety and social support are above the OECD average. Overall life satisfaction is also above the OECD average. However, it is within the domains or earnings, income and housing affordability that the UK performs poorly. Household disposable income in 2016 was 7% higher than in 2005, despite falling between 2011 and 2014, but income growth remains below the OECD average. The average UK household spends 24% of their disposable income on housing costs, above the OECD average of 21%. Across all indicators of ‘deprivation’ the UK performs poorly, being classified in the top, or middle third, of
www.productivityinsightsnetwork.co.uk
www.productivityinsightsnetwork.co.uk
6
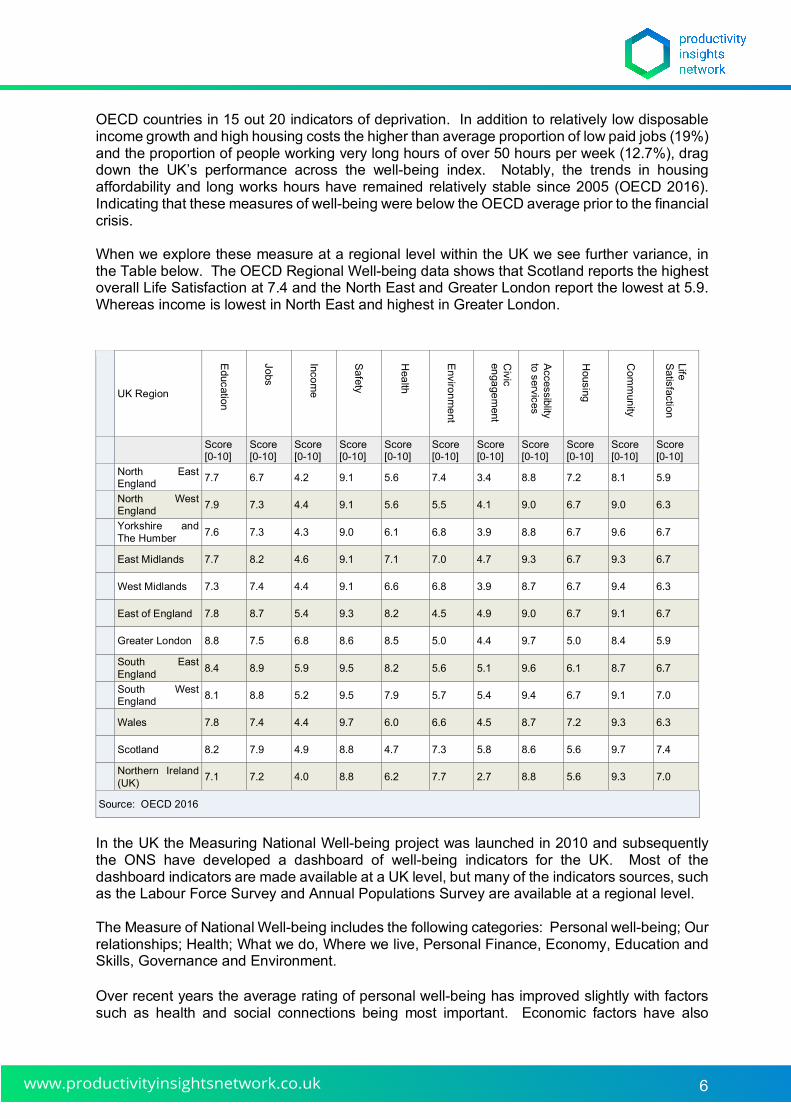
OECD countries in 15 out 20 indicators of deprivation. In addition to relatively low disposable income growth and high housing costs the higher than average proportion of low paid jobs (19%) and the proportion of people working very long hours of over 50 hours per week (12.7%), drag down the UK’s performance across the well-being index. Notably, the trends in housing affordability and long works hours have remained relatively stable since 2005 (OECD 2016). Indicating that these measures of well-being were below the OECD average prior to the financial crisis. When we explore these measure at a regional level within the UK we see further variance, in the Table below. The OECD Regional Well-being data shows that Scotland reports the highest overall Life Satisfaction at 7.4 and the North East and Greater London report the lowest at 5.9. Whereas income is lowest in North East and highest in Greater London.
In the UK the Measuring National Well-being project was launched in 2010 and subsequently the ONS have developed a dashboard of well-being indicators for the UK. Most of the dashboard indicators are made available at a UK level, but many of the indicators sources, such as the Labour Force Survey and Annual Populations Survey are available at a regional level. The Measure of National Well-being includes the following categories: Personal well-being; Our relationships; Health; What we do, Where we live, Personal Finance, Economy, Education and Skills, Governance and Environment. Over recent years the average rating of personal well-being has improved slightly with factors such as health and social connections being most important. Economic factors have also
UK Region
Education
Jobs
Income
Safety
Health
Environment
Civic
engagement
Accessiblity to services
Housing
Com
munity
Life Satisfaction
Score [0-10]
Score [0-10]
Score [0-10]
Score [0-10]
Score [0-10]
Score [0-10]
Score [0-10]
Score [0-10]
Score [0-10]
Score [0-10]
Score [0-10]
North East England 7.7 6.7 4.2 9.1 5.6 7.4 3.4 8.8 7.2 8.1 5.9
North West England 7.9 7.3 4.4 9.1 5.6 5.5 4.1 9.0 6.7 9.0 6.3
Yorkshire and The Humber 7.6 7.3 4.3 9.0 6.1 6.8 3.9 8.8 6.7 9.6 6.7
East Midlands 7.7 8.2 4.6 9.1 7.1 7.0 4.7 9.3 6.7 9.3 6.7
West Midlands 7.3 7.4 4.4 9.1 6.6 6.8 3.9 8.7 6.7 9.4 6.3
East of England 7.8 8.7 5.4 9.3 8.2 4.5 4.9 9.0 6.7 9.1 6.7
Greater London 8.8 7.5 6.8 8.6 8.5 5.0 4.4 9.7 5.0 8.4 5.9
South East England 8.4 8.9 5.9 9.5 8.2 5.6 5.1 9.6 6.1 8.7 6.7
South West England 8.1 8.8 5.2 9.5 7.9 5.7 5.4 9.4 6.7 9.1 7.0
Wales 7.8 7.4 4.4 9.7 6.0 6.6 4.5 8.7 7.2 9.3 6.3
Scotland 8.2 7.9 4.9 8.8 4.7 7.3 5.8 8.6 5.6 9.7 7.4
Northern Ireland (UK) 7.1 7.2 4.0 8.8 6.2 7.7 2.7 8.8 5.6 9.3 7.0
Source: OECD 2016
www.productivityinsightsnetwork.co.uk
www.productivityinsightsnetwork.co.uk
7
slightly improved post-recession. However, the ONS note the increasing inequalities between different groups in society “We have also seen inequalities emerging within the data, and we will be exploring these further looking at factors that may contribute to some groups of society having lower personal well-being.” Silvia Manclossi, Head of Quality of Life Team, Office for National Statistics. The emergent inter-generational inequalities, occurring simultaneously with demographic changes such as an aging population indicate the need for further research on the ‘inter-sectional’ impacts of productivity policies. Different groups in our society will be impacted in different ways. Thus further research looking at the shifting labour market dynamics and the potential role of productivity in off-setting further labour market polarisation would be beneficial. At a local authority level in the UK the What Works Centre for Well-Being researched inequality in well-being at a local authority level. The research focused on measuring inequality in life satisfaction within a local authority, using Annual Population Survey data for over 200 local authorities. What Works Well-Being (2017) found that higher deprivation and living in a rural area are associated with higher inequality in life satisfaction. Whereas higher median income, female life expectancy, engagement in heritage activities (including volunteering and visiting heritage sites) and use of green space are associated with lower inequality in life satisfaction. Local Well-Being Indexes: Additionally, well-being indexes have been developed by a number of think tanks, civil society organisations (Happy City’s Index of Thriving Places ) and business organisations. Employee well-being: Management research has looked at ways in which worker well-being contributes to firm performance. Bender et al (2018) examined productivity, management practices, and employee ability using German data. Finding that better-managed firms recruit and retain workers with higher average human capital. Thus indicating that there may be a link between better managed firms and worker productivity. Oswald et al (2015) conclude that: “Lower happiness is systematically associated with lower productivity”. Thus indicating the importance of worker well-being on individual output. However, there remain gaps in our knowledge as to how individual worker productivity is reflected in industry/sectoral productivity (Mishel and Bivens 2015). Going forward this will be particularly important for the UK’s long tail of low productivity firms. Can marginal gains in individual workers’ productivity within firms be captured in industry output figures and subsequently macroeconomic data? In recent years there has been improvement in the availability, and use, of well-being indicators. There remains work to be done however, in determining the interaction between the drivers of well-being and what this means for policy solutions. Developments in well-being indicators particularly at a regional and local level are to be welcomed. However, in relation to the UK’s productivity puzzle how can well-being indicators contribute to solving the problem? Thus, in relation to well-being and productivity the following gaps, requiring further research, have been identified: • Further studies on the direct links between productivity and economic, regional and labour
market well-being are needed. • Recent developments in well-being indicators are welcome. This supports further research
on the practical application of well-being indicators within productivity research. • Evidence-based research that will be of use to government, industry and workers looking to
improve both productivity and well-being.
www.productivityinsightsnetwork.co.uk
www.productivityinsightsnetwork.co.uk
8
Inequality and Productivity Most advanced economies have witnessed increasing income inequalities over the past 30 years. OECD data shows that in “the mid-1980s, the top 10% of the income distribution in OECD countries earned around seven times the income of the bottom 10%. However, by 2013 that ratio had increased markedly to almost ten times” (OECD 2016). Similarly, the average Gini co-efficient of OECD countries has increased by 10% (from 0.29 to 0.32) over the same time period. This was due to income growth at the top of the income distribution (the top 1%) and stagnating income growth at the bottom on the distribution (OECD 2014). Average figures mask that the structural changes to the economy since the financial crisis have meant that is has been those of working-age that have experienced the most shift in income inequality. Unsurprisingly related to job losses ensuing from the financial crisis. The most notable feature from OECD data on income inequalities is the extent to which different groups of people in the economy have been affected in different ways. Young people have now replaced the elderly as the group most at risk of relative poverty (OECD 2016). Though this trend began in the 1980s it accelerated during and post crisis. Research by Eurofound (2017) using the European Social Survey, examining the long term scarring effect of youth unemployment found that although the scarring effects on labour market participation disappeared over time there was a permanent lifelong scarring effect on the earning prospects of young people. This lifelong scarring not only impacted future earnings but also the types of future jobs under-taken, with those who experienced long term unemployment in their youth more likely to be employed in unskilled or semi-skilled jobs. This indicates that the impact of the financial crisis may continue impacting on employment and income inequalities for decades to come. Average household disposable income fell or stagnated in most OECD countries between 2007-2011 (OECD 2016). The OECD find that it was the loss of employment was the main cause of falling disposable income, along with to a lesser degree falling wages. The interaction between redistributive tax and benefits policies played an important role in income inequality with benefits and redistributive policies doing their job and supporting incomes in the early years of the crisis. However, the onset of austerity measures saw the redistributive power of taxes and welfare benefits weaken and income inequality accelerate. In the UK further planned cuts to welfare spending are projected to reduce the incomes of the poorest (OBR 2017, HM Treasury 2017). Changes to tax credits will adversely affects families with two or more children (IFS 2017). These welfare cuts are likely to mean that more people in the bottom decile fall below the poverty threshold of 60% of median incomes (Ghelani and Tonutti, 2017). This will in turn likely be reflected in a worsening position within the OECD’s well-being index. It can be argued that the financial crisis and the ensuing ‘hysteresis’ effects have further entrenched patterns of labour market polarisation, as supported by segmented labour market theory (Reich 2008, Gregg & Wadsworth 2004, Reich et al 1973). In the US the term ‘dual economy’ is used to highlight this phenomenon of ‘good jobs’/ ‘bad jobs’, and the ILO were among the first to talk of ‘hollowing out of the middle” through the loss of traditional middle-class jobs in manufacturing and services toward both high-skill and low-skill occupations (Ernst 2015). Studies specifically examining the links between increasing inequality and productivity are limited. Further research is required to specifically examine increasing inequality, increasing labour market polarisation, the links between regional inequality - between and within regions - and the impact of regional productivity.
www.productivityinsightsnetwork.co.uk
www.productivityinsightsnetwork.co.uk
9
However, one aspect of inequality which has sparked new research interest in productivity has been the phenomenon of wage stagnation, particularly in the USA. Stagnating wage growth has promoted a renewed focus on the role of productivity. Research by Mishel and Bivens (2015) sparked debates regarding the link between productivity and pay. This has prompted the question: “Is the link between productivity and pay broken?” (Stansbury and Summers 2018) Stansbury and Summers (2018, supported by Bernstein 2015) conclude that the link between productivity and pay has not de-linked and that increasing productivity remains a direct method of increasing wages, particularly for middle income workers. However, they argue that: “This does not mean that policy should ignore questions of redistribution or labour market intervention – the evidence of the past four decades demonstrates that productivity growth alone is not necessarily enough to raise real incomes substantially, particularly in the face of strong downward pressures on pay. However, it does mean that policy should not focus on these issues to the exclusion of productivity growth – strategies that focus both on productivity growth and on policies to promote inclusion are likely to have the greatest impact on the living standards of middle-income Americans”. Whilst Stansbury and Summers emphasised that productivity remains a direct method of increasing wage for typical workers. Mishel and Bivens (2015) emphasised the weakening of the link between productivity and pay: “in the most recent period, 2000-2014, that rising inequality—both compensation inequality and reductions in labor’s income share—explains eighty percent of the gap between productivity and a typical workers compensation“. They conclude that “although boosting productivity growth is an important long-run goal, this will not lead to broad-based wage gains unless we pursue policies that reconnect productivity growth and the pay of the vast majority”. The Mishel Bivens/Stansbury Summers debate has been important as it has questioned conventional wisdom on the direct link between pay and productivity, challenged assumptions, and signified the role of wage inequality. Both papers indicate that income inequality has weakened the direct impact of productivity gains on wages. This research highlights the need for further studies on whether inequality has weakened the link between pay and productivity. Given the significant structural shifts in the UK labour market since the financial crisis such further studies focused on the UK, and international comparators, would be beneficial. Consideration of regional pay variations, sectoral differences and groups of workers would provide further evidence of labour market and productivity dynamics. Also, worth considering is whether increasing wages would boost productivity. At a micro level efficiency wage theory (Shapiro and Stiglitz 1984, Akerlof 1982) has been examined, predominantly in minimum wage studies (Card and Krueger 1995), as a theoretical justification whereby increasing wages has a positive impact on employee effort. McKinsey (2018) posit whether increasing pay first would boost productivity. Drawing on the fact that the US minimum wage was introduced in 1935, in response to the Great Depression, with arguments focusing on the potential role of a minimum wage floor on boosting demand and the marginal propensity to consume. Manyika, Remes and Mischke (2018) state “The impact of demand on productivity growth is often under appreciated. Looking closer at the period following the financial crisis, 2010 to 2014, we find that weak demand played a key role in the recent productivity growth decline to historic lows. In fact, about half of the slowdown in productivity growth — from an average of 2.4% in the United States and Western Europe in 2000 to 2004 to 0.5% a decade later — was due to weak demand and uncertainty”. Demand side policies for wage led growth is an emerging argument as is the role of demand in driving investment: “Demand is the single most important factor driving corporate investment decisions. Investment, in turn, is critical for productivity growth, as it equips workers with more – and with more recent and innovative – equipment, software, and structures. But we have seen capital intensity growth fall to the lowest
www.productivityinsightsnetwork.co.uk
www.productivityinsightsnetwork.co.uk
10
levels in post-WWII history. Weaker demand leads to weaker investment and creates a vicious cycle for productivity and income growth (Manyika, Remes and Mischke (2018). Further studies on the effects of increasing pay on productivity within firms, sectors, and regions would be beneficial. As would further investigation of demand-led productivity growth. McKinsey (2018) expect that global productivity has the potential to recover at least 2 per cent per year over the next ten years, “with 60 percent coming from digital opportunities”. However McKinsey (2018) warn that the legacy of the crisis may hamper global demand for goods and services. They point to rising income inequality, declining labour share of the value, demographic changes and reduced rates of investment. They warn that the diffusion of digital advances may “amplify these demand leakages while potentially creating other barriers to productivity growth, such as winner-take-most effects on industry structure”. Raising questions as to how digital diffusion can be managed so as to avoid widening sectoral and regional inequalities. Thus, for the UK this poses the question of ascertaining the winners and losers of digital diffusion at an industry level, firm level and geographic level. How can regional inequalities be diminished by digital diffusion rather than exacerbated? How will the diffusion of new technologies be managed so as not to create further inequalities? The World Economic Forum on its work on the Fourth Industrial Revolution point out that the focus on the development and diffusion of new digital technologies and technological improvement focus on the micro level benefits. Whether that be in firm level profitability, firm or sectoral productivity. There remain gaps in our knowledge, and thinking particularly within macroeconomic models, as to how these micro improvements transfer into the macro economy. Transfer through economic theory and, reflect in the macroeconomic indicators. Arguably it is headline macroeconomic indicators, showing the UK’s relatively poor productivity growth and related relatively poor GDP growth that has driven the political and media interest in productivity. Thus further work is needed within the macroeconomic model, statistics and headline indicators. In conclusion this analysis of gaps in our knowledge on the links between inequality and productivity indicate further evidence is needed: • Further studies on ‘hysteresis’, the long-term scarring effect of the financial crisis on
productivity growth. Particularly regional labour market polarisation and shifting labour market dynamics and their implications for future productivity opportunities • Has inequality weakened the direct link between pay and productivity? Further evidence from
the UK along with international comparator studies is needed. • Research on demand-led productivity growth and the role of inequality requires further
investigation Inclusive Growth and Productivity Inclusive Growth has emerged as a term in response to increasing income inequalities and evidence that the benefits of economic growth are not distributed evenly (OECD 2016, Furman 2014, Stiglitz 2012) and is a term used by the UK and devolved Governments, civil society organisations, such as the JRF and Resolution Foundation, and now also by business organisations such as the CBI and the Institute of Directors. The Scottish Government defines inclusive growth as meaning the following: “When we talk about inclusive growth, we mean growth that: combines increases in prosperity with greater equity; creates opportunities for all; distributes the dividends of increased prosperity fairly” (Scotland’s Agenda for Cities, 2016: 24).
www.productivityinsightsnetwork.co.uk
www.productivityinsightsnetwork.co.uk
11
The commitment to inclusive growth by the UK Government has direct implications for productivity research. Productivity is viewed as a key component of economic growth, thus follows if economic growth should be inclusive so must productivity growth. The debate regarding the potential trade-offs between growth and equity is beyond the scope of this gap analysis. However, the following points specifically salient for further productivity and inclusive growth research are worth noting. The IMF (2018: 2) conclude from one study that although “higher inequality does dampen the growth benefits, the net effect on growth remains positive”. The OECD (2015: 12) recommends that policy-makers consider the potential “trade-offs and complementaries between growth and distributional objectives” to allow for “corrective action” if needed. Evidence on wage inequality from the US recommends that “strategies that focus both on productivity growth and on policies to promote inclusion are likely to have the greatest impact on the living standards” (Stansbury and Summers 2018). Thus ensuring that gains from productivity create opportunities for all and distribute the dividend from improved productivity fairly are equitable are the challenge facing the UK. This supports the OECD’s (2015) research into inclusive growth, which highlights the need for greater understanding of the effects of policies on “specific social groups” and introduces the concept of ‘spatial inclusion’. The OECD recommends mainstreaming inclusive growth into policy making. Delivering meaningful inclusive growth (Turok 2010) will require a step change in the UK from government, business and civil society to ensure that strategies are effectively implemented and deliver tangible outputs across all regions and communities in the UK. As we have seen with the analysis of well-being making sense, and effectively measuring progress, of the multi-dimensional factors associated with inclusive growth, and demonstrating the impact of changes in productivity will be a challenge. Measures of Productivity in the Context of Well-being, Inequality and Inclusive Growth This take us on to examine measures of productivity and considering what alternative measures of progress may be required in the context of improving well-being, reducing income inequality and delivering inclusive growth. There is a gap in theoretical and empirical evidence on the distribution of productivity gains. New theoretical approaches and frameworks of measurement need to move onto inter-disciplinary ground and deliver robust evidence to support policy development and effective implementation. The Industrial Strategy Commission found that the: “UK’s ‘soft’ infrastructure, or in other words investment in human capital through universal education and health and social care services, also faces significant challenges. Addressing shortfalls in soft infrastructure will be an important aspect of improving living standards and economic potential in towns and areas that are not going to be part of a high-productivity urban agglomeration.” (Industrial Strategy Commission 2017: 52) The move to beyond thinking of infrastructure as solely physical infrastructure is an important step. This recognition of ‘soft infrastructure’ moves mainstream economic thinking on the factors that contribute to productivity closer to schools of thought in the broader social sciences, including heterodox economics, feminist economics and political science where the need for better “social infrastructure” has been argued.
www.productivityinsightsnetwork.co.uk
www.productivityinsightsnetwork.co.uk
12
The term ‘social infrastructure is used by economists and planners meaning physical infrastructure that supports social objectives (Morphet 2016), such as health centres, educational establishments, leisure facilities and cultural venues. Whilst the recognition that the physical infrastructure impacts on wider quality of life and well-being the focus is still on the built environment rather than the human. Coyle (2017) has called for a ‘universal basic infrastructure’, arguing that whereas measures such as a universal basic income may boost individual income a universal basic infrastructure would guaranteed access to healthcare, education, public transport that arguably may deliver greater benefits. Infrastructure is viewed as a tangible, visible, output of regional economic develop and delivering productivity improvements. Indeed, the current City Region Deals prioritise spending on infrastructure, arguably at the expense of other objectives such as inclusive growth (McSorley 2017) and large-scale infrastructure investments are still measured as delivering the largest boost to productivity and GDP. The Industrial Strategy Commission views these ‘soft infrastructure’ investments in terms of building ‘human capital’ and thereby infer that living standards will improve. Heterodox economic authors take a more bottom up approach arguing the importance of social infrastructure beyond human capital accumulation. Non-market social infrastructures and social capital (Halpern 2005), particularly in the care economy, are viewed as being as equally as important as paid market activity. In order to build human capital within the labour market citizens need to be able to access the labour market. Inequality starts pre-market entry. Since the 1990s, feminist economic critiques of the human capital model have developed and there is now a sophisticated literature on care and labor markets (Elson 1999, England 2005) and on gender and macroeconomic policy (Elson and Çagatay 2000 and Seguino and Grown 2006). This work is important in relation to policy solutions to the productivity puzzle, and merit further investigation. For example, the ONS (2013) calculate unpaid care and informal childcare, mostly undertaken by women, has an estimated economic value of £340bn in the UK. Himmelweit (2016: 84) argues that high quality childcare increases wealth and well-being of the society now and in the future, thus it should be viewed as “a form of capital rather than current spending”. Heckman (2011, 2006) demonstrated the links between investments in childcare and the long term economic benefits of reduced social exclusion. Similarly, policies to tackle youth unemployment and NEET have so far largely ignored the highly gendered aspects of the youth labour market, including the fact that half of NEETs who are male are unemployed whereas only one third of female NEETs are classified as unemployed, with two thirds classed as inactive (ONS 2018). Caring responsibilities have been found to be a key factor (Eurofound 2017). The state-of-the-art narrative shifting to include ‘soft’ factors that have to date remained unmeasured and unaccounted for opens up exciting new avenues for productivity research. Relating to inclusive growth areas for further investigation have been identified as: • Further evidence on whether inequality has weakened the direct link between pay and
productivity in the UK. Combined with the need for further international comparisons. • Managing the productivity gains from digital and technological diffusion to support, rather than
undermine, inclusive growth. • Policy-focused and industry-focused research combining robust theoretical and empirical
evidence with practical application as how to inclusive productivity growth can be delivered. • Consideration of ‘soft’ infrastructure and pre-market and non-market factors which affect
inclusive growth, including the care economy.
www.productivityinsightsnetwork.co.uk
www.productivityinsightsnetwork.co.uk
13
Conclusion This gap analysis has focused on current evidence regarding the direct links between productivity and well-being, inequality and inclusive growth. New thinking, new multi-disciplinary theoretical and empirical approaches are needed along with research evidence which can support policy and industry implementation. The focus on boosting productivity is welcome and offers opportunities for the UK. Nonetheless, as highlighted by the OECD, there is no guarantee that the gains from productivity will be broadly shared across the UK economy. This emphasises the need for further research to ensure we do not miss the opportunity to deliver inclusive productivity growth.
www.productivityinsightsnetwork.co.uk
www.productivityinsightsnetwork.co.uk
14
Bibliography Akerlof, G.A. (1982) Labor Contracts as Partial Gift Exchange. Quarterly Journal of Economics, 97, 543-569 Bender, S. Bloom, N. Card, D. Van Reenen, J and Wolter, S. (2018) "Management Practices, Workforce Selection, and Productivity," Journal of Labor Economics 36, no. S1 (January 2018): S371-S409. Bernstein, J (2015), “Faster productivity growth would be great. I’m just not sure we can count on it to lift middle class incomes”, On the Economy Blog, 21 April. Bivens, J and L Mishel (2015), “Understanding the historic divergence between productivity and a typical worker's pay: Why it matters and why it's real", Economic Policy Institute, Washington DC Bryson, A. and Forth J. (2016). “The UK’s Productivity Puzzle”, in Ashkenazy, P et al (Eds). Productivity Puzzles Across Europe. Oxford University Press. Coyle, D (2017) Do-it-yourself digital: the production boundary and the productivity puzzle. ESCoE Discussion Paper 2017-01. https://www.escoe.ac.uk/wp-content/uploads/2017/02/ESCoE-DP-2017-01.pdf Elson, D. (1999) “Labor Markets as Gendered Institutions: Equality, Efficiency and Empowerment Issues.” World Development 27(3): 611–27. Elson, D and Çagatay, N. (2000) “The Social Content of Macroeconomic Policies.” World Development 28(7): 1347–64. England, P. (2005) “Emerging Theories of Care Work.” Annual Review of Sociology 31: 381–99. Ernst, E (2015) “The Shrinking Middle”. Finance and Development, March 2015. http://www.imf.org/external/pubs/ft/fandd/2015/03/pdf/ernst.pdf Furman, J. 2014. Global Lessons for Inclusive Growth. White House Institute for Economic Affairs. Gregg, P., & Wadsworth, J. 2004. Two sides to every story: Measuring the polarisation of work. CEP Discussion Paper, (632). Halpern D (2005) ‘Social Capital’, published by Polity Press: Cambridge Heckman, J.J. (2006). “Skill formation and the economics of investing in disadvantaged children”. Science 312(5782): 1900-1902. Heckman, J. J. (2011). “The Economics of Inequality. The Value of Early Childhood Education”. American Educator, Spring: 31-47. Henau De, J., S. Himmelweit, Z. Łapniewska and D. Perrons (2016). Investing in the Care Economy. A gender analysis of employment stimulus in seven OECD countries. Brussels: ITUC.
www.productivityinsightsnetwork.co.uk
www.productivityinsightsnetwork.co.uk
15
Himmelweit, S. (2016). Childcare as an investment in infrastructure. In J. Campbell and M. Gillespie (eds.) Economics and Public Policy: Reflections on the Work and Impact of Ailsa McKay, pp. 83-93. Abingdon: Routledge. Layard, 2016. Measuring Wellbeing and Cost-Effectiveness Analysis: Using Subjective Wellbeing. Available here: https://whatworkswellbeing.files.wordpress.com/2016/08/common-currency-measuring-wellbeing- series-1-dec-2016v2.pdf Manyika, Remes and Mischke (2018), “The U.S. Economy Is Suffering from Low Demand. Higher Wages Would Help”. Harvard Business Review, January 2018. Morphet, J (2016) “Infrastructure Delivery Planning. An Effective Approach. Mukuria, C. Et al (2016). An empirical comparison of well-being measures used in UK. Research Interim Report RR0027: University of Sheffield and the University of York OECD (2017), How's Life? 2017: Measuring Well-being. Paris: OECD OECD (2016). The Productivity-Inclusiveness Nexus. Paris: OECD OECD. 2015. All on board: Making inclusive growth happen. Paris: OECD. ONS (2013). Household Satellite Accounts, Valuing Informal Childcare in the UK, 201 http://webarchive.nationalarchives.gov.uk/20160106223819/http://www.ons.gov.uk/ons/rel/wellbeing/household-satellite-accounts/valuing-informal-childcare-in-the-uk/index.html Oswald, A.J. Proto, E. and Sgroi, D. (2015) "Happiness and Productivity," Journal of Labor Economics 33, no. 4 (October 2015): 789-822. Ostry, J, Berg, A and Kothari, S (2018) Growth-Equity Trade-offs in Structural Reforms. IMF Working Paper, IMF. Piketty, T (2014), Capital in the twenty-first century, Harvard University Press. Reich, M. Gordon, D.M. and Edwards, R.C. (1973) “A Theory of Labor Market Segmentation” The American Economic Review, Vol. 63, No. 2, Papers and Proceedings of the Eighty-fifth Annual Meeting of the American Economic Association (May, 1973), pp. 359-365 Resolution Foundation (2012) Gaining from growth: The final report of the Commission on Living Standards. London: Resolution Foundation Shapiro C. and J Stiglitz (1984) “Equilibrium Unemployment as a Worker Discipline Device”, American Economic Review Seguino, S and Grown, C. (2006) “Gender Equity and Globalization: Macroeconomic Policy for Developing Countries.” Journal of International Development 18(8): 1081–104. Stansbury, A and Summers, L.H. (2018) “On the link Between US Pay and Productivity”. Vox, CEPR’s Policy Portal. https://voxeu.org/article/link-between-us-pay-and-productivity Turok, I. 2010. “Inclusive Growth: Meaningful goal or mirage” in Pike et al. (eds). Handbook of Local and Regional Development, London: Routledge, 74-86.