industry’s sustainability performance · • at start of project, set ambitious safety target of...
TRANSCRIPT

THE GLOBAL FOREST PRODUCTS
INDUSTRY’S SUSTAINABILITY
PERFORMANCE
November 30th, Brussels

Who are we?
The International Council of Forest & Paper
Associations (ICFPA) is a worldwide network of
forest and paper industry associations that
promotes cooperation in areas of common interest
to its members and serves as the industry’s
advocate at the international level.


Contributing Associations
• AFPA
• Ibá
• FPAC
• CORMA
• CEPI
• JPA
• NZFOA
• PAMSA
• AF&PA
2

Sustainability Commitments*
• Creating solutions to global climate change and
energy supply challenges
• Promoting sustainable forest management
worldwide
• Combatting illegal logging
• Recovering and recycling fibre
• Improving environmental management
• Investing in workers and communities
*2006 CEO Leadership Statement on Sustainability
3

GREENHOUSE GAS (GHG) EMISSIONS
INTENSITY Driven by energy efficiency improvements at facilities, increased fuel switching to lower emission fuels, and closing of less energy-efficient mills.
Baseline 2004/2005
2008/2009 2010/2011 2012/2013 2014/2015
-16% from
baseline
GH
G E
MIS
SIO
NS
INTE
NS
ITY
(M
T C
O2
EQ
/MT P
RO
DU
CTIO
N)
.689
.630 .602
.574 .577

SHARE OF BIO-ENERGY IN THE FUEL
MIX
The forest products industry’s onsite energy needs are increasingly met by carbon-neutral biomass and renewable fuels, allowing reduced use of energy from fossil fuel sources, purchased electricity and steam
53.0 baseline
2004/2005
Percent of onsite energy needs met by biomass and renewable fuel sources (% on a lower heating value energy content basis)
57.7 2010/2011
60.7 2012/2013
63.3 2014/2015
+10.3 PERCENTAGE POINTS FROM BASELINE

CASE STUDY: U.S. INDUSTRY
EXCEEDS GHG REDUCTION GOAL
http://sustainability.afandpa.org

CASE STUDY: U.S. INDUSTRY
EXCEEDS GHG REDUCTION GOAL
http://sustainability.afandpa.org

CASE STUDY: U.S. INDUSTRY
EXCEEDS GHG REDUCTION GOAL
http://sustainability.afandpa.org

CASE STUDY: U.S. INDUSTRY
EXCEEDS GHG REDUCTION GOAL
http://sustainability.afandpa.org

CASE STUDY: U.S. INDUSTRY
EXCEEDS GHG REDUCTION GOAL
http://sustainability.afandpa.org

CASE STUDY: U.S. INDUSTRY
EXCEEDS GHG REDUCTION GOAL
http://sustainability.afandpa.org

SUSTAINABLE FOREST
MANAGEMENT-CERTIFIED HECTARES
The sustainable procurement indicator reflects the share of wood fibre the forest products industry sources from third-party certified sustainably managed forests. Third-party verification is carried out by FSC and/or PEFC.
+42 PERCENTAGE POINTS FROM 2000 BASELINE YEAR
54% IN 2015

GLOBAL DEMAND AND CERTIFICATION
SYSTEMS
will come from plantations
To give society confidence
that people manage forests sustainably

5.4 million hectares of certified forests by
the plantations-based sector
2,5 million FSC and
PEFC/CERFLOR
0.3 million PEFC/CERFLOR
alone
2.6 million FSC alone
CERTIFICATION IN BRAZIL

CERTIFICATION IN BRAZIL
0
1
2
3
4
5
6
7
8
2010 2017
mil
lio
n h
a
Certified Area (ha)
0
1
2
3
4
5
6
7
8
9
10
2010 2011 2012 2013 2014 2015 2016 2017
Millio
n h
a
Certified Area (ha)
Native (ha) Plantations (ha) Certified Area (ha)
Source: FSC

CERTIFICATION IN NUMBERS - GLOBAL
650
Natural
Plantations
Semi-natural &
mixed plantation
& natural forest
Number of certificates (FSC)
Africa
Asia
Europe
Latin America &
Caribbean
North America
Oceania
Global distribution of certificates by region ( FSC)
Challenge: certify tropical forests
Significant market in intensively managed forest (plantations and semi-natural)
Growing mainly in Europe, North America and Latin America

Pulp Paper Wood Panels Laminate flooring Solid wood products
NTFP
EVOLUTION FOR FOREST CERTIFICATION
Low carbon products Future CoC (new products/ bioeconomy) Innovation /New technologies Sustainable Intensification New procedures Added value New services
Current What needs to come...

WHAT IF IT DOES COME?
1970 1980 1990 2000 2010
YIELD m³/ha.year
LAND ha/1,000,000
tons pulp
73,500
21
27
29
31
41
49
Conventional
breeding benefits
Potential
biotech
enhancement
171,500
133,500
124,000
116,000
88,000
20%
Productivity and land requirement in selected years One example of SI that
has succeeded in Brazil
Source: Suzano
Produce more with
less and certify areas

CERTIFICATION SYSTEMS CANNOT
RESTRAIN SFM - SHALL PROMOTE SFM

GLOBAL PAPER RECYCLING RATE
2000 2001 2002 2003 2004 2005 2006 2007 2008 2009 2010 2011 2012 2013 2014 2015
46.5% 47.6% 47.6%
48.2% 48.6%
49.9%
51.0%
52.6%
53.7%
55.6% 56.0%
56.6% 57.5%
57.9% 58.2%
58.9% The global recycling rate represents the amount of recovered paper used by paper and paperboard mills as a percent of global paper and paperboard consumption
Source: RISI

CEPI RAW MATERIAL CONSUMPTION

*Europe means EU-28 countries plus Norway and Switzerland
UTILISATION, NET TRADE AND
RECYCLING RATE OF PFR IN EUROPE

RECYCLING RATE, UTILISATION RATE AND
UTILISATION OF PFR IN2016

SIMPLE MESSAGES ON PAPER RECYCLING!

EUROPEAN DECLARATION ON
PAPER RECYCLING
27

EUROPEAN PAPER RECYCLING COUNCIL

EUROPEAN DECLARATION ON PAPER
RECYCLING 2016-2020
29
New Target for the European Paper Recycling Rate
74% by 2020
71,5% in 2015

ONSITE ENERGY INTENSITY
-1.1% Improvement from
baseline
18.2 baseline
2004/2005
17.4 2012/2013
18.0 2014/2015
TOTAL ONSITE ENERGY INTENSITY (GJ LHV/MT)
Driven by energy-efficiency improvements at facilities and closing of less energy-efficient mills over time

COAL
SOLAR
NUCLEAR HYDRO
WIND
BIO-MASS
ENERGY MIX
1.3m tonnes of carbon emissions from fossil fuels (coal, oil and gas) avoided annually
through biomass-based renewable energy.

SULPHUR DIOXIDE (SO2) EMISSIONS
48% Decrease from baseline
2.0 Baseline
2004/2006 1.3
2010/2011 1.2
2012/2013 1.04
2014/2015
Driven by reduced use of fuels with high sulphur content and increased prevalence of SO2 removal systems
on boilers
SO2 emissions from on-site combustion sources (KG SO2/MT PRODUCTION)

WATER USE
-7.2% decrease in process water use
-6.8% decrease in total
water use
PROCESS WATER Water used for process purposes and either treated onsite and then discharged to a surface water or discharged to a publicly owned treatment works for treatment and discharge Driven by initiatives to improve and preserve water resources
36.1 process water
discharge M3/MT
45.4
total water discharge
M3/MT
33.5 process water
discharge M3/MT
42.3
total water discharge
M3/MT

BENEFICIAL WATER USER
• SA forestry and
paper companies
commit to efficient
water use and
conservation of
natural and
biodiverse
wetlands
• Plantation forestry
uses 3%
compared to 62%
by agriculture. Source: Assessment of the Ultimate Potential and Future Marginal Cost
of Water Resources in South Africa, Report no: PRSA 000/00/12610 prepared
by BKS for the Department of Water Affairs, September 2010 Source: Department of Water Affairs 2010.

BENEFICIAL WATER USE
Plantations
use both soil
and water
resources but
can be
measured
against the
returns they
provide.

RECORDABLE INCIDENT RATE
-24.5% Improvement from
baseline
Number of recordable incidents x 200 000 hours/number of hours worked by all employees
Baseline 2006/2007 3.35
2.53 2015
0.82 DE
CR
EA
SE
Driven by improved safety awareness,
processes and systems
Number of recordable injuries and illnesses that
occured per:
x 100 employees in a year

SOUTH AFRICA
Safety

Mondi: Group sustainability report 2016
• The mill’s wood yard upgrade had peak headcount of 500 contractors
and Mondi employees on-site at any one time.
• At start of project, set ambitious safety target of 500,000 recordable case-
free hours
• Wide-ranging steps ensure it was achieved and well exceeded.
Improving safety | Mondi Richards Bay (SA) wood
yard shut: 900,000 recordable injury-free hours

SOUTH AFRICA
Changing lives through education and training
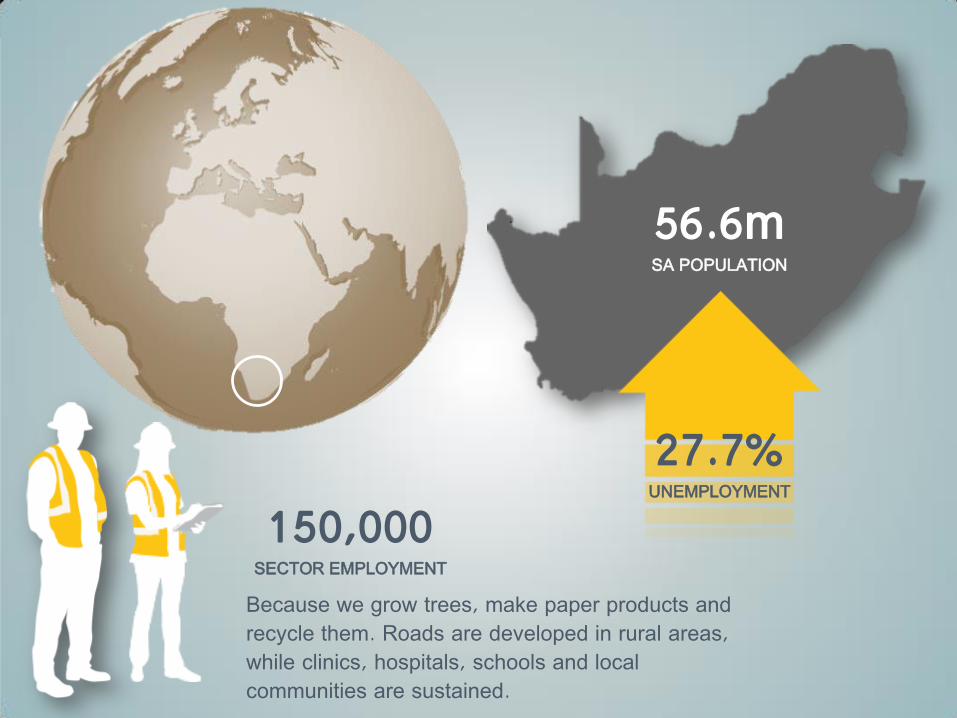
56.6m SA POPULATION
27.7% UNEMPLOYMENT
150,000 SECTOR EMPLOYMENT
Because we grow trees, make paper products and recycle them. Roads are developed in rural areas, while clinics, hospitals, schools and local communities are sustained.

PROGRESSIVE EDUCATION PARTNERSHIPS
• Support from Fibre
Processing &
Manufacturing Sector
Education Training
Authority
• Pulp & paper
occupational programme
• Skills development levy
• Partnerships with TVET
colleges and universities
• Centre of Excellence

Ladder of Learning

SOUTH AFRICA
Changing lives through paper recycling and entrepreneurship training

ENTREPRENEUR STORY: Mary and the Waste
Takers
• Attended ETC in Aug 2016.
• Three permanent staff
members
• Pays 10 collectors on
regular basis
• Source of income for up to
18 casual workers.
• Specialises in recycling
used telephone directories.
• Port Elizabeth, South Africa

ENTREPRENEUR STORY: Siphamandla
Ntshangase
“The PRASA training course really
opened my eyes to the concept of
creating a business out of waste. It
identified serious opportunities that
could be exploited using sound
business principles and helped me
to create a proper marketing plan.
I was no longer just collecting
boxes.”
• 12 people now have
permanent work in
an employment-
stressed region
• Kimberley, South Africa

RESEARCH AND INNOVATION

LOOKING INTO THE FUTURE
Blue Sky Young Researchers and Innovation Award
Harnessing Cellulose Nanofiber
Masataka HAYAMA
Japan Paper Association

BLUE SKY YOUNG RESEARCHERS
AND INNOVATION AWARD
• Purpose
By using the angle of innovation, to reposition the
sector, renew its image and create interest in our
industry as a future workplace.
• Eligible young researchers
Students or other researchers under age 30,
carrying out research and innovation projects
relevant for forestry, forest products processing
technologies and forest products.
• Award
Winners are invited to CEO Roundtable to make
presentation about awarded theme.
• 2016-2017 Awards:
(1) Selection Process
Regional
Selection
Over 50
applicants
Final Selection
12 applicants

2016-2017 Awards
(2) Juries of Final Selection
• Mark Gardner, CEO of Sappi (United States)
• Dr. Akira Isogai, Professor of the Graduate School of Agricultural and Life Sciences at the University of Tokyo (Japan)
• Dr. Ligia Ferrari Torella di Romagnano, from the Institute of Research and Technology (Brazil)
• Prof. Wingfield, Chairman of IUFRO and Director of FABI (South Africa)
• Andrey Kushlin, Deputy Director of Forestry Department of Food and Agriculture Organization of the United Nations (FAO)
(3) Winners
• Ms. Koh Sakai (Japan): “Cellulose Nanofibers Prepared by Phosphorylation”
• Mr. Shuji Fujisawa (Japan): “Biocompatible nanocellulose/polymer composite microparticles formed by emulsiontemplated synthesis”
• Mr. Esthevan A. G. Gasparoto (Brazil): “Cutting-edge Technologies for forest monitoring and measurement”
BLUE SKY YOUNG RESEARCHERS
AND INNOVATION AWARD

1. Future image of the Paper Industry
Cellulose
Nanofiber
(CNF)
Bio
chemicals
Te
ch
no
log
y D
ev
elo
pm
en
t
Present
• Strengthen revenue base of existing pulp and paper business
• Expand business into growing markets
• Create new businesses (develop high-value-added paper products)
Create a Forest Biomass Industry Bio
chemicals Methanol, IPA,
Furfural, Acetic acid,
and more Other
CNF Packaging materials, Food,
Chemicals, Cosmetics,Filter,
Automobile parts, and more
Energy business
Source: Japan Paper Association
HARNESSING CELLULOSE NANOFIBER (CNF)
Comprehensive Biomass Industry

CELLULOSE NANOFIBER (CNF)
What is cellulose nanofiber ? Classification of nanocellulose
Characteristic features and expected applications of nanocellulose
Cellulose
nanofibers
(CNF)
Cellulose
nanocrystals
(CNC)
The average
width
several~20n
m
several ~
10nm
The average
length
0.5~several
μm 200nm
Shape Fiber Spindle
Characteristic features Expected applications
Light and strong (5 times stronger than steel) Automobile parts, building materials, interior
materials
Low thermal expansion (50 times lower than glass) Semiconductor sealing material, printed circuit
board
Large specific surface area (more than 250㎡/g) Filter, odor eliminating sheet for paper diaper
High gas barrier Cosmetics, foods, coating materials
High transparency Transparent sheet
Source: METI, “The manufacturing base technology survey ( The future perspective and challenges of paper industry, 74-75, 2014”

JAPANESE GOVERNMENT’S STRATEGIES
Year Strategies Contents
2014 Japan Revitalization
Strategy 2014
States “promoting the use of new materials through R&D
focused on CNF”
2015 Japan Revitalization
Strategy 2015
States “promoting the use of new materials while proceeding
with R&D for international standardization of CNF”
2016 Japan Revitalization
Strategy 2016
States “promoting the use of woody biomass, R&D for
international standardization and commercialization of CNF”
2017 Growth Strategy 2017 States “working on the R&D of CNF and lignin aimed at
international standardization and commercialization”
Projects
Total expenditure:
1.8 billion yens (approx. 13.8 million €)
• Development of integrated production process and application
technologies of highly functional ligno-CNF
• Promotion of utilization of next-generation materials including
CNF (e.g. automobile members)
• Creation of new demand for wood.
• R&D on international standardization of CNF
Government’s Projects on Cellulose Nanofiber (Fiscal Year 2016)

CHALLENGES FOR EXPANDING THE USE OF CELLULOSE NANOFIBER
Current major technology in the defibration process
TEMPO oxidation method:
Chemical denaturation of cellulose based on TEMPO catalysis. With this
method, pulp is easily defibrated and nanofiber with a uniform width can
be created.
The phosphate esterification method:
To introduce phosphate groups on the surface of cellulose crystals by
phosphorylation method before mechanical treatment. With this method,
the manufacturing of high quality (high transparency, high viscosity) CNF
is possible.
Aqueous Counter Collision method:
To allow bio-based materials to be downsized into nano-objects only using
a pair of high speeded water jets as the medium without chemical
modification.
CNF-Reinforced Plastic method “Kyoto Process” :
This is produced by mixing CNF and plastics, such as polypropylene (PP),
polyethylene (PE), nylon and other plastic, resulting in additional strength.
Further technology
development
Component separation
technology according to
application, Cellulose,
hemicellulose, lignin.
Low-energy, high-
efficiency in the
disfibration process.
Surface-modification,
complex technology.
Target production cost
by 2030.
500 yen/kg
(3.75 €/kg)
Manufacturing technology development for cost lowering, Application development

Expected to create a 1 trillion yen market
by 2030.
(7,509 million €)
EFFORTS FOR APPLICATION OF CNF
55
Purpose:
Accelerate R&D, commercialization, and
standardization of nanocellulose with
cooperation among industry, academia and
government.
No. of Members: 359 (as of November, 2017)
- Individual member: 85
Researchers in university, private institution,
etc.
- Corporate member : 223
Paper manufacturers, chemical companies,
auto companies, etc.
- Special member: 51
Government agencies, local governments,
public/private research institutions
Nanocellulose Forum (established in 2014)

APPLICATION OF CNF
Currently commercialized as ink thickening agent, odor eliminating sheet for
paper diaper and diaphragm for loudspeaker.
Source: Mitsubishi Pencil Co., Ltd., Nippon Paper Industries Co., Ltd. and Onkyo Corporation

PRODUCTION FACILITIES IN MAJOR COMPANIES
Source: Japan Paper Association
(Slurry)
(Powder)
(Sheet)
(Water
dispersion)
Company Mill/Plant Start-up
Year
Annual
Capacity Product Form
Oji Holdings
Corporation
1: Shinonome R.
C. 2013 N/A Sheet, Slurry,
Powder
2: Tomioka Mill 2016 40 tons Slurry
Nippon Paper
Industries Co.,
Ltd.
3: Iwakuni Mill 2013 30 tons Wet powder
4: Ishinomaki
Mill 2017 500 tons
Water
dispersion
5: Fuji Mill 2017 10 tons CNF reinforced
resin
6: Gotsu Mill 2017 30 tons Powder
Daio Paper
Corporation 7: Mishima Mill 2016 100 tons Slurry
Chuetsu Pulp
& Paper Co.,
Ltd.
8: Sendai Mill 2017 100 tons Slurry,
Wet powder
DKS Co., Ltd. 9: Ogata Plant 2014 N/A Water
dispersion
Seiko PMC
Corporation 10: Ryugasaki
Mill 2014 1-2
tons/day
Pellet,
Dry powder

Progress on our Commitments
4
Thank you!