industry revenues and contributions
TRANSCRIPT

1 - 1
1. Industry Revenues and Contributions
This section provides a general overview of the revenues of the U.S. telecommunications industry, and the contributions to the universal service support mechanisms that are based on these revenues.1 Most of the data for 2002 are taken from filings of annual Telecommunications Reporting Worksheets (FCC Form 499-A) made with the Universal Service Administrative Company (USAC) on April 1, 2003.2 Revenue data collected on these worksheets are used to administer contributions to the universal service fund (USF), Interstate Telecommunications Relay Service (TRS), North American Numbering Plan (NANP), and local number portability (LNP) programs. Filer revenue also are used to calculate FCC Interstate Telecommunications Service Provider (ITSP) regulatory fees.3 Data presented for 2003 are taken from May 1, 2003, August 1, 2003, November 1, 2003, and February 1, 2004 FCC Form 499-Q quarterly filings. Revenue Information
Universal service requirements include several mechanisms that help ensure that all Americans have access to affordable telecommunications service. In section 254(d) of the Telecommunications Act of 1996,4 Congress mandated that "[e]very telecommunications carrier that provides interstate telecommunications services shall contribute, on an equitable and nondiscriminatory basis, to the specific, predictable, and sufficient mechanisms established by the Commission to preserve and advance universal service." The Commission implemented this mandate in a 1997 Report and Order.5 The Commission subsequently selected USAC as the
1 Portions of this section are based on Industry Analysis and Technology Division,
Wireline Competition Bureau, Federal Communications Commission, Telecommunications Industry Revenues 2002 (March 2004).
2 Telecommunications providers filed worksheets containing calendar year 2003 revenue
data on April 1, 2004. The worksheets are filed with the FCC’s Data Collection Agent, which extensively reviews and validates data. Revised filings are routinely accepted through December. As a result, the data are not considered reliable enough for publication for several months after the initial filing date.
3 Much of the information filed on FCC Form 499-A is proprietary. Publicly available
information on individual carriers is contained in Industry Analysis and Technology Division, Wireline Competition Bureau, Federal Communications Commission, Telecommunications Provider Locator (February 2004). See also <gullfoss2.fcc.gov/cib/form499/499a.cfm>.
4 Pub. L. No. 104-104, 110 Stat. 56 codified at 47 U.S.C. §§ 151 et seq. 5 See Federal-State Joint Board on Universal Service, CC Docket No. 96-45, Report and

1 - 2
administrator of the universal service support mechanisms. Telecommunications providers currently file FCC Form 499-A (Telecommunications Reporting Worksheets, due each April) and FCC Form 499-Q (Telecommunications Reporting Worksheets, due one month after the close of each calendar quarter.)
Virtually all providers of telecommunications must file FCC Form 499-A each year.6 Telecommunications Reporting Worksheets are not filed directly with the FCC but rather with USAC, which serves as the data collection agent. The annual worksheets for 2003 data were due April 1, 2004, but have not yet been compiled because some providers filed late or updated their filing after that date.7 Information from filings received after October 22, 2003 were not included in 2002 data.
FCC Form 499-A asks each filer to report total, interstate and international revenues in two broad categories: those billed to Universal Service contributors for resale (carrier's carrier revenues); and those billed to de minimis telecommunications providers and end users (end-user revenues). Filers must provide further breakdowns of local, wireless, and toll services.8 The form also asks each filer to choose the communications business that best describes its operations:9
Order, 12 FCC Rcd 8776 (1997) (subsequent history omitted). 6 There are certain exceptions. Providers that offer telecommunications for a fee
exclusively on a non-common carrier basis are not required to file if their total annual contribution to universal service would be less than $10,000. Government entities that purchase telecommunications services in bulk on their own behalf, public safety and local government entities licensed under Subpart B of Part 90 of the Commission’s rules, and entities providing interstate telecommunications exclusively to government or public safety entities are not required to file. In addition, broadcasters, non-profit schools, non-profit libraries, non-profit colleges, non-profit universities and non-profit health care providers are not required to file. Finally, systems integrators that derive less than 5% of their systems integration revenues from the resale of telecommunications and entities that provide services only to themselves or to commonly owned affiliates need not file.
7 The information in Tables 1.2 through 1.8 use year 2002 data because 2003 data from
Form 499-A were not yet available to us as of May 2004, the cut-off for information contained in this report. Telecommunications Reporting Worksheets are not filed directly with the FCC but rather with the USAC, which serves as the data collection agent. The annual worksheets are due April 1, but some providers file late or update their filing after that date. Consequently, the availability of the information to the FCC is delayed.
8 Telecommunications providers are considered de minimis and thus are not required to
contribute to universal service (or file Form 499-Q) if their annual contributions to universal service would be less than $10,000. For universal service contribution

1 - 3
• All Distance Carrier10 • Competitive Access Provider (CAP) or Competitive Local Exchange Carrier (CLEC) • Cellular, Personal Communications Service (PCS) and Specialized Mobile Radio
(SMR) Wireless Telephony Service Provider • Coaxial Cable10 • Incumbent Local Exchange Carrier (ILEC) • Interexchange Carrier (IXC) • Local Reseller • Operator Service Provider (OSP) • Other Local Service Provider • Other Mobile Service Provider • Other Toll Service Provider • Paging and Messaging Service Provider • Payphone Provider • Prepaid Calling Card Provider • Private Service Provider • Satellite Service Provider • Shared-Tenant Service Provider • Specialized Mobile Radio - Dispatch • Toll Reseller • Wireless Data Service Provider
The April 2003 FCC Form 499-A instructed carriers to report amounts actually billed to customers. This means that filers were required to report revenues net of discounts, but without making adjustments to reflect uncollectible revenues or international settlement payments or receipts.11 Most filers were able to report revenues in this manner using information contained in
purposes, any underlying service providers treat de minimis firms as end users.
9 The detailed definitions of the filer categories are contained in section III.A of the
Instructions to the Telecommunications Reporting Worksheet, FCC Form 499-A available at www.fcc.gov/Forms/Form499-A/499a.pdf. Starting in 2004, carriers were instructed to select up to 5 ranked categories of telecommunications service providers.
10 The All Distance and Coaxial Cable categories were added with the April 2004 filing. 11 As discussed more fully below, in December 2002, the Commission made certain
modifications to its contribution assessment methodology. Form 499-Q filers now file information on billed revenues for the previous quarter and both projected billed revenues and projected collected revenues for the upcoming quarter. Projected collected revenues, which are projected billed revenues less an allowance for uncollectible

1 - 4
their corporate books of account. Some service providers, however, have no business or regulatory requirements to record intrastate or international revenues separately from interstate revenues, or to use the detailed revenue categories contained in the worksheets. Many wireless providers therefore use the interim safe harbor percentages to estimate the interstate portion of their revenues.12
Form 499-A filings sometimes contain mistakes. Initial examination of the data occasionally reveals carrier types, revenue amounts and/or revenues reported in service categories inconsistent with the known operations of the filer. Some corrections have been made based on supplemental filer information. Nonetheless, disaggregated data are likely to be less accurate than industry totals.
Table 1.1 shows the major components of telecommunications revenues for 1997 through 2003. This table was created by simply aggregating the revenues in the major classifications designated on Form 499-A.
Tables 1.2 and 1.3 provide a look at annual industry revenues over time. Generally, Form
499-A revenue data can be tabulated in two distinct ways: by type of service provided and by type of business. Table 1.2 categorizes revenues by type of service and shows, for example, that carriers reported $81.5 billion in wireless service revenues for 2002. This total includes wireless service revenues from some carriers that are not identified as wireless carriers. In contrast, Table 1.3 shows that wireless service providers reported total revenues of $80.5 billion, including some revenues for fixed local and toll services.
Revenue data shown for 1992 through 1996 were derived from information filed on TRS worksheets. Revenue data for 1997 and 1998 were derived by combining TRS worksheet and Universal Service worksheet data. 1999 revenue data come from Form 499-A, which replaced both the TRS and Universal Service worksheets. Because of reporting changes, data for 1997 through 2001 are not entirely consistent with data for prior years. For example, special access revenues were included with other access revenues prior to 1997 but have been included with local private line services since then. Similarly, through 1996, filers reported as other local and mobile revenues substantial amounts of customer premises equipment, billing and collection, and other types of revenues that are excluded from contributions to universal service. These revenues are now reported as non-telecommunications revenues. Both tables contain estimates of non-telecommunications revenues that had been reported in prior years. Based on staff estimates, the 1996
revenues, form the basis for USF contribution assessments.
12 See Instructions to the Telecommunications Reporting Worksheet, FCC Form 499-A
section III.C.3. available at http://www.fcc.gov/Forms/Form499-A/499a-2004.pdf. In 2001 and 2002, the interim safe harbor for wireless carriers was 15%. In December 2002, the Commission raised the wireless interim safe harbor to 28.5%. Wireless carriers began reporting revenues based on the higher interim safe harbor percent on the FCC Form 499-Q due on February 1, 2003, and began contributing on this basis in April 2003.

1 - 5
telecommunications revenues reported on TRS Worksheets would have been $10.5 billion lower if revenues had been reported using current instructions.
Some inconsistencies exist in the 1997 - 1998 period. For example, filers were required in 1997 to include inside wiring maintenance revenues as part of local exchange revenues. In 1998, filers were instructed to report these revenues as non-telecommunications service revenues. The local exchange service revenue data in Table 1.2 would show a greater increase from 1997 to 1998 if the same reporting instructions had been used for each year.
Note also that each year, many filers erroneously report substantial amounts of switched toll revenues as other long distance revenues. The data are examined and some revenues are reclassified based on staff research. Even so, the other long distance category of Table 1.2 probably continues to contain some switched toll revenues, perhaps significant amounts in some years.
Table 1.4 illustrates how data from the Form 499-A are used to develop the funding base for the USF.13 As noted above, providers are considered de minimis for USF purposes if their annual contribution is expected to be less than $10,000. Otherwise, only those providers that are not carriers are not required to contribute. Revenue data for individual filers are not available to the public. However, Tables 1.5 through 1.8 present detailed industry totals by type of revenue and type of filer. Table 1.5 provides a detailed breakout of revenues for each of the Form 499-A revenue categories used to report services provided to other filers for resale. Table 1.6 displays similar detail for each of the revenue categories used to report telecommunications service provided to end users. Table 1.7 combines data from Tables 1.5 and 1.6 with data on non-telecommunications revenues to develop total industry revenues. Table 1.8 provides more aggregated revenue information by type of filers. The revenue categories presented in Tables 1.5 through 1.7 are explained in the Form 499-A filing instructions.
Table 1.9 presents data from quarterly filings of FCC Form 499-Q for 2003. FCC Form 499-
Q is far less detailed than Form 499-A. Because Form 499-Q filings do not include a business type, filers were categorized based on the primary business type selected on their Form 499-A filings. The quarterly form asks filers to identify revenues as carrier’s carrier, contribution base end-user, or non-telecommunications and to indicate the interstate and international shares of each category. Unlike Form 499-A, the quarterly form does not require filers to attach revenues to the provision of specific types of services. Also, international-to-international revenues are included with non-telecommunications revenues rather than with end-user revenues.
13 See Telecommunications Industry Revenues 2001 for a comparison with the funding
bases used for TRS, NANP, and LNP.

1 - 6
The universal service rules prohibit the fund administrator from releasing company-specific information contained in Form 499-A and Form 499-Q worksheets.14 Revenue data for individual filers are not available to the public.
Program Requirements and Contribution Factors Carriers make payments into the universal service mechanism based on their interstate and international end-user revenues. Carriers report their revenue data to USAC, which tabulates the data, and reports it to the Commission. The Commission reviews program requirements and revenue data, and determines the appropriate contribution factor. The Commission’s Wireline Competition Bureau (formerly known as the Common Carrier Bureau) releases a public notice stating the proposed contribution factor for the upcoming quarter. If, after 14 days, the Commission takes no action regarding the proposed contribution factor, the factor becomes final. The Commission issued orders in February 2002 and December 2002 that changed the methodology used to determine payments that carriers make into the federal universal support mechanisms. Before these changes, carriers were required to file historical revenue information each quarter, allowing the Commission to set quarterly contribution factors by simply dividing the program requirements by the contribution base (and allowing for a 1% uncollectible rate). Some carriers placed surcharges on customer bills to recover the amounts that the carriers expect to make in USF payments. These surcharges are called "pass-through" charges and revenues from these charges also are included in those carrier's contribution bases. In the past, that led a carrier’s contribution requirements to be based partly on that carrier’s revenues collected to pay the contribution requirements. Carriers used the term "circularity" to describe this situation. As a result of circularity and other reasons, carriers imposed markups greater than the adopted factors. To address this issue, the Commission twice changed the universal service contribution methodology. The first change reduced each carrier’s contribution base by the amount that the carrier paid into USF during the prior quarter.15 The line item “Circularity Adjustment” in Table 1.10 accounts 14 47 C.F.R. §54.711(b). 15 See Federal-State Joint Board on Universal Service, 1998 Biennial Regulatory Review -
Streamlined Contributor Reporting Requirements Associated with Administration of Telecommunications Relay Service, North American Numbering Plan, Local Number Portability, and Universal Service Support Mechanisms, Telecommunications Services for Individuals with Hearing and Speech Disabilities, and the Americans with Disabilities Act of 1990. Administration of the North American Numbering Plan and North American Numbering Plan Cost Recovery Contribution Factor and Fund Size, Number Resource Optimization, Telephone Number Portability, Truth-in-Billing and Billing Format, CC Docket Nos. 96-45, 98-171, 90-571, 92-237, 99-200, 95-116, 98-170, Further Notice of Proposed Rulemaking and Report and Order, 17 FCC Rcd 3752 (2002).

1 - 7
for this change. The “Circularity Adjustment” represents the industry’s actual contributions during the prior quarter as reported by USAC. This eliminated circularity as a reason for carriers to inflate pass-through charges. After this first change, carriers continued to mark up pass-through charges to offset their uncollectibles from their customers that do not pay. This reflected the fact that carriers had to contribute on all billed end-user revenues, even those that they were not able to collect from customers. Also, carriers with declining revenues had to recover contributions from a smaller base than the amount used to calculate contributions. Carriers cited these as reasons for marking up the pass-through charges. In December 2002, the Commission adopted additional changes to its contribution methodology, which were fully implemented in the second quarter of 2003. Carriers now project the amount of end-user revenues that they will collect from their customers in the upcoming quarter. This amount is then adjusted to eliminate circularity. The details are explained fully in the Order.16 Starting with the second quarter of 2003, the "Circularity Adjustment" amounts shown in Table 1.10 (discussed in more detail below) reflect expected USF contributions for the quarter rather than the industry's actual contributions from a prior quarter. Table 1.10 shows the program funding requirements for 2003 and the first three quarters of 2004. For each program and for each quarter, the table lists projected program demand, administrative costs, interest income, and periodic true-ups. The table also shows the revenue base and contribution factors for each quarter. The Commission then reduces the subtotal by 1% to reflect the fact that some contribution assessments may prove uncollectible. Table 1.11 shows universal service disbursements on a mechanism-by-mechanism basis for 2002 and 2003.17 The schools and libraries mechanism and the rural health care mechanism operate on a school-year basis rather than a calendar-year basis, so for the purposes of Table 1.11, Funding 16 See Federal-State Joint Board on Universal Service, 1998 Biennial Regulatory Review -
Streamlined Contributor Reporting Requirements Associated with Administration of Telecommunications Relay Service, North American Numbering Plan, Local Number Portability, and Universal Service Support Mechanisms, Telecommunications Services for Individuals with Hearing and Speech Disabilities, and the Americans with Disabilities Act of 1990, Administration of the North American Numbering Plan and North American Numbering Plan Cost Recovery Contribution Factor and Fund Size, Number Resource Optimization, Telephone Number Portability, Truth-in-Billing and Billing Format, CC Docket Nos. 96-45, 98-171, 90-571, 92-237, 99-200, 95-116, 98-170, Report and Order and Second Further Notice of Proposed Rulemaking, 17 FCC Rcd 24952 (2002).
17 Figures in Table 1.11 are lower than those in Table 1.10 due to the difference between
projected demand and actual disbursements.

1 - 8
Year 2001 (July 1, 2001 through June 30, 2002) disbursements were used for these two mechanisms for 2002, and Funding Year 2002 (July 1, 2002 through June 30, 2003) disbursements were used for 2003. For these two mechanisms, the bulk of a funding year disbursements are made in the second half of the funding year. Chart 1.1 shows the same information graphically. Table 1.12 shows, on a state-by-state basis, the total amount of funding disbursements for each of the universal service mechanisms, estimated contributions towards universal service, and the net estimated dollar flow (disbursements less estimated contributions) for 2002 and 2003.18 Technical Appendix Carrier revenue information is not reported on a state-by-state basis. Therefore, it is necessary to estimate revenues per state in order to derive contributions made per state.
The nationwide sum of contributions to support universal service is equal to the payments made from USAC to carriers for universal service mechanisms plus administration costs. Contributions on a per-state basis are computed by multiplying nationwide contributions by the ratio of interstate end-user revenues in each state to nationwide interstate end-user revenues. Estimates of interstate end-user revenues for 2002 by state are reported in Table 1.13. Each state’s share of interstate end user revenues is reported in Table 1.12.19
The remainder of this appendix provides a detailed description on how revenues are allocated to the states. Tables 1.5 and 1.6 present nationwide data on telecommunications revenues derived from information filed on Form 499-A Telecommunications Reporting Worksheets. Nationwide (cumulative) telecommunications revenues from these tables are divided into categories. These categories are ILECs’ local exchange service revenues, CLEC revenues, subscriber line charge revenues, access revenues, mobile wireless revenues and toll revenues.20 Table 1.14 presents telecommunication revenues for each of these categories at the nationwide level.
As set forth below, once the revenues are divided into categories, we use data from several sources to estimate each state’s telecommunications revenues. Data from the Statistics of 18 For a discussion of the methodology used to estimate contributions per state for 2003, see
the Technical Appendix below and Table 1.13, and for 2002 see the 2003 Monitoring Report (December 2003).
19 State’s share of interstate end user revenues are reported under the heading percent of
total estimated contributions. 20 The notes in Table 1.14 discuss how revenues from Tables 1.5 and 1.6 are assigned to
categories in Table 1.14.

1 - 9
Communication Common Carriers21 are used to estimate on a state-by-state basis ILECs’ local exchange service revenues, access revenues, and toll revenues.22 Data from tariff access filings with the FCC are used to estimate subscriber line charge (SLC) revenues. CLEC revenues are estimated on a state-by-state basis using data from FCC Form 477, and mobile wireless revenues are estimated using data from FCC Form 502.
Table 1.15 shows intrastate carrier’s carrier, end-user and total telecommunication
revenues by category for ILECs’ local exchange service, CLECs, wireless, access, ILEC toll, and non-ILEC toll.23 Components of interstate carrier’s carrier, end-user and total telecommunications revenues are presented in Table 1.16. These components include ILECs, CLECs, wireless, SLCs, access, and toll.24
Data from the 2002/2003 Statistics of Communications Common Carriers are adjusted prior to allocating nationwide revenues to the states. Data compiled in the Statistics of Communications Common Carriers include those ILECs with annual operating revenues over $119 million for 2001 and revenues over $121 million in 2002. The Statistics of Communications Common Carriers revenue data represent approximately 92 percent of the local telephone industry based on USF loops. Here, data from the Statistics of Communications Common Carriers are expanded to include the entire ILEC industry based on USF loops. Column 1 of Table 1.17 shows USF loops at year-end 2002. Column 2 shows the percent of the ILEC industry that is included in the tables in the Statistics of Communications Common Carriers. It is the average for year-end 2001 and 2002 data.25 The adjustment formula in Column 3 is (100/Column 2). 21 Industry Analysis and Technology Division, Wireline Competition Bureau, Statistics of
Communications Common Carriers, 2002/2003 edition (February 2004). 22 Revenues for Alaska, American Samoa, Guam, the Northern Mariana Islands, and the
Virgin Islands are not estimated using data from the Statistics of Communications Common Carriers because these jurisdictions have no telephone companies subject to the FCC's Automated Reporting Management Information System (ARMIS) 43-01 and 43-08 reporting requirements.
23 Estimated intrastate telephone revenues for Alaska, American Samoa, Guam, the
Northern Mariana Islands, and the Virgin Islands are determined by multiplying the nationwide average intrastate telephone revenues per loop by number of loops in the jurisdiction.
24 Estimated interstate telephone revenues for Alaska, American Samoa, Guam, the
Northern Mariana Islands, and the Virgin Islands are determined by multiplying the nationwide average interstate telephone revenues per access minute by number of access minutes in the jurisdiction.
25 See Table 5.1 of the Statistics of Communications Common Carriers, 2002/2003 edition,

1 - 10
In Table 1.18, ILECs’ state local exchange revenues are allocated based on local exchange
service and state miscellaneous revenues from Table 2.11 of the 2002/2003 Statistics of Communications Common Carriers. Local exchange revenues for allocation are the product of reported ILECs’ local exchange service and miscellaneous revenues and the adjustment formula in Table 1.17. Allocation percentages in each state are the ratio of the state’s allocation revenues to nationwide revenues. Local exchange revenues by type are determined by multiplying the allocation factor by the type of revenues (see Table 1.14).
In Table 1.19, we allocate interstate and intrastate CLEC revenues on a state-by-state basis by multiplying national revenues (see Table 1.14) by an allocation percentage. For those states with publicly available data on CLEC lines that exceed 100,000, the allocation percentage is determined by dividing the number of CLEC lines as reported in FCC Form 477 by nationwide CLEC lines.26 It is more difficult to determine the allocation percentage for the other states. For these states, the allocation percentage is the product of the following two percentages: 1) the percentage of nationwide CLEC lines that are in states in which CLEC line totals are not publicly available or have fewer than 100,000 CLEC lines, and 2) the ratio of Regional Bell Operating Company (RBOC) resold lines and UNE loops in the state as compared to RBOC resold lines and UNE loops in all states in which CLEC lines are not reported or have fewer than 100,000 CLEC lines reported.27
In Table 1.20, we allocate interstate and intrastate mobile wireless revenues on a state-by-
state basis by multiplying national revenues (see Table 1.14) by an allocation percentage. The allocation percentage is determined by dividing the number of wireless numbers in a state using data from FCC Form 502 (Numbering Resources Utilization/Forecasting) by nationwide wireless numbers.
SLC revenues are allocated by state in Table 1.21. The sum of residential non-lifeline lines (including both primary and non-primary lines) and single-line business lines are estimated by multiplying residential non-lifeline lines and single-line business lines from Table 2.17 of the 2002/2003 Statistics of Communications Common Carriers by the adjustment factor from Table 1.17. Column 1 shows primary residential lines and single-line business lines which is the difference between total residential and single-line business lines, and non-primary lines. Non-primary residential lines are estimated by multiplying the percentage of non-primary lines by the sum of residential non-lifeline lines and single-line business lines reported in Table 2.17 of the
for year-end 2002 data.
26 See <http://www.fcc.gov/wcb/iatd/comp.html> for CLEC lines as of June 2002. 27 See <http://www.fcc.gov/wcb/iatd/comp.html> for RBOC data on resold lines and UNE
loops as of June 2002.

1 - 11
Statistics of Communications Common Carriers.28 Multiline business lines (Column 3) are estimated for the industry by multiplying the number of lines in Table 2.17 of the Statistics of Communications Common Carriers by the adjustment factor in Table 1.17.
Primary residential and single-line business lines SLC rates per month, shown in Column 4 are the weighted average of rates filed in the Tariff Review Plan (TRP) for price-cap carriers from the July 2001 and July 2002 filings and from NECA pool and rate-of-return carriers.29 Non-primary SLC revenues per line per month for price-cap companies, shown in Column 5, are the weighted average of rates filed in the TRPs from the July of 2001 and July of 2002 filings. Multiline business SLC rates per line per month in each state, shown in Column 6, are estimated based on the rates in the July 2001 and July 2002 TRP filings for price-cap companies and from NECA pool and rate-of-return carriers.30
Revenues used for allocating SLC revenues by state are determined by the following formula: 12 * [primary residential and single-line business SLC per line per month * (primary residential lines and single-line business lines) + multiline business SLC per line per month * (multiline business lines) + non-primary lines * non-primary SLC per line per month]. Allocation percentage in each state is the ratio of the state’s allocation revenues to nationwide revenues. SLC revenues are determined by multiplying the allocation factor by the type of revenues (see Table 1.14).
In Table 1.22, interstate access revenues and private line revenues are allocated on a state-by-state basis based on net access revenues. Gross access revenues for allocation are the product of interstate access revenues from Table 2.11 of the 2002/2003 Statistics of Communications Common Carriers and the adjustment formula presented in Table 1.17. Revenues for allocation are the difference between gross access revenues for allocation and subscriber line charge revenues. Allocation percentages in each state are the ratio of the state’s allocation revenues to nationwide revenues. Access revenues by type are determined by multiplying the allocation factors by the type of revenues (see Table 1.14). 28 Carriers that are not subject to price-cap regulation charge the same rate for a customer's
first line as they do for additional lines. Staff estimated the percentage of non-lifeline residential and single-line business lines that are charged the non-primary access rates based on data that the Commission receives from access filings from price-cap carriers and from ARMIS 43-08 filings.
29 Carrier USF loop counts are used as weights. We assume that the residential SLC for
NECA pool and rate-of-return carriers during the relevant time period was $3.50. 30 The rates of NECA pool carriers and rate-of-return carriers are assumed to be $9.20 per
line per month for multiline business, and $5.50 per line per month for residential and single-line business.

1 - 12
In Table 1.23, intrastate access revenues are allocated between states based on intrastate
access revenues from Table 2.11 of the 2002/2003 Statistics of Communications Common Carriers. Intrastate access revenues for allocation are the product of these access revenues and the adjustment formula in Table 1.17. Allocation percentage in each state is the ratio of the state’s allocation revenues to nationwide revenues. Access revenues by type are determined by multiplying the allocation factor by the type of revenues (see Table 1.14).
Table 1.24 shows ILEC toll revenues of large ILECs reported in Table 2.11 of the Statistics of Communications Common Carriers, and ILEC intrastate toll revenues.31 ILEC intrastate toll revenues are the product of ILEC reported revenues and the adjustment formula in Table 1.17.
Table 1.25 shows how non-LECs’ intrastate toll revenues are allocated between states based on intrastate access minutes and intrastate access revenues.32 Non-LEC toll is the difference between intrastate toll revenues and LEC toll revenues.33 Intrastate toll revenues are reported in Table 1.14, and LEC toll revenues are reported in Table 1.24. Column 1 shows access minutes for allocation. Access minutes for allocation are the product of intrastate-interLATA access minutes from Table 2.5 of the 2002/2003 Statistics of Communications Common Carriers and the adjustment formula in Table 1.17. Column 2 shows each state’s percentage of intrastate access minutes. Column 3 shows each state’s percentage of intrastate access revenues.34 The allocation percentages for non-LECs’ intrastate toll revenues, presented in Column 4, are (75% * Column 2) + (25% * Column 3). Intrastate toll revenues by type presented in Columns 5 and 6 are determined by multiplying the allocation percentage by the type of revenues.
In Table 1.26, interstate toll revenues are allocated on a per state basis by interstate access minutes. Interstate access minutes are from Table 8.4. The allocation percentages are each state’s percentage of interstate access minutes. Interstate toll revenues by type presented are determined by multiplying the allocation percentage by the type of revenues. (see Table 1.14).
31 ILECs’ toll revenues are assumed to be intrastate revenues. 32 Intrastate access revenues are a proxy for intrastate toll rates. 33 We assume that all LEC toll revenues are end-user revenues. 34 Intrastate access revenues are reported in Table 1.23. Non-LEC toll is the difference
between intrastate toll revenues and LEC toll. LEC toll is assumed to be end-user toll. Intrastate toll revenues are reported in Table 1.14 and LEC toll in Table 1.24.

Table 1.1Total Telecommunications Industry Revenues 1/
(Dollar Amounts Shown in Millions)
Preliminary 1997 1998 1999 2000 2001 2002 2003 5/
Carrier's Carrier Revenues 2/
Local Service 3/ $28,289 $29,374 $33,156 $36,621 $40,108 $38,412 $38,041Wireless Service 2,752 3,060 4,652 5,144 6,180 5,020 5,086Toll Service 11,598 13,448 14,934 21,849 19,999 16,476 18,654
Intrastate 16,201 18,892 22,293 25,553 27,848 25,770 27,347Interstate and International 4/ 26,562 27,114 30,449 38,060 38,439 34,138 34,434
Total 42,639 45,882 52,742 63,613 66,287 59,907 61,781
End User Revenues 2/
Local Service 3/ 69,137 75,189 78,608 84,526 87,704 88,712 90,141Wireless Service 30,199 33,714 43,843 56,857 68,507 76,501 84,770Toll Service 89,193 91,607 93,311 87,767 79,302 67,222 59,028
Intrastate 117,454 123,216 134,919 147,465 155,347 154,815 153,708Interstate and International 4/ 70,952 77,170 80,844 81,685 80,165 77,619 80,231
Total 188,406 200,386 215,763 229,149 235,513 232,434 233,939
Total Revenues
Local Service 3/ 97,426 104,563 111,764 121,147 127,812 127,123 128,181Wireless Service 32,951 36,775 48,495 62,000 74,687 81,521 89,857Toll Service 100,791 105,055 108,246 109,615 99,301 83,697 77,682
Intrastate 133,655 142,108 157,212 173,018 183,195 180,585 181,055Interstate and International 4/ 97,514 104,284 111,293 119,745 118,605 111,756 114,665
Total $231,168 $246,392 $268,505 $292,762 $301,800 $292,341 $295,720
Note: Detail may not add to totals due to rounding.
1/
2/
3/
4/
5/
Source: Industry Analysis and Technology Division, Wireline Competition Bureau, Telecommunications Industry Revenues (March 2004). Preliminary 2003 data are based on FCC Form 499-Q filings
Data include revenues for de minimis filers as well as for other carriers that are exempt from universal service contribution requirements.
Carrier's carrier revenues are reported on the FCC Form 499-A as sales to other universal service contributors for resale. This includes, for example, access services that local exchange carriers provide to toll carriers. Sales to de minimis resellers, end-user customers, governments, non-profits, and any other non-contributors are treated as end-user revenues. Filers contribute to the universal service funding mechanisms based on their end-user revenues.
Payphone revenues are included with local service revenues in this table.
Revenues from calls that both originate and terminate in foreign points are reported as end-user revenues, and are included in this table, but are not included in the universal service contribution base.
The preliminary 2003 data are based on FCC Form 499-Q filings, FCC Form 499Q filers do not separate revenue by type of service. The service breakdowns shown for 2003 are based on type of reporting carrier. For example, revenues from filers that identified themselves as IXCs in their most recent FCC Form 499-A filing were classified as toll revenues.
1 - 13
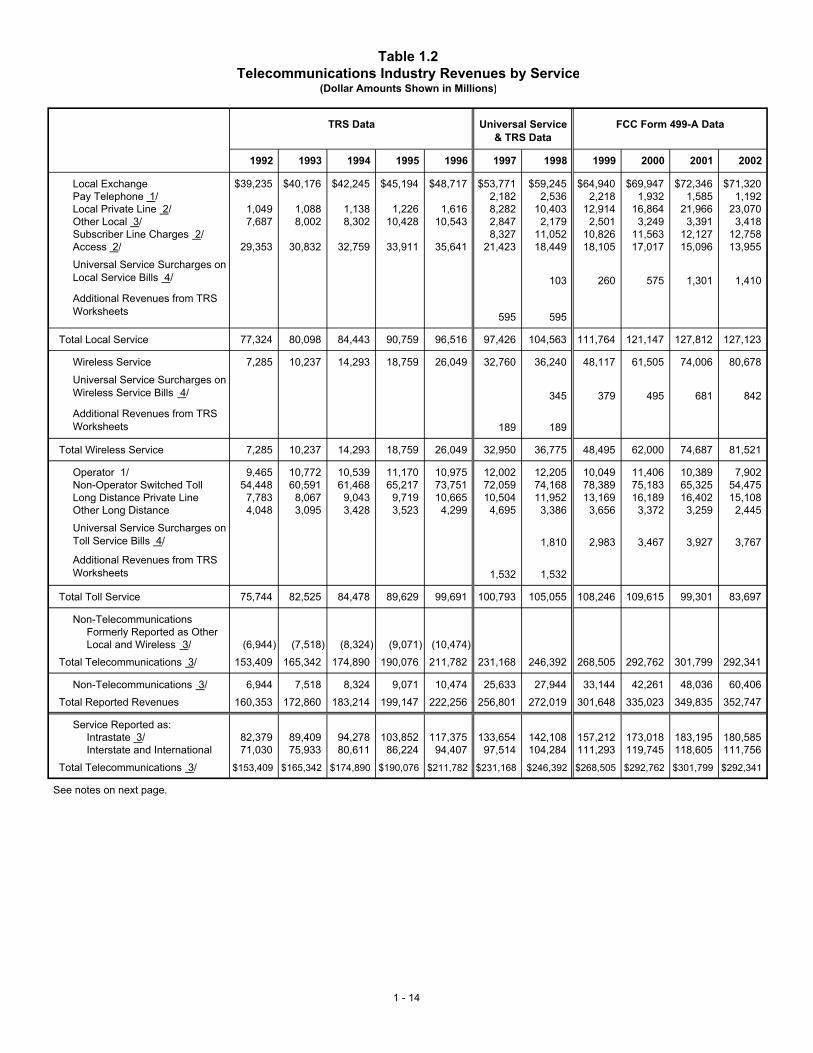
Table 1.2Telecommunications Industry Revenues by Service
(Dollar Amounts Shown in Millions)
TRS Data Universal Service FCC Form 499-A Data& TRS Data
1992 1993 1994 1995 1996 1997 1998 1999 2000 2001 2002
Local Exchange $39,235 $40,176 $42,245 $45,194 $48,717 $53,771 $59,245 $64,940 $69,947 $72,346 $71,320Pay Telephone 1/ 2,182 2,536 2,218 1,932 1,585 1,192Local Private Line 2/ 1,049 1,088 1,138 1,226 1,616 8,282 10,403 12,914 16,864 21,966 23,070Other Local 3/ 7,687 8,002 8,302 10,428 10,543 2,847 2,179 2,501 3,249 3,391 3,418Subscriber Line Charges 2/ 8,327 11,052 10,826 11,563 12,127 12,758Access 2/ 29,353 30,832 32,759 33,911 35,641 21,423 18,449 18,105 17,017 15,096 13,955
103 260 575 1,301 1,410
595 595
Total Local Service 77,324 80,098 84,443 90,759 96,516 97,426 104,563 111,764 121,147 127,812 127,123
Wireless Service 7,285 10,237 14,293 18,759 26,049 32,760 36,240 48,117 61,505 74,006 80,678
345 379 495 681 842
189 189
Total Wireless Service 7,285 10,237 14,293 18,759 26,049 32,950 36,775 48,495 62,000 74,687 81,521
Operator 1/ 9,465 10,772 10,539 11,170 10,975 12,002 12,205 10,049 11,406 10,389 7,902Non-Operator Switched Toll 54,448 60,591 61,468 65,217 73,751 72,059 74,168 78,389 75,183 65,325 54,475Long Distance Private Line 7,783 8,067 9,043 9,719 10,665 10,504 11,952 13,169 16,189 16,402 15,108Other Long Distance 4,048 3,095 3,428 3,523 4,299 4,695 3,386 3,656 3,372 3,259 2,445
1,810 2,983 3,467 3,927 3,767
1,532 1,532
Total Toll Service 75,744 82,525 84,478 89,629 99,691 100,793 105,055 108,246 109,615 99,301 83,697
Non-Telecommunications Formerly Reported as OtherLocal and Wireless 3/ (6,944) (7,518) (8,324) (9,071) (10,474)
Total Telecommunications 3/ 153,409 165,342 174,890 190,076 211,782 231,168 246,392 268,505 292,762 301,799 292,341
Non-Telecommunications 3/ 6,944 7,518 8,324 9,071 10,474 25,633 27,944 33,144 42,261 48,036 60,406Total Reported Revenues 160,353 172,860 183,214 199,147 222,256 256,801 272,019 301,648 335,023 349,835 352,747
Service Reported as:Intrastate 3/ 82,379 89,409 94,278 103,852 117,375 133,654 142,108 157,212 173,018 183,195 180,585Interstate and International 71,030 75,933 80,611 86,224 94,407 97,514 104,284 111,293 119,745 118,605 111,756
Total Telecommunications 3/ $153,409 $165,342 $174,890 $190,076 $211,782 $231,168 $246,392 $268,505 $292,762 $301,799 $292,341
Universal Service Surcharges on Local Service Bills 4/
Additional Revenues from TRS Worksheets
Universal Service Surcharges on Wireless Service Bills 4/
Additional Revenues from TRS Worksheets
Universal Service Surcharges on Toll Service Bills 4/
Additional Revenues from TRS Worksheets
See notes on next page.
1 - 14

4/ Charges on end-user bills identified as recovering state or federal universal service contributions are reported separately from local, wireless and toll revenues. Reported amounts are apportioned between local, wireless and toll service based on the proportions of local, wireless and toll intrastate and interstate revenues by type of carrier.
Source: Industry Analysis and Technology Division, Wireline Competition Bureau, Telecommunications Industry Revenues (March 2004). Data for 1992 through 1996 summarized from FCC Form 431 TRS Worksheets. Data for 1992 through 1996 summarized from FCC Form 431 TRS Worksheets. Data for 1997 and 1998 primarily based on FCC Form 457 Universal Service Worksheets. Starting in 1999, data summarized from FCC Form 499-A Telecommunications Reporting Worksheets, which replaced both FCC Form 431 and FCC Form 457.
2/ TRS Worksheet filers generally reported special access revenues as access revenues. Reporting changes implemented with the Universal Service Worksheet explain the increase in local private line revenues and the fall in access revenues shown for 1997. TRS Worksheet filers included subscriber line charges with other access charges. For the years 1992 - 1996, these revenues have been disaggregated by assuming that the end-user access revenues in Table 4.2 of Statistics of Communications Common Carriers represent 93% of industry total subscriber line charge revenues. Universal Service Worksheet filers report subscriber line charges in a separate category. The increase from 1997 to 1998 represents PICC charges levied by ILECs as well as $1.2 billion of PICC pass-through charges levied by toll carriers.
3/ Significant amounts of enhanced services, billing and collection, CPE and other non-telecommunications revenues were reported in the TRS mobile and other local service categories through 1996. Universal Service Worksheet filers report these revenues in the non-telecommunications category. For prior years, the amounts of non-telecommunications revenues reported as mobile and other local revenues were estimated as 70% of the amounts that Tier 1 ILECs reported in ARMIS as miscellaneous and nonregulated revenues (currently account 5200 + account 5280) and 10% of amounts reported as mobile service revenue.
Note: Detail may not add to totals due to rounding. Some data for prior years have been revised.TRS filers generally reported pay telephone revenues as local service revenues, access revenues or operator toll revenues. The Universal Service and FCC Form 499-A worksheets contain a separate category for payphone coin revenues. Starting in 1997, payphone revenues include payphone compensation received from toll carriers.
1/
Notes for Table 1.2
1 - 15

Table 1.3Telecommunications Revenues Reported by Type of Carrier
(Dollar Amounts Shown in Millions)
TRS Worksheet Data Universal Service FCC Form 499-A Data & TRS Data
Service Provider Category 1/ 1992 1993 1994 1995 1996 1997 1998 1999 2000 2001 2002
Incumbent Local Exchange Carriers 2/ $91,584 $95,228 $98,431 $102,820 $107,905 $105,154 $108,234 $112,216 $116,158 $117,885 $114,990
Competitive Access Providers (CAPs) and Competitive Local Exchange Carriers (CLECs) 69 191 281 623 1,011 1,919 3,348 5,652 9,814 12,998 13,043Local Resellers 206 410 511 879 1,393 1,538Other Local Exchange Carriers 157 36 171 11 329 406Private Carriers 112 147 87 39 15 281Shared-Tenant Service Providers 87 93 87 202 46 42
Competitors of ILECs 69 191 281 623 1,011 2,481 4,034 6,508 10,945 14,781 15,309
Fixed Local Service Providers 91,835 95,595 99,011 103,792 109,273 107,634 112,268 118,725 127,103 132,666 130,300
Payphone Providers 183 175 300 349 357 933 1,101 1,213 972 836 641
Wireless Telephony Including Cellular, 6,718 9,215 13,259 17,208 23,778 29,944 33,139 46,513 59,823 71,887 78,568 Personal Communications Service (PCS) and SMR Telephony Carriers 2/Paging & Messaging Service 2/ 2,861 3,161 3,232 3,102 2,197 1,473Specialized Mobile Radio (SMR) 186 191 206 Dispatch Wireless Data Service Providers 63 36 214Other Mobile Service Providers 670 964 938 1,419 2,121 225 731 159 128 110 220
Wireless Service Providers 7,387 10,179 14,197 18,627 25,900 33,030 37,032 50,152 63,280 74,596 80,467
Interexchange Carriers (IXCs) 57,341 61,118 66,381 70,938 79,057 79,080 83,443 87,570 87,311 81,272 68,146Operator Service Providers (OSPs) 558 695 536 500 461 603 590 337 635 611 554Prepaid Calling Card Providers 16 238 519 888 866 727 133 460Satellite Service Providers 1,011 475 280 336 373 406Toll Resellers 1,293 1,869 2,840 4,220 6,564 8,010 9,885 9,211 10,641 8,797 9,279Other Toll Carriers 2,186 711 709 773 577 348 710 150 1,758 2,516 2,089
Toll Service Providers 61,378 64,393 70,466 76,447 86,896 89,570 95,992 98,414 101,407 93,702 80,934
Non-Telecommunications Revenues in Prior Year Data 2/ (6,944) (7,518) (8,324) (9,071) (10,474)
(248) 2,693 (461) 280 187 0 0 0 0 0 0
Total Telecommunications Revenues $153,409 $165,342 $174,890 $190,076 $211,782 $231,168 $246,392 $268,505 $292,762 $301,799 $292,341
1/
2/
3/
Source: Industry Analysis and Technology Division, Wireline Competition Bureau, Telecommunications Industry Revenues (March 2004).
Filers are asked to select for themselves a service provider category that best describes their operations. The choices have changed over the years. For example, most satellite service providers identified themselves as other toll carriers in their 1997 FCC Form 431 TRS worksheets because there was no separate category for satellite service providers.Significant amounts of enhanced service, billing and collection, CPE and other non-telecommunications revenues were reported on TRS worksheets by incumbent local exchange carriers (ILECs) and wireless carriers through 1996. Universal Service Worksheet filers report these revenues in the non-telecommunications category. For prior years, the amounts of non-telecommunications revenues reported as mobile and other local revenues were estimated as 70% of the amounts that Tier 1 ILECs reported in ARMIS as miscellaneous and nonregulated revenues (currently account 5200 + account 5280) and 10% of amounts reported as mobile service revenues.Other adjustments include some amounts withheld to preserve confidentiality and revisions made after the initial publication of the data.
Other Adjustments 3/
1 - 16

Table 1.4Contribution Base Revenues By Program 1 /: 2002
(Dollar Amounts Shown in Millions)
2002
Revenues subject to universal service contributionInterstate and international end-user revenues $77,619
less revenues for international - to - international services 636
less international revenues of subject filers that were excluded because interstate toll represented less than 12% of combined interstate and international revenues 2/ 1,134
less interstate and other international revenues for 2,262 filers who are de minimis or otherwise exempt from universal service support requirements 71
equals $75,778
Revenues subject to TRS contribution Interstate and international end-user revenues $77,619
less interstate and international revenues for 410 filers who claim to be exempt from interstate telecommunications relay service (TRS) contribution requirements 296
less interstate and international revenues for services provided for resale but reported as end user because it was provided to carriers that do not contribute to universal service support mechanisms 222
equals $77,101
Revenues subject to NANPA contribution Total telecommunications service end-user revenues (including intrastate, interstate and international) $232,434
less telecommunications revenues for 583 filers who claim to be exempt from North American Numbering Plan Administration (NANPA) contribution requirements 337
less telecommunications revenues for services provided for resale but reported as end user because it was provided to carriers that do not contribute to universal service support mechanisms 264
equals $231,833
Revenues subject to LNP contribution Total telecommunications service end-user revenues (including intrastate, interstate and international) $232,434
less telecommunications revenues for 584 filers who claim to be exempt from local number portability administration (LNP) contribution requirements 335
less telecommunications revenues for services provided for resale but reported as end user because it was provided to carriers that do not contribute to universal service support mechanisms 264
equals $231,835
1/
2/
This table shows how contribution bases differ for different programs and provides relative magnitudes, but does not provide the actual amounts used for determining contribution amounts. Amounts shown represent the amounts contained in the FCC Form 499-A database as of October 22, 2003. The universal service administrator continues to receive additional and corrected filings. Exempt amounts were based on revenues and the filer certification statement contained in the FCC Form 499-A filings. The fund administrators use carrier type, revenue type and additional information requested from filers to review exemption claims (and in some instances, failure to make claims.) The universal service fund administrator bills delinquent filers based on estimated revenues and therefore can include estimated revenue amounts in contribution base amounts. As a result of these factors, actual contribution bases have been based on slightly different amounts than those shown. Note also that universal service contribution factors are set quarterly based on FCC Form 499-Q filings. FCC Form 499-A data are used for true-up and auditing purposes. Also note that local number portability contribution amounts are determined by region of the country rather than on a nationwide basis.International revenues are excluded from the contribution base if the total amount of interstate revenues for the filing entity consolidated with all affiliates is less than 12% of the total of interstate and international revenues for the filing entity consolidated with all affiliates. See 47 C.F.R. § 54.706(c). The threshold was increased from 8% to 12% in 2002. See Federal-State Joint Board on Universal Service , et al. , CC Docket Nos. 96-45, 98-171, 90-571, 92-237, 99-200, 95-166, 98-170, Further Notice of Proposed Rulemaking and Report and Order , 17 FCC Rcd 3752, 3806, para. 125 (2002).
Source: Industry Analysis and Technology Division, Wireline Competition Bureau, Telecommunications Industry Revenues (March 2004).
1 - 17
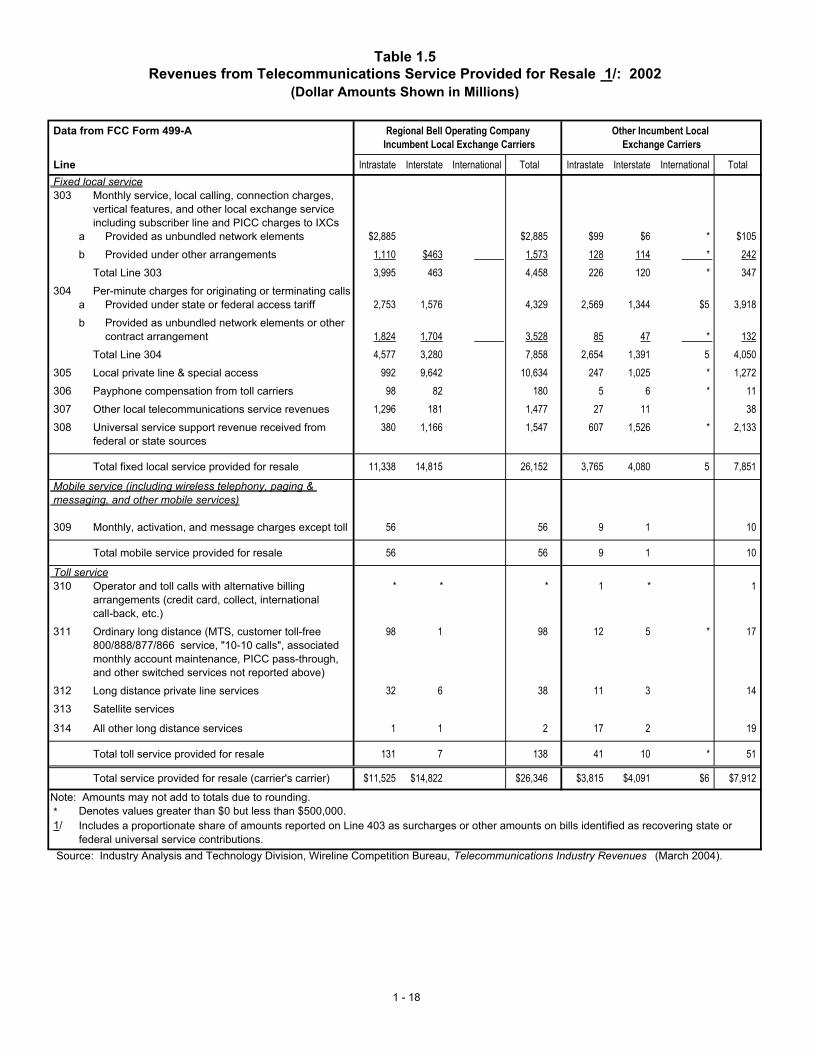
Table 1.5Revenues from Telecommunications Service Provided for Resale 1/: 2002
(Dollar Amounts Shown in Millions)
Data from FCC Form 499-A Other Incumbent Local Exchange Carriers
Line Intrastate Interstate International Total Intrastate Interstate International Total Fixed local service 303 Monthly service, local calling, connection charges,
vertical features, and other local exchange service including subscriber line and PICC charges to IXCs
a Provided as unbundled network elements $2,885 $2,885 $99 $6 * $105 b Provided under other arrangements 1,110 $463 1,573 128 114 * 242
Total Line 303 3,995 463 4,458 226 120 * 347 304 Per-minute charges for originating or terminating calls
a Provided under state or federal access tariff 2,753 1,576 4,329 2,569 1,344 $5 3,918 b Provided as unbundled network elements or other
contract arrangement 1,824 1,704 3,528 85 47 * 132 Total Line 304 4,577 3,280 7,858 2,654 1,391 5 4,050
305 Local private line & special access 992 9,642 10,634 247 1,025 * 1,272 306 Payphone compensation from toll carriers 98 82 180 5 6 * 11 307 Other local telecommunications service revenues 1,296 181 1,477 27 11 38 308 Universal service support revenue received from 380 1,166 1,547 607 1,526 * 2,133
federal or state sources Total fixed local service provided for resale 11,338 14,815 26,152 3,765 4,080 5 7,851
Mobile service (including wireless telephony, paging & messaging, and other mobile services)
309 Monthly, activation, and message charges except toll 56 56 9 1 10
Total mobile service provided for resale 56 56 9 1 10 Toll service 310 Operator and toll calls with alternative billing * * * 1 * 1
arrangements (credit card, collect, international call-back, etc.)
311 Ordinary long distance (MTS, customer toll-free 98 1 98 12 5 * 17800/888/877/866 service, "10-10 calls", associated monthly account maintenance, PICC pass-through, and other switched services not reported above)
312 Long distance private line services 32 6 38 11 3 14 313 Satellite services 314 All other long distance services 1 1 2 17 2 19
Total toll service provided for resale 131 7 138 41 10 * 51 Total service provided for resale (carrier's carrier) $11,525 $14,822 $26,346 $3,815 $4,091 $6 $7,912
Note: Amounts may not add to totals due to rounding. * Denotes values greater than $0 but less than $500,000. 1/ Includes a proportionate share of amounts reported on Line 403 as surcharges or other amounts on bills identified as recovering state or
federal universal service contributions. Source: Industry Analysis and Technology Division, Wireline Competition Bureau, Telecommunications Industry Revenues (March 2004).
Incumbent Local Exchange CarriersRegional Bell Operating Company
1 - 18

Table 1.5Revenues from Telecommunications Service Provided for Resale 1/: 2002
Continued(Dollar Amounts Shown in Millions)
Data from FCC Form 499-A CLECS and Other Payphone ProvidersFixed Local Competitors
Line Intrastate Interstate International Total Intrastate Interstate International Total Fixed local service 303 Monthly service, local calling, connection charges,
vertical features, and other local exchange service including subscriber line and PICC charges to IXCs
a Provided as unbundled network elements $132 $187 $4 $322 * * b Provided under other arrangements 63 2 65
Total Line 303 195 189 4 388 * * 304 Per-minute charges for originating or terminating calls
a Provided under state or federal access tariff 686 549 4 1,239 * * b Provided as unbundled network elements or other
contract arrangement 384 233 * 616 Total Line 304 1,069 782 4 1,855 * *
305 Local private line & special access 569 110 * 679 $1 * * $1 306 Payphone compensation from toll carriers * 4 4 75 $60 $2 137 307 Other local telecommunications service revenues 173 265 * 438 5 1 * 6 308 Universal service support revenue received from 4 2 6 * * *
federal or state sources Total fixed local service provided for resale 2,011 1,351 8 3,370 81 62 2 144
Mobile service (including wireless telephony, paging & messaging, and other mobile services)
309 Monthly, activation, and message charges except toll 1 1
Total mobile service provided for resale 1 1 Toll service 310 Operator and toll calls with alternative billing 28 * * 29 1 * * 2
arrangements (credit card, collect, international call-back, etc.)
311 Ordinary long distance (MTS, customer toll-free 189 124 26 339 * * * * 800/888/877/866 service, "10-10 calls", associated monthly account maintenance, PICC pass-through, and other switched services not reported above)
312 Long distance private line services 141 397 59 596 313 Satellite services * 96 96 314 All other long distance services 30 16 * 45 * 1 * 1
Total toll service provided for resale 388 537 181 1,105 2 1 * 3 Total service provided for resale (carrier's carrier) $2,400 $1,888 $188 $4,476 $83 $63 $2 $147
Note: Amounts may not add to totals due to rounding. * Denotes values greater than $0 but less than $500,000. 1/ Includes a proportionate share of amounts reported on Line 403 as surcharges or other amounts on bills identified as recovering state or
federal universal service contributions. Source: Industry Analysis and Technology Division, Wireline Competition Bureau, Telecommunications Industry Revenues (March 2004).
1 - 19

Table 1.5Revenues from Telecommunications Service Provided for Resale 1/: 2002
Continued(Dollar Amounts Shown in Millions)
Data from FCC Form 499-A Cellular, PCS and SMR Wireless Other WirelessTelephony
Line Intrastate Interstate International Total Intrastate Interstate International Total Fixed local service 303 Monthly service, local calling, connection charges,
vertical features, and other local exchange service including subscriber line and PICC charges to IXCs
a Provided as unbundled network elements $1 * $1 b Provided under other arrangements 2.4 * 2.7 * *
Total Line 303 3 * 3 * * 304 Per-minute charges for originating or terminating calls
a Provided under state or federal access tariff $1 $1 $1 b Provided as unbundled network elements or other
contract arrangement 36 $3 * 38 Total Line 304 36 3 * 38 1 1 1
305 Local private line & special access 15 1 16 * 306 Payphone compensation from toll carriers * * * * * * 307 Other local telecommunications service revenues 1 1 2 1 3 308 Universal service support revenue received from 14 1 * 14
federal or state sources Total fixed local service provided for resale 68 4 * 72 2 2 * 4
Mobile service (including wireless telephony, paging & messaging, and other mobile services)
309 Monthly, activation, and message charges except toll 3,896 607 $12 4,516 229 77 306
Total mobile service provided for resale 3,896 607 12 4,516 229 77 306 Toll service 310 Operator and toll calls with alternative billing * * 1
arrangements (credit card, collect, international call-back, etc.)
311 Ordinary long distance (MTS, customer toll-free 343 135 2 480 4 1 * 5800/888/877/866 service, "10-10 calls", associated monthly account maintenance, PICC pass-through,
and other switched services not reported above) 312 Long distance private line services * * * 1 313 Satellite services * * * 314 All other long distance services * * 1
Total toll service provided for resale 344 136 2 482 4 1 * 5 Total service provided for resale (carrier's carrier) $4,308 $747 $14 $5,070 $236 $80 * $315
Note: Amounts may not add to totals due to rounding. * Denotes values greater than $0 but less than $500,000. 1/ Includes a proportionate share of amounts reported on Line 403 as surcharges or other amounts on bills identified as recovering state or
federal universal service contributions. Source: Industry Analysis and Technology Division, Wireline Competition Bureau, Telecommunications Industry Revenues (March 2004).
1 - 20

Table 1.5Revenues from Telecommunications Service Provided for Resale 1/: 2002
Continued(Dollar Amounts Shown in Millions)
Data from FCC Form 499-A Toll Carriers Total All Filers
Line Intrastate Interstate International Total Intrastate Interstate International Total Fixed local service 303 Monthly service, local calling, connection charges,
vertical features, and other local exchange service including subscriber line and PICC charges to IXCs
a Provided as unbundled network elements $73 $22 $67 $162 $3,190 $215 $71 $3,476 b Provided under other arrangements 74 9 * 83 1,376 589 * 1,965
Total Line 303 147 31 67 245 4,566 803 71 5,441 304 Per-minute charges for originating or terminating calls
a Provided under state or federal access tariff 48 51 4 102 6,057 3,521 12 9,590 b Provided as unbundled network elements or other
contract arrangement 40 10 2 51 2,368 1,996 2 4,365 Total Line 304 88 60 5 153 8,425 5,517 13 13,955
305 Local private line & special access 271 88 1 360 2,094 10,866 1 12,961 306 Payphone compensation from toll carriers 7 12 * 19 184 165 2 351 307 Other local telecommunications service revenues 19 1 * 20 1,522 460 * 1,982 308 Universal service support revenue received from 22 * 22 1,027 2,695 * 3,722
federal or state sources Total fixed local service provided for resale 554 193 73 819 17,819 20,506 87 38,412
Mobile service (including wireless telephony, paging & messaging, and other mobile services)
309 Monthly, activation, and message charges except toll 111 20 * 131 4,302 706 12 5,020
Total mobile service provided for resale 111 20 * 131 4,302 706 12 5,020 Toll service 310 Operator and toll calls with alternative billing 35 257 947 1,239 66 258 947 1,271
arrangements (credit card, collect, international call-back, etc.)
311 Ordinary long distance (MTS, customer toll-free 2,123 4,320 3,522 9,965 2,769 4,585 3,551 10,904800/888/877/866 service, "10-10 calls", associated monthly account maintenance, PICC pass-through,
and other switched services not reported above) 312 Long distance private line services 549 2,145 520 3,214 733 2,551 579 3,863 313 Satellite services * 80 32 112 * 81 128 209 314 All other long distance services 34 116 12 162 83 136 12 230
Total toll service provided for resale 2,740 6,919 5,033 14,692 3,650 7,611 5,216 16,476 Total service provided for resale (carrier's carrier) $3,404 $7,132 $5,105 $15,642 $25,770 $28,823 $5,315 $59,907
Note: Amounts may not add to totals due to rounding. * Denotes values greater than $0 but less than $500,000. 1/ Includes a proportionate share of amounts reported on Line 403 as surcharges or other amounts on bills identified as recovering state or
federal universal service contributions. Source: Industry Analysis and Technology Division, Wireline Competition Bureau, Telecommunications Industry Revenues (March 2004).
1 - 21

Table 1.6Revenues from Telecommunications Service Provided to End Users: 2002
(Dollar Amounts Shown in Millions)
Data from FCC Form 499-A Other Incumbent Local Exchange Carriers
Line Intrastate Interstate International Total Intrastate Interstate International Total Fixed local service 404 Monthly service, local calling, connection charges, $46,782 $255 $47,037 $7,110 $11 * $7,122
vertical features, and other local exchange service charges except for federally tariffed subscriber line charges and PICC charges
405 PICC charges levied by a local exchange carrier 277 9,547 9,824 70 1,821 * 1,891on a no-PIC customer and tariffed subscriber line charges Total local exchange (Line 404 + Line 405) 47,059 9,802 56,861 7,180 1,832 * 9,012
406 Local private line and special access service 2,756 3,327 6,083 326 182 * 508 407 Payphone coin revenues 396 1 397 28 * * 28 408 Other local telecommunications service revenues 1,099 37 1,136 83 3 * 87
Line 403 surcharges on fixed local service 1/ 196 911 1,106 32 112 144
Total fixed local service provided to end users 51,506 14,076 65,582 7,649 2,130 * 9,779 Mobile service (including wireless telephony, paging & messaging, and other mobile services) 409 Monthly and activation charges 164 * 165 40 6 46 410 Message charges including roaming, but excluding 117 7 124 17 4 20
toll charges Line 403 surcharges on mobile service 1/ 1 * 1 * * * Total mobile service provided to end users 283 8 291 57 9 67
Toll service 411 Prepaid calling card (including card sales to 3 1 4 * * * 1
customers and non-carrier distributors) reported at face value of cards
412 International calls that both originate and terminate in foreign points
413 Operator and toll calls with alternative billing 139 2 141 6 2 * 8arrangements (credit card, collect, international call- back, etc.) other than revenues reported on Line 412
414 Ordinary long distance (MTS, customer toll-free 3,327 86 $2 3,415 323 37 $2 363800/888/877/866 service, "10-10" calls, associated monthly account maintenance, PICC pass-through, and other switched services not reported above)
415 Long distance private line services 922 1 923 80 7 * 87 416 Satellite services 417 All other long distance services 45 * 45 9 1 * 11
Line 403 surcharges on toll service 1/ 8 7 15 2 2 * 4 Total toll service provided to end users 4,443 97 2 4,542 421 48 3 472
Total telecommunications service provided to $56,231 $14,181 $2 $70,414 $8,128 $2,187 $3 $10,318end users
Note: Amounts may not add to totals due to rounding. * Denotes values greater than $0 but less than $500,000. 1/ Includes a proportionate share of amounts reported on Line 403 as surcharges or other amounts on bills identified as recovering
state or federal contributions. Source: Industry Analysis and Technology Division, Wireline Competition Bureau, Telecommunications Industry Revenues (March 2004).
Regional Bell Operating Company Incumbent Local Exchange Carriers
1 - 22

Table 1.6Revenues from Telecommunications Service Provided to End Users: 2002
Continued(Dollar Amounts Shown in Millions)
Data from FCC Form 499-A CLECS and Other Payphone ProvidersFixed Local Competitors
Line Intrastate Interstate International Total Intrastate Interstate International Total Fixed local service 404 Monthly service, local calling, connection charges, $5,077 $169 $4 $5,250 * * *
vertical features, and other local exchange service charges except for federally tariffed subscriber line charges and PICC charges
405 PICC charges levied by a local exchange carrier 58 646 * 704 on a no-PIC customer and tariffed subscriber line charges Total local exchange (Line 404 + Line 405) 5,135 815 4 5,954 * * *
406 Local private line and special access service 941 1,134 * 2,074 $1 * * $1 407 Payphone coin revenues 7 3 10 354 $15 * 369 408 Other local telecommunications service revenues 149 7 * 156 1 * * 1
Line 403 surcharges on fixed local service 1/ 18 63 * 82 * * *
Total fixed local service provided to end users 6,249 2,022 4 8,275 356 15 * 372 Mobile service (including wireless telephony, paging & messaging, and other mobile services) 409 Monthly and activation charges 10 1 * 11 * * * 410 Message charges including roaming, but excluding 24 4 29
toll charges Line 403 surcharges on mobile service 1/ * * 1 Total mobile service provided to end users 34 6 * 40 * * *
Toll service 411 Prepaid calling card (including card sales to 1 1 * 2 1 1 * 2
customers and non-carrier distributors) reported at face value of cards
412 International calls that both originate and terminate in 2 2 foreign points
413 Operator and toll calls with alternative billing 47 29 5 81 102 17 * 119arrangements (credit card, collect, international call- back, etc.) other than revenues reported on Line 412
414 Ordinary long distance (MTS, customer toll-free 681 873 168 1,722 * * * * 800/888/877/866 service, "10-10" calls, associated monthly account maintenance, PICC pass-through, and other switched services not reported above)
415 Long distance private line services 129 419 13 561 416 Satellite services 4 7 * 11 417 All other long distance services 22 11 5 38 * *
Line 403 surcharges on toll service 1/ 11 87 3 101 * * * Total toll service provided to end users 895 1,427 197 2,518 102 19 * 122
Total telecommunications service provided to $7,178 $3,454 $201 $10,834 $459 $34 $1 $494end users
Note: Amounts may not add to totals due to rounding. * Denotes values greater than $0 but less than $500,000. 1/ Includes a proportionate share of amounts reported on Line 403 as surcharges or other amounts on bills identified as recovering
state or federal contributions. Source: Industry Analysis and Technology Division, Wireline Competition Bureau, Telecommunications Industry Revenues (March 2004).
1 - 23
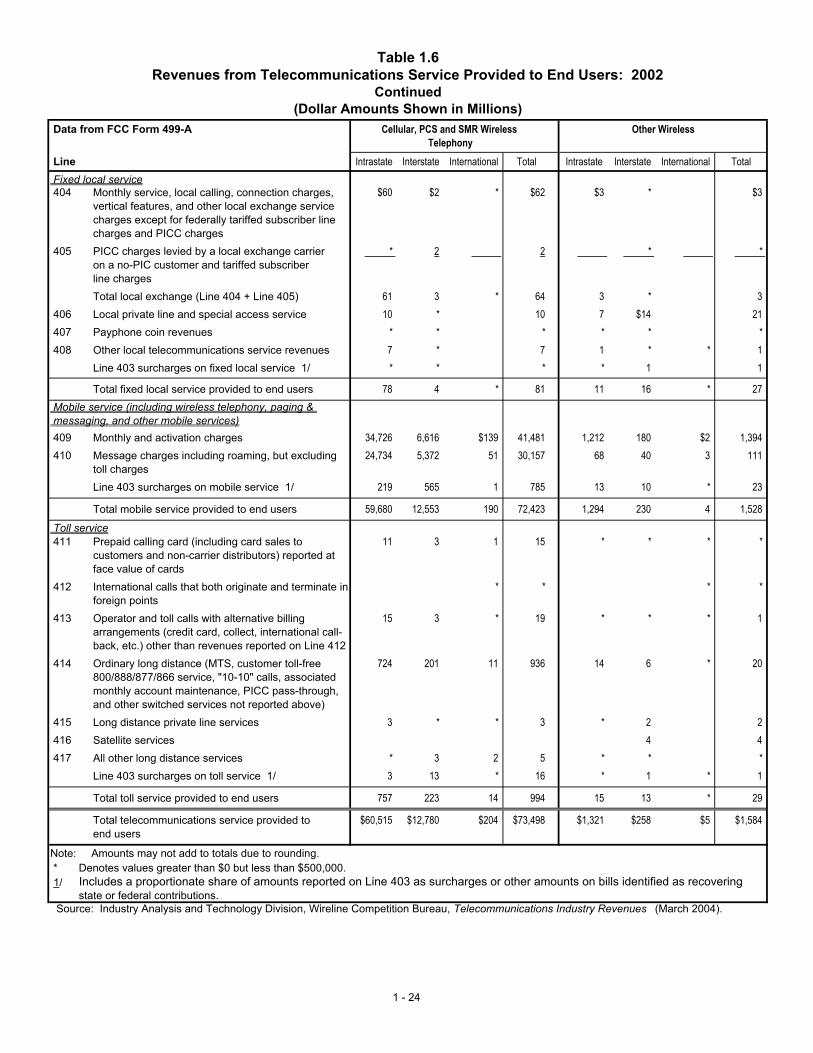
Table 1.6Revenues from Telecommunications Service Provided to End Users: 2002
Continued(Dollar Amounts Shown in Millions)
Data from FCC Form 499-A Cellular, PCS and SMR Wireless Other WirelessTelephony
Line Intrastate Interstate International Total Intrastate Interstate International Total Fixed local service 404 Monthly service, local calling, connection charges, $60 $2 * $62 $3 * $3
vertical features, and other local exchange service charges except for federally tariffed subscriber line charges and PICC charges
405 PICC charges levied by a local exchange carrier * 2 2 * * on a no-PIC customer and tariffed subscriber line charges Total local exchange (Line 404 + Line 405) 61 3 * 64 3 * 3
406 Local private line and special access service 10 * 10 7 $14 21 407 Payphone coin revenues * * * * * * 408 Other local telecommunications service revenues 7 * 7 1 * * 1
Line 403 surcharges on fixed local service 1/ * * * * 1 1
Total fixed local service provided to end users 78 4 * 81 11 16 * 27 Mobile service (including wireless telephony, paging & messaging, and other mobile services) 409 Monthly and activation charges 34,726 6,616 $139 41,481 1,212 180 $2 1,394 410 Message charges including roaming, but excluding 24,734 5,372 51 30,157 68 40 3 111
toll charges Line 403 surcharges on mobile service 1/ 219 565 1 785 13 10 * 23 Total mobile service provided to end users 59,680 12,553 190 72,423 1,294 230 4 1,528
Toll service 411 Prepaid calling card (including card sales to 11 3 1 15 * * * *
customers and non-carrier distributors) reported at face value of cards
412 International calls that both originate and terminate in * * * * foreign points
413 Operator and toll calls with alternative billing 15 3 * 19 * * * 1arrangements (credit card, collect, international call- back, etc.) other than revenues reported on Line 412
414 Ordinary long distance (MTS, customer toll-free 724 201 11 936 14 6 * 20800/888/877/866 service, "10-10" calls, associated monthly account maintenance, PICC pass-through, and other switched services not reported above)
415 Long distance private line services 3 * * 3 * 2 2 416 Satellite services 4 4 417 All other long distance services * 3 2 5 * * *
Line 403 surcharges on toll service 1/ 3 13 * 16 * 1 * 1 Total toll service provided to end users 757 223 14 994 15 13 * 29
Total telecommunications service provided to $60,515 $12,780 $204 $73,498 $1,321 $258 $5 $1,584end users
Note: Amounts may not add to totals due to rounding. * Denotes values greater than $0 but less than $500,000. 1/ Includes a proportionate share of amounts reported on Line 403 as surcharges or other amounts on bills identified as recovering
state or federal contributions. Source: Industry Analysis and Technology Division, Wireline Competition Bureau, Telecommunications Industry Revenues (March 2004).
1 - 24

Table 1.6Revenues from Telecommunications Service Provided to End Users: 2002
Continued(Dollar Amounts Shown in Millions)
Data from FCC Form 499-A Toll Carriers Total All Filers
Line Intrastate Interstate International Total Intrastate Interstate International Total Fixed local service 404 Monthly service, local calling, connection charges, $2,668 $10 $7 $2,684 $61,701 $446 $11 $62,158
vertical features, and other local exchange service charges except for federally tariffed subscriber line charges and PICC charges
405 PICC charges levied by a local exchange carrier * 338 338 405 12,353 * 12,758on a no-PIC customer and tariffed subscriber line charges Total local exchange (Line 404 + Line 405) 2,668 348 7 3,022 62,106 12,800 11 74,916
406 Local private line and special access service 985 427 * 1,412 5,026 5,083 * 10,109 407 Payphone coin revenues 24 10 4 37 808 29 4 841 408 Other local telecommunications service revenues 24 21 2 47 1,364 69 2 1,436
Line 403 surcharges on fixed local service 1/ 7 70 * 77 252 1,157 1 1,410
Total fixed local service provided to end users 3,707 875 13 4,595 69,556 19,138 18 88,712 Mobile service (including wireless telephony, paging & messaging, and other mobile services) 409 Monthly and activation charges 1,372 254 1 1,627 37,525 7,057 141 44,723 410 Message charges including roaming, but excluding 415 79 * 495 25,376 5,506 54 30,935
toll charges Line 403 surcharges on mobile service 1/ 2 29 * 31 236 606 1 842 Total mobile service provided to end users 1,789 362 1 2,152 63,137 13,168 196 76,501
Toll service 411 Prepaid calling card (including card sales to 90 144 587 820 105 150 588 843
customers and non-carrier distributors) reported at face value of cards
412 International calls that both originate and terminate in 633 633 636 636foreign points
413 Operator and toll calls with alternative billing 1,738 2,086 960 4,784 2,048 2,139 966 5,153arrangements (credit card, collect, international call- back, etc.) other than revenues reported on Line 412
414 Ordinary long distance (MTS, customer toll-free 12,071 19,328 5,717 37,116 17,141 20,531 5,899 43,572800/888/877/866 service, "10-10" calls, associated monthly account maintenance, PICC pass-through, and other switched services not reported above)
415 Long distance private line services 947 7,437 1,286 9,669 2,081 7,866 1,299 11,245 416 Satellite services 6 111 129 246 10 122 129 261 417 All other long distance services 523 1,054 69 1,646 600 1,070 77 1,746
Line 403 surcharges on toll service 1/ 115 3,364 152 3,631 139 3,473 155 3,767 Total toll service provided to end users 15,489 33,525 9,531 58,545 22,122 35,351 9,748 67,222
Total telecommunications service provided to $20,984 $34,762 $9,546 $65,292 $154,815 $67,657 $9,962 $232,434end users
Note: Amounts may not add to totals due to rounding. * Denotes values greater than $0 but less than $500,000. 1/ Includes a proportionate share of amounts reported on Line 403 as surcharges or other amounts on bills identified as recovering
state or federal contributions. Source: Industry Analysis and Technology Division, Wireline Competition Bureau, Telecommunications Industry Revenues (March 2004).
1 - 25

Table 1.7Total Revenues: 2002
(Dollar Amounts Shown in Millions)
Data from FCC Form 499-A Other Incumbent Local Exchange Carriers
Line Intrastate Interstate International Total Intrastate Interstate International Total
Fixed local service other than payphone $62,350 $28,808 $91,158 $11,382 $6,203 $6 $17,590[Lines 303, 304, 305, 307, 308, 404, 405, 406, 408, and a portion of 403 1/]
Payphone 494 83 576 33 7 * 40[Lines 306 and 407]
Mobile service 339 8 347 66 11 77[Lines 309, 409, 410, and a portion of 403 1/]
Toll service 4,574 104 $2 4,679 462 58 4 523[Lines 310, 311, 312, 313, 314, 411, 412, 413, 414, 415, 416, 417, and a portion of 403 1/]
Total telecommunications service revenues 67,756 29,002 2 96,760 11,942 6,279 9 18,230
Total telecommunications service provided for resale 11,525 14,822 26,346 3,815 4,091 6 7,912(from Table 1.5)
Total telecommunications service provided to 56,231 14,181 2 70,414 8,128 2,187 3 10,318end users (from Table 1.6)
Total telecommunications service revenues 67,756 29,002 2 96,760 11,942 6,279 9 18,230
418 Enhanced services, inside wiring maintenance, billing - - - - - - - - - 10,925 - - - - - - - - - 2,745
and collection, customer premises equipment, published directory, dark fiber, Internet access, cable TV program transmission, and non-telecommunications service revenues
419 Gross billed revenues from all sources - - - - - - - - - $107,685 - - - - - - - - - $20,975
Note: Amounts may not add to totals due to rounding. * Denotes values greater than $0 but less than $500,000. 1/ Includes a proportionate share of amounts reported on Line 403 as surcharges or other amounts on bills identified as recovering
state or federal universal service contributions. Source: Industry Analysis and Technology Division, Wireline Competition Bureau, Telecommunications Industry Revenues (March 2004).
Incumbent Local Exchange CarriersRegional Bell Operating Company
1 - 26

Table 1.7Total Revenues: 2002
Continued(Dollar Amounts Shown in Millions)
Data from FCC Form 499-A CLECS and Other Payphone ProvidersFixed Local Competitors
Line Intrastate Interstate International Total Intrastate Interstate International Total
Fixed local service other than payphone $8,253 $3,366 $12 $11,631 $9 $2 * $10[Lines 303, 304, 305, 307, 308, 404, 405, 406, 408, and a portion of 403 1/]
Payphone 7 7 14 429 75 $2 506[Lines 306 and 407]
Mobile service 35 6 * 41 * * * [Lines 309, 409, 410, and a portion of 403 1/]
Toll service 1,283 1,963 377 3,624 104 20 * 125[Lines 310, 311, 312, 313, 314, 411, 412, 413, 414, 415, 416, 417, and a portion of 403 1/]
Total telecommunications service revenues 9,578 5,342 389 15,309 542 97 2 641
Total telecommunications service provided for resale 2,400 1,888 188 4,476 83 63 2 147(from Table 1.5)
Total telecommunications service provided to 7,178 3,454 201 10,834 459 34 1 494end users (from Table 1.6)
Total telecommunications service revenues 9,578 5,342 389 15,309 542 97 2 641
418 Enhanced services, inside wiring maintenance, billing - - - - - - - - - 7,846 - - - - - - - - - 33
and collection, customer premises equipment, published directory, dark fiber, Internet access, cable TV program transmission, and non-telecommunications service revenues
419 Gross billed revenues from all sources - - - - - - - - - $23,155 - - - - - - - - - $674
Note: Amounts may not add to totals due to rounding. * Denotes values greater than $0 but less than $500,000. 1/ Includes a proportionate share of amounts reported on Line 403 as surcharges or other amounts on bills identified as recovering
state or federal universal service contributions. Source: Industry Analysis and Technology Division, Wireline Competition Bureau, Telecommunications Industry Revenues (March 2004).
1 - 27

Table 1.7Total Revenues: 2002
Continued(Dollar Amounts Shown in Millions)
Data from FCC Form 499-A Cellular, PCS and SMR Wireless Other WirelessTelephony
Line Intrastate Interstate International Total Intrastate Interstate International Total
Fixed local service other than payphone $146 $8 * $154 $14 $17 * $31[Lines 303, 304, 305, 307, 308, 404, 405, 406, 408, and a portion of 403 1/]
Payphone * * * * * * [Lines 306 and 407]
Mobile service 63,576 13,160 $202 76,938 1,523 307 $4 1,834[Lines 309, 409, 410, and a portion of 403 1/]
Toll service 1,101 359 16 1,476 19 14 * 33[Lines 310, 311, 312, 313, 314, 411, 412, 413, 414, 415, 416, 417, and a portion of 403 1/]
Total telecommunications service revenues 64,823 13,527 218 78,568 1,556 338 5 1,899
Total telecommunications service provided for resale 4,308 747 14 5,070 236 80 * 315(from Table 1.5)
Total telecommunications service provided to 60,515 12,780 204 73,498 1,321 258 5 1,584end users (from Table 1.6)
Total telecommunications service revenues 64,823 13,527 218 78,568 1,556 338 5 1,899
418 Enhanced services, inside wiring maintenance, billing - - - - - - - - - 14,845 - - - - - - - - - 897
and collection, customer premises equipment, published directory, dark fiber, Internet access, cable TV program transmission, and non-telecommunications service revenues
419 Gross billed revenues from all sources - - - - - - - - - $93,413 - - - - - - - - - $2,796
Note: Amounts may not add to totals due to rounding. * Denotes values greater than $0 but less than $500,000. 1/ Includes a proportionate share of amounts reported on Line 403 as surcharges or other amounts on bills identified as recovering
state or federal universal service contributions. Source: Industry Analysis and Technology Division, Wireline Competition Bureau, Telecommunications Industry Revenues (March 2004).
1 - 28

Table 1.7Total Revenues: 2002
Continued(Dollar Amounts Shown in Millions)
Data from FCC Form 499-A Toll Carriers Total All Filers
Line Intrastate Interstate International Total Intrastate Interstate International Total
Fixed local service other than payphone $4,230 $1,046 $82 $5,357 $86,382 $39,450 $100 $125,931[Lines 303, 304, 305, 307, 308, 404, 405, 406, 408, and a portion of 403 1/]
Payphone 30 23 4 57 992 194 6 1,192[Lines 306 and 407]
Mobile service 1,899 383 2 2,283 67,439 13,874 208 81,521[Lines 309, 409, 410, and a portion of 403 1/]
Toll service 18,229 40,444 14,564 73,237 25,772 42,962 14,964 83,697[Lines 310, 311, 312, 313, 314, 411, 412, 413, 414, 415, 416, 417, and a portion of 403 1/]
Total telecommunications service revenues 24,388 41,895 14,651 80,934 180,585 96,479 15,277 292,341
Total telecommunications service provided for resale 3,404 7,132 5,105 15,642 25,770 28,823 5,315 59,907(from Table 1.5)
Total telecommunications service provided to 20,984 34,762 9,546 65,292 154,815 67,657 9,962 232,434end users (from Table 1.6)
Total telecommunications service revenues 24,388 41,895 14,651 80,934 180,585 96,479 15,277 292,341
418 Enhanced services, inside wiring maintenance, billing - - - - - - - - - 23,116 - - - - - - - - - 60,406
and collection, customer premises equipment, published directory, dark fiber, Internet access, cable TV program transmission, and non-telecommunications service revenues
419 Gross billed revenues from all sources - - - - - - - - - $104,050 - - - - - - - - - $352,747
Note: Amounts may not add to totals due to rounding. * Denotes values greater than $0 but less than $500,000. 1/ Includes a proportionate share of amounts reported on Line 403 as surcharges or other amounts on bills identified as recovering
state or federal universal service contributions. Source: Industry Analysis and Technology Division, Wireline Competition Bureau, Telecommunications Industry Revenues (March 2004).
1 - 29

Table 1.8Revenues by Type of Carrier: 2002(Dollar Amounts Shown in Millions)
Data from FCC Form 499-A Telecommunications Services Telecommunications ServicesProvided for Resale 1/ Provided to End Users 1/
Fixed Mobile Toll Total Fixed Mobile Toll TotalLocal Local
Regional Bell Operating Companies $26,152 $56 $138 $26,346 $65,582 $290 $4,541 $70,414
Other Incumbent Local Exchange Carriers (ILECs) 7,851 10 51 7,912 9,779 67 472 10,318
Total ILECs 34,003 66 189 34,258 75,361 357 5,014 80,732
Competitive Access Providers (CAPs) and 2,823 * 804 3,627 7,178 34 2,204 9,416 Competitive Local Exchange Carriers (CLECs)
Local Resellers 260 1 72 332 1,005 2 200 1,206
Private Service Providers 5 178 182 5 * 93 98
Shared-Tenant Service Providers 1 * 1 26 * 15 41
Other Local Service Providers 281 52 334 61 4 7 72
Total Local Competitors 3,370 1 1,105 4,476 8,275 40 2,518 10,834
Fixed Local Service Providers 37,372 67 1,294 38,734 83,636 397 7,532 91,566
Payphone Service Providers 144 3 147 372 * 122 494
Wireless Telephony Including Cellular, Personal 72 4,516 482 5,069 81 72,423 994 73,498 Communications Service (PCS) and SMR Telephony Carriers
Paging & Messaging Service Providers 2 302 5 309 4 1,144 16 1,164
Specialized Mobile Radio (SMR) Dispatch * * * 204 1 206
Wireless Data and Other Mobile Service Providers 2 4 6 22 179 12 214
Wireless Service Providers 76 4,822 487 5,385 108 73,951 1,023 75,082
Interexchange Carriers (IXCs) 598 47 11,608 12,253 4,257 1,025 50,610 55,892
Operator Service Providers (OSPs) 2 36 38 3 514 517
Prepaid Calling Card Providers * 10 10 * * 450 450
Satellite Service Providers 7 114 121 12 272 284
Toll Resellers 155 76 1,275 1,506 303 1,102 6,368 7,773
Other Toll Carriers 64 * 1,649 1,714 32 13 330 375
Toll Service Providers 819 131 14,692 15,642 4,595 2,152 58,545 65,292
All Filers $38,412 $5,020 $16,476 $59,907 $88,711 $76,501 $67,222 $232,434
Note: Amounts may not add to totals due to rounding. * Denotes values greater than $0 but less than $500,000. 1/
Source: Industry Analysis and Technology Division, Wireline Competition Bureau, Telecommunications Industry Revenues (March 2004).
Telecommunications service provided for resale consists of services provided to other contributors to federal universal service support mechanisms for resale. Revenues from services provided to firms that are de minimis or otherwise exempt from federal universal service support mechanisms are reported as end-user service and are subject to contribution requirements.
1 - 30
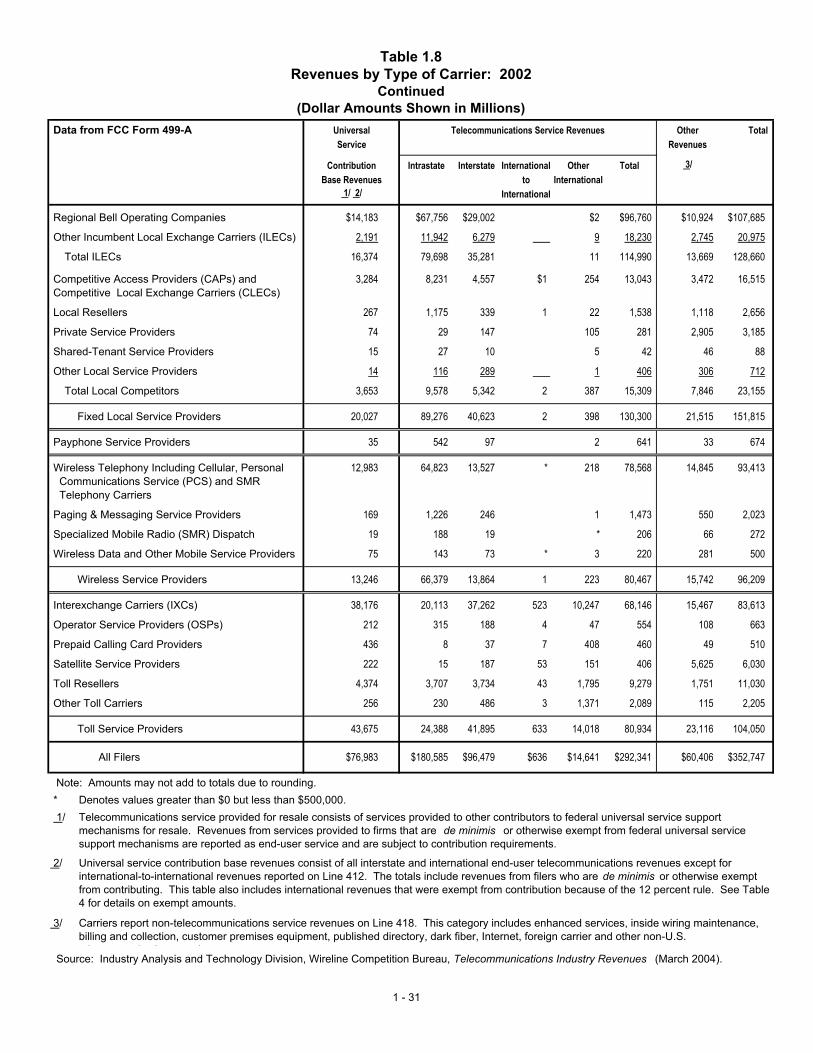
Table 1.8Revenues by Type of Carrier: 2002
Continued(Dollar Amounts Shown in Millions)
Data from FCC Form 499-A Universal Telecommunications Service Revenues Other TotalService Revenues
Contribution Intrastate Interstate International Other Total 3/Base Revenues to International
1/ 2/ International
Regional Bell Operating Companies $14,183 $67,756 $29,002 $2 $96,760 $10,924 $107,685
Other Incumbent Local Exchange Carriers (ILECs) 2,191 11,942 6,279 9 18,230 2,745 20,975
Total ILECs 16,374 79,698 35,281 11 114,990 13,669 128,660
Competitive Access Providers (CAPs) and 3,284 8,231 4,557 $1 254 13,043 3,472 16,515 Competitive Local Exchange Carriers (CLECs)
Local Resellers 267 1,175 339 1 22 1,538 1,118 2,656
Private Service Providers 74 29 147 105 281 2,905 3,185
Shared-Tenant Service Providers 15 27 10 5 42 46 88
Other Local Service Providers 14 116 289 1 406 306 712
Total Local Competitors 3,653 9,578 5,342 2 387 15,309 7,846 23,155
Fixed Local Service Providers 20,027 89,276 40,623 2 398 130,300 21,515 151,815
Payphone Service Providers 35 542 97 2 641 33 674
Wireless Telephony Including Cellular, Personal 12,983 64,823 13,527 * 218 78,568 14,845 93,413 Communications Service (PCS) and SMR Telephony Carriers
Paging & Messaging Service Providers 169 1,226 246 1 1,473 550 2,023
Specialized Mobile Radio (SMR) Dispatch 19 188 19 * 206 66 272
Wireless Data and Other Mobile Service Providers 75 143 73 * 3 220 281 500
Wireless Service Providers 13,246 66,379 13,864 1 223 80,467 15,742 96,209
Interexchange Carriers (IXCs) 38,176 20,113 37,262 523 10,247 68,146 15,467 83,613
Operator Service Providers (OSPs) 212 315 188 4 47 554 108 663
Prepaid Calling Card Providers 436 8 37 7 408 460 49 510
Satellite Service Providers 222 15 187 53 151 406 5,625 6,030
Toll Resellers 4,374 3,707 3,734 43 1,795 9,279 1,751 11,030
Other Toll Carriers 256 230 486 3 1,371 2,089 115 2,205
Toll Service Providers 43,675 24,388 41,895 633 14,018 80,934 23,116 104,050
All Filers $76,983 $180,585 $96,479 $636 $14,641 $292,341 $60,406 $352,747
Note: Amounts may not add to totals due to rounding. * Denotes values greater than $0 but less than $500,000. 1/
2/
3/
Source: Industry Analysis and Technology Division, Wireline Competition Bureau, Telecommunications Industry Revenues (March 2004).
Telecommunications service provided for resale consists of services provided to other contributors to federal universal service support mechanisms for resale. Revenues from services provided to firms that are de minimis or otherwise exempt from federal universal service support mechanisms are reported as end-user service and are subject to contribution requirements.
Universal service contribution base revenues consist of all interstate and international end-user telecommunications revenues except for international-to-international revenues reported on Line 412. The totals include revenues from filers who are de minimis or otherwise exempt from contributing. This table also includes international revenues that were exempt from contribution because of the 12 percent rule. See Table 4 for details on exempt amounts.
Carriers report non-telecommunications service revenues on Line 418. This category includes enhanced services, inside wiring maintenance, billing and collection, customer premises equipment, published directory, dark fiber, Internet, foreign carrier and other non-U.S. t l i ti i
1 - 31

Table 1.9Carrier Telecommunications Revenues Reported on FCC Form 499-Q: 2003
(Dollar Amounts Shown in Millions)
Data from FCC Form 499-Q Intrastate, Interstate Interstate and Internationaland International Revenues End-User Revenues 3/
Service Service Total Projected Projected Implied HistoricProvided Provided Billed Collected Uncollectible Billed
For To End 4/ Rate 5/Resale 1/ Users 2/
Regional Bell Operating Companies $25,775 $65,768 $91,543 $13,834 $13,564 1.9% $14,109
Other Incumbent Local Exchange 7,695 10,627 18,322 2,110 2,080 1.4% 2,495 Carriers (ILECs)
Total ILECs 33,470 76,395 109,865 15,943 15,644 1.9% 16,604
Competitive Access Providers 3,644 11,741 15,385 4,040 3,901 3.4% 3,856 (CAPs) and Competitive Local Exchange Carriers (CLECs)
Local Resellers 360 1,258 1,617 252 239 5.2% 260
Private Service Providers 92 106 198 46 46 0.1% 77
Shared-Tenant Service Providers 1 55 56 14 11 18.2% 15
Other Local Service Providers 336 96 432 24 21 13.4% 32
Total Local Competitors 4,434 13,255 17,689 4,374 4,219 3.5% 4,240
Fixed Local Service Providers 37,904 89,650 127,554 20,318 19,862 2.2% 20,844
Payphone Service Providers 137 491 627 43 40 7.2% 37
Wireless Telephony Including Cellular, 4,833 83,434 88,267 18,544 18,026 2.8% 19,226 Personal Communications Service (PCS) and SMR Telephony Carriers
Paging & Messaging Service Providers 206 880 1,086 200 139 30.4% 128
Specialized Mobile Radio (SMR) Dispatch 0 217 217 38 35 7.4% 45
Wireless Data and Other Mobile Service 47 240 286 115 112 2.4% 76 Providers
Wireless Service Providers 5,086 84,770 89,857 18,898 18,313 3.1% 19,475
Interexchange Carriers (IXCs) 13,598 47,985 61,583 32,890 31,439 4.4% 32,779
Operator Service Providers (OSPs) 33 474 507 195 171 12.6% 185
Prepaid Calling Card Providers 23 558 581 273 272 0.3% 534
Satellite Service Providers 135 158 293 200 190 4.9% 136
Toll Resellers 2,852 9,423 12,276 5,494 5,187 5.6% 5,936
Other Toll Carriers 2,014 429 2,442 300 276 8.2% 304
Toll Service Providers 18,654 59,028 77,682 39,353 37,533 4.6% 39,874
All Filers $61,781 $233,939 $295,720 $78,610 $75,747 3.6% $80,231
See notes on next page.
1 - 32

Note: Amounts may not add to totals due to rounding.
1/ Telecommunications service provided for resale consists of services provided for resale as telecommunications to other contributors to federal universal service support mechanisms. Revenues from services provided to firms that are de minimis or otherwise exempt from federal universal service support mechanisms are reported as end-user service.
2/ The FCC Form 499-A and the FCC Form 499-Q have different reporting requirements for revenues from telecommunications calls that traverse the United States but both originate and teminate in foreign points. These calls are termed international-to-international calls and are reported with end-user revenues on the FCC Form 499-A and are included in contribution bases for telecommunications relay service, local number portability and number administration. However, these revenues are exempt from universal service contribution and are not included with end-user telecommunications revenues on the FCC Form 499-Q. This table, which is based on the FCC Form 499-Q, does not include international-to-international revenues.
3/ The FCC Form 499-Q collects total, interstate and international billed end-user revenues for the most recently completed quarter. Filers also project interstate and international (but not total) billed end-user revenues for the next calendar quarter. In addition,filers project how much of the billed revenues actually will be collected. Projected collected end-user interstate and internationalrevenues form the base for universal service support contributions. For example, the May 2004 filings contain historic revenuedata for the first quarter of 2004 and projected revenue data for the third quarter of 2004.
4/ These tables show carrier's carrier and end-user telecommunications revenues reported on FCC Form 499-Q filings. Telecommunications providers who are exempt from contributing to universal service support mechanisms are not required to file this form. Some exempt providers nonetheless file and their revenues are included in the tables. In addition, some filers are notrequired to contribute on international revenues if their interstate end-user revenues represent less than 12% of their combinedinterstate and international end-user revenues -- a test referred to as the 12% rule. Thus, total interstate and international revenues shown in this table slightly exceed universal service contribution base revenues..
5/ Filers report historic billed revenues two quarters after they provide projections for the quarter. Filers subsequently report historic billed revenues for the year on their FCC Form 449-A filings. The annual data, which is not yet availablefor 2003, will provide more accurate data for the year.
Data filed on FCC Forms 499-Q Worksheets. See also: Industry Analysis and Technology Division, Wireline CompetitionBureau, Telecommunications Industry Revenues (March 2004) available at <http://www.fcc.gov/wcb/iatd/stats.html>.
Notes for Table 1.9
1 - 33

Universal Service Program Requirements and Contribution Factors for 2003(Dollar Amounts Shown in Millions)
First Second Third Fourth FullQuarter Quarter Quarter Quarter Year
All Support MechanismsProjections of demand and administrative expensesat the time the contribution factors were adopted
High CostHigh-Cost Loop Support $280.063 $278.254 $285.421 $285.728 $1,129.466Local Switching Support $106.680 $109.231 $112.669 $112.256 $440.836Long-Term Support $125.214 $127.103 $130.579 $130.579 $513.475Interstate Common Line Support $93.085 $95.873 $108.729 $106.621 $404.308Interstate Access Support Mechanism $162.500 $162.500 $162.500 $162.500 $650.000Forward-Looking High Cost Mechanism $58.452 $58.538 $60.161 $60.219 $237.370Prior Period True-ups -$42.700 -$39.456 $2.388 -$48.013 -$127.781Administrative expenses $2.125 $3.822 $4.334 $4.898 $15.179Interest income1 -$0.605 -$0.545 -$0.393 -$0.189 -$1.732
Program Total $784.814 $795.320 $866.388 $814.599 $3,261.121Low Income
Lifeline Assistance $178.095 $164.599 $176.582 $175.802 $695.078Link-Up $8.948 $7.779 $8.093 $7.500 $32.320Incremental Toll Limitation $1.135 $0.937 $1.097 $1.123 $4.292Prior Period true-ups -$2.206 -$3.388 -$12.539 -$3.958 -$22.091Administrative expenses $0.489 $0.929 $1.045 $1.737 $4.200Interest income1 -$0.321 -$0.193 -$0.241 -$0.102 -$0.857
Program Total $186.140 $170.663 $174.037 $182.102 $712.942Rural Health
Rural Health Care Support $3.020 $8.855 $7.617 $6.200 $25.692Prior Period True-ups -$0.424 $0.282 $0.078 -$0.240 -$0.304Administrative expenses $0.694 $0.696 $0.644 $0.654 $2.688Interest income1 -$0.051 -$0.033 -$0.017 -$0.019 -$0.120
Program Total $3.239 $9.800 $8.322 $6.595 $27.956Schools and Libraries
Schools and Libraries Support $552.695 $549.648 $551.956 $551.197 $2,205.496Prior Period True-ups -$26.485 $2.810 -$0.343 -$15.710 -$39.728Administrative expenses $9.805 $12.852 $10.544 $11.303 $44.504Interest income1 -$9.666 -$7.018 -$4.848 -$4.709 -$26.241
Program Total $526.349 $558.292 $557.309 $542.081 $2,184.031Grand Total $1,500.542 $1,534.075 $1,606.056 $1,545.377 $6,186.050
Applicable interstate and international end-user revenuesReported contribution base revenues $18,705.408 $18,743.028 $18,844.156 $18,607.282
Circularity Adjustment Amount carriers will contribute to USF in this quarter. -$1,302.320 -$1,534.075 -$1,606.056 -$1,545.377
Subtotal $17,403.088 $17,208.953 $17,238.100 $17,061.905Adjustment factor for uncollectibles 1.00% 1.00% 1.00% 1.00%Contribution base at the time the factor was calculated $17,229.057 $17,036.863 $17,065.719 $16,891.286
Contribution factor 7.2805% 9.1000% 9.5000% 9.2000%Contribution factor times contribution base $1,254.362 $1,550.355 $1,621.243 $1,553.998
1 Interest income is shown as negative because it is subtracted from expenses to yield the total.2 For the schools and libraries mechanism, periodic true-ups include applications of unused fund balance from prior periods.
Table 1.10
1 - 34

Universal Service Program Requirements and Contribution Factors for 2004(Dollar Amounts Shown in Millions)
First Second Third Fourth FullQuarter Quarter Quarter Quarter Year
All Support MechanismsProjections of demand and administrative expensesat the time the contribution factors were adopted
High CostHigh Cost Loop Support $297.985 $305.625 $318.224Local Switching Support $112.442 $116.409 $120.566Long Term Support $138.011 $142.900 $0.000Interstate Common Line Support $114.937 $113.324 $270.209Interstate Access Support Mechanism $162.500 $162.500 $162.500Forward-Looking High Cost Mechanism $63.577 $69.424 $70.800Prior Period True-ups -$86.468 $8.549 -$14.944Administrative expenses $3.187 $3.430 $3.588Interest income1 -$0.356 -$0.352 -$0.306
Program Total $805.815 $921.809 $930.637Low Income
Lifeline Assistance $171.362 $166.804 $185.029Link-Up $8.462 $7.333 $8.394Incremental Toll Limitation $1.145 $1.010 $1.353Prior Period true-ups -$18.456 $10.680 $6.766Administrative expenses $0.990 $1.044 $1.598Interest income1 -$0.155 -$0.171 -$0.147
Program Total $163.348 $186.700 $202.993Rural Health
Rural Health Care Support $14.601 -$0.488 $12.643Prior Period True-ups -$0.677 $0.867 $0.419Administrative expenses $0.776 $0.814 $0.808Interest income1 -$0.038 -$0.038 -$0.047
Program Total $14.662 $1.155 $13.823Schools & Libraries
Schools and Libraries Support $550.159 $349.989 $349.283Prior Period True-ups -$44.451 $38.820 $10.670Administrative expenses $12.341 $12.511 $13.217Interest income1 -$6.378 -$6.981 -$6.112
Program Total $511.671 $394.339 $367.058Grand Total $1,495.496 $1,504.003 $1,514.511
Applicable interstate and international end-user revenuesReported contribution base revenues $18,894.138 $19,100.887 $18,707.211
Circularity Adjustment Amount carriers will contribute to USF in this quarter. -$1,495.496 -$1,504.003 -$1,514.511
Subtotal $17,398.642 $17,596.884 $17,192.700Adjustment factor for uncollectibles 1.00% 1.00% 1.00%Contribution base at the time the factor was calculated $17,224.656 $17,420.915 $17,020.773
Contribution factor 8.7000% 8.7000% 8.9000%Contribution factor times contribution base $1,498.545 $1,515.620 $1,514.849
1 Interest income is shown as negative because it is subtracted from expenses to yield the total.2 For the schools & libraries mechanism, periodic true-ups include applications of unused fund balance from prior periods.
Table 1.10
1 - 35

MechanismPercent of
TotalPercent of
Total
High-Cost Support $2,949,308 56.0 % $3,273,222 61.1 % High-Cost Loop (HCL) Support 1,064,257 20.2 1,084,786 20.3 Long-Term Support (LTS) 497,731 9.4 504,089 9.4 Local Switching Support (LSS) 375,892 7.1 420,154 7.8 High-Cost Model (HCM) Support 228,119 4.3 236,881 4.4 Interstate Access Support (IAS) 610,416 11.6 621,741 11.6 Interstate Common Line Support (ICLS) 172,894 3.3 399,420 7.5 Safety Net Additive Support (SNAS) 0 0.0 6,154 0.1
Low-Income Support 676,385 12.8 715,742 13.4School and Libraries * 1,625,681 30.8 1,345,787 p 25.1Rural Health Care * 18,554 0.4 19,198 p 0.4 All Universal Service Support $5,269,929 100.0 % $5,353,949 100.0 %
p indicates preliminary
Table 1.11Universal Service Support Mechanisms
(Dollars in Thousands)
Note: Figures may not add due to rounding.
Disbursements Disbursements
2002 2003
Distribution of Universal Service Payments Chart 1.1
* Schools and libraries, and rural health care programs operate on a school year rather than a calendar year. Amounts for those programs in 2002 are for July 1, 2001 to June 30, 2002, and figures for 2003 are for July 1, 2002 to June 30, 2003. Disbursements for Schools and Libraries: as of May 6, 2004; and disbursements for Rural Health Care: as of June 14, 2004.
Source: Universal Service Administration Company (USAC). Refer to Table 1.12 for more details.
Distributions in 2003
Low Income13.4% High Cost
61.1%
Rural Health Care0.4%
Schools & Libraries
25.1%
1 - 36

(Annual Payments and Contributions in Thousands)
Payments from USF to Service Providers 1
State or JurisdictionHigh-Cost Support
Low-Income Support
Schools & Libraries
Rural Health Care
Amount % of Total Amount % of TotalAlabama $96,565 $2,706 $17,200 $8 $116,478 2.21% $71,722 1.35% $44,756Alaska 79,261 2,472 9,513 12,097 103,343 1.96% 14,095 0.27% 89,248American Samoa 875 57 1,506 0 2,439 0.05% 128 0.00% 2,311Arizona 60,429 11,556 40,852 660 113,497 2.15% 109,013 2.05% 4,484Arkansas 92,382 1,231 12,177 93 105,884 2.01% 43,974 0.83% 61,910California 85,141 314,346 224,815 230 624,533 11.85% 545,736 10.26% 78,797Colorado 68,117 3,282 12,013 144 83,557 1.59% 106,297 2.00% -22,740Connecticut 1,601 5,499 16,507 0 23,606 0.45% 81,693 1.54% -58,087Delaware 370 249 1,667 0 2,286 0.04% 20,693 0.39% -18,407Dist. of Columbia 0 1,193 3,169 0 4,362 0.08% 28,195 0.53% -23,833Florida 86,174 15,518 44,972 166 146,830 2.79% 353,181 6.64% -206,351Georgia 110,962 7,366 51,552 6 169,885 3.22% 167,301 3.15% 2,584Guam 2,609 346 2,103 0 5,058 0.10% 2,191 0.04% 2,867Hawaii 6,942 1,361 1,300 232 9,834 0.19% 22,343 0.42% -12,509Idaho 49,376 3,068 3,005 57 55,506 1.05% 26,619 0.50% 28,888Illinois 47,639 8,727 43,276 105 99,747 1.89% 227,488 4.28% -127,741Indiana 46,795 4,103 14,266 0 65,164 1.24% 100,839 1.90% -35,675Iowa 41,446 1,627 4,634 103 47,810 0.91% 50,821 0.96% -3,011Kansas 95,107 1,510 7,406 216 104,239 1.98% 49,581 0.93% 54,657Kentucky 54,117 5,578 16,328 357 76,380 1.45% 62,536 1.18% 13,844Louisiana 87,716 1,876 24,196 11 113,799 2.16% 71,903 1.35% 41,896Maine 29,548 9,779 4,547 19 43,894 0.83% 25,070 0.47% 18,823Maryland 4,679 430 12,721 0 17,831 0.34% 122,166 2.30% -104,336Massachusetts 1,348 17,611 27,600 0 46,558 0.88% 138,590 2.61% -92,031Michigan 45,665 11,963 55,468 519 113,616 2.16% 155,634 2.93% -42,018Minnesota 67,619 3,945 15,524 702 87,790 1.67% 90,700 1.71% -2,910Mississippi 167,445 2,420 25,853 35 195,753 3.71% 44,311 0.83% 151,442Missouri 87,728 3,201 22,697 35 113,662 2.16% 102,375 1.93% 11,287Montana 63,138 1,741 2,997 463 68,340 1.30% 18,390 0.35% 49,950Nebraska 31,075 1,673 5,102 452 38,301 0.73% 31,396 0.59% 6,906Nevada 24,395 3,464 2,766 81 30,707 0.58% 51,774 0.97% -21,067New Hampshire 11,930 639 815 0 13,384 0.25% 31,300 0.59% -17,915New Jersey 3,487 4,648 38,453 0 46,588 0.88% 220,442 4.15% -173,854New Mexico 46,297 5,358 46,808 193 98,656 1.87% 35,009 0.66% 63,647New York 56,501 53,358 308,156 13 418,027 7.93% 358,916 6.75% 59,111North Carolina 60,581 10,891 19,765 148 91,384 1.73% 154,543 2.91% -63,158North Dakota 31,499 2,010 1,177 380 35,067 0.67% 12,589 0.24% 22,478Northern Mariana Is. 3,560 43 2,102 0 5,704 0.11% 986 0.02% 4,718Ohio 33,940 26,811 61,359 11 122,121 2.32% 179,524 3.38% -57,403Oklahoma 86,698 12,846 23,715 64 123,324 2.34% 57,843 1.09% 65,481Oregon 68,368 4,092 8,848 66 81,374 1.54% 69,430 1.31% 11,944Pennsylvania 42,702 10,481 61,651 3 114,837 2.18% 219,708 4.13% -104,871Puerto Rico 96,756 6,619 3,733 0 107,108 2.03% 31,185 0.59% 75,923Rhode Island 62 4,933 4,287 0 9,283 0.18% 20,783 0.39% -11,501South Carolina 72,420 2,445 31,040 8 105,912 2.01% 72,537 1.36% 33,375South Dakota 31,682 3,875 5,190 258 41,005 0.78% 13,620 0.26% 27,385Tennessee 46,973 5,303 33,317 21 85,613 1.62% 98,466 1.85% -12,853Texas 206,516 45,650 182,533 48 434,746 8.25% 334,935 6.30% 99,811Utah 18,129 2,152 4,603 48 24,931 0.47% 40,295 0.76% -15,364Vermont 25,845 3,229 1,130 0 30,204 0.57% 14,349 0.27% 15,855Virgin Islands 27,637 0 5,321 81 33,039 0.63% 3,449 0.06% 29,591Virginia 69,530 2,294 17,501 129 89,454 1.70% 162,014 3.05% -72,559Washington 81,781 11,084 13,638 64 106,568 2.02% 117,426 2.21% -10,858West Virginia 80,614 480 4,959 59 86,112 1.63% 31,876 0.60% 54,236Wisconsin 68,209 6,972 16,663 71 91,915 1.74% 87,044 1.64% 4,871Wyoming 41,327 275 1,186 97 42,885 0.81% 12,223 0.23% 30,661 Total $2,949,308 $676,385 $1,625,681 $18,554 $5,269,929 100.00% $5,317,247 100.00% -$47,318
2 Estimated contributions include administrative cost of approximately $47 million. Allocation of contributions among states is an FCC staff estimate.3 Net dollar flow is positive when payments from USF to carriers exceed contributions to USF. Total is negative because of administrative expenses.
1 Data from this report: High-Cost from Table 3.13; Low-Income from Table 2.4; Schools & Libraries from Table 4.2; Rural Health Care from Table 5.2.
Table 1.12Universal Service Support Mechanisms by State: 2002
Estimated Net Dollar Flow 3
Notes: Figures may not add due to rounding. Support payments do not include quarterly true-ups. USF is an abbreviation for the Universal Service Fund.
Estimated Contributions
2 Total
1 - 37
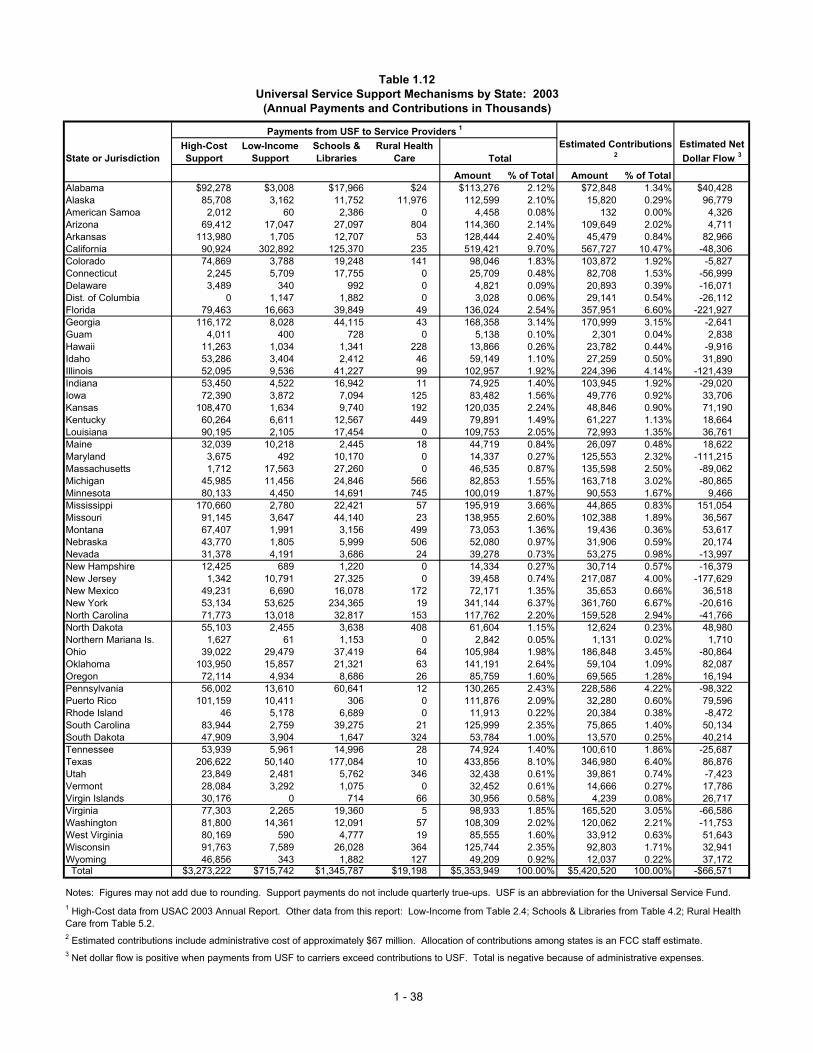
(Annual Payments and Contributions in Thousands)
Payments from USF to Service Providers 1
State or JurisdictionHigh-Cost Support
Low-Income Support
Schools & Libraries
Rural Health Care
Amount % of Total Amount % of TotalAlabama $92,278 $3,008 $17,966 $24 $113,276 2.12% $72,848 1.34% $40,428Alaska 85,708 3,162 11,752 11,976 112,599 2.10% 15,820 0.29% 96,779American Samoa 2,012 60 2,386 0 4,458 0.08% 132 0.00% 4,326Arizona 69,412 17,047 27,097 804 114,360 2.14% 109,649 2.02% 4,711Arkansas 113,980 1,705 12,707 53 128,444 2.40% 45,479 0.84% 82,966California 90,924 302,892 125,370 235 519,421 9.70% 567,727 10.47% -48,306Colorado 74,869 3,788 19,248 141 98,046 1.83% 103,872 1.92% -5,827Connecticut 2,245 5,709 17,755 0 25,709 0.48% 82,708 1.53% -56,999Delaware 3,489 340 992 0 4,821 0.09% 20,893 0.39% -16,071Dist. of Columbia 0 1,147 1,882 0 3,028 0.06% 29,141 0.54% -26,112Florida 79,463 16,663 39,849 49 136,024 2.54% 357,951 6.60% -221,927Georgia 116,172 8,028 44,115 43 168,358 3.14% 170,999 3.15% -2,641Guam 4,011 400 728 0 5,138 0.10% 2,301 0.04% 2,838Hawaii 11,263 1,034 1,341 228 13,866 0.26% 23,782 0.44% -9,916Idaho 53,286 3,404 2,412 46 59,149 1.10% 27,259 0.50% 31,890Illinois 52,095 9,536 41,227 99 102,957 1.92% 224,396 4.14% -121,439Indiana 53,450 4,522 16,942 11 74,925 1.40% 103,945 1.92% -29,020Iowa 72,390 3,872 7,094 125 83,482 1.56% 49,776 0.92% 33,706Kansas 108,470 1,634 9,740 192 120,035 2.24% 48,846 0.90% 71,190Kentucky 60,264 6,611 12,567 449 79,891 1.49% 61,227 1.13% 18,664Louisiana 90,195 2,105 17,454 0 109,753 2.05% 72,993 1.35% 36,761Maine 32,039 10,218 2,445 18 44,719 0.84% 26,097 0.48% 18,622Maryland 3,675 492 10,170 0 14,337 0.27% 125,553 2.32% -111,215Massachusetts 1,712 17,563 27,260 0 46,535 0.87% 135,598 2.50% -89,062Michigan 45,985 11,456 24,846 566 82,853 1.55% 163,718 3.02% -80,865Minnesota 80,133 4,450 14,691 745 100,019 1.87% 90,553 1.67% 9,466Mississippi 170,660 2,780 22,421 57 195,919 3.66% 44,865 0.83% 151,054Missouri 91,145 3,647 44,140 23 138,955 2.60% 102,388 1.89% 36,567Montana 67,407 1,991 3,156 499 73,053 1.36% 19,436 0.36% 53,617Nebraska 43,770 1,805 5,999 506 52,080 0.97% 31,906 0.59% 20,174Nevada 31,378 4,191 3,686 24 39,278 0.73% 53,275 0.98% -13,997New Hampshire 12,425 689 1,220 0 14,334 0.27% 30,714 0.57% -16,379New Jersey 1,342 10,791 27,325 0 39,458 0.74% 217,087 4.00% -177,629New Mexico 49,231 6,690 16,078 172 72,171 1.35% 35,653 0.66% 36,518New York 53,134 53,625 234,365 19 341,144 6.37% 361,760 6.67% -20,616North Carolina 71,773 13,018 32,817 153 117,762 2.20% 159,528 2.94% -41,766North Dakota 55,103 2,455 3,638 408 61,604 1.15% 12,624 0.23% 48,980Northern Mariana Is. 1,627 61 1,153 0 2,842 0.05% 1,131 0.02% 1,710Ohio 39,022 29,479 37,419 64 105,984 1.98% 186,848 3.45% -80,864Oklahoma 103,950 15,857 21,321 63 141,191 2.64% 59,104 1.09% 82,087Oregon 72,114 4,934 8,686 26 85,759 1.60% 69,565 1.28% 16,194Pennsylvania 56,002 13,610 60,641 12 130,265 2.43% 228,586 4.22% -98,322Puerto Rico 101,159 10,411 306 0 111,876 2.09% 32,280 0.60% 79,596Rhode Island 46 5,178 6,689 0 11,913 0.22% 20,384 0.38% -8,472South Carolina 83,944 2,759 39,275 21 125,999 2.35% 75,865 1.40% 50,134South Dakota 47,909 3,904 1,647 324 53,784 1.00% 13,570 0.25% 40,214Tennessee 53,939 5,961 14,996 28 74,924 1.40% 100,610 1.86% -25,687Texas 206,622 50,140 177,084 10 433,856 8.10% 346,980 6.40% 86,876Utah 23,849 2,481 5,762 346 32,438 0.61% 39,861 0.74% -7,423Vermont 28,084 3,292 1,075 0 32,452 0.61% 14,666 0.27% 17,786Virgin Islands 30,176 0 714 66 30,956 0.58% 4,239 0.08% 26,717Virginia 77,303 2,265 19,360 5 98,933 1.85% 165,520 3.05% -66,586Washington 81,800 14,361 12,091 57 108,309 2.02% 120,062 2.21% -11,753West Virginia 80,169 590 4,777 19 85,555 1.60% 33,912 0.63% 51,643Wisconsin 91,763 7,589 26,028 364 125,744 2.35% 92,803 1.71% 32,941Wyoming 46,856 343 1,882 127 49,209 0.92% 12,037 0.22% 37,172 Total $3,273,222 $715,742 $1,345,787 $19,198 $5,353,949 100.00% $5,420,520 100.00% -$66,571
2 Estimated contributions include administrative cost of approximately $67 million. Allocation of contributions among states is an FCC staff estimate.3 Net dollar flow is positive when payments from USF to carriers exceed contributions to USF. Total is negative because of administrative expenses.
1 High-Cost data from USAC 2003 Annual Report. Other data from this report: Low-Income from Table 2.4; Schools & Libraries from Table 4.2; Rural Health Care from Table 5.2.
Table 1.12Universal Service Support Mechanisms by State: 2003
Estimated Net Dollar Flow 3
Notes: Figures may not add due to rounding. Support payments do not include quarterly true-ups. USF is an abbreviation for the Universal Service Fund.
Estimated Contributions
2 Total
1 - 38

Table 1.13Total Telecommunications Revenues: 2002
(Dollars in Millions) End User Carrier's Carrier Total: End User + Carrier's Carrier
PercentInterstate Intrastate Total Interstate Intrastate Total Interstate Intrastate Total of Total
Alabama $1,040 $2,293 $3,333 $429 $293 $721 $1,468 $2,586 $4,054 1.39 %Alaska 227 388 614 100 65 164 326 452 778 0.27American Samoa 2 9 11 1 1 2 3 10 13 0.00Arizona 1,576 2,456 4,032 630 387 1,017 2,206 2,843 5,049 1.73Arkansas 661 1,303 1,965 298 225 523 959 1,528 2,488 0.85California 8,126 19,505 27,631 3,568 3,664 7,231 11,693 23,169 34,862 11.93Colorado 1,496 2,715 4,211 679 423 1,101 2,175 3,138 5,312 1.82Connecticut 1,186 1,900 3,086 534 237 771 1,721 2,137 3,857 1.32Delaware 300 403 703 125 50 175 425 452 877 0.30Dist. of Columbia 417 586 1,003 268 74 342 685 660 1,345 0.46Florida 5,141 9,260 14,401 2,172 1,663 3,836 7,314 10,923 18,237 6.24Georgia 2,452 5,024 7,476 1,186 717 1,904 3,638 5,741 9,379 3.21Guam 33 61 94 14 10 25 47 71 119 0.04Hawaii 341 629 970 136 95 231 477 724 1,201 0.41Idaho 390 571 962 189 94 284 580 666 1,245 0.43Illinois 3,220 6,572 9,792 1,300 1,025 2,325 4,520 7,597 12,117 4.14Indiana 1,488 2,829 4,318 596 475 1,071 2,084 3,305 5,389 1.84Iowa 718 1,299 2,017 315 219 534 1,033 1,518 2,551 0.87Kansas 701 1,267 1,968 331 182 513 1,032 1,449 2,481 0.85Kentucky 885 1,831 2,716 351 236 587 1,236 2,067 3,303 1.13Louisiana 1,045 2,383 3,427 430 330 760 1,475 2,713 4,187 1.43Maine 375 715 1,090 178 99 276 553 814 1,366 0.47Maryland 1,799 3,041 4,841 735 462 1,197 2,534 3,503 6,037 2.07Massachusetts 1,949 3,746 5,695 894 539 1,433 2,843 4,285 7,128 2.44Michigan 2,294 5,246 7,540 944 971 1,915 3,238 6,217 9,455 3.23Minnesota 1,304 2,485 3,789 591 395 986 1,895 2,880 4,776 1.63Mississippi 641 1,476 2,117 281 181 463 922 1,658 2,580 0.88Missouri 1,467 2,786 4,253 685 503 1,187 2,152 3,289 5,441 1.86Montana 278 425 703 116 89 205 395 513 908 0.31Nebraska 450 940 1,389 222 185 408 672 1,125 1,797 0.61Nevada 762 979 1,741 298 126 424 1,060 1,104 2,164 0.74New Hampshire 441 662 1,103 193 104 298 634 766 1,400 0.48New Jersey 3,114 5,013 8,126 1,351 782 2,134 4,465 5,795 10,260 3.51New Mexico 513 777 1,290 206 136 342 719 913 1,632 0.56New York 5,173 11,609 16,782 2,500 1,882 4,382 7,673 13,491 21,164 7.24North Carolina 2,298 4,385 6,683 948 742 1,690 3,246 5,128 8,373 2.86North Dakota 182 335 517 95 66 161 278 401 679 0.23N. Mariana Islands 16 19 35 7 3 10 23 22 46 0.02Ohio 2,646 5,588 8,234 1,135 990 2,124 3,781 6,577 10,358 3.54Oklahoma 847 1,639 2,486 379 239 617 1,226 1,877 3,103 1.06Oregon 998 1,653 2,651 456 277 733 1,454 1,930 3,384 1.16Pennsylvania 3,281 6,330 9,611 1,434 1,238 2,672 4,716 7,567 12,283 4.20Puerto Rico 433 1,282 1,715 247 210 457 680 1,492 2,172 0.74Rhode Island 293 506 798 113 67 180 406 573 978 0.33South Carolina 1,093 2,257 3,350 450 345 795 1,544 2,602 4,145 1.42South Dakota 196 336 532 90 68 158 287 404 690 0.24Tennessee 1,447 2,996 4,443 592 378 969 2,038 3,374 5,412 1.85Texas 4,994 12,057 17,051 2,413 2,101 4,514 7,408 14,157 21,565 7.38Utah 574 1,028 1,601 263 154 417 837 1,181 2,018 0.69Vermont 210 290 500 96 45 141 305 335 640 0.22Virgin Islands 61 60 120 27 10 37 87 70 157 0.05Virginia 2,380 3,985 6,366 1,084 733 1,816 3,464 4,718 8,182 2.80Washington 1,727 3,100 4,827 802 592 1,394 2,529 3,691 6,221 2.13West Virginia 441 827 1,268 46 134 180 487 961 1,448 0.50Wisconsin 1,327 2,703 4,030 529 420 949 1,856 3,123 4,979 1.70Wyoming 170 257 427 85 40 126 255 297 552 0.19 Total $77,619 $154,815 $232,434 $34,137 $25,770 $59,907 $111,756 $180,585 $292,341 100.00
Note: Figures may not add due to rounding.
1 - 39

Table 1.142002 Telecommunications Revenues
(In Millions of Dollars) Incumbent Subcriber
Local Exchange Mobile Line Services 1/ Wireless Charges 2/ Access 3/ Toll 4/ Total
End-User Revenues Intrastate $63,307 $7,178 $63,103 $0 $0 $21,228 $154,815 Interstate 378 3,656 13,358 12,802 3,950 43,476 77,619 Intrastate + Interstate 63,685 10,834 76,460 12,802 3,950 64,703 232,434
Carriers' Carrier Revenues Intrastate 8,453 2,400 4,301 0 7,355 3,261 25,770 Interstate 3,732 2,076 718 0 15,502 12,109 34,138 Intrastate + Interstate 12,185 4,476 5,019 0 22,857 15,370 59,907
Total Revenues Intrastate 71,760 9,578 67,403 0 7,355 24,489 180,585 Interstate 4,111 5,732 14,076 12,802 19,451 55,585 111,756 Intrastate + Interstate 75,870 15,310 81,479 12,802 26,806 80,074 292,341
1/ Excludes subscriber line charges.2/ Intrastate subscriber line charges are included under access.3/ Interstate access includes switched access, special access and local private line.4/ Intrastate toll includes both incumbent local exchange carrier (LEC) toll and non-ILEC toll.
Notes: Interstate revenues include both interstate and international revenues.
CLECs
End-user revenues are from Table 1.6. CLEC revenues include telecommunication revenues provided to end users by CLECs (including local exchange service, mobile wireless, subscriber line charge, access and toll revenues). Revenues in the other categories (incumbent local exchange service, mobile wireless, subscriber line charge, access and toll) include revenues from all filers other than CLECs. Intrastate incumbent local exchange service revenues include fixed local service revenues provided to end users. Interstate incumbent local exchange revenues include interstate revenues from Form 499-A, Telecommunications Reporting Worksheets, lines 404, 407 and 408. Mobile wireless revenues include mobile wireless revenues provided to end users. Subscriber line charge revenues include revenues from line 405 and 428. Toll revenues include toll service revenues provided to end users.
Carrier's carrier revenues are from Table 1.5. CLEC revenues include telecommunications revenues provided for resale by CLECs (including local exchange service, mobile wireless, access and toll). Revenues in the other categories (incumbent local exchange service, mobile wireless, access and toll) include revenues for all filers other than CLECs. Intrastate Incumbent local exchange service revenues include revenues from lines 303, 305, 306, 307 and 308. Interstate incumbent local exchange service revenues include revenues from lines 303, 306, 307 and 308. Mobile wireless revenues include mobile service revenues provided for resale. Intrastate access revenues include revenues in line 304. Interstate access revenues include revenues in lines 304 and 305. Toll revenues include toll service revenues for resale.
Source: Industry Analysis and Technology Division, Wireline Competition Bureau, Telecommunications Industry Revenues: 2002 (March 2004).
1 - 40

Table 1.15 Intrastate Telecommunications Revenues: 2002
Total: End User + Carrier's CarrierIncumbent Mobile ILEC Non-ILEC
Local Exchange 1/ CLECs Wireless Access Toll Toll TotalAlabama $1,281 $52 $1,003 36 $39 $174 $2,586 Alaska NA NA NA NA NA NA 452 American Samoa NA NA NA NA NA NA 10 Arizona 1,173 156 1,230 104 16 165 2,843 Arkansas 668 38 532 77 58 154 1,528 California 7,284 952 8,638 1,343 886 4,065 23,169 Colorado 1,471 191 1,171 97 26 182 3,138 Connecticut 881 98 828 37 179 113 2,137 Delaware 197 17 201 6 9 23 452 District of Columbia 339 71 249 0 0 0 660 Florida 4,287 457 4,235 570 144 1,230 10,923 Georgia 2,692 311 2,159 123 83 373 5,741 Guam NA NA NA NA NA NA 71 Hawaii 297 16 336 28 7 40 724 Idaho 298 12 270 31 7 47 666 Illinois 2,806 647 2,992 250 352 550 7,597 Indiana 1,399 111 1,167 144 95 388 3,305 Iowa 576 84 617 65 19 157 1,518 Kansas 672 78 519 30 25 125 1,449 Kentucky 994 31 838 34 24 146 2,067 Louisiana 1,356 51 1,001 59 39 207 2,713 Maine 346 26 245 17 69 109 814 Maryland 1,465 103 1,411 112 41 371 3,503 Massachusetts 1,417 325 1,634 91 241 578 4,285 Michigan 2,082 534 2,221 345 397 639 6,217 Minnesota 1,155 196 1,201 97 12 220 2,880 Mississippi 967 12 528 16 47 88 1,658 Missouri 1,373 123 1,260 180 49 303 3,289 Montana 229 9 164 38 7 66 513 Nebraska 495 70 375 68 11 106 1,125 Nevada 458 63 518 16 5 44 1,104 New Hampshire 264 48 284 26 41 103 766 New Jersey 1,893 175 2,253 228 378 868 5,795 New Mexico 393 6 377 52 10 76 913 New York 5,656 1,437 4,365 325 183 1,525 13,491 North Carolina 2,202 145 1,935 233 66 547 5,128 North Dakota 175 20 136 25 4 42 401 N. Mariana Islands NA NA NA NA NA NA 22 Ohio 2,751 225 2,329 324 122 826 6,577 Oklahoma 826 90 713 49 50 149 1,877 Oregon 801 68 775 87 20 179 1,930 Pennsylvania 2,487 586 2,661 436 235 1,163 7,567 Puerto Rico 593 22 623 86 112 57 1,492 Rhode Island 194 53 247 7 19 53 573 South Carolina 1,236 54 946 90 60 216 2,602 South Dakota 158 16 154 29 8 39 404 Tennessee 1,595 109 1,373 41 51 205 3,374 Texas 5,913 957 5,106 613 204 1,364 14,157 Utah 472 71 511 36 19 72 1,181 Vermont 179 9 87 10 15 36 335 Virginia 1,742 246 1,815 245 32 639 4,718 Virgin Islands NA NA NA NA NA NA 70 Washington 1,363 158 1,444 229 74 422 3,691 West Virginia 487 16 297 36 22 101 961 Wisconsin 1,321 185 1,093 102 141 281 3,123 Wyoming 149 13 99 9 4 22 297 Total 2/ $71,759 $9,578 $67,402 $7,355 $4,772 $19,717 $180,585 NA - Not Applicable. Note: Figures may not add due to rounding.1/ Excludes subscriber line charges.2/ Totals in the first six columns include revenues for locations not estimated.
(Dollars in Millions)
1 - 41

Table 1.15Intrastate Telecommunications Revenues: 2002 - Continued
(Dollars in Millions)
End UserIncumbent Mobile ILEC Non-ILEC
Local Exchange 1/ CLECs Wireless Access Toll Toll TotalAlabama $1,130 $39 $939 $0 $39 $145 $2,293 Alaska NA NA NA NA NA NA 388 American Samoa NA NA NA NA NA NA 9 Arizona 1,035 117 1,151 0 16 138 2,456 Arkansas 590 28 498 0 58 129 1,303 California 6,426 713 8,087 0 886 3,393 19,505 Colorado 1,298 143 1,096 0 26 152 2,715 Connecticut 778 74 776 0 179 94 1,900 Delaware 174 13 189 0 9 19 403 District of Columbia 299 53 233 0 0 0 586 Florida 3,782 342 3,965 0 144 1,026 9,260 Georgia 2,375 233 2,021 0 83 311 5,024 Guam NA NA NA NA NA NA 61 Hawaii 262 12 314 0 7 33 629 Idaho 263 9 253 0 7 39 571 Illinois 2,475 485 2,801 0 352 459 6,572 Indiana 1,234 84 1,092 0 95 324 2,829 Iowa 508 63 578 0 19 131 1,299 Kansas 593 58 486 0 25 104 1,267 Kentucky 877 23 785 0 24 122 1,831 Louisiana 1,196 38 937 0 39 173 2,383 Maine 306 19 230 0 69 91 715 Maryland 1,293 77 1,321 0 41 310 3,041 Massachusetts 1,250 244 1,529 0 241 482 3,746 Michigan 1,837 400 2,079 0 397 533 5,246 Minnesota 1,019 147 1,124 0 12 183 2,485 Mississippi 853 9 495 0 47 73 1,476 Missouri 1,211 92 1,180 0 49 253 2,786 Montana 202 6 154 0 7 55 425 Nebraska 437 53 351 0 11 89 940 Nevada 404 47 485 0 5 37 979 New Hampshire 233 36 266 0 41 86 662 New Jersey 1,670 131 2,109 0 378 724 5,013 New Mexico 346 4 353 0 10 63 777 New York 4,990 1,077 4,086 0 183 1,273 11,609 North Carolina 1,943 109 1,812 0 66 456 4,385 North Dakota 154 15 128 0 4 35 335 N. Mariana Islands NA NA NA NA NA NA 19 Ohio 2,427 169 2,181 0 122 690 5,588 Oklahoma 729 67 668 0 50 125 1,639 Oregon 707 51 726 0 20 149 1,653 Pennsylvania 2,194 439 2,491 0 235 971 6,330 Puerto Rico 523 16 583 0 112 48 1,282 Rhode Island 171 39 231 0 19 44 506 South Carolina 1,090 40 886 0 60 180 2,257 South Dakota 139 12 144 0 8 32 336 Tennessee 1,408 82 1,285 0 51 171 2,996 Texas 5,217 717 4,780 0 204 1,138 12,057 Utah 416 53 479 0 19 60 1,028 Vermont 158 6 81 0 15 30 290 Virginia 1,537 184 1,699 0 32 534 3,985 Virgin Islands NA NA NA NA NA NA 60 Washington 1,203 119 1,351 0 74 353 3,100 West Virginia 430 12 278 0 22 84 827 Wisconsin 1,165 139 1,023 0 141 234 2,703 Wyoming 131 10 93 0 4 18 257 Total 2/ $63,306 $7,178 $63,102 $0 $4,772 $16,455 $154,815 NA - Not Applicable. Note: Figures may not add due to rounding.1/ Excludes subscriber line charges.2/ Totals in the first six columns include revenues for locations not estimated.
1 - 42
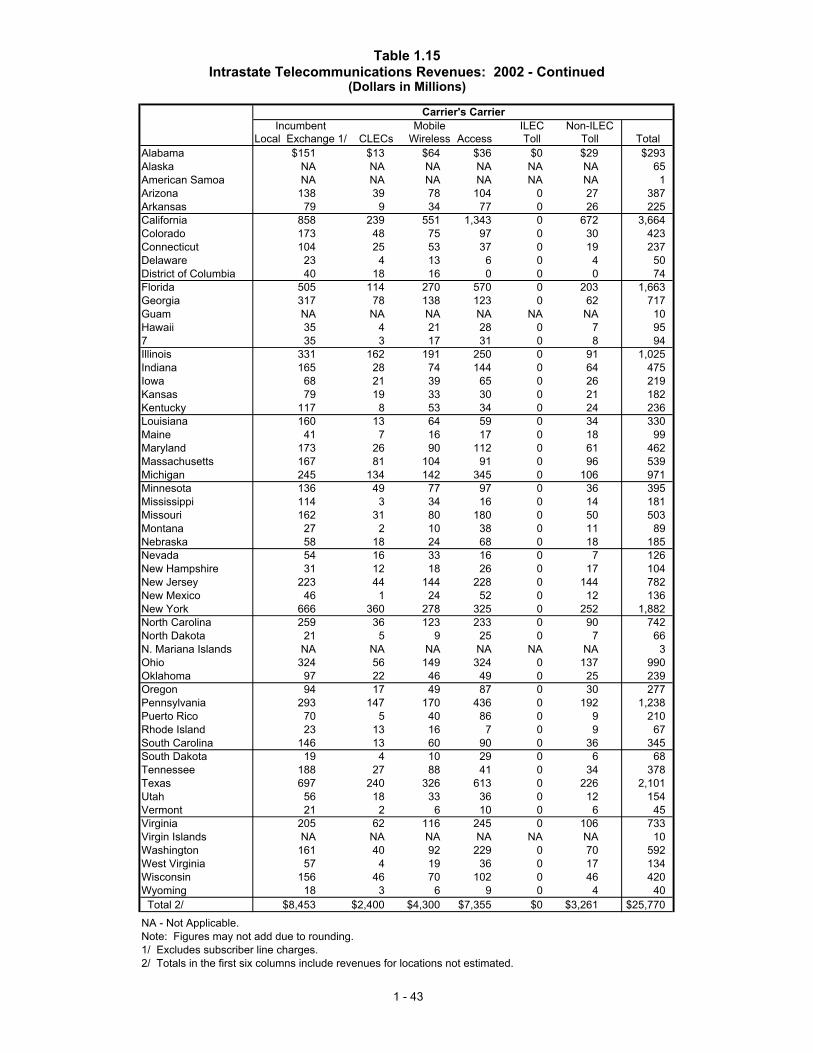
Table 1.15Intrastate Telecommunications Revenues: 2002 - Continued
(Dollars in Millions)
Carrier's CarrierIncumbent Mobile ILEC Non-ILEC
Local Exchange 1/ CLECs Wireless Access Toll Toll TotalAlabama $151 $13 $64 $36 $0 $29 $293 Alaska NA NA NA NA NA NA 65 American Samoa NA NA NA NA NA NA 1 Arizona 138 39 78 104 0 27 387 Arkansas 79 9 34 77 0 26 225 California 858 239 551 1,343 0 672 3,664 Colorado 173 48 75 97 0 30 423 Connecticut 104 25 53 37 0 19 237 Delaware 23 4 13 6 0 4 50 District of Columbia 40 18 16 0 0 0 74 Florida 505 114 270 570 0 203 1,663 Georgia 317 78 138 123 0 62 717 Guam NA NA NA NA NA NA 10 Hawaii 35 4 21 28 0 7 95 7 35 3 17 31 0 8 94 Illinois 331 162 191 250 0 91 1,025 Indiana 165 28 74 144 0 64 475 Iowa 68 21 39 65 0 26 219 Kansas 79 19 33 30 0 21 182 Kentucky 117 8 53 34 0 24 236 Louisiana 160 13 64 59 0 34 330 Maine 41 7 16 17 0 18 99 Maryland 173 26 90 112 0 61 462 Massachusetts 167 81 104 91 0 96 539 Michigan 245 134 142 345 0 106 971 Minnesota 136 49 77 97 0 36 395 Mississippi 114 3 34 16 0 14 181 Missouri 162 31 80 180 0 50 503 Montana 27 2 10 38 0 11 89 Nebraska 58 18 24 68 0 18 185 Nevada 54 16 33 16 0 7 126 New Hampshire 31 12 18 26 0 17 104 New Jersey 223 44 144 228 0 144 782 New Mexico 46 1 24 52 0 12 136 New York 666 360 278 325 0 252 1,882 North Carolina 259 36 123 233 0 90 742 North Dakota 21 5 9 25 0 7 66 N. Mariana Islands NA NA NA NA NA NA 3 Ohio 324 56 149 324 0 137 990 Oklahoma 97 22 46 49 0 25 239 Oregon 94 17 49 87 0 30 277 Pennsylvania 293 147 170 436 0 192 1,238 Puerto Rico 70 5 40 86 0 9 210 Rhode Island 23 13 16 7 0 9 67 South Carolina 146 13 60 90 0 36 345 South Dakota 19 4 10 29 0 6 68 Tennessee 188 27 88 41 0 34 378 Texas 697 240 326 613 0 226 2,101 Utah 56 18 33 36 0 12 154 Vermont 21 2 6 10 0 6 45 Virginia 205 62 116 245 0 106 733 Virgin Islands NA NA NA NA NA NA 10 Washington 161 40 92 229 0 70 592 West Virginia 57 4 19 36 0 17 134 Wisconsin 156 46 70 102 0 46 420 Wyoming 18 3 6 9 0 4 40 Total 2/ $8,453 $2,400 $4,300 $7,355 $0 $3,261 $25,770 NA - Not Applicable.Note: Figures may not add due to rounding.1/ Excludes subscriber line charges.2/ Totals in the first six columns include revenues for locations not estimated.
1 - 43
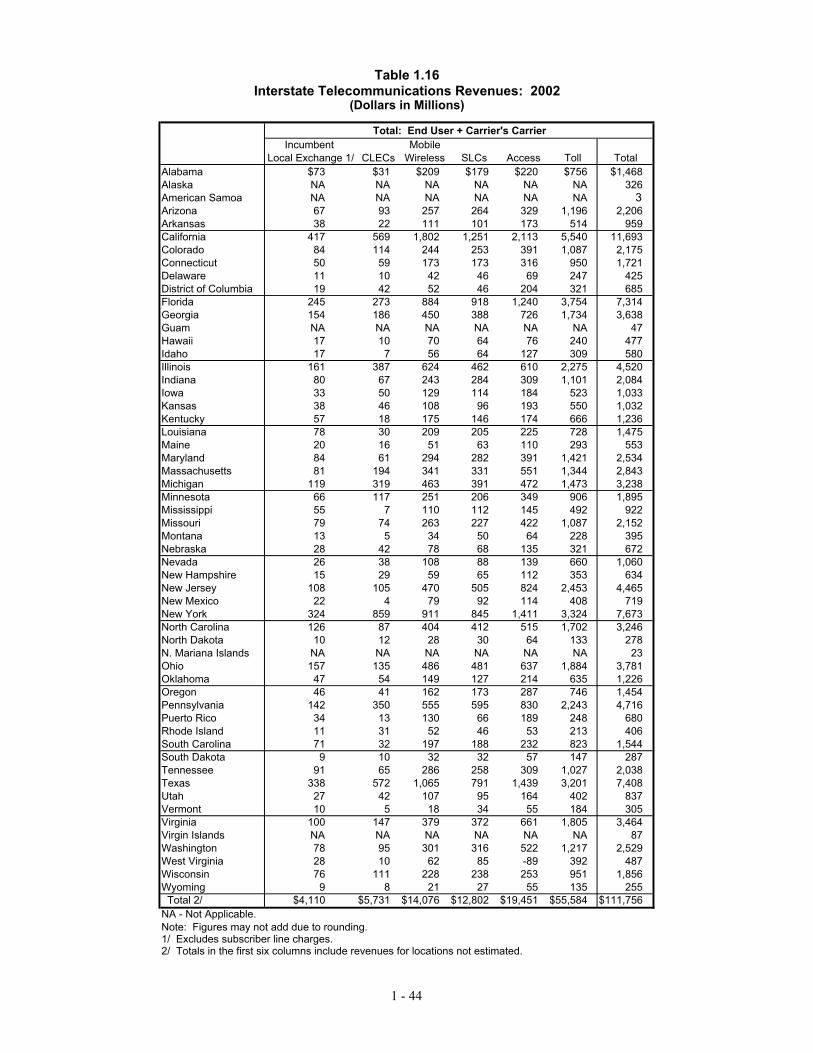
Table 1.16Interstate Telecommunications Revenues: 2002
(Dollars in Millions)
Total: End User + Carrier's CarrierIncumbent Mobile
Local Exchange 1/ CLECs Wireless SLCs Access Toll TotalAlabama $73 $31 $209 $179 $220 $756 $1,468 Alaska NA NA NA NA NA NA 326 American Samoa NA NA NA NA NA NA 3 Arizona 67 93 257 264 329 1,196 2,206 Arkansas 38 22 111 101 173 514 959 California 417 569 1,802 1,251 2,113 5,540 11,693 Colorado 84 114 244 253 391 1,087 2,175 Connecticut 50 59 173 173 316 950 1,721 Delaware 11 10 42 46 69 247 425 District of Columbia 19 42 52 46 204 321 685 Florida 245 273 884 918 1,240 3,754 7,314 Georgia 154 186 450 388 726 1,734 3,638 Guam NA NA NA NA NA NA 47 Hawaii 17 10 70 64 76 240 477 Idaho 17 7 56 64 127 309 580 Illinois 161 387 624 462 610 2,275 4,520 Indiana 80 67 243 284 309 1,101 2,084 Iowa 33 50 129 114 184 523 1,033 Kansas 38 46 108 96 193 550 1,032 Kentucky 57 18 175 146 174 666 1,236 Louisiana 78 30 209 205 225 728 1,475 Maine 20 16 51 63 110 293 553 Maryland 84 61 294 282 391 1,421 2,534 Massachusetts 81 194 341 331 551 1,344 2,843 Michigan 119 319 463 391 472 1,473 3,238 Minnesota 66 117 251 206 349 906 1,895 Mississippi 55 7 110 112 145 492 922 Missouri 79 74 263 227 422 1,087 2,152 Montana 13 5 34 50 64 228 395 Nebraska 28 42 78 68 135 321 672 Nevada 26 38 108 88 139 660 1,060 New Hampshire 15 29 59 65 112 353 634 New Jersey 108 105 470 505 824 2,453 4,465 New Mexico 22 4 79 92 114 408 719 New York 324 859 911 845 1,411 3,324 7,673 North Carolina 126 87 404 412 515 1,702 3,246 North Dakota 10 12 28 30 64 133 278 N. Mariana Islands NA NA NA NA NA NA 23 Ohio 157 135 486 481 637 1,884 3,781 Oklahoma 47 54 149 127 214 635 1,226 Oregon 46 41 162 173 287 746 1,454 Pennsylvania 142 350 555 595 830 2,243 4,716 Puerto Rico 34 13 130 66 189 248 680 Rhode Island 11 31 52 46 53 213 406 South Carolina 71 32 197 188 232 823 1,544 South Dakota 9 10 32 32 57 147 287 Tennessee 91 65 286 258 309 1,027 2,038 Texas 338 572 1,065 791 1,439 3,201 7,408 Utah 27 42 107 95 164 402 837 Vermont 10 5 18 34 55 184 305 Virginia 100 147 379 372 661 1,805 3,464 Virgin Islands NA NA NA NA NA NA 87 Washington 78 95 301 316 522 1,217 2,529 West Virginia 28 10 62 85 -89 392 487 Wisconsin 76 111 228 238 253 951 1,856 Wyoming 9 8 21 27 55 135 255 Total 2/ $4,110 $5,731 $14,076 $12,802 $19,451 $55,584 $111,756 NA - Not Applicable. Note: Figures may not add due to rounding.1/ Excludes subscriber line charges.2/ Totals in the first six columns include revenues for locations not estimated.
1 - 44

Table 1.16Interstate Telecommunications Revenues: 2002 - Continued
(Dollars in Millions)
End UserIncumbent Mobile
Local Exchange 1/ CLECs Wireless SLCs Access Toll TotalAlabama $7 $20 $199 $179 $45 $591 $1,040 Alaska NA NA NA NA NA NA 227 American Samoa NA NA NA NA NA NA 2 Arizona 6 60 243 264 67 936 1,576 Arkansas 4 14 105 101 35 402 661 California 38 363 1,710 1,251 429 4,333 8,126 Colorado 8 73 232 253 79 851 1,496 Connecticut 5 37 164 173 64 743 1,186 Delaware 1 6 40 46 14 193 300 District of Columbia 2 27 49 46 41 251 417 Florida 23 174 839 918 252 2,936 5,141 Georgia 14 118 427 388 147 1,356 2,452 Guam NA NA NA NA NA NA 33 Hawaii 2 6 66 64 16 188 341 Idaho 2 5 53 64 26 241 390 Illinois 15 247 592 462 124 1,779 3,220 Indiana 7 42 231 284 63 861 1,488 Iowa 3 32 122 114 37 409 718 Kansas 4 30 103 96 39 430 701 Kentucky 5 12 166 146 35 521 885 Louisiana 7 19 198 205 46 570 1,045 Maine 2 10 49 63 22 229 375 Maryland 8 39 279 282 79 1,112 1,799 Massachusetts 7 124 323 331 112 1,051 1,949 Michigan 11 204 440 391 96 1,152 2,294 Minnesota 6 75 238 206 71 709 1,304 Mississippi 5 5 105 112 29 385 641 Missouri 7 47 250 227 86 850 1,467 Montana 1 3 33 50 13 178 278 Nebraska 3 27 74 68 27 251 450 Nevada 2 24 103 88 28 517 762 New Hampshire 1 18 56 65 23 276 441 New Jersey 10 67 446 505 167 1,918 3,114 New Mexico 2 2 75 92 23 319 513 New York 30 548 864 845 287 2,600 5,173 North Carolina 12 55 383 412 105 1,331 2,298 North Dakota 1 8 27 30 13 104 182 N. Mariana Islands NA NA NA NA NA NA 16 Ohio 14 86 461 481 129 1,474 2,646 Oklahoma 4 34 141 127 43 497 847 Oregon 4 26 154 173 58 584 998 Pennsylvania 13 224 527 595 168 1,754 3,281 Puerto Rico 3 8 123 66 38 194 433 Rhode Island 1 20 49 46 11 166 293 South Carolina 7 20 187 188 47 643 1,093 South Dakota 1 6 30 32 11 115 196 Tennessee 8 42 272 258 63 804 1,447 Texas 31 365 1,011 791 292 2,504 4,994 Utah 2 27 101 95 33 314 574 Vermont 1 3 17 34 11 144 210 Virginia 9 94 359 372 134 1,412 2,380 Virgin Islands NA NA NA NA NA NA 61 Washington 7 60 286 316 106 952 1,727 West Virginia 3 6 59 85 -18 306 441 Wisconsin 7 71 216 238 51 744 1,327 Wyoming 1 5 20 27 11 106 170 Total 2/ $378 $3,656 $13,357 $12,802 $3,949 $43,475 $77,619 NA - Not Applicable. Note: Figures may not add due to rounding.1/ Excludes subscriber line charges.2/ Totals in the first six columns include revenues for locations not estimated.
1 - 45

Table 1.16Interstate Telecommunications Revenues: 2002 - Continued
Carrier's CarrierIncumbent Mobile
Local Exchange 1/ CLECs Wireless SLCs Access Toll TotalAlabama $67 $11 $11 $0 $175 $165 $429 Alaska NA NA NA NA NA NA 100 American Samoa NA NA NA NA NA NA 1 Arizona 61 34 13 0 262 261 630 Arkansas 35 8 6 0 138 112 298 California 379 206 92 0 1,684 1,207 3,568 Colorado 76 41 12 0 312 237 679 Connecticut 46 21 9 0 252 207 534 Delaware 10 4 2 0 55 54 125 District of Columbia 18 15 3 0 163 70 268 Florida 223 99 45 0 988 818 2,172 Georgia 140 67 23 0 579 378 1,186 Guam NA NA NA NA NA NA 14 Hawaii 15 4 4 0 61 52 136 Idaho 16 3 3 0 101 67 189 Illinois 146 140 32 0 486 496 1,300 Indiana 73 24 12 0 247 240 596 Iowa 30 18 7 0 146 114 315 Kansas 35 17 6 0 154 120 331 Kentucky 52 7 9 0 138 145 351 Louisiana 70 11 11 0 179 159 430 Maine 18 6 3 0 88 64 178 Maryland 76 22 15 0 312 310 735 Massachusetts 74 70 17 0 439 293 894 Michigan 108 116 24 0 376 321 944 Minnesota 60 42 13 0 278 197 591 Mississippi 50 3 6 0 116 107 281 Missouri 71 27 13 0 336 237 685 Montana 12 2 2 0 51 50 116 Nebraska 26 15 4 0 107 70 222 Nevada 24 14 6 0 111 144 298 New Hampshire 14 10 3 0 89 77 193 New Jersey 98 38 24 0 657 534 1,351 New Mexico 20 1 4 0 91 89 206 New York 294 311 46 0 1,125 724 2,500 North Carolina 114 31 21 0 411 371 948 North Dakota 9 4 1 0 51 29 95 N. Mariana Islands NA NA NA NA NA NA 7 Ohio 143 49 25 0 508 410 1,135 Oklahoma 43 19 8 0 170 138 379 Oregon 42 15 8 0 229 163 456 Pennsylvania 129 127 28 0 661 489 1,434 Puerto Rico 31 5 7 0 150 54 247 Rhode Island 10 11 3 0 42 46 113 South Carolina 64 12 10 0 185 179 450 South Dakota 8 4 2 0 45 32 90 Tennessee 83 24 15 0 247 224 592 Texas 307 207 54 0 1,147 697 2,413 Utah 25 15 5 0 130 88 263 Vermont 9 2 1 0 44 40 96 Virginia 91 53 19 0 527 393 1,084 Virgin Islands NA NA NA NA NA NA 27 Washington 71 34 15 0 416 265 802 West Virginia 25 4 3 0 -71 85 46 Wisconsin 69 40 12 0 202 207 529 Wyoming 8 3 1 0 44 29 85 Total 2/ $3,732 $2,076 $718 $0 $15,501 $12,109 $34,137 NA - Not Applicable. Note: Figures may not add due to rounding.1/ Excludes subscriber line charges.2/ Totals in the first six columns include revenues for locations not estimated.
(Dollars in Millions)
1 - 46

Table 1.17Adjustment Formula: 2002
1 2 3
Average Percent Adjustment FormulaReporting 2/ 100/Average Percent
2002 2002 ReportingAlabama 2,417,624 84.4 % 1.18Alaska 451,038 0.0 NA American Samoa 10,325 0.0 NA Arizona 2,929,763 93.0 1.08Arkansas 1,453,606 68.3 1.46California 22,684,649 98.4 1.02Colorado 2,808,697 95.3 1.05Connecticut 2,322,733 98.9 1.01Delaware 580,535 100.0 1.00District of Columbia 897,193 100.0 1.00Florida 11,051,084 98.2 1.02Georgia 4,952,969 88.5 1.13Guam 70,975 0.0 NA Hawaii 706,080 99.9 1.00Idaho 742,213 90.8 1.10Illinois 7,988,559 95.0 1.05Indiana 3,723,570 95.4 1.05Iowa 1,659,718 64.7 1.55Kansas 1,572,621 83.6 1.20Kentucky 2,162,127 77.9 1.28Louisiana 2,499,254 92.3 1.08Maine 877,024 82.7 1.21Maryland 3,843,853 99.8 1.00Massachusetts 4,189,345 99.9 1.00Michigan 6,279,428 96.2 1.04Minnesota 2,984,615 72.1 1.39Mississippi 1,410,890 93.1 1.07Missouri 3,517,725 85.9 1.16Montana 542,127 67.4 1.48Nebraska 911,103 78.8 1.27Nevada 1,347,190 95.5 1.05New Hampshire 812,911 92.9 1.08New Jersey 6,628,315 99.8 1.00New Mexico 990,104 85.0 1.18New York 12,581,000 96.6 1.03North Carolina 4,999,581 89.8 1.11North Dakota 389,363 52.9 1.89N. Mariana Islands 22,206 0.0 NA Ohio 6,891,138 95.1 1.05Oklahoma 1,933,297 81.4 1.23Oregon 2,082,960 91.8 1.09Pennsylvania 8,001,521 95.7 1.04Puerto Rico 1,289,665 100.0 1.00Rhode Island 595,651 100.0 1.00South Carolina 2,312,026 72.6 1.38South Dakota 393,174 62.0 1.61Tennessee 3,291,141 86.0 1.16Texas 12,756,323 92.7 1.08Utah 1,115,866 91.5 1.09Vermont 421,974 84.5 1.18Virginia 4,639,121 97.4 1.03Virgin Islands 69,369 0.0 NA Washington 3,616,816 92.5 1.08West Virginia 1,021,908 83.0 1.20Wisconsin 3,362,356 73.6 1.36Wyoming 304,439 83.4 1.20 Total 180,110,858 92.4 % 1.08
NA - Not Applicable.1/ USF loops, a measure of access lines, are defined in subcategory 1.3 of 47 C.F.R. 36.154(a).2/ Average percent reporting to ARMIS (Report 43-01) is based on USF loops.
USF Loops 1/Year End
1 - 47

Table 1.18Information for Allocating Incumbent Local Exchange Revenues: 2002
(Dollars in Millions)
Revenues Interstatefor Total
Allocation RevenuesAlabama $1,151 1.79 % $1,130 $7 $1,281 $73Alaska NA NA NA NA NA NAAmerican Samoa NA NA NA NA NA NAArizona 1,054 1.64 1,035 6 1,173 67Arkansas 600 0.93 590 4 668 38California 6,543 10.19 6,426 38 7,284 417Colorado 1,321 2.06 1,298 8 1,471 84Connecticut 792 1.23 778 5 881 50Delaware 177 0.28 174 1 197 11District of Columbia 305 0.47 299 2 339 19Florida 3,851 6.00 3,782 23 4,287 245Georgia 2,418 3.76 2,375 14 2,692 154Guam NA NA NA NA NA NAHawaii 267 0.42 262 2 297 17Idaho 268 0.42 263 2 298 17Illinois 2,520 3.92 2,475 15 2,806 161Indiana 1,257 1.96 1,234 7 1,399 80Iowa 517 0.80 508 3 576 33Kansas 603 0.94 593 4 672 38Kentucky 893 1.39 877 5 994 57Louisiana 1,218 1.90 1,196 7 1,356 78Maine 311 0.48 306 2 346 20Maryland 1,316 2.05 1,293 8 1,465 84Massachusetts 1,273 1.98 1,250 7 1,417 81Michigan 1,870 2.91 1,837 11 2,082 119Minnesota 1,038 1.62 1,019 6 1,155 66Mississippi 868 1.35 853 5 967 55Missouri 1,233 1.92 1,211 7 1,373 79Montana 206 0.32 202 1 229 13Nebraska 445 0.69 437 3 495 28Nevada 412 0.64 404 2 458 26New Hampshire 238 0.37 233 1 264 15New Jersey 1,700 2.65 1,670 10 1,893 108New Mexico 353 0.55 346 2 393 22New York 5,081 7.91 4,990 30 5,656 324North Carolina 1,978 3.08 1,943 12 2,202 126North Dakota 157 0.24 154 1 175 10Northern Mariana Islands NA NA NA NA NA NAOhio 2,471 3.85 2,427 14 2,751 157Oklahoma 742 1.15 729 4 826 47Oregon 720 1.12 707 4 801 46Pennsylvania 2,234 3.48 2,194 13 2,487 142Puerto Rico 533 0.83 523 3 593 34Rhode Island 174 0.27 171 1 194 11South Carolina 1,110 1.73 1,090 7 1,236 71South Dakota 142 0.22 139 1 158 9Tennessee 1,433 2.23 1,408 8 1,595 91Texas 5,312 8.27 5,217 31 5,913 338Utah 424 0.66 416 2 472 27Vermont 161 0.25 158 1 179 10Virginia 1,565 2.44 1,537 9 1,742 100Virgin Islands NA NA NA NA NA NAWashington 1,225 1.91 1,203 7 1,363 78West Virginia 438 0.68 430 3 487 28Wisconsin 1,186 1.85 1,165 7 1,321 76Wyoming 134 0.21 131 1 149 9 Total 1/ $64,236 100.00 % $63,306 $378 $71,759 $4,110NA - Not Applicable.Note: Incumbent local exchange revenues exclude SLC. Figures may not add due to rounding.1/ Totals in the last four columns include revenues for locations not estimated.
1 2 3 4 5 6
AllocationPercentage
Revenues
InterstateEnd-UserRevenuesRevenues
Total IntrastateEnd-User
Intrastate
1 - 48

Table 1.19Information for Allocating CLEC Revenues: 2002
(Dollars in Millions)
CLEC Allocation Interstate Interstate Intrastate IntrastateLines Percentage End-User Total End-User Total
Jun 02 1/ Revenues Revenues Revenues RevenuesAlabama 118,721 NA 0.55 % $20 $31 $39 $52Alaska NA NA NA NA NA NA NAAmerican Samoa NA NA NA NA NA NA NAArizona 354,592 NA 1.64 60 93 117 156Arkansas * 82,653 0.39 14 22 28 38California 2,158,878 NA 9.97 363 569 713 952Colorado 434,125 NA 2.01 73 114 143 191Connecticut 222,815 NA 1.03 37 59 74 98Delaware * 37,169 0.18 6 10 13 17District of Columbia 161,114 NA 0.74 27 42 53 71Florida 1,035,417 NA 4.78 174 273 342 457Georgia 704,651 NA 3.26 118 186 233 311Guam NA NA NA NA NA NA NAHawaii * 36,212 0.17 6 10 12 16Idaho * 26,166 0.12 5 7 9 12Illinois 1,468,057 NA 6.78 247 387 485 647Indiana 252,722 NA 1.17 42 67 84 111Iowa 190,869 NA 0.88 32 50 63 84Kansas 176,322 NA 0.81 30 46 58 78Kentucky * 67,999 0.32 12 18 23 31Louisiana 115,220 NA 0.53 19 30 38 51Maine * 57,143 0.27 10 16 19 26Maryland 232,793 NA 1.08 39 61 77 103Massachusetts 736,932 NA 3.40 124 194 244 325Michigan 1,211,379 NA 5.60 204 319 400 534Minnesota 443,739 NA 2.05 75 117 147 196Mississippi * 27,141 0.13 5 7 9 12Missouri 279,342 NA 1.29 47 74 92 123Montana * 18,989 0.09 3 5 6 9Nebraska 159,617 NA 0.74 27 42 53 70Nevada 142,826 NA 0.66 24 38 47 63New Hampshire 109,610 NA 0.51 18 29 36 48New Jersey 396,865 NA 1.83 67 105 131 175New Mexico * 13,062 0.06 2 4 4 6New York 3,259,221 NA 15.06 548 859 1,077 1,437North Carolina 328,715 NA 1.52 55 87 109 145North Dakota * 43,950 0.21 8 12 15 20N. Mariana Islands NA NA NA NA NA NA NAOhio 510,623 NA 2.36 86 135 169 225Oklahoma 203,028 NA 0.94 34 54 67 90Oregon 154,492 NA 0.71 26 41 51 68Pennsylvania 1,329,357 NA 6.14 224 350 439 586Puerto Rico * 47,499 0.23 8 13 16 22Rhode Island 119,112 NA 0.55 20 31 39 53South Carolina 121,331 NA 0.56 20 32 40 54South Dakota * 35,977 0.17 6 10 12 16Tennessee 247,056 NA 1.14 42 65 82 109Texas 2,170,914 NA 10.03 365 572 717 957Utah 161,193 NA 0.74 27 42 53 71Vermont * 18,998 0.09 3 5 6 9Virginia 558,206 NA 2.58 94 147 184 246Virgin Islands 0 NA NA NA NA NA NAWashington 358,933 NA 1.66 60 95 119 158West Virginia * 35,988 0.17 6 10 12 16Wisconsin 420,200 NA 1.94 71 111 139 185Wyoming * 29,538 0.14 5 8 10 13 Total 3/ 21,644,928 NA 100.00 % $3,656 $5,731 $7,178 $9,578NA - Not Applicable. * Data withheld to maintain firms confidentiality or CLECs have less than 100,000 lines in state.1/ Industry Analysis and Technology Division, Wireline Competition Bureau, Local Telephone Competition (June 2004). 2/ RBOC data from FCC Form 477 for only carriers in which CLEC lines are not reported. Data from the former GTE territories are not included. Resold lines and UNEs for Hawaii and Puerto Rico are estimated based on personal income. 3/ Totals in the last four columns include revenues for locations not estimated.
June 02 2/
3 4 5 61 2 7
RBOC LinesResold or UNEs
1 - 49

Table 1.20Information for Allocating Mobile Wireless Revenues: 2002
Alabama 2,111,899 1.49 % $939 $199 $1,003 $209Alaska NA NA NA NA NA NAAmerican Samoa NA NA NA NA NA NAArizona 2,588,752 1.83 1,151 243 1,230 257Arkansas 1,120,741 0.79 498 105 532 111California 18,183,290 12.86 8,087 1,710 8,638 1,802Colorado 2,464,678 1.74 1,096 232 1,171 244Connecticut 1,743,749 1.23 776 164 828 173Delaware 423,913 0.30 189 40 201 42District of Columbia 524,991 0.37 233 49 249 52Florida 8,914,776 6.30 3,965 839 4,235 884Georgia 4,544,502 3.21 2,021 427 2,159 450Guam NA NA NA NA NA NAHawaii 706,712 0.50 314 66 336 70Idaho 568,555 0.40 253 53 270 56Illinois 6,298,548 4.45 2,801 592 2,992 624Indiana 2,456,469 1.74 1,092 231 1,167 243Iowa 1,299,463 0.92 578 122 617 129Kansas 1,092,975 0.77 486 103 519 108Kentucky 1,764,954 1.25 785 166 838 175Louisiana 2,106,263 1.49 937 198 1,001 209Maine 516,702 0.37 230 49 245 51Maryland 2,970,267 2.10 1,321 279 1,411 294Massachusetts 3,438,844 2.43 1,529 323 1,634 341Michigan 4,674,299 3.31 2,079 440 2,221 463Minnesota 2,527,653 1.79 1,124 238 1,201 251Mississippi 1,112,483 0.79 495 105 528 110Missouri 2,653,371 1.88 1,180 250 1,260 263Montana 346,187 0.24 154 33 164 34Nebraska 789,321 0.56 351 74 375 78Nevada 1,090,801 0.77 485 103 518 108New Hampshire 597,963 0.42 266 56 284 59New Jersey 4,741,923 3.35 2,109 446 2,253 470New Mexico 793,256 0.56 353 75 377 79New York 9,188,321 6.50 4,086 864 4,365 911North Carolina 4,074,109 2.88 1,812 383 1,935 404North Dakota 286,745 0.20 128 27 136 28N. Mariana Islands NA NA NA NA NA NAOhio 4,903,121 3.47 2,181 461 2,329 486Oklahoma 1,501,859 1.06 668 141 713 149Oregon 1,632,184 1.15 726 154 775 162Pennsylvania 5,600,739 3.96 2,491 527 2,661 555Puerto Rico 1,311,508 0.93 583 123 623 130Rhode Island 520,429 0.37 231 49 247 52South Carolina 1,992,150 1.41 886 187 946 197South Dakota 324,206 0.23 144 30 154 32Tennessee 2,889,687 2.04 1,285 272 1,373 286Texas 10,748,849 7.60 4,780 1,011 5,106 1,065Utah 1,076,507 0.76 479 101 511 107Vermont 182,269 0.13 81 17 87 18Virginia 3,819,951 2.70 1,699 359 1,815 379Virgin Islands NA NA NA NA NA NAWashington 3,038,828 2.15 1,351 286 1,444 301West Virginia 625,620 0.44 278 59 297 62Wisconsin 2,301,155 1.63 1,023 216 1,093 228Wyoming 209,446 0.15 93 20 99 21 Total 2/ 141,775,850 100.00 % $63,102 $13,357 $67,402 $14,076NA - Not Applicable. * Data withheld to maintain firms confidentiality. 1/ Based on FCC Form 502 (Number Resources Utililization/Forecasting, as of December 2002).2/ Totals in the last four columns include revenues for locations not estimated.
Dec 02 1/
4 5 6 71 3
RevenuesTotal
Revenues Revenues
InterstateEnd-User
IntrastateEnd-UserNumbers
Allocation Percentage
Wireless IntrastateTotal
Interstate
Revenues
(Dollars in Millions)
1 - 50

Table 1.21Information for Allocating Subscriber Line Charges' (SLCs) Revenues: 2002
AllocationResidential Percentage
SLC 3/Alabama 1,437,491 116,557 469,690 $5.50 $6.98 $8.13 $150 1.40 % $179Alaska NA NA NA NA NA NA NA NA NA American Samoa NA NA NA NA NA NA NA NA NA Arizona 1,761,486 299,945 821,688 5.50 6.73 8.30 222 2.07 264Arkansas 795,832 63,549 359,161 5.26 5.34 7.09 85 0.79 101California 8,033,127 3,016,093 7,035,148 4.63 4.75 5.15 1,053 9.82 1,251Colorado 1,531,449 333,429 786,448 5.50 7.00 8.91 213 1.99 253Connecticut 1,198,828 320,486 513,836 5.35 5.88 7.45 145 1.36 173Delaware 321,037 58,769 161,056 5.50 6.42 6.54 38 0.36 46Dist. of Columbia 220,044 46,163 577,063 3.82 3.82 3.82 39 0.36 46Florida 6,548,380 1,075,953 2,548,165 5.50 6.99 8.18 773 7.20 918Georgia 2,631,495 375,538 1,249,893 5.50 6.98 8.09 326 3.04 388Guam NA NA NA NA NA NA NA NA NA Hawaii 411,463 58,359 198,221 5.50 7.00 9.12 54 0.50 64Idaho 465,660 54,241 194,445 5.50 6.52 7.93 53 0.50 64Illinois 3,715,662 652,124 2,355,500 4.62 4.78 5.16 389 3.63 462Indiana 2,219,190 240,207 942,922 5.34 6.06 6.99 239 2.23 284Iowa 991,360 75,287 415,696 5.02 5.31 6.34 96 0.90 114Kansas 802,409 78,956 344,027 5.17 5.29 6.26 81 0.75 96Kentucky 1,169,871 63,882 420,476 5.46 6.78 8.07 123 1.14 146Louisiana 1,519,105 182,311 593,101 5.50 6.98 7.95 172 1.60 205Maine 488,002 39,507 187,305 5.50 6.42 7.79 53 0.49 63Maryland 2,026,572 417,126 1,123,956 5.31 5.84 5.85 237 2.21 282Massachusetts 2,195,609 338,724 1,196,803 5.50 6.42 7.50 279 2.60 331Michigan 2,992,007 315,260 1,690,877 5.21 5.53 5.97 329 3.07 391Minnesota 1,748,180 181,347 775,977 5.03 5.18 6.11 174 1.62 206Mississippi 887,814 65,364 316,152 5.50 6.98 7.94 94 0.88 112Missouri 1,929,263 226,647 706,992 5.21 5.46 6.59 191 1.78 227Montana 357,282 25,963 149,885 5.50 7.00 9.20 42 0.39 50Nebraska 525,597 38,234 290,398 5.12 5.50 6.47 57 0.53 68Nevada 797,545 117,861 396,956 4.31 4.73 5.51 74 0.69 88New Hampshire 507,334 64,597 180,210 5.50 6.42 7.62 55 0.51 65New Jersey 2,983,302 1,153,075 1,896,440 5.49 6.20 6.29 425 3.97 505New Mexico 598,725 78,730 280,360 5.50 7.00 9.20 77 0.72 92New York 5,339,133 1,068,516 3,046,391 5.47 6.37 7.62 711 6.63 845North Carolina 3,198,629 337,037 1,155,234 5.46 6.65 7.96 347 3.24 412North Dakota 217,225 9,007 93,386 5.50 6.99 8.84 25 0.23 30N. Mariana Islands NA NA NA NA NA NA NA NA NA Ohio 4,037,305 418,533 1,614,861 5.26 5.72 6.27 405 3.78 481Oklahoma 1,071,850 123,796 432,359 5.18 5.24 6.31 107 1.00 127Oregon 1,299,327 154,999 468,687 5.50 6.84 8.33 145 1.36 173Pennsylvania 4,530,726 757,099 1,892,462 5.43 6.04 6.64 501 4.67 595Puerto Rico 1,060,179 0 147,020 3.50 0.00 6.00 55 0.51 66Rhode Island 342,347 38,388 142,289 5.50 6.42 7.50 38 0.36 46South Carolina 1,526,863 99,124 504,776 5.49 6.88 8.22 159 1.48 188South Dakota 217,841 11,438 126,009 5.50 6.40 7.87 27 0.25 32Tennessee 2,106,965 212,236 649,333 5.47 6.86 7.91 217 2.03 258Texas 5,916,055 1,062,689 2,913,969 5.19 5.48 6.49 666 6.21 791Utah 628,286 107,081 334,270 5.50 6.43 7.55 80 0.75 95Vermont 254,281 21,517 107,960 5.50 6.42 7.76 28 0.27 34Virginia 2,576,892 402,068 1,325,732 5.46 6.56 7.07 313 2.92 372Virgin Islands NA NA NA NA NA NA NA NA NA Washington 2,337,932 346,505 961,257 5.47 6.28 7.50 266 2.48 316West Virginia 720,773 37,338 203,998 5.50 7.00 8.39 71 0.66 85Wisconsin 1,949,750 187,461 828,988 5.20 5.34 6.65 200 1.86 238Wyoming 169,835 14,082 93,459 5.50 7.00 9.20 23 0.21 27 Total 3/ 92,247,606 15,583,198 46,221,287 $5.32 $5.88 $6.74 $10,724 100.00 % $12,802Note: Figures may not add due to rounding. NA - Not Applicable. 1/ Excludes additional lines for residential customers of price-cap carriers.2/ A staff estimate of additional lines for price-cap carriers.3/ SLC for single line business is the same as for residential lines. 4/ Totals in the last column include revenues for locations not estimated.
Average5 7 8 961 2 3 4
Primary Residential Lines & Single
Line Business 1/
AdditionalResidential
Average Interstate
(Millions)AllocationBusiness
Revenues forSLCs
(Millions)
AverageAdditional Line SLC Multiline SLCLines 2/
BusinessMultilines
1 - 51

Table 1.22
1 2 6
Gross Access SLCs Revenues Allocation Interstate InterstateRevenues for for Percentage End-User Total
Allocation Allocation Revenues RevenuesAlabama $388 $179 $209 1.14 % $45 $220 Alaska NA NA NA NA NA NA American Samoa NA NA NA NA NA NA Arizona 576 264 312 1.70 67 329 Arkansas 265 101 164 0.89 35 173 California 3,258 1,251 2,007 10.91 429 2,113 Colorado 625 253 371 2.02 79 391 Connecticut 473 173 300 1.63 64 316 Delaware 111 46 66 0.36 14 69 District of Columbia 240 46 194 1.05 41 204 Florida 2,095 918 1,177 6.40 252 1,240 Georgia 1,077 388 689 3.75 147 726 Guam NA NA NA NA NA NA Hawaii 136 64 72 0.39 16 76 Idaho 184 64 121 0.66 26 127 Illinois 1,042 462 579 3.15 124 610 Indiana 578 284 294 1.60 63 309 Iowa 289 114 174 0.95 37 184 Kansas 279 96 183 1.00 39 193 Kentucky 311 146 165 0.90 35 174 Louisiana 418 205 214 1.16 46 225 Maine 167 63 104 0.57 22 110 Maryland 653 282 371 2.02 79 391 Massachusetts 855 331 523 2.85 112 551 Michigan 839 391 448 2.44 96 472 Minnesota 538 206 332 1.80 71 349 Mississippi 250 112 138 0.75 29 145 Missouri 628 227 401 2.18 86 422 Montana 111 50 61 0.33 13 64 Nebraska 196 68 128 0.70 27 135 Nevada 221 88 132 0.72 28 139 New Hampshire 172 65 106 0.58 23 112 New Jersey 1,288 505 782 4.25 167 824 New Mexico 200 92 109 0.59 23 114 New York 2,185 845 1,340 7.29 287 1,411 North Carolina 901 412 489 2.66 105 515 North Dakota 91 30 61 0.33 13 64 N. Mariana Islands NA NA NA NA NA NA Ohio 1,086 481 605 3.29 129 637 Oklahoma 330 127 203 1.10 43 214 Oregon 445 173 273 1.48 58 287 Pennsylvania 1,383 595 788 4.28 168 830 Puerto Rico 245 66 179 0.97 38 189 Rhode Island 96 46 50 0.27 11 53 South Carolina 409 188 221 1.20 47 232 South Dakota 86 32 54 0.29 11 57 Tennessee 552 258 294 1.60 63 309 Texas 2,158 791 1,367 7.43 292 1,439 Utah 250 95 155 0.84 33 164 Vermont 86 34 52 0.28 11 55 Virginia 1,000 372 628 3.42 134 661 Virgin Islands NA NA NA NA NA NA Washington 812 316 496 2.70 106 522 West Virginia 85 (85) -0.46 -18 -89 Wisconsin 478 238 240 1.31 51 253 Wyoming 80 27 53 0.29 11 55 Total 1/ $31,136 $12,748 $18,389 100.00 % $3,949 $19,451 NA - Not Applicable.Note: Includes switched and special access revenues and private line revenues. Figures may not add due to rounding.1/ Totals in the last two columns include revenues for locations not estimated.
Information for Allocating Interstate Access Revenues: 2002(Dollars in Millions)
3 4 5
1 - 52
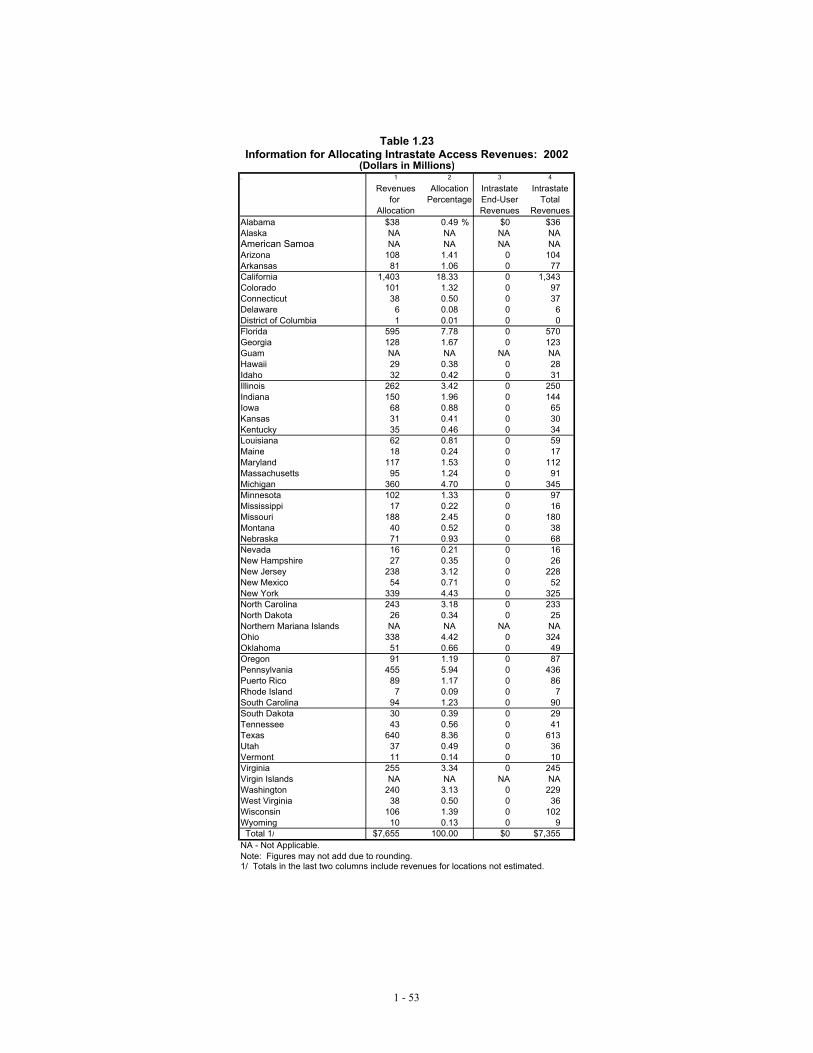
Table 1.23
. 4
Allocation Intrastate IntrastatePercentage End-User Total
Revenues RevenuesAlabama $38 0.49 % $0 $36 Alaska NA NA NA NA American Samoa NA NA NA NA Arizona 108 1.41 0 104 Arkansas 81 1.06 0 77 California 1,403 18.33 0 1,343 Colorado 101 1.32 0 97 Connecticut 38 0.50 0 37 Delaware 6 0.08 0 6 District of Columbia 1 0.01 0 0 Florida 595 7.78 0 570 Georgia 128 1.67 0 123 Guam NA NA NA NA Hawaii 29 0.38 0 28 Idaho 32 0.42 0 31 Illinois 262 3.42 0 250 Indiana 150 1.96 0 144 Iowa 68 0.88 0 65 Kansas 31 0.41 0 30 Kentucky 35 0.46 0 34 Louisiana 62 0.81 0 59 Maine 18 0.24 0 17 Maryland 117 1.53 0 112 Massachusetts 95 1.24 0 91 Michigan 360 4.70 0 345 Minnesota 102 1.33 0 97 Mississippi 17 0.22 0 16 Missouri 188 2.45 0 180 Montana 40 0.52 0 38 Nebraska 71 0.93 0 68 Nevada 16 0.21 0 16 New Hampshire 27 0.35 0 26 New Jersey 238 3.12 0 228 New Mexico 54 0.71 0 52 New York 339 4.43 0 325 North Carolina 243 3.18 0 233 North Dakota 26 0.34 0 25 Northern Mariana Islands NA NA NA NA Ohio 338 4.42 0 324 Oklahoma 51 0.66 0 49 Oregon 91 1.19 0 87 Pennsylvania 455 5.94 0 436 Puerto Rico 89 1.17 0 86 Rhode Island 7 0.09 0 7 South Carolina 94 1.23 0 90 South Dakota 30 0.39 0 29 Tennessee 43 0.56 0 41 Texas 640 8.36 0 613 Utah 37 0.49 0 36 Vermont 11 0.14 0 10 Virginia 255 3.34 0 245 Virgin Islands NA NA NA NA Washington 240 3.13 0 229 West Virginia 38 0.50 0 36 Wisconsin 106 1.39 0 102 Wyoming 10 0.13 0 9 Total 1/ $7,655 100.00 $0 $7,355 NA - Not Applicable.Note: Figures may not add due to rounding.1/ Totals in the last two columns include revenues for locations not estimated.
Information for Allocating Intrastate Access Revenues: 2002
2 3
Revenuesfor
(Dollars in Millions)
Allocation
1
1 - 53

Table 1.24Information for Allocating LECs' Intrastate Toll: 2002
(Dollars in Millions)
Reported Revenues Intrastateby Revenues 2/
Large ILECs 1/Alabama $33 $39Alaska NA NAAmerican Samoa NA NAArizona 15 16Arkansas 40 58California 872 886Colorado 25 26Connecticut 177 179Delaware 9 9District of Columbia 0 0Florida 142 144Georgia 74 83Guam NA NAHawaii 7 7Idaho 7 7Illinois 334 352Indiana 91 95Iowa 12 19Kansas 21 25Kentucky 19 24Louisiana 36 39Maine 57 69Maryland 41 41Massachusetts 240 241Michigan 382 397Minnesota 8 12Mississippi 43 47Missouri 42 49Montana 5 7Nebraska 8 11Nevada 5 5New Hampshire 38 41New Jersey 378 378New Mexico 9 10New York 177 183North Carolina 59 66North Dakota 2 4Northern Mariana Islands NA NAOhio 116 122Oklahoma 41 50Oregon 18 20Pennsylvania 225 235Puerto Rico 112 112Rhode Island 19 19South Carolina 43 60South Dakota 5 8Tennessee 44 51Texas 189 204Utah 17 19Vermont 12 15Virginia 31 32Virgin Islands NA NAWashington 69 74West Virginia 19 22Wisconsin 104 141Wyoming 3 4 Total 3/ $4,473 $4,772NA - Not Applicable.
1/ Includes only carriers that file ARMIS Report 43-01.2/ We assume that there is no carrier's carrier LEC toll. End-user LEC toll equals total LEC toll.3/ Totals in the last column include revenues for locations not estimated.
1 2
Note: LEC is an abbreviation for local exchange carrier. Figures may not add due to rounding.
1 - 54

Table 1.25Information for Allocating Non-LECs' Intrastate Toll: 2002
(Dollars in Millions)
Access Minutes 1/ State Access Allocation End-User Totalfor Revenues Percentage 2/ Revenues Revenues
Allocation Alabama 2,338,948 1.01 % 0.49 % 0.88 % $145 $174Alaska NA NA NA NA NA NAAmerican Samoa NA NA NA NA NA NAArizona 1,491,930 0.65 1.41 0.84 138 165Arkansas 1,602,795 0.70 1.06 0.79 129 154California 49,520,241 21.47 18.33 20.69 3,393 4,065Colorado 1,832,030 0.79 1.32 0.93 152 182Connecticut 1,383,286 0.60 0.50 0.58 94 113Delaware 298,148 0.13 0.08 0.12 19 23District of Columbia 0 0.00 0.01 0.00 0 0Florida 13,267,685 5.75 7.78 6.26 1,026 1,230Georgia 4,552,555 1.97 1.67 1.90 311 373Guam NA NA NA NA NA NAHawaii 333,611 0.14 0.38 0.20 33 40Idaho 409,155 0.18 0.42 0.24 39 47Illinois 5,981,351 2.59 3.42 2.80 459 550Indiana 4,562,362 1.98 1.96 1.98 324 388Iowa 1,777,584 0.77 0.88 0.80 131 157Kansas 1,642,179 0.71 0.41 0.64 104 125Kentucky 1,929,395 0.84 0.46 0.74 122 146Louisiana 2,620,120 1.14 0.81 1.05 173 207Maine 1,526,222 0.66 0.24 0.56 91 109Maryland 4,632,410 2.01 1.53 1.89 310 371Massachusetts 8,089,003 3.51 1.24 2.94 482 578Michigan 6,378,524 2.77 4.70 3.25 533 639Minnesota 2,419,785 1.05 1.33 1.12 183 220Mississippi 1,197,964 0.52 0.22 0.45 73 88Missouri 2,863,876 1.24 2.45 1.54 253 303Montana 627,176 0.27 0.52 0.33 55 66Nebraska 946,016 0.41 0.93 0.54 89 106Nevada 523,469 0.23 0.21 0.22 37 44New Hampshire 1,345,297 0.58 0.35 0.53 86 103New Jersey 11,186,451 4.85 3.12 4.42 724 868New Mexico 634,924 0.28 0.71 0.38 63 76New York 20,459,492 8.87 4.43 7.76 1,273 1,525North Carolina 6,112,492 2.65 3.18 2.78 456 547North Dakota 387,152 0.17 0.34 0.21 35 42N. Mariana Islands NA NA NA NA NA NAOhio 9,536,280 4.14 4.42 4.21 690 826Oklahoma 1,825,623 0.79 0.66 0.76 125 149Oregon 1,883,751 0.82 1.19 0.91 149 179Pennsylvania 13,632,028 5.91 5.94 5.92 971 1,163Puerto Rico 0 0.00 1.17 0.29 48 57Rhode Island 763,974 0.33 0.09 0.27 44 53South Carolina 2,440,109 1.06 1.23 1.10 180 216South Dakota 309,166 0.13 0.39 0.20 32 39Tennessee 2,776,868 1.20 0.56 1.04 171 205Texas 14,920,108 6.47 8.36 6.94 1,138 1,364Utah 760,202 0.33 0.49 0.37 60 72Vermont 454,610 0.20 0.14 0.18 30 36Virginia 7,440,911 3.23 3.34 3.25 534 639Virgin Islands NA NA NA NA NA NAWashington 4,205,688 1.82 3.13 2.15 353 422West Virginia 1,201,009 0.52 0.50 0.51 84 101Wisconsin 3,329,004 1.44 1.39 1.43 234 281Wyoming 246,582 0.11 0.13 0.11 18 22 Total 3/ 230,599,542 100.00 % 100.00 % 100.00 % $16,455 $19,717NA - Not Applicable.Note: LEC is an abbreviation for local exchange carrier. Figures may not add due to rounding.1/ Access minutes are in thousands and include both originating and terminating minutes.2/ Allocation percentage is a function of both access minutes and access revenues.
1 5 62
3/ Totals in the last two columns include revenues for locations not estimated.
3 4
% of Nation
Access Minutes
% of Nation
1 - 55
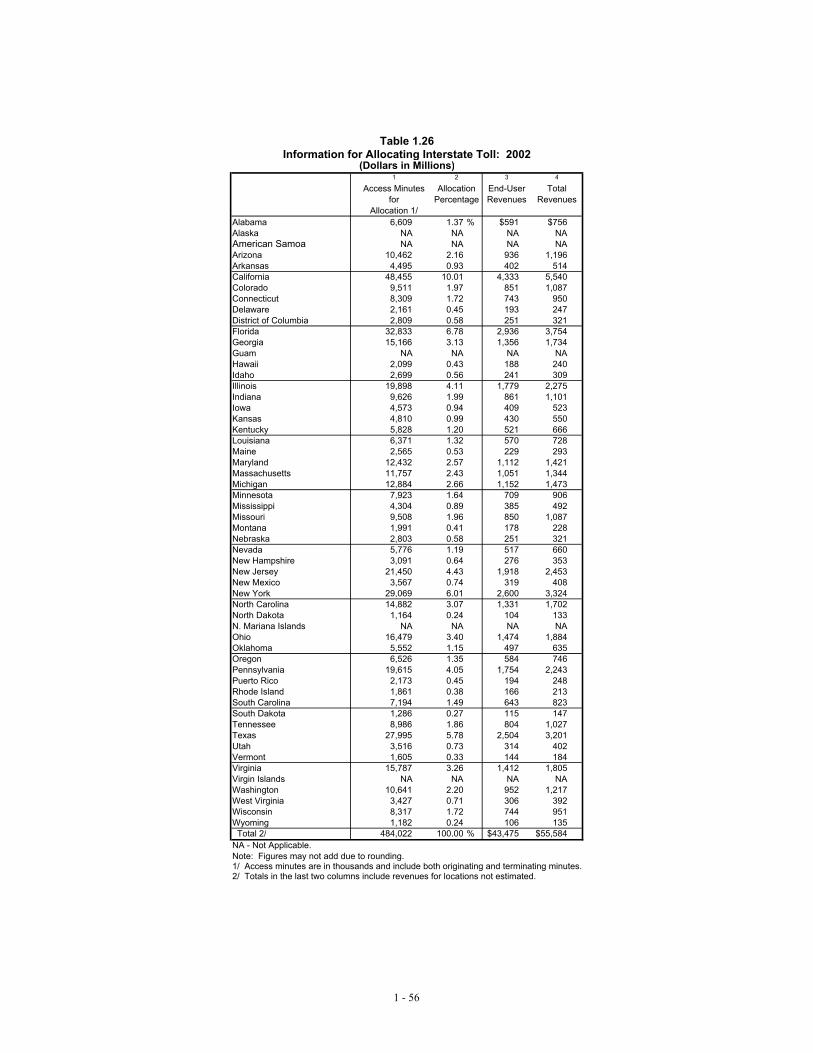
Table 1.26Information for Allocating Interstate Toll: 2002
Access Minutes Allocationfor Percentage
Allocation 1/ Alabama 6,609 1.37 % $591 $756Alaska NA NA NA NAAmerican Samoa NA NA NA NAArizona 10,462 2.16 936 1,196Arkansas 4,495 0.93 402 514California 48,455 10.01 4,333 5,540Colorado 9,511 1.97 851 1,087Connecticut 8,309 1.72 743 950Delaware 2,161 0.45 193 247District of Columbia 2,809 0.58 251 321Florida 32,833 6.78 2,936 3,754Georgia 15,166 3.13 1,356 1,734Guam NA NA NA NAHawaii 2,099 0.43 188 240Idaho 2,699 0.56 241 309Illinois 19,898 4.11 1,779 2,275Indiana 9,626 1.99 861 1,101Iowa 4,573 0.94 409 523Kansas 4,810 0.99 430 550Kentucky 5,828 1.20 521 666Louisiana 6,371 1.32 570 728Maine 2,565 0.53 229 293Maryland 12,432 2.57 1,112 1,421Massachusetts 11,757 2.43 1,051 1,344Michigan 12,884 2.66 1,152 1,473Minnesota 7,923 1.64 709 906Mississippi 4,304 0.89 385 492Missouri 9,508 1.96 850 1,087Montana 1,991 0.41 178 228Nebraska 2,803 0.58 251 321Nevada 5,776 1.19 517 660New Hampshire 3,091 0.64 276 353New Jersey 21,450 4.43 1,918 2,453New Mexico 3,567 0.74 319 408New York 29,069 6.01 2,600 3,324North Carolina 14,882 3.07 1,331 1,702North Dakota 1,164 0.24 104 133N. Mariana Islands NA NA NA NAOhio 16,479 3.40 1,474 1,884Oklahoma 5,552 1.15 497 635Oregon 6,526 1.35 584 746Pennsylvania 19,615 4.05 1,754 2,243Puerto Rico 2,173 0.45 194 248Rhode Island 1,861 0.38 166 213South Carolina 7,194 1.49 643 823South Dakota 1,286 0.27 115 147Tennessee 8,986 1.86 804 1,027Texas 27,995 5.78 2,504 3,201Utah 3,516 0.73 314 402Vermont 1,605 0.33 144 184Virginia 15,787 3.26 1,412 1,805Virgin Islands NA NA NA NAWashington 10,641 2.20 952 1,217West Virginia 3,427 0.71 306 392Wisconsin 8,317 1.72 744 951Wyoming 1,182 0.24 106 135 Total 2/ 484,022 100.00 % $43,475 $55,584NA - Not Applicable.Note: Figures may not add due to rounding.1/ Access minutes are in thousands and include both originating and terminating minutes.2/ Totals in the last two columns include revenues for locations not estimated.
1
End-UserRevenues
(Dollars in Millions)
TotalRevenues
42 3
1 - 56