telecommunications industry revenues: 2009 · telecommunications industry revenues this report...
TRANSCRIPT
Telecommunications Industry Revenues: 2009
Susan Lee Kenneth Lynch
Industry Analysis and Technology Division Wireline Competition Bureau
May 2011
This report is available for reference in the FCC's Reference Information Center, Courtyard Level, 445 12th Street, SW, Washington, DC. Copies may be purchased by contacting Best Copy and Printing, Inc., 445 12th Street, SW, Room CY-B402, Washington, DC, telephone (800) 378-3160, or via their website at www.bcpiweb.com. The report can also be downloaded from the Wireline Competition Bureau Statistical Reports Internet site at www.fcc.gov/wcb/stats.
Contents TEXT Telecommunications Industry Revenues ................................................................................................1 Form 499-A Filing Requirements ...........................................................................................................6 Summary Tables .....................................................................................................................................8
CHARTS 1. End-User Telecommunications Revenues........................................................................................3
2. End-User Interstate Telecommunications and Other Telecommunications Revenues.....................4
3. Share of Universal Service Contributions by Principal Type of Contributor...................................5
TABLES 1. Overview of Telecommunications Industry Revenues...................................................................11
2. Telecommunications Industry Revenues by Service......................................................................12
3. Telecommunications and Interconnected VoIP Revenues Reported by Type of Provider ............13
4. Contribution Base Revenues by Program: 2009............................................................................14
5. Revenues from Telecommunications and Interconnected VoIP Service Provided for Resale: 2009.............................................................................................................................15
6. Revenues from Telecommunications and Interconnected VoIP Service Provided to End Users: 2009 ........................................................................................................................19
7. Total Revenues: 2009....................................................................................................................23
8. Revenues by Type of Provider: 2009 ............................................................................................27
9. End-User Telecommunications and Interconnected VoIP Service Revenues by Region of the Country: 2009......................................................................................................................29
10. Share of Universal Service Contributions by Principal Type of Contributor.................................30
U.S. Federal Communications Commission Telecommunications Industry Revenues: 2009 i
Telecommunications Industry Revenues
This report provides an overview of U.S. telecommunications industry revenues and contributions to the universal service support mechanisms over the past decade.1 It updates our report that was released in September 2010.2 Most of the new data, for 2009, are based on April 1, 2010 filings of the annual Telecommunications Reporting Worksheet (FCC Form 499-A). Preliminary 2010 data presented in Table 1, and the preliminary 2010 and 2011 shares of universal service contributions by principal type of contributor presented in Table 10, are based on filings of the quarterly Telecommunications Reporting Worksheet (FCC Form 499-Q).3
Virtually all telecommunications carriers providing interstate telecommunications services in the United States (to either domestic or foreign points) and certain other providers of interstate telecommunications, including interconnected Voice over Internet Protocol (interconnected VoIP) service providers, must report the information that is summarized in this report.4 Reported information includes revenues from regulated telecommunications offerings, non-regulated telecommunications offerings, and services that are not telecommunications.
Because contributions to the universal service support mechanisms are generally based on end-user (retail) interstate telecommunications revenues, the report distinguishes between end-user telecommunications revenues and carrier’s carrier (wholesale) telecommunications revenues, and it distinguishes between interstate (including international) and intrastate revenues.5 The revenues that are considered non-telecommunications revenues in this context, such as from Internet access service or other
1 Revenue data summarized in this report are used to calculate and assess any necessary contributions to fund universal service (USF), interstate telecommunications relay services (TRS), the administration of the North American Numbering Plan (NANPA), and the shared costs of local number portability administration (LNPA). They are also used to calculate and assess interstate telecommunications service provider (ITSP) regulatory fees. Commission rules prohibit program administrators from releasing the company-specific revenue data to the public. 2 See Telecommunications Industry Revenues: 2008, available at http://www.fcc.gov/wcb/iatd/lec.html.
3 Summarized quarterly data are available at http://www.fcc.gov/wcb/iatd/lec.html. The quarterly data, which are far less detailed than the annual data, do not include the service-level detail that is available in the annual data.
4 Terms have specific meanings in the context of this report. “Telecommunications” means the transmission, between or among points specified by the user, of information of the user’s choosing, without change in the form or content of the information as sent and received. (47 U.S.C. § 153(43).) “Interstate telecommunications” includes, but is not limited to, the following types of services: wireless telephony, including cellular and personal communications services (PCS); paging and messaging services; dispatch and operator services; mobile radio services; access to interexchange service (which is provided by all incumbent and competitive local exchange carriers); special access; wide area telecommunications services (WATS); subscriber toll-free and 900 services; message telephone services (MTS); private line; telex; telegraph; video services; satellite services; resale services; Frame Relay services; asynchronous transfer mode (ATM) services; Multi-Protocol Label Switching (MPLS) services; audio bridging services; and interconnected VoIP services. No exemptions exist for data or non-voice services. See 2011 FCC Form 499-A Instructions (499-A Instructions), section II.A (“Who must file”), available at http://www.fcc.gov/formpage.html, for additional information.
5 (Domestic) interstate revenues and international revenues are separately identified in some tables of the report.
U.S. Federal Communications Commission Telecommunications Industry Revenues: 2009 1
information services, customer premises equipment (CPE) sales, inside wiring maintenance, published directories, or cable or direct broadcast satellite (DBS) services, are not discussed in detail in the report.6 In 2009, the industry reported $281 billion in telecommunications service revenues, a decrease of 5% from 2008’s $297 billion. The $281 billion includes revenues from interstate (including international) and intrastate services, and from end-user and carrier’s carrier services. It includes revenues from all the major service categories: toll (“long distance”) service, which primarily is reported by providers who use wired networks; 7 local service, which also is primarily reported by wireline carriers; and mobile wireless service. Details of the data include:
• Total (carrier’s carrier and end-user) toll service revenues decreased about 8% during 2009, from $61 billion to $56 billion. End-user toll service revenues decreased about 9%, from $47 billion to $43 billion. See Table 1.
• Filers reported $107 billion of total (carrier’s carrier and end-user) local service revenues for
2009, about 4% less than the $112 billion reported for 2008. End-user local service revenues decreased about 6% during 2009, from $73 billion to $68 billion. See Table 1.
• Total (carrier’s carrier and end-user) mobile wireless service revenues fell by 5% between 2008
and 2009, from $124 billion to $118 billion, and the end-user services component fell by 4%, from $119 billion to $114 billion. See Table 1. This reverses a long-standing trend. However, when non-telecommunications revenues such as CPE sales and Internet service are included, total revenues of providers whose principal business activity is mobile wireless service held steady at about $187 billion. See Table 8.
• Total (carrier’s carrier and end-user) telecommunications revenues for incumbent local exchange
carriers (ILECs) decreased to $83 billion in 2009, down 7% from $90 billion in 2008. See Table 3. These carriers reported $49 billion of fixed local service end-user revenue in 2009. See Table 8. This is about 10% lower than the $54 billion they had reported for 2008.
• Non-ILEC providers of local services, including competitive local exchange carriers (CLECs),
interconnected VoIP service providers, and, to a much lesser extent, toll carriers and mobile wireless carriers, reported $20 billion of fixed local service end-user revenues in 2009. See Table 8. This is about 5% higher than the $19 billion they had reported for 2008.
6 See 499-A Instructions, section III.C.1.iv, for additional examples of non-telecommunications services. Non-telecommunications revenues are presented only in report Tables 2, 7, and 8. 7 Toll revenues collected by Form 499-A include a small percentage of mobile wireless revenues, representing calls that used alternative billing arrangements (credit card, collect, etc.) or that were itemized as toll calls on mobile wireless service bills.
U.S. Federal Communications Commission Telecommunications Industry Revenues: 2009 2
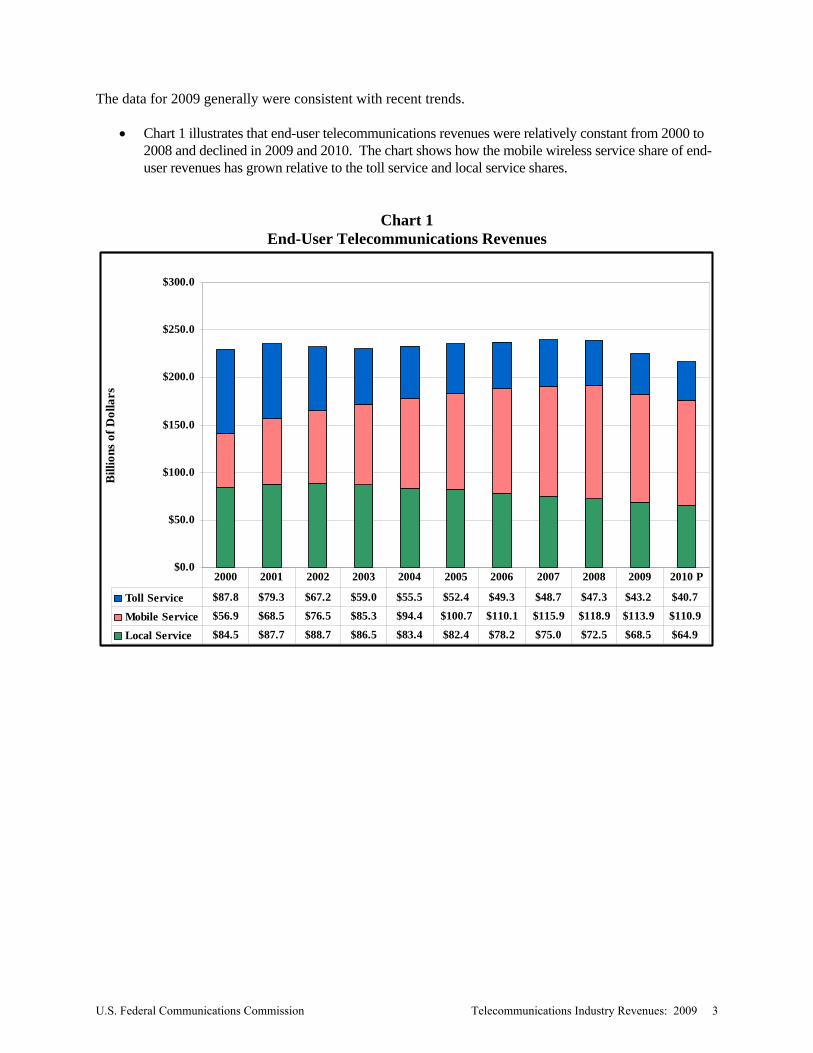
The data for 2009 generally were consistent with recent trends.
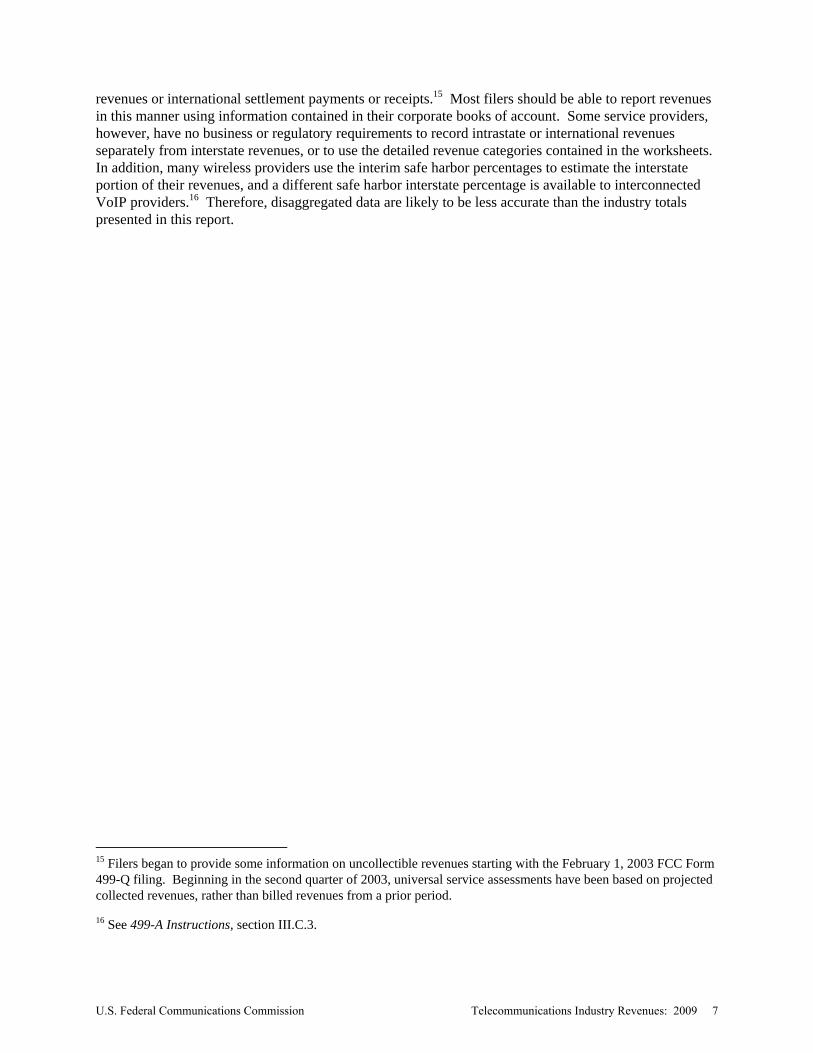
• Chart 1 illustrates that end-user telecommunications revenues were relatively constant from 2000 to 2008 and declined in 2009 and 2010. The chart shows how the mobile wireless service share of end-user revenues has grown relative to the toll service and local service shares.
Chart 1 End-User Telecommunications Revenues
$0.0
$50.0
$100.0
$150.0
$200.0
$250.0
$300.0
Bill
ions
of D
olla
rs
Toll Service $87.8 $79.3 $67.2 $59.0 $55.5 $52.4 $49.3 $48.7 $47.3 $43.2 $40.7
Mobile Service $56.9 $68.5 $76.5 $85.3 $94.4 $100.7 $110.1 $115.9 $118.9 $113.9 $110.9
Local Service $84.5 $87.7 $88.7 $86.5 $83.4 $82.4 $78.2 $75.0 $72.5 $68.5 $64.9
2000 2001 2002 2003 2004 2005 2006 2007 2008 2009 2010 P
U.S. Federal Communications Commission Telecommunications Industry Revenues: 2009 3
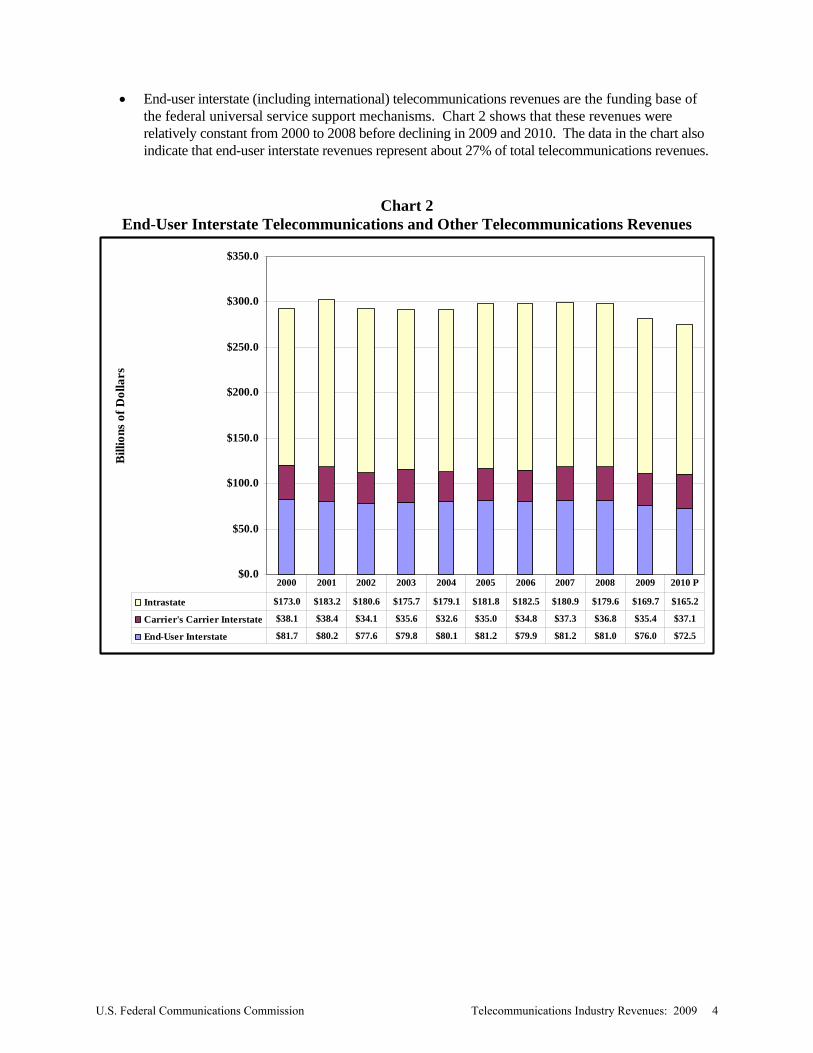
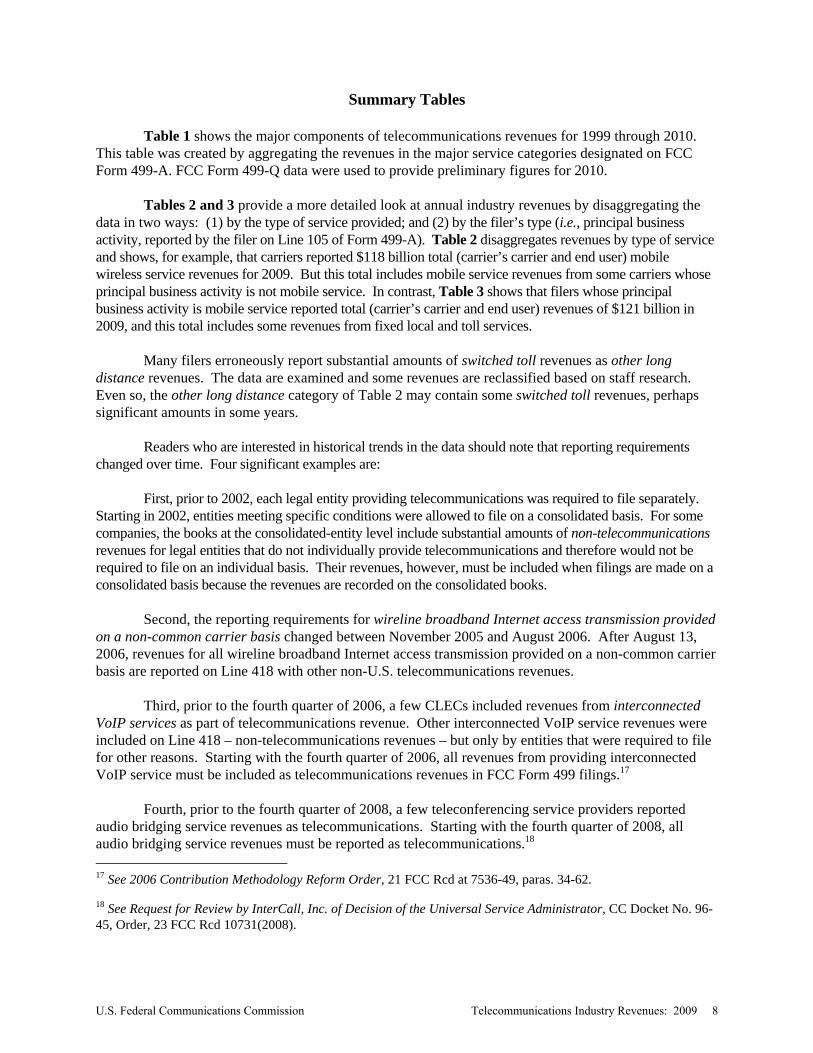
• End-user interstate (including international) telecommunications revenues are the funding base of the federal universal service support mechanisms. Chart 2 shows that these revenues were relatively constant from 2000 to 2008 before declining in 2009 and 2010. The data in the chart also indicate that end-user interstate revenues represent about 27% of total telecommunications revenues.
Chart 2 End-User Interstate Telecommunications and Other Telecommunications Revenues
$0.0
$50.0
$100.0
$150.0
$200.0
$250.0
$300.0
$350.0
Bill
ions
of D
olla
rs
Intrastate $173.0 $183.2 $180.6 $175.7 $179.1 $181.8 $182.5 $180.9 $179.6 $169.7 $165.2
Carrier's Carrier Interstate $38.1 $38.4 $34.1 $35.6 $32.6 $35.0 $34.8 $37.3 $36.8 $35.4 $37.1
End-User Interstate $81.7 $80.2 $77.6 $79.8 $80.1 $81.2 $79.9 $81.2 $81.0 $76.0 $72.5
2000 2001 2002 2003 2004 2005 2006 2007 2008 2009 2010 P
U.S. Federal Communications Commission Telecommunications Industry Revenues: 2009 4
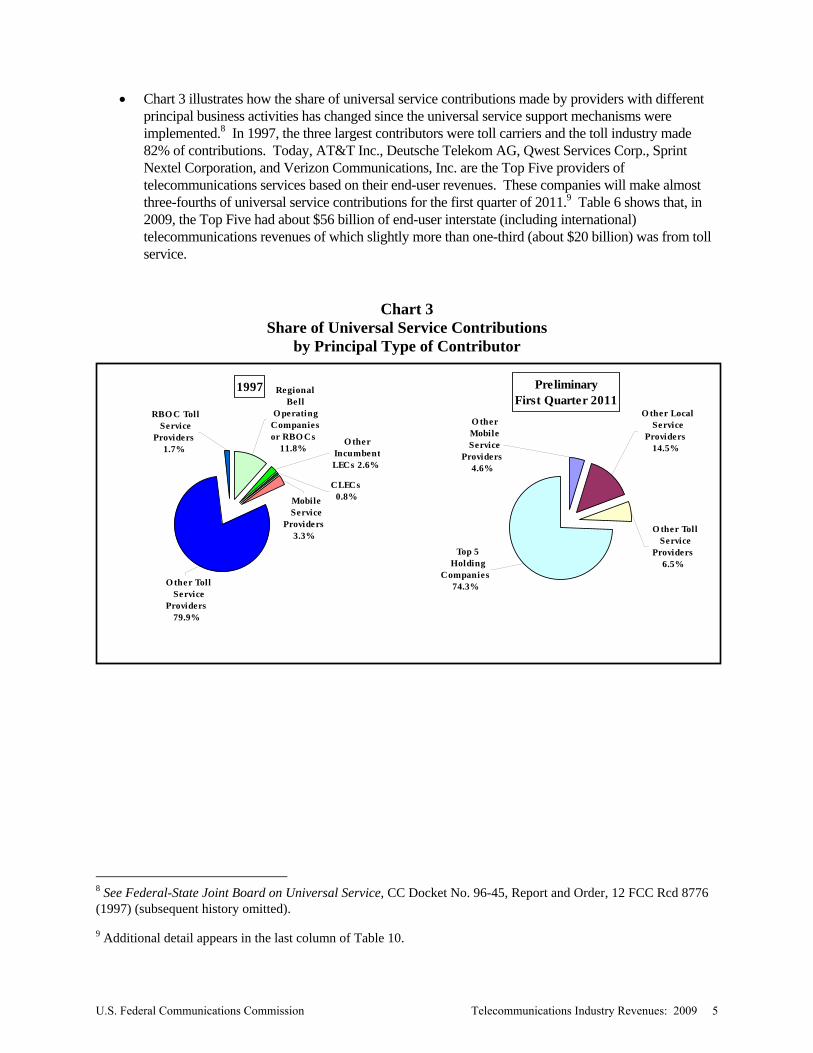
• Chart 3 illustrates how the share of universal service contributions made by providers with different principal business activities has changed since the universal service support mechanisms were implemented.8 In 1997, the three largest contributors were toll carriers and the toll industry made 82% of contributions. Today, AT&T Inc., Deutsche Telekom AG, Qwest Services Corp., Sprint Nextel Corporation, and Verizon Communications, Inc. are the Top Five providers of telecommunications services based on their end-user revenues. These companies will make almost three-fourths of universal service contributions for the first quarter of 2011.9 Table 6 shows that, in 2009, the Top Five had about $56 billion of end-user interstate (including international) telecommunications revenues of which slightly more than one-third (about $20 billion) was from toll service.
Chart 3 Share of Universal Service Contributions
by Principal Type of Contributor
8 See Federal-State Joint Board on Universal Service, CC Docket No. 96-45, Report and Order, 12 FCC Rcd 8776 (1997) (subsequent history omitted).
9 Additional detail appears in the last column of Table 10.
1997
O ther IncumbentLECs 2.6%
CLECs0.8%
RBO C Toll Service
Providers1.7%
O ther Toll Service
Providers79.9%
Regional Bell
O perating Companiesor RBO Cs
11.8%
Mobile Service
Providers3.3%
PreliminaryFirst Quarter 2011
Top 5 Holding
Companies74.3%
O ther Mobile Service
Providers4.6%
O ther Toll Service
Providers6.5%
O ther Local Service
Providers14.5%
U.S. Federal Communications Commission Telecommunications Industry Revenues: 2009 5
FCC Form 499-A Filing Requirements
All providers of telecommunications must file FCC Form 499-A each year, with few exceptions.10 The filings are made with the Universal Service Administrative Company (USAC), which serves as the Commission’s data collection agent. While the most recent filings were due April 1, 2010, some providers filed late or submitted revised filings after that date. Year 2009 data summarized in this report do not include information from filings received after December 2, 2010 or information from filings that were incomplete. Form 499-A requires each filer to choose a principal business activity that best describes its operations. The business activities among which the filer must choose appear in Table 3.11
Each filer must report total revenues, and separately report (domestic) interstate revenues and
international revenues.12 Revenues in each of the three categories must be broken down between revenues billed to universal service contributors for resale (carrier's carrier revenues) and revenues billed to de minimis telecommunications providers and end users (end-user revenues).13 Filers must provide further breakdowns of services into local, mobile wireless, and toll service categories. Fixed local services connect a specific point to one or more other points in the same geographic area. These services can be provided using wireline, fixed wireless, or interconnected VoIP technologies and can be used for local exchange service, private communications, or access to toll services. Mobile services are wireless communications between mobile wireless equipment, such as cellular phones, and other points. Toll services are telecommunications services – wireline, wireless, or interconnected VoIP services – that enable customers to communicate outside of local exchange calling areas. Toll service revenues include revenues from intrastate, interstate, and international long distance services.14 FCC Form 499-A filers are instructed to report amounts actually billed to customers. Therefore, filers must report revenues net of discounts, but without making adjustments to reflect uncollectible
10 Telecommunications providers that are contributors to any of the support mechanisms (USF, TRS, NANPA, or LNPA) must file Form 499-A. Under certain specified circumstances, three types of non-common-carrier telecommunications providers may not be required to file: (1) de minimis telecommunications providers; (2) government, broadcasters, schools, and libraries; and (3) system integrators and self-providers. See 499-A Instructions, section II.A and Appendix A, for more information.
Telecommunications providers are considered de minimis and thus are not required to contribute to USF (or to make quarterly filings of FCC Form 499-Q) if their annual contributions to USF would be less than $10,000. However, most of these providers must file Form 499-A because they must contribute to another of the support mechanisms (TRS, NANPA, or LNPA).
11 See also, 499-A Instructions, section III.A and Appendix B.
12 International-to-international revenues are more specifically identified by filers because these revenues are not assessable for universal service contribution purposes. 13 Underlying service providers treat de minimis firms as end users for universal service contribution purposes. 14 Section III.C.1 of 499-A Instructions provides additional information on revenue reporting categories.
U.S. Federal Communications Commission Telecommunications Industry Revenues: 2009 6
revenues or international settlement payments or receipts.15 Most filers should be able to report revenues in this manner using information contained in their corporate books of account. Some service providers, however, have no business or regulatory requirements to record intrastate or international revenues separately from interstate revenues, or to use the detailed revenue categories contained in the worksheets. In addition, many wireless providers use the interim safe harbor percentages to estimate the interstate portion of their revenues, and a different safe harbor interstate percentage is available to interconnected VoIP providers.16 Therefore, disaggregated data are likely to be less accurate than the industry totals presented in this report.
15 Filers began to provide some information on uncollectible revenues starting with the February 1, 2003 FCC Form 499-Q filing. Beginning in the second quarter of 2003, universal service assessments have been based on projected collected revenues, rather than billed revenues from a prior period. 16 See 499-A Instructions, section III.C.3.
U.S. Federal Communications Commission Telecommunications Industry Revenues: 2009 7
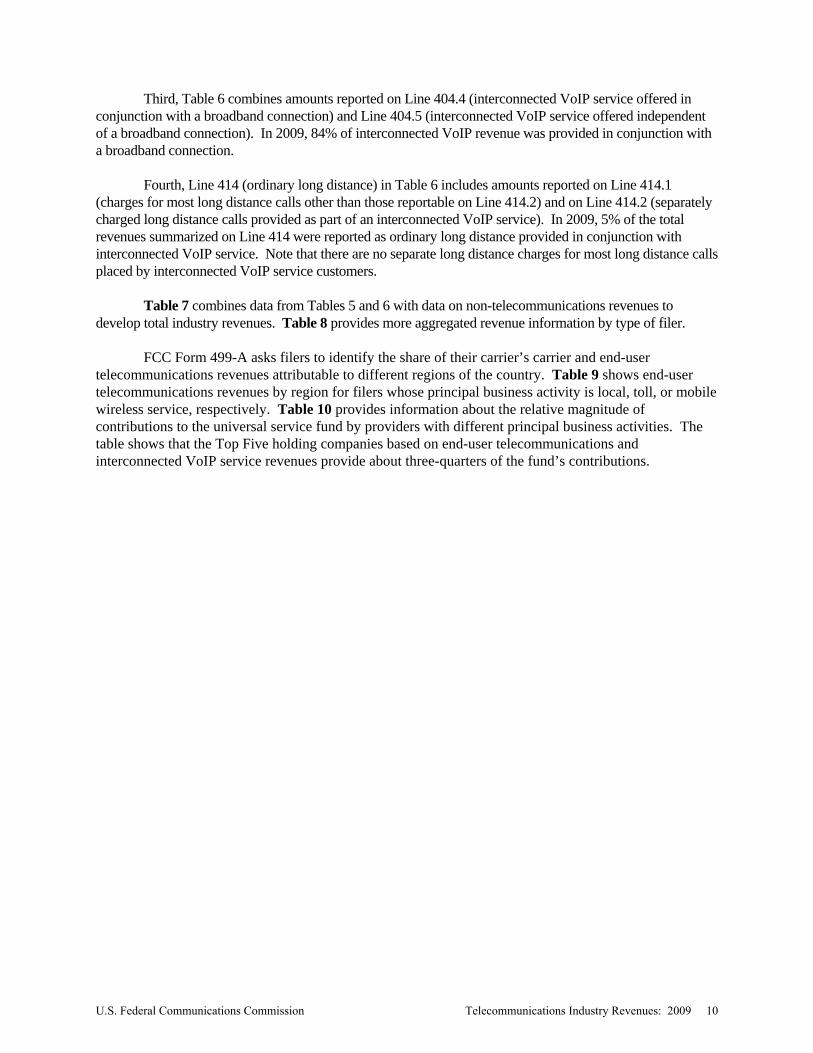
Summary Tables Table 1 shows the major components of telecommunications revenues for 1999 through 2010. This table was created by aggregating the revenues in the major service categories designated on FCC Form 499-A. FCC Form 499-Q data were used to provide preliminary figures for 2010.
Tables 2 and 3 provide a more detailed look at annual industry revenues by disaggregating the data in two ways: (1) by the type of service provided; and (2) by the filer’s type (i.e., principal business activity, reported by the filer on Line 105 of Form 499-A). Table 2 disaggregates revenues by type of service and shows, for example, that carriers reported $118 billion total (carrier’s carrier and end user) mobile wireless service revenues for 2009. But this total includes mobile service revenues from some carriers whose principal business activity is not mobile service. In contrast, Table 3 shows that filers whose principal business activity is mobile service reported total (carrier’s carrier and end user) revenues of $121 billion in 2009, and this total includes some revenues from fixed local and toll services.
Many filers erroneously report substantial amounts of switched toll revenues as other long
distance revenues. The data are examined and some revenues are reclassified based on staff research. Even so, the other long distance category of Table 2 may contain some switched toll revenues, perhaps significant amounts in some years.
Readers who are interested in historical trends in the data should note that reporting requirements changed over time. Four significant examples are: First, prior to 2002, each legal entity providing telecommunications was required to file separately. Starting in 2002, entities meeting specific conditions were allowed to file on a consolidated basis. For some companies, the books at the consolidated-entity level include substantial amounts of non-telecommunications revenues for legal entities that do not individually provide telecommunications and therefore would not be required to file on an individual basis. Their revenues, however, must be included when filings are made on a consolidated basis because the revenues are recorded on the consolidated books. Second, the reporting requirements for wireline broadband Internet access transmission provided on a non-common carrier basis changed between November 2005 and August 2006. After August 13, 2006, revenues for all wireline broadband Internet access transmission provided on a non-common carrier basis are reported on Line 418 with other non-U.S. telecommunications revenues.
Third, prior to the fourth quarter of 2006, a few CLECs included revenues from interconnected VoIP services as part of telecommunications revenue. Other interconnected VoIP service revenues were included on Line 418 – non-telecommunications revenues – but only by entities that were required to file for other reasons. Starting with the fourth quarter of 2006, all revenues from providing interconnected VoIP service must be included as telecommunications revenues in FCC Form 499 filings.17
Fourth, prior to the fourth quarter of 2008, a few teleconferencing service providers reported audio bridging service revenues as telecommunications. Starting with the fourth quarter of 2008, all audio bridging service revenues must be reported as telecommunications.18 17 See 2006 Contribution Methodology Reform Order, 21 FCC Rcd at 7536-49, paras. 34-62. 18 See Request for Review by InterCall, Inc. of Decision of the Universal Service Administrator, CC Docket No. 96-45, Order, 23 FCC Rcd 10731(2008).
U.S. Federal Communications Commission Telecommunications Industry Revenues: 2009 8
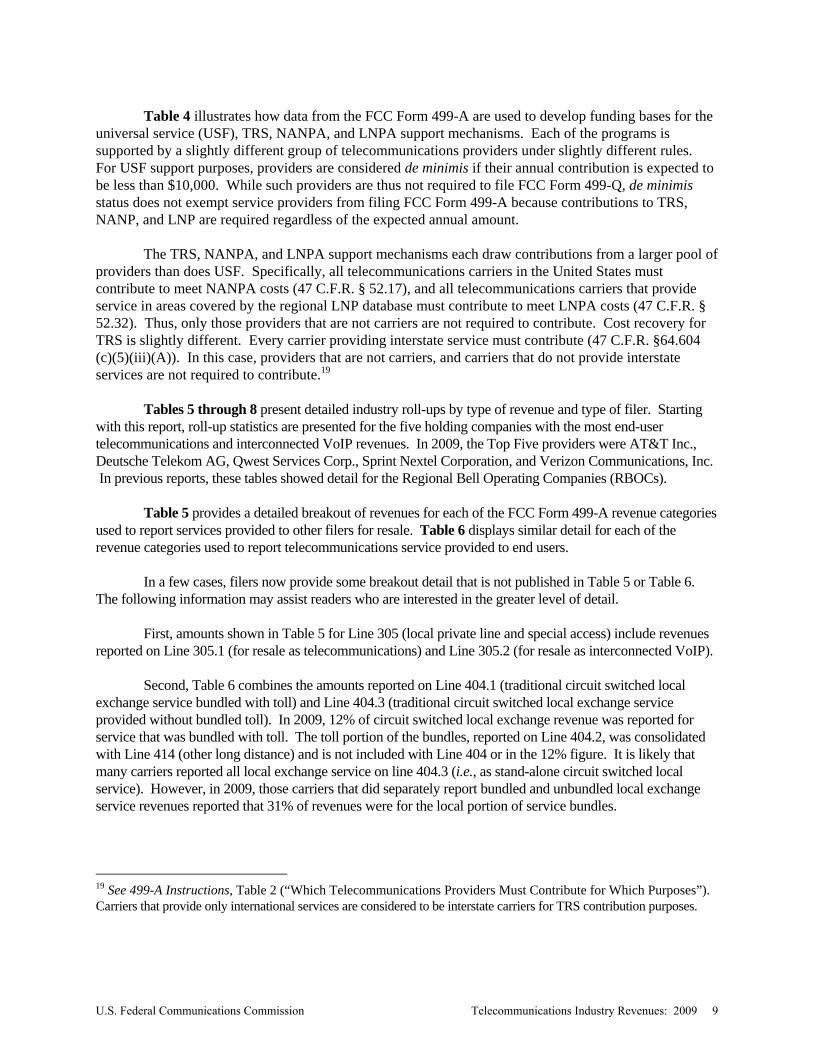
Table 4 illustrates how data from the FCC Form 499-A are used to develop funding bases for the universal service (USF), TRS, NANPA, and LNPA support mechanisms. Each of the programs is supported by a slightly different group of telecommunications providers under slightly different rules. For USF support purposes, providers are considered de minimis if their annual contribution is expected to be less than $10,000. While such providers are thus not required to file FCC Form 499-Q, de minimis status does not exempt service providers from filing FCC Form 499-A because contributions to TRS, NANP, and LNP are required regardless of the expected annual amount. The TRS, NANPA, and LNPA support mechanisms each draw contributions from a larger pool of providers than does USF. Specifically, all telecommunications carriers in the United States must contribute to meet NANPA costs (47 C.F.R. § 52.17), and all telecommunications carriers that provide service in areas covered by the regional LNP database must contribute to meet LNPA costs (47 C.F.R. § 52.32). Thus, only those providers that are not carriers are not required to contribute. Cost recovery for TRS is slightly different. Every carrier providing interstate service must contribute (47 C.F.R. §64.604 (c)(5)(iii)(A)). In this case, providers that are not carriers, and carriers that do not provide interstate services are not required to contribute.19 Tables 5 through 8 present detailed industry roll-ups by type of revenue and type of filer. Starting with this report, roll-up statistics are presented for the five holding companies with the most end-user telecommunications and interconnected VoIP revenues. In 2009, the Top Five providers were AT&T Inc., Deutsche Telekom AG, Qwest Services Corp., Sprint Nextel Corporation, and Verizon Communications, Inc. In previous reports, these tables showed detail for the Regional Bell Operating Companies (RBOCs). Table 5 provides a detailed breakout of revenues for each of the FCC Form 499-A revenue categories used to report services provided to other filers for resale. Table 6 displays similar detail for each of the revenue categories used to report telecommunications service provided to end users.
In a few cases, filers now provide some breakout detail that is not published in Table 5 or Table 6. The following information may assist readers who are interested in the greater level of detail. First, amounts shown in Table 5 for Line 305 (local private line and special access) include revenues reported on Line 305.1 (for resale as telecommunications) and Line 305.2 (for resale as interconnected VoIP). Second, Table 6 combines the amounts reported on Line 404.1 (traditional circuit switched local exchange service bundled with toll) and Line 404.3 (traditional circuit switched local exchange service provided without bundled toll). In 2009, 12% of circuit switched local exchange revenue was reported for service that was bundled with toll. The toll portion of the bundles, reported on Line 404.2, was consolidated with Line 414 (other long distance) and is not included with Line 404 or in the 12% figure. It is likely that many carriers reported all local exchange service on line 404.3 (i.e., as stand-alone circuit switched local service). However, in 2009, those carriers that did separately report bundled and unbundled local exchange service revenues reported that 31% of revenues were for the local portion of service bundles.
19 See 499-A Instructions, Table 2 (“Which Telecommunications Providers Must Contribute for Which Purposes”). Carriers that provide only international services are considered to be interstate carriers for TRS contribution purposes.
U.S. Federal Communications Commission Telecommunications Industry Revenues: 2009 9
Third, Table 6 combines amounts reported on Line 404.4 (interconnected VoIP service offered in conjunction with a broadband connection) and Line 404.5 (interconnected VoIP service offered independent of a broadband connection). In 2009, 84% of interconnected VoIP revenue was provided in conjunction with a broadband connection. Fourth, Line 414 (ordinary long distance) in Table 6 includes amounts reported on Line 414.1 (charges for most long distance calls other than those reportable on Line 414.2) and on Line 414.2 (separately charged long distance calls provided as part of an interconnected VoIP service). In 2009, 5% of the total revenues summarized on Line 414 were reported as ordinary long distance provided in conjunction with interconnected VoIP service. Note that there are no separate long distance charges for most long distance calls placed by interconnected VoIP service customers. Table 7 combines data from Tables 5 and 6 with data on non-telecommunications revenues to develop total industry revenues. Table 8 provides more aggregated revenue information by type of filer.
FCC Form 499-A asks filers to identify the share of their carrier’s carrier and end-user telecommunications revenues attributable to different regions of the country. Table 9 shows end-user telecommunications revenues by region for filers whose principal business activity is local, toll, or mobile wireless service, respectively. Table 10 provides information about the relative magnitude of contributions to the universal service fund by providers with different principal business activities. The table shows that the Top Five holding companies based on end-user telecommunications and interconnected VoIP service revenues provide about three-quarters of the fund’s contributions.
U.S. Federal Communications Commission Telecommunications Industry Revenues: 2009 10
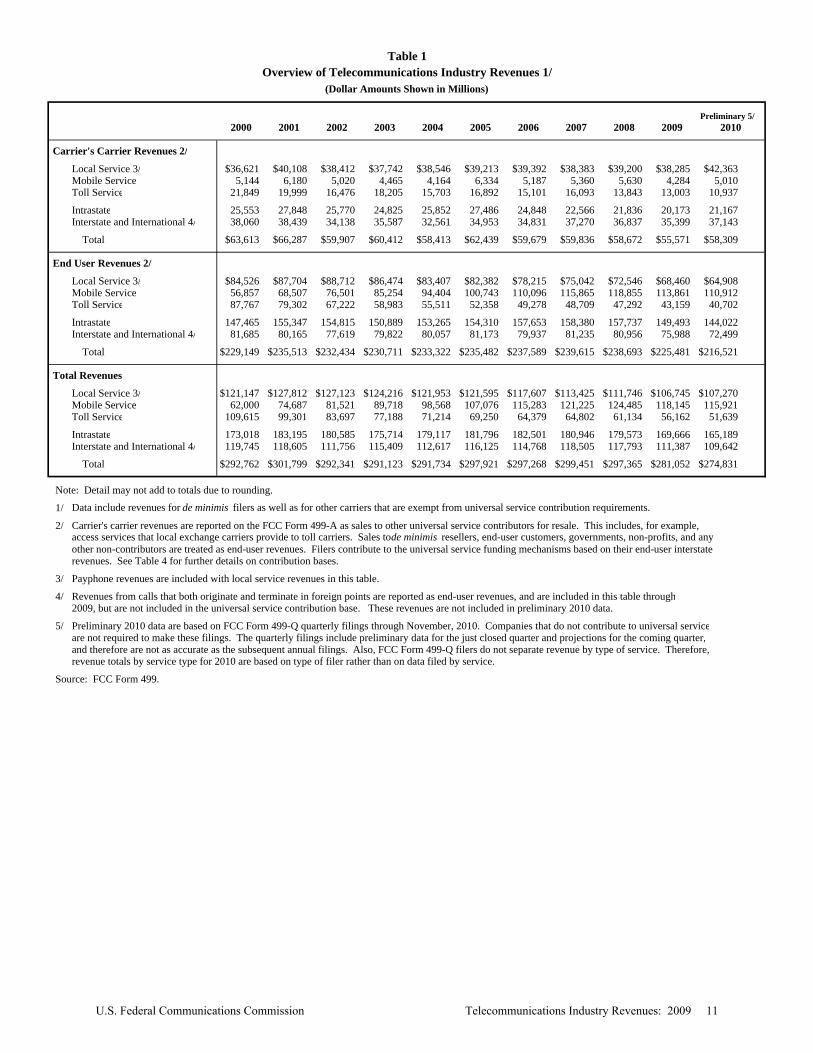
Table 1Overview of Telecommunications Industry Revenues 1/
(Dollar Amounts Shown in Millions)
Preliminary 5/ 2000 2001 2002 2003 2004 2005 2006 2007 2008 2009 2010
Carrier's Carrier Revenues 2/
Local Service 3/ $36,621 $40,108 $38,412 $37,742 $38,546 $39,213 $39,392 $38,383 $39,200 $38,285 $42,363Mobile Service 5,144 6,180 5,020 4,465 4,164 6,334 5,187 5,360 5,630 4,284 5,010Toll Service 21,849 19,999 16,476 18,205 15,703 16,892 15,101 16,093 13,843 13,003 10,937
Intrastate 25,553 27,848 25,770 24,825 25,852 27,486 24,848 22,566 21,836 20,173 21,167Interstate and International 4/ 38,060 38,439 34,138 35,587 32,561 34,953 34,831 37,270 36,837 35,399 37,143
Total $63,613 $66,287 $59,907 $60,412 $58,413 $62,439 $59,679 $59,836 $58,672 $55,571 $58,309
End User Revenues 2/
Local Service 3/ $84,526 $87,704 $88,712 $86,474 $83,407 $82,382 $78,215 $75,042 $72,546 $68,460 $64,908Mobile Service 56,857 68,507 76,501 85,254 94,404 100,743 110,096 115,865 118,855 113,861 110,912Toll Service 87,767 79,302 67,222 58,983 55,511 52,358 49,278 48,709 47,292 43,159 40,702
Intrastate 147,465 155,347 154,815 150,889 153,265 154,310 157,653 158,380 157,737 149,493 144,022Interstate and International 4/ 81,685 80,165 77,619 79,822 80,057 81,173 79,937 81,235 80,956 75,988 72,499
Total $229,149 $235,513 $232,434 $230,711 $233,322 $235,482 $237,589 $239,615 $238,693 $225,481 $216,521
Total Revenues
Local Service 3/ $121,147 $127,812 $127,123 $124,216 $121,953 $121,595 $117,607 $113,425 $111,746 $106,745 $107,270Mobile Service 62,000 74,687 81,521 89,718 98,568 107,076 115,283 121,225 124,485 118,145 115,921Toll Service 109,615 99,301 83,697 77,188 71,214 69,250 64,379 64,802 61,134 56,162 51,639
Intrastate 173,018 183,195 180,585 175,714 179,117 181,796 182,501 180,946 179,573 169,666 165,189Interstate and International 4/ 119,745 118,605 111,756 115,409 112,617 116,125 114,768 118,505 117,793 111,387 109,642
Total $292,762 $301,799 $292,341 $291,123 $291,734 $297,921 $297,268 $299,451 $297,365 $281,052 $274,831
Note: Detail may not add to totals due to rounding.
1/ Data include revenues for de minimis filers as well as for other carriers that are exempt from universal service contribution requirements.
2/ Carrier's carrier revenues are reported on the FCC Form 499-A as sales to other universal service contributors for resale. This includes, for example,access services that local exchange carriers provide to toll carriers. Sales to de minimis resellers, end-user customers, governments, non-profits, and any other non-contributors are treated as end-user revenues. Filers contribute to the universal service funding mechanisms based on their end-user interstaterevenues. See Table 4 for further details on contribution bases.
3/ Payphone revenues are included with local service revenues in this table.
4/ Revenues from calls that both originate and terminate in foreign points are reported as end-user revenues, and are included in this table through2009, but are not included in the universal service contribution base. These revenues are not included in preliminary 2010 data.
5/ Preliminary 2010 data are based on FCC Form 499-Q quarterly filings through November, 2010. Companies that do not contribute to universal serviceare not required to make these filings. The quarterly filings include preliminary data for the just closed quarter and projections for the coming quarter,and therefore are not as accurate as the subsequent annual filings. Also, FCC Form 499-Q filers do not separate revenue by type of service. Therefore,revenue totals by service type for 2010 are based on type of filer rather than on data filed by service.
Source: FCC Form 499.
U.S. Federal Communications Commission Telecommunications Industry Revenues: 2009 11
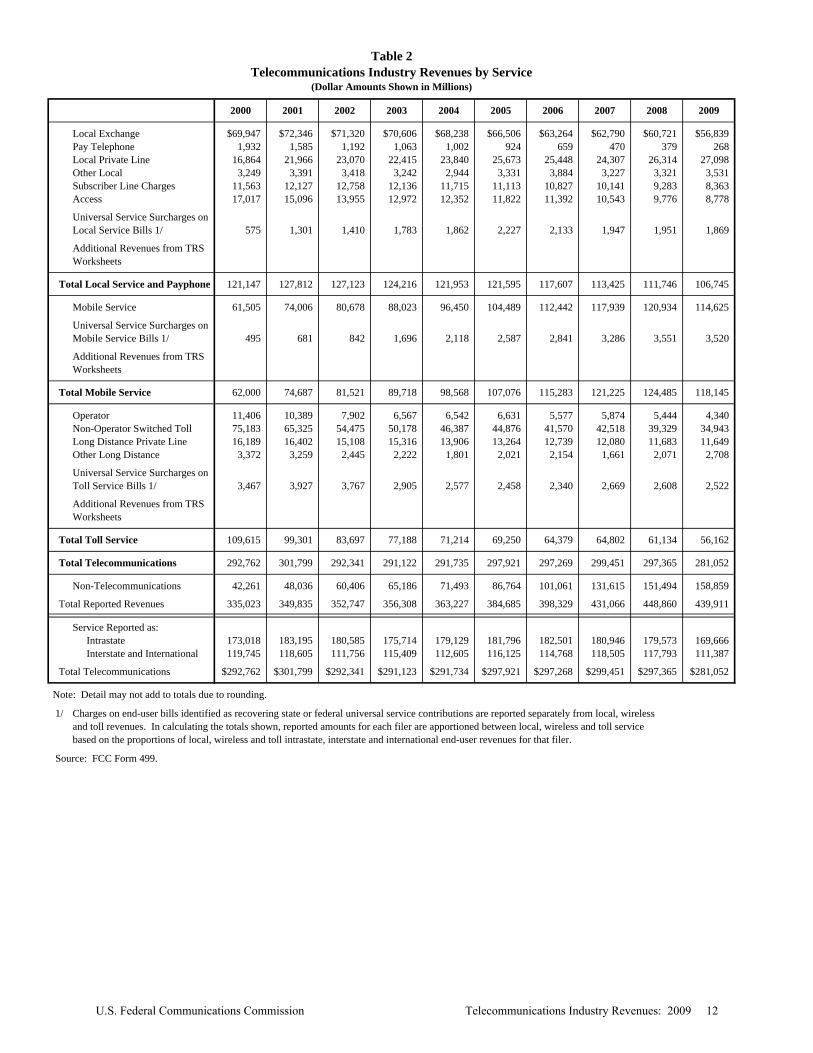
Table 2Telecommunications Industry Revenues by Service
(Dollar Amounts Shown in Millions)
2000 2001 2002 2003 2004 2005 2006 2007 2008 2009
Local Exchange $69,947 $72,346 $71,320 $70,606 $68,238 $66,506 $63,264 $62,790 $60,721 $56,839Pay Telephone 1,932 1,585 1,192 1,063 1,002 924 659 470 379 268Local Private Line 16,864 21,966 23,070 22,415 23,840 25,673 25,448 24,307 26,314 27,098Other Local 3,249 3,391 3,418 3,242 2,944 3,331 3,884 3,227 3,321 3,531Subscriber Line Charges 11,563 12,127 12,758 12,136 11,715 11,113 10,827 10,141 9,283 8,363Access 17,017 15,096 13,955 12,972 12,352 11,822 11,392 10,543 9,776 8,778
575 1,301 1,410 1,783 1,862 2,227 2,133 1,947 1,951 1,869
Total Local Service and Payphone 121,147 127,812 127,123 124,216 121,953 121,595 117,607 113,425 111,746 106,745
Mobile Service 61,505 74,006 80,678 88,023 96,450 104,489 112,442 117,939 120,934 114,625
495 681 842 1,696 2,118 2,587 2,841 3,286 3,551 3,520
Total Mobile Service 62,000 74,687 81,521 89,718 98,568 107,076 115,283 121,225 124,485 118,145
Operator 11,406 10,389 7,902 6,567 6,542 6,631 5,577 5,874 5,444 4,340Non-Operator Switched Toll 75,183 65,325 54,475 50,178 46,387 44,876 41,570 42,518 39,329 34,943Long Distance Private Line 16,189 16,402 15,108 15,316 13,906 13,264 12,739 12,080 11,683 11,649Other Long Distance 3,372 3,259 2,445 2,222 1,801 2,021 2,154 1,661 2,071 2,708
3,467 3,927 3,767 2,905 2,577 2,458 2,340 2,669 2,608 2,522
Total Toll Service 109,615 99,301 83,697 77,188 71,214 69,250 64,379 64,802 61,134 56,162
Total Telecommunications 292,762 301,799 292,341 291,122 291,735 297,921 297,269 299,451 297,365 281,052
Non-Telecommunications 42,261 48,036 60,406 65,186 71,493 86,764 101,061 131,615 151,494 158,859
Total Reported Revenues 335,023 349,835 352,747 356,308 363,227 384,685 398,329 431,066 448,860 439,911
Service Reported as:Intrastate 173,018 183,195 180,585 175,714 179,129 181,796 182,501 180,946 179,573 169,666Interstate and International 119,745 118,605 111,756 115,409 112,605 116,125 114,768 118,505 117,793 111,387
Total Telecommunications $292,762 $301,799 $292,341 $291,123 $291,734 $297,921 $297,268 $299,451 $297,365 $281,052
Note: Detail may not add to totals due to rounding.
1/ Charges on end-user bills identified as recovering state or federal universal service contributions are reported separately from local, wirelessand toll revenues. In calculating the totals shown, reported amounts for each filer are apportioned between local, wireless and toll service based on the proportions of local, wireless and toll intrastate, interstate and international end-user revenues for that filer.
Source: FCC Form 499.
Universal Service Surcharges on Toll Service Bills 1/
Additional Revenues from TRS Worksheets
Universal Service Surcharges on Local Service Bills 1/
Additional Revenues from TRS Worksheets
Universal Service Surcharges on Mobile Service Bills 1/
Additional Revenues from TRS Worksheets
U.S. Federal Communications Commission Telecommunications Industry Revenues: 2009 12
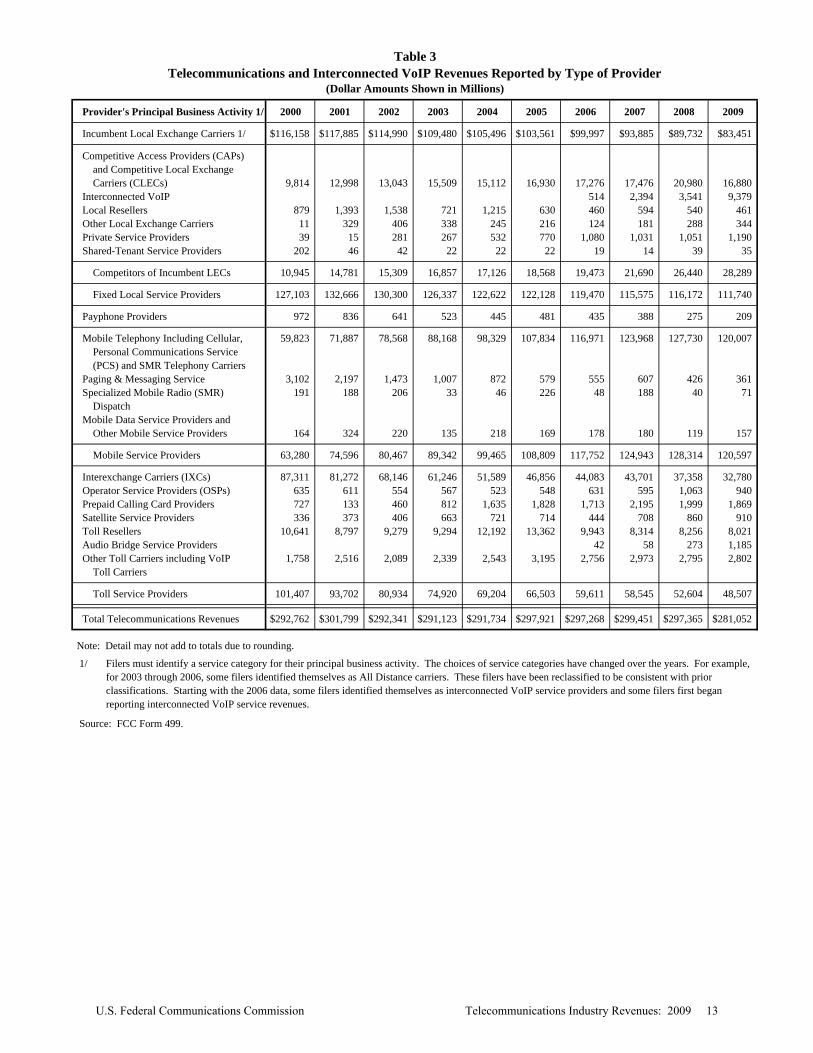
Table 3Telecommunications and Interconnected VoIP Revenues Reported by Type of Provider
(Dollar Amounts Shown in Millions)
Provider's Principal Business Activity 1/ 2000 2001 2002 2003 2004 2005 2006 2007 2008 2009
Incumbent Local Exchange Carriers 1/ $116,158 $117,885 $114,990 $109,480 $105,496 $103,561 $99,997 $93,885 $89,732 $83,451
Competitive Access Providers (CAPs) and Competitive Local Exchange Carriers (CLECs) 9,814 12,998 13,043 15,509 15,112 16,930 17,276 17,476 20,980 16,880Interconnected VoIP 514 2,394 3,541 9,379Local Resellers 879 1,393 1,538 721 1,215 630 460 594 540 461Other Local Exchange Carriers 11 329 406 338 245 216 124 181 288 344Private Service Providers 39 15 281 267 532 770 1,080 1,031 1,051 1,190Shared-Tenant Service Providers 202 46 42 22 22 22 19 14 39 35
Competitors of Incumbent LECs 10,945 14,781 15,309 16,857 17,126 18,568 19,473 21,690 26,440 28,289
Fixed Local Service Providers 127,103 132,666 130,300 126,337 122,622 122,128 119,470 115,575 116,172 111,740
Payphone Providers 972 836 641 523 445 481 435 388 275 209
Mobile Telephony Including Cellular, 59,823 71,887 78,568 88,168 98,329 107,834 116,971 123,968 127,730 120,007 Personal Communications Service (PCS) and SMR Telephony CarriersPaging & Messaging Service 3,102 2,197 1,473 1,007 872 579 555 607 426 361Specialized Mobile Radio (SMR) 191 188 206 33 46 226 48 188 40 71 Dispatch Mobile Data Service Providers and Other Mobile Service Providers 164 324 220 135 218 169 178 180 119 157
Mobile Service Providers 63,280 74,596 80,467 89,342 99,465 108,809 117,752 124,943 128,314 120,597
Interexchange Carriers (IXCs) 87,311 81,272 68,146 61,246 51,589 46,856 44,083 43,701 37,358 32,780Operator Service Providers (OSPs) 635 611 554 567 523 548 631 595 1,063 940Prepaid Calling Card Providers 727 133 460 812 1,635 1,828 1,713 2,195 1,999 1,869Satellite Service Providers 336 373 406 663 721 714 444 708 860 910Toll Resellers 10,641 8,797 9,279 9,294 12,192 13,362 9,943 8,314 8,256 8,021Audio Bridge Service Providers 42 58 273 1,185Other Toll Carriers including VoIP 1,758 2,516 2,089 2,339 2,543 3,195 2,756 2,973 2,795 2,802 Toll Carriers
Toll Service Providers 101,407 93,702 80,934 74,920 69,204 66,503 59,611 58,545 52,604 48,507
Total Telecommunications Revenues $292,762 $301,799 $292,341 $291,123 $291,734 $297,921 $297,268 $299,451 $297,365 $281,052
Note: Detail may not add to totals due to rounding.
1/ Filers must identify a service category for their principal business activity. The choices of service categories have changed over the years. For example, for 2003 through 2006, some filers identified themselves as All Distance carriers. These filers have been reclassified to be consistent with prior classifications. Starting with the 2006 data, some filers identified themselves as interconnected VoIP service providers and some filers first beganreporting interconnected VoIP service revenues.
Source: FCC Form 499.
U.S. Federal Communications Commission Telecommunications Industry Revenues: 2009 13
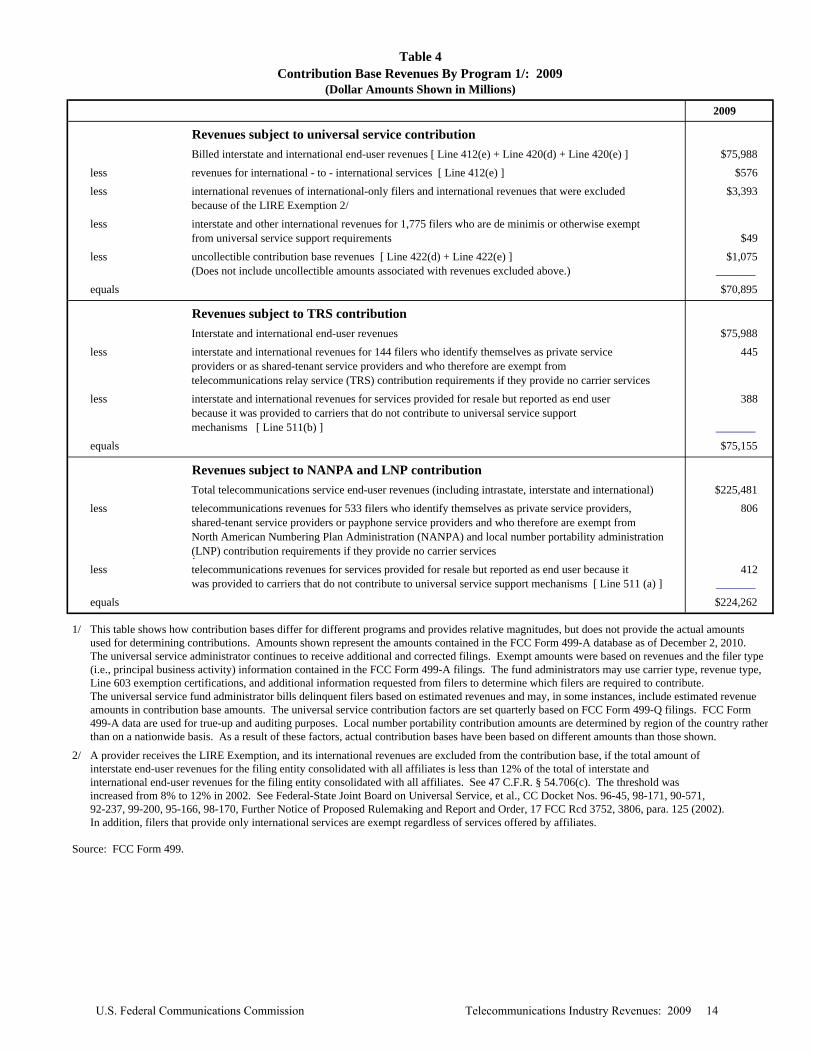
Table 4Contribution Base Revenues By Program 1/: 2009
(Dollar Amounts Shown in Millions)
2009
Revenues subject to universal service contributionBilled interstate and international end-user revenues [ Line 412(e) + Line 420(d) + Line 420(e) ] $75,988
less revenues for international - to - international services [ Line 412(e) ] $576less international revenues of international-only filers and international revenues that were excluded $3,393
because of the LIRE Exemption 2/less interstate and other international revenues for 1,775 filers who are de minimis or otherwise exempt
from universal service support requirements $49less uncollectible contribution base revenues [ Line 422(d) + Line 422(e) ] $1,075
(Does not include uncollectible amounts associated with revenues excluded above.) _______ equals $70,895
Revenues subject to TRS contribution Interstate and international end-user revenues $75,988
less interstate and international revenues for 144 filers who identify themselves as private service 445providers or as shared-tenant service providers and who therefore are exempt from telecommunications relay service (TRS) contribution requirements if they provide no carrier services
less interstate and international revenues for services provided for resale but reported as end user 388because it was provided to carriers that do not contribute to universal service support mechanisms [ Line 511(b) ] _______
equals $75,155
Revenues subject to NANPA and LNP contribution Total telecommunications service end-user revenues (including intrastate, interstate and international) $225,481
less telecommunications revenues for 533 filers who identify themselves as private service providers, 806shared-tenant service providers or payphone service providers and who therefore are exempt from North American Numbering Plan Administration (NANPA) and local number portability administration (LNP) contribution requirements if they provide no carrier services?
less telecommunications revenues for services provided for resale but reported as end user because it 412was provided to carriers that do not contribute to universal service support mechanisms [ Line 511 (a) ] _______
equals $224,262
1/ This table shows how contribution bases differ for different programs and provides relative magnitudes, but does not provide the actual amountsused for determining contributions. Amounts shown represent the amounts contained in the FCC Form 499-A database as of December 2, 2010. The universal service administrator continues to receive additional and corrected filings. Exempt amounts were based on revenues and the filer type (i.e., principal business activity) information contained in the FCC Form 499-A filings. The fund administrators may use carrier type, revenue type, Line 603 exemption certifications, and additional information requested from filers to determine which filers are required to contribute. The universal service fund administrator bills delinquent filers based on estimated revenues and may, in some instances, include estimated revenue amounts in contribution base amounts. The universal service contribution factors are set quarterly based on FCC Form 499-Q filings. FCC Form 499-A data are used for true-up and auditing purposes. Local number portability contribution amounts are determined by region of the country ratherthan on a nationwide basis. As a result of these factors, actual contribution bases have been based on different amounts than those shown.
2/ A provider receives the LIRE Exemption, and its international revenues are excluded from the contribution base, if the total amount of interstate end-user revenues for the filing entity consolidated with all affiliates is less than 12% of the total of interstate and international end-user revenues for the filing entity consolidated with all affiliates. See 47 C.F.R. § 54.706(c). The threshold was increased from 8% to 12% in 2002. See Federal-State Joint Board on Universal Service, et al., CC Docket Nos. 96-45, 98-171, 90-571,92-237, 99-200, 95-166, 98-170, Further Notice of Proposed Rulemaking and Report and Order, 17 FCC Rcd 3752, 3806, para. 125 (2002). In addition, filers that provide only international services are exempt regardless of services offered by affiliates.
Source: FCC Form 499.
U.S. Federal Communications Commission Telecommunications Industry Revenues: 2009 14
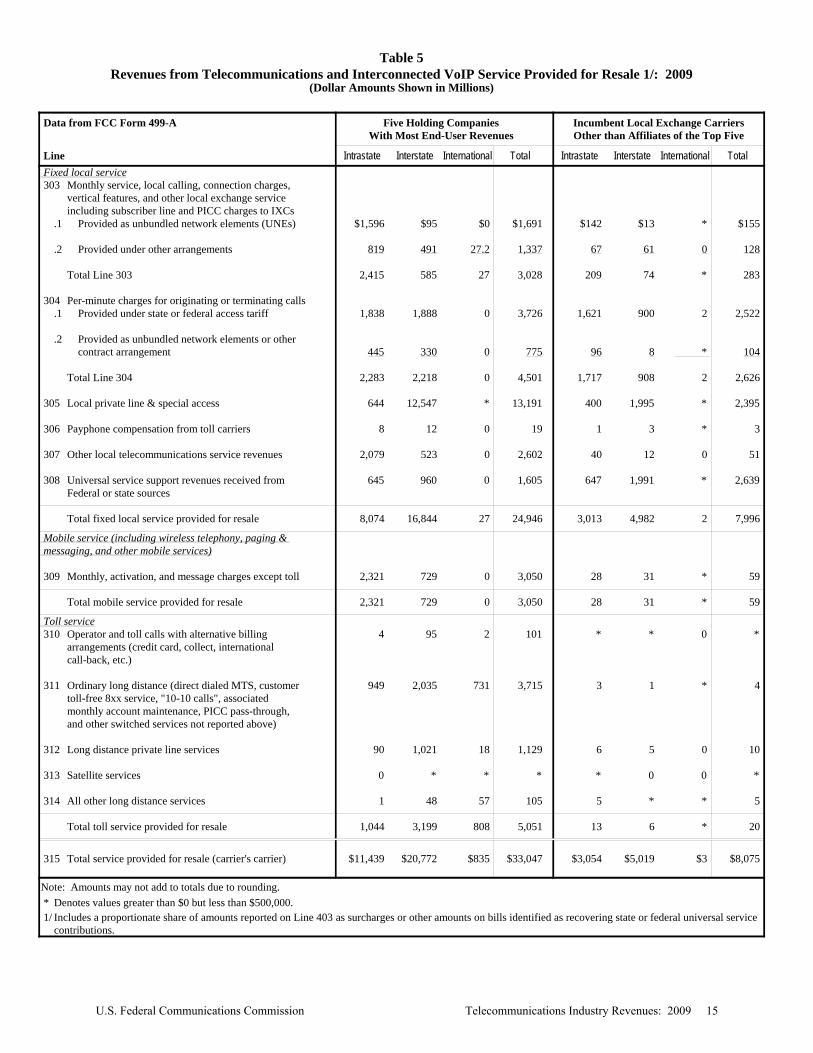
Table 5Revenues from Telecommunications and Interconnected VoIP Service Provided for Resale 1/: 2009
(Dollar Amounts Shown in Millions)
Data from FCC Form 499-A Five Holding Companies Incumbent Local Exchange CarriersWith Most End-User Revenues Other than Affiliates of the Top Five
Line Intrastate Interstate International Total Intrastate Interstate International Total Fixed local service 303 Monthly service, local calling, connection charges,
vertical features, and other local exchange service including subscriber line and PICC charges to IXCs
.1 Provided as unbundled network elements (UNEs) $1,596 $95 $0 $1,691 $142 $13 * $155
.2 Provided under other arrangements 819 491 27.2 1,337 67 61 0 128
Total Line 303 2,415 585 27 3,028 209 74 * 283
304 Per-minute charges for originating or terminating calls .1 Provided under state or federal access tariff 1,838 1,888 0 3,726 1,621 900 2 2,522
.2 Provided as unbundled network elements or other
contract arrangement 445 330 0 775 96 8 * 104
Total Line 304 2,283 2,218 0 4,501 1,717 908 2 2,626
305 Local private line & special access 644 12,547 * 13,191 400 1,995 * 2,395
306 Payphone compensation from toll carriers 8 12 0 19 1 3 * 3
307 Other local telecommunications service revenues 2,079 523 0 2,602 40 12 0 51
308 Universal service support revenues received from 645 960 0 1,605 647 1,991 * 2,639Federal or state sources Total fixed local service provided for resale 8,074 16,844 27 24,946 3,013 4,982 2 7,996
Mobile service (including wireless telephony, paging & messaging, and other mobile services)
309 Monthly, activation, and message charges except toll 2,321 729 0 3,050 28 31 * 59
Total mobile service provided for resale 2,321 729 0 3,050 28 31 * 59 Toll service 310 Operator and toll calls with alternative billing 4 95 2 101 * * 0 *
arrangements (credit card, collect, international call-back, etc.)
311 Ordinary long distance (direct dialed MTS, customer 949 2,035 731 3,715 3 1 * 4
toll-free 8xx service, "10-10 calls", associated monthly account maintenance, PICC pass-through, and other switched services not reported above)
312 Long distance private line services 90 1,021 18 1,129 6 5 0 10
313 Satellite services 0 * * * * 0 0 *
314 All other long distance services 1 48 57 105 5 * * 5
Total toll service provided for resale 1,044 3,199 808 5,051 13 6 * 20
315 Total service provided for resale (carrier's carrier) $11,439 $20,772 $835 $33,047 $3,054 $5,019 $3 $8,075
Note: Amounts may not add to totals due to rounding. * Denotes values greater than $0 but less than $500,000. 1/ Includes a proportionate share of amounts reported on Line 403 as surcharges or other amounts on bills identified as recovering state or federal universal service
contributions.
U.S. Federal Communications Commission Telecommunications Industry Revenues: 2009 15
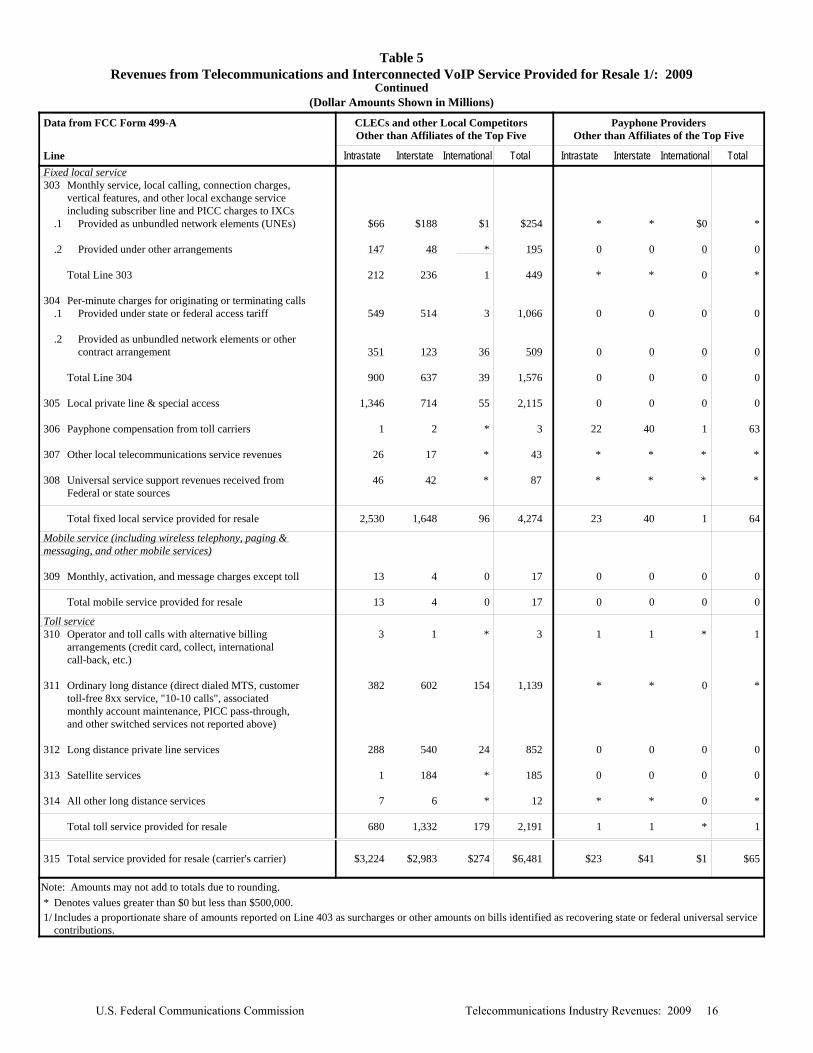
Table 5Revenues from Telecommunications and Interconnected VoIP Service Provided for Resale 1/: 2009
Continued(Dollar Amounts Shown in Millions)
Data from FCC Form 499-A CLECs and other Local Competitors Payphone ProvidersOther than Affiliates of the Top Five Other than Affiliates of the Top Five
Line Intrastate Interstate International Total Intrastate Interstate International Total Fixed local service 303 Monthly service, local calling, connection charges,
vertical features, and other local exchange service including subscriber line and PICC charges to IXCs
.1 Provided as unbundled network elements (UNEs) $66 $188 $1 $254 * * $0 *
.2 Provided under other arrangements 147 48 * 195 0 0 0 0
Total Line 303 212 236 1 449 * * 0 *
304 Per-minute charges for originating or terminating calls .1 Provided under state or federal access tariff 549 514 3 1,066 0 0 0 0
.2 Provided as unbundled network elements or other
contract arrangement 351 123 36 509 0 0 0 0
Total Line 304 900 637 39 1,576 0 0 0 0
305 Local private line & special access 1,346 714 55 2,115 0 0 0 0
306 Payphone compensation from toll carriers 1 2 * 3 22 40 1 63
307 Other local telecommunications service revenues 26 17 * 43 * * * *
308 Universal service support revenues received from 46 42 * 87 * * * * Federal or state sources Total fixed local service provided for resale 2,530 1,648 96 4,274 23 40 1 64
Mobile service (including wireless telephony, paging & messaging, and other mobile services)
309 Monthly, activation, and message charges except toll 13 4 0 17 0 0 0 0
Total mobile service provided for resale 13 4 0 17 0 0 0 0 Toll service 310 Operator and toll calls with alternative billing 3 1 * 3 1 1 * 1
arrangements (credit card, collect, international call-back, etc.)
311 Ordinary long distance (direct dialed MTS, customer 382 602 154 1,139 * * 0 *
toll-free 8xx service, "10-10 calls", associated monthly account maintenance, PICC pass-through, and other switched services not reported above)
312 Long distance private line services 288 540 24 852 0 0 0 0
313 Satellite services 1 184 * 185 0 0 0 0
314 All other long distance services 7 6 * 12 * * 0 *
Total toll service provided for resale 680 1,332 179 2,191 1 1 * 1
315 Total service provided for resale (carrier's carrier) $3,224 $2,983 $274 $6,481 $23 $41 $1 $65
Note: Amounts may not add to totals due to rounding. * Denotes values greater than $0 but less than $500,000. 1/ Includes a proportionate share of amounts reported on Line 403 as surcharges or other amounts on bills identified as recovering state or federal universal service
contributions.
U.S. Federal Communications Commission Telecommunications Industry Revenues: 2009 16
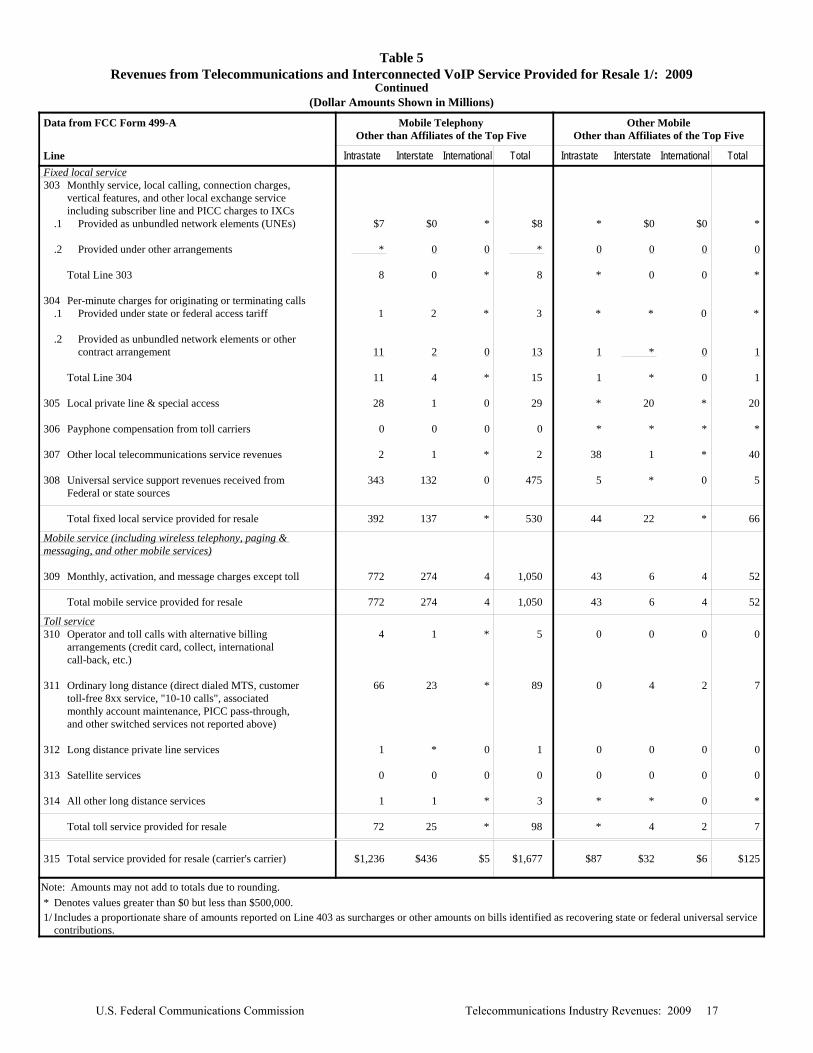
Table 5Revenues from Telecommunications and Interconnected VoIP Service Provided for Resale 1/: 2009
Continued(Dollar Amounts Shown in Millions)
Data from FCC Form 499-A Mobile Telephony Other MobileOther than Affiliates of the Top Five Other than Affiliates of the Top Five
Line Intrastate Interstate International Total Intrastate Interstate International Total Fixed local service 303 Monthly service, local calling, connection charges,
vertical features, and other local exchange service including subscriber line and PICC charges to IXCs
.1 Provided as unbundled network elements (UNEs) $7 $0 * $8 * $0 $0 *
.2 Provided under other arrangements * 0 0 * 0 0 0 0
Total Line 303 8 0 * 8 * 0 0 *
304 Per-minute charges for originating or terminating calls .1 Provided under state or federal access tariff 1 2 * 3 * * 0 *
.2 Provided as unbundled network elements or other
contract arrangement 11 2 0 13 1 * 0 1
Total Line 304 11 4 * 15 1 * 0 1
305 Local private line & special access 28 1 0 29 * 20 * 20
306 Payphone compensation from toll carriers 0 0 0 0 * * * *
307 Other local telecommunications service revenues 2 1 * 2 38 1 * 40
308 Universal service support revenues received from 343 132 0 475 5 * 0 5Federal or state sources Total fixed local service provided for resale 392 137 * 530 44 22 * 66
Mobile service (including wireless telephony, paging & messaging, and other mobile services)
309 Monthly, activation, and message charges except toll 772 274 4 1,050 43 6 4 52
Total mobile service provided for resale 772 274 4 1,050 43 6 4 52 Toll service 310 Operator and toll calls with alternative billing 4 1 * 5 0 0 0 0
arrangements (credit card, collect, international call-back, etc.)
311 Ordinary long distance (direct dialed MTS, customer 66 23 * 89 0 4 2 7
toll-free 8xx service, "10-10 calls", associated monthly account maintenance, PICC pass-through, and other switched services not reported above)
312 Long distance private line services 1 * 0 1 0 0 0 0
313 Satellite services 0 0 0 0 0 0 0 0
314 All other long distance services 1 1 * 3 * * 0 *
Total toll service provided for resale 72 25 * 98 * 4 2 7
315 Total service provided for resale (carrier's carrier) $1,236 $436 $5 $1,677 $87 $32 $6 $125
Note: Amounts may not add to totals due to rounding. * Denotes values greater than $0 but less than $500,000. 1/ Includes a proportionate share of amounts reported on Line 403 as surcharges or other amounts on bills identified as recovering state or federal universal service
contributions.
U.S. Federal Communications Commission Telecommunications Industry Revenues: 2009 17
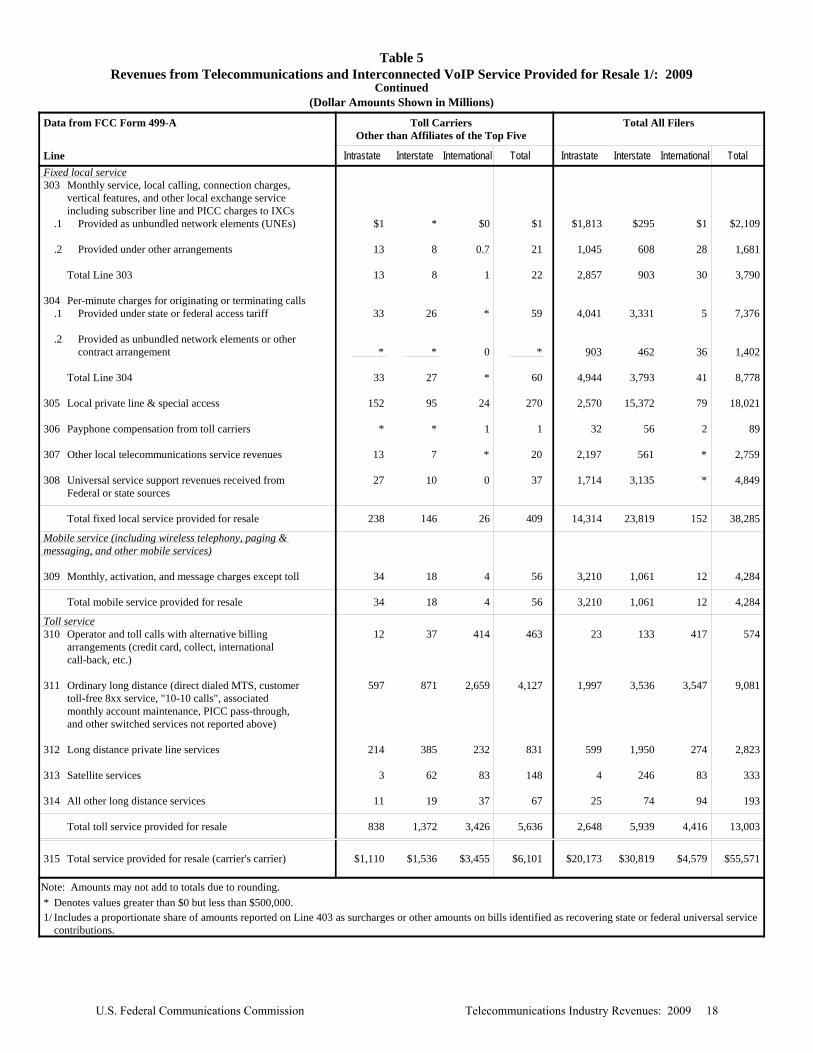
Table 5Revenues from Telecommunications and Interconnected VoIP Service Provided for Resale 1/: 2009
Continued(Dollar Amounts Shown in Millions)
Data from FCC Form 499-A Toll Carriers Total All FilersOther than Affiliates of the Top Five
Line Intrastate Interstate International Total Intrastate Interstate International Total Fixed local service 303 Monthly service, local calling, connection charges,
vertical features, and other local exchange service including subscriber line and PICC charges to IXCs
.1 Provided as unbundled network elements (UNEs) $1 * $0 $1 $1,813 $295 $1 $2,109
.2 Provided under other arrangements 13 8 0.7 21 1,045 608 28 1,681
Total Line 303 13 8 1 22 2,857 903 30 3,790
304 Per-minute charges for originating or terminating calls .1 Provided under state or federal access tariff 33 26 * 59 4,041 3,331 5 7,376
.2 Provided as unbundled network elements or other
contract arrangement * * 0 * 903 462 36 1,402
Total Line 304 33 27 * 60 4,944 3,793 41 8,778
305 Local private line & special access 152 95 24 270 2,570 15,372 79 18,021
306 Payphone compensation from toll carriers * * 1 1 32 56 2 89
307 Other local telecommunications service revenues 13 7 * 20 2,197 561 * 2,759
308 Universal service support revenues received from 27 10 0 37 1,714 3,135 * 4,849Federal or state sources Total fixed local service provided for resale 238 146 26 409 14,314 23,819 152 38,285
Mobile service (including wireless telephony, paging & messaging, and other mobile services)
309 Monthly, activation, and message charges except toll 34 18 4 56 3,210 1,061 12 4,284
Total mobile service provided for resale 34 18 4 56 3,210 1,061 12 4,284 Toll service 310 Operator and toll calls with alternative billing 12 37 414 463 23 133 417 574
arrangements (credit card, collect, international call-back, etc.)
311 Ordinary long distance (direct dialed MTS, customer 597 871 2,659 4,127 1,997 3,536 3,547 9,081
toll-free 8xx service, "10-10 calls", associated monthly account maintenance, PICC pass-through, and other switched services not reported above)
312 Long distance private line services 214 385 232 831 599 1,950 274 2,823
313 Satellite services 3 62 83 148 4 246 83 333
314 All other long distance services 11 19 37 67 25 74 94 193
Total toll service provided for resale 838 1,372 3,426 5,636 2,648 5,939 4,416 13,003
315 Total service provided for resale (carrier's carrier) $1,110 $1,536 $3,455 $6,101 $20,173 $30,819 $4,579 $55,571
Note: Amounts may not add to totals due to rounding. * Denotes values greater than $0 but less than $500,000. 1/ Includes a proportionate share of amounts reported on Line 403 as surcharges or other amounts on bills identified as recovering state or federal universal service
contributions.
U.S. Federal Communications Commission Telecommunications Industry Revenues: 2009 18
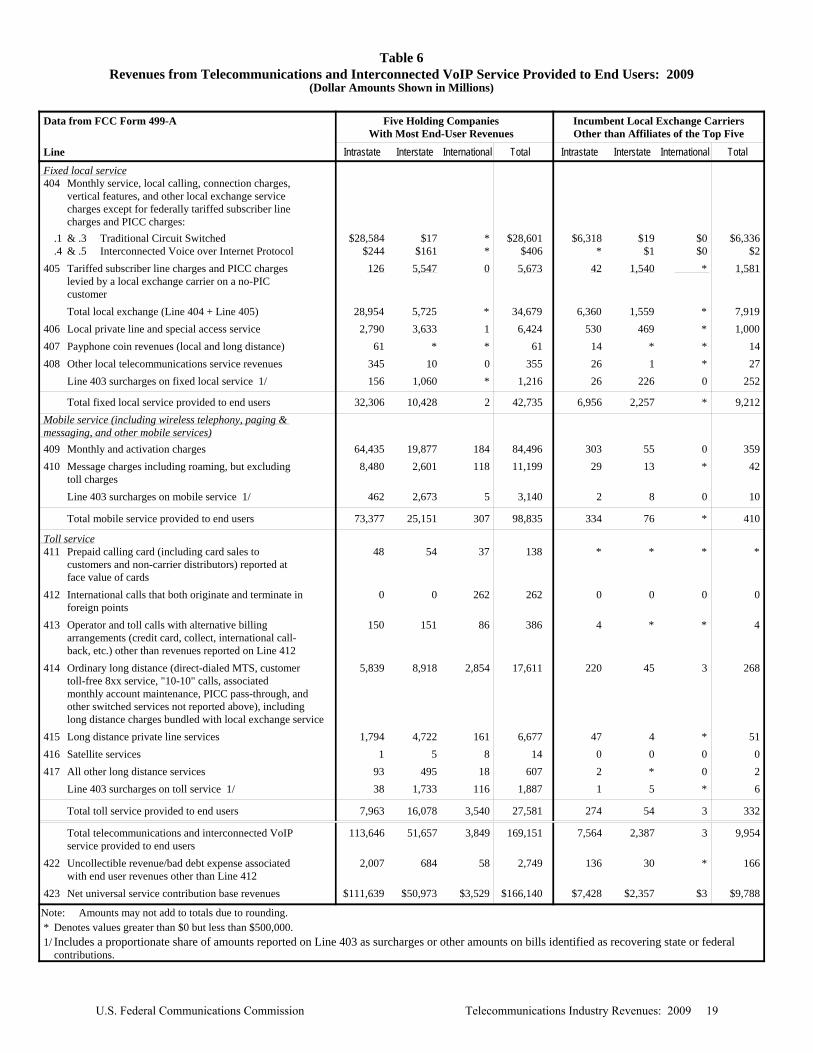
Table 6Revenues from Telecommunications and Interconnected VoIP Service Provided to End Users: 2009
(Dollar Amounts Shown in Millions)
Data from FCC Form 499-A Five Holding Companies Incumbent Local Exchange CarriersWith Most End-User Revenues Other than Affiliates of the Top Five
Line Intrastate Interstate International Total Intrastate Interstate International Total Fixed local service 404 Monthly service, local calling, connection charges,
vertical features, and other local exchange service charges except for federally tariffed subscriber line charges and PICC charges:
.1 & .3 Traditional Circuit Switched $28,584 $17 * $28,601 $6,318 $19 $0 $6,336
.4 & .5 Interconnected Voice over Internet Protocol $244 $161 * $406 * $1 $0 $2 405 Tariffed subscriber line charges and PICC charges 126 5,547 0 5,673 42 1,540 * 1,581
levied by a local exchange carrier on a no-PIC customer Total local exchange (Line 404 + Line 405) 28,954 5,725 * 34,679 6,360 1,559 * 7,919
406 Local private line and special access service 2,790 3,633 1 6,424 530 469 * 1,000 407 Payphone coin revenues (local and long distance) 61 * * 61 14 * * 14 408 Other local telecommunications service revenues 345 10 0 355 26 1 * 27
Line 403 surcharges on fixed local service 1/ 156 1,060 * 1,216 26 226 0 252 Total fixed local service provided to end users 32,306 10,428 2 42,735 6,956 2,257 * 9,212
Mobile service (including wireless telephony, paging & messaging, and other mobile services) 409 Monthly and activation charges 64,435 19,877 184 84,496 303 55 0 359 410 Message charges including roaming, but excluding 8,480 2,601 118 11,199 29 13 * 42
toll charges Line 403 surcharges on mobile service 1/ 462 2,673 5 3,140 2 8 0 10 Total mobile service provided to end users 73,377 25,151 307 98,835 334 76 * 410
Toll service 411 Prepaid calling card (including card sales to 48 54 37 138 * * * *
customers and non-carrier distributors) reported at face value of cards
412 International calls that both originate and terminate in 0 0 262 262 0 0 0 0foreign points
413 Operator and toll calls with alternative billing 150 151 86 386 4 * * 4arrangements (credit card, collect, international call- back, etc.) other than revenues reported on Line 412
414 Ordinary long distance (direct-dialed MTS, customer 5,839 8,918 2,854 17,611 220 45 3 268toll-free 8xx service, "10-10" calls, associated monthly account maintenance, PICC pass-through, and other switched services not reported above), including long distance charges bundled with local exchange service
415 Long distance private line services 1,794 4,722 161 6,677 47 4 * 51 416 Satellite services 1 5 8 14 0 0 0 0 417 All other long distance services 93 495 18 607 2 * 0 2
Line 403 surcharges on toll service 1/ 38 1,733 116 1,887 1 5 * 6 Total toll service provided to end users 7,963 16,078 3,540 27,581 274 54 3 332 Total telecommunications and interconnected VoIP 113,646 51,657 3,849 169,151 7,564 2,387 3 9,954service provided to end users
422 Uncollectible revenue/bad debt expense associated 2,007 684 58 2,749 136 30 * 166with end user revenues other than Line 412
423 Net universal service contribution base revenues $111,639 $50,973 $3,529 $166,140 $7,428 $2,357 $3 $9,788 Note: Amounts may not add to totals due to rounding. * Denotes values greater than $0 but less than $500,000. 1/ Includes a proportionate share of amounts reported on Line 403 as surcharges or other amounts on bills identified as recovering state or federal
contributions.
U.S. Federal Communications Commission Telecommunications Industry Revenues: 2009 19
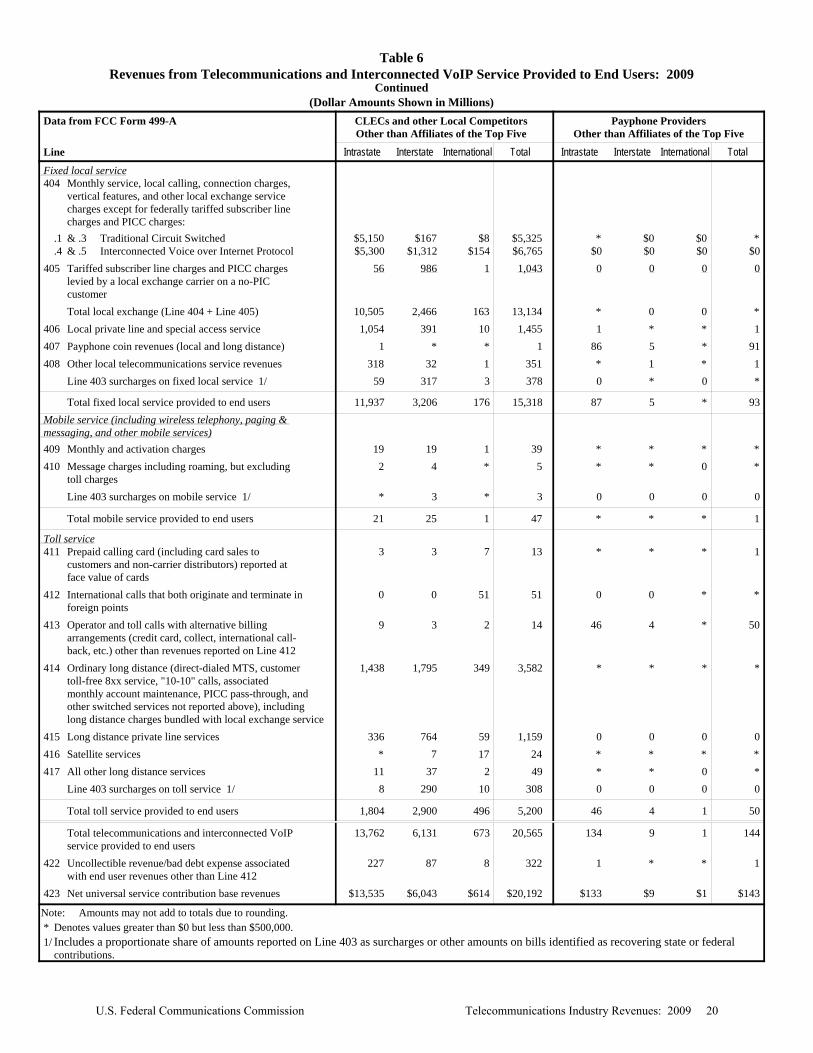
Table 6Revenues from Telecommunications and Interconnected VoIP Service Provided to End Users: 2009
Continued(Dollar Amounts Shown in Millions)
Data from FCC Form 499-A CLECs and other Local Competitors Payphone ProvidersOther than Affiliates of the Top Five Other than Affiliates of the Top Five
Line Intrastate Interstate International Total Intrastate Interstate International Total Fixed local service 404 Monthly service, local calling, connection charges,
vertical features, and other local exchange service charges except for federally tariffed subscriber line charges and PICC charges:
.1 & .3 Traditional Circuit Switched $5,150 $167 $8 $5,325 * $0 $0 *
.4 & .5 Interconnected Voice over Internet Protocol $5,300 $1,312 $154 $6,765 $0 $0 $0 $0 405 Tariffed subscriber line charges and PICC charges 56 986 1 1,043 0 0 0 0
levied by a local exchange carrier on a no-PIC customer Total local exchange (Line 404 + Line 405) 10,505 2,466 163 13,134 * 0 0 *
406 Local private line and special access service 1,054 391 10 1,455 1 * * 1 407 Payphone coin revenues (local and long distance) 1 * * 1 86 5 * 91 408 Other local telecommunications service revenues 318 32 1 351 * 1 * 1
Line 403 surcharges on fixed local service 1/ 59 317 3 378 0 * 0 * Total fixed local service provided to end users 11,937 3,206 176 15,318 87 5 * 93
Mobile service (including wireless telephony, paging & messaging, and other mobile services) 409 Monthly and activation charges 19 19 1 39 * * * * 410 Message charges including roaming, but excluding 2 4 * 5 * * 0 *
toll charges Line 403 surcharges on mobile service 1/ * 3 * 3 0 0 0 0 Total mobile service provided to end users 21 25 1 47 * * * 1
Toll service 411 Prepaid calling card (including card sales to 3 3 7 13 * * * 1
customers and non-carrier distributors) reported at face value of cards
412 International calls that both originate and terminate in 0 0 51 51 0 0 * * foreign points
413 Operator and toll calls with alternative billing 9 3 2 14 46 4 * 50arrangements (credit card, collect, international call- back, etc.) other than revenues reported on Line 412
414 Ordinary long distance (direct-dialed MTS, customer 1,438 1,795 349 3,582 * * * * toll-free 8xx service, "10-10" calls, associated monthly account maintenance, PICC pass-through, and other switched services not reported above), including long distance charges bundled with local exchange service
415 Long distance private line services 336 764 59 1,159 0 0 0 0 416 Satellite services * 7 17 24 * * * * 417 All other long distance services 11 37 2 49 * * 0 *
Line 403 surcharges on toll service 1/ 8 290 10 308 0 0 0 0 Total toll service provided to end users 1,804 2,900 496 5,200 46 4 1 50 Total telecommunications and interconnected VoIP 13,762 6,131 673 20,565 134 9 1 144service provided to end users
422 Uncollectible revenue/bad debt expense associated 227 87 8 322 1 * * 1with end user revenues other than Line 412
423 Net universal service contribution base revenues $13,535 $6,043 $614 $20,192 $133 $9 $1 $143 Note: Amounts may not add to totals due to rounding. * Denotes values greater than $0 but less than $500,000. 1/ Includes a proportionate share of amounts reported on Line 403 as surcharges or other amounts on bills identified as recovering state or federal
contributions.
U.S. Federal Communications Commission Telecommunications Industry Revenues: 2009 20

Table 6Revenues from Telecommunications and Interconnected VoIP Service Provided to End Users: 2009
Continued(Dollar Amounts Shown in Millions)
Data from FCC Form 499-A Mobile Telephony Other MobileOther than Affiliates of the Top Five Other than Affiliates of the Top Five
Line Intrastate Interstate International Total Intrastate Interstate International Total Fixed local service 404 Monthly service, local calling, connection charges,
vertical features, and other local exchange service charges except for federally tariffed subscriber line charges and PICC charges:
.1 & .3 Traditional Circuit Switched $9 * $0 $9 $11 * $0 $11
.4 & .5 Interconnected Voice over Internet Protocol $8 $1 $0 $10 $3 $1 * $4 405 Tariffed subscriber line charges and PICC charges 0 7 0 7 0 0 0 0
levied by a local exchange carrier on a no-PIC customer Total local exchange (Line 404 + Line 405) 17 9 0 26 13 1 * 14
406 Local private line and special access service 21 1 0 22 20 2 0 21 407 Payphone coin revenues (local and long distance) 0 0 0 0 * * * * 408 Other local telecommunications service revenues 2 * 0 2 13 * * 13
Line 403 surcharges on fixed local service 1/ * 1 0 2 * * 0 * Total fixed local service provided to end users 40 12 0 52 46 3 * 49
Mobile service (including wireless telephony, paging & messaging, and other mobile services) 409 Monthly and activation charges 8,779 2,583 15 11,377 334 40 * 374 410 Message charges including roaming, but excluding 1,706 400 17 2,123 9 1 1 11
toll charges Line 403 surcharges on mobile service 1/ 43 310 * 354 1 4 0 5 Total mobile service provided to end users 10,528 3,293 32 13,853 344 45 1 390
Toll service 411 Prepaid calling card (including card sales to 7 4 5 15 * * * *
customers and non-carrier distributors) reported at face value of cards
412 International calls that both originate and terminate in 0 0 6 6 0 0 0 0foreign points
413 Operator and toll calls with alternative billing 6 * 1 7 0 0 * * arrangements (credit card, collect, international call- back, etc.) other than revenues reported on Line 412
414 Ordinary long distance (direct-dialed MTS, customer 80 45 86 211 6 3 4 13toll-free 8xx service, "10-10" calls, associated monthly account maintenance, PICC pass-through, and other switched services not reported above), including long distance charges bundled with local exchange service
415 Long distance private line services * * * 1 1 3 0 4 416 Satellite services * * 0 * * * * * 417 All other long distance services * 4 2 7 * * 0 *
Line 403 surcharges on toll service 1/ * 6 1 7 * * * * Total toll service provided to end users 93 59 101 253 7 7 4 18 Total telecommunications and interconnected VoIP 10,661 3,364 134 14,159 397 55 5 457service provided to end users
422 Uncollectible revenue/bad debt expense associated 553 134 2 689 4 * * 4with end user revenues other than Line 412
423 Net universal service contribution base revenues $10,108 $3,230 $125 $13,464 $394 $54 $5 $453 Note: Amounts may not add to totals due to rounding. * Denotes values greater than $0 but less than $500,000. 1/ Includes a proportionate share of amounts reported on Line 403 as surcharges or other amounts on bills identified as recovering state or federal
contributions.
U.S. Federal Communications Commission Telecommunications Industry Revenues: 2009 21
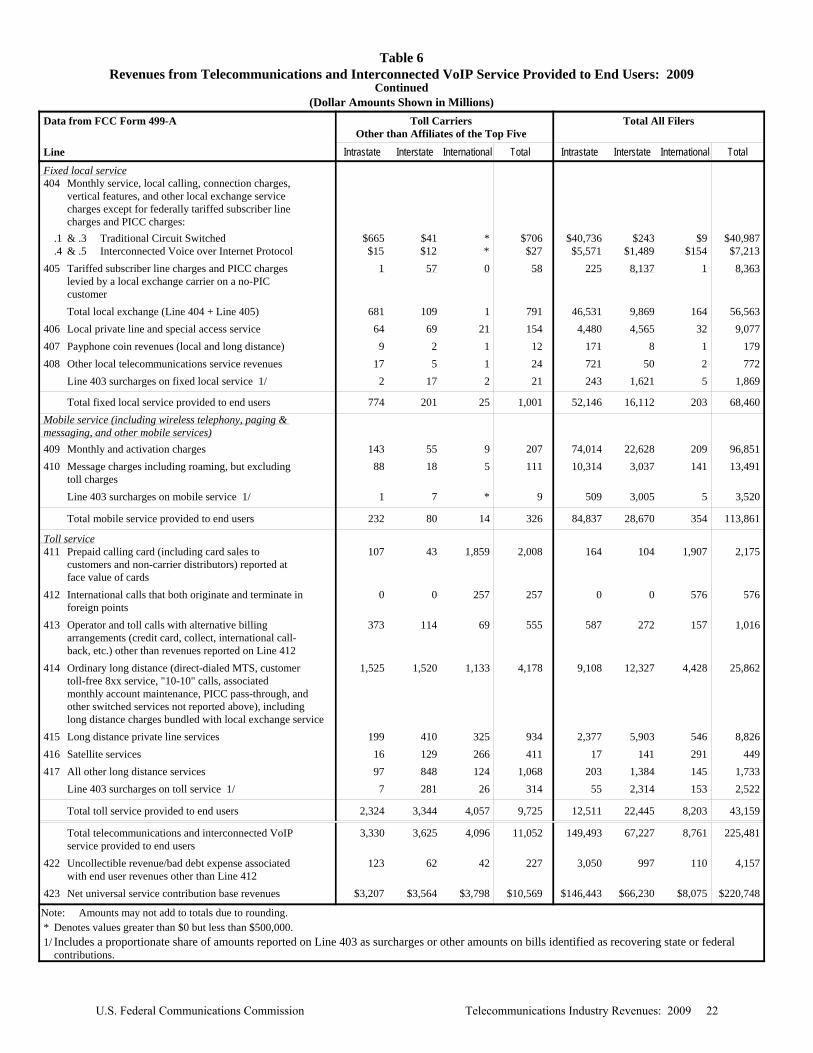
Table 6Revenues from Telecommunications and Interconnected VoIP Service Provided to End Users: 2009
Continued(Dollar Amounts Shown in Millions)
Data from FCC Form 499-A Toll Carriers Total All FilersOther than Affiliates of the Top Five
Line Intrastate Interstate International Total Intrastate Interstate International Total Fixed local service 404 Monthly service, local calling, connection charges,
vertical features, and other local exchange service charges except for federally tariffed subscriber line charges and PICC charges:
.1 & .3 Traditional Circuit Switched $665 $41 * $706 $40,736 $243 $9 $40,987
.4 & .5 Interconnected Voice over Internet Protocol $15 $12 * $27 $5,571 $1,489 $154 $7,213 405 Tariffed subscriber line charges and PICC charges 1 57 0 58 225 8,137 1 8,363
levied by a local exchange carrier on a no-PIC customer Total local exchange (Line 404 + Line 405) 681 109 1 791 46,531 9,869 164 56,563
406 Local private line and special access service 64 69 21 154 4,480 4,565 32 9,077 407 Payphone coin revenues (local and long distance) 9 2 1 12 171 8 1 179 408 Other local telecommunications service revenues 17 5 1 24 721 50 2 772
Line 403 surcharges on fixed local service 1/ 2 17 2 21 243 1,621 5 1,869 Total fixed local service provided to end users 774 201 25 1,001 52,146 16,112 203 68,460
Mobile service (including wireless telephony, paging & messaging, and other mobile services) 409 Monthly and activation charges 143 55 9 207 74,014 22,628 209 96,851 410 Message charges including roaming, but excluding 88 18 5 111 10,314 3,037 141 13,491
toll charges Line 403 surcharges on mobile service 1/ 1 7 * 9 509 3,005 5 3,520 Total mobile service provided to end users 232 80 14 326 84,837 28,670 354 113,861
Toll service 411 Prepaid calling card (including card sales to 107 43 1,859 2,008 164 104 1,907 2,175
customers and non-carrier distributors) reported at face value of cards
412 International calls that both originate and terminate in 0 0 257 257 0 0 576 576foreign points
413 Operator and toll calls with alternative billing 373 114 69 555 587 272 157 1,016arrangements (credit card, collect, international call- back, etc.) other than revenues reported on Line 412
414 Ordinary long distance (direct-dialed MTS, customer 1,525 1,520 1,133 4,178 9,108 12,327 4,428 25,862toll-free 8xx service, "10-10" calls, associated monthly account maintenance, PICC pass-through, and other switched services not reported above), including long distance charges bundled with local exchange service
415 Long distance private line services 199 410 325 934 2,377 5,903 546 8,826 416 Satellite services 16 129 266 411 17 141 291 449 417 All other long distance services 97 848 124 1,068 203 1,384 145 1,733
Line 403 surcharges on toll service 1/ 7 281 26 314 55 2,314 153 2,522 Total toll service provided to end users 2,324 3,344 4,057 9,725 12,511 22,445 8,203 43,159 Total telecommunications and interconnected VoIP 3,330 3,625 4,096 11,052 149,493 67,227 8,761 225,481service provided to end users
422 Uncollectible revenue/bad debt expense associated 123 62 42 227 3,050 997 110 4,157with end user revenues other than Line 412
423 Net universal service contribution base revenues $3,207 $3,564 $3,798 $10,569 $146,443 $66,230 $8,075 $220,748 Note: Amounts may not add to totals due to rounding. * Denotes values greater than $0 but less than $500,000. 1/ Includes a proportionate share of amounts reported on Line 403 as surcharges or other amounts on bills identified as recovering state or federal
contributions.
U.S. Federal Communications Commission Telecommunications Industry Revenues: 2009 22
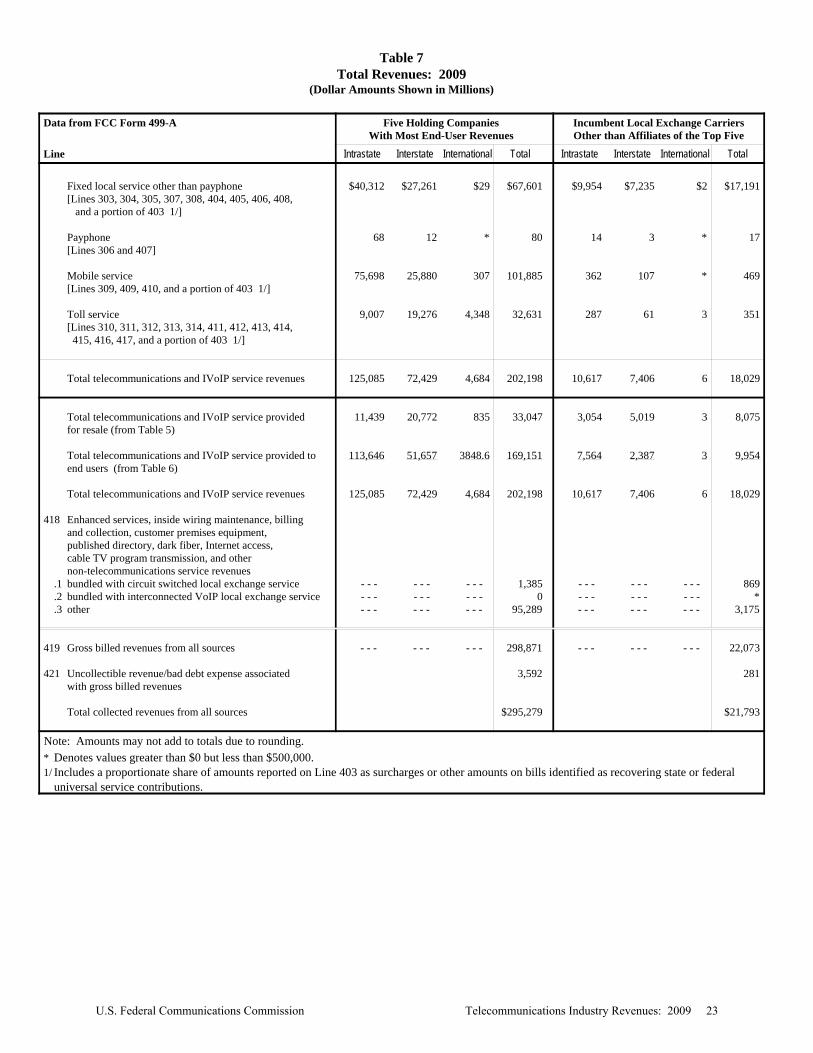
Table 7Total Revenues: 2009
(Dollar Amounts Shown in Millions)
Data from FCC Form 499-A Five Holding Companies Incumbent Local Exchange CarriersWith Most End-User Revenues Other than Affiliates of the Top Five
Line Intrastate Interstate International Total Intrastate Interstate International Total
Fixed local service other than payphone $40,312 $27,261 $29 $67,601 $9,954 $7,235 $2 $17,191[Lines 303, 304, 305, 307, 308, 404, 405, 406, 408, and a portion of 403 1/]
Payphone 68 12 * 80 14 3 * 17[Lines 306 and 407]
Mobile service 75,698 25,880 307 101,885 362 107 * 469[Lines 309, 409, 410, and a portion of 403 1/]
Toll service 9,007 19,276 4,348 32,631 287 61 3 351[Lines 310, 311, 312, 313, 314, 411, 412, 413, 414, 415, 416, 417, and a portion of 403 1/]
Total telecommunications and IVoIP service revenues 125,085 72,429 4,684 202,198 10,617 7,406 6 18,029
Total telecommunications and IVoIP service provided 11,439 20,772 835 33,047 3,054 5,019 3 8,075for resale (from Table 5)
Total telecommunications and IVoIP service provided to 113,646 51,657 3848.6 169,151 7,564 2,387 3 9,954end users (from Table 6)
Total telecommunications and IVoIP service revenues 125,085 72,429 4,684 202,198 10,617 7,406 6 18,029
418 Enhanced services, inside wiring maintenance, billing
and collection, customer premises equipment, published directory, dark fiber, Internet access, cable TV program transmission, and other non-telecommunications service revenues
.1 bundled with circuit switched local exchange service - - - - - - - - - 1,385 - - - - - - - - - 869
.2 bundled with interconnected VoIP local exchange service - - - - - - - - - 0 - - - - - - - - - *
.3 other - - - - - - - - - 95,289 - - - - - - - - - 3,175
419 Gross billed revenues from all sources - - - - - - - - - 298,871 - - - - - - - - - 22,073
421 Uncollectible revenue/bad debt expense associated 3,592 281with gross billed revenues
Total collected revenues from all sources $295,279 $21,793
Note: Amounts may not add to totals due to rounding. * Denotes values greater than $0 but less than $500,000. 1/ Includes a proportionate share of amounts reported on Line 403 as surcharges or other amounts on bills identified as recovering state or federal
universal service contributions.
U.S. Federal Communications Commission Telecommunications Industry Revenues: 2009 23
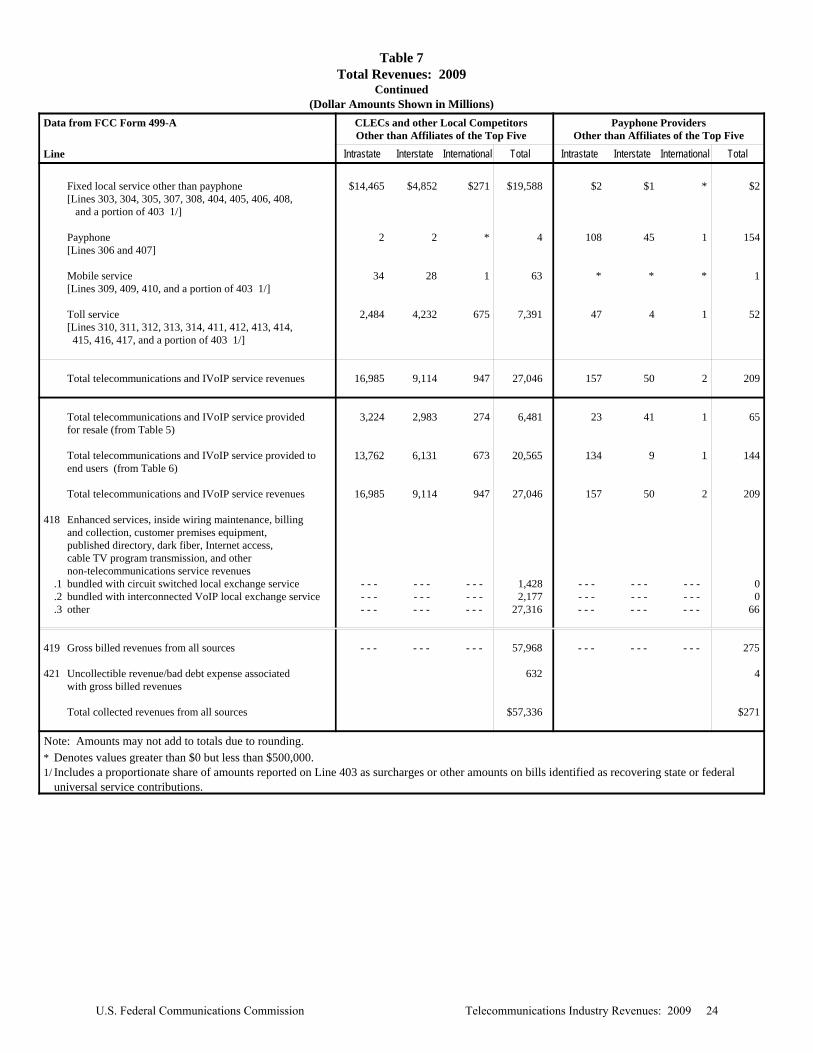
Table 7Total Revenues: 2009
Continued(Dollar Amounts Shown in Millions)
Data from FCC Form 499-A CLECs and other Local Competitors Payphone ProvidersOther than Affiliates of the Top Five Other than Affiliates of the Top Five
Line Intrastate Interstate International Total Intrastate Interstate International Total
Fixed local service other than payphone $14,465 $4,852 $271 $19,588 $2 $1 * $2[Lines 303, 304, 305, 307, 308, 404, 405, 406, 408, and a portion of 403 1/]
Payphone 2 2 * 4 108 45 1 154[Lines 306 and 407]
Mobile service 34 28 1 63 * * * 1[Lines 309, 409, 410, and a portion of 403 1/]
Toll service 2,484 4,232 675 7,391 47 4 1 52[Lines 310, 311, 312, 313, 314, 411, 412, 413, 414, 415, 416, 417, and a portion of 403 1/]
Total telecommunications and IVoIP service revenues 16,985 9,114 947 27,046 157 50 2 209
Total telecommunications and IVoIP service provided 3,224 2,983 274 6,481 23 41 1 65for resale (from Table 5)
Total telecommunications and IVoIP service provided to 13,762 6,131 673 20,565 134 9 1 144end users (from Table 6)
Total telecommunications and IVoIP service revenues 16,985 9,114 947 27,046 157 50 2 209
418 Enhanced services, inside wiring maintenance, billing
and collection, customer premises equipment, published directory, dark fiber, Internet access, cable TV program transmission, and other non-telecommunications service revenues
.1 bundled with circuit switched local exchange service - - - - - - - - - 1,428 - - - - - - - - - 0
.2 bundled with interconnected VoIP local exchange service - - - - - - - - - 2,177 - - - - - - - - - 0
.3 other - - - - - - - - - 27,316 - - - - - - - - - 66
419 Gross billed revenues from all sources - - - - - - - - - 57,968 - - - - - - - - - 275
421 Uncollectible revenue/bad debt expense associated 632 4with gross billed revenues
Total collected revenues from all sources $57,336 $271
Note: Amounts may not add to totals due to rounding. * Denotes values greater than $0 but less than $500,000. 1/ Includes a proportionate share of amounts reported on Line 403 as surcharges or other amounts on bills identified as recovering state or federal
universal service contributions.
U.S. Federal Communications Commission Telecommunications Industry Revenues: 2009 24
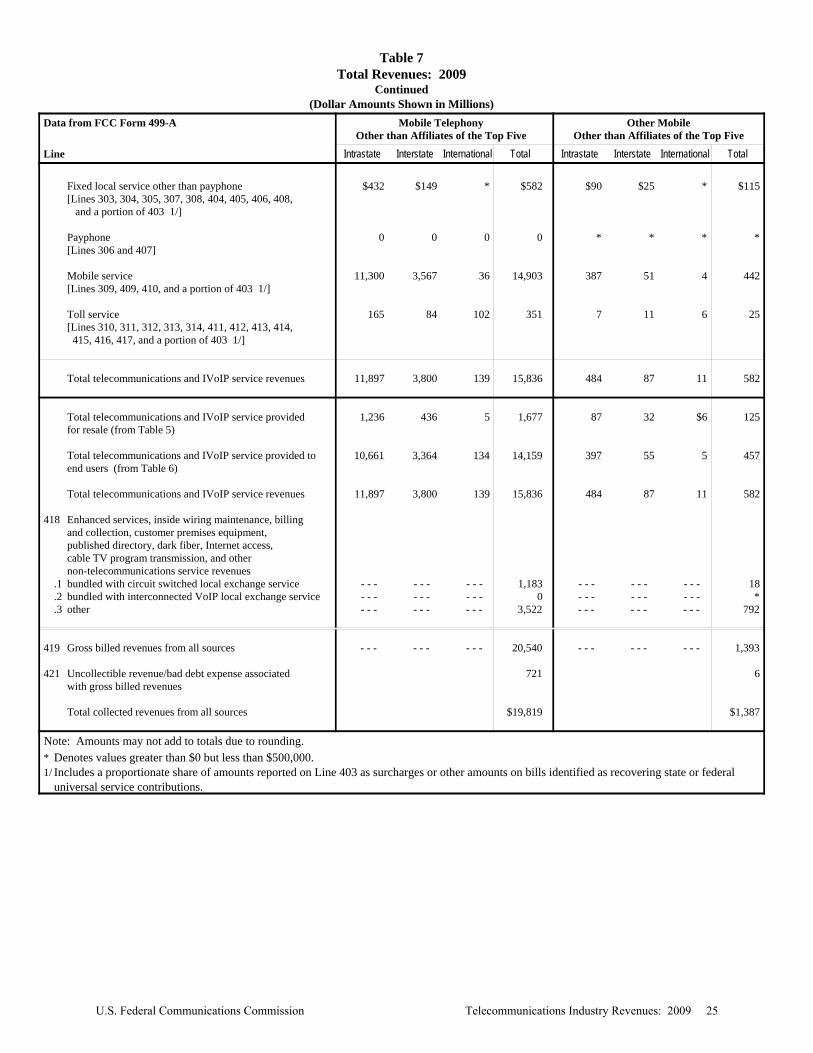
Table 7Total Revenues: 2009
Continued(Dollar Amounts Shown in Millions)
Data from FCC Form 499-A Mobile Telephony Other MobileOther than Affiliates of the Top Five Other than Affiliates of the Top Five
Line Intrastate Interstate International Total Intrastate Interstate International Total
Fixed local service other than payphone $432 $149 * $582 $90 $25 * $115[Lines 303, 304, 305, 307, 308, 404, 405, 406, 408, and a portion of 403 1/]
Payphone 0 0 0 0 * * * * [Lines 306 and 407]
Mobile service 11,300 3,567 36 14,903 387 51 4 442[Lines 309, 409, 410, and a portion of 403 1/]
Toll service 165 84 102 351 7 11 6 25[Lines 310, 311, 312, 313, 314, 411, 412, 413, 414, 415, 416, 417, and a portion of 403 1/]
Total telecommunications and IVoIP service revenues 11,897 3,800 139 15,836 484 87 11 582
Total telecommunications and IVoIP service provided 1,236 436 5 1,677 87 32 $6 125for resale (from Table 5)
Total telecommunications and IVoIP service provided to 10,661 3,364 134 14,159 397 55 5 457end users (from Table 6)
Total telecommunications and IVoIP service revenues 11,897 3,800 139 15,836 484 87 11 582
418 Enhanced services, inside wiring maintenance, billing
and collection, customer premises equipment, published directory, dark fiber, Internet access, cable TV program transmission, and other non-telecommunications service revenues
.1 bundled with circuit switched local exchange service - - - - - - - - - 1,183 - - - - - - - - - 18
.2 bundled with interconnected VoIP local exchange service - - - - - - - - - 0 - - - - - - - - - *
.3 other - - - - - - - - - 3,522 - - - - - - - - - 792
419 Gross billed revenues from all sources - - - - - - - - - 20,540 - - - - - - - - - 1,393
421 Uncollectible revenue/bad debt expense associated 721 6with gross billed revenues
Total collected revenues from all sources $19,819 $1,387
Note: Amounts may not add to totals due to rounding. * Denotes values greater than $0 but less than $500,000. 1/ Includes a proportionate share of amounts reported on Line 403 as surcharges or other amounts on bills identified as recovering state or federal
universal service contributions.
U.S. Federal Communications Commission Telecommunications Industry Revenues: 2009 25
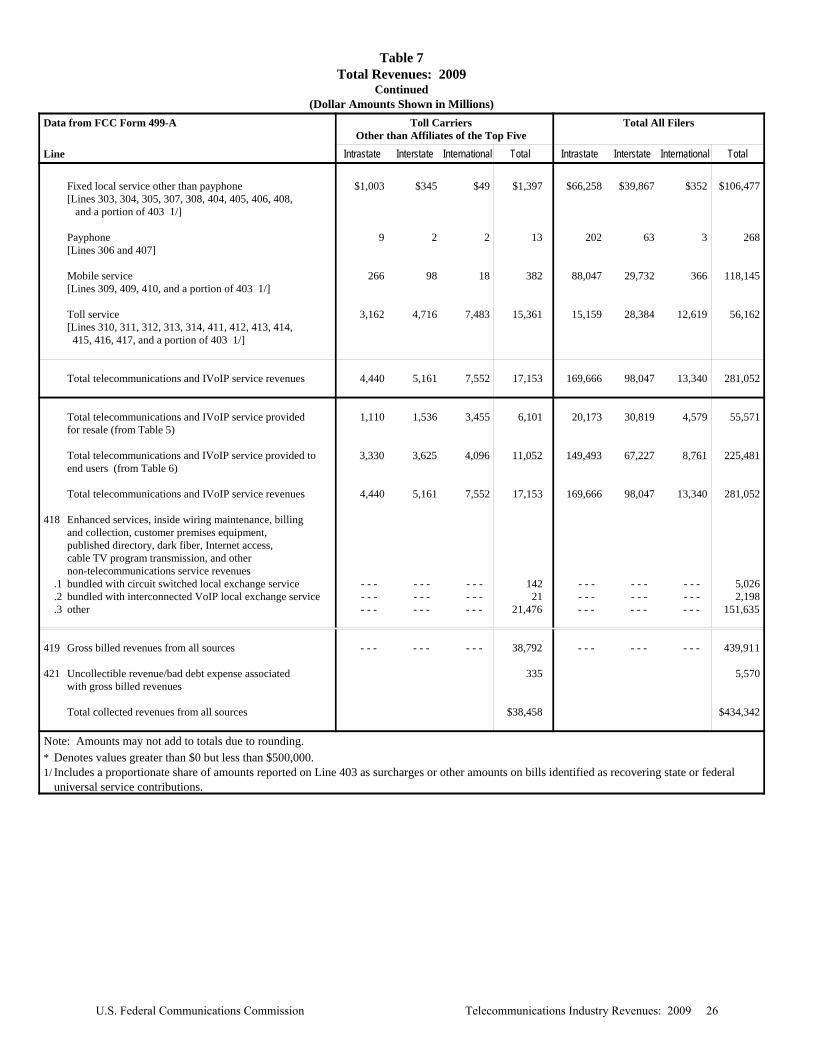
Table 7Total Revenues: 2009
Continued(Dollar Amounts Shown in Millions)
Data from FCC Form 499-A Toll Carriers Total All FilersOther than Affiliates of the Top Five
Line Intrastate Interstate International Total Intrastate Interstate International Total
Fixed local service other than payphone $1,003 $345 $49 $1,397 $66,258 $39,867 $352 $106,477[Lines 303, 304, 305, 307, 308, 404, 405, 406, 408, and a portion of 403 1/]
Payphone 9 2 2 13 202 63 3 268[Lines 306 and 407]
Mobile service 266 98 18 382 88,047 29,732 366 118,145[Lines 309, 409, 410, and a portion of 403 1/]
Toll service 3,162 4,716 7,483 15,361 15,159 28,384 12,619 56,162[Lines 310, 311, 312, 313, 314, 411, 412, 413, 414, 415, 416, 417, and a portion of 403 1/]
Total telecommunications and IVoIP service revenues 4,440 5,161 7,552 17,153 169,666 98,047 13,340 281,052
Total telecommunications and IVoIP service provided 1,110 1,536 3,455 6,101 20,173 30,819 4,579 55,571for resale (from Table 5)
Total telecommunications and IVoIP service provided to 3,330 3,625 4,096 11,052 149,493 67,227 8,761 225,481end users (from Table 6)
Total telecommunications and IVoIP service revenues 4,440 5,161 7,552 17,153 169,666 98,047 13,340 281,052
418 Enhanced services, inside wiring maintenance, billing
and collection, customer premises equipment, published directory, dark fiber, Internet access, cable TV program transmission, and other non-telecommunications service revenues
.1 bundled with circuit switched local exchange service - - - - - - - - - 142 - - - - - - - - - 5,026
.2 bundled with interconnected VoIP local exchange service - - - - - - - - - 21 - - - - - - - - - 2,198
.3 other - - - - - - - - - 21,476 - - - - - - - - - 151,635
419 Gross billed revenues from all sources - - - - - - - - - 38,792 - - - - - - - - - 439,911
421 Uncollectible revenue/bad debt expense associated 335 5,570with gross billed revenues
Total collected revenues from all sources $38,458 $434,342
Note: Amounts may not add to totals due to rounding. * Denotes values greater than $0 but less than $500,000. 1/ Includes a proportionate share of amounts reported on Line 403 as surcharges or other amounts on bills identified as recovering state or federal
universal service contributions.
U.S. Federal Communications Commission Telecommunications Industry Revenues: 2009 26
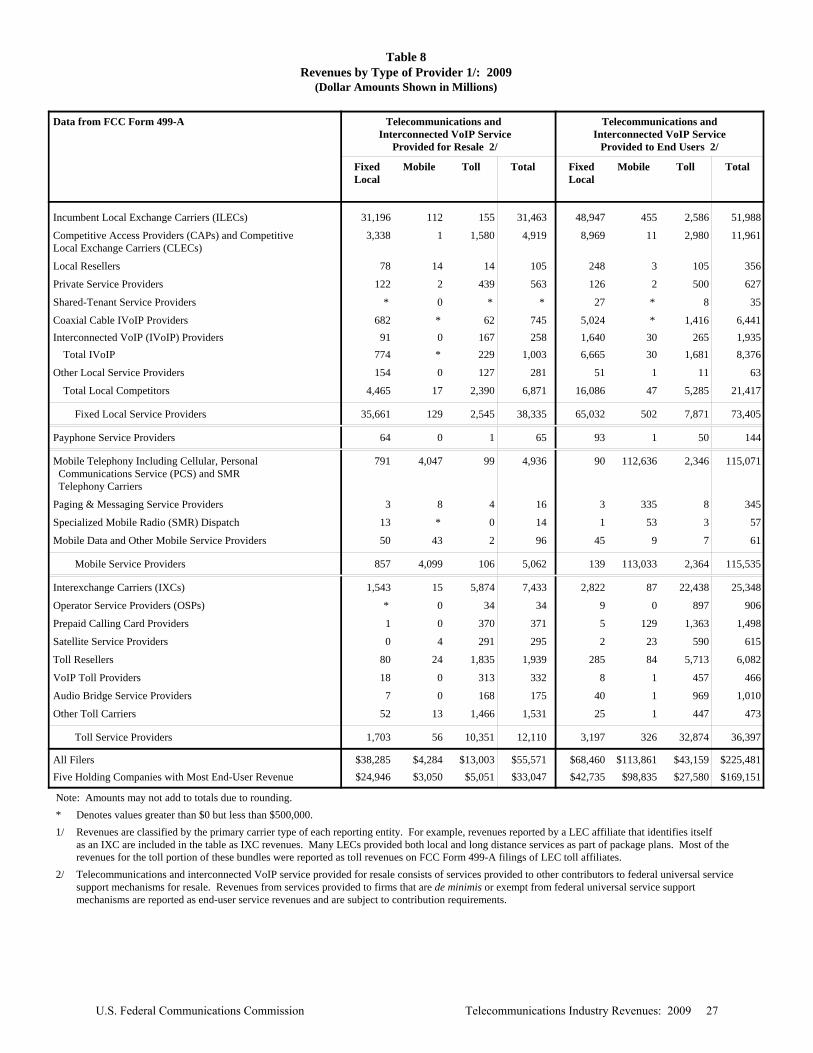
Table 8Revenues by Type of Provider 1/: 2009
(Dollar Amounts Shown in Millions)
Data from FCC Form 499-A Telecommunications and Telecommunications andInterconnected VoIP Service Interconnected VoIP Service
Provided for Resale 2/ Provided to End Users 2/
Fixed Mobile Toll Total Fixed Mobile Toll TotalLocal Local
Incumbent Local Exchange Carriers (ILECs) 31,196 112 155 31,463 48,947 455 2,586 51,988
Competitive Access Providers (CAPs) and Competitive 3,338 1 1,580 4,919 8,969 11 2,980 11,961 Local Exchange Carriers (CLECs)
Local Resellers 78 14 14 105 248 3 105 356
Private Service Providers 122 2 439 563 126 2 500 627
Shared-Tenant Service Providers * 0 * * 27 * 8 35
Coaxial Cable IVoIP Providers 682 * 62 745 5,024 * 1,416 6,441 Interconnected VoIP (IVoIP) Providers 91 0 167 258 1,640 30 265 1,935 Total IVoIP 774 * 229 1,003 6,665 30 1,681 8,376
Other Local Service Providers 154 0 127 281 51 1 11 63
Total Local Competitors 4,465 17 2,390 6,871 16,086 47 5,285 21,417
Fixed Local Service Providers 35,661 129 2,545 38,335 65,032 502 7,871 73,405
Payphone Service Providers 64 0 1 65 93 1 50 144
Mobile Telephony Including Cellular, Personal 791 4,047 99 4,936 90 112,636 2,346 115,071 Communications Service (PCS) and SMR Telephony Carriers
Paging & Messaging Service Providers 3 8 4 16 3 335 8 345
Specialized Mobile Radio (SMR) Dispatch 13 * 0 14 1 53 3 57
Mobile Data and Other Mobile Service Providers 50 43 2 96 45 9 7 61
Mobile Service Providers 857 4,099 106 5,062 139 113,033 2,364 115,535
Interexchange Carriers (IXCs) 1,543 15 5,874 7,433 2,822 87 22,438 25,348
Operator Service Providers (OSPs) * 0 34 34 9 0 897 906
Prepaid Calling Card Providers 1 0 370 371 5 129 1,363 1,498
Satellite Service Providers 0 4 291 295 2 23 590 615
Toll Resellers 80 24 1,835 1,939 285 84 5,713 6,082
VoIP Toll Providers 18 0 313 332 8 1 457 466
Audio Bridge Service Providers 7 0 168 175 40 1 969 1,010
Other Toll Carriers 52 13 1,466 1,531 25 1 447 473
Toll Service Providers 1,703 56 10,351 12,110 3,197 326 32,874 36,397
All Filers $38,285 $4,284 $13,003 $55,571 $68,460 $113,861 $43,159 $225,481 Five Holding Companies with Most End-User Revenue $24,946 $3,050 $5,051 $33,047 $42,735 $98,835 $27,580 $169,151
Note: Amounts may not add to totals due to rounding. * Denotes values greater than $0 but less than $500,000. 1/ Revenues are classified by the primary carrier type of each reporting entity. For example, revenues reported by a LEC affiliate that identifies itself
as an IXC are included in the table as IXC revenues. Many LECs provided both local and long distance services as part of package plans. Most of the revenues for the toll portion of these bundles were reported as toll revenues on FCC Form 499-A filings of LEC toll affiliates.
2/ Telecommunications and interconnected VoIP service provided for resale consists of services provided to other contributors to federal universal service support mechanisms for resale. Revenues from services provided to firms that are de minimis or exempt from federal universal service support mechanisms are reported as end-user service revenues and are subject to contribution requirements.
U.S. Federal Communications Commission Telecommunications Industry Revenues: 2009 27
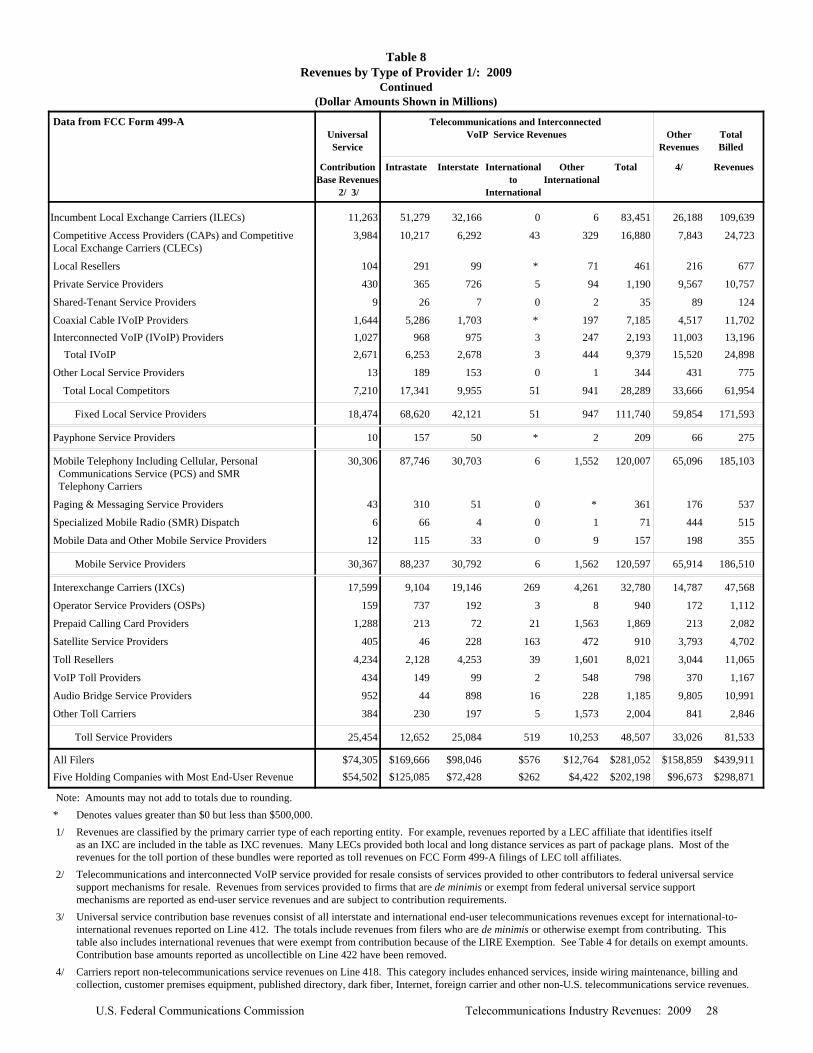
Table 8Revenues by Type of Provider 1/: 2009
Continued(Dollar Amounts Shown in Millions)
Data from FCC Form 499-A Telecommunications and Interconnected Universal VoIP Service Revenues Other Total
Service Revenues Billed
Contribution Intrastate Interstate International Other Total 4/ RevenuesBase Revenues to International
2/ 3/ International
Incumbent Local Exchange Carriers (ILECs) 11,263 51,279 32,166 0 6 83,451 26,188 109,639
Competitive Access Providers (CAPs) and Competitive 3,984 10,217 6,292 43 329 16,880 7,843 24,723 Local Exchange Carriers (CLECs)
Local Resellers 104 291 99 * 71 461 216 677
Private Service Providers 430 365 726 5 94 1,190 9,567 10,757
Shared-Tenant Service Providers 9 26 7 0 2 35 89 124
Coaxial Cable IVoIP Providers 1,644 5,286 1,703 * 197 7,185 4,517 11,702 Interconnected VoIP (IVoIP) Providers 1,027 968 975 3 247 2,193 11,003 13,196 Total IVoIP 2,671 6,253 2,678 3 444 9,379 15,520 24,898
Other Local Service Providers 13 189 153 0 1 344 431 775
Total Local Competitors 7,210 17,341 9,955 51 941 28,289 33,666 61,954
Fixed Local Service Providers 18,474 68,620 42,121 51 947 111,740 59,854 171,593
Payphone Service Providers 10 157 50 * 2 209 66 275
Mobile Telephony Including Cellular, Personal 30,306 87,746 30,703 6 1,552 120,007 65,096 185,103 Communications Service (PCS) and SMR Telephony Carriers
Paging & Messaging Service Providers 43 310 51 0 * 361 176 537
Specialized Mobile Radio (SMR) Dispatch 6 66 4 0 1 71 444 515
Mobile Data and Other Mobile Service Providers 12 115 33 0 9 157 198 355
Mobile Service Providers 30,367 88,237 30,792 6 1,562 120,597 65,914 186,510
Interexchange Carriers (IXCs) 17,599 9,104 19,146 269 4,261 32,780 14,787 47,568
Operator Service Providers (OSPs) 159 737 192 3 8 940 172 1,112
Prepaid Calling Card Providers 1,288 213 72 21 1,563 1,869 213 2,082
Satellite Service Providers 405 46 228 163 472 910 3,793 4,702
Toll Resellers 4,234 2,128 4,253 39 1,601 8,021 3,044 11,065
VoIP Toll Providers 434 149 99 2 548 798 370 1,167
Audio Bridge Service Providers 952 44 898 16 228 1,185 9,805 10,991
Other Toll Carriers 384 230 197 5 1,573 2,004 841 2,846
Toll Service Providers 25,454 12,652 25,084 519 10,253 48,507 33,026 81,533
All Filers $74,305 $169,666 $98,046 $576 $12,764 $281,052 $158,859 $439,911 Five Holding Companies with Most End-User Revenue $54,502 $125,085 $72,428 $262 $4,422 $202,198 $96,673 $298,871
Note: Amounts may not add to totals due to rounding. * Denotes values greater than $0 but less than $500,000. 1/ Revenues are classified by the primary carrier type of each reporting entity. For example, revenues reported by a LEC affiliate that identifies itself
as an IXC are included in the table as IXC revenues. Many LECs provided both local and long distance services as part of package plans. Most of the revenues for the toll portion of these bundles were reported as toll revenues on FCC Form 499-A filings of LEC toll affiliates.
2/ Telecommunications and interconnected VoIP service provided for resale consists of services provided to other contributors to federal universal service support mechanisms for resale. Revenues from services provided to firms that are de minimis or exempt from federal universal service support mechanisms are reported as end-user service revenues and are subject to contribution requirements.
3/ Universal service contribution base revenues consist of all interstate and international end-user telecommunications revenues except for international-to-international revenues reported on Line 412. The totals include revenues from filers who are de minimis or otherwise exempt from contributing. This table also includes international revenues that were exempt from contribution because of the LIRE Exemption. See Table 4 for details on exempt amounts.Contribution base amounts reported as uncollectible on Line 422 have been removed.
4/ Carriers report non-telecommunications service revenues on Line 418. This category includes enhanced services, inside wiring maintenance, billing and collection, customer premises equipment, published directory, dark fiber, Internet, foreign carrier and other non-U.S. telecommunications service revenues.
U.S. Federal Communications Commission Telecommunications Industry Revenues: 2009 28
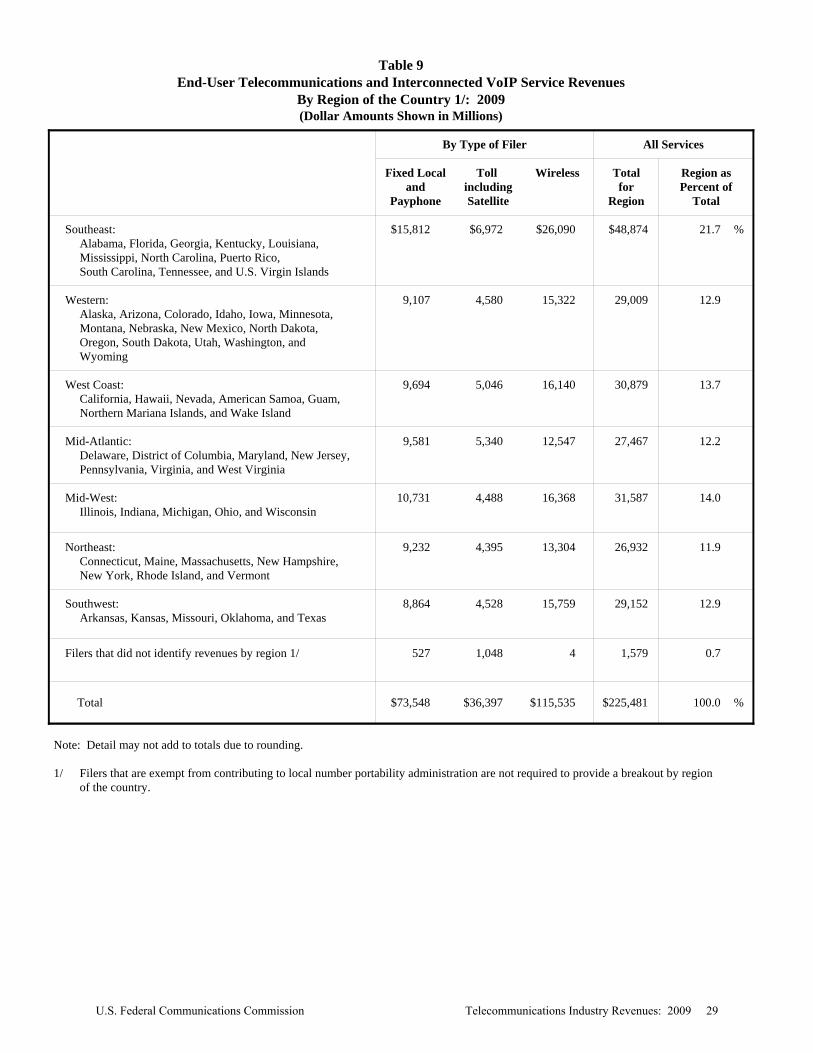
Table 9End-User Telecommunications and Interconnected VoIP Service Revenues
By Region of the Country 1/: 2009(Dollar Amounts Shown in Millions)
By Type of Filer All Services
Fixed Local Toll Wireless Total Region asand including for Percent of
Payphone Satellite Region Total
Southeast: $15,812 $6,972 $26,090 $48,874 21.7 % Alabama, Florida, Georgia, Kentucky, Louisiana, Mississippi, North Carolina, Puerto Rico,
South Carolina, Tennessee, and U.S. Virgin Islands
Western: 9,107 4,580 15,322 29,009 12.9 Alaska, Arizona, Colorado, Idaho, Iowa, Minnesota, Montana, Nebraska, New Mexico, North Dakota,
Oregon, South Dakota, Utah, Washington, and Wyoming
West Coast: 9,694 5,046 16,140 30,879 13.7 California, Hawaii, Nevada, American Samoa, Guam, Northern Mariana Islands, and Wake Island
Mid-Atlantic: 9,581 5,340 12,547 27,467 12.2 Delaware, District of Columbia, Maryland, New Jersey, Pennsylvania, Virginia, and West Virginia
Mid-West: 10,731 4,488 16,368 31,587 14.0 Illinois, Indiana, Michigan, Ohio, and Wisconsin
Northeast: 9,232 4,395 13,304 26,932 11.9 Connecticut, Maine, Massachusetts, New Hampshire,
New York, Rhode Island, and Vermont
Southwest: 8,864 4,528 15,759 29,152 12.9 Arkansas, Kansas, Missouri, Oklahoma, and Texas
Filers that did not identify revenues by region 1/ 527 1,048 4 1,579 0.7
Total $73,548 $36,397 $115,535 $225,481 100.0 %
Note: Detail may not add to totals due to rounding.
1/ Filers that are exempt from contributing to local number portability administration are not required to provide a breakout by region of the country.
U.S. Federal Communications Commission Telecommunications Industry Revenues: 2009 29
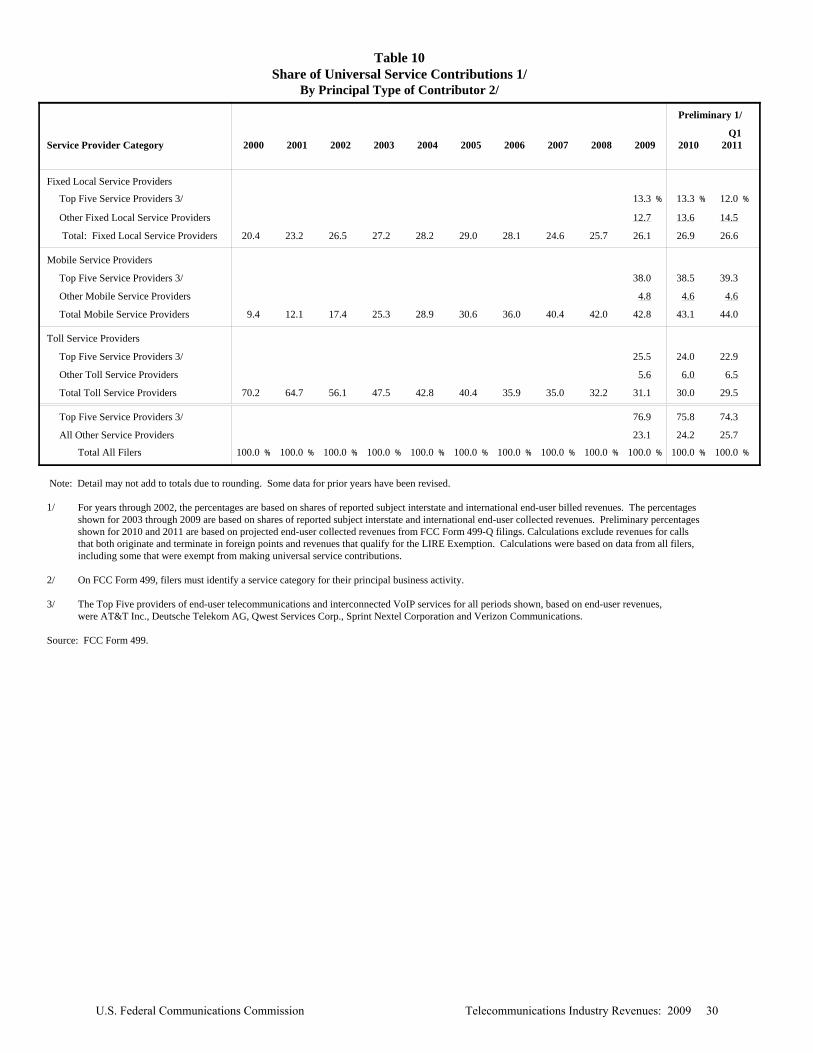
Table 10Share of Universal Service Contributions 1/
By Principal Type of Contributor 2/
Preliminary 1/
Q1Service Provider Category 2000 2001 2002 2003 2004 2005 2006 2007 2008 2009 2010 2011
Fixed Local Service Providers
Top Five Service Providers 3/ 13.3 % 13.3 % 12.0 %
Other Fixed Local Service Providers 12.7 13.6 14.5
Total: Fixed Local Service Providers 20.4 23.2 26.5 27.2 28.2 29.0 28.1 24.6 25.7 26.1 26.9 26.6
Mobile Service Providers
Top Five Service Providers 3/ 38.0 38.5 39.3
Other Mobile Service Providers 4.8 4.6 4.6
Total Mobile Service Providers 9.4 12.1 17.4 25.3 28.9 30.6 36.0 40.4 42.0 42.8 43.1 44.0
Toll Service Providers
Top Five Service Providers 3/ 25.5 24.0 22.9
Other Toll Service Providers 5.6 6.0 6.5
Total Toll Service Providers 70.2 64.7 56.1 47.5 42.8 40.4 35.9 35.0 32.2 31.1 30.0 29.5
Top Five Service Providers 3/ 76.9 75.8 74.3
All Other Service Providers 23.1 24.2 25.7
Total All Filers 100.0 % 100.0 % 100.0 % 100.0 % 100.0 % 100.0 % 100.0 % 100.0 % 100.0 % 100.0 % 100.0 % 100.0 %
Note: Detail may not add to totals due to rounding. Some data for prior years have been revised.
1/ For years through 2002, the percentages are based on shares of reported subject interstate and international end-user billed revenues. The percentagesshown for 2003 through 2009 are based on shares of reported subject interstate and international end-user collected revenues. Preliminary percentagesshown for 2010 and 2011 are based on projected end-user collected revenues from FCC Form 499-Q filings. Calculations exclude revenues for callsthat both originate and terminate in foreign points and revenues that qualify for the LIRE Exemption. Calculations were based on data from all filers,including some that were exempt from making universal service contributions.
2/ On FCC Form 499, filers must identify a service category for their principal business activity.
3/ The Top Five providers of end-user telecommunications and interconnected VoIP services for all periods shown, based on end-user revenues, were AT&T Inc., Deutsche Telekom AG, Qwest Services Corp., Sprint Nextel Corporation and Verizon Communications.
Source: FCC Form 499.
U.S. Federal Communications Commission Telecommunications Industry Revenues: 2009 30
Customer Response Publication: Telecommunications Industry Revenues: 2009 You can help us provide the best possible information to the public by completing this form and returning it to the Industry Analysis & Technology Division of the FCC's Wireline Competition Bureau. 1. Please check the category that best describes you: ____ press ____ current telecommunications carrier ____ potential telecommunications carrier ____ business customer evaluating vendors/service options ____ consultant, law firm, lobbyist ____ other business customer ____ academic/student ____ residential customer ____ FCC employee ____ other federal government employee ____ state or local government employee ____ Other (please specify) 2. Please rate the report: Excellent Good Satisfactory Poor No opinion Data accuracy (_) (_) (_) (_) (_) Data presentation (_) (_) (_) (_) (_) Timeliness of data (_) (_) (_) (_) (_) Completeness of data (_) (_) (_) (_) (_) Text clarity (_) (_) (_) (_) (_) Completeness of text (_) (_) (_) (_) (_) 3. Overall, how do you Excellent Good Satisfactory Poor No opinion rate this report? (_) (_) (_) (_) (_) 4. How can this report be improved? 5. May we contact you to discuss possible improvements? Name: Telephone #:
Questions? Contact Susan Lee or Ken Lynch at 202-418-0940 (TTY users, call 202-418-0484) or email [email protected] or [email protected]
Fax this response to or Mail this response to
202-418-0520 FCC/WCB/IATD, Mail Stop 1600 F Washington, DC 20554