industry report - amta.org.au
TRANSCRIPT
June 2008
Australian Mobile Telecommunications Industry: Economic significance and contribution
Report by Access Economics Pty Limited for
Australian Mobile Telecommunications Association

Australian Mobile Telecommunications Industry
Disclaimer While every effort has been made to ensure the accuracy of this document, the uncertain nature of economic data, forecasting and analysis means that Access Economics Pty Limited is unable to make any warranties in relation to the information contained herein. Access Economics Pty Limited, its employees and agents disclaim liability for any loss or damage which may arise as a consequence of any person relying on the information contained in this document.
TABLE OF CONTENTS
GLOSSARY .......................................... .................................................................................. i
EXECUTIVE SUMMARY ........................................................................................................ ii
1. Introduction ...................................... ........................................................................... 1
1.1 Study objectives ................................................................................................................... 1
1.2 Study approach .................................................................................................................... 1
1.3 Report structure ................................................................................................................... 3
2. The Australian mobile telecommunications industry: an overview ......................... 4
2.1 Brief introduction/history ...................................................................................................... 4
2.2 Industry structure ................................................................................................................. 7
2.3 Trends ................................................................................................................................11
3. Productivity, innovation and investment ........... ...................................................... 14
3.1 Recent innovations ............................................................................................................14
3.2 Investments made by the industry .....................................................................................15
3.3 Productivity gains enabled .................................................................................................16
4. The economic contribution of the industry ......... .................................................... 19
4.1 Direct contribution ..............................................................................................................19
4.2 indirect contribution ............................................................................................................23
5. REFERENCES ............................................................................................................ 30
FIGURES
Figure 1-1: Framework for the analysis 2
Figure 2-1: The Mobile Telecommunications Industry 8
Figure 2-2: Market Share of Mobile Network Carriers by Revenue, 2007 9
Figure 2-3: Market Share of Mobile Resellers by Revenue, 2007 10
Figure 2-4: Currently Accessed Internet Services on 3G Mobiles 12
Figure 2-5: Total Pre-paid and Post-paid Services, 2000-01 to 2006-07 12
Figure 3-1: Benefits and drawbacks of Blackberry use, per cent of respondents 17
Figure 4-1: Industry revenue and value added, 2002-03 to 2006-07 (2007 $bn) 20
Figure 4-2: Industry value added, 2001-02 to 2006-07 21
Figure 4-3: Price indices used in the modelling exercise 24
Figure 4-4: Total economic contribution of mobile telecommunications, 2007 28
Figure 4-5: Benefits from mobile voice and data, 2008-2010 29

Australian Mobile Telecommunications Industry
TABLES
Table 2-1: Population Coverage by Carrier and Network Type, 2007 7
Table 4-1: Industry revenue and value added, 2002-03 to 2006-07 (2007 $m) 19
Table 4-2: Earnings to employees, 2002-03 to 2006-07 (2007 $m) 21
Table 4-3: Employees, by carriers and resellers, 2002-03 to 2006-07 22
Table 4-4: Industry payments to government, 2006-07 23
Table 4-5: Economic impacts in 2007 27
Table 4-6: Economic impacts of mobile voice and data (deviation from reference case), 2008-2010 29

Australian Mobile Telecommunications Industry
i
GLOSSARY 1G First Generation
2G Second Generation
3G Third Generation
4G Fourth Generation
ACCC Australian Competition and Consumer Commission
ACMA Australian Communications and Media Authority
AMTA Australian Mobile Telecommunications Association
ARPU Average Revenue Per User
BSC Base Station Controller
BSS Base System Substation
BTS Base Transceiver Station
CDMA Code Division Multiple Access
CSP Carriage Service Provider
GDP Gross Domestic Product
GPRS General Packet Radio Service
GSM Global System for Mobile Communications
HSDPA High Speed Downlink Packet Access
LTE Long-Term Evolution
Mbps Megabits per second
MSC Mobile Switching Centre
MHz Megahertz
MMS Multimedia Message Service
MVNO Mobile Virtual Network Operator
NGN Next Generation Networks
PDA Personal Digital Assistant
PSTN Public Switched Telephone Network
SMS Short Message Service
TIO Telecommunications Industry Ombudsman
VoIP Voice over Internet Protocol
WAP Wireless Application Protocol
W-CDMA Wideband Code Division Multiple Access
WiMax Worldwide Interoperability for Microwave Access
Australian Mobile Telecommunications Industry
ii
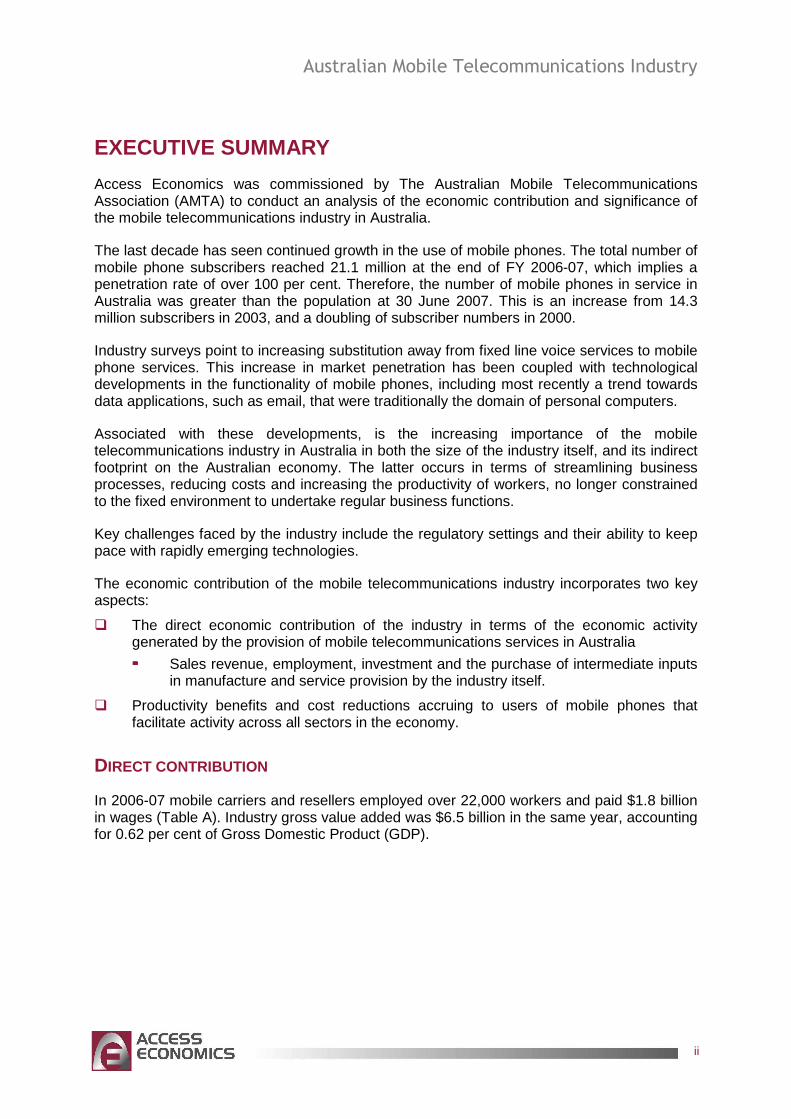
EXECUTIVE SUMMARY
Access Economics was commissioned by The Australian Mobile Telecommunications Association (AMTA) to conduct an analysis of the economic contribution and significance of the mobile telecommunications industry in Australia.
The last decade has seen continued growth in the use of mobile phones. The total number of mobile phone subscribers reached 21.1 million at the end of FY 2006-07, which implies a penetration rate of over 100 per cent. Therefore, the number of mobile phones in service in Australia was greater than the population at 30 June 2007. This is an increase from 14.3 million subscribers in 2003, and a doubling of subscriber numbers in 2000.
Industry surveys point to increasing substitution away from fixed line voice services to mobile phone services. This increase in market penetration has been coupled with technological developments in the functionality of mobile phones, including most recently a trend towards data applications, such as email, that were traditionally the domain of personal computers.
Associated with these developments, is the increasing importance of the mobile telecommunications industry in Australia in both the size of the industry itself, and its indirect footprint on the Australian economy. The latter occurs in terms of streamlining business processes, reducing costs and increasing the productivity of workers, no longer constrained to the fixed environment to undertake regular business functions.
Key challenges faced by the industry include the regulatory settings and their ability to keep pace with rapidly emerging technologies.
The economic contribution of the mobile telecommunications industry incorporates two key aspects:
� The direct economic contribution of the industry in terms of the economic activity generated by the provision of mobile telecommunications services in Australia
���� Sales revenue, employment, investment and the purchase of intermediate inputs in manufacture and service provision by the industry itself.
� Productivity benefits and cost reductions accruing to users of mobile phones that facilitate activity across all sectors in the economy.
DIRECT CONTRIBUTION
In 2006-07 mobile carriers and resellers employed over 22,000 workers and paid $1.8 billion in wages (Table A). Industry gross value added was $6.5 billion in the same year, accounting for 0.62 per cent of Gross Domestic Product (GDP).

Australian Mobile Telecommunications Industry
iii
TABLE A: MOBILE PHONE SECTOR , REVENUE AND VALUE ADDED , FY 2003 – 2007 CONSTANT PRICES ($M 2007)
2003 2004 2005 2006 2007 Industry revenue 11,757.8 12,267.7 13,381.2 13,676.7 14,500.1
Industry gross value added 5,751.6 5,952.4 6,266.8 6,218.9 6,470.3
Earnings to capital 4,288.1 4,440.1 4,661.6 4,687.8 4,634.0
Earnings to employees 1,463.5 1,512.3 1,605.3 1,531.0 1,836.3
Employment 21,405 22,216 23,685 22,923 22,386
Mobile subscribers (m) 14.3 16.5 18.4 19.9 21.1
Source: IBISWorld J7122 and J7123 and Access Economics
The mobile telecommunications industry accounted for 25.6% of the total communications industries’ contribution to GDP (Figure A) in 2006-07.
FIGURE A: INDUSTRY VALUE ADDED , 2001-02 TO 2006-07
0
1000
2000
3000
4000
5000
6000
7000
2001-02 2002-03 2003-04 2004-05 2005-06 2006-07
Indu
stry
Val
ue A
dded
($m
)
20%
21%
22%
23%
24%
25%
26%
Pro
port
ion
of to
tal c
omm
unic
atio
ns IG
P
Carriers Resellers Carriers & resellers as proportion of communications industry
Source: IBISWorld, ABS 5204
ECONOMIC IMPACTS
The total economic impacts of the industry, taking into account direct and indirect contributions, have been modelled using Access Economics’ general equilibrium model (AE-GEM).
The total economic impact of the mobile telecommunications industry is detailed in Figure B. Combining the direct and indirect contributions, Access Economics estimates the mobile telecommunications industry contributed $14.2 billion to the Australian economy in 2006-07,
Australian Mobile Telecommunications Industry
iv
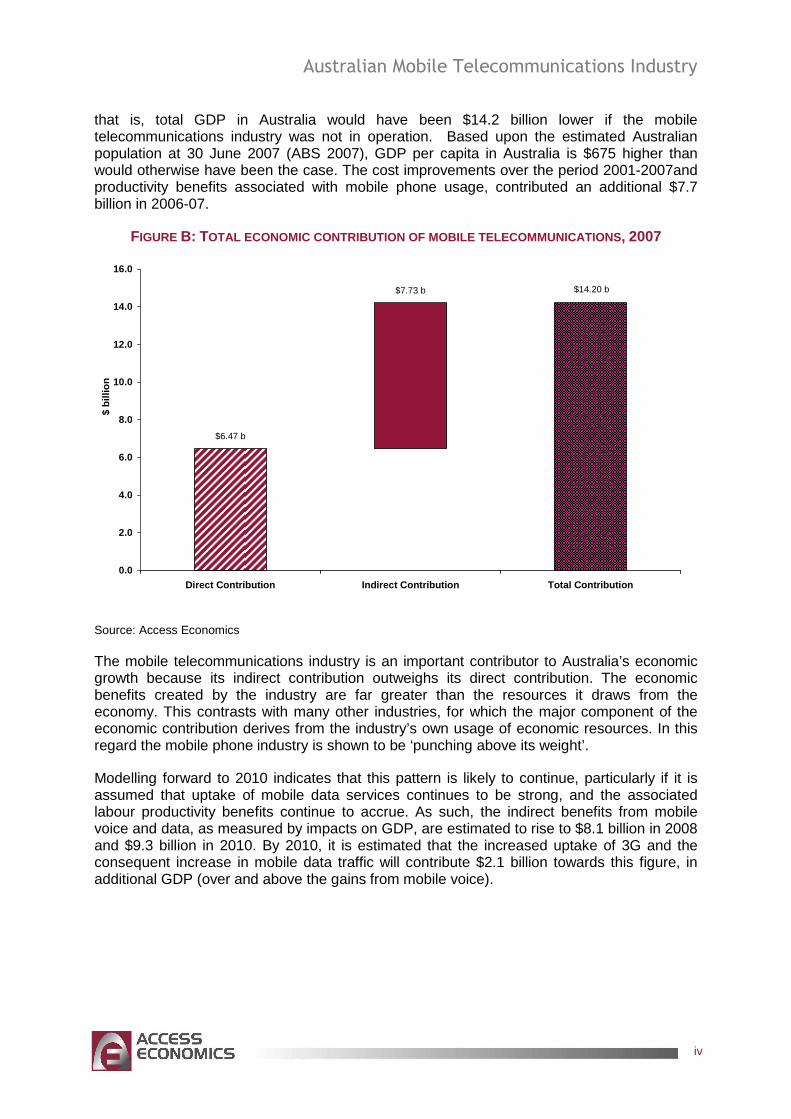
that is, total GDP in Australia would have been $14.2 billion lower if the mobile telecommunications industry was not in operation. Based upon the estimated Australian population at 30 June 2007 (ABS 2007), GDP per capita in Australia is $675 higher than would otherwise have been the case. The cost improvements over the period 2001-2007and productivity benefits associated with mobile phone usage, contributed an additional $7.7 billion in 2006-07.
FIGURE B: TOTAL ECONOMIC CONTRIBUTION OF MOBILE TELECOMMUNICATIONS , 2007
$6.47 b
$7.73 b $14.20 b
0.0
2.0
4.0
6.0
8.0
10.0
12.0
14.0
16.0
Direct Contribution Indirect Contribution Total Contr ibution
$ bi
llion
Source: Access Economics
The mobile telecommunications industry is an important contributor to Australia’s economic growth because its indirect contribution outweighs its direct contribution. The economic benefits created by the industry are far greater than the resources it draws from the economy. This contrasts with many other industries, for which the major component of the economic contribution derives from the industry’s own usage of economic resources. In this regard the mobile phone industry is shown to be ‘punching above its weight’.
Modelling forward to 2010 indicates that this pattern is likely to continue, particularly if it is assumed that uptake of mobile data services continues to be strong, and the associated labour productivity benefits continue to accrue. As such, the indirect benefits from mobile voice and data, as measured by impacts on GDP, are estimated to rise to $8.1 billion in 2008 and $9.3 billion in 2010. By 2010, it is estimated that the increased uptake of 3G and the consequent increase in mobile data traffic will contribute $2.1 billion towards this figure, in additional GDP (over and above the gains from mobile voice).

Australian Mobile Telecommunications Industry
1
1. INTRODUCTION
The mobile telephone has experienced large take-up and growth worldwide over the past two decades and has significantly impacted upon businesses and the way people live. In Australia, mobile penetration has increased such that is approaching levels of natural saturation – that is when statistically every person in the population from age 12 onwards is a subscriber to a mobile service. This increase in penetration has occurred in tandem with substantial declines in the price of mobile telephony.
On the technological side, there have been major advances in mobile handset technology (for example, built-in cameras and large, high resolution full-colour screens), network capabilities (such multi-media services and wireless broadband services), as well as the number and variety of content services and applications (ring tones, gaming services, music, etc).
It is against this background that Access Economics was commissioned by the Australian Mobile Telecommunications Association (AMTA) to report on the economic significance and contribution of the Australian mobile telecommunications industry. This follows three preceding reports published annually between 2003 and 2005, and is an update of the report prepared by Access Economics in 2007.
1.1 STUDY OBJECTIVES
The key objective of this report is to update the 2007 report, via measurement and analysis of impacts of developments in the telecommunications industry on the broader Australian economy and society.
It is hoped that this report will be a valuable tool for the industry to promote increased public awareness of the economic and social importance of Australia’s mobile telecommunications industry and the factors likely to shape its future.
1.2 STUDY APPROACH
The economic contribution of the Australian mobile telecommunications industry (the industry) can be estimated by ‘economic contribution’ and ‘economic impact’ studies. Access has determined the direct contribution of the industry to the Australian economy by calculating the direct value added. However, given that the main contribution of the industry is through the provision of productivity enabling services, this is only a partial measure.
To consider the impact of the industry on the economy more generally, through enhancements to labour productivity, general equilibrium modelling has also been undertaken. As shown in Figure 1-1, the information compiled in the economic contribution study feeds into the economic impacts analysis.

Australian Mobile Telecommunications Industry
2
FIGURE 1-1: FRAMEWORK FOR THE ANALYSIS
Economic contribution
-direct value added and employment
contribution by industry
Economic impacts
-direct and indirect effects of industry on the
economy
Usage of inputs, sale of
output
- productivity enhancing
1.2.1 ECONOMIC CONTRIBUTION STUDIES
‘Economic contribution’ studies are intended to quantify measures such as value added, exports, imports and employment associated with a given industry or firm, in a historical reference year. The economic contribution is a measure of the value of production by a firm or industry.
Value added (output after deducting the value of inputs) is the most appropriate measure of an industry’s/company’s economic contribution to gross state product (GSP) at the state level and gross domestic product (GDP) at the national level.
The value added of each industry in the value chain can be added without the risk of double counting across industries. Value added of an industry can be calculated directly by summing the returns to the primary factors of production, labour and capital (the gross operating surplus, ‘GOS’, or profit), as well as production taxes less subsidies.
Measures such as total revenue or total exports double count — that is, overstate the contribution of an industry/company to economic activity — as they include the value added of other industries. For example the industry’s sales revenue includes the value added of external firms supplying inputs to the industry.
While describing the geographic origin of production inputs may be a guide to a firm’s linkages with the local economy, it should be recognised that these are the type of normal industry linkages that characterise all economic activities.
Unless there is significant unused capacity in the economy (such as unemployed labour) there is only a weak relationship between a firm’s economic contribution as measured by value added (or other static aggregates) and the welfare or living standard. Indeed, the use of labour and capital in production is a cost to the economy. In simple terms, economic resources (land, labour, capital) are not for exclusive use by the industry (or any other business). That is, activity related to the industry comes at an opportunity cost as it may

Australian Mobile Telecommunications Industry
3
reduce the amount of resources available to spend on other (possibly more worthwhile) activities than producing and exporting minerals.
This is not to say that the economic contribution of the industry, including employment, is not important. As stated by the Productivity Commission (PC) in the context of Australia’s gambling industries:1
Value-added, trade and job creation arguments need to be considered in the context of the economy as a whole…income from trade uses real resources, which could have been employed to generate benefits elsewhere…These arguments do not mean that jobs, trade and activity are unimportant in an economy. To the contrary they are critical to people’s well-being. However, any particular industry’s contribution to these benefits is much smaller than might at first be thought, because substitute industries could produce similar, though not equal gains.
In a fundamental sense, economic contribution studies are simply historical accounting exercises. No ‘what-if’, or counterfactual inferences, such as ‘what would happen to living standards if the firm disappeared?’ should be drawn from them.
1.2.2 ECONOMIC IMPACT STUDIES
In contrast, the ultimate aim of economic impact studies (such as GE modelling) is to gauge the net benefit of an economic stimulus or contraction – whether living standards will increase and by how much, not how much expenditure is incurred.
Static analysis like contribution studies, while useful to gauge the size of firms or industries in the economy, are a poor guide to living standards – they do not take into account dynamic displacement or ‘crowding out’ effects on other sectors of the economy, such as increases in wages.
The economic contribution of the industry as measured by value added indicates the value of activity in terms of production undertaken in Australia. The contribution of the industry’s operations to Australia’s income is less than the value of production.
1.3 REPORT STRUCTURE
This report is organised as follows:
� Chapter 2 provides a snapshot of the Australian mobile telecommunications industry.
� Chapter 3 discusses recent innovation and investment in the mobile telecommunications industry and discusses the productivity gains these have enabled.
� Chapter 4 describes the direct and indirect economic contributions of the industry.
� Chapter 5 provides some conclusions based upon the findings of the report.
1 Productivity Commission 1999, Australia’s Gambling Industries, Report No. 10, AusInfo, Canberra, (page 4.19).

Australian Mobile Telecommunications Industry
4
2. THE AUSTRALIAN MOBILE TELECOMMUNICATIONS INDUSTRY: AN OVERVIEW
This chapter provides an overview of the mobile telecommunications industry. Topics covered include a brief history of mobile telecommunication technology, the current industry structure, and trends in the mobile telecommunications industry.
2.1 BRIEF INTRODUCTION/HISTORY
Pre-3G
Fully automatic first-generation cellular networks (1G) were first introduced in the early to mid-1980s. The technology used different frequency carriers to create communications channels via Frequency Division Multiple Access and only had voice functionality. The first fully automatic mobile phone system was the 1981 Nordic Mobile Telephone system. In Australia, the first mobile phone system began operation in August 1981 in Melbourne.
1987 saw the launch of the first Advanced Mobile Phone Service cellular network in Australia. Bulky and heavy handsets retailed at over $4,000 at the time. The number of mobile network operators increased in the next five years along with the rising number of subscribers. The government mandated the closure of the analogue network in 2000 due to its inefficient use of spectrum.
The second generation of mobile technology (2G) continues to play a significant part in the Australian mobile market, accounting for the majority of total industry product segmentation in 2006-07 (ACMA 2008a). Offering limited data functionality, 2G services operates on the Global System for Mobiles (GSM) network. GSM is a Time Division Multiple Access-based technology that supports voice, data and text messaging and allows roaming between different networks. First introduced into the Australian market in 1993, Telstra, Optus and Vodafone presently operate 2G GSM networks using 900 Megahertz (MHz) and 1800 MHz spectrum. Code Division Multiple Access (CDMA) 2G services were also available in Australia, with the closure of the last CDMA network occurring on April 28 2008.
Carriers in Australia have also incorporated the General Packet Radio Service (GPRS) data standard into their GSM networks (‘2.5G networks’). 2.5G technology refers to the increased functionality of 2G and is regarded as a stepping stone from 2G to 3G in that it offers enhanced data services such as Wireless Application Protocol (WAP) and Multimedia Message Service (MMS). WAP offers mobile-Internet connectivity at relatively low speeds. Bandwidth limitations and limited web content for handheld display has hindered both the implementation and take-up of WAP in Australia and overseas.
3G and Beyond
3G technology was first offered in Australia by Hutchison’s 3 in 2003, using Wideband Code Division Multiple Access (W-CDMA) technology. 3G technology offers services such as music and video downloads, mobile broadband, improved Internet connectivity and a host of other data-rich services.

Australian Mobile Telecommunications Industry
5
Box 2-1: Structure of Mobile Networks
Mobile networks are composed of the following equipment and software:
The base transceiver station (BTS) or base station subsystem (BSS) – The BTS is connected to the antenna, and transmits and receives mobile calls and amplifies signals. A base station consists of a BTS plus the antenna. The base stations are the costliest parts of a mobile network’s hardware.
The base station controller (BSC) – The BSC is the ‘traffic cop’ of the mobile network. It does pre-call setup (that is, it assigns calls to radio channels in the BTS, sends ringing to the correct channel and measures signal strength). The BSC can be located at the BTS or one controller can manage many BTSs.
The mobile switching centre (MSC) – also called the mobile telephone switching office. The MSC switches calls between mobile networks and the public switched telephone network. Mobile switches have Signalling System 7 links to databases that contain billing and roaming information. New mobile switches may control up to 1024 cell sites.
Databases – Home location registers contain information service and billing information on subscribers, and also keeps track of the status and location of subscribers within its area.
Connections to the public switched telephone networ k (PSTN) – Mobile telephone switching offices are connected to landline public networks by high-speed links.
Source: Dodd AZ 2002
3G networks are now being offered by all mobile network carriers in Australia. Initial 3G network implementations used the 2100 MHz spectrum band, primarily in urban areas. For example, Hutchison’s ‘3’ and Telstra jointly operate a 3G network in the 2100 MHz band, covering metropolitan areas that form 56% of Australia’s population, while Vodafone and Optus jointly built and operate a 2100 MHz 3G network to 55% of the population. This will be expanded to 96% of the population by December 2008 and to 98% by December 20092.
Telstra has also developed an independent 3G network with wider coverage, introducing its ‘Next G’ network in October 2006 using the lower 850 MHz spectrum. The network claims to cover 98.8% of the population.
Innovations such as the development of Bluetooth, which allows rapid data transfer from mobile devices to Local Area Networks and personal computers (PCs) over short distances, have enhanced the functionality of 3G devices. Mobile users are able to conveniently upload and download large amounts of data automatically, without having to use the mobile network to do so.
Another important technological development is Worldwide Interoperability for Microwave Access (WiMax). WiMax aims to provide wireless data over long distances, in a variety of different ways, from point to point links to full mobile cellular-type access. These
2 Optus, 2008

Australian Mobile Telecommunications Industry
6
developments have enhanced the operability of mobile devices for uses generally associated with more ‘traditional’ computers.
So-called ‘3.5G’ services are enhanced 3G services, typically to High Speed Downlink Packet Access (HSDPA), an advancement on W-CDMA that supports ‘bursty traffic’ and offers theoretical downlink speeds of up to 14.4 Megabits per second (Mbps). All four carriers in Australia upgraded their 3G mobile services to HSDPA protocol during 2006-07.
2.1.1 MOBILE TELECOMMUNICATIONS IN AUSTRALIA TODAY
A wide variety of mobile telecommunication services is currently available to both personal and business users in Australia.
� Wireless Network Communication Services – Voice remains the primary use of mobile devices however this service has been commoditised, reflected in declining average revenue per user (ARPU) across almost all major market segments. In June 2007, there were an estimated 21.26 million mobile subscribers (ACMA 2008a).
� Short Message Service (SMS) and Multimedia Message Service (MMS) Text Communication Services – The Australian networks carried over 10.2 billion SMS messages in 2005-06. MMS enables sound and images to be sent and received in addition to text. In 2005-06 approximately 63.6 million MMS were sent, compared to 13.7 million in 2003-04.
� Mobile Broadband – Mobile broadband technologies include those that deliver typical end-user downlink data rates of 500 kbps or more while providing full mobility. These devices include feature phones, smartphones, personal digital assistants (PDAs), PC Cards and Express Cards, USB ‘thumb’ drives, embedded notebooks and even desktop modems.
� Push-to-Talk – Push to Talk offers consumers the ability to talk to another individual or group without having to make additional calls. Penetration has remained very low.
� Mobile TV – Mobile TV is expected to be one of the value added services that will drive margins and 3G penetration for carriers.
� Mobile Commerce (m-Commerce) – Mobile commerce is another service that can provide an additional revenue streams and boost margins for carriers as voice margins decline. Further penetration of m-commerce solutions may depend on agreements between mobile carriers and merchants, payment security, costs to introduce the service, simplicity of use, and non-prohibitive pricing.
Current Coverage
Following Telstra’s closure of the CDMA network, the four mobile carriers now operate seven mobile networks in Australia. The geographic spread of mobile telecommunication coverage follows Australia’s demographic profile, in particular its population density. At present, Australia’s terrestrial mobile network covers 98% of the population and approximately 27% of its landmass. In recent years, mobile carriers have invested considerable resources in building new base stations to expand their geographic footprint. There are currently around 15,000 base transceiver stations (BTS) throughout the country. The population coverage by each carrier and network type is summarised in Table 2-1.
With spectrum licences being granted on a ‘nationwide’, ‘all cities’ and an individual city or region basis, mobile subscriber access to carriers varies between states, cities and regions.

Australian Mobile Telecommunications Industry
7
For example, Sydney and Melbourne mobile users have access to all mobile carriers while subscribers in rural regions may have access to just one or two.
TABLE 2-1: POPULATION COVERAGE BY CARRIER AND NETWORK TYPE, 2007
Carrier Network No. of mobile services
Subscriber share (%)
Population coverage (%)
Telstra GSM 5,947 28.1 96
CDMA 1,262 6.0 98
W-CDMA 2,003 9.5 98
Optus GSM 6,802 32.2 96
Vodafone GSM 3,709 17.6 95
Hutchison W-CDMA 1,405 6.6 53
Source: IBISWorld J7122 February 2008 Note: Telstra CDMA closed in April 2008
2.2 INDUSTRY STRUCTURE
Mobile telecommunications require several entities to work together (see Figure 2-1). Some firms operate across multiple sectors of the industry.
� The manufacturing or hardware sector is responsible for building and maintaining the extensive telecommunications network (including base stations, switching equipment, antennas and towers) as well as supplying handsets and associated equipment to end-users. Ericsson Australia, Alcatel-Lucent and Nokia Siemens provide infrastructure hardware to the Australian mobile telecommunications market, while the AMTA members who supply products to meet consumer demand and drive market growth include: Nokia, Motorola, Samsung, LG, Sony Ericsson, i-Mate and RIM.
� Carriage service providers (CSPs) provide telecommunications services to households and businesses using carrier network infrastructure. There are several levels of CSP.
���� Mobile telecommunications carriers are primarily engaged in operating and maintaining switching and transmission facilities that provide direct communication via airwaves. There are presently four network carriers in Australia: Telstra, Optus, Vodafone and Hutchison’s ‘3’.
���� Resellers provide telecommunications services by use of a network owned by a third party but bill customers in their own names. Some own switching equipment while others simply buy and resell telecommunications services. An example of a reseller is Primus Mobile, which resells Optus GSM services.
���� Mobile virtual network operators (MVNOs) are value adding entities that use an existing network to sell a service, usually one linked to other branded services. Unlike resellers, MVNOs purchase wholesale mobile capacity from network carriers. For example, AAPT purchases wholesale mobile capacity from Vodafone. MVNOs in Australia include B Digital, Revolution, Boost Mobile, Primus Telecom, People Telecom and Macquarie Telecom.
� There are several types of firms involved in the provision of mobile content .
���� Content service providers deliver information and entertainment services, which are sourced and purchased from a variety of channels before being structured and bundled for distribution over mobile networks. The advent of 3G mobile services has increased the importance of the role played by content service providers.

Australian Mobile Telecommunications Industry
8
���� Content aggregators manage multiple content providers and provide services through content linked to these providers’ products such as sourcing, reporting, formatting for multiple streams, quality control and cross-referencing. Examples of Australian content aggregators are Legion Interactive, Infospace and iTouch.
���� Program developers use industry development tools to create new and innovative applications for mobile phone users.
� Retailers offer mobile services to end users on behalf of carriage service providers.
���� Most CSPs have their own retail shops where customers can purchase the hardware required to access mobile services and enter into contracts and other arrangements to use the network hardware infrastructure.
���� Other retailers include ‘non-branded’ but still speciality telecommunications or electronics retail outlets that offer hardware and services, such as Crazy Johns; non-specialty stores such as petrol stations, supermarkets and Australia Post; and online stores.
FIGURE 2-1: THE MOBILE TELECOMMUNICATIONS INDUSTRY
Source: Access Economics 2007
Competition
Competition in the Australian mobile telecommunications industry is high amongst established firms, both in terms of price and service, as all bar one of the carriers now provides service to over 95% of the population. Resellers are limited in their ability to compete on price by the price at which they are able to procure network services from the four carriers. There is also some scope for those firms which offer other telecommunications to provide price advantages through bundling, including Telstra and Optus, as well as some resellers such as AAPT. On the whole however the large number of firms offering similar products means price uncompetitive firms will lose customers.
The mobile telecommunications industry also faces competition from other areas of the communications sector. For calls when not on the move, fixed phones can be used as a
Mobile Network Carriers
Resellers
Mobile Virtual Operators
Carriage Service Providers
Hardware Providers
Retailers Pre-paid
Post-paid
Customers
Content Suppliers & Aggregators

Australian Mobile Telecommunications Industry
9
substitute for mobile devices. Additionally, as mobile devices are increasingly able to meet demands such as email and web browsing, the industry will face competition from internet service providers and providers of broadband internet.
Because of the limited product differentiation through price and service, marketing tools (beyond simple advertisements) are increasingly used as a means of attracting customers. Recent strategies in this area include Telstra’s ‘friends’ network where customers may nominate up to 5 other mobile numbers to which they may make free calls, or cross-promotional marketing such as packages from Hutchison’s 3 with Big Brother television phone packages that include regular updates and live streaming on 3G phones or Optus’ Fox Sports video news content for pre- and post-paid 3G customers.
Although competition is high amongst existing market players, there remain substantial barriers to entry to the Australian market for mobile carriers. The capital costs of establishing a network are prohibitively high for most potential entrants, and even if these expenses can be met, the ‘big four’ have sufficiently large market shares to enjoy economies of scale and scope, and the high level of marketing expenditure by the four network providers makes obtaining market share difficult for new entrants. Finally, the prevailing high rate of technological change in telecommunications presents a barrier, as a new entrant’s technology may be out of date even as they launch it.
Figure 2-2 shows the market share of mobile network carriers by revenue in 2007.
FIGURE 2-2: MARKET SHARE OF MOBILE NETWORK CARRIERS BY REVENUE, 2007
Source: IBISWorld J7122 February 2008
Figure 2-3 shows the corresponding market share for resellers in the same year.

Australian Mobile Telecommunications Industry
10
FIGURE 2-3: MARKET SHARE OF MOBILE RESELLERS BY REVENUE, 2007
Source: IBISworld J7123, February 2008
Regulation
The main regulatory body is the Australian Communications and Media Authority (ACMA). The specific responsibilities of ACMA include regulating compliance with legislation, licence conditions and the like; reporting on matters relating to the communications industry, including its performance; and issuing telecommunications licences and radiofrequency spectrum. In 2006-07 ACMA was also responsible for preparing a report considering service quality implications of the closure of Telstra’s CDMA network.
Under the Telecommunications Act 1997 (Cth), the telecommunications industry has broad scope for self-regulation, with Industry Codes developed by the industry, much of which is developed by the industry group Communications Alliance (formerly the Australian Communications Industry Forum). As at 30 June 2007, ACMA had registered 27 telecommunications codes, 24 of which were from Communications Alliance. ACMA may act in response to a complaint of a breach of one of the codes as well as more formal regulation.
The Telecommunications Industry Ombudsman (TIO), which carriers are obliged to join, may also be responsible for responding to breaches under these codes. The TIO is funded by members, and is a dispute resolution body for residential and small business customers and their service providers. Failure to join the TIO scheme may result in pecuniary penalties to a carrier.
The increasingly blurred line between services offered in mobile telephony and television and the internet was highlighted by the Commonwealth Legislation Amendment (Content Services) Act 2007. This legislation amended the Broadcasting Services Act such that those laws which apply appropriate viewing safeguards to content delivered over the internet and television are now applied to live content and internet accessed via mobile devices.
An important potential future development for regulation of the industry relates to 3G. Unlike the CDMA and GSM networks, the Australian Competition and Consumer Commission (ACCC) has not made any of the 3G networks a declared service, meaning access to the network is not subject to price regulation. The GSM network was declared in 1997, increasing competition through obliging the carriers to supply network services to resellers and restricting the price they may charge for access. At this stage the ACCC is not expected to declare any of the 3G networks, meaning resellers are unlikely to get wholesale access to

Australian Mobile Telecommunications Industry
11
3G services. This situation may change as the GSM networks these resellers currently access are closed.
2.3 TRENDS
Mobile penetration
The Australian mobile phone market is nearing saturation levels. In June 2007 the number of mobile phone services exceeded the national population, with 21.26 million phone services (ACMA 2008a). This does not necessarily mean that all persons in the relevant population (those aged 12 years and over) have a mobile phone; there are many instances of one person with multiple services, for example business versus personal use, or the take-up of a second service to take advantage of an associated benefit such as a new handset. Indeed, ACMA (2008a) reports mobile phone ownership levels at 81%, with rates highest among those aged 18-34 years and lowest for those over 65 years. A greater intensity of competition in the industry is anticipated, as scope for increasing market share now arises primarily through lowering switching costs and enticing customers from rival firms to switch providers.
2G versus 3G penetration
As overall market penetration approaches saturation point, the focus of the industry will tend to shift towards higher yielding services. As those services with higher margins are mostly unavailable on the 2G network, this implies a push to move customers onto the 3G network and the additional potential revenue from their use of WAP and other services. Indeed, at 30 June 2007 there were 4.56 million 3G mobile phones in operation in Australia, representing a growth of 192% since 2005-06 (ACMA 2008a). The increase in total 3G revenue was even greater than the uptake of the service, up 251% for 2006-07. The recent closure of Telstra’s CDMA network and the associated move to shift these customers onto Telstra’s Next G network means substantial growth in 3G penetration can be expected again for 2007-08.
The market share of email-capable smartphones is increasing in Australia. IDC Australia research indicates that such smartphones presently comprise 26.8% of mobile phone shipments in Australia, up from 21% penetration at the end of 2006 (Flynn 2008b). Whether this increase in market penetration of mobile devices with such capabilities will translate into a similarly rapid uptake of the full features of these devices remains unclear.
3G usage
The rapid uptake of 3G phones to date has been associated with an increase in use of 3G functions, such as MMS, video calls, and accessing the internet. For example, 20% of 3G users now utilise the MMS functions, while around 5% access the internet on their mobile device. Voice calls and SMS, however, remain the primary applications utilised on 3G phones (ACMA 2008a), with results from the ACMA-commissioned Woolcott Research surveys finding over two-thirds of household respondents who own a 3G phone do not use any of the services that are not available on a 2G phone. Of these, half are not interested in the services, while a further third do not use them as they are too expensive and 17% of respondents do not know how to access services (ACMA 2008b). Figure 2-4 details current use of internet services among 3G mobile owners in Australia.

Australian Mobile Telecommunications Industry
12
FIGURE 2-4: CURRENTLY ACCESSED INTERNET SERVICES ON 3G MOBILES
Source: AMTA/ANU 2007
Pre-Paid/Post-Paid
FIGURE 2-5: TOTAL PRE-PAID AND POST-PAID SERVICES, 2000-01 TO 2006-07
Source: ACMA 2008a
There has been a worldwide trend towards use of pre-paid mobile services, as shown in Figure 2-5. Pre-paid as a proportion of total mobile services in Australia has increased from 27% in 2000-01 to over half of all services in 2005-06. In 2006-07 a slight reversal of this was seen, with pre-paid services falling to 49% of the total. Some of this fall may be

Australian Mobile Telecommunications Industry
13
attributable to the increased uptake of 3G services, which are more commonly offered on post-paid contracts.
Fixed/Mobile Substitution
Mobile phones are increasingly becoming a substitute for fixed line phone services. Telecommunications markets across a number of developed countries have observed a trend of:
� an increasing proportion of voice calls being carried over mobile networks compared with the proportion of voice calls carried over the fixed-line networks; and
� a decrease in the number of fixed-line connections and an increase in the number of mobile connections.
Substitution in the form of an increasing proportion of traffic carried over mobile networks is driven by users opting to make calls on their mobile phones rather than their fixed-line phones. This form of substitution is increasingly apparent in the Australian market, with some 40% of consumers now reporting that they use their mobile phone more than their home phone (ACMA 2008a). In contrast, substitution in terms of access is driven by users discontinuing their fixed-line subscription and instead using a mobile solution to meet their basic connectivity needs. This form of substitution is now being seen, with around 20% of mobile phone owners surveyed indicating that they could consider replacing their home phone with mobile phone services (ACMA 2008a). Additionally, the high growth rates in mobile phone services noted above are countered by a 2.7% fall in fixed-line services in operation in 2006-07 (ACMA 2008a).
Australian Mobile Telecommunications Industry
14
3. PRODUCTIVITY, INNOVATION AND INVESTMENT
According to Moore’s Law, the capabilities of technological devices roughly double every 12 to 24 months. The high level of investment in the mobile telecommunications industry is consistent with this rapid rate of advancement, and has facilitated and continues to facilitate productivity gains. This section considers recent innovations and investment undertaken in Australia, and the productivity gains realised on the back of these developments.
3.1 RECENT INNOVATIONS
The Next Generation Network (NGN) is a broad term to describe several architectural evolutions currently underway in the telecommunication core and access networks. The general idea behind the NGN is that one network transports all information and services (voice, data, and multimedia) by encapsulating these into packets, as on the Internet. The two major components of any NGN are likely to be:
� an IP-based core network with enhancements to support not only the standard Internet-based services with Internet grade quality, but also Quality of Service based applications and real-time services; and
� broadband customer access network with support for both and mobile services.
NGNs deliver convergence between the traditional telephony networks and new data networks by carrying a full range of multimedia services on a common broadband digital connection to consumers. Further, the access-agnostic nature of the NGN, where 3G mobile telephony, optical fibre, cable and fixed wireless are viewed as alternative means of accessing the IP core network, has implications for fixed-to-mobile convergence. In particular, a number of carriers have begun to offer converged devices that use the mobile network away from home, and the user’s broadband link when at home to offer VoIP services.
Several innovations in networks and services have been introduced of late.
� Early 2008 saw the point at which Telstra’s ‘Next G’ network formally superseded the CDMA network. Those subscribing to the CDMA network were primarily living outside of metropolitan areas and so unable to use the GSM network. For this reason Telstra was prohibited from closing their CDMA network until it could be demonstrated that ‘Next G’ would continue to service these rural residents. The Minister announced the network could be closed on April 15, satisfied that Telstra had addressed the problems with the Next G network previously identified and that Telstra’s 3G ‘Next G’ Network is providing these rural customers with equivalent or better coverage and retail services compared to the CDMA network.
� In October 2006, 3 launched the ‘Skypephone’, offering free VoIP services on Skype-to-Skype calls and messages. This phone offered the first VoIP services available on a mobile anywhere in the world (Hutchison 2007).
� Even as improvements are made to 3G networks, 4G is coming ever closer to fruition. Late in 2007 Nokia Siemens Networks announced the successful trial of a long-term evolution (LTE) mobile broadband system with a theoretical maximum downlink of up to 173 Mbps. This trial also demonstrated that future LTE networks will be able to operate utilising existing base station sites (Meyer 2007).

Australian Mobile Telecommunications Industry
15
Innovation in handsets and technologies available to be utilised in handsets has also been prolific.
� A recent innovation that may soon become more widely used is the use of mobile phones for payments. Nokia announced in July 2006 that local trials of phones being used for this purpose had commenced, with the phone functioning in a similar manner to electronic tags for road tolls. Phones must be equipped with a near-field communications chip and an antenna to pick up radio frequency however the cost of the devices is expected to be only a few cents, so handset manufacturers should be easily able to incorporate this in every new device.
� The Microsoft Windows Mobile operating system has meant reduce the brand strength of BlackBerry in the internet-enabled mobile device market. Microsoft’s system has meant other telecommunications firms can produce smartphones built around this system, and Microsoft has built Windows mobile-compatible push email into their Exchange Server software. This software powers most company email systems, meaning work emails can more readily be accessed on the mobile device (Flynn 2008a).
� Initial security fears over accessing commercially sensitive information on mobile devices are now being addressed. The new 3G iPhone utilises the high levels of technology available, including the Microsoft system, with the added security of remote over-the-air wiping in the case of a lost or stolen device (Flynn 2008a). The 3G iPhone is to be available in Australia from 11 July 2008, with Optus and Vodafone confirmed as offering the handset.
3.2 INVESTMENTS MADE BY THE INDUSTRY
The mobile telecommunications industry is a capital-intensive one due to rapid technological advances and the requirements for building an extensive nationwide network infrastructure.
Initial 3G network investment
The first 3G network in Australia was launched by Hutchison in mid-April 2003 under the ‘3’ brand. By the middle of that year, Hutchison Australia had invested more than $1 billion with the total investment anticipated then to be in the order of $3 billion. Of this, $1 billion was required to build the network, including the $196.1 million paid to secure 2100 MHz spectrum licences for 3G.
Recent 3G investments
In October 2006, Telstra launched a new national 3G network investment using the lower 850MHz spectrum band, which was built in ten months. The network currently covers 98.8% of the Australian population. In January 2007, Optus also announced that it would invest up to $800 million to extend its 3G mobile communications network from 55% to 96% of the Australian population by December 2008, and invest a further $315 million extending the network to 98% by December 2009.
All carriers have also recently enabled, or are in the process of enabling, their 3G networks with the HSDPA standard. Today with an HSDPA-enabled device, Australian consumers can experience speeds of between 600 kilobits per second and 1.5 Mbps with a theoretical maximum speed of 3.6 Mbps.
Longer term upgraded networks will in theory support downlink speeds of up to 14.4 Mbps, and provides carriers with an upgrade path to offer enhanced data services in the future. For

Australian Mobile Telecommunications Industry
16
consumers, HSDPA will mean shorter service response times, fewer waits and faster connections, and an increased offering of interactive services and applications.
Planned investment
Optus recently announced plans to extend coverage of its 3G network, such that it will reach 98% of Australia’s population by the end of 2009. Under the plan, Optus will spend $315 million on building the infrastructure, which will use 900 MHz spectrum. Additionally, Optus is working on an upgrade of the 3G network which will see the current download speeds of 7.2 Mbps increase to 28 Mbps by late 2009. Further work with its strategic partners will make the network capable of speeds of up to 42 Mbps by mid 2010 (Optus 2008).
Telstra made a similar announcement in February, with plans to increase the speed of the Next G network to 21 Mbps by the end of 2008, with plans to further increase the speed by the end of 2009, to a theoretical maximum downlink of 41 Mbps (Best 2008).
Government investment
In August 2005, the Australian Government announced the $1.1 billion Connect Australia package, then the single largest investment in telecommunications services in the country, to improve broadband speeds and rollout, deliver better mobile phone coverage and help connect schools, hospitals and universities to the communications services they need.
However, the Australia Connected initiative, which was to include installation of 1361 broadband wireless sites using WiMax technology, has been cancelled by the Federal Government in favour of the nation-wide FTTN broadband rollout. The FTTN rollout will enhance internet speeds for fixed computer devices, which may at least temporarily lower the competitiveness of mobile devices in the internet market.
3.3 PRODUCTIVITY GAINS ENABLED
The advancement of mobile devices, although perceived by half of employed persons as increasing their workload, has led to improved workplace productivity. A survey commissioned by AMTA found that 55% of employed respondents believe mobile devices have increased their productivity (Wajcman 2007).
Anecdotal evidence suggests that mobile telephony has benefited business by allowing for small slivers of time to be made productive and for people to remain up-to-date with news and developments on projects in the work place, whilst out of the office and on the move. For example, IDC notes that responding to email is taking up an increasing amount of corporate user’s time, so being able to use mobile devices to respond to email when out of the office allows employees to be more time efficient and better at utilising gaps in their daily work schedule (IDC 2005). Further, a survey of BlackBerry users conducted for ACMA (2008b) found that the productivity gains for work, and the ability to better balance work and leisure commitments, were the most important benefits of internet-enabled mobile devices. The results of this survey are detailed in Figure 3-1.
There have been numerous case studies or examples of the impact that mobile telephony has on productivity of a particular business or firm. For example:
� Dural First National, a real estate agency with more than 3000 agents across Sydney, found that since using 3G phones running Loc3 — the first location-based mobile data service for the real estate industry — sales agents have saved at least two hours per day and become around 25 per cent more efficient. The technology does this by

Australian Mobile Telecommunications Industry
17
enabling agents to download, enter and send data at high-speed in the field and generate reports (AMTA 2005); and
� Leapfrog IT — a Perth-based payment system provider with 15 staff and a sales force of about 65 in Australia and New Zealand providing non-banking payment products such as loyalty cards and smartcards — maintains that it was able to boost the productivity of its staff by up to two hours a day since introducing PDA-style phones (Foreshew 2007).
FIGURE 3-1: BENEFITS AND DRAWBACKS OF BLACKBERRY USE , PER CENT OF RESPONDENTS
0 10 20 30 40 50 60
No Drawbacks
Cost
Awkward to use
Too bulky
Battery life
Constant calls/ emails
Intrudes in users personal life
No Benefit
Information organiser
Communication
Balance work and family better
Can work away from the office
Respond to emails quickly
Dra
wb
ack
sB
en
efi
ts
Per cent
Source: ACMA 2008b
Insofar as the aggregate productivity impacts throughout the economy, the Centre for Economics and Business Research (CEBR) conducted a study on labour productivity on behalf of the UK telecommunications firm O2, finding that, overall, mobiles increase UK labour productivity by almost 1%. Because of mobiles, UK workers can all work for around 20 minutes less each week to achieve the same output. From another perspective, if all mobile workers were able to use 5% more of their time out of the office productively, this would be the equivalent of an extra 180 million hours of work each year. In total, the CEBR estimated on behalf of O2 that the productivity benefits of mobile phones boosted UK GDP by £8.9 billion in 2004.
Increasingly, mobile devices are converging with ‘traditional’ computers. This convergence works both ways; just as the internet is available on mobile devices, so too Skype and similar programs are facilitating voice calls on computers. The line between what constitutes ‘mobile phones’ and ‘computers’ is becoming increasingly blurred as mobile devices approach the point where they are capable of performing all the functions of a laptop. Internet speeds on mobile devices are increasing as carriers continue to upgrade their networks, while advancements such as the Microsoft Office interface take advantage of existing workplace ‘learning by doing’ productivity gains. As the functionality and reliability of

Australian Mobile Telecommunications Industry
18
such computer-based features on mobile devices continues to increase, the productivity gains enabled will also further improve.

Australian Mobile Telecommunications Industry
19
4. THE ECONOMIC CONTRIBUTION OF THE INDUSTRY
The mobile telecommunications industry makes a substantial contribution to the overall Australian economy3. In addition to its direct contribution to aggregate output through value added by the industry, mobile telecommunications also benefit other industries and economic sectors by raising the labour productivity of workers. Access Economics has used its AE-GEM dynamic computable general equilibrium model to quantify the economy-wide impacts of falling mobile telecommunication prices and rising labour productivity resulting from increasing mobile penetration.
4.1 DIRECT CONTRIBUTION
The direct contributions of the telecommunications industry can be summarised as follows:
Value added – the contribution production in the sector makes to GDP – totalled $6.5 billion for the 2006-07 financial year. This is up 4.0% from $6.2 billion in 2005-06.
Employment in the sector totalled 22,386 full-time equivalent (FTE) persons for 2006-07; down 2.3% from the previous year.
The increase in value added in the sector is driven by higher wages to employees; 2006-07 saw a 19.9% increase in the total wage bill for the industry, totalling $1.8 billion. Earnings to capital have largely remained constant at around $4.6 billion.
Table 4-1 outlines the direct economic contribution of the sector for the last five financial years.
TABLE 4-1: INDUSTRY REVENUE AND VALUE ADDED , 2002-03 TO 2006-07 (2007 $M)4
2002-03 2003-04 2004-05 2005-06 2006-07 Industry revenue 11,757.8 12,267.7 13,381.2 13,676.7 14,500.1
Industry value added 5,751.6 5,952.4 6,266.8 6,218.9 6,470.3
Earnings to capital 4,288.1 4,440.1 4,661.6 4,687.8 4,634.0
Earnings to employees 1,463.5 1,512.3 1,605.3 1,531.0 1,836.3
Employment 21,405 22,216 23,685 22,923 22,386
Source: IBISWorld J7122 and J7123 and Access Economics estimates
3 Note this analysis takes account of mobile carriers and resellers. For example, the mobile handset industry is also an important contributor of value added and employment in Australia. However, data is presently unavailable to quantify the industry wide contribution. 4 The estimate of 2006 Industry gross product has changed from the previous Access Economics report (2007); this change arose because the figures from IBISWorld on which the estimates are based has been revised, and further, these figures have been adjusted to 2007 dollars.

Australian Mobile Telecommunications Industry
20
Output (revenue)
Output in the sector was valued at $14.5 billion for 2006-07, up 6.0% on the 2005-06 total of $13.7 billion. Figure 4-1 demonstrates the trend of high growth in industry revenue. Industry output has growth strongly in recent years; the 2006-07 result represents a total increase in output of 23.3% over five years.
Over the period 2002-03 to 2006-07, increases in revenue have been driven by a substantial increase in mobile telecommunications subscriptions, with the total number of mobile accounts increasing from 14.3 million at the end of 2002-03 to over 21 million mobile accounts in 2007. The high growth in subscription numbers has more than offset the downward pressure that falling prices for telephony services has had on revenue figures. Growth rates have eased of late, with year-on-year growth peaking in the 2004-05 financial year as the output of the sector grew by of 9.1%.
FIGURE 4-1: INDUSTRY REVENUE AND VALUE ADDED , 2002-03 TO 2006-07 (2007 $BN)
5.0
7.5
10.0
12.5
15.0
2003 2004 2005 2006 2007
$ b
illi
on
Industry revenue Industry value added
Source: IBISWorld J7122 and J7123 February 2008 and Access Economics estimates
Industry value added
The previous report (Access Economics 2007) outlined an industry value added in 2006 dollars of $5.8 billion for 2005-06. After adjustments for inflation and updates to the dataset (based upon changes made by the source, IBISWorld), this figure increases to $6.2 billion in 2007 dollars.
The combined industry value added of mobile network carriers and resellers in 2006-07 was $6.5 billion or 0.62 per cent of GDP in that year. This represents a real increase of 4.0% for the year. This is the second largest annual increase in recent years, after the exceptional performance of the industry in 2004-05, when industry value added grew 5.4%. The mobile

Australian Mobile Telecommunications Industry
21
telecommunications industry accounted for 25.6% of the total communications industries’ contribution to GDP (Figure 4-2) in 2006-07.
FIGURE 4-2: INDUSTRY VALUE ADDED , 2001-02 TO 2006-07
0
1000
2000
3000
4000
5000
6000
7000
2001-02 2002-03 2003-04 2004-05 2005-06 2006-07
Indu
stry
Val
ue A
dded
($m
)
20%
21%
22%
23%
24%
25%
26%
Pro
port
ion
of to
tal c
omm
unic
atio
ns IG
P
Carriers Resellers Carriers & resellers as proportion of communications industry
Source: IBISWorld, ABS 5204
Employee earnings are given by wages paid to those working in the mobile telecommunications industry. In 2006-07, the total wage bill for the mobile telecommunications industry was approximately $1.8 billion. This is an increase of almost 20% on the 2005-06 result. The increase in total wages paid is largely attributable to growth in wages paid to those working for mobile carriers; wages paid to employees of carriers increased by 21.9% in 2006-07. The smaller reseller firms have a far more stable wages bill, with variation of only a few million dollars from one year to the next. Table 4-2 details the total earnings of workers in the mobile telecommunications industry over the past five years.
TABLE 4-2: EARNINGS TO EMPLOYEES , 2002-03 TO 2006-07 (2007 $M)
2002-03 2003-04 2004-05 2005-06 2006-07 Earnings to employees 1,463.5 1,512.3 1,605.3 1,531 .0 1,836.3
Carrier 1,352.1 1,401.6 1,492.9 1,423.7 1,735.4
Reseller 111.4 110.7 112.4 107.3 100.9
Source: IBISWorld J7122 and J7123 February 2008 and Access Economics estimates
Earnings in the mobile telecommunications industry attributable to capital were $4.6 billion for 2006-07. In this report, earnings to capital have been derived as the residual of industry gross product once earnings to employees have been accounted for. The total earnings to capital in the industry have been highly stable in real terms over recent years, and also in

Australian Mobile Telecommunications Industry
22
terms of the share of total industry gross product, accounting for around three-quarters of the total.
Employment
Employment in the sector is estimated to be 22,386 employees FTE in 2006-07. This represents a fall of 2.3% in total number of employees for the year. As is to be expected, the vast majority of persons employed in the mobile telecommunications industry work for network carriers, with less than 10% of total employees working for resellers. Table 4-3 provides a breakdown of the share of total employment by carriers and resellers.
Both carriers and resellers have cut FTE staff for the last two years, even as the industry is growing at a rapid rate. Some of the fall in carrier staff numbers is attributable to an increase in outsourcing maintenance work to contractors, representing a shift to indirect contribution rather than direct contribution (Courier Mail 2007). A more significant factor, however, is increased labour productivity. The same telecommunications technology produced that is increasing total labour productivity is having the same effect within the industry itself, while mergers and acquisitions within the industry5 mean there is some level of ‘fat’ to be cut due to duplication of roles within the one firm.
TABLE 4-3: EMPLOYEES, BY CARRIERS AND RESELLERS , 2002-03 TO 2006-07
2003 2004 2005 2006 2007 Employment 21,404 22,215 23,685 22,923 22,386
Carrier 19,267 20,067 21,468 20,850 20,289
Reseller 2,138 2,149 2,217 2,073 2,097
Source: IBISWorld J7122 and J7123 February 2008 and Access Economics estimates
Payments to Government
Like all major industries, the mobile telecommunications industry engages with the Australian Government in myriad ways. For example, the industry contributes to government revenues through payments for spectrum allocation as well as through annual payments such as those relating to universal service obligation, the digital data service obligation and the National Relay Service, and carrier licences. Many of these payments are proportional to a carrier’s eligible revenue, which is based on the carrier’s gross sales revenue less a series of revenue and expense deductions.
Payments made by the mobile telecommunications industry to the Australian Government include one-off payments such as spectrum licences, and on-going payments such as annual spectrum access charges (encompassing the spectrum licence tax, universal service obligation and national relay service charges, numbering charges etc). Like businesses in other industries, those in the mobile telecommunications industry also pay corporate income taxes to the Australian Government and payroll taxes to State and Territory Governments.
The mobile telecommunications industry is required to make a number of industry-specific payments to government. Access Economics estimates that, in 2006-07, the value of these payments was $169.2 million. The portion of this total attributable to each type of payment is detailed in Table 4-4.
5 For example, Optus’ acquisition of Virgin Mobile and AAPT’s acquisition of PowerTel.

Australian Mobile Telecommunications Industry
23
In addition, the industry contributes to its effective operation through voluntary and compulsory payments to support various industry associations and self-regulatory schemes, including AMTA and the TIO.
TABLE 4-4: INDUSTRY PAYMENTS TO GOVERNMENT, 2006-076
Payment type Basis for calculating payment amount E stimated 2006-07 payment
($ million) Radiocommunications licence fee
61.6
Universal Service Obligation Eligible telecommunications revenue 50.3
National Relay Service Eligible telecommunications revenue 2.3
Licence fee for fixed service Number of fixed point-to-point installations 10.7
Numbering charge Quantity of mobile telephone numbers 38.2
Annual Carrier Licence Charge
Fixed sum plus eligible telecommunications revenue
6.1
Total 169.2
Source: Access Economics calculations based on data in ACMA 2008a
4.2 INDIRECT CONTRIBUTION
The economic impact of the mobile telecommunications industry extends beyond the revenues and value-added it generates, the workers it employs, and the wages paid out to these workers. Falling mobile phone service prices have increased consumer benefits from telecommunications. Furthermore, the ubiquity of mobiles has transformed the way businesses operate and their employees work in almost every industry and sector of the Australian economy. This means that the economic impact of the mobile telecommunications industry encompasses its flow-on impacts on all other industries. Access Economics has applied its in-house GE model, AE-GEM, to analyse the broader macroeconomic impacts of recent developments in mobile telecommunications. The key indirect effects modeled were falls in the price of mobile service delivery and labour productivity enhancements through the use of mobile phones in the economy.
Price declines
Strong competition in the mobile phone industry has led to cheaper mobile services. According to ACMA, in 2006-07 average call costs for residential customers fell by 0.8 per cent while those for business customers fell by 23.7 per cent. 2G customers received a 14.3 per cent reduction in calling costs in 2006-07, while call costs for 3G customers (a small proportion of total mobile users, but fast growing) increased - however the latter reflected the proportion of video calls made by 3G customers. The cheaper provision of mobile phone
6 For payments that are contingent on eligible telecommunications revenues, the 2006-07 figures were computed by applying the share of mobile payments in the 2005-06 figures to the total payments made by the telecommunications industry in 2006-07 and adjusting for the rise in the share of mobile telecommunications revenues in total telecommunications revenues between 2005-06 and 2006-07. Licence fees for fixed services were estimated by assuming that the growth rate for such fees were the same in 2006-07 as in 2005-06.

Australian Mobile Telecommunications Industry
24
services, the increasing take-up of capped price plans and plans with no up front payments for handsets, have contributed to the increasing uptake of mobile phones.
The first component of the analysis of indirect effects is the simulation of the historical price reductions achieved by mobile telecommunications service providers over the period 2001-2007 (Figure 4-3).
FIGURE 4-3: PRICE INDICES USED IN THE MODELLING EXERCISE
70
80
90
100
110
2001 2002 2003 2004 2005 2006 2007
Pric
e in
dex
(200
1 =
100)
Telecommunications Price Index PSTN Price Index Mobile Price Index
Source: ACCC, ACMA, Access Economics
Economic benefits – theory
The fall in price of mobile telecommunications services in Australian creates economic benefits for consumers of telecommunications services, as there will be:
� gains to consumers of mobile services; and
� gains to consumers of telecommunications services more generally through the price pressure that mobile services places on fixed-line services in Australia — that is, the competitive pressure on fixed services due to fixed-to-mobile substitution.
Therefore, the price decrease in mobiles services places downward pressure on the price of a basket of telecommunications services, and the price-quantity diagram below captures the economic benefits associated with such an effect.

Australian Mobile Telecommunications Industry
25
PT
QT 0
DT
0TP
MCT
a
b
c d
abcd = gain in allocative efficiency from decreasing prices for telecommunications services
1TP
0TQ 1
TQ
Decrease in the price of a basket of telecommunications services due to falling prices for mobile services.
The diagram adopts the following notation:
� DT denotes the demand curve for telecommunications services;
� MCT denotes the (constant) marginal cost to society associated with supplying telecommunications services;
� PT is the per-unit price of telecommunications services; and
� QT is the quantity of telecommunications services.
It illustrates that with a fall in the price of a basket of telecommunications services from 0TP to
1TP , there will be an increase in the demand for telecommunications services from 0
TQ to 1TQ .
As consumers value these additional units supplied from 0TQ to 1
TQ by the amount 0T
1TQabQ ,
and the cost to society of supplying these units is only 0T
1TQdcQ , the increase in supply
creates an overall increase in allocative efficiency equal to the red-shaded area abcd.
Productivity gains
Aside from mobile services being consumed, mobiles are also an input for many businesses across many different sectors of the economy. Studies, such as that by the CEBR on behalf of O2, suggest that mobiles have a positive impact on the productivity of workers, and this will lead to gains in productive efficiency across the economy. These gains augment those from lower costs of telecommunications to businesses due to falling mobile and fixed-line prices.
The figure below captures this effect, by illustrating the increase in efficiency associated with a productivity gain in a particular competitive sector of the economy.

Australian Mobile Telecommunications Industry
26
P
Q 0
D
P0
P1
Q0 Q1
MC0 a
b c
P0acP1 = gain in productive efficiency from declining mobile prices and increased labour productivity
MC1
abc = gain in allocative efficiency from decreasing prices in this competitive sector of the economy
Using similar notation to the previous section, but discarding the subscript T which was used to denote the telecommunications industry, the impact of mobiles on labour productivity in competitive sectors in the economy, is to decrease the marginal cost of production to society from MC0 to MC1, decrease the price from P0 to P1, and increase quantity from Q0 to Q1. The decrease in the cost of supplying Q0 units, leads to a gain in productive efficiency equal to the green-shaded rectangle area P0acP1, while the increase in quantity from Q0 to Q1 leads to a gain in allocative efficiency equal to red-shaded triangle area abc. Therefore, across each competitive market, the increase in productivity resulting from mobile telecommunications services generates an overall efficiency gain equal to area P0abP1.
Surveys conducted by Telstra indicated that on average, commercial users of the Next G™ network felt that their productivity had been improved on average by 9.3 per cent. The productivity improvements were quantified as estimated cost savings that the businesses using Next G™ have achieved in different areas (such as travel costs, administration costs and monitoring of staff costs)7. Earlier work by CEBR, on behalf of mobile phone provider O2, in the UK had estimated that, on average, each worker in the UK in 2004 saved 20 minutes per week from the use of mobile phones8.
The industry is rapidly growing, both in terms of overall subscriptions and the uptake of the 3G network. According to ACMA the number of 3G services in operation was 4.56 million at 30 June 2007, a staggering 192 per cent annual increase. Revenue from 3G services increased 251 per cent over the year 2006-079.
Based on these sources, Access has estimated productivity shocks taking into account the higher proportion of mobile data services in 2006-07, as shown by the rapid increase in 3G subscriptions.
7 Econtech, 2007. Productivity gains of Next GTM: results on the customer survey. Report to Telstra. 8 CEBR, 2006. An analysis of how mobile phone use contributes to business productivity. Report to O2. 9 Australian Communications and Media Authority 2008a, Communications Report 2006-07, ACMA, Melbourne

Australian Mobile Telecommunications Industry
27
Modelling results
The estimated economic impact of mobile telecommunications on the Australian economy was to raise economic growth as measured by GDP, in real terms, by $7.7 billion in 2007. That is to say, if mobile price levels had not fallen relative to the CPI from 2001, and there were no flow-on effects to PSTN prices or labour productivity, Australia’s GDP would have been $7.7 billion lower in 2007.
Australia’s economic welfare, measured by GNP, was projected to be $7.2 billion higher in 2007 than would otherwise have been the case.10 In addition, investment and employment were projected to be stronger as a result of mobile telecommunications. For example, mobile telecommunications were projected to increase employment by 43,000 FTEs in 2006. The productivity enhancing effects of mobile telecommunications also exerted downward pressure on prices (reflected in the projected decline in the CPI), while increasing real wages. The results of the GE modelling are found in Table 4-5.
TABLE 4-5: ECONOMIC IMPACTS IN 2007
Variable Change from reference values
($m)
Variable % deviation from reference case
Real GDP 7,735 Real GDP 1.47
Real GNP 7,155 Real GNP 1.35
Real Consumption 4,435 Real Consumption 1.39
Real Investment 3,556 Real Investment 3.29
Real Exports 55 Real Exports 0.05
Real Imports 1,579 Real Imports 1.55
Employment (000) 43 CPI -0.16
Real Wage 1.22
Employment 0.43
Source: Access Economics
All but one of these economic impacts has improved since the analysis for the year 2006 was undertaken (Access Economics 2007). The impact of mobile telecommunications on employment is lower in 2007 than in 2006, down 10,000 FTE workers. This decline is attributable to the increased productivity that technological advancements have facilitated; as the technology improves further it is possible to attain the same amount of output using fewer workers.
The total economic contribution of the mobile telecommunications industry is detailed in Figure 4-4. Combining the direct and indirect contributions, Access Economics estimates the mobile telecommunications industry contributed $14.2 billion to the Australian economy, that is, total GDP in Australia would have been $14.2 billion lower if the mobile telecommunications industry did not exist. Based upon the estimated Australian population at 30 June 2007 (ABS 2007), GDP per capita in Australia is $675 higher than would otherwise have been the case.
10 GDP measures the output produced in Australia and includes income generated by foreigners residing in Australia. GNP measures the output and income generated by Australians, including those living abroad.

Australian Mobile Telecommunications Industry
28
FIGURE 4-4: TOTAL ECONOMIC CONTRIBUTION OF MOBILE TELECOMMUNICAT IONS, 2007
$6.47 b
$7.73 b $14.20 b
0.0
2.0
4.0
6.0
8.0
10.0
12.0
14.0
16.0
Direct Contribution Indirect Contribution Total Contr ibution
$ bi
llion
Source: Access Economics
Access Economics has also produced a forward estimate of the economy-wide benefits flowing from a projected increase in mobile data use made possible by 3G networks. While there is no new empirical evidence behind the specific parameters that have been chosen in this scenario, the simulation has been designed to illustrate the possible scale of the economy-wide benefits of further improvements in labour productivity from new services offered by mobile telecommunications.
In this simulation, it is assumed that the ability to access and exchange complex data and other information while on the move saves skilled workers who possess the enabling mobile technology (such as a subscription to a 3G network and a smartphone) an additional 20 minutes per week.
As can be seen in Table 4-6 and Figure 4-5, the total benefits from mobile voice and data, as measured by GDP, is estimated to rise from approximately $8.1 billion in 2008 to $9.3 billion in 2010. By 2010, it is estimated that the increased uptake of 3G will contribute $2.1 billion towards this figure, in additional GDP.

Australian Mobile Telecommunications Industry
29
TABLE 4-6: ECONOMIC IMPACTS OF MOBILE VOICE AND DATA (DEVIATION FROM REFERENCE CASE), 2008-2010
Variable 2008 2009 2010 % deviation from reference case Real GDP 1.50 1.56 1.65
Real GNP 1.33 1.35 1.40
Real Consumption 1.39 1.42 1.48
Real Investment 2.99 2.84 2.79
Real Exports 0.35 0.61 0.84
Real Imports 1.41 1.32 1.29
Employment -0.26 -0.35 -0.42
Change from reference case Real GDP ($b) 8.08 8.57 9.27
Real GNP ($b) 7.25 7.52 8.02
Real Consumption ($b) 4.56 4.76 5.08
Real Investment ($b) 3.35 3.23 3.22
Real Exports ($b) 0.39 0.69 0.98
Real Imports ($b) 1.48 1.42 1.41
Employment (000) 30 23 21
Source: Access Economics
FIGURE 4-5: BENEFITS FROM MOBILE VOICE AND DATA , 2008-2010
0
1,000
2,000
3,000
4,000
5,000
6,000
7,000
8,000
9,000
10,000
2008 2009 2010
$ m
illio
n
Real GDP Real Consumption Real Investment Real Exports Real Imports
Source: Access Economics

Australian Mobile Telecommunications Industry
30
5. REFERENCES
Access Economics 2007, Australian Mobile Telecommunications Industry: Economic Significance and State of the Industry, July, Canberra
Australian Bureau of Statistics 2007, Australian Demographic Statistics, June quarter 2007, Cat. No. 3101.0, ABS, Canberra
Australian Communications and Media Authority 2008a, Communications Report 2006-07, ACMA, Melbourne
Australian Communications and Media Authority 2008b, Telecommunications Today, Report 5: Consumer choice and preference in adopting services, ACMA, April, Melbourne
Australian Mobile Telecommunications Association 2005, Third Generation Mobile Networks in Australia — Broadband for your Mobile Phone, AMTA, Canberra
Best J 2008, “Telstra Next G jumping to 21 Mbps in 2008”, ZDNet.com.au, February 12
CEBR, 2006. An analysis of how mobile phone use contributes to business productivity. Report to O2.
Courier Mail 2007, “Telstra ‘bleeding staff’ with cuts’, The Courier Mail, October 30
Dodd AZ 2002, The Essential Guide to Telecommunications 3rd Edition, Prentice Hall
Econtech 2007. Productivity gains of Next GTM: results on the customer survey. Report to Telstra.
Flynn D 2008a, “Where to now for the BlackBerry?”, The Age, May 20
Flynn 2008b, “Finding time to get out of the inbox trap”, The Age, May 6
Foreshew J 2007, “Cutting Wires Slashes Costs”, The Australian, Jennifer Foreshew, May 8
IBISWorld 2008, Mobile Telecommunications Carriers in Australia, Report J7122, February
IBISWorld 2008, Telecommunications Resellers in Australia, Report J7123, February
IDC 2005, Corporate Mobile Email in Western Europe 2004-2009, September
Meyer D 2007, “Coming soon: 173 Mbps on your mobile”, ZDNet.com.au, December 21
Optus 2008, Optus sets new milestone with the expansion of mobile network coverage to 98 per cent, Media Release, May 7
Wajcman J, Bittman M, Jones P, Johnstone L, Brown J 2007, The Impact of the Mobile Phone on Work/Life Balance, AMTA/ANU, June, Canberra