industry mix, plant turnover and productivity growth: … · the electronic and electrical product...
TRANSCRIPT

Industry Mix, Plant Turnover and Productivity Growth: A Case Study of the Electronic and Electrical Product Manufacturing Industry
Kelvin Ka Yin Chan, Industry Canada Wulong Gu, Statistics Canada Jianmin Tang, Industry Canada Working Paper 2014-05
ECONOMIC RESEARCH AND POLICY ANALYSIS BRANCH
Working Paper Series

This publication is also available online in HTML: http://www.ic.gc.ca/eic/site/eas-aes.nsf/eng/h_ra02326.html. To obtain a copy of this publication or an alternate format (Braille, large print, etc.), please contact: Economic Research and Policy Analysis Branch Industry Canada C.D. Howe Building 235 Queen Street Ottawa, ON Canada K1A 0H5 Telephone: 343-291-2627 Facsimile: 613-991-1261 and E-mail: [email protected]
Permission to Reproduce Except as otherwise specifically noted, the information in this publication may be reproduced, in part or in whole and by any means, without charge or further permission from Industry Canada, provided that due diligence is exercised in ensuring the accuracy of the information reproduced; that Industry Canada is identified as the source institution; and that the reproduction is not represented as an official version of the information reproduced, nor as having been made in affiliation with, or with the endorsement of, Industry Canada. For permission to reproduce the information in this publication for commercial purposes, please contact the: Web Services Centre Industry Canada C.D. Howe Building 235 Queen Street Ottawa, ON Canada K1A 0H5 Telephone (toll-free in Canada): 1-800-328-6189 Telephone (Ottawa): 613-954-5031 Fax: 613-954-2340 TTY (for hearing-impaired): 1-866-694-8389 Business hours: 8:30 a.m. to 5:00 p.m. (Eastern Time) Email: [email protected] © Her Majesty the Queen in Right of Canada, represented by the Minister of Industry, 2014 Cat. No. Iu172-1/2014-5E-PDF ISBN 978-1-100-25178-3
Aussi offert en français sous le titre Composition de l'industrie, renouvellement des établissements et croissance de la productivité : étude de cas sur l'industrie de la fabrication de produits électroniques et électriques.
Industry Mix, Plant Turnover and Productivity Growth: A Case Study of the Electronicand Electrical Product Manufacturing Industry
The views and opinions expressed in the research paper are those of the authors alone and do notrepresent, in any way, the views or opinions of the Department of Industry, Statistics Canada or of theGovernment of Canada.
*
Kelvin Ka Yin Chan,Industry Canada
Wulong Gu,Statistics Canada
Jianmin Tang,Industry Canada
July 2011
Abstract
Labour productivity growth in the Canadian electronic and electrical product manufacturing industry declined,from 21% per year in the period 1997–2000, to negative 4% per year in the period 2000–2006. This paperinvestigates if the restructuring and the reallocation of market share and resources within the industryfollowing the bursting of the tech bubble in 2000 contributed to the slowdown in productivity growth. Thereallocation may be a result of change in the composition of constituent sub-industries (industry mix), theentry of new firms and the exit of existing firms, and/or the growth and decline in continuing firms. Thispaper shows that the slowdown in productivity growth in the Canadian electronic and electrical productindustry was mainly due to weaker productivity performance of the sub-industries, which can largely betraced to the decline in labour productivity growth of continuing plants. It finds that the reallocation hadsome impact, but it was not the primary factor behind the decline. Finally, the paper shows that even if theCanadian industry mix were the same as the U.S. industry mix over this period, the productivity growthprofile of the Canadian electronic and electrical product manufacturing industry would not change.
We would like to thank John Baldwin, Jay Dixon, Someshwar Rao, Annette Ryan, Larry Shute, and Weimin Wang forsupport, comments and suggestions over the course of this research.
*
1

Table of Contents
Introduction1.
Methodology
2.1. Industry Mix and Productivity Performance
2.2. Plant Turnover and Productivity Performance
2.
Data and Measurement Issues
3.1. Data Sources
3.2. Data Adjustments
3.
A Profile of the Electronic and Electrical Product Manufacturing Industry in Canada and the United States4.
Empirical Findings on the Industry Mix Effect5.
Empirical Findings on the Plant Turnover Effect in Canada
6.1. Plant Turnover in the Canadian Electronic and Electrical Product Industry
6.2. The Productivity Effect of Plant Turnover
6.
Concluding Remarks7.
References
Tables
Charts
2

1. Introduction
The electronic and electrical product manufacturing industry, which consists of computer and electronic productmanufacturing (NAICS 334) and electrical equipment manufacturing (NAICS 335) is one of the most dynamic,skill intensive and innovative manufacturing industries (Chart 1). With its unprecedented technological progress,especially in computers and electronics, it contributed significantly to aggregate productivity growth in Canada inthe pre-2000 period (Ho, Rao and Tang, 2004).
However, the productivity performance of this industry in Canada has deteriorated substantially since 2000.According to a recent study by Tang, Rao and Li (2010), output per hour worked was falling 3.0% per year in theperiod of 2000–2008, compared to a positive growth rate of 7.8% per year in the period 1987–2000, a differenceof more than 10 percentage points between the two periods. Baldwin and Gu (2009) show that electronic productmanufacturing made the largest contribution to the decline in labour productivity growth in the manufacturingsector between the 1988–2000 and 2000–2005 periods, accounting for 0.2 percentage points of the 2.4percentage point slowdown in aggregate manufacturing labour productivity growth.
The Canadian industry has also underperformed its U.S. counterpart after 2000. Hao, et al. (2008) find thatCanadian labour productivity in the electronics and electrical product industry fell from 86% of the U.S.productivity level in 2000 to 36% in 2004. The relatively poor productivity growth in this industry, versus theUnited States, is an important factor underlying the widening Canada-U.S. productivity gap in the manufacturingsector, as well as in the business sector as a whole (Chart 2).
Research shows that reallocation of output and resources within the industry contributed to productivity growth inaggregation. Some of the reallocation may be due to a change in the composition of constituent sub-industries(or industry mix). Some may be due to firm turnover as a result of the entry of new firms, the exit of existingfirms, and reallocation of resources and output between incumbent firms.
Nadeau and Rao (2002) find that part of the reason for Canada's slower productivity growth in the manufacturingsector as a whole versus the United States before 2000 was that Canada was less successful than the UnitedStates in shifting resources towards activities with higher productivity and more rapid productivity growth. Inaddition, they show that Canada's weaker performance was partly due to the fact that Canada was heavilydependent on resource-based manufacturing industries, which were characterized by relatively moderate rates ofproductivity growth, while the United States enjoyed the benefits from a high concentration of dynamic industriessuch as computer and electronic manufacturing.
Productivity growth at the industry level is ultimately driven by growth taking place at the firm/plant level and bythe competitive process that constantly shifts market share from the exits to the entrants and/or from decliningfirms to growing firms. Baldwin and Gu (2004) show the main source of productivity growth in mostmanufacturing industries is the competitive process or plant turnover that shifts output shares toward the plantsthat are more productive. Beckstead and Brown (2005) find that the Canadian information and communicationtechnology industry, for example, maintained firm entry and exit rates higher than the manufacturing sectoraverage, both during and after the bursting of the tech bubble in 2000.
This paper examines the contributions of structural shifts and firm dynamics to Canada's weaker productivitygrowth in the electronic and electrical product manufacturing industry. It first asks how much of the industry'sweaker productivity growth, both in the 2000s and relative to its U.S. counterpart, was due to shift in industrymix and how much was due to weaker productivity growth at the sub-industry level. It then traces the decline inproductivity growth at the sub-industry level in Canada into slower productivity growth at the plant level and achange in plant dynamics due to entry and exit as well as reallocation among continuing plants.
This paper concerns only labour productivity as investment or capital stock data at the plant level are notavailable in Canada. 1 The analyses are conducted in a value-added framework with labour productivity beingdefined as value added per hour worked.
The structure of the paper is as follows. In section 2, we present the analytical frameworks for the analysis of theimpacts of industry structural shift and plant dynamics on labour productivity growth. In section 3, we discussdata and measurement issues. In sections 4 and 5, we discuss the empirical findings of the industry mix effect
3
and plant turnover effect on productivity growth of the industry. The final section, section 6, summarizes the keyfindings of the paper and discusses possible reasons for the productivity growth slowdown in the industry.
2. Methodology
In this section, we present the methodology for the analysis of the impacts of industry structural shift and plantdynamics on labour productivity growth.
2.1. Industry Mix and Productivity Performance
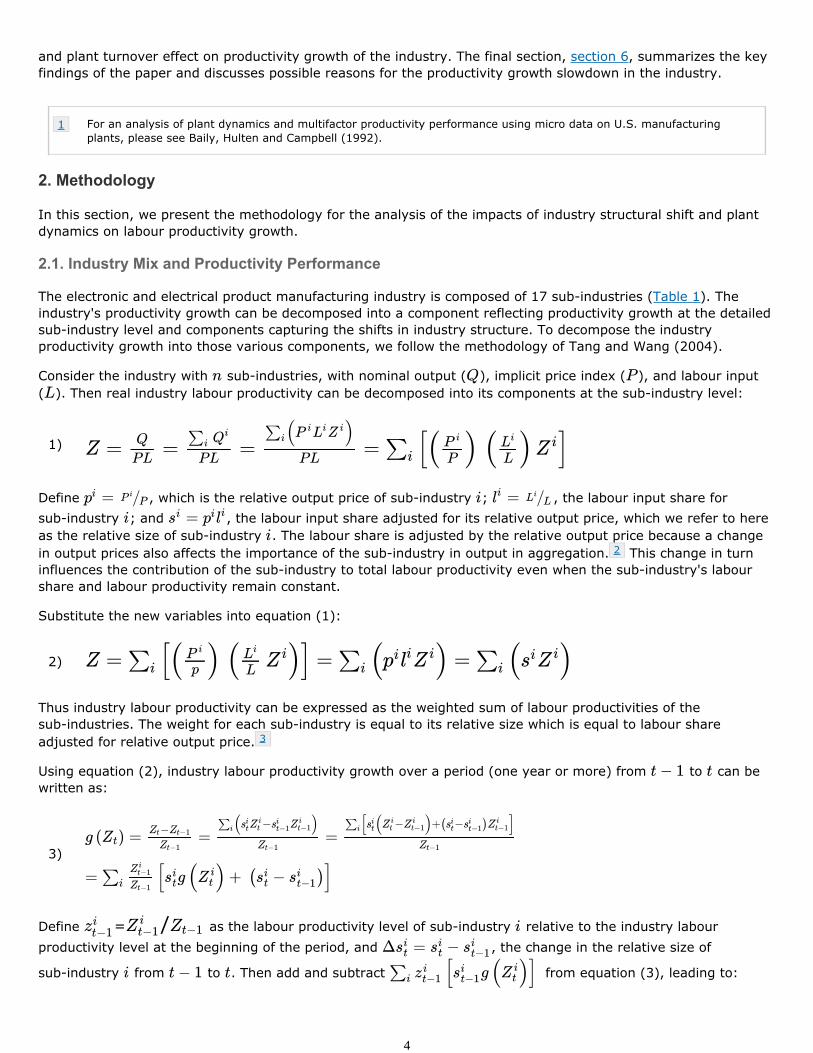
The electronic and electrical product manufacturing industry is composed of 17 sub-industries (Table 1). Theindustry's productivity growth can be decomposed into a component reflecting productivity growth at the detailedsub-industry level and components capturing the shifts in industry structure. To decompose the industryproductivity growth into those various components, we follow the methodology of Tang and Wang (2004).
Consider the industry with sub-industries, with nominal output ( ), implicit price index ( ), and labour input( ). Then real industry labour productivity can be decomposed into its components at the sub-industry level:
1)
Define , which is the relative output price of sub-industry ; , the labour input share forsub-industry ; and , the labour input share adjusted for its relative output price, which we refer to hereas the relative size of sub-industry . The labour share is adjusted by the relative output price because a changein output prices also affects the importance of the sub-industry in output in aggregation. 2 This change in turninfluences the contribution of the sub-industry to total labour productivity even when the sub-industry's labourshare and labour productivity remain constant.
Substitute the new variables into equation (1):
2)
Thus industry labour productivity can be expressed as the weighted sum of labour productivities of thesub-industries. The weight for each sub-industry is equal to its relative size which is equal to labour shareadjusted for relative output price. 3
Using equation (2), industry labour productivity growth over a period (one year or more) from to can bewritten as:
3)
Define = / as the labour productivity level of sub-industry relative to the industry labourproductivity level at the beginning of the period, and , the change in the relative size of
sub-industry from to . Then add and subtract from equation (3), leading to:
For an analysis of plant dynamics and multifactor productivity performance using micro data on U.S. manufacturingplants, please see Baily, Hulten and Campbell (1992).
1
4
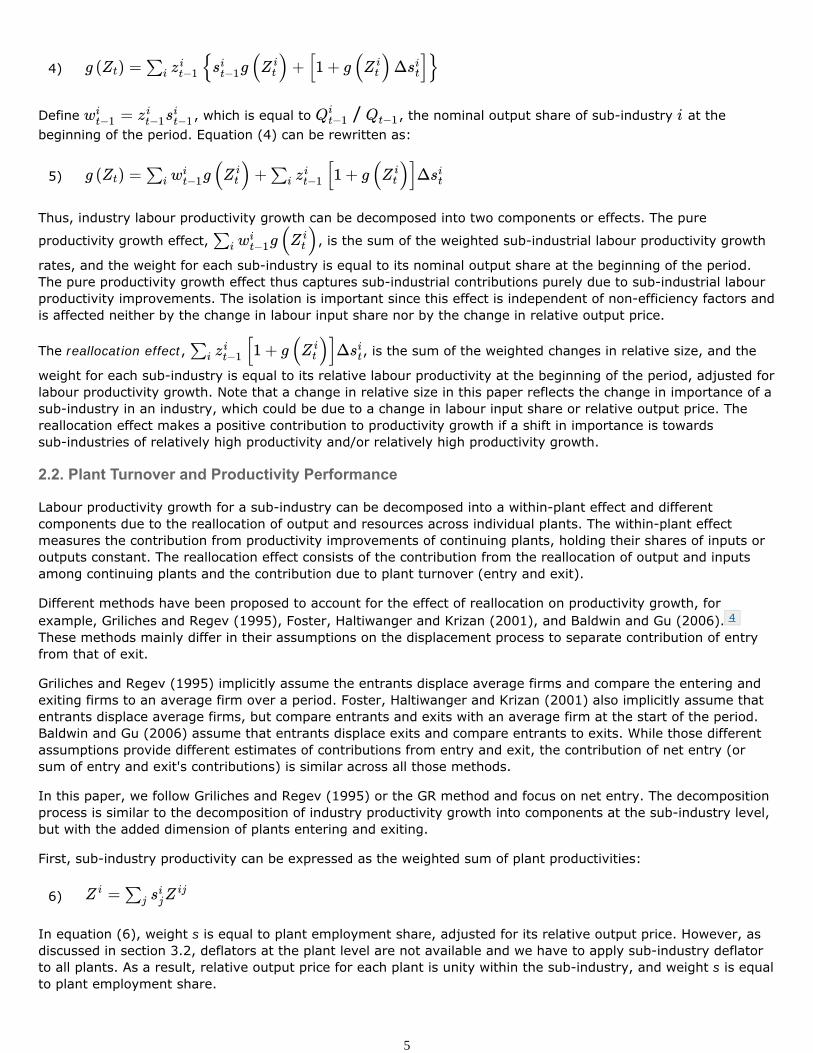
4)
Define , which is equal to / , the nominal output share of sub-industry at thebeginning of the period. Equation (4) can be rewritten as:
5)
Thus, industry labour productivity growth can be decomposed into two components or effects. The pure
productivity growth effect, , is the sum of the weighted sub-industrial labour productivity growth
rates, and the weight for each sub-industry is equal to its nominal output share at the beginning of the period.The pure productivity growth effect thus captures sub-industrial contributions purely due to sub-industrial labourproductivity improvements. The isolation is important since this effect is independent of non-efficiency factors andis affected neither by the change in labour input share nor by the change in relative output price.
The reallocation effect, , is the sum of the weighted changes in relative size, and the
weight for each sub-industry is equal to its relative labour productivity at the beginning of the period, adjusted forlabour productivity growth. Note that a change in relative size in this paper reflects the change in importance of asub-industry in an industry, which could be due to a change in labour input share or relative output price. Thereallocation effect makes a positive contribution to productivity growth if a shift in importance is towardssub-industries of relatively high productivity and/or relatively high productivity growth.
2.2. Plant Turnover and Productivity Performance
Labour productivity growth for a sub-industry can be decomposed into a within-plant effect and differentcomponents due to the reallocation of output and resources across individual plants. The within-plant effectmeasures the contribution from productivity improvements of continuing plants, holding their shares of inputs oroutputs constant. The reallocation effect consists of the contribution from the reallocation of output and inputsamong continuing plants and the contribution due to plant turnover (entry and exit).
Different methods have been proposed to account for the effect of reallocation on productivity growth, forexample, Griliches and Regev (1995), Foster, Haltiwanger and Krizan (2001), and Baldwin and Gu (2006). 4
These methods mainly differ in their assumptions on the displacement process to separate contribution of entryfrom that of exit.
Griliches and Regev (1995) implicitly assume the entrants displace average firms and compare the entering andexiting firms to an average firm over a period. Foster, Haltiwanger and Krizan (2001) also implicitly assume thatentrants displace average firms, but compare entrants and exits with an average firm at the start of the period.Baldwin and Gu (2006) assume that entrants displace exits and compare entrants to exits. While those differentassumptions provide different estimates of contributions from entry and exit, the contribution of net entry (orsum of entry and exit's contributions) is similar across all those methods.
In this paper, we follow Griliches and Regev (1995) or the GR method and focus on net entry. The decompositionprocess is similar to the decomposition of industry productivity growth into components at the sub-industry level,but with the added dimension of plants entering and exiting.
First, sub-industry productivity can be expressed as the weighted sum of plant productivities:
6)
In equation (6), weight s is equal to plant employment share, adjusted for its relative output price. However, asdiscussed in section 3.2, deflators at the plant level are not available and we have to apply sub-industry deflatorto all plants. As a result, relative output price for each plant is unity within the sub-industry, and weight s is equalto plant employment share.
5
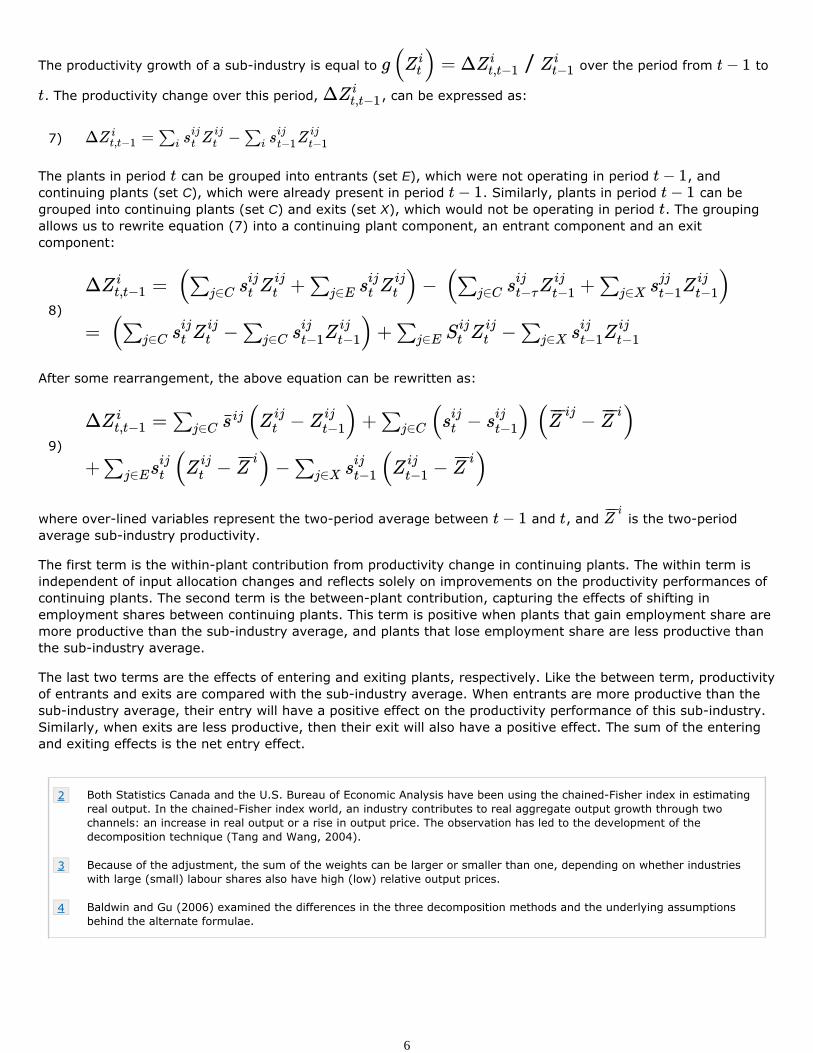
The productivity growth of a sub-industry is equal to over the period from to
. The productivity change over this period, , can be expressed as:
7)
The plants in period can be grouped into entrants (set E), which were not operating in period , andcontinuing plants (set C), which were already present in period . Similarly, plants in period can begrouped into continuing plants (set C) and exits (set X), which would not be operating in period . The groupingallows us to rewrite equation (7) into a continuing plant component, an entrant component and an exitcomponent:
8)
After some rearrangement, the above equation can be rewritten as:
9)
where over-lined variables represent the two-period average between and , and is the two-periodaverage sub-industry productivity.
The first term is the within-plant contribution from productivity change in continuing plants. The within term isindependent of input allocation changes and reflects solely on improvements on the productivity performances ofcontinuing plants. The second term is the between-plant contribution, capturing the effects of shifting inemployment shares between continuing plants. This term is positive when plants that gain employment share aremore productive than the sub-industry average, and plants that lose employment share are less productive thanthe sub-industry average.
The last two terms are the effects of entering and exiting plants, respectively. Like the between term, productivityof entrants and exits are compared with the sub-industry average. When entrants are more productive than thesub-industry average, their entry will have a positive effect on the productivity performance of this sub-industry.Similarly, when exits are less productive, then their exit will also have a positive effect. The sum of the enteringand exiting effects is the net entry effect.
Both Statistics Canada and the U.S. Bureau of Economic Analysis have been using the chained-Fisher index in estimatingreal output. In the chained-Fisher index world, an industry contributes to real aggregate output growth through twochannels: an increase in real output or a rise in output price. The observation has led to the development of thedecomposition technique (Tang and Wang, 2004).
2
Because of the adjustment, the sum of the weights can be larger or smaller than one, depending on whether industrieswith large (small) labour shares also have high (low) relative output prices.
3
Baldwin and Gu (2006) examined the differences in the three decomposition methods and the underlying assumptionsbehind the alternate formulae.
4
6

3. Data and Measurement Issues
This section provides the data sources for our analyses, and deals with measurement issues associated with thedata.
3.1. Data Sources
We make use of the data collected by the Census of Manufactures programs in Canada and the United States.Both programs are quite similar in how they collect data on outputs and inputs.
The Canadian data comes from a longitudinal file that was constructed from the micro-records of StatisticsCanada's Annual Survey (Census) of Manufactures (ASM). The file covers the entire Canadian manufacturingsector using both survey and administrative data, and permits plants and firms to be followed over time. Itcollects data on manufacturing value added and employment, together with other variables, for about 54,000manufacturing plants, of which about 3,200 plants are in the electronic and electrical product manufacturingindustry.
For the United States, we obtain data for total value added and employment from the U.S. Census Bureau. Thesedata are at the very detailed industry level (six-digit NAICS level). They are also aggregated from the micro-records of the U.S. ASM administrated by the U.S. Census Bureau. Note, however, unlike in Canada, that thevalue added for the United Statesis total value added, which consists of both manufacturing value added andvalue added from merchandising operations (i.e., the difference between the sales value and the cost ofmerchandise sold without further manufacture, processing, or assembly).
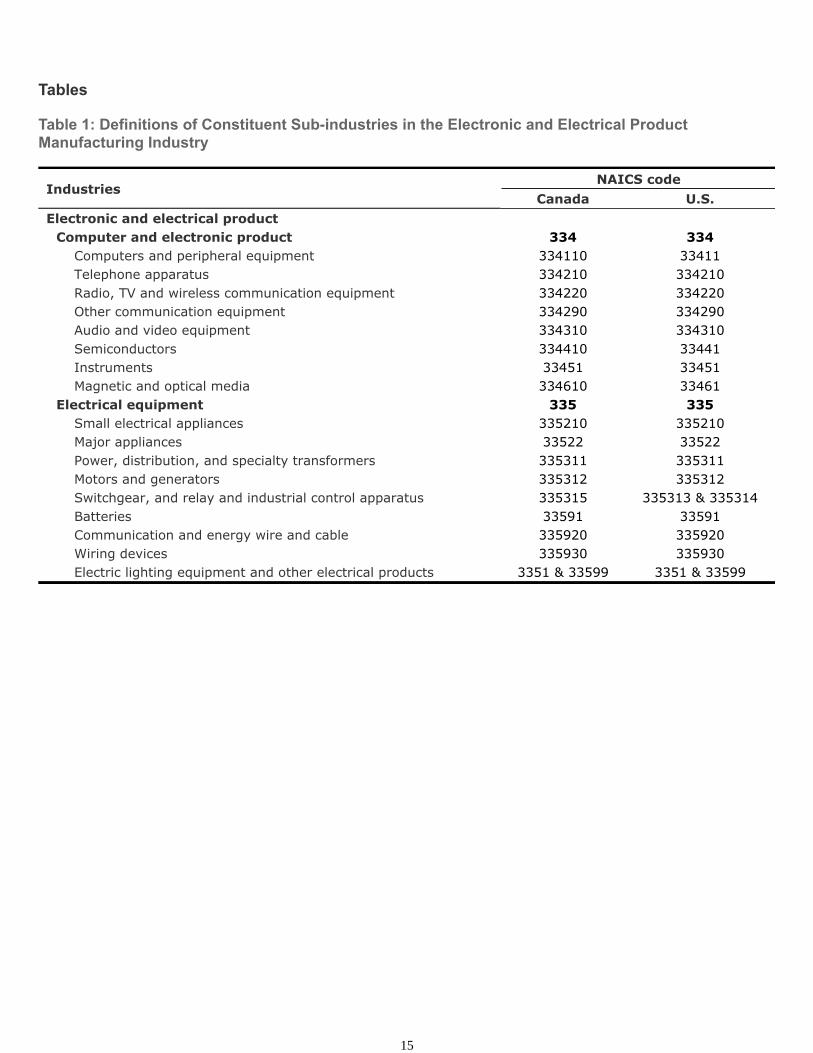
The electronic and electrical product manufacturing industry consists of computer and electronic productmanufacturing (NAICS 334) and electrical equipment manufacturing (NAICS 335). For this paper, we divide thetwo manufacturing industries into 17 sub-industries, at five or six-digit NAICS level, which is the most-detailedindustry level that meets the Statistics Canada confidentiality policy (Table 1).
For our analysis, we choose the period of 1997–2006, for which we have data for both Canada and the UnitedStates The industry mix and plant turnover effects on productivity growth are examined for two periods:1997–2000 and 2000–2006. We use 2000 as a dividing point to contrast trends before and after the burst of thehigh-tech bubble.
3.2. Data Adjustments
To improve the comparability over time and between the two countries, we made several adjustments to theindustry level data obtained from the ASM data for both Canada and the United States.
First, the ASM data may not be entirely comparable over time due to changes in industry classification (e.g., from1997 NAICS to 2002 NAICS) and in sampling methodology. For instance, for Canada, the micro-records of theASM for the 1997–1999, the 2000–2003, and the 2004–2006 sub-periods are drawn from different populations.
Second, "value-added" from the ASM is often referred to as "census value-added," and is inclusive of paymentsfor purchased services, which is part of intermediate inputs for production. Including purchased service in theanalysis has a significant effect, since the increased trend in outsourcing in services activities in themanufacturing sectors and the development may differ between Canada and the United States. In addition,census value-added does not include the output from those who are self-employed.
Third, as discussed in section 3.1, "value added" for Canada is manufacturing value added and for the UnitedStates, it is total value added, which also includes value added from non-manufacturing activities, i.e.,merchandising operations.
Finally, the number of employees from the Census of Manufactures is not exactly equal to the number ofemployees used by the statistical agencies to produce the official productivity statistics, and it needs to add thosethat are classified as being self-employed. In addition, we need to adjust part-time and full-time employment tohours worked to reflect the change in work intensity over time.
7

To make these adjustments, we benchmark the industry employment and value-added obtained from the ASM tothe data on hours worked and value-added from Statistics Canada's productivity program for Canada (CANSIMtables 383-0021 and 383-0009). 5 For the United States, the data from the U.S. ASM are benchmarked to thedata on value-added and employment from the industry accounts of the U.S. Bureau of Economic Analysis (valueadded) and the U.S. Bureau of Labor Statistics (hours worked for all persons). Due to data availability, theadjustment is made at the four-digit level for Canada and at the three-digit level for the United States.
The adjustments at the industry level for both Canada and the United States are in Table 2. The benchmarkingadjustment has little effect on the growth rates of value added and labour for Canada. For the United States theadjustment has little effect on the growth rates of value added. But it affects the growth of labour for the UnitedStates. The growth of hours worked from the U.S. BEA is higher than the growth of employment obtained fromthe ASM. This partly reflects the increased work intensity in the United States in the industry over this period.
The adjustment has an effect on the level of the output as the value added from the ASM includes the cost ofpurchased services, while the value-added from the industry accounts or productivity program excludes the costof purchased services. The ratio of the value added from the national accounts to the value-added from the ASMis larger in Canada as the ASM value added for the United States is total value added while it is manufacturingvalue added for Canada. The ratio of the benchmarking hours worked to the employment from the ASM is lowerin Canada than in the United States, since Canadian workers tend to work shorter hours than their U.S.counterparts.
For real value added, we need value added price deflators to deflate nominal value added. The price deflators arenot available at the plant-level or the detailed industry level as in Table 1. So we have to rely on price deflators ata more aggregated industry level. For the United States, we use deflators at the three-digit NAICS level:computers and electronic products (334) and electric products (335), which are from U.S. Bureau of EconomicAnalysis. For Canada, the deflators are at four-digit NAICS or combined four-digit NAICS industry level fromStatistics Canada.
4. A Profile of the Electronic and Electrical Product Manufacturing Industry in Canada and theUnited States
In Canada, the computer and electronic product industry was more productive than the electrical equipmentindustry (Table 3). In 2006, the computers and electronics industry was 12% more productive than the industryaverage while the electrical equipment industry was 25% less productive.. 6 The most productive sub-industrywas the computer and peripheral equipment industry.
The productivity profile of the electronic and electrical product industry in the United States was generally similarto that in Canada. However, the productivity difference between the computers and electronic product industryand the electrical equipment was even larger. In 2006, the U.S. computer and electronic product industry was38% more productive than the industry average while the electric equipment industry was 76% less productive. The most productive sub-industry was telephone apparatus, followed by the computer and peripheral equipmentindustry.
The electronic and electrical product manufacturing industry is smaller in Canada than in the United States. Itaccounted for about 7.5% of hours worked in the Canadian manufacturing sector in 2008 and the share has beenfairly stable since 1997. In terms of nominal value added, however, its share declined from 7.7% in 1997 to 6.2%in 2008. In contrast, the industry is much more important for the U.S. manufacturing sector where it accountedfor more than 12% of hours worked and nominal value added in 2007.
In Canada, the computers and electronic product sub-industry made up more than two thirds of nominal valueadded, while electrical equipment made up less than one third (Table 3). Of these 17 sub-industries, only threesub-industries produced more than ten percent of nominal value added in 2006. They were radio, TV, andwireless communication equipment (11.0%), semiconductors (13.7%), and instruments (21.7%).
For comparison, the benchmarking value added in basic prices for Canada is adjusted to value added at factor cost.Similarly, for the United States, value added in market prices is adjusted to value added at factor cost.
5
8

In the United States, computer and electronic product manufacturing was larger than electrical equipmentmanufacturing, making up 72.2% of the output in 2006, while for Canada, it was 66.6%. In particular, the U.S.semiconductors sub-industry was much larger and had a share of 23.9% in 2006, while, in Canada its share was13.7%. On the other hand, the radio, TV and wireless communication equipment sub-industry in the UnitedStates was relatively smaller than in Canada, with the output share being 6.1% and 11.0%, respectively.
It is interesting to note that the value added share for telephone apparatus as well as for semiconductors declinedsubstantially in Canada from 2000 to 2006. The value added share for telephone apparatus declined from 24.5%in 2000 to 4.6% in 2006. Similarly, for semiconductor, the share decreased from 20.0% to 13.7%. At the sametime, radio, TV and wireless communication equipment as well as instruments in Canada saw their shares morethan doubled from 5.0% in 2000 to 11.0% in 2006 and from 11.0% to 21.7%, respectively.
As in Canada, telephone apparatus as well as semiconductor in the United States also experienced a decline invalue added share, but the decline was more moderate (from 10.1% to 4.6% for telephone apparatus and from29.6% to 23.9% for semiconductor). Also like Canada, the United States also saw its value added share forinstruments increased from 17.0% to 23.7% over this period.
In both countries, there were also important shifts in industry structure in terms of employment share, althoughthey were more moderate than the changes in value added share. The employment shift was mainly within thecomputer and electronic product industry after 2000 (Table 4). Both countries experienced a decline inemployment share in computer and peripheral equipment, telephone apparatus, and semiconductors. In Canada,the lost employment share was picked up mainly by radio, TV and wireless communications equipment andinstruments while in the United States, it was taken over by instruments.
In terms of relative size, which also takes into account of the relative output price of a sub-industry, the declinein importance of computer and electronic product manufacturing was more pronounced, especially in the UnitedStates. This is because the differences in relative output prices between computer and electronic product andelectrical equipment were much smaller in Canada than in the United States. It reflects a much faster decline inthe output prices of computer and electronic products in the United States than in Canada over the time period.
5. Empirical Findings on the Industry Mix Effect
We now apply the Tang and Wang (2004) decomposition to productivity changes in the Canadian and U.S.electronic and electrical product industry over 1997–2000 and 2000–2006. We first discuss the Canadianexperiences and then compare them to the United States.
Canada
As shown in Table 5, the productivity changes in the Canadian electronic and electrical product industry in thosetwo periods were dominated by pure productivity changes within constituent sub-industries and the reallocationeffect was small.
In 1997–2000, the industry productivity increased by 21.1% per year. Pure productivity growth was the primaryfactor, accounting for 90% of the total productivity growth. Computer and electronic product manufacturingaccounted for 77% of the growth, again primarily driven by pure productivity growth.
Among the sub-industries, semiconductors accounted for 29% of the industry productivity growth, followed bytelephone apparatus accounting for 27%. It is interesting to note that the computers and peripheral equipment,which experienced the largest productivity growth over this period, had a minimal contribution. This was becauseits large pure productivity growth effect was offset by a large negative relative size change effect, due to asubstantial decline in relative output price and to a lesser extent to the decline in its employment share.
In 2000–2006, the industry productivity in Canada fell by 4.1% per year. This was a decline of 25.2 percentagepoints compared to 1997–2000, largely driven by negative pure productivity growth, which accounted for 88% ofthe productivity growth slowdown. About 80% of the productivity growth slowdown was due to the productivity
The productivity level comparisons should be undertaken with the understanding that the relative levels are sensitive tothe base year.
6
9

growth decline in computer and electronic product manufacturing, mainly from telephone apparatus andsemiconductors.
United States
Similar to the Canadian situation, the productivity growth in the U.S. electronic and electrical product industrydeclined a 21.1 percentage-points difference between the pre- and post-2000 periods (Table 6). However, unlikein Canada, where productivity growth was negative 4.1% per year in the post-2000 period, labour productivity inthe United States continued to grow at a healthy pace at 25.6% per year.
Also, as in Canada, the decomposition shows that computer and electronic product manufacturing was the drivingforce of productivity trends in the United States, accounting for more than two-thirds of the productivity growth.The largest contributor was semiconductors and instruments in both periods, which was again entirely driven bypure productivity growth.
Counterfactual Analysis
As discussed in section 4, the Canadian electronic and electrical product industry had a different industry mixthan its U.S. counterpart. Most notably, semiconductors and instruments in the United States were much larger interms of both employment and output than in Canada.
In this sub-section, we examine how industry structure differences affect the productivity performance of theelectronic and electrical product industry in Canada, using a counterfactual analysis. To this end, we replaceCanadian sub-industry output and employment shares by corresponding U.S. output and employment shares inthe decomposition, keeping the values of other variables as before.
The counterfactual analysis shows that the productivity profile of the Canadian electronic and electrical productindustry would grow almost at the same pace as before (Table 7). At the sub-industry level, as expected, the shiftin industry structure would increase significantly the importance of semiconductor in contribution to industrylabour productivity growth. But, at the same time, it would decrease the importance of some othersub-industries. For example, the contribution from telephone apparatus would be reduced by more than half.
In sum, the counterfactual analysis suggests that the differences in industry structure of the electronic andelectrical product industry between Canada and the United States are not a factor for the weaker productivityperformance of the industry in Canada than in the United States.
6. Empirical Findings on the Plant Turnover Effect in Canada
In this section, we deepen our investigation for Canada by examining the role played by plant turnover inproductivity performance. To this end, we divide the participants in each sub-industry into three groups:continuing plants, entrants and exits. Because of the further disaggregation, some sub-industries have to becombined to meet the Statistics Canada's confidential policy. As a result, we end up with six combinedsub-industries: computers and peripheral equipment; communications equipment; semiconductors; instruments;other electronic products; and electrical equipment. The first four sub-industries made up 59% of the industryvalue added and 56% of total employment in 2006. We combine the telephone apparatus industry with otherelectronic products, despite its large output share and productivity changes, because plant entry and exit data forthe sub-industry is confidential.
6.1. Plant Turnover in the Canadian Electronic and Electrical Product Industry
In this section, we discuss plant turnover in the Canadian electronic and electrical product industry and how itdiffers between the pre- and post-2000 periods.
1997–2000
In the pre-2000 period, exiting plants made up about a quarter of the 1997 plant population, and entering plantsmade up almost 40% of the 2000 plant population (Table 8). 7 There was a net increase in the number of plants.This ratio was relatively consistent across constituent sub-industries.
10
Entrants and exits were typically smaller than continuing plants. They employed about 80% and 36%,respectively, of the employment of continuing plants in 1997-2000 (Table 9). There was more dispersion in thesize of exits than of entrants among sub-industries. Exits ranged from as little as 31% smaller than continuingplants in electrical equipment to 4% smaller in computers and peripheral equipment. Meanwhile, continuingplants' employment expanded by an average of 15%.
Entrants and exits were both less productive than continuing plants in this period (Table 10). Exits were 22% lessproductive than the continuing plants in 1997 and entrants were 30% less productive than the continuing plantsin 2000. Over this period, continuing plants improved productivity by 58%.
The productivity distribution was wide among sub-industries. In 1997, exiting plants ranged from being 63% lessproductive than continuing plants in the semiconductors sub-industry to 50% more productive in the computersand peripheral equipment sub-industry. Similarly, in 2000, entrants ranged from 73% less productive thancontinuing plants in the other electronic product sub-industry, to 15% more productive in the instrumentssub-industry.
2000–2006
The high-tech bubble popped after the turn of the century. As a result, there was a decline in plant population aslarge number of plants exited the industry. There were more exits than entrants. Exiting plants made up 51% ofthe 2000 plant population, but entering plants made up only 44% of the 2006 population (Table 8). 8
As in 1997–2000, entrants and exits in 2000–2006 were generally smaller than continuing plants, but there was alarge dispersion of employment across sub-industries (Table 9). Exiting plants ranged from employing 32% fewerworkers than continuing plants in computers and peripheral equipment manufacturing to hiring 25% moreworkers than continuing plants in the semiconductors sub-industry. Entering plants ranged from employing 53%fewer workers in computers and peripheral equipment to employing 1% more workers in semiconductor.
For the industry as a whole, continuing plants increased employment share by 1% over this period, but there waslarge dispersion across sub-industries, from employing 41% fewer workers in computers and peripheralequipment to employing 33% more workers in communications equipment.
On average, exits were 33% more productive and entrants were 14% less productive than continuing plants(Table 10). At the sub-industry level, however, exiting plants were 43% less productive than continuing plants in2000 in computer and peripheral equipment and communications equipment, to 86% more productive in theother electronic product industry. 9 Similarly, there was a large difference between the productivity of enteringplants and the productivity of continuing plants. Entering plants ranged from 32% less productive than thecontinuing plants in semiconductor in 2006 to 34% more productive than continuing plants in computers andperipheral equipment.
The observation that exiting firms are on average more productive than continuing firms in the period 2000–2006contrasts with the previous finding that exits tend to be on average less productive than incumbents inmanufacturing (for example, Baldwin and Gu, 2006, Foster, Haltiwanger and Krizan, 2001).
Productivity of continuing plants fell on average by 9% over this period. But, in computer and peripheralequipment and instruments sub-industries, continuing plants improved their productivity, by 100% and 9%,respectively.
6.2 The Productivity Effect of Plant Turnover
As shown in Table 5, the decline in labour productivity growth in the Canadian electronic and electrical productindustry between the pre-2000 and post-2000 periods was mainly from the decline in productivity growth at thesub-industry level. The effect is referred to as the pure productivity growth effect, which is equal to the weightedsum of labour productivity growth of the sub-industries, with the weight being the nominal output share of eachsub-industry at the beginning of each period.
In this section, we decompose labour productivity growth at the sub-industry level into components associatedwith continuing plants, entrants and exits, using the GR decomposition framework described in section 2.2. Theresults are reported in Table 11. A positive number for entrants (exits) represents the entrants (exits) being on
11
average more (less) productive than the industry average, and vice versa. The component related to net entry isthe sum of the components for entrants and exits.
The GR decomposition results show that the dramatic decline in labour productivity growth in the continuingplants between pre-2000 and post-2000 periods was mainly responsible for the dramatic decline in productivitygrowth in the Canadian sub-industries (Table 11). The contributions from resource reallocation betweencontinuing plants, entrant and exit were relatively small, but significant. For instance, in 1997–2000, productivityin the computer and peripheral equipment sub-industry grew at a rate of 47.5% per year while in 2000–2006, thegrowth rated declined to 25.8% per year. The sharp in decline in productivity growth rate was largely due to thedecline in productivity growth of continuing plants.
The weaker labour productivity performance of continuing plants (i.e., the within plants contribution) wasresponsible for two-thirds of the decline in the pure productivity growth effect. 10 The latter in turn, as shown inSection 5, was mainly responsible for the decline in labour productivity growth of the Canadian electronic andelectrical product industry between the pre- and post-2000 periods. While net entry had a positive contribution toproductivity growth before 2000, it made a negative contribution after 2000, accounting for 23.1% of theproductivity growth slowdown. The resource reallocation between continuing plants was responsible for theremaining 10.9% of the slowdown.
7. Concluding Remarks
Productivity growth in the Canadian electronic and electrical product industry declined between the pre-2000 andpost-2000 period, despite observed technological advancement and intense competition (high plant turnover) inthe industry.
This paper shows that the dramatic decline in productivity growth was mainly due to the slowdown in productivitygrowth in sub-industries. About two-thirds of the productivity growth decline in sub-industries can be traced tothe decline in labour productivity growth in continuing plants, mainly within computers, communicationsequipment and semiconductors manufacturing. The remaining one-third of the decline was due to the net entry ofless efficient plants and to a lesser extent the reallocation of labour between continuing plants. Finally, the papershows that even if the Canadian industry mix were the same as the U.S. industry mix over these periods, theproductivity growth profile of the Canadian industry would not change.
Many factors might have contributed to the productivity growth slowdown. Two of these factors were: largerestructuring/adjustment costs and lower capacity utilization within the industry following the burst of thehigh-tech bubble in 2000. The high-tech bubble, partly due to the media hype and exaggeration of the Y2Kproblem (the millennium bug), led to overinvestment of information technology equipment and createdconsiderable excess capacity in this industry. 11 For instance, the value of shipments of Canadian computer andelectronic product industry increased from $27.3 billion in 1999 to $37.3 billion in 2000, a 37% jump (Table 12). 12
But, the demand for computer and electronic products collapsed immediately following the turn of the century.This is evidenced by the decline of the value of shipments from $37.3 billion in 2000 to $27.0 billion in 2001. 13
As a result, the industry experienced the lowest levels of capacity utilization, from 97 percent in 2000 to72 percent in 2001 and 67 percent in 2002.
Plant turnover due to changes in industry classification was minor, accounting for about 1–2% of the turnover in total.7
Note, however, that since the number of continuing plants relative to the number of entrants and exits can only decreaseover time, the employment shares of entrants and exits should increase with time, assuming other factors being constant.
8
Unfortunately, we could not pin down the source due to the lack of identification of those exiting plants. Presumably, thefalling of high flying high-tech companies such as Nortel Networks and JDS Uniphase during the high-tech boom mighthave contributed to the anti-intuitive result.
9
The weighted sum of total components is similar but not identical to the pure productivity growth effect in the industrymix analysis, that is, the first term in equation (5) in section 2.1. The discrepancy is due to a higher level ofdisaggregation of the electronic and electrical product industry for plant turnover analysis than for industry mix analysis.
10
12

The good news is that there is some evidence to suggest that the painful restructuring or adjustment in theCanadian electronic and electrical products industry might have been completed. Over the period 2006–2008,labour productivity grew at an annual rate of 4.5% in the Canadian computer and electrical product industry and4.8% in the electrical equipment industry. The hypothesis of recovery is also supported by increased capacityutilization in the two industries to an above-average level around 88% for computer and electronic productmanufacturing and 83% for electrical equipment manufacturing in recent years.
In a recent study, Baldwin, Gu and Yan (2011) show that most of the decline in labour productivity growth in the Canadianmanufacturing sector after 2000 was due to the decline in capacity utilization.
11
About 90% of the Canadian shipments were exported.12
Part of the further decline in demand after 2002 was due to the appreciation of the Canadian dollar relative to the U.S.dollar and increased competition from China in the U.S. market. As shown in Table 13, the Chinese share of the U.S.imports increased substantially, especially for the computer and electronic products.
13
13

References
Baily, M. N., Hulten, C., & Campbell, D. (1992). Productivity Dynamics in Manufacturing Plants, Brookings Papers:Microeconomics 1992, p. 187–268.
Baldwin, J., & Gu, W. (2004). Industrial Competition, Shifts in Market Share and Productivity Growth, StatisticsCanada Research Paper, Catalogue No. 11F0027MIE – No. 021.
Baldwin, J., & Gu, W. (2006). Plant Turnover and Productivity Growth in Canadian Manufacturing, Industrial andCorporate Change, 5(3), 417–465.
Baldwin, J., & Gu, W. (2009). Canada's Productivity Performance, 1961–2008: An Update on Long-term Trends,The Canadian Productivity Review
Baldwin, J., Gu, W., & Yan, B. (2011). Accounting for Slower Productivity Growth in the Canadian ManufacturingSector after 2000: Evidence from Micro Data, Mimeo, Statistics Canada.
Beckstead, D., & Brown, W. M. (2005). An Anatomy of Growth and Decline: High-tech Industries Through theBoom and Bust Years, 1997–2003. Insights on the Canadian Economy, Statistics Canada.
Foster, L., Haltiwanger, J., & Krizan, C. J. (2001). Aggregate Productivity: Lessons from Microeconomic Evidence,in C. R. Hulten, E.R. Dean, and M. J. Harper (eds.), New Developments in Productivity Analysis. Chicago:University of Chicago Press.
Griliches, Z., and Regev, H. (1995). Firm Productivity in Israeli Industry: 1979–1988. Journal of Econometrics,65(1), 175–203.
Hao, L., Rao, S., Tang, J., & Wang, M. (2008). Canada-U.S. Productivity Level Comparisons: New Estimates,Industry Canada Research Paper.
Ho, M. S., Rao, S., & Tang, J. (2004) Sources of Output Growth in Canadian and U.S. Industries in theInformation Age, in Economic Growth in Canada and the United States in the Information Age, ed. Dale W.Jorgenson, Industry Canada Research Monograph.
Nadeau, S., & Rao, S. (2002). The Role of Industrial Structure in Canada's Productivity Performance, inProductivity Issues in Canada, eds. Someshwar Rao and Andrew Sharpe, University of Calgary Press.
Tang, J., Rao, S., & Li, M. (2010). Sensitivity of Capital Stock and Multifactor Productivity Estimates toDepreciation Assumptions: A Canada-U.S. Comparison. International Productivity Monitor 20, 22–47.
Tang, J., & Wang, W. (2004). Sources of Aggregate Labour Productivity Growth in Canada and the United States.Canadian Journal of Economics, 37(2), 421–444.
14
Tables
Table 1: Definitions of Constituent Sub-industries in the Electronic and Electrical ProductManufacturing Industry
IndustriesNAICS code
Canada U.S.Electronic and electrical product
Computer and electronic product 334 334Computers and peripheral equipment 334110 33411Telephone apparatus 334210 334210Radio, TV and wireless communication equipment 334220 334220Other communication equipment 334290 334290Audio and video equipment 334310 334310Semiconductors 334410 33441Instruments 33451 33451Magnetic and optical media 334610 33461
Electrical equipment 335 335Small electrical appliances 335210 335210Major appliances 33522 33522Power, distribution, and specialty transformers 335311 335311Motors and generators 335312 335312Switchgear, and relay and industrial control apparatus 335315 335313 & 335314Batteries 33591 33591Communication and energy wire and cable 335920 335920Wiring devices 335930 335930Electric lighting equipment and other electrical products 3351 & 33599 3351 & 33599
15

Table 2: The Industry Adjustments for the Canadian and the U.S. Electronic and Electrical ProductIndustry, 1997–2006
Year Canada U.S. Output-related
Adjustment
(1)
Labour-relatedAdjustment
(2)
TotalAdjustment
Output-relatedAdjustment
(1)
Labour-relatedAdjustment
(2)
TotalAdjustment
Note: and are benchmarking value added and hours worked, and and are ASM "value added" and employment.
1997 0.76 2.05 0.37 0.64 2.39 0.271998 0.74 2.01 0.37 0.66 2.39 0.271999 0.75 2.00 0.37 0.63 2.39 0.262000 0.74 2.04 0.36 0.68 2.38 0.282001 0.70 2.01 0.35 0.65 2.28 0.282002 0.73 1.97 0.37 0.67 2.43 0.272003 0.74 1.93 0.38 0.66 2.47 0.272004 0.75 2.15 0.35 0.62 2.56 0.242005 0.79 2.23 0.36 0.62 2.65 0.232006 0.73 2.04 0.36 0.67 2.68 0.25
16
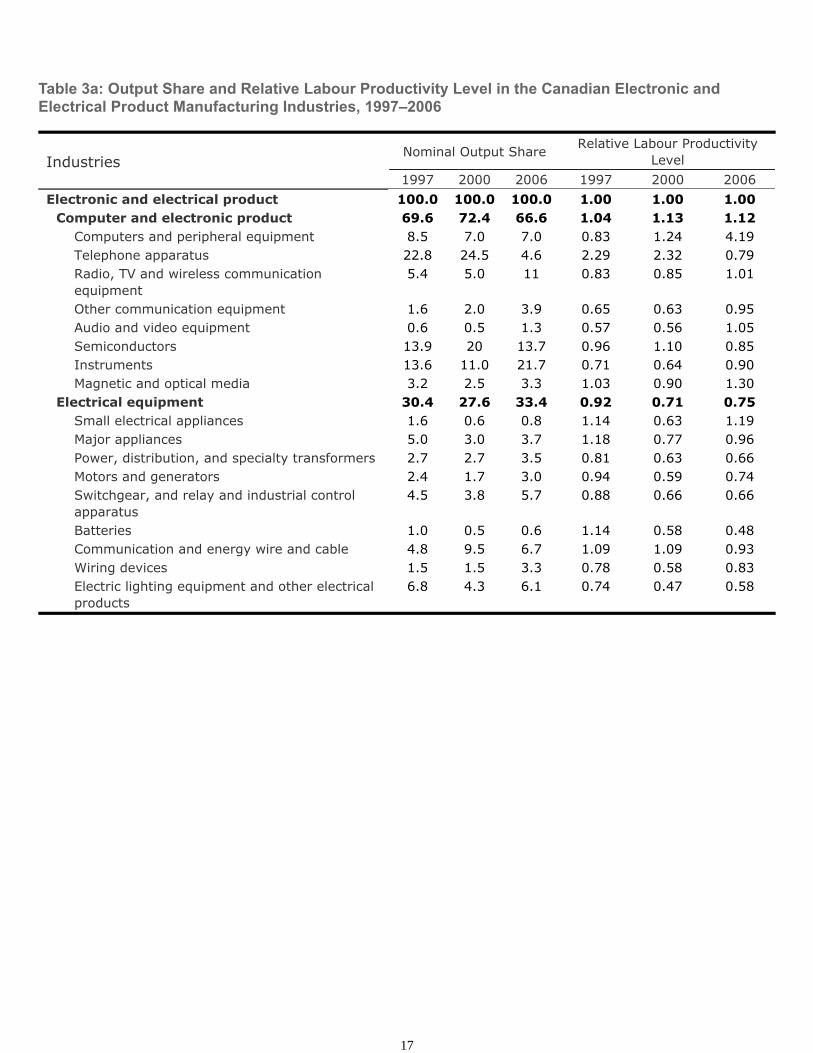
Table 3a: Output Share and Relative Labour Productivity Level in the Canadian Electronic andElectrical Product Manufacturing Industries, 1997–2006
IndustriesNominal Output Share Relative Labour Productivity
Level1997 2000 2006 1997 2000 2006
Electronic and electrical product 100.0 100.0 100.0 1.00 1.00 1.00Computer and electronic product 69.6 72.4 66.6 1.04 1.13 1.12
Computers and peripheral equipment 8.5 7.0 7.0 0.83 1.24 4.19Telephone apparatus 22.8 24.5 4.6 2.29 2.32 0.79Radio, TV and wireless communicationequipment
5.4 5.0 11 0.83 0.85 1.01
Other communication equipment 1.6 2.0 3.9 0.65 0.63 0.95Audio and video equipment 0.6 0.5 1.3 0.57 0.56 1.05Semiconductors 13.9 20 13.7 0.96 1.10 0.85Instruments 13.6 11.0 21.7 0.71 0.64 0.90Magnetic and optical media 3.2 2.5 3.3 1.03 0.90 1.30
Electrical equipment 30.4 27.6 33.4 0.92 0.71 0.75Small electrical appliances 1.6 0.6 0.8 1.14 0.63 1.19Major appliances 5.0 3.0 3.7 1.18 0.77 0.96Power, distribution, and specialty transformers 2.7 2.7 3.5 0.81 0.63 0.66Motors and generators 2.4 1.7 3.0 0.94 0.59 0.74Switchgear, and relay and industrial controlapparatus
4.5 3.8 5.7 0.88 0.66 0.66
Batteries 1.0 0.5 0.6 1.14 0.58 0.48Communication and energy wire and cable 4.8 9.5 6.7 1.09 1.09 0.93Wiring devices 1.5 1.5 3.3 0.78 0.58 0.83Electric lighting equipment and other electricalproducts
6.8 4.3 6.1 0.74 0.47 0.58
17

Table 3b: Output Share and Relative Labour Productivity Level in the U.S. Electronic and ElectricalProduct Manufacturing Industries, 1997–2006
IndustriesNominal Output
ShareRelative Labour Productivity
Level1997 2000 2006 1997 2000 2006
Electronic and electrical product 100 100 100 1.00 1.00 1.00Computer and electronic product 77.2 78.6 72.2 1.01 1.22 1.38
Computers and peripheral equipment 13.5 12.2 11.0 1.24 1.52 2.18Telephone apparatus 7.3 10.1 4.6 1.55 2.36 2.9Radio, TV and wireless communicationequipment
6.7 6.7 6.1 0.88 1.08 1.47
Other communication equipment 0.8 0.8 0.8 0.70 0.88 0.92Audio and video equipment 0.7 0.9 1.0 0.53 0.81 1.09Semiconductors 28.8 29.6 23.9 1.09 1.23 1.32Instruments 17.8 17.0 23.7 0.81 0.92 1.18Magnetic and optical media 1.7 1.3 1.0 0.69 0.75 0.68
Electrical equipment 22.8 21.4 27.8 0.96 0.44 0.24Small electrical appliances 1.1 0.9 0.8 1.04 0.45 0.23Major appliances 2.9 2.6 4.1 1.04 0.41 0.26Power, distribution, and specialty transformers 1.0 0.9 1.2 0.95 0.43 0.21Motors and generators 2.4 1.8 2.7 0.83 0.33 0.21Switchgear, and relay and industrial controlapparatus
4.2 3.8 5.1 0.98 0.44 0.24
Batteries 1.4 1.4 1.6 1.10 0.51 0.23Communication and energy wire and cable 2.5 2.9 2.7 1.13 0.56 0.29Wiring devices 2.4 2.6 3.3 0.88 0.45 0.26Electric lighting equipment and other electricalproducts
4.8 4.6 6.3 0.92 0.42 0.24
18

Table 4a: Relative Size of the Canadian Electronic and Electrical Product Manufacturing Industries,1997–2006
IndustriesEmployment Share Relative Output
Price Relative Size
1997 2000 2006 1997 2000 2006 1997 2000 2006Electronic and electrical product 100.0 100.0 100.0 1.00 1.00 1.00 1.00 1.00 1.00
Computer and electronic product 66.9 67.7 65.6 1.00 0.94 0.91 0.67 0.64 0.60Computers and peripheralequipment
10.2 11.5 7.4 1.00 0.49 0.23 0.10 0.06 0.02
Telephone apparatus 9.9 10.1 5.3 1.00 1.04 1.11 0.10 0.11 0.06Radio, TV and wirelesscommunication equipment
6.5 5.6 9.8 1.00 1.04 1.11 0.07 0.06 0.11
Other communication equipment 2.5 3.0 3.7 1.00 1.04 1.11 0.03 0.03 0.04Audio and video equipment 1.0 0.8 1.1 1.00 1.04 1.11 0.01 0.01 0.01Semiconductors 14.5 17.5 14.5 1.00 1.04 1.11 0.15 0.18 0.16Instruments 19.2 16.5 21.6 1.00 1.04 1.11 0.19 0.17 0.24Magnetic and optical media 3.1 2.7 2.3 1.00 1.04 1.11 0.03 0.03 0.03
Electrical equipment 33.1 32.3 34.4 1.00 1.20 1.30 0.33 0.39 0.45Small electrical appliances 1.4 0.9 0.8 1.00 0.98 0.93 0.01 0.01 0.01Major appliances 4.2 4.0 4.2 1.00 0.98 0.93 0.04 0.04 0.04Power, distribution, and specialtytransformers
3.3 3.4 3.8 1.00 1.25 1.39 0.03 0.04 0.05
Motors and generators 2.5 2.3 3.0 1.00 1.25 1.39 0.03 0.03 0.04Switchgear, and relay andindustrial control apparatus
5.1 4.6 6.2 1.00 1.25 1.39 0.05 0.06 0.09
Batteries 0.9 0.8 0.9 1.00 1.25 1.39 0.01 0.01 0.01Communication and energy wireand cable
4.4 6.9 5.1 1.00 1.25 1.39 0.04 0.09 0.07
Wiring devices 2.0 2.1 2.9 1.00 1.25 1.39 0.02 0.03 0.04Electric lighting equipment andother electrical products
9.2 7.2 7.5 1.00 1.25 1.39 0.09 0.09 0.10
19
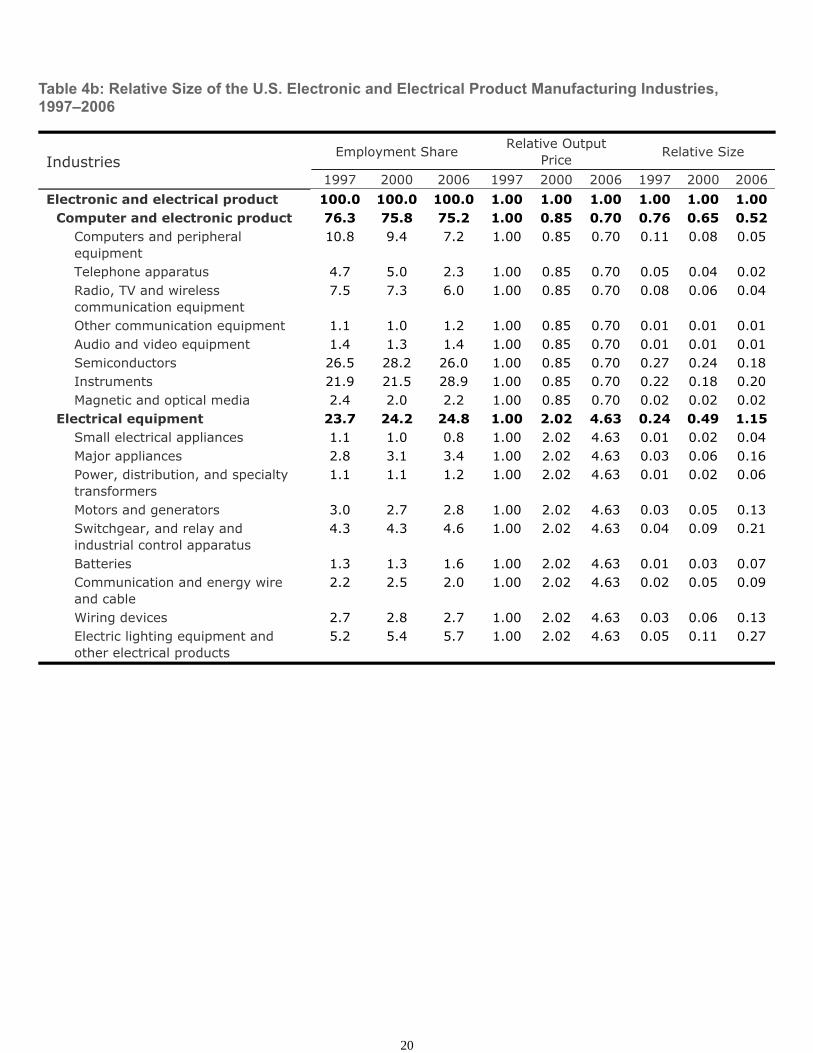
Table 4b: Relative Size of the U.S. Electronic and Electrical Product Manufacturing Industries,1997–2006
IndustriesEmployment Share Relative Output
Price Relative Size
1997 2000 2006 1997 2000 2006 1997 2000 2006Electronic and electrical product 100.0 100.0 100.0 1.00 1.00 1.00 1.00 1.00 1.00
Computer and electronic product 76.3 75.8 75.2 1.00 0.85 0.70 0.76 0.65 0.52Computers and peripheralequipment
10.8 9.4 7.2 1.00 0.85 0.70 0.11 0.08 0.05
Telephone apparatus 4.7 5.0 2.3 1.00 0.85 0.70 0.05 0.04 0.02Radio, TV and wirelesscommunication equipment
7.5 7.3 6.0 1.00 0.85 0.70 0.08 0.06 0.04
Other communication equipment 1.1 1.0 1.2 1.00 0.85 0.70 0.01 0.01 0.01Audio and video equipment 1.4 1.3 1.4 1.00 0.85 0.70 0.01 0.01 0.01Semiconductors 26.5 28.2 26.0 1.00 0.85 0.70 0.27 0.24 0.18Instruments 21.9 21.5 28.9 1.00 0.85 0.70 0.22 0.18 0.20Magnetic and optical media 2.4 2.0 2.2 1.00 0.85 0.70 0.02 0.02 0.02
Electrical equipment 23.7 24.2 24.8 1.00 2.02 4.63 0.24 0.49 1.15Small electrical appliances 1.1 1.0 0.8 1.00 2.02 4.63 0.01 0.02 0.04Major appliances 2.8 3.1 3.4 1.00 2.02 4.63 0.03 0.06 0.16Power, distribution, and specialtytransformers
1.1 1.1 1.2 1.00 2.02 4.63 0.01 0.02 0.06
Motors and generators 3.0 2.7 2.8 1.00 2.02 4.63 0.03 0.05 0.13Switchgear, and relay andindustrial control apparatus
4.3 4.3 4.6 1.00 2.02 4.63 0.04 0.09 0.21
Batteries 1.3 1.3 1.6 1.00 2.02 4.63 0.01 0.03 0.07Communication and energy wireand cable
2.2 2.5 2.0 1.00 2.02 4.63 0.02 0.05 0.09
Wiring devices 2.7 2.8 2.7 1.00 2.02 4.63 0.03 0.06 0.13Electric lighting equipment andother electrical products
5.2 5.4 5.7 1.00 2.02 4.63 0.05 0.11 0.27
20

Table 5a: Industry Contribution to Labour Productivity Growth in the Canadian Electronic andElectrical Product Manufacturing Industry, 1997–2000
IndustriesLabour Productivity
Growth Rate(% per year)
Contribution
Total Pure ProductivityGrowth Reallocation
Electronic and electrical product 21.1 21.1 19.0 2.1Computer and electronic product 25.8 16.2 17.1 −1.0
Computers and peripheral equipment 47.5 1.0 4.0 −3.1Telephone apparatus 21.6 5.7 4.9 0.8Radio, TV and wirelesscommunication equipment
21.8 0.9 1.2 −0.3
Other communication equipment 19.1 0.5 0.3 0.2Audio and video equipment 19.7 0.1 0.1 0.0Semiconductors 28.5 6.2 4.0 2.2Instruments 15.9 1.5 2.2 −0.7Magnetic and optical media 13.8 0.3 0.4 −0.1
Electrical equipment 9.1 4.9 1.8 3.0Small electrical appliances −3.1 −0.2 0.0 −0.2Major appliances 1.9 0.0 0.1 −0.1Power, distribution, and specialtytransformers
9.2 0.6 0.2 0.4
Motors and generators 1.0 0.1 0.0 0.1Switchgear, and relay and industrialcontrol apparatus
7.4 0.6 0.3 0.2
Batteries −5.6 0.0 −0.1 0.0Communication and energy wire andcable
21.1 3.5 1.0 2.6
Wiring devices 7.6 0.3 0.1 0.2Electric lighting equipment and otherelectrical products
1.5 0.1 0.1 0.0
21
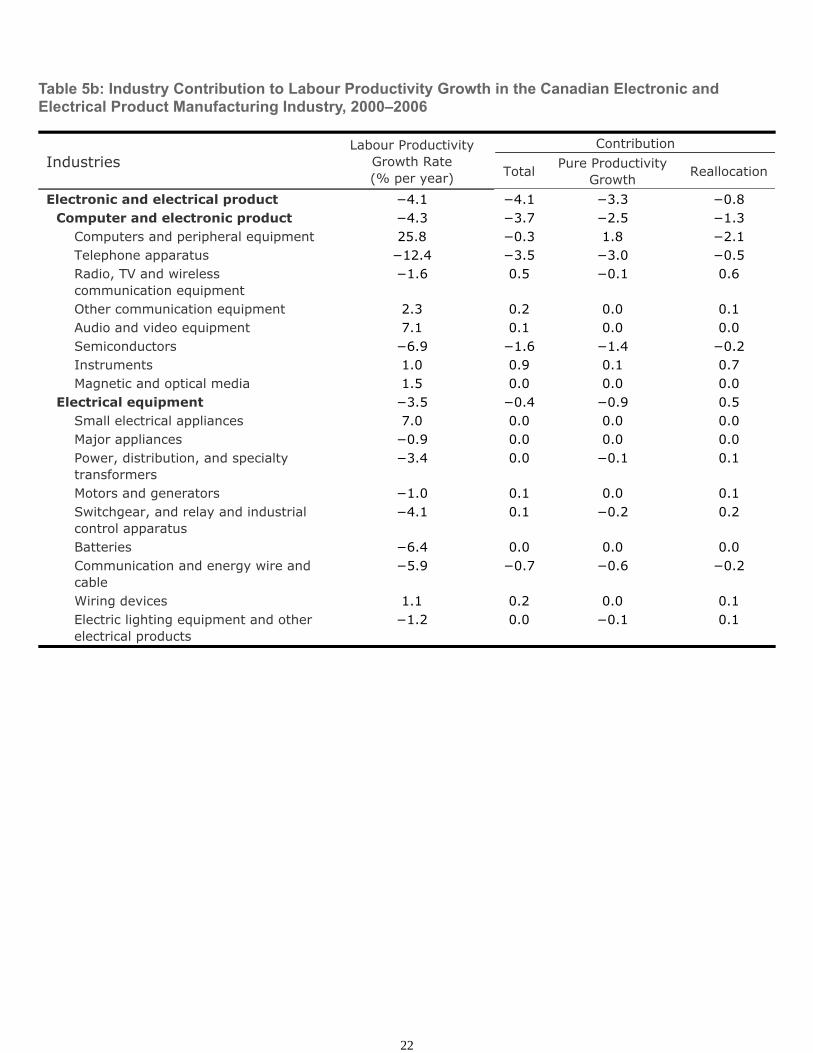
Table 5b: Industry Contribution to Labour Productivity Growth in the Canadian Electronic andElectrical Product Manufacturing Industry, 2000–2006
IndustriesLabour Productivity
Growth Rate(% per year)
Contribution
Total Pure ProductivityGrowth Reallocation
Electronic and electrical product −4.1 −4.1 −3.3 −0.8Computer and electronic product −4.3 −3.7 −2.5 −1.3
Computers and peripheral equipment 25.8 −0.3 1.8 −2.1Telephone apparatus −12.4 −3.5 −3.0 −0.5Radio, TV and wirelesscommunication equipment
−1.6 0.5 −0.1 0.6
Other communication equipment 2.3 0.2 0.0 0.1Audio and video equipment 7.1 0.1 0.0 0.0Semiconductors −6.9 −1.6 −1.4 −0.2Instruments 1.0 0.9 0.1 0.7Magnetic and optical media 1.5 0.0 0.0 0.0
Electrical equipment −3.5 −0.4 −0.9 0.5Small electrical appliances 7.0 0.0 0.0 0.0Major appliances −0.9 0.0 0.0 0.0Power, distribution, and specialtytransformers
−3.4 0.0 −0.1 0.1
Motors and generators −1.0 0.1 0.0 0.1Switchgear, and relay and industrialcontrol apparatus
−4.1 0.1 −0.2 0.2
Batteries −6.4 0.0 0.0 0.0Communication and energy wire andcable
−5.9 −0.7 −0.6 −0.2
Wiring devices 1.1 0.2 0.0 0.1Electric lighting equipment and otherelectrical products
−1.2 0.0 −0.1 0.1
22

Table 6a: Industry Contribution to Labour Productivity Growth in the U.S. Electronic and ElectricalProduct Manufacturing Industry, 1997–2000
IndustriesLabour Productivity
Growth Rate(% per year)
Contribution
Total Pure ProductivityGrowth Reallocation
Electronic and electrical product 46.7 46.7 49.0 −2.3Computer and electronic product 62.9 37.2 48.3 −11.2
Computers and peripheral equipment 64.7 5.3 8.7 −3.5Telephone apparatus 88.5 5.6 6.4 −0.8Radio, TV and wirelesscommunication equipment
64.5 3.2 4.3 −1.1
Other communication equipment 67.0 0.4 0.5 −0.1Audio and video equipment 88.4 0.5 0.6 −0.1Semiconductors 57.5 14.1 16.6 −2.5Instruments 57.6 7.7 10.3 −2.5Magnetic and optical media 54.5 0.5 0.9 −0.5
Electrical equipment 2.9 9.5 0.6 8.9Small electrical appliances 1.4 0.4 0.0 0.3Major appliances −1.4 1.1 0.0 1.2Power, distribution, and specialtytransformers
2.7 0.4 0.0 0.4
Motors and generators −1.7 0.6 0.0 0.7Switchgear, and relay and industrialcontrol apparatus
2.5 1.6 0.1 1.5
Batteries 3.7 0.6 0.1 0.6Communication and energy wire andcable
6.0 1.5 0.1 1.3
Wiring devices 8.1 1.3 0.2 1.1Electric lighting equipment and otherelectrical products
3.1 2.1 0.1 2.0
23

Table 6b: Industry Contribution to Labour Productivity Growth in the U.S. Electronic and ElectricalProduct Manufacturing Industry, 2000–2006
IndustriesLabour Productivity
Growth Rate(% per year)
Contribution
Total Pure ProductivityGrowth Reallocation
Electronic and electrical product 25.6 25.6 28.8 −3.3Computer and electronic product 31.3 17.4 27.3 −9.9
Computers and peripheral equipment 44.0 2.6 5.4 −2.8Telephone apparatus 35.3 0.3 3.6 −3.3Radio, TV and wirelesscommunication equipment
40.7 1.5 2.7 −1.3
Other communication equipment 27.8 0.2 0.2 0.0Audio and video equipment 40.5 0.3 0.4 −0.1Semiconductors 28.6 5.2 8.5 −3.3Instruments 37.2 7.2 6.3 0.9Magnetic and optical media 21.4 0.2 0.3 0.0
Electrical equipment 6.8 8.2 1.5 6.7Small electrical appliances 5.1 0.2 0.0 0.1Major appliances 9.8 1.3 0.3 1.1Power, distribution, and specialtytransformers
3.7 0.4 0.0 0.4
Motors and generators 10.0 0.8 0.2 0.6Switchgear, and relay and industrialcontrol apparatus
6.5 1.5 0.2 1.3
Batteries 2.3 0.5 0.0 0.5Communication and energy wire andcable
5.2 0.7 0.1 0.5
Wiring devices 7.8 1.0 0.2 0.7Electric lighting equipment and otherelectrical products
7.5 1.9 0.3 1.6
24
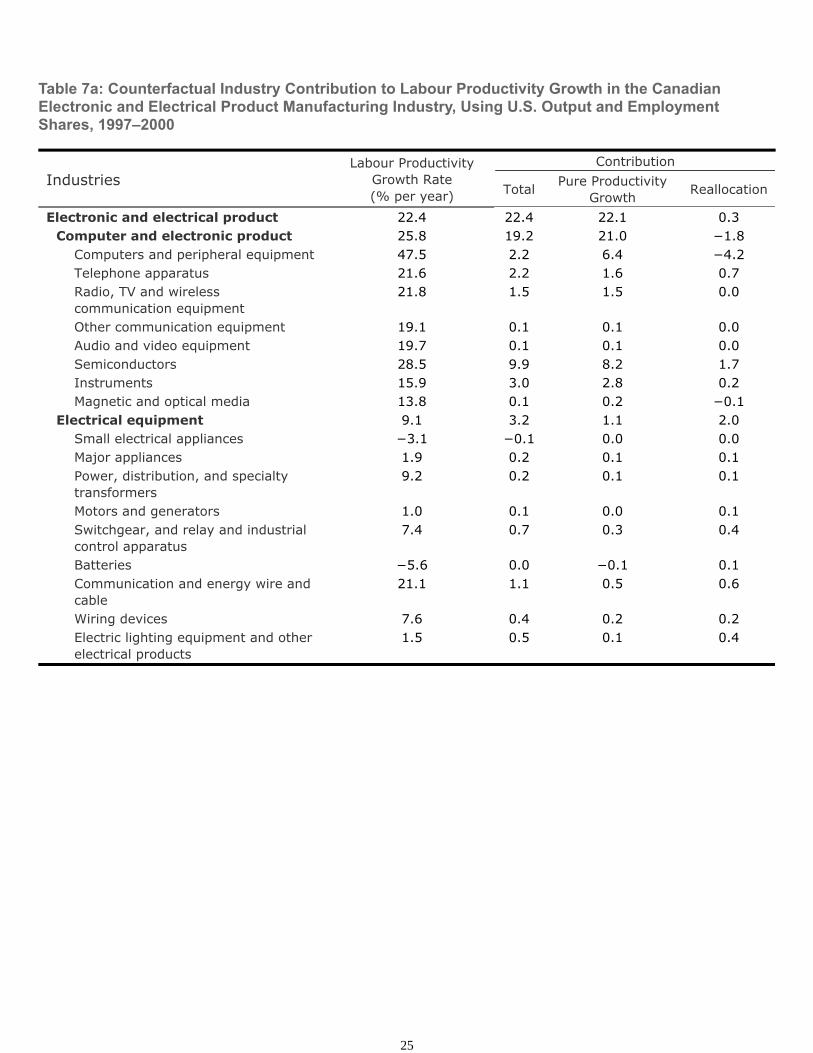
Table 7a: Counterfactual Industry Contribution to Labour Productivity Growth in the CanadianElectronic and Electrical Product Manufacturing Industry, Using U.S. Output and EmploymentShares, 1997–2000
IndustriesLabour Productivity
Growth Rate(% per year)
Contribution
Total Pure ProductivityGrowth Reallocation
Electronic and electrical product 22.4 22.4 22.1 0.3Computer and electronic product 25.8 19.2 21.0 −1.8
Computers and peripheral equipment 47.5 2.2 6.4 −4.2Telephone apparatus 21.6 2.2 1.6 0.7Radio, TV and wirelesscommunication equipment
21.8 1.5 1.5 0.0
Other communication equipment 19.1 0.1 0.1 0.0Audio and video equipment 19.7 0.1 0.1 0.0Semiconductors 28.5 9.9 8.2 1.7Instruments 15.9 3.0 2.8 0.2Magnetic and optical media 13.8 0.1 0.2 −0.1
Electrical equipment 9.1 3.2 1.1 2.0Small electrical appliances −3.1 −0.1 0.0 0.0Major appliances 1.9 0.2 0.1 0.1Power, distribution, and specialtytransformers
9.2 0.2 0.1 0.1
Motors and generators 1.0 0.1 0.0 0.1Switchgear, and relay and industrialcontrol apparatus
7.4 0.7 0.3 0.4
Batteries −5.6 0.0 −0.1 0.1Communication and energy wire andcable
21.1 1.1 0.5 0.6
Wiring devices 7.6 0.4 0.2 0.2Electric lighting equipment and otherelectrical products
1.5 0.5 0.1 0.4
25

Table 7b: Counterfactual Industry Contribution to Labour Productivity Growth in the CanadianElectronic and Electrical Product Manufacturing Industry, Using U.S. Output and EmploymentShares, 2000–2006
IndustriesLabour Productivity
Growth Rate(% per year)
Contribution
Total Pure ProductivityGrowth Reallocation
Electronic and electrical product −1.0 −1.0 −0.4 −0.5Computer and electronic product −4.3 −0.8 0.0 −0.8
Computers and peripheral equipment 25.8 1.6 3.2 −1.6Telephone apparatus −12.4 −1.5 −1.2 −0.2Radio, TV and wirelesscommunication equipment
−1.6 −0.2 −0.1 −0.1
Other communication equipment 2.3 0.1 0.0 0.0Audio and video equipment 7.1 0.1 0.1 0.0Semiconductors −6.9 −2.1 −2.1 −0.1Instruments 1.0 1.3 0.2 1.1Magnetic and optical media 1.5 0.1 0.0 0.0
Electrical equipment −3.5 −0.2 −0.5 0.2Small electrical appliances 7.0 0.0 0.1 0.0Major appliances −0.9 0.0 0.0 0.0Power, distribution, and specialtytransformers
−3.4 0.0 0.0 0.0
Motors and generators −1.0 0.0 0.0 0.1Switchgear, and relay and industrialcontrol apparatus
−4.1 −0.1 −0.2 0.1
Batteries −6.4 −0.1 −0.1 0.0Communication and energy wire andcable
−5.9 −0.2 −0.2 −0.1
Wiring devices 1.1 0.1 0.0 0.0Electric lighting equipment and otherelectrical products
−1.2 0.0 −0.1 0.1
26

Table 8: Percent of Entering, Continuing, and Exiting Plants in the Canadian Electronic and ElectricalProduct Manufacturing Industry, 1997–2006
1997–2000ExitingPlants
1997–2000Continuing
Plants
1997–2000EnteringPlants
2000–2006ExitingPlants
2000–2006Continuing
Plants
2000–2006EnteringPlants
Note: (1) Share in 1997 of plants that existed in 1997, but not in 2000. (2) Share of plants that existed in both 1997 and 2000. Thenumbers are shares of those plants in 1997 and 2000, respectively. (3) Share in 2000 of plants that did not exist in 1997, but in2000. (4) Share in 2000 of plants that existed in 2000, but not in 2006. (5) Share of plants that existed in both 2000 and 2006. Thenumbers are share of those plants in 2000 and 2006, respectively. (6) Share in 2006 of plants that did not exist in 2000, but in2006.
Electronic andelectrical product
24.0 76.061.5
38.5 50.6 49.456.3
43.7
Computer andelectronic product
25.0 75.058.8
41.2 53.7 46.356.1
43.9
Computers andperipheralequipment
29.9 70.163.6
36.4 60.7 39.354.0
46.1
Communicationequipment
26.8 73.256.3
43.7 53.0 47.049.0
51.1
Semiconductors 14.7 85.362.5
37.5 53.9 46.153.9
46.1
Instruments 27.7 72.458.8
41.2 49.0 51.061.6
38.4
Other electronicproducts
25.6 24.450.0
50.0 60.5 39.551.7
48.3
Electricalequipment
22.2 77.866.7
33.3 44.6 55.456.8
43.2
27
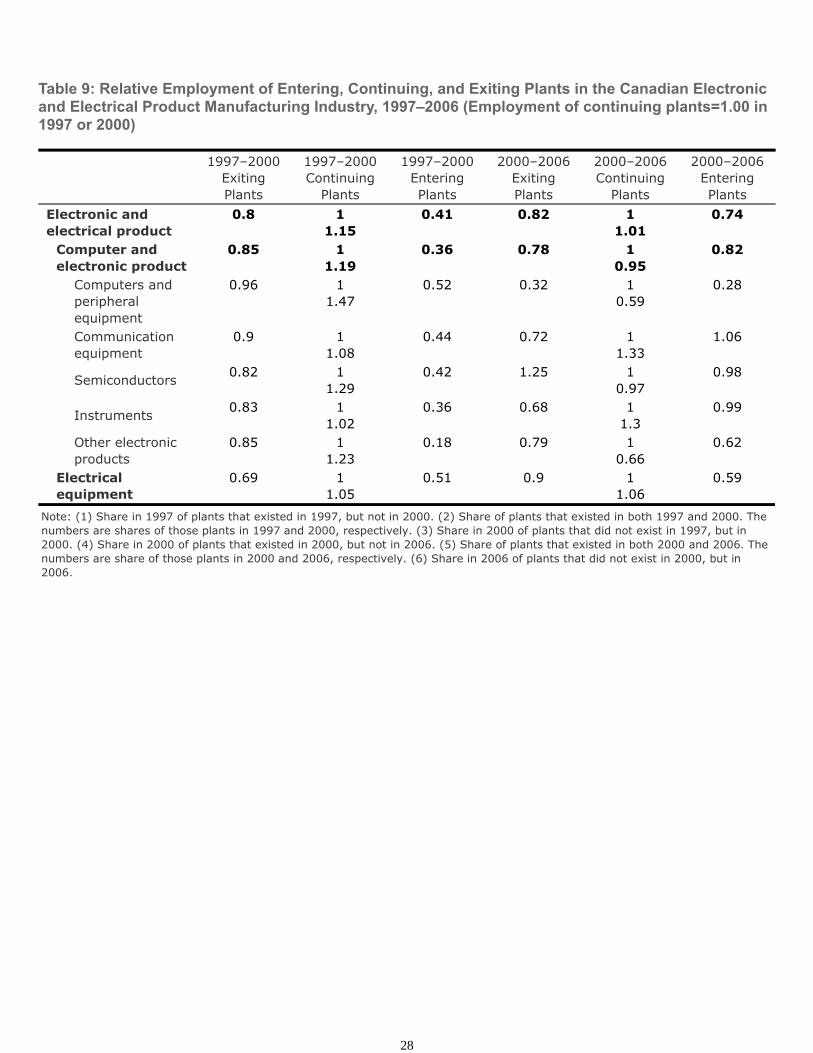
Table 9: Relative Employment of Entering, Continuing, and Exiting Plants in the Canadian Electronicand Electrical Product Manufacturing Industry, 1997–2006 (Employment of continuing plants=1.00 in1997 or 2000)
1997–2000ExitingPlants
1997–2000Continuing
Plants
1997–2000EnteringPlants
2000–2006ExitingPlants
2000–2006Continuing
Plants
2000–2006EnteringPlants
Note: (1) Share in 1997 of plants that existed in 1997, but not in 2000. (2) Share of plants that existed in both 1997 and 2000. Thenumbers are shares of those plants in 1997 and 2000, respectively. (3) Share in 2000 of plants that did not exist in 1997, but in2000. (4) Share in 2000 of plants that existed in 2000, but not in 2006. (5) Share of plants that existed in both 2000 and 2006. Thenumbers are share of those plants in 2000 and 2006, respectively. (6) Share in 2006 of plants that did not exist in 2000, but in2006.
Electronic andelectrical product
0.8 11.15
0.41 0.82 11.01
0.74
Computer andelectronic product
0.85 11.19
0.36 0.78 10.95
0.82
Computers andperipheralequipment
0.96 11.47
0.52 0.32 10.59
0.28
Communicationequipment
0.9 11.08
0.44 0.72 11.33
1.06
Semiconductors 0.82 11.29
0.42 1.25 10.97
0.98
Instruments 0.83 11.02
0.36 0.68 11.3
0.99
Other electronicproducts
0.85 11.23
0.18 0.79 10.66
0.62
Electricalequipment
0.69 11.05
0.51 0.9 11.06
0.59
28
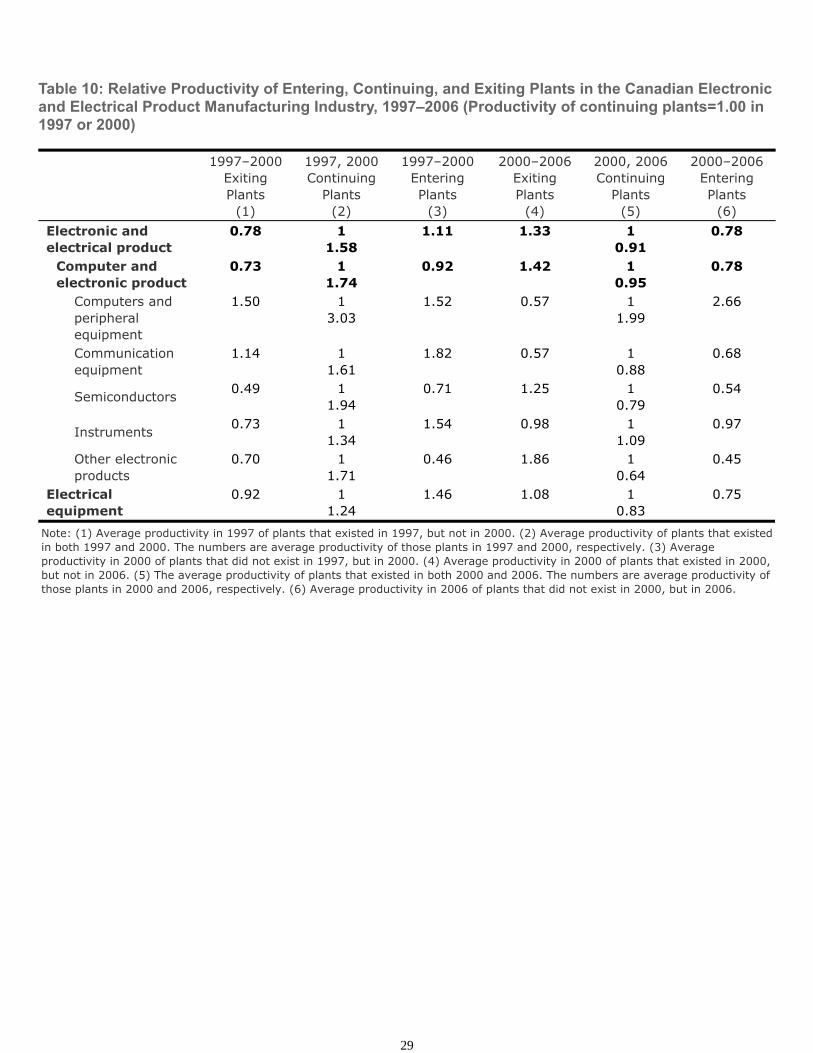
Table 10: Relative Productivity of Entering, Continuing, and Exiting Plants in the Canadian Electronicand Electrical Product Manufacturing Industry, 1997–2006 (Productivity of continuing plants=1.00 in1997 or 2000)
1997–2000ExitingPlants
(1)
1997, 2000Continuing
Plants(2)
1997–2000EnteringPlants
(3)
2000–2006ExitingPlants
(4)
2000, 2006Continuing
Plants(5)
2000–2006EnteringPlants
(6)
Note: (1) Average productivity in 1997 of plants that existed in 1997, but not in 2000. (2) Average productivity of plants that existedin both 1997 and 2000. The numbers are average productivity of those plants in 1997 and 2000, respectively. (3) Averageproductivity in 2000 of plants that did not exist in 1997, but in 2000. (4) Average productivity in 2000 of plants that existed in 2000,but not in 2006. (5) The average productivity of plants that existed in both 2000 and 2006. The numbers are average productivity ofthose plants in 2000 and 2006, respectively. (6) Average productivity in 2006 of plants that did not exist in 2000, but in 2006.
Electronic andelectrical product
0.78 11.58
1.11 1.33 10.91
0.78
Computer andelectronic product
0.73 11.74
0.92 1.42 10.95
0.78
Computers andperipheralequipment
1.50 13.03
1.52 0.57 11.99
2.66
Communicationequipment
1.14 11.61
1.82 0.57 10.88
0.68
Semiconductors 0.49 11.94
0.71 1.25 10.79
0.54
Instruments 0.73 11.34
1.54 0.98 11.09
0.97
Other electronicproducts
0.70 11.71
0.46 1.86 10.64
0.45
Electricalequipment
0.92 11.24
1.46 1.08 10.83
0.75
29
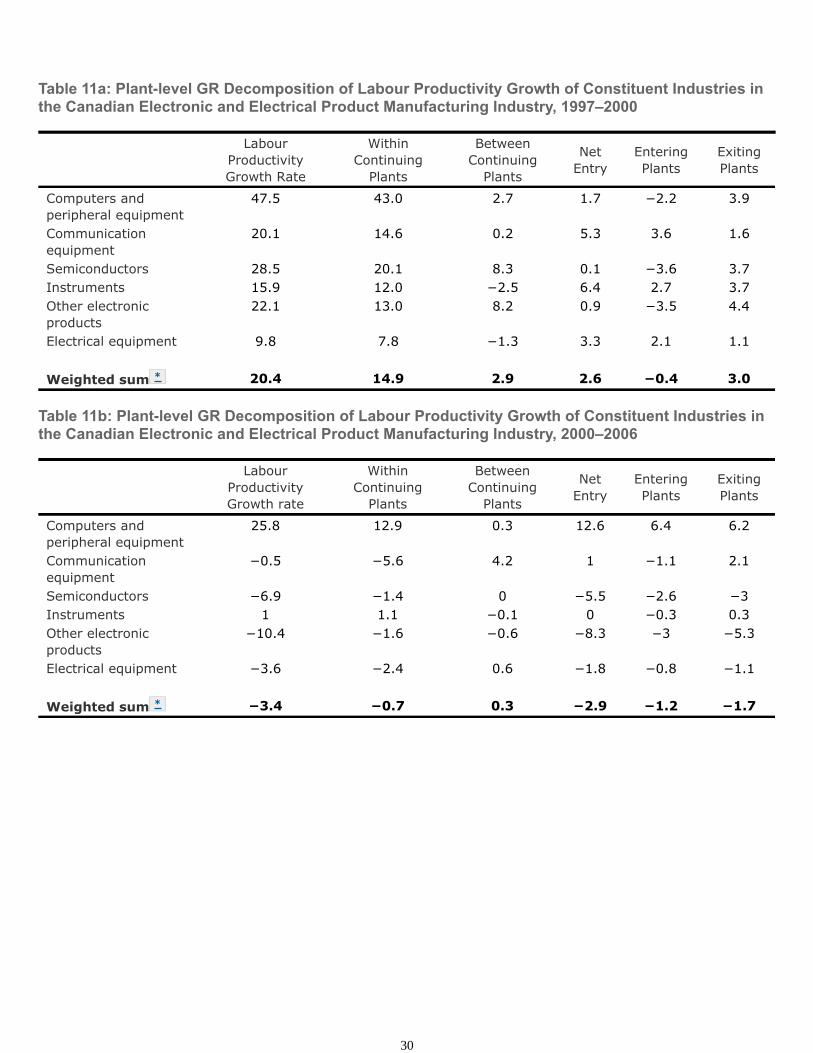
Table 11a: Plant-level GR Decomposition of Labour Productivity Growth of Constituent Industries inthe Canadian Electronic and Electrical Product Manufacturing Industry, 1997–2000
Labour
ProductivityGrowth Rate
WithinContinuing
Plants
BetweenContinuing
Plants
NetEntry
EnteringPlants
ExitingPlants
Computers andperipheral equipment
47.5 43.0 2.7 1.7 −2.2 3.9
Communicationequipment
20.1 14.6 0.2 5.3 3.6 1.6
Semiconductors 28.5 20.1 8.3 0.1 −3.6 3.7Instruments 15.9 12.0 −2.5 6.4 2.7 3.7Other electronicproducts
22.1 13.0 8.2 0.9 −3.5 4.4
Electrical equipment 9.8 7.8 −1.3 3.3 2.1 1.1 Weighted sum * 20.4 14.9 2.9 2.6 −0.4 3.0
Table 11b: Plant-level GR Decomposition of Labour Productivity Growth of Constituent Industries inthe Canadian Electronic and Electrical Product Manufacturing Industry, 2000–2006
Labour
ProductivityGrowth rate
WithinContinuing
Plants
BetweenContinuing
Plants
NetEntry
EnteringPlants
ExitingPlants
Computers andperipheral equipment
25.8 12.9 0.3 12.6 6.4 6.2
Communicationequipment
−0.5 −5.6 4.2 1 −1.1 2.1
Semiconductors −6.9 −1.4 0 −5.5 −2.6 −3Instruments 1 1.1 −0.1 0 −0.3 0.3Other electronicproducts
−10.4 −1.6 −0.6 −8.3 −3 −5.3
Electrical equipment −3.6 −2.4 0.6 −1.8 −0.8 −1.1 Weighted sum * −3.4 −0.7 0.3 −2.9 −1.2 −1.7
30
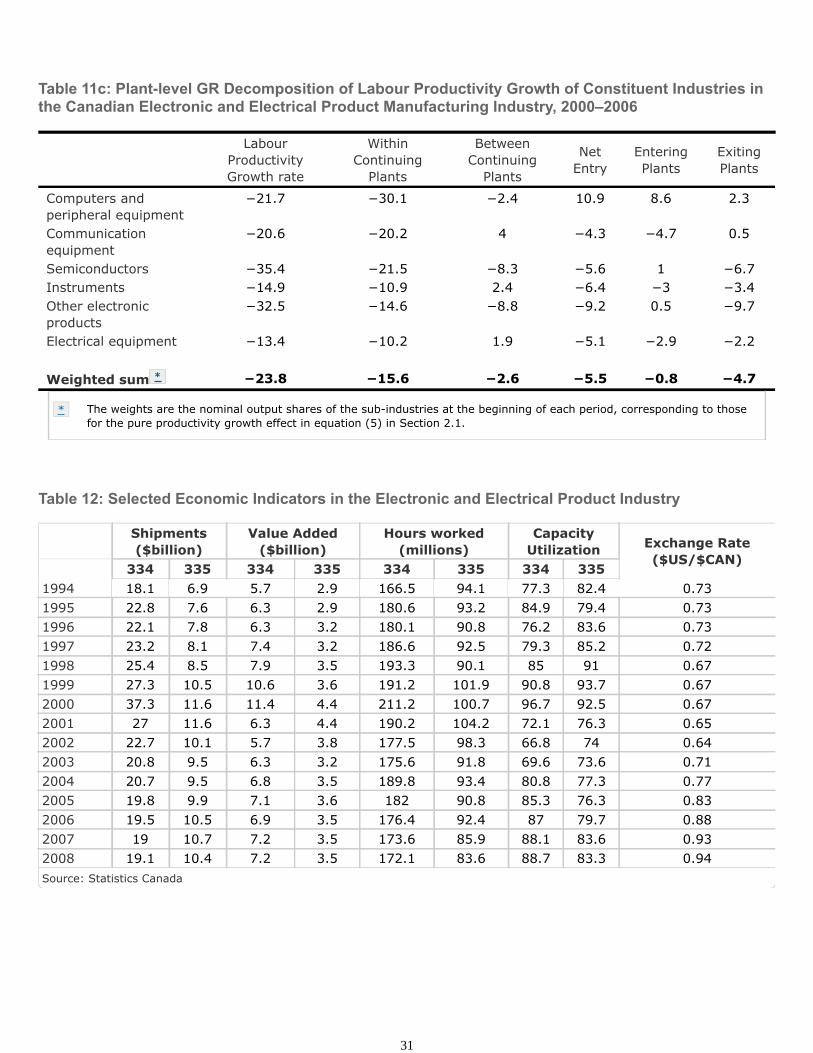
Table 11c: Plant-level GR Decomposition of Labour Productivity Growth of Constituent Industries inthe Canadian Electronic and Electrical Product Manufacturing Industry, 2000–2006
Labour
ProductivityGrowth rate
WithinContinuing
Plants
BetweenContinuing
Plants
NetEntry
EnteringPlants
ExitingPlants
Computers andperipheral equipment
−21.7 −30.1 −2.4 10.9 8.6 2.3
Communicationequipment
−20.6 −20.2 4 −4.3 −4.7 0.5
Semiconductors −35.4 −21.5 −8.3 −5.6 1 −6.7Instruments −14.9 −10.9 2.4 −6.4 −3 −3.4Other electronicproducts
−32.5 −14.6 −8.8 −9.2 0.5 −9.7
Electrical equipment −13.4 −10.2 1.9 −5.1 −2.9 −2.2 Weighted sum * −23.8 −15.6 −2.6 −5.5 −0.8 −4.7
Table 12: Selected Economic Indicators in the Electronic and Electrical Product Industry
Shipments($billion)
Value Added($billion)
Hours worked(millions)
CapacityUtilization Exchange Rate
($US/$CAN) 334 335 334 335 334 335 334 335
Source: Statistics Canada
1994 18.1 6.9 5.7 2.9 166.5 94.1 77.3 82.4 0.731995 22.8 7.6 6.3 2.9 180.6 93.2 84.9 79.4 0.731996 22.1 7.8 6.3 3.2 180.1 90.8 76.2 83.6 0.731997 23.2 8.1 7.4 3.2 186.6 92.5 79.3 85.2 0.721998 25.4 8.5 7.9 3.5 193.3 90.1 85 91 0.671999 27.3 10.5 10.6 3.6 191.2 101.9 90.8 93.7 0.672000 37.3 11.6 11.4 4.4 211.2 100.7 96.7 92.5 0.672001 27 11.6 6.3 4.4 190.2 104.2 72.1 76.3 0.652002 22.7 10.1 5.7 3.8 177.5 98.3 66.8 74 0.642003 20.8 9.5 6.3 3.2 175.6 91.8 69.6 73.6 0.712004 20.7 9.5 6.8 3.5 189.8 93.4 80.8 77.3 0.772005 19.8 9.9 7.1 3.6 182 90.8 85.3 76.3 0.832006 19.5 10.5 6.9 3.5 176.4 92.4 87 79.7 0.882007 19 10.7 7.2 3.5 173.6 85.9 88.1 83.6 0.932008 19.1 10.4 7.2 3.5 172.1 83.6 88.7 83.3 0.94
The weights are the nominal output shares of the sub-industries at the beginning of each period, corresponding to thosefor the pure productivity growth effect in equation (5) in Section 2.1.
*
31
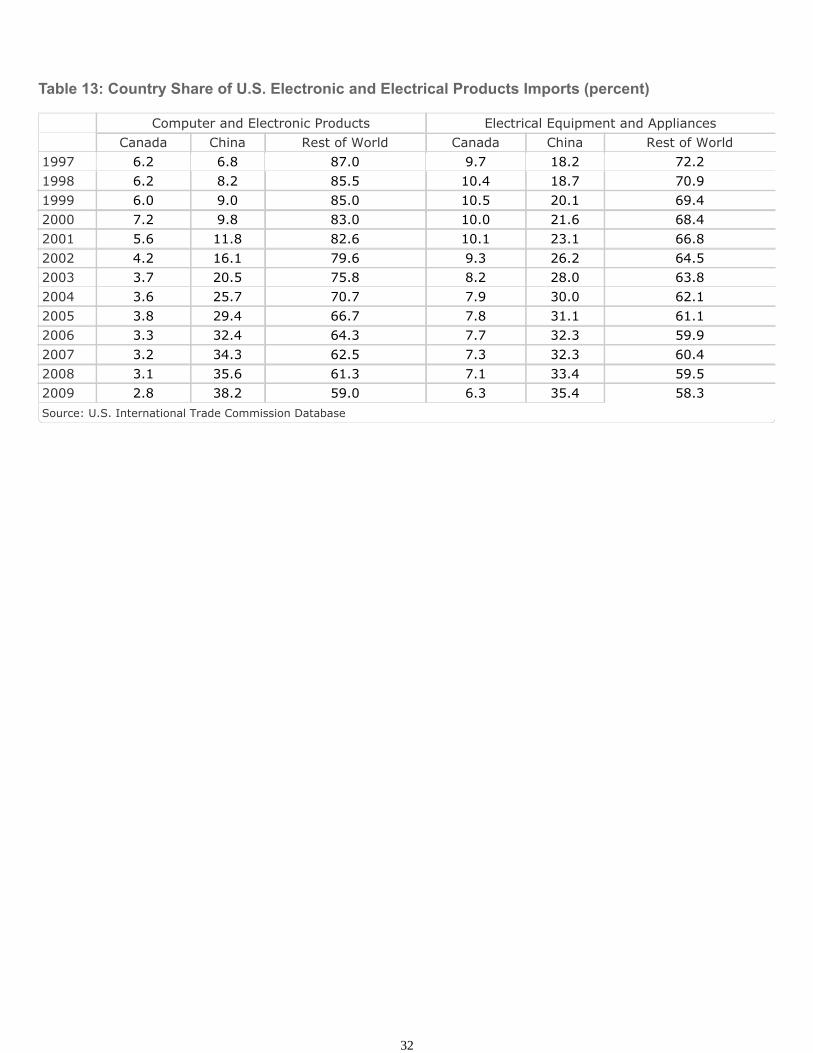
Table 13: Country Share of U.S. Electronic and Electrical Products Imports (percent)
Computer and Electronic Products Electrical Equipment and Appliances Canada China Rest of World Canada China Rest of World
Source: U.S. International Trade Commission Database
1997 6.2 6.8 87.0 9.7 18.2 72.21998 6.2 8.2 85.5 10.4 18.7 70.91999 6.0 9.0 85.0 10.5 20.1 69.42000 7.2 9.8 83.0 10.0 21.6 68.42001 5.6 11.8 82.6 10.1 23.1 66.82002 4.2 16.1 79.6 9.3 26.2 64.52003 3.7 20.5 75.8 8.2 28.0 63.82004 3.6 25.7 70.7 7.9 30.0 62.12005 3.8 29.4 66.7 7.8 31.1 61.12006 3.3 32.4 64.3 7.7 32.3 59.92007 3.2 34.3 62.5 7.3 32.3 60.42008 3.1 35.6 61.3 7.1 33.4 59.52009 2.8 38.2 59.0 6.3 35.4 58.3
32

Charts
Chart 1: Plant Turnover, Skilled Labour and Innovation in the Electronic and Electrical Product(EEP) Industry Relative to the Manufacturing Sector
Turnover: average annual share (%) of entrants and exits in total number of plants in 1997–2006Skilled labour: Average share (%) of hours worked by workers with university education or above in 1997–2006R&D intensity: average ratio (%) of business expenditures on research and development to value added in1997-2006
Source: Statistics Canada
33
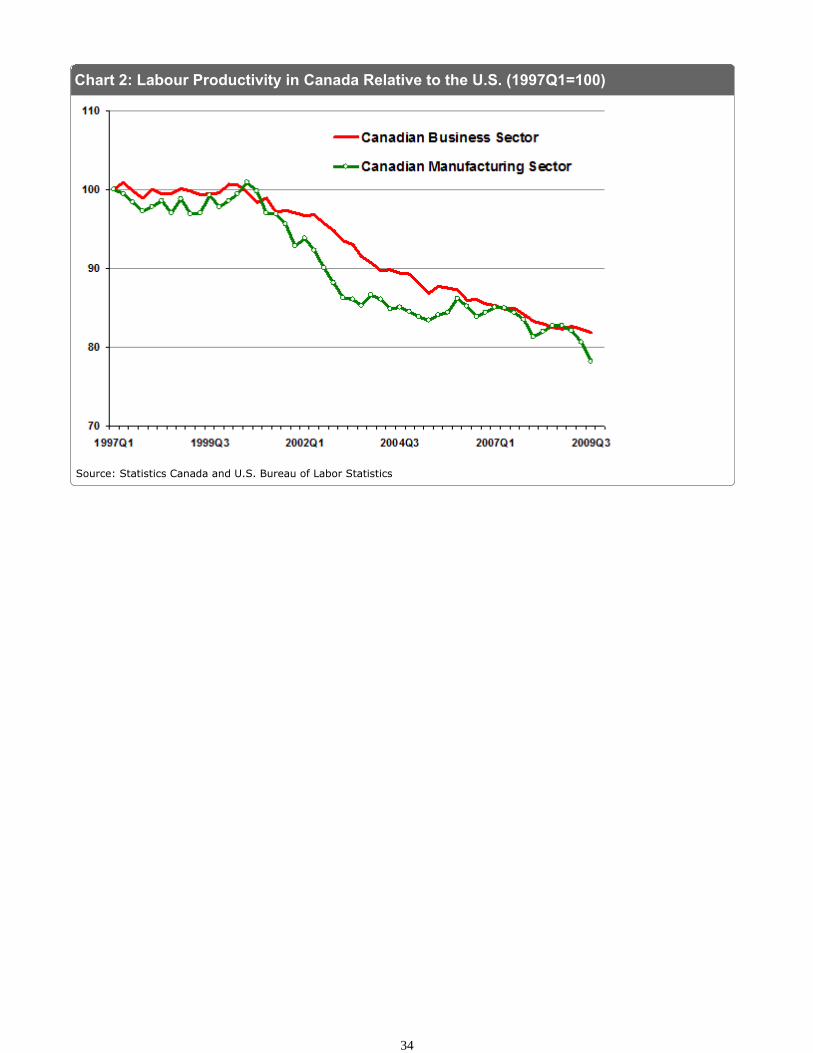
Chart 2: Labour Productivity in Canada Relative to the U.S. (1997Q1=100)
Source: Statistics Canada and U.S. Bureau of Labor Statistics
34