industrial and commercial bank of china limited third...
TRANSCRIPT
1
Hong Kong Exchanges and Clearing Limited and The Stock Exchange of Hong Kong Limited take no responsibility for the
contents of this announcement, make no representation as to its accuracy or completeness and expressly disclaim any liability
whatsoever for any loss howsoever arising from or in reliance upon the whole or any part of the contents of this announcement.
Stock Code: 1398USD Preference Shares Stock Code: 4603EUR Preference Shares Stock Code: 4604
RMB Preference Shares Stock Code: 84602
INDUSTRIAL AND COMMERCIAL BANK OF CHINA LIMITEDTHIRD QUARTERLY REPORT OF 2019
The Board of Directors of Industrial and Commercial Bank of China Limited (“the Bank”) announces the results of the Bank and its subsidiaries (“the Group”) for the third quarter ended 30 September 2019. This report is made in accordance with Part XIVA of the Securities and Futures Ordinance (Chapter 571 of the Laws of Hong Kong) and Rule 13.09 of the Rules Governing the Listing of Securities on The Stock Exchange of Hong Kong Limited.
1. IMPORTANT NOTICE
1.1 The Board of Directors, the Board of Supervisors, Directors, Supervisors and Senior Management members of Industrial and Commercial Bank of China Limited undertake that the information in this report contains no false record, misleading statement or material omission; and assume individual and joint and several liability for the authenticity, accuracy and completeness of the information in this report.
1.2 The Third Quarterly Report of 2019 has been considered and approved at the meeting of the Board of Directors of the Bank held on 25 October 2019. There were 14 directors eligible for attending the meeting, of whom 13 directors attended the meeting in person and 1 director attended the meeting by proxy, namely, Mr. Hu Hao appointed Mr. Gu Shu, Vice Chairman of the Board of Directors, to attend the meeting and exercise the voting right on his behalf.
1.3 These quarterly financial statements have not been audited.
1.4 Mr. Chen Siqing, Legal Representative of the Bank, Mr. Gu Shu, President in charge of finance of the Bank, and Mr. Zhang Wenwu, General Manager of the Finance and Accounting Department of the Bank, hereby warrant and guarantee that the financial statements contained in this quarterly report are authentic, accurate and complete.
2
2. CORPORATE INFORMATION
2.1 Basic information
Stock name Stock codeStock exchange onwhich shares are listed
A share 工商銀行 601398 Shanghai Stock Exchange
H share ICBC 1398 The Stock Exchange of Hong Kong Limited
Offshore preference shares
ICBC USDPREF1 4603 The Stock Exchange of Hong Kong LimitedICBC EURPREF1 4604
ICBC CNHPREF1-R 84602
Domestic preference shares
工行優 1 360011 Shanghai Stock Exchange
工行優 2 360036
Board Secretary and Company SecretaryName Guan Xueqing
Address No. 55 Fuxingmennei Avenue, Xicheng District, Beijing, China (Postal code: 100140)
Telephone 86-10-66108608
Facsimile 86-10-66107571
E-mail [email protected]
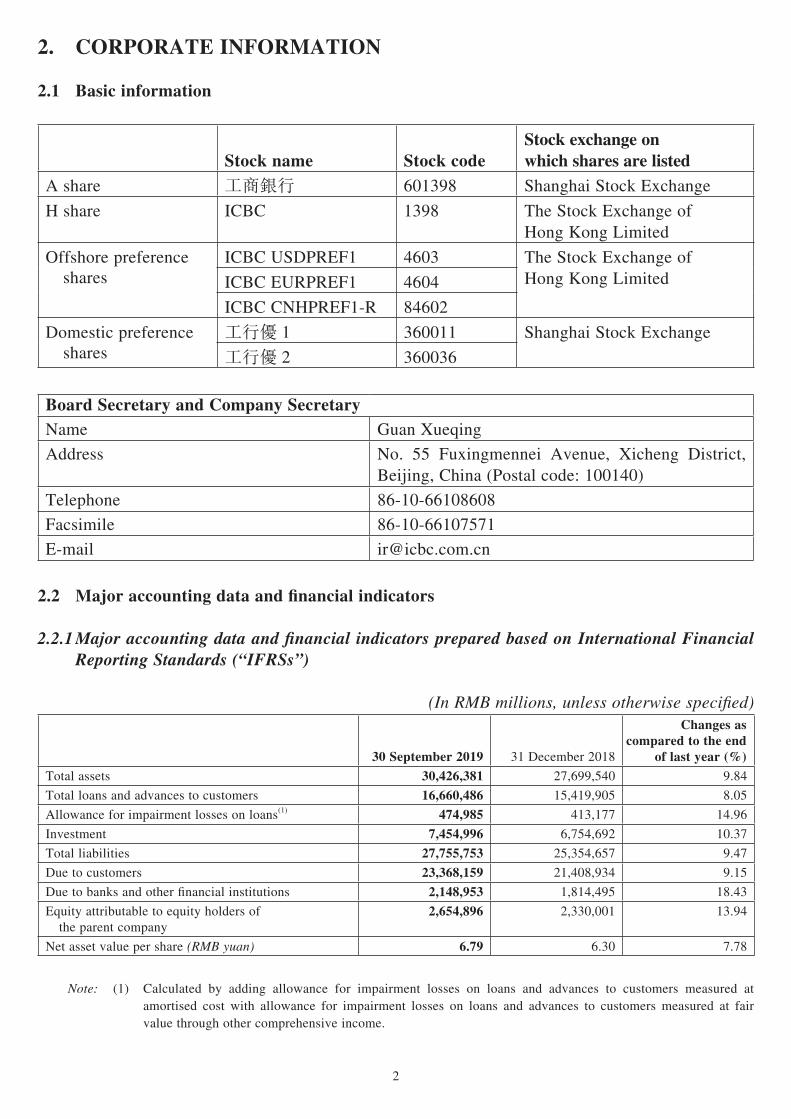
2.2 Major accounting data and financial indicators
2.2.1 Major accounting data and financial indicators prepared based on International Financial Reporting Standards (“IFRSs”)
(In RMB millions, unless otherwise specified)
30 September 2019 31 December 2018
Changes as compared to the end
of last year (%)
Total assets 30,426,381 27,699,540 9.84
Total loans and advances to customers 16,660,486 15,419,905 8.05
Allowance for impairment losses on loans(1) 474,985 413,177 14.96
Investment 7,454,996 6,754,692 10.37
Total liabilities 27,755,753 25,354,657 9.47
Due to customers 23,368,159 21,408,934 9.15
Due to banks and other financial institutions 2,148,953 1,814,495 18.43
Equity attributable to equity holders of the parent company
2,654,896 2,330,001 13.94
Net asset value per share (RMB yuan) 6.79 6.30 7.78
Note: (1) Calculated by adding allowance for impairment losses on loans and advances to customers measured at amortised cost with allowance for impairment losses on loans and advances to customers measured at fair value through other comprehensive income.
3
Three monthsended
30 September2019
Changes ascompared to the
three months ended30 September
2018 (%)
Nine monthsended
30 September2019
Changes ascompared to the
nine months ended30 September
2018 (%)
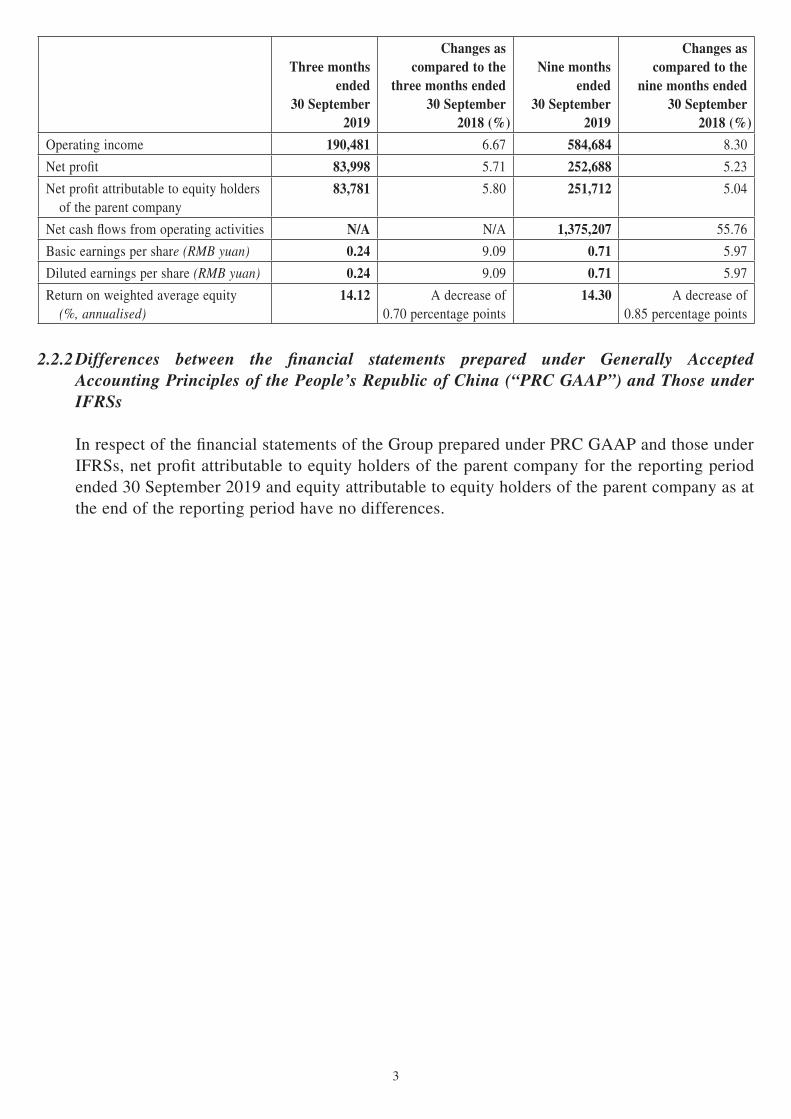
Operating income 190,481 6.67 584,684 8.30
Net profit 83,998 5.71 252,688 5.23
Net profit attributable to equity holders of the parent company
83,781 5.80 251,712 5.04
Net cash flows from operating activities N/A N/A 1,375,207 55.76
Basic earnings per share (RMB yuan) 0.24 9.09 0.71 5.97
Diluted earnings per share (RMB yuan) 0.24 9.09 0.71 5.97
Return on weighted average equity (%, annualised)
14.12 A decrease of0.70 percentage points
14.30 A decrease of0.85 percentage points
2.2.2 Differences between the financial statements prepared under Generally Accepted Accounting Principles of the People’s Republic of China (“PRC GAAP”) and Those under IFRSs
In respect of the financial statements of the Group prepared under PRC GAAP and those under IFRSs, net profit attributable to equity holders of the parent company for the reporting period ended 30 September 2019 and equity attributable to equity holders of the parent company as at the end of the reporting period have no differences.
4
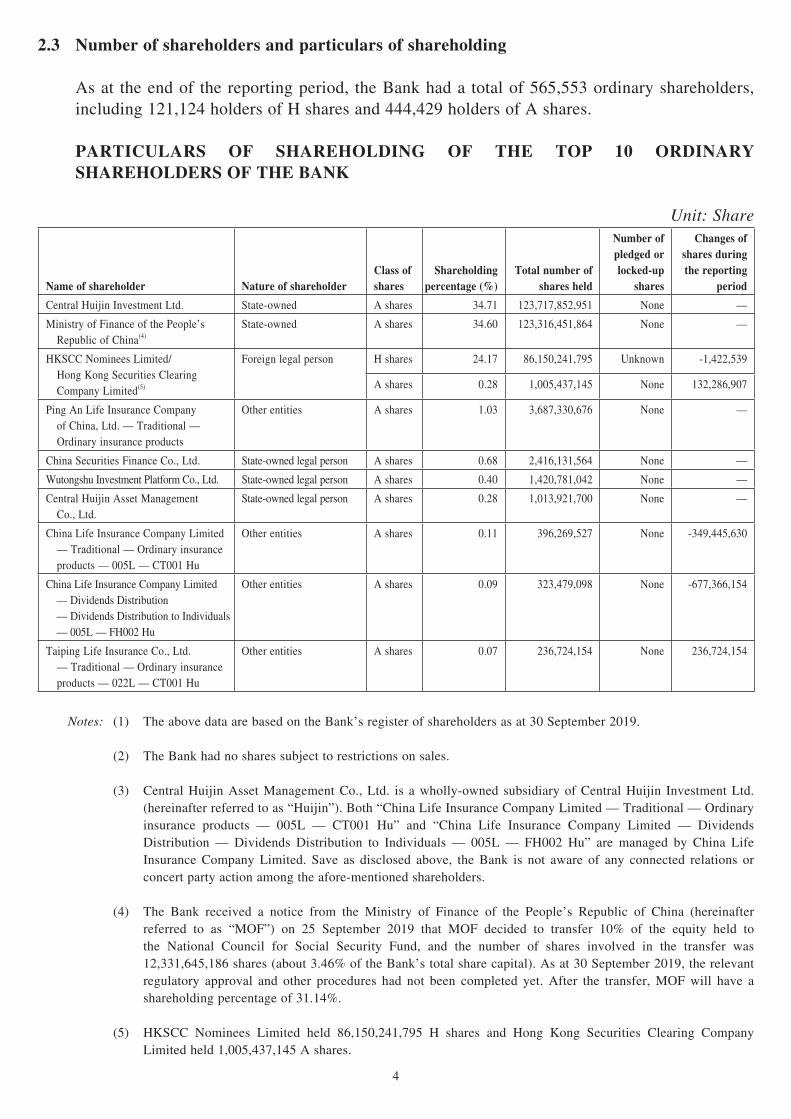
2.3 Number of shareholders and particulars of shareholding
As at the end of the reporting period, the Bank had a total of 565,553 ordinary shareholders, including 121,124 holders of H shares and 444,429 holders of A shares.
PARTICULARS OF SHAREHOLDING OF THE TOP 10 ORDINARY SHAREHOLDERS OF THE BANK
Unit: Share
Name of shareholder Nature of shareholderClass ofshares
Shareholdingpercentage (%)
Total number ofshares held
Number ofpledged orlocked-up
shares
Changes ofshares duringthe reporting
period
Central Huijin Investment Ltd. State-owned A shares 34.71 123,717,852,951 None —
Ministry of Finance of the People’s Republic of China(4)
State-owned A shares 34.60 123,316,451,864 None —
HKSCC Nominees Limited/ Hong Kong Securities Clearing Company Limited(5)
Foreign legal person H shares 24.17 86,150,241,795 Unknown -1,422,539
A shares 0.28 1,005,437,145 None 132,286,907
Ping An Life Insurance Company of China, Ltd. — Traditional — Ordinary insurance products
Other entities A shares 1.03 3,687,330,676 None —
China Securities Finance Co., Ltd. State-owned legal person A shares 0.68 2,416,131,564 None —
Wutongshu Investment Platform Co., Ltd. State-owned legal person A shares 0.40 1,420,781,042 None —
Central Huijin Asset Management Co., Ltd.
State-owned legal person A shares 0.28 1,013,921,700 None —
China Life Insurance Company Limited — Traditional — Ordinary insurance products — 005L — CT001 Hu
Other entities A shares 0.11 396,269,527 None -349,445,630
China Life Insurance Company Limited — Dividends Distribution — Dividends Distribution to Individuals — 005L — FH002 Hu
Other entities A shares 0.09 323,479,098 None -677,366,154
Taiping Life Insurance Co., Ltd. — Traditional — Ordinary insurance products — 022L — CT001 Hu
Other entities A shares 0.07 236,724,154 None 236,724,154
Notes: (1) The above data are based on the Bank’s register of shareholders as at 30 September 2019.
(2) The Bank had no shares subject to restrictions on sales.
(3) Central Huijin Asset Management Co., Ltd. is a wholly-owned subsidiary of Central Huijin Investment Ltd. (hereinafter referred to as “Huijin”). Both “China Life Insurance Company Limited — Traditional — Ordinary insurance products — 005L — CT001 Hu” and “China Life Insurance Company Limited — Dividends Distribution — Dividends Distribution to Individuals — 005L — FH002 Hu” are managed by China Life Insurance Company Limited. Save as disclosed above, the Bank is not aware of any connected relations or concert party action among the afore-mentioned shareholders.
(4) The Bank received a notice from the Ministry of Finance of the People’s Republic of China (hereinafter referred to as “MOF”) on 25 September 2019 that MOF decided to transfer 10% of the equity held to the National Council for Social Security Fund, and the number of shares involved in the transfer was 12,331,645,186 shares (about 3.46% of the Bank’s total share capital). As at 30 September 2019, the relevant regulatory approval and other procedures had not been completed yet. After the transfer, MOF will have a shareholding percentage of 31.14%.
(5) HKSCC Nominees Limited held 86,150,241,795 H shares and Hong Kong Securities Clearing Company Limited held 1,005,437,145 A shares.
5
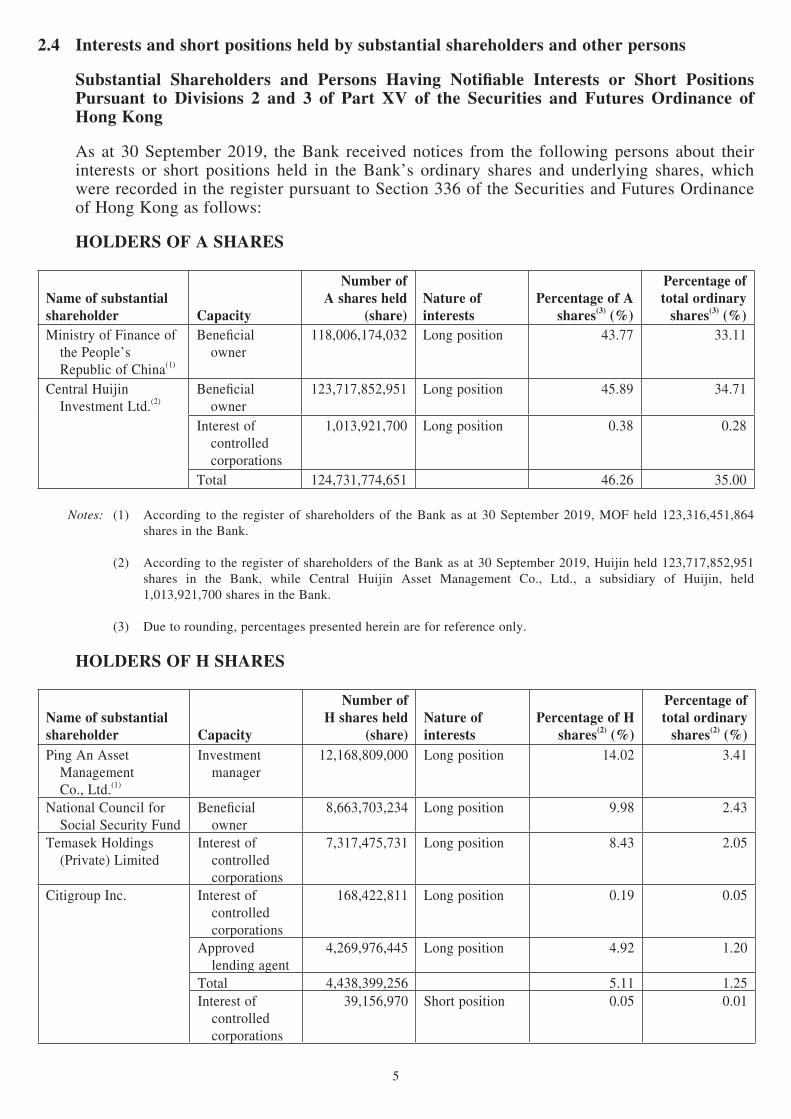
2.4 Interests and short positions held by substantial shareholders and other persons
Substantial Shareholders and Persons Having Notifiable Interests or Short Positions Pursuant to Divisions 2 and 3 of Part XV of the Securities and Futures Ordinance of Hong Kong
As at 30 September 2019, the Bank received notices from the following persons about their interests or short positions held in the Bank’s ordinary shares and underlying shares, which were recorded in the register pursuant to Section 336 of the Securities and Futures Ordinance of Hong Kong as follows:
HOLDERS OF A SHARES
Name of substantialshareholder Capacity
Number ofA shares held
(share)Nature of interests
Percentage of A shares(3) (%)
Percentage of total ordinary
shares(3) (%)Ministry of Finance of the People’s Republic of China(1)
Beneficial owner
118,006,174,032 Long position 43.77 33.11
Central Huijin Investment Ltd.(2)
Beneficial owner
123,717,852,951 Long position 45.89 34.71
Interest of controlled corporations
1,013,921,700 Long position 0.38 0.28
Total 124,731,774,651 46.26 35.00
Notes: (1) According to the register of shareholders of the Bank as at 30 September 2019, MOF held 123,316,451,864 shares in the Bank.
(2) According to the register of shareholders of the Bank as at 30 September 2019, Huijin held 123,717,852,951 shares in the Bank, while Central Huijin Asset Management Co., Ltd., a subsidiary of Huijin, held 1,013,921,700 shares in the Bank.
(3) Due to rounding, percentages presented herein are for reference only.
HOLDERS OF H SHARES
Name of substantialshareholder Capacity
Number ofH shares held
(share)Nature ofinterests
Percentage of H shares(2) (%)
Percentage oftotal ordinary
shares(2) (%)Ping An Asset Management Co., Ltd.(1)
Investment manager
12,168,809,000 Long position 14.02 3.41
National Council for Social Security Fund
Beneficial owner
8,663,703,234 Long position 9.98 2.43
Temasek Holdings (Private) Limited
Interest of controlled corporations
7,317,475,731 Long position 8.43 2.05
Citigroup Inc. Interest of controlled corporations
168,422,811 Long position 0.19 0.05
Approved lending agent
4,269,976,445 Long position 4.92 1.20
Total 4,438,399,256 5.11 1.25Interest of controlled corporations
39,156,970 Short position 0.05 0.01

6
Notes: (1) As confirmed by Ping An Asset Management Co., Ltd., such shares were held by Ping An Asset Management Co., Ltd. on behalf of certain customers (including but not limited to Ping An Life Insurance Company of China, Ltd.) in its capacity as investment manager and the interests in such shares were disclosed based on the latest disclosure of interests form filed by Ping An Asset Management Co., Ltd. for the period ended 30 September 2019 (the date of relevant event being 12 June 2019). Both Ping An Life Insurance Company of China, Ltd. and Ping An Asset Management Co., Ltd. are subsidiaries of Ping An Insurance (Group) Company of China, Ltd. As Ping An Asset Management Co., Ltd. is in a position to fully exercise the voting rights in respect of such shares on behalf of customers and independently exercise the rights of investment and business management in its capacity as investment manager, and is completely independent from Ping An Insurance (Group) Company of China, Ltd., Ping An Insurance (Group) Company of China, Ltd. is exempted from aggregating the interests in such shares as a holding company under the aggregation exemption and disclosing the holding of the same in accordance with the Securities and Futures Ordinance of Hong Kong.
(2) Due to rounding, percentages presented herein are for reference only.
2.5 Number of preference shareholders and particulars of shareholding
As at the end of the reporting period, the Bank had two offshore preference shareholders (or proxies), 26 domestic preference shareholders of “工行優 1” and 32 domestic preference shareholders of “工行優 2”. During the reporting period, the Bank did not restore any voting right of the preference shares.
PARTICULARS OF SHAREHOLDING OF THE TOP 10 OFFSHORE PREFERENCE SHAREHOLDERS (OR PROXIES)
Unit: Share
Name of shareholderNature of shareholder Class of shares
Increase/decrease
during the reporting
period
Shares heldat the end of
the period
Shareholdingpercentage
(%)
Number ofshares subjectto restrictions
on sales
Number ofpledged orlocked-up
shares
Cede & Co. Foreign legal
person
USD offshore
preference
shares
— 147,000,000 47.9 — Unknown
The Bank of New York
Depository (Nominees)
Limited
Foreign legal
person
RMB offshore
preference
shares
— 120,000,000 39.1 — Unknown
EUR offshore
preference
shares
— 40,000,000 13.0 — Unknown
Notes: (1) The above data are based on the Bank’s register of offshore preference shareholders as at 30 September 2019.
(2) As the issuance of the offshore preference shares above was private offering, the register of preference shareholders presented the information on proxies of placees.
(3) The Bank is not aware of any connected relations or concert party action among the afore-mentioned preference shareholders and among the afore-mentioned preference shareholders and the top 10 ordinary shareholders.
(4) “Shareholding percentage” refers to the percentage of offshore preference shares held by preference shareholders in total number of offshore preference shares.
7
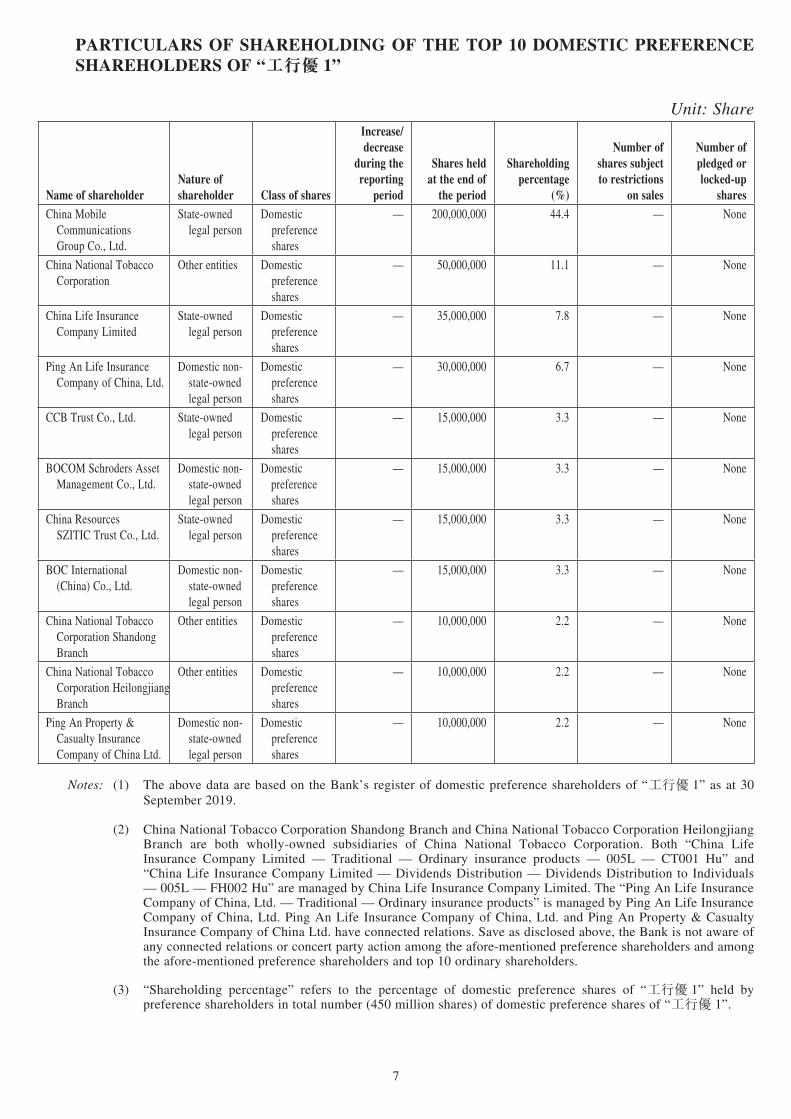
PARTICULARS OF SHAREHOLDING OF THE TOP 10 DOMESTIC PREFERENCE SHAREHOLDERS OF “工行優 1”
Unit: Share
Name of shareholderNature of shareholder Class of shares
Increase/decrease
during the reporting
period
Shares heldat the end of
the period
Shareholdingpercentage
(%)
Number ofshares subjectto restrictions
on sales
Number ofpledged orlocked-up
sharesChina Mobile Communications Group Co., Ltd.
State-owned legal person
Domestic preference shares
— 200,000,000 44.4 — None
China National Tobacco Corporation
Other entities Domestic preference shares
— 50,000,000 11.1 — None
China Life Insurance Company Limited
State-owned legal person
Domestic preference shares
— 35,000,000 7.8 — None
Ping An Life Insurance Company of China, Ltd.
Domestic non- state-owned legal person
Domestic preference shares
— 30,000,000 6.7 — None
CCB Trust Co., Ltd. State-owned legal person
Domestic preference shares
— 15,000,000 3.3 — None
BOCOM Schroders Asset Management Co., Ltd.
Domestic non- state-owned legal person
Domestic preference shares
— 15,000,000 3.3 — None
China Resources SZITIC Trust Co., Ltd.
State-owned legal person
Domestic preference shares
— 15,000,000 3.3 — None
BOC International (China) Co., Ltd.
Domestic non- state-owned legal person
Domestic preference shares
— 15,000,000 3.3 — None
China National Tobacco Corporation Shandong Branch
Other entities Domestic preference shares
— 10,000,000 2.2 — None
China National Tobacco Corporation Heilongjiang Branch
Other entities Domestic preference shares
— 10,000,000 2.2 — None
Ping An Property & Casualty Insurance Company of China Ltd.
Domestic non- state-owned legal person
Domestic preference shares
— 10,000,000 2.2 — None
Notes: (1) The above data are based on the Bank’s register of domestic preference shareholders of “工行優 1” as at 30 September 2019.
(2) China National Tobacco Corporation Shandong Branch and China National Tobacco Corporation Heilongjiang Branch are both wholly-owned subsidiaries of China National Tobacco Corporation. Both “China Life Insurance Company Limited — Traditional — Ordinary insurance products — 005L — CT001 Hu” and “China Life Insurance Company Limited — Dividends Distribution — Dividends Distribution to Individuals — 005L — FH002 Hu” are managed by China Life Insurance Company Limited. The “Ping An Life Insurance Company of China, Ltd. — Traditional — Ordinary insurance products” is managed by Ping An Life Insurance Company of China, Ltd. Ping An Life Insurance Company of China, Ltd. and Ping An Property & Casualty Insurance Company of China Ltd. have connected relations. Save as disclosed above, the Bank is not aware of any connected relations or concert party action among the afore-mentioned preference shareholders and among the afore-mentioned preference shareholders and top 10 ordinary shareholders.
(3) “Shareholding percentage” refers to the percentage of domestic preference shares of “工行優 1” held by preference shareholders in total number (450 million shares) of domestic preference shares of “工行優 1”.

8
PARTICULARS OF SHAREHOLDING OF THE TOP 10 DOMESTIC PREFERENCE SHAREHOLDERS OF “工行優 2”
Unit: Share
Name of shareholderNature ofshareholder Class of shares
Increase/decrease
during the reporting
period
Shares heldat the end of
the period
Shareholding percentage
(%)
Number ofshares subjectto restrictions
on sales
Number of pledged or locked-up
shares
Bosera Asset Management Co., Limited
State-owned legal person
Domestic preference shares
150,000,000 150,000,000 21.4 — None
China Life Insurance Company Limited
State-owned legal person
Domestic preference shares
120,000,000 120,000,000 17.1 — None
China Mobile Communications Group Co., Ltd.
State-owned legal person
Domestic preference shares
100,000,000 100,000,000 14.3 — None
Shaanxi International Trust Co., Ltd.
State-owned legal person
Domestic preference shares
70,000,000 70,000,000 10.0 — None
CCB Trust Co., Ltd. State-owned legal person
Domestic preference shares
70,000,000 70,000,000 10.0 — None
China National Tobacco Corporation
Other entities Domestic preference shares
50,000,000 50,000,000 7.1 — None
Shanghai Tobacco Group Co., Ltd.
Other entities Domestic preference shares
30,000,000 30,000,000 4.3 — None
Bank of Beijing Co., Ltd. Domestic non- state-owned legal person
Domestic preference shares
20,000,000 20,000,000 2.9 — None
BOCOM Schroders Asset Management Co., Ltd.
Domestic non- state-owned legal person
Domestic preference shares
15,000,000 15,000,000 2.1 — None
Ping An Property & Casualty Insurance Company of China Ltd.
Domestic non- state-owned legal person
Domestic preference shares
15,000,000 15,000,000 2.1 — None
Notes: (1) The above data are based on the Bank’s register of domestic preference shareholders of “工行優 2” as at 30 September 2019.
(2) Shanghai Tobacco Group Co., Ltd., China National Tobacco Corporation Shandong Branch and China National Tobacco Corporation Heilongjiang Branch are all wholly-owned subsidiaries of China National Tobacco Corporation. Both “China Life Insurance Company Limited — Traditional — Ordinary insurance products — 005L — CT001 Hu” and “China Life Insurance Company Limited — Dividends Distribution — Dividends Distribution to Individuals — 005L — FH002 Hu” are managed by China Life Insurance Company Limited. The “Ping An Life Insurance Company of China, Ltd. — Traditional — Ordinary insurance products” is managed by Ping An Life Insurance Company of China, Ltd. Ping An Life Insurance Company of China, Ltd. and Ping An Property & Casualty Insurance Company of China Ltd. have connected relations. Save as disclosed above, the Bank is not aware of any connected relations or concert party action among the afore-mentioned preference shareholders and among the afore-mentioned preference shareholders and top 10 ordinary shareholders.
(3) “Shareholding percentage” refers to the percentage of domestic preference shares of “工行優 2” held by preference shareholders in total number (700 million shares) of domestic preference shares of “工行優 2”.

9
3. BRIEF ANALYSIS ON OVERALL OPERATING ACTIVITIES IN THE THIRD QUARTER
(The financial data herein are presented in RMB unless otherwise indicated.)
Set out below are the highlights of the operating results of the Group for the reporting period:
Net profit amounted to RMB252,688 million, representing an increase of 5.23% compared with the same period of last year. Annualised return on average total assets was 1.16%. Annualised return on weighted average equity was 14.30%.
Operating income amounted to RMB584,684 million, representing an increase of 8.30% compared with the same period of last year. Net interest income was RMB453,146 million, representing an increase of 6.97% compared with the same period of last year. Annualised net interest margin stood at 2.26%. Non-interest income reported RMB131,538 million, representing an increase of 13.15% compared with the same period of last year, of which net fee and commission income was RMB124,635 million, representing an increase of 9.58% compared with the same period of last year. Operating expenses (excluding taxes and surcharges) were RMB130,019 million, representing an increase of 6.11% compared with the same period of last year. Cost-to-income ratio was 22.24%.
As at the end of the reporting period, total assets amounted to RMB30,426,381 million, representing an increase of RMB2,726,841 million or 9.84% over the end of the previous year. Total loans and advances to customers (excluding accrued interest) amounted to RMB16,660,486 million, representing an increase of RMB1,240,581 million or 8.05% over the end of last year, of which RMB loans of domestic branches grew by RMB1,152,644 million or 8.48%. In terms of the structure, corporate loans were RMB10,040,360 million, personal loans were RMB6,231,251 million and discounted bills were RMB388,875 million. Investments reached RMB7,454,996 million, representing an increase of RMB700,304 million or 10.37% over the end of last year.
Total liabilities amounted to RMB27,755,753 million, representing an increase of RMB2,401,096 million or 9.47% over the end of the previous year. Due to customers amounted to RMB23,368,159 million, representing an increase of RMB1,959,225 million or 9.15% over the end of the previous year. In terms of the structure, time deposits were RMB11,964,405 million, demand deposits were RMB10,943,680 million, other deposits were RMB225,851 million and accrued interest was RMB234,223 million.
Shareholders’ equity amounted to RMB2,670,628 million, representing an increase of RMB325,745 million or 13.89% over the end of last year.
According to the five-category classification of loans, the balance of non-performing loans (“NPLs”) amounted to RMB239,785 million, representing an increase of RMB4,701 million over the end of the previous year. The NPL ratio was 1.44%, representing a decrease of 0.08 percentage points over the end of the previous year. The allowance to NPL ratio stood at 198.09%, representing an increase of 22.33 percentage points over the end of the previous year.
The core tier 1 capital adequacy ratio was 12.93%, the tier 1 capital adequacy ratio was 14.16% and the capital adequacy ratio was 16.65%1, all meeting regulatory requirements.
1 Calculated in accordance with the Regulation Governing Capital of Commercial Banks (Provisional).
10
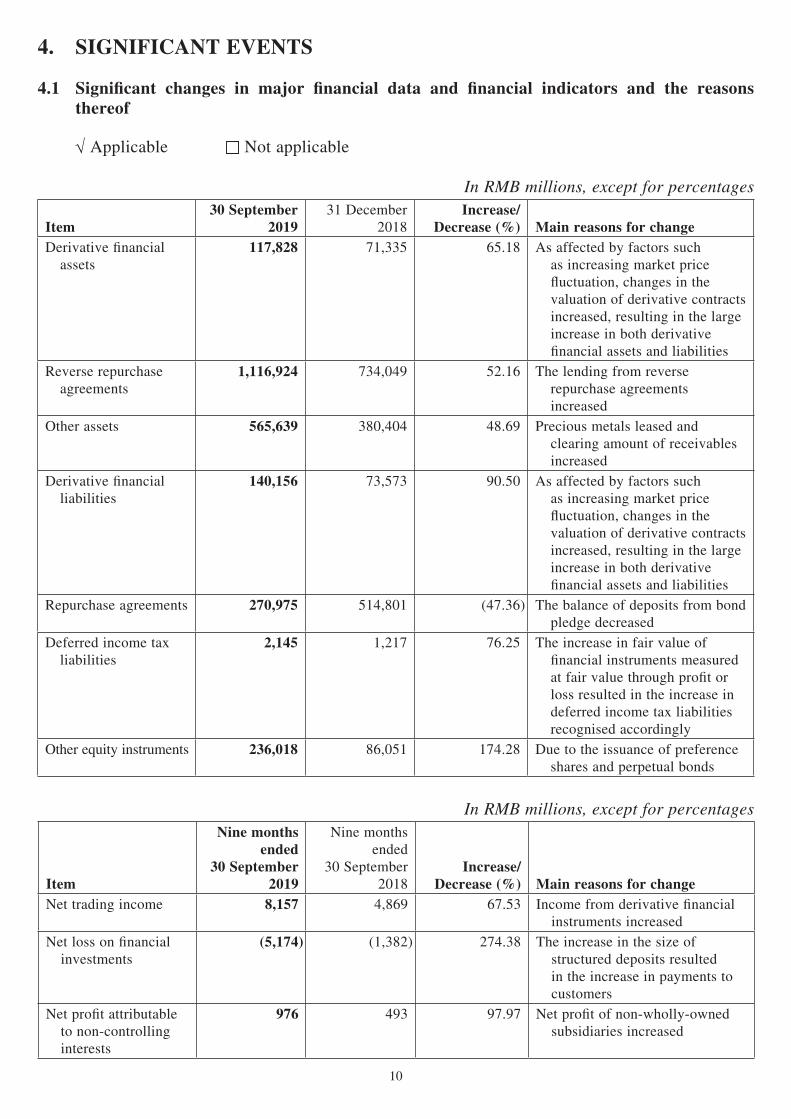
4. SIGNIFICANT EVENTS
4.1 Significant changes in major financial data and financial indicators and the reasons thereof
√ Applicable Not applicable
In RMB millions, except for percentages
Item30 September
201931 December
2018Increase/
Decrease (%) Main reasons for changeDerivative financial assets
117,828 71,335 65.18 As affected by factors such as increasing market price fluctuation, changes in the valuation of derivative contracts increased, resulting in the large increase in both derivative financial assets and liabilities
Reverse repurchase agreements
1,116,924 734,049 52.16 The lending from reverse repurchase agreements increased
Other assets 565,639 380,404 48.69 Precious metals leased and clearing amount of receivables increased
Derivative financial liabilities
140,156 73,573 90.50 As affected by factors such as increasing market price fluctuation, changes in the valuation of derivative contracts increased, resulting in the large increase in both derivative financial assets and liabilities
Repurchase agreements 270,975 514,801 (47.36) The balance of deposits from bond pledge decreased
Deferred income tax liabilities
2,145 1,217 76.25 The increase in fair value of financial instruments measured at fair value through profit or loss resulted in the increase in deferred income tax liabilities recognised accordingly
Other equity instruments 236,018 86,051 174.28 Due to the issuance of preference shares and perpetual bonds
In RMB millions, except for percentages
Item
Nine months ended
30 September 2019
Nine months ended
30 September 2018
Increase/Decrease (%) Main reasons for change
Net trading income 8,157 4,869 67.53 Income from derivative financial instruments increased
Net loss on financial investments
(5,174) (1,382) 274.38 The increase in the size of structured deposits resulted in the increase in payments to customers
Net profit attributable to non-controlling interests
976 493 97.97 Net profit of non-wholly-owned subsidiaries increased
11
4.2 Progress of significant events and analysis of their effects and solutions
√ Applicable Not applicable
4.2.1 Issuance of Undated Additional Tier 1 Capital Bonds
As approved by the China Banking and Insurance Regulatory Commission and the People’s Bank of China, the Bank made a public issuance of RMB80.0 billion undated additional tier 1 capital bonds in China’s national inter-bank bond market in July 2019. Please refer to the announcements published by the Bank on the “HKEXnews” website of Hong Kong Exchanges and Clearing Limited (hereinafter referred to as “HKEX”) and website of Shanghai Stock Exchange for details.
4.2.2 Issuance of Preference Shares
As approved by the China Banking and Insurance Regulatory Commission and the China Securities Regulatory Commission, the Bank made a non-public issuance of RMB70.0 billion domestic preference shares in September 2019. With the approval of the Shanghai Stock Exchange, the domestic preference shares were listed on the integrated trading platform of the Shanghai Stock Exchange for transfer as of 16 October 2019. Please refer to the announcements published by the Bank on the “HKEXnews” website of HKEX and website of Shanghai Stock Exchange for details.
4.2.3 Progress of the Redemption of Offshore Preference Shares
In 2014, the Bank issued USD2.94 billion USD Preference Shares and RMB12.0 billion RMB Preference Shares in the offshore market. On 29 August 2019, the Board of Directors of the Bank considered and approved the Proposal on Exercising the Redemption Right of the Offshore Preference Shares. The Bank proposes to exercise the redemption right of all of the aforesaid offshore preference shares on 10 December 2019, under the condition that the approval from the China Banking and Insurance Regulatory Commission is obtained. In October 2019, the Bank received a reply letter from the China Banking and Insurance Regulatory Commission, pursuant to which, no objections were raised to the Bank’s redeeming USD2.94 billion USD Preference Shares and RMB12.0 billion RMB Preference Shares. Please refer to the announcements published by the Bank on the “HKEXnews” website of HKEX and website of Shanghai Stock Exchange for details.
4.3 Implementation of cash dividend policy during the reporting period
√ Applicable Not applicable
Upon the approval at the Annual General Meeting for the Year 2018 held on 20 June 2019, the Bank has distributed cash dividends of about RMB89,315 million, or RMB2.506 per ten shares (pre-tax), for the period from 1 January 2018 to 31 December 2018 to the ordinary shareholders whose names appeared on the register of shareholders upon the close of market on 2 July 2019.

12
During the reporting period, the Bank did not distribute any dividend on the preference shares. The Bank considered and approved the implementation of dividend distribution for preference shares at the meeting of the Board of Directors convened on 25 October 2019, and decided to distribute total dividends of RMB2,025 million for domestic preference shares on 25 November 2019 at a dividend rate of 4.5% (pre-tax, and tax payable arising from dividend income gained by domestic preference shareholders shall be borne by them in accordance with relevant laws and regulations); and to distribute total dividends equivalent to about RMB2,512 million (estimated based on the exchange rate at the end of September, and the actual sum will depend on the exchange rate on the day of announcement) for offshore preference shares on 10 December 2019 at a dividend rate of 6% (post-tax, i.e., actual dividend rate received by offshore preference shareholders).
4.4 Unfulfilled commitments during the reporting period
Applicable √ Not applicable
4.5 Warnings and explanations on estimated loss or significant changes as compared to the same period of last year in net accumulated profit from the beginning of the year to the end of the next reporting period
Applicable √ Not applicable
5. APPENDICES
5.1 Financial statements prepared based on IFRSs are attached in Appendix I to this report
5.2 Capital adequacy ratios disclosed as per the Regulation Governing Capital of Commercial Banks (Provisional), leverage ratio disclosed as per the Administrative Measures for Leverage Ratio of Commercial Banks (Revised) and liquidity coverage ratio disclosed as per the Administrative Measures for the Information Disclosure of Liquidity Coverage Ratio of Commercial Banks are attached in Appendix II to this report
13
6. RELEASE OF QUARTERLY REPORT
The report will be published simultaneously on the “HKEXnews” website of HKEX (www.hkexnews.hk) and the website of the Bank (www.icbc-ltd.com). The quarterly report prepared in accordance with PRC GAAP will also be published simultaneously on the website of the Shanghai Stock Exchange (www.sse.com.cn) and the website of the Bank (www.icbc-ltd.com).
This report is prepared in both Chinese and English. In case of any discrepancy between the two versions, the Chinese version shall prevail.
By Order ofThe Board of Directors of
Industrial and Commercial Bank of China Limited
Beijing, China25 October 2019
As at the date of this announcement, the Board of Directors comprises Mr. CHEN Siqing, Mr. GU Shu and Mr. HU Hao as executive
directors, Mr. YE Donghai, Mr. ZHENG Fuqing, Ms. MEI Yingchun, Mr. DONG Shi and Mr. LU Yongzhen as non-executive
directors, Mr. Anthony Francis NEOH, Mr. YANG Siu Shun, Ms. Sheila Colleen BAIR, Mr. SHEN Si, Mr. Nout WELLINK and
Mr. Fred Zuliu HU as independent non-executive directors.
14
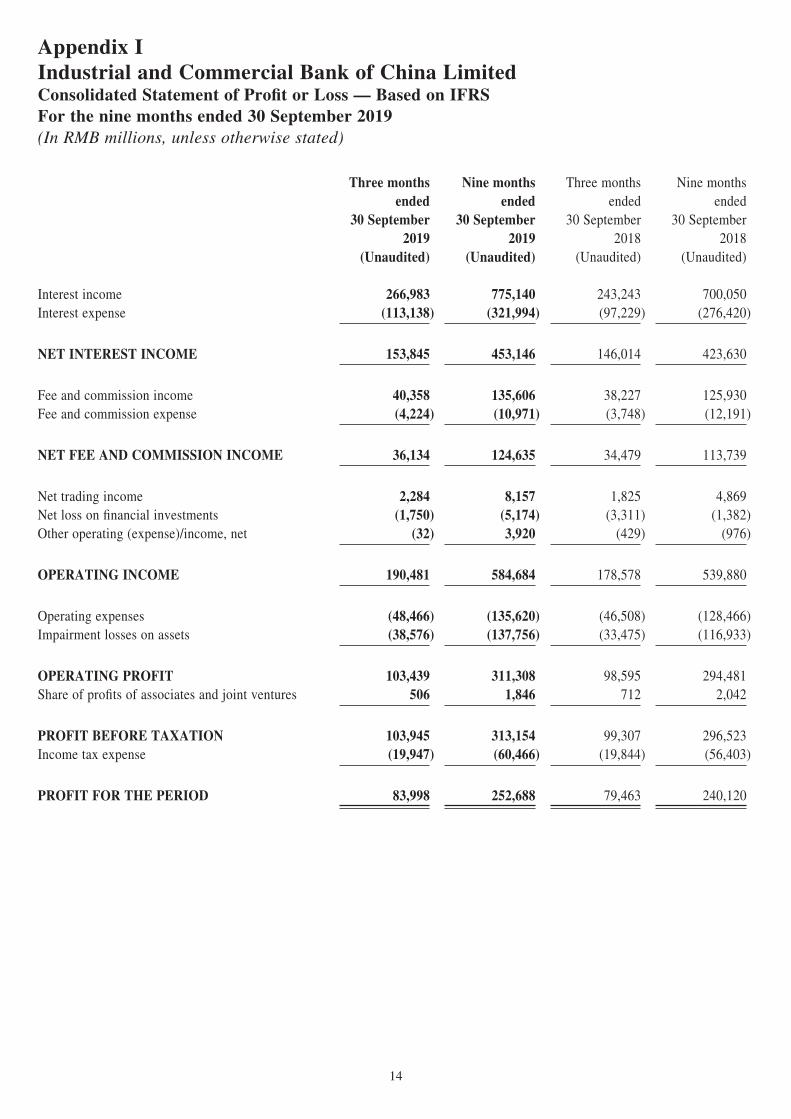
Appendix IIndustrial and Commercial Bank of China LimitedConsolidated Statement of Profit or Loss — Based on IFRSFor the nine months ended 30 September 2019(In RMB millions, unless otherwise stated)
Three monthsended
30 September2019
Nine months ended
30 September2019
Three months ended
30 September2018
Nine monthsended
30 September2018
(Unaudited) (Unaudited) (Unaudited) (Unaudited)
Interest income 266,983 775,140 243,243 700,050Interest expense (113,138) (321,994) (97,229) (276,420)
NET INTEREST INCOME 153,845 453,146 146,014 423,630
Fee and commission income 40,358 135,606 38,227 125,930Fee and commission expense (4,224) (10,971) (3,748) (12,191)
NET FEE AND COMMISSION INCOME 36,134 124,635 34,479 113,739
Net trading income 2,284 8,157 1,825 4,869Net loss on financial investments (1,750) (5,174) (3,311) (1,382)Other operating (expense)/income, net (32) 3,920 (429) (976)
OPERATING INCOME 190,481 584,684 178,578 539,880
Operating expenses (48,466) (135,620) (46,508) (128,466)Impairment losses on assets (38,576) (137,756) (33,475) (116,933)
OPERATING PROFIT 103,439 311,308 98,595 294,481Share of profits of associates and joint ventures 506 1,846 712 2,042
PROFIT BEFORE TAXATION 103,945 313,154 99,307 296,523Income tax expense (19,947) (60,466) (19,844) (56,403)
PROFIT FOR THE PERIOD 83,998 252,688 79,463 240,120

15
Industrial and Commercial Bank of China LimitedConsolidated Statement of Profit or Loss — Based on IFRS (continued)For the nine months ended 30 September 2019(In RMB millions, unless otherwise stated)
Three monthsended
30 September2019
Nine months ended
30 September2019
Three months ended
30 September2018
Nine monthsended
30 September2018
(Unaudited) (Unaudited) (Unaudited) (Unaudited)
Attributable to: Equity holders of the parent company 83,781 251,712 79,185 239,627 Non-controlling interests 217 976 278 493
Profit for the period 83,998 252,688 79,463 240,120
EARNINGS PER SHARE — Basic (RMB yuan) 0.24 0.71 0.22 0.67 — Diluted (RMB yuan) 0.24 0.71 0.22 0.67
Chen Siqing Gu Shu Zhang WenwuChairman President General Manager of the Finance
and Accounting Department
16
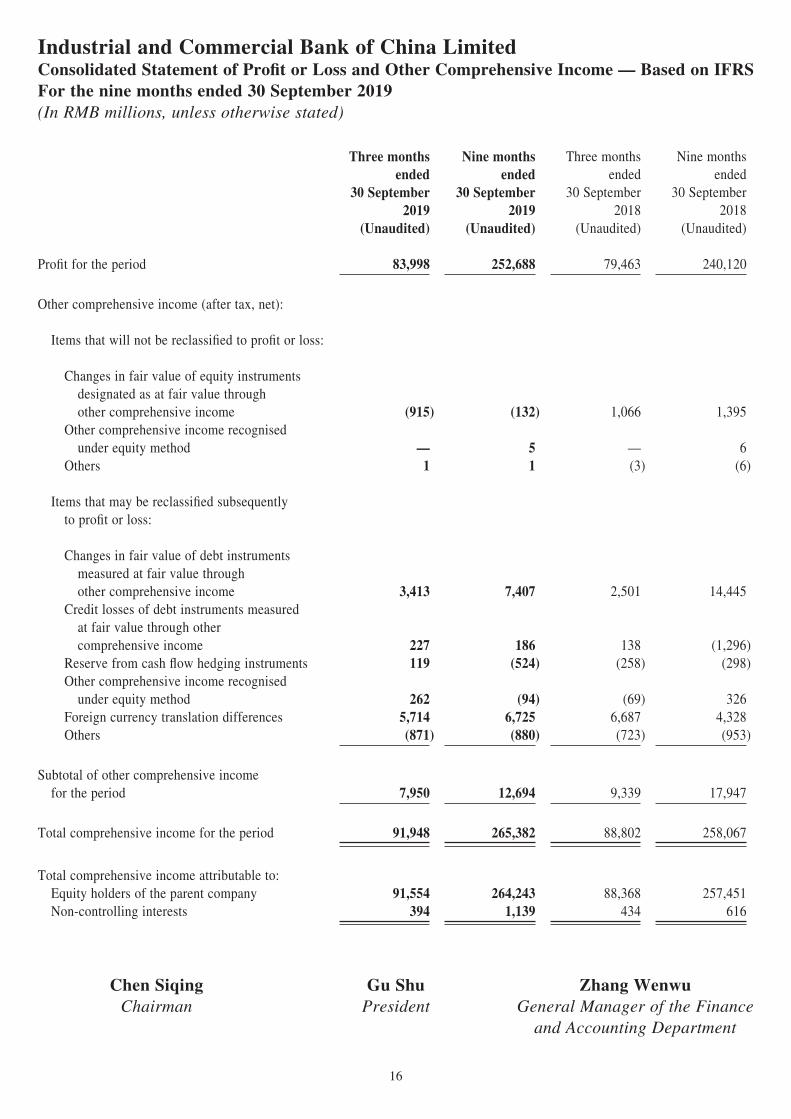
Industrial and Commercial Bank of China LimitedConsolidated Statement of Profit or Loss and Other Comprehensive Income — Based on IFRSFor the nine months ended 30 September 2019(In RMB millions, unless otherwise stated)
Three monthsended
30 September2019
Nine months ended
30 September2019
Three months ended
30 September2018
Nine monthsended
30 September2018
(Unaudited) (Unaudited) (Unaudited) (Unaudited)
Profit for the period 83,998 252,688 79,463 240,120
Other comprehensive income (after tax, net):
Items that will not be reclassified to profit or loss:
Changes in fair value of equity instruments designated as at fair value through other comprehensive income (915) (132) 1,066 1,395 Other comprehensive income recognised under equity method — 5 — 6 Others 1 1 (3) (6)
Items that may be reclassified subsequently to profit or loss:
Changes in fair value of debt instruments measured at fair value through other comprehensive income 3,413 7,407 2,501 14,445 Credit losses of debt instruments measured at fair value through other comprehensive income 227 186 138 (1,296) Reserve from cash flow hedging instruments 119 (524) (258) (298) Other comprehensive income recognised under equity method 262 (94) (69) 326 Foreign currency translation differences 5,714 6,725 6,687 4,328 Others (871) (880) (723) (953)
Subtotal of other comprehensive income for the period 7,950 12,694 9,339 17,947
Total comprehensive income for the period 91,948 265,382 88,802 258,067
Total comprehensive income attributable to: Equity holders of the parent company 91,554 264,243 88,368 257,451 Non-controlling interests 394 1,139 434 616
Chen Siqing Gu Shu Zhang WenwuChairman President General Manager of the Finance
and Accounting Department
17
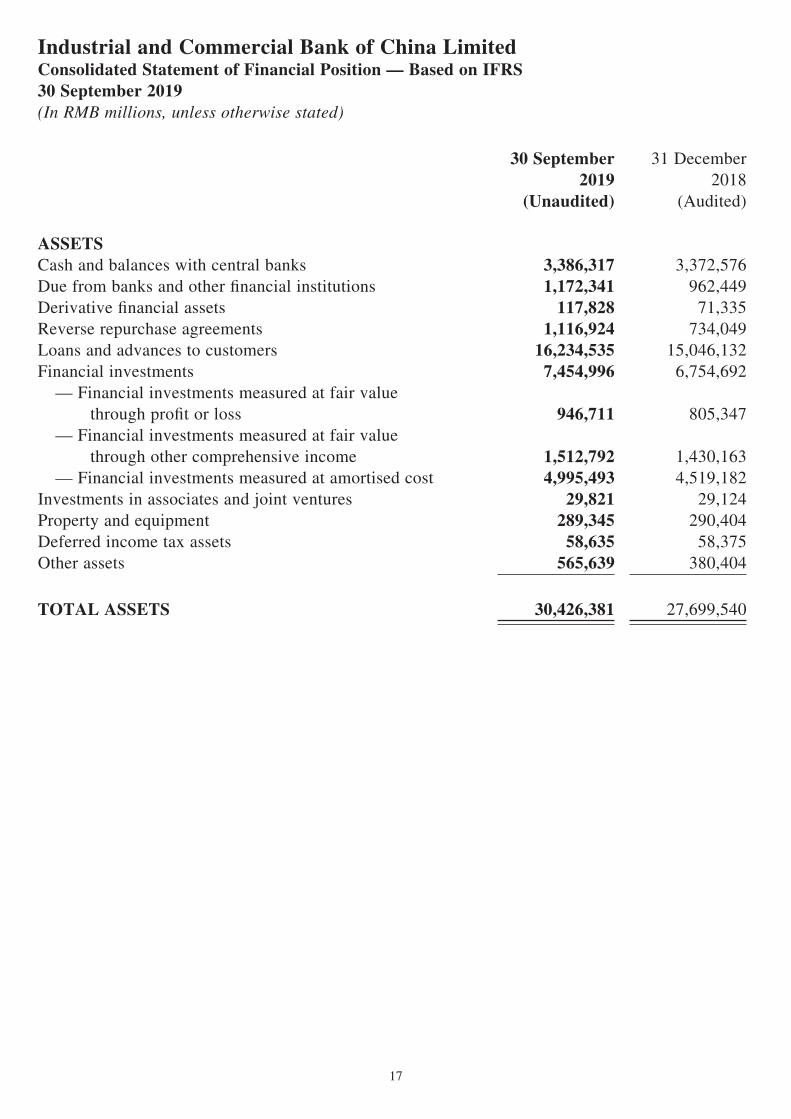
Industrial and Commercial Bank of China LimitedConsolidated Statement of Financial Position — Based on IFRS30 September 2019(In RMB millions, unless otherwise stated)
30 September 2019
31 December 2018
(Unaudited) (Audited)
ASSETSCash and balances with central banks 3,386,317 3,372,576Due from banks and other financial institutions 1,172,341 962,449Derivative financial assets 117,828 71,335Reverse repurchase agreements 1,116,924 734,049Loans and advances to customers 16,234,535 15,046,132Financial investments 7,454,996 6,754,692 — Financial investments measured at fair value through profit or loss 946,711 805,347 — Financial investments measured at fair value through other comprehensive income 1,512,792 1,430,163 — Financial investments measured at amortised cost 4,995,493 4,519,182Investments in associates and joint ventures 29,821 29,124Property and equipment 289,345 290,404Deferred income tax assets 58,635 58,375Other assets 565,639 380,404
TOTAL ASSETS 30,426,381 27,699,540
18
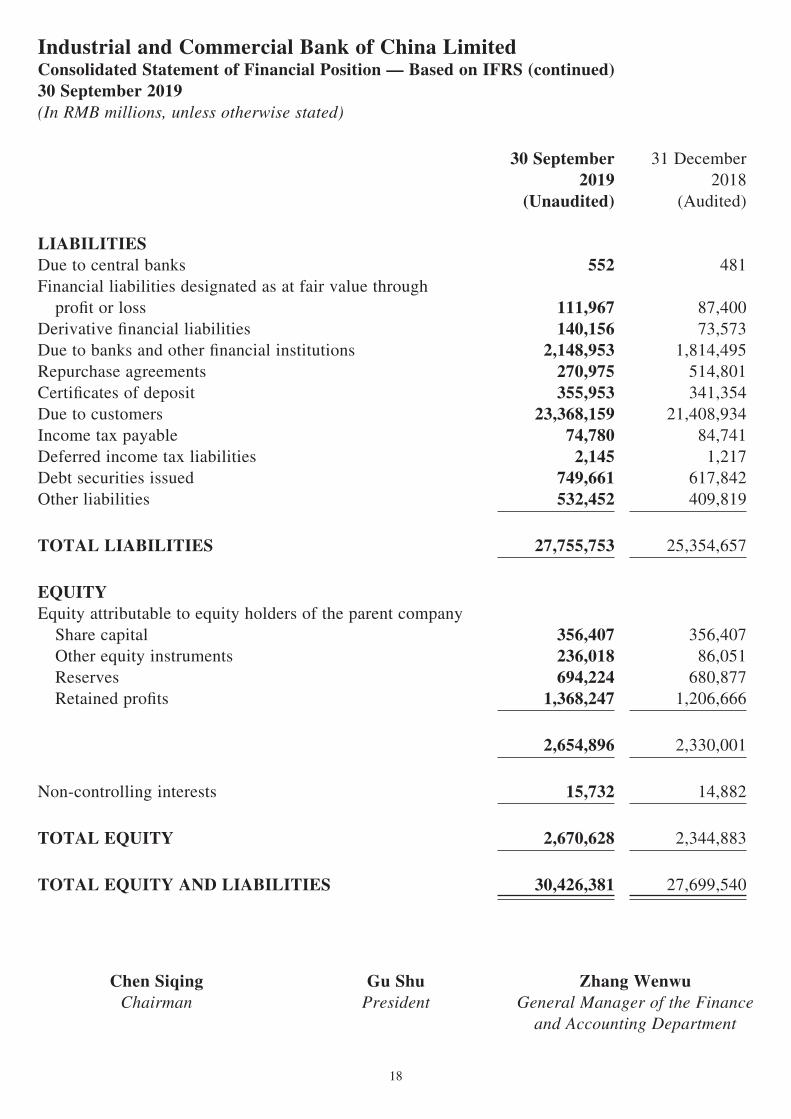
Industrial and Commercial Bank of China LimitedConsolidated Statement of Financial Position — Based on IFRS (continued)30 September 2019(In RMB millions, unless otherwise stated)
30 September 2019
31 December 2018
(Unaudited) (Audited)
LIABILITIESDue to central banks 552 481Financial liabilities designated as at fair value through profit or loss 111,967 87,400Derivative financial liabilities 140,156 73,573Due to banks and other financial institutions 2,148,953 1,814,495Repurchase agreements 270,975 514,801Certificates of deposit 355,953 341,354Due to customers 23,368,159 21,408,934Income tax payable 74,780 84,741Deferred income tax liabilities 2,145 1,217Debt securities issued 749,661 617,842Other liabilities 532,452 409,819
TOTAL LIABILITIES 27,755,753 25,354,657
EQUITYEquity attributable to equity holders of the parent company Share capital 356,407 356,407 Other equity instruments 236,018 86,051 Reserves 694,224 680,877 Retained profits 1,368,247 1,206,666
2,654,896 2,330,001
Non-controlling interests 15,732 14,882
TOTAL EQUITY 2,670,628 2,344,883
TOTAL EQUITY AND LIABILITIES 30,426,381 27,699,540
Chen Siqing Gu Shu Zhang WenwuChairman President General Manager of the Finance
and Accounting Department

19
Industrial and Commercial Bank of China LimitedConsolidated Cash Flow Statement — Based on IFRSFor the nine months ended 30 September 2019(In RMB millions, unless otherwise stated)
Nine months ended
30 September2019
Nine months ended
30 September2018
(Unaudited) (Unaudited)
CASH FLOWS FROM OPERATING ACTIVITIESProfit before taxation 313,154 296,524Adjustments for: Share of profits of associates and joint ventures (1,846) (2,042) Depreciation 14,227 9,376 Amortisation 2,342 4,474 Amortisation of financial investments (2,439) (115) Impairment losses on assets 137,756 116,933 Unrealised loss on foreign exchange 14,421 24,637 Interest expense on debt securities issued 21,393 17,213 Accreted interest on impaired loans (1,757) (2,019) Net loss on disposal of financial investments 5,676 1,577 Net trading gain on equity investments (1,850) (455) Net (gain)/loss on changes in fair value (10,970) 5,727 Net gain on disposal and overage of property and equipment and other assets (other than repossessed assets) (933) (1,361) Dividend income (502) (195)
488,672 470,274

20
Industrial and Commercial Bank of China LimitedConsolidated Cash Flow Statement — Based on IFRS (continued)For the nine months ended 30 September 2019(In RMB millions, unless otherwise stated)
Nine months ended
30 September2019
Nine months ended
30 September2018
(Unaudited) (Unaudited)
Net decrease/(increase) in operating assets:Due from central banks 112,115 127,341Due from banks and other financial institutions 174,636 (171,499)Financial investments measured at fair value through profit or loss (119,965) (285,657)Reverse repurchase agreements 37,115 185,600Loans and advances to customers (1,246,351) (879,358)Other assets (172,909) (98,279)
(1,215,359) (1,121,852)
Net increase/(decrease) in operating liabilities:Financial liabilities designated as at fair value through profit or loss 20,690 3,309Due to central banks 70 (19)Due to banks and other financial institutions 308,317 284,165Repurchase agreements (243,744) (481,855)Certificates of deposit 2,041 41,845Due to customers 1,892,284 1,675,361Other liabilities 194,526 77,048
2,174,184 1,599,854
Net cash flows from operating activities before tax 1,447,497 948,276Income tax paid (72,290) (65,374)
Net cash flows from operating activities 1,375,207 882,902
21
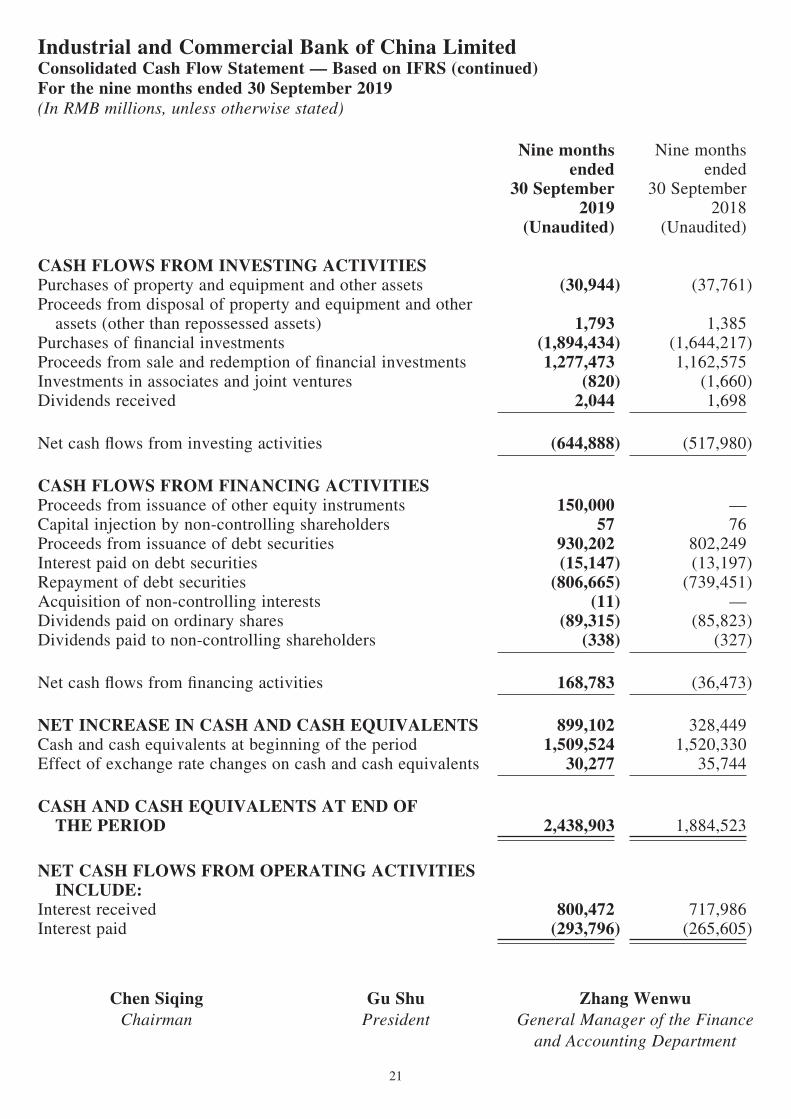
Industrial and Commercial Bank of China LimitedConsolidated Cash Flow Statement — Based on IFRS (continued)For the nine months ended 30 September 2019(In RMB millions, unless otherwise stated)
Nine months ended
30 September2019
Nine months ended
30 September2018
(Unaudited) (Unaudited)
CASH FLOWS FROM INVESTING ACTIVITIESPurchases of property and equipment and other assets (30,944) (37,761)Proceeds from disposal of property and equipment and other assets (other than repossessed assets) 1,793 1,385Purchases of financial investments (1,894,434) (1,644,217)Proceeds from sale and redemption of financial investments 1,277,473 1,162,575Investments in associates and joint ventures (820) (1,660)Dividends received 2,044 1,698
Net cash flows from investing activities (644,888) (517,980)
CASH FLOWS FROM FINANCING ACTIVITIESProceeds from issuance of other equity instruments 150,000 —Capital injection by non-controlling shareholders 57 76 Proceeds from issuance of debt securities 930,202 802,249 Interest paid on debt securities (15,147) (13,197)Repayment of debt securities (806,665) (739,451)Acquisition of non-controlling interests (11) —Dividends paid on ordinary shares (89,315) (85,823)Dividends paid to non-controlling shareholders (338) (327)
Net cash flows from financing activities 168,783 (36,473)
NET INCREASE IN CASH AND CASH EQUIVALENTS 899,102 328,449Cash and cash equivalents at beginning of the period 1,509,524 1,520,330Effect of exchange rate changes on cash and cash equivalents 30,277 35,744
CASH AND CASH EQUIVALENTS AT END OF THE PERIOD 2,438,903 1,884,523
NET CASH FLOWS FROM OPERATING ACTIVITIES INCLUDE:Interest received 800,472 717,986Interest paid (293,796) (265,605)
Chen Siqing Gu Shu Zhang WenwuChairman President General Manager of the Finance
and Accounting Department
22
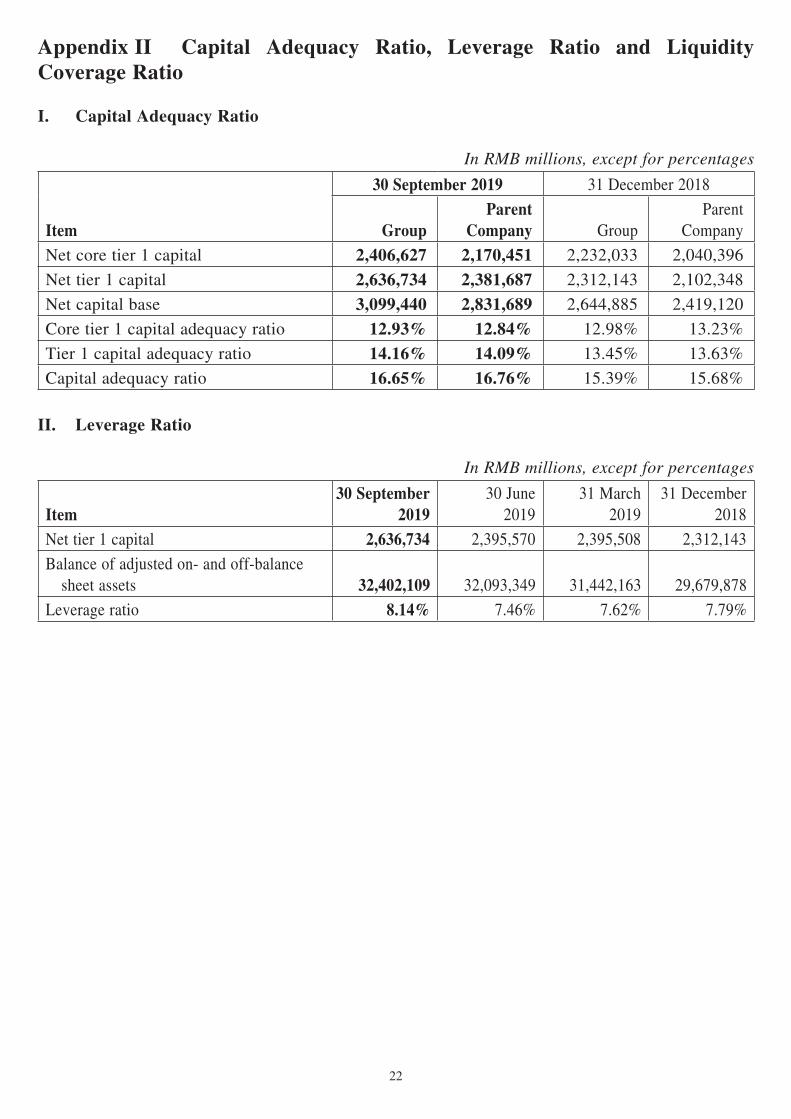
Appendix II Capital Adequacy Ratio, Leverage Ratio and Liquidity Coverage Ratio
I. Capital Adequacy Ratio
In RMB millions, except for percentages
Item
30 September 2019 31 December 2018
GroupParent
Company GroupParent
Company
Net core tier 1 capital 2,406,627 2,170,451 2,232,033 2,040,396
Net tier 1 capital 2,636,734 2,381,687 2,312,143 2,102,348
Net capital base 3,099,440 2,831,689 2,644,885 2,419,120
Core tier 1 capital adequacy ratio 12.93% 12.84% 12.98% 13.23%
Tier 1 capital adequacy ratio 14.16% 14.09% 13.45% 13.63%
Capital adequacy ratio 16.65% 16.76% 15.39% 15.68%
II. Leverage Ratio
In RMB millions, except for percentages
Item30 September
201930 June
201931 March
201931 December
2018
Net tier 1 capital 2,636,734 2,395,570 2,395,508 2,312,143
Balance of adjusted on- and off-balance sheet assets 32,402,109 32,093,349 31,442,163 29,679,878
Leverage ratio 8.14% 7.46% 7.62% 7.79%

23
III. Quantitative Information Disclosure of Liquidity Coverage Ratio
In RMB millions, except for percentages
No. Third quarter 2019Total
un-weightedvalue
Totalweighted
valueHIGH-QUALITY LIQUID ASSETS1 Total high-quality liquid assets (HQLA) 4,986,360
CASH OUTFLOWS2 Retail deposits and deposits from small business
customers, of which: 10,990,820 1,095,045
3 Stable deposits 62,122 2,175
4 Less stable deposits 10,928,698 1,092,870
5 Unsecured wholesale funding, of which: 12,880,037 4,290,560
6 Operational deposits (excluding those generated from correspondent banking activities) 7,331,602 1,779,172
7 Non-operational deposits (all counterparties) 5,461,268 2,424,221
8 Unsecured debt 87,167 87,167
9 Secured funding 18,291
10 Additional requirements, of which: 3,424,206 1,217,514
11 Outflows related to derivative exposures and other collateral requirements 1,028,791 1,028,786
12 Outflows related to loss of funding on debt products — —
13 Credit and liquidity facilities 2,395,415 188,728
14 Other contractual funding obligations 57,535 57,008
15 Other contingent funding obligations 3,589,331 116,291
16 TOTAL CASH OUTFLOWS 6,794,709CASH INFLOWS17 Secured lending (including reverse repos and
securities borrowing) 1,018,439 539,828
18 Inflows from fully performing exposures 1,508,784 1,111,680
19 Other cash inflows 1,033,318 1,026,455
20 TOTAL CASH INFLOWS 3,560,541 2,677,963Total
adjustedvalue
21 TOTAL HQLA 4,986,36022 TOTAL NET CASH OUTFLOWS 4,116,74623 LIQUIDITY COVERAGE RATIO (%) 121.18%
Note: Data of the above table are all the simple arithmetic means of the 92 natural days’ figures of the recent quarter.