industrial and commercial bank of china...
TRANSCRIPT
1
Hong Kong Exchanges and Clearing Limited and The Stock Exchange of Hong Kong Limited take no responsibility for the
contents of this announcement, make no representation as to its accuracy or completeness and expressly disclaim any liability
whatsoever for any loss howsoever arising from or in reliance upon the whole or any part of the contents of this announcement.
Stock Code: 1398USD Preference Shares Stock Code: 4603EUR Preference Shares Stock Code: 4604
RMB Preference Shares Stock Code: 84602
INDUSTRIAL AND COMMERCIAL BANK OF CHINA LIMITEDTHIRD QUARTERLY REPORT OF 2016
(H SHARE)
The Board of Directors of Industrial and Commercial Bank of China Limited (“the Bank”) announces the results of the Bank and its subsidiaries (“the Group”) for the third quarter ended 30 September 2016. This announcement is made in accordance with Part XIVA of the Securities and Futures Ordinance (Chapter 571 of the Laws of Hong Kong) and Rule 13.09 of the Rules Governing the Listing of Securities on The Stock Exchange of Hong Kong Limited.
1. IMPORTANT NOTICE
1.1 The Board of Directors, the Board of Supervisors, Directors, Supervisors and Senior Management members of Industrial and Commercial Bank of China Limited undertake that the information in this report contains no false record, misleading statement or material omission; and assume individual and joint and several liability for the authenticity, accuracy and completeness of the information in this report.
1.2 The Third Quarterly Report of 2016 has been considered and approved at the meeting of the Board of Directors of the Bank held on 28 October 2016. There were 14 directors eligible for attending the meeting, of whom 12 directors attended the meeting in person and 2 directors by proxy, namely, Mr. Zhang Hongli appointed Mr. Yi Huiman, the Chairman of the board, and Ms. Ge Rongrong appointed Ms. Wang Xiaoya to attend the meeting and exercise the voting right on their behalf.
1.3 These quarterly financial statements have not been audited.
1.4 Mr. Yi Huiman, Legal Representative of the Bank, Mr. Gu Shu, President in charge of finance of the Bank, and Mr. Zhang Wenwu, General Manager of the Finance and Accounting Department of the Bank, hereby warrant and guarantee that the financial statements contained in this quarterly report are authentic, accurate and complete.

2
2. CORPORATE INFORMATION
2.1 Basic information
Stock name Stock codeStock exchange on which shares are listed
A share 工商銀行 601398 Shanghai Stock ExchangeH share ICBC 1398 The Stock Exchange of Hong
Kong LimitedOffshore preference shares
ICBC USDPREF1 4603 The Stock Exchange of Hong Kong LimitedICBC EURPREF1 4604
ICBC CNHPREF1-R 84602
Domestic preference shares
工行優 1 360011 Shanghai Stock Exchange
Board Secretary, Company Secretary:Name Guan XueqingAddress No. 55 Fuxingmennei Avenue, Xicheng District,
Beijing, People’s Republic of China(Postal code:100140)
Telephone 86-10-66108608Facsimile 86-10-66107571E-mail [email protected]
2.2 Major accounting data and financial indicators
2.2.1 Major accounting data and financial indicators prepared based on International Financial Reporting Standards (“IFRSs”)
(In RMB millions, unless otherwise specified)30 September 2016 31 December 2015 Change (%)
Total assets 23,646,472 22,209,780 6.47
Total loans and advances to customers 12,914,203 11,933,466 8.22
Allowance for impairment losses on loans 284,365 280,654 1.32
Investment 5,469,130 5,009,963 9.17
Total liabilities 21,692,477 20,409,261 6.29
Due to customers 17,754,418 16,281,939 9.04
Due to banks and other financial institutions 1,877,479 2,265,860 (17.14)
Equity attributable to equity holders of the parent company 1,942,287 1,789,474 8.54
Net asset value per share (RMB yuan) 5.21 4.80 8.54

3
(In RMB millions, unless otherwise specified)
Nine months ended
30 September 2016
Nine months ended
30 September 2015
Changes as compared to the
same period of last year
(%, percentage points)
Operating income 484,015 503,833 (3.93)
Net profit 223,468 222,291 0.53
Net profit attributable to equity holders of the parent company 222,792 221,761 0.46
Net cash flows from operating activities 283,803 752,630 (62.29)
Basic earnings per share (RMB yuan) 0.63 0.62 1.61
Diluted earnings per share (RMB yuan) 0.63 0.62 1.61
Return on weighted average equity (%, annualized) 16.53 18.60
A decrease of 2.07 percentage points
2.2.2 Differences between the financial statements prepared based on Generally Accepted Accounting Principles of the People’s Republic of China (“PRC GAAP”) and those based on IFRSs
In respect of the financial statements of the Group prepared based on PRC GAAP and those based on IFRSs, net profit attributable to equity holders of the parent company for the reporting period ended 30 September 2016 and equity attributable to equity holders of the parent company as at the end of the reporting period have no differences.

4
2.3 Number of shareholders and particulars of shareholding
As at the end of the reporting period, the Bank had a total of 573,028 ordinary shareholders, including 133,715 holders of H shares and 439,313 holders of A shares.
PARTICULARS OF SHAREHOLDING OF THE TOP 10 ORDINARY SHAREHOLDERS OF THE BANK (The following data are based on the register of shareholders as at 30 September 2016)
Unit: Share
Name of shareholder Nature of shareholderType of shares
Shareholding percentage
(%)Total number of
shares held
Number of pledged or locked-up
shares
Changes of shares during the reporting
period
Central Huijin Investment Ltd. State-owned A shares 34.71 123,717,852,951 None —
Ministry of Finance of the People’s Republic of China
State-owned A shares 34.60 123,316,451,864 None —
HKSCC Nominees Limited/ Hong Kong Securities Clearing Company Limited (3)
Foreign legal person H shares 24.14 86,051,702,233 Unknown -7,855,380
A shares 0.14 493,761,677 None 185,437,500
China Securities Finance Corporation Limited
State-owned legal person A shares 1.32 4,697,561,618 None 323,301,532
Ping An Life Insurance Company of China, Ltd. — Traditional — Ordinary insurance products
Other entities A shares 1.21 4,322,828,137 None —
Wutongshu Investment Platform Co., Ltd.
State-owned legal person A shares 0.40 1,420,781,042 None —
Central Huijin Asset Management Co., Ltd. (4)
State-owned legal person A shares 0.28 1,013,921,700 None —
Anbang Life Insurance Co., Ltd. — Conservative investment portfolio
Other entities A shares 0.11 390,487,231 None —
China Life Insurance Company Limited — Traditional — Ordinary insurance products — 005L — CT001 Hu
Other entities A shares 0.09 317,038,927 None 100
Guotai Junan Securities Co., Ltd. State-owned legal person A shares 0.06 209,342,769 None -40,443,100
Notes: (1) Particulars of shareholding of H shareholders were based on the number of shares set out in the Bank’s register of shareholders maintained at the H share registrar.
(2) The Bank had no shares subject to restrictions on sales.
(3) HKSCC Nominees Limited held 86,051,702,233 H shares and Hong Kong Securities Clearing Company Limited held 493,761,677 A shares.
(4) Central Huijin Asset Management Co., Ltd. is a wholly-owned subsidiary of Central Huijin Investment Ltd. Apart from this, the Bank is not aware of any connected relations or concert party action among the afore-mentioned shareholders.
5
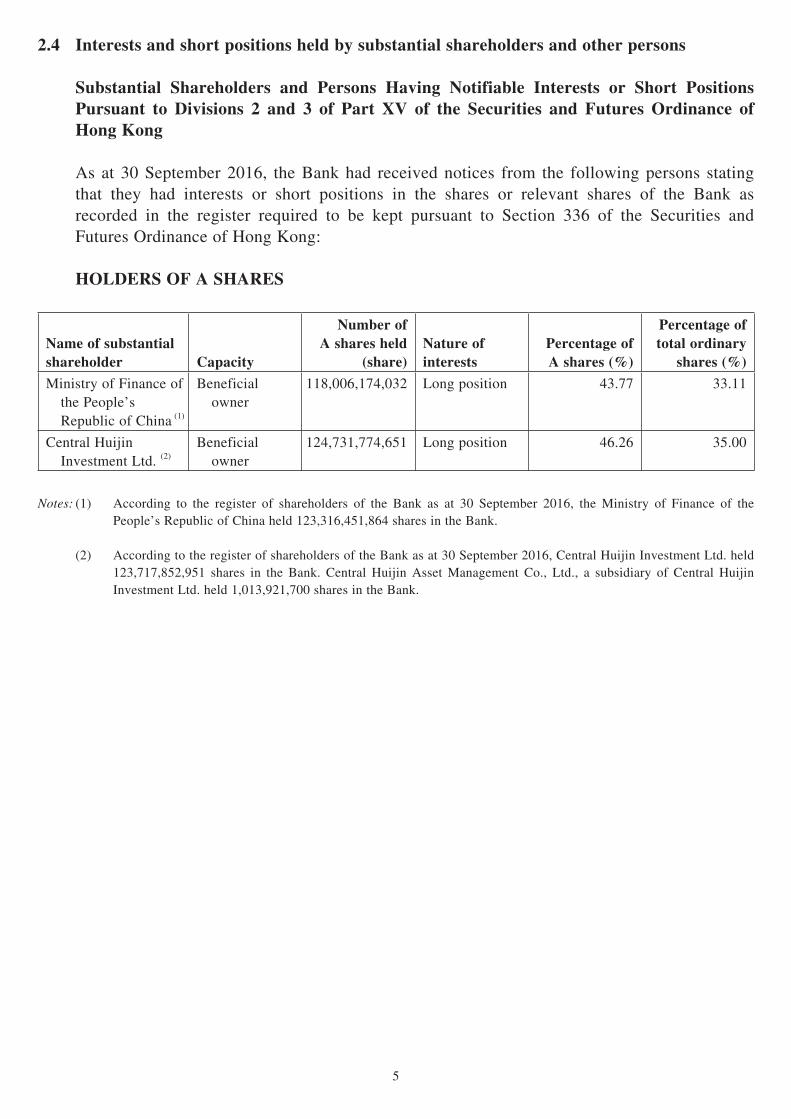
2.4 Interests and short positions held by substantial shareholders and other persons
Substantial Shareholders and Persons Having Notifiable Interests or Short Positions Pursuant to Divisions 2 and 3 of Part XV of the Securities and Futures Ordinance of Hong Kong
As at 30 September 2016, the Bank had received notices from the following persons stating that they had interests or short positions in the shares or relevant shares of the Bank as recorded in the register required to be kept pursuant to Section 336 of the Securities and Futures Ordinance of Hong Kong:
HOLDERS OF A SHARES
Name of substantial shareholder Capacity
Number of A shares held
(share)Nature of interests
Percentage of A shares (%)
Percentage of total ordinary
shares (%)
Ministry of Finance of the People’s Republic of China (1)
Beneficial owner
118,006,174,032 Long position 43.77 33.11
Central Huijin Investment Ltd. (2)
Beneficial owner
124,731,774,651 Long position 46.26 35.00
Notes: (1) According to the register of shareholders of the Bank as at 30 September 2016, the Ministry of Finance of the People’s Republic of China held 123,316,451,864 shares in the Bank.
(2) According to the register of shareholders of the Bank as at 30 September 2016, Central Huijin Investment Ltd. held 123,717,852,951 shares in the Bank. Central Huijin Asset Management Co., Ltd., a subsidiary of Central Huijin Investment Ltd. held 1,013,921,700 shares in the Bank.
6
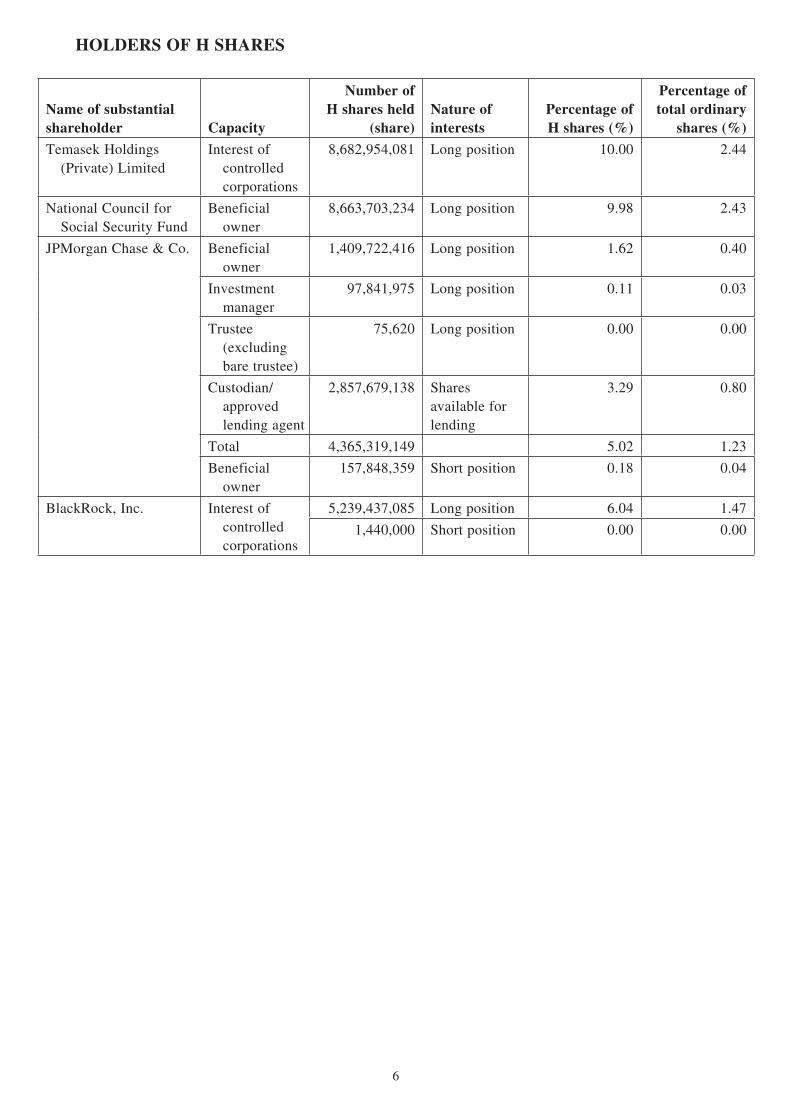
HOLDERS OF H SHARES
Name of substantial shareholder Capacity
Number of H shares held
(share)Nature of interests
Percentage of H shares (%)
Percentage of total ordinary
shares (%)
Temasek Holdings (Private) Limited
Interest of controlled corporations
8,682,954,081 Long position 10.00 2.44
National Council for Social Security Fund
Beneficial owner
8,663,703,234 Long position 9.98 2.43
JPMorgan Chase & Co. Beneficial owner
1,409,722,416 Long position 1.62 0.40
Investment manager
97,841,975 Long position 0.11 0.03
Trustee (excluding bare trustee)
75,620 Long position 0.00 0.00
Custodian/ approved lending agent
2,857,679,138 Shares available for lending
3.29 0.80
Total 4,365,319,149 5.02 1.23
Beneficial owner
157,848,359 Short position 0.18 0.04
BlackRock, Inc. Interest of controlled corporations
5,239,437,085 Long position 6.04 1.47
1,440,000 Short position 0.00 0.00
7
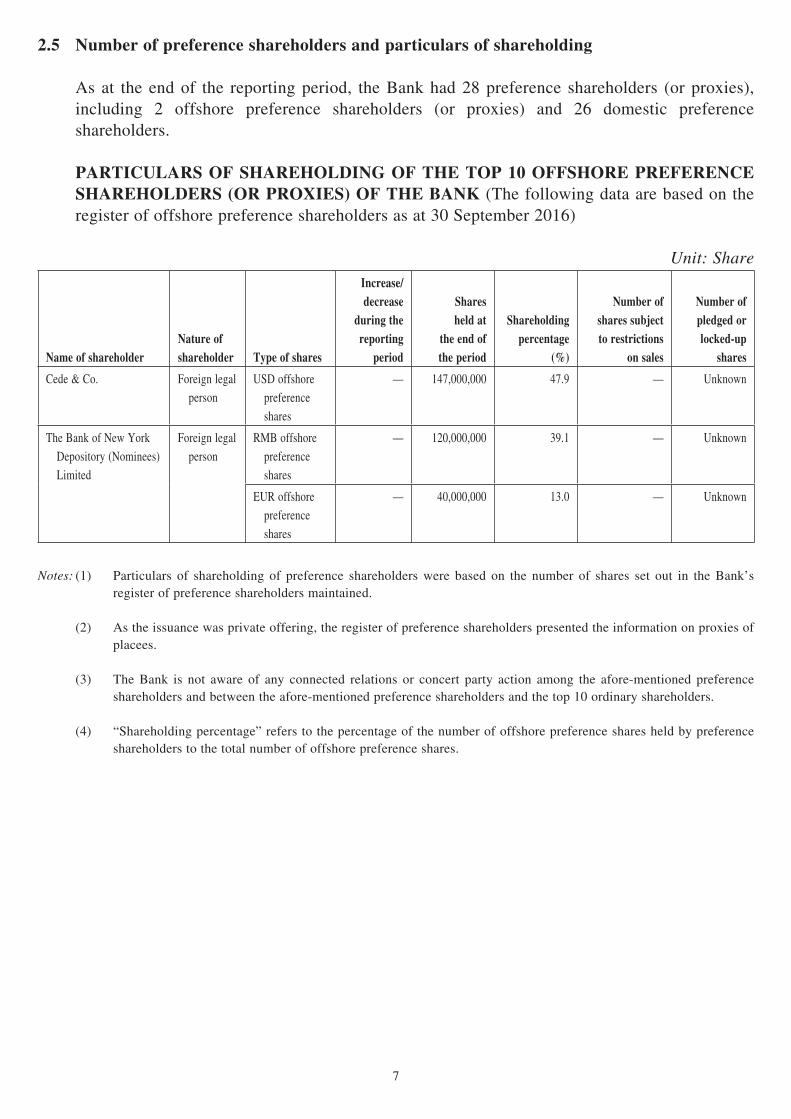
2.5 Number of preference shareholders and particulars of shareholding
As at the end of the reporting period, the Bank had 28 preference shareholders (or proxies), including 2 offshore preference shareholders (or proxies) and 26 domestic preference shareholders.
PARTICULARS OF SHAREHOLDING OF THE TOP 10 OFFSHORE PREFERENCE SHAREHOLDERS (OR PROXIES) OF THE BANK (The following data are based on the register of offshore preference shareholders as at 30 September 2016)
Unit: Share
Name of shareholderNature of shareholder Type of shares
Increase/decrease
during the reporting
period
Shares held at
the end of the period
Shareholding percentage
(%)
Number of shares subject to restrictions
on sales
Number of pledged or locked-up
shares
Cede & Co. Foreign legal
person
USD offshore
preference
shares
— 147,000,000 47.9 — Unknown
The Bank of New York
Depository (Nominees)
Limited
Foreign legal
person
RMB offshore
preference
shares
— 120,000,000 39.1 — Unknown
EUR offshore
preference
shares
— 40,000,000 13.0 — Unknown
Notes: (1) Particulars of shareholding of preference shareholders were based on the number of shares set out in the Bank’s register of preference shareholders maintained.
(2) As the issuance was private offering, the register of preference shareholders presented the information on proxies of placees.
(3) The Bank is not aware of any connected relations or concert party action among the afore-mentioned preference shareholders and between the afore-mentioned preference shareholders and the top 10 ordinary shareholders.
(4) “Shareholding percentage” refers to the percentage of the number of offshore preference shares held by preference shareholders to the total number of offshore preference shares.

8
PARTICULARS OF SHAREHOLDING OF THE TOP 10 DOMESTIC PREFERENCE SHAREHOLDERS OF THE BANK (The following data are based on the register of domestic preference shareholders as at 30 September 2016)
Unit: Share
Name of shareholderNature of shareholder Type of shares
Increase/decrease
during the reporting
period
Shares held at
the end of the period
Shareholding percentage
(%)
Number of shares subject to restrictions
on sales
Number of pledged or locked-up
shares
China Mobile Communications Corporation
Other entities Domestic preference shares
— 200,000,000 44.4 — None
China National Tobacco Corporation
Other entities Domestic preference shares
— 50,000,000 11.1 — None
China Life Insurance Company Limited
State-owned legal person
Domestic preference shares
— 35,000,000 7.8 — None
Ping An Life Insurance Company of China, Ltd.
Domestic non- state-owned legal person
Domestic preference shares
— 30,000,000 6.7 — None
CCB Trust Co., Ltd. State-owned legal person
Domestic preference shares
— 15,000,000 3.3 — None
Bank of Communications Schroder Fund Management Co., Ltd.
Domestic non- state-owned legal person
Domestic preference shares
— 15,000,000 3.3 — None
China Resources SZITIC Trust Co., Ltd.
State-owned legal person
Domestic preference shares
— 15,000,000 3.3 — None
BOC International (China) Limited
Domestic non- state-owned legal person
Domestic preference shares
— 15,000,000 3.3 — None
Shandong Branch of China National Tobacco Corporation
Other entities Domestic preference shares
— 10,000,000 2.2 — None
Heilongjiang Branch of China National Tobacco Corporation
Other entities Domestic preference shares
— 10,000,000 2.2 — None
Ping An Property & Casualty Insurance Company of China, Ltd.
Domestic non- state-owned legal person
Domestic preference shares
— 10,000,000 2.2 — None
Notes: (1) Particulars of shareholding of preference shareholders were based on the number of shares set out in the Bank’s register of preference shareholders maintained.
(2) Shandong Branch of China National Tobacco Corporation and Heilongjiang Branch of China National Tobacco Corporation are wholly-owned subsidiaries of China National Tobacco Corporation. Ping An Life Insurance Company of China, Ltd. and Ping An Property & Casualty Insurance Company of China, Ltd. are subsidiaries of Ping An Insurance (Group) Company of China, Ltd. Apart from this, the Bank is not aware of any connected relations or concert party action among the afore-mentioned preference shareholders and between the afore-mentioned preference shareholders and the top 10 ordinary shareholders.
(3) “Shareholding percentage” refers to the percentage of the number of domestic preference shares held by preference shareholders to the total number of domestic preference shares.

9
3. BRIEF ANALYSIS ON OVERALL OPERATING ACTIVITIES IN THE THIRD QUARTER
(The financial data herein are presented in RMB unless otherwise indicated.)
Set out below are the highlights of the operating results of the Group for the reporting period:
Net profit amounted to RMB223,468 million, representing an increase of 0.53% over the same period of last year. Specifically, net profit attributable to equity holders of the parent company was RMB222,792 million, representing an increase of 0.46% over the same period of last year. Annualised return on average total assets and annualised return on weighted average equity were 1.30% and 16.53%, respectively.
Operating income amounted to RMB484,015 million, representing a decrease of 3.93% compared with the same period of last year. Net interest income was RMB351,358 million, representing a decrease of 7.52% compared with the same period of last year. Annualised net interest margin dropped by 0.31 percentage points to 2.18% compared to the same period of last year. Non-interest income amounted to RMB132,657 million, representing an increase of 7.08% over the same period of last year. Specifically, net fee and commission income was RMB113,748 million, representing an increase of 2.31% compared with the same period of last year. Operating expenses were RMB132,199 million, representing a decrease of 13.88% compared with the same period of last year. Cost-to-income ratio was 24.30%.
As at the end of the reporting period, total assets amounted to RMB23,646,472 million, representing an increase of RMB1,436,692 million or 6.47% over the end of the previous year. Total loans and advances to customers amounted to RMB12,914,203 million, representing an increase of RMB980,737 million or 8.22% over the end of last year, of which RMB loans of domestic branches grew by RMB762,296 million or 7.19%. In terms of the structure of loans and advances to customers, corporate loans were RMB8,074,586 million, personal loans were RMB4,027,782 million and discounted bills were RMB811,835 million. Investment was RMB5,469,130 million, representing an increase of RMB459,167 million or 9.17% over the end of last year.
Total liabilities amounted to RMB21,692,477 million, representing an increase of RMB1,283,216 million or 6.29% over the end of the previous year. Due to customers amounted to RMB17,754,418 million, representing an increase of RMB1,472,479 million or 9.04% over the end of the previous year. In terms of the structure of deposits, time deposits were RMB8,532,863 million, demand deposits were RMB8,972,611 million and others were RMB248,944 million.
Shareholders’ equity amounted to RMB1,953,995 million, representing an increase of RMB153,476 million or 8.52% over the end of last year.

10
According to the five-category classification of loans, the balance of non-performing loans (“NPLs”) amounted to RMB208,880 million. The NPL ratio was 1.62%. The allowance to NPL stood at 136.14%.
The core tier 1 capital adequacy ratio was 12.58%, the tier 1 capital adequacy ratio was 13.13% and the capital adequacy ratio was 14.18%1, all meeting regulatory requirements.
4. SIGNIFICANT EVENTS
4.1 Significant changes in major financial statements items and financial indicators and the reasons thereof
Applicable ■ Not applicable
In RMB millions, except for percentages
Item30 September
201631 December
2015Increase/
Decrease (%) Main reasons for changeFinancial assets held for trading
235,134 132,838 77.01 Investment in trading financial assets increased
Reverse repurchase agreements
554,690 996,333 (44.33) The balance of placements by bond pledge decreased
Other assets 620,036 458,699 35.17 Precious metals leasing increasedRepurchase agreements 446,604 337,191 32.45 The balance of deposits from bond
pledge increasedIncome tax payable 40,126 63,266 (36.58) Income tax for 2015 was settled
and paid
In RMB millions, except for percentages
Item
Nine months ended
30 September 2016
Nine months ended
30 September 2015
Increase/Decrease (%) Main reasons for change
Net trading income 5,259 3,830 37.31 Trading investment interest income and income from financial derivative contracts increased
Net loss on financial assets and liabilities designated at fair value through profit or loss
(345) (5,931) N/A The size and average cost of liabilities measured at fair value decreased
1 Calculated based on the Regulation Governing Capital of Commercial Banks (Provisional) promulgated by China Banking Regulatory Commission.

11
4.2 Progress of significant events and analysis of their effects and solutions
■ Applicable Not applicable
4.3 Fulfillment of commitments made by the Bank or its shareholders holding 5% shares or above
Applicable ■ Not applicable
During the reporting period, the Bank and the shareholders holding 5% shares or above did not make any new commitments. As at 30 September 2016, all of the continuing commitments made by the shareholders were properly fulfilled. For relevant commitments, please refer to the 2016 Interim Report of the Bank.
4.4 Implementation of cash dividend policy during the reporting period
Applicable ■ Not applicable
Upon the approval at the Annual General Meeting for the Year 2015 held on 24 June 2016, the Bank has distributed cash dividends of about RMB83,150 million, or RMB2.333 per ten shares (pre-tax), for the period from 1 January 2015 to 31 December 2015 to the ordinary shareholders whose names appeared on the register of shareholders upon the close of market on 7 July 2016.
During the reporting period, the Bank did not distribute any dividend on the preference shares. The Bank considered and approved the implementation of dividend distribution for preference shares at the meeting of the Board of Directors convened on 28 October 2016, and decided to distribute total dividends of RMB2,025 million for domestic preference shares on 23 November 2016 at a dividend rate of 4.5% (pre-tax, and tax payable arising from dividend income gained by domestic preference shareholders shall be borne by them in accordance with relevant laws and regulations); and to distribute total dividends equivalent to about RMB2,406 million for offshore preference shares on 12 December 2016 at a dividend rate of 6% (post-tax, i.e., actual dividend rate received by offshore preference shareholders).
4.5 Warnings and explanations on estimated loss or significant changes as compared to the same period of last year in net accumulated profit from the beginning of the year to the end of the next reporting period
■ Applicable Not applicable

12
5. APPENDICES: FINANCIAL STATEMENTS PREPARED BASED ON IFRSs
5.1 Financial statements prepared based on IFRSs are attached in Appendix I to this announcement
5.2 Capital adequacy ratios disclosed as per the Regulation Governing Capital of Commercial Banks (Provisional) promulgated by China Banking Regulatory Commission, leverage ratio disclosed as per the Administrative Measures for Leverage Ratio of Commercial Banks (Revised) promulgated by China Banking Regulatory Commission and liquidity coverage ratio disclosed as per the Regulation Governing Disclosure of Liquidity Coverage Ratio of Commercial Banks are attached in Appendix II to this announcement
6. RELEASE OF QUARTERLY REPORT
The report will be published simultaneously on the “HKExnews” website of The Stock Exchange of Hong Kong Limited (www.hkexnews.hk) and the website of the Bank (www. icbc-ltd.com). The quarterly report prepared in accordance with PRC GAAP will also be published simultaneously on the website of the Shanghai Stock Exchange (www.sse.com.cn) and the website of the Bank (www.icbc-ltd.com).
This report is prepared in both Chinese and English. In case of any discrepancy between the two versions, the Chinese version shall prevail.
By Order ofThe Board of Directors of
Industrial and Commercial Bank of China Limited
Beijing, PRC28 October 2016
As at the date of this announcement, the Board of Directors comprises Mr. YI Huiman and Mr. ZHANG Hongli as executive
directors, Ms. WANG Xiaoya, Ms. GE Rongrong, Mr. FU Zhongjun, Mr. ZHENG Fuqing, Mr. FEI Zhoulin and Mr. CHENG
Fengchao as non-executive directors, Sir Malcolm Christopher McCARTHY, Mr. Kenneth Patrick CHUNG, Mr. OR Ching Fai,
Mr. HONG Yongmiao, Mr. Anthony Francis NEOH and Mr. YANG Siu Shun as independent non-executive directors.

13
Appendix IIndustrial and Commercial Bank of China LimitedConsolidated Statement of Income — Based on IFRSFor the nine months ended 30 September 2016(In RMB millions, unless otherwise stated)
Three months ended
30 September 2016
Nine months ended
30 September 2016
Three months ended
30 September 2015
Nine months ended
30 September 2015
(unaudited) (unaudited) (unaudited) (unaudited)
Interest income 195,466 590,694 219,693 656,988Interest expense (78,388) (239,336) (91,835) (277,043)
NET INTEREST INCOME 117,078 351,358 127,858 379,945
Fee and commission income 36,981 127,797 38,431 123,761Fee and commission expense (4,948) (14,049) (4,368) (12,578)
NET FEE AND COMMISSION INCOME 32,033 113,748 34,063 111,183
Net trading income 1,925 5,259 1,665 3,830Net loss on financial assets and liabilities designated at fair value through profit or loss (92) (345) (849) (5,931)Net gain on financial investments 1,088 3,653 980 3,593Other operating income, net 3,002 10,342 3,379 11,213
OPERATING INCOME 155,034 484,015 167,096 503,833
Operating expenses (41,605) (132,199) (52,012) (153,511)
Impairment losses on: — Loans and advances to customers (19,354) (63,245) (19,301) (61,253) — Others (119) (661) (317) (316)
OPERATING PROFIT 93,956 287,910 95,466 288,753Share of profits of associates and joint ventures 835 1,956 377 1,768
PROFIT BEFORE TAXATION 94,791 289,866 95,843 290,521Income tax expense (21,979) (66,398) (22,978) (68,230)
PROFIT FOR THE PERIOD 72,812 223,468 72,865 222,291

14
Industrial and Commercial Bank of China LimitedConsolidated Statement of Income — Based on IFRS (continued)For the nine months ended 30 September 2016(In RMB millions, unless otherwise stated)
Three months ended
30 September 2016
Nine months ended
30 September 2016
Three months ended
30 September 2015
Nine months ended
30 September 2015
(unaudited) (unaudited) (unaudited) (unaudited)
Attributable to: Equity holders of the parent company 72,575 222,792 72,740 221,761 Non-controlling interests 237 676 125 530
72,812 223,468 72,865 222,291
EARNINGS PER SHARE — Basic (RMB yuan) 0.20 0.63 0.20 0.62 — Diluted (RMB yuan) 0.20 0.63 0.20 0.62
Yi Huiman Gu Shu Zhang WenwuChairman President General Manager of
the Finance and Accounting Department

15
Industrial and Commercial Bank of China LimitedConsolidated Statement of Profit or Loss and Other Comprehensive Income — Based on IFRSFor the nine months ended 30 September 2016(In RMB millions, unless otherwise stated)
Three months ended
30 September 2016
Nine months ended
30 September 2016
Three months ended
30 September 2015
Nine months ended
30 September 2015
(unaudited) (unaudited) (unaudited) (unaudited)
Net profit for the period 72,812 223,468 72,865 222,291
Other comprehensive income (after tax, net)
Items that will not be reclassified to profit or loss
Share of the other comprehensive income of the investee accounted for using equity method which will not be reclassified subsequently to profit or loss — (5) — — Others (2) (12) — —
Items that may be reclassified subsequently to profit or loss
Net gain/(loss) from change in fair value of available-for-sale financial assets 5,085 (50) 5,207 12,879 Effective hedging portion of gains or losses arising from cash flow hedging instruments 30 (206) (26) (60) Share of the other comprehensive income of the investee accounted for using equity method which will be reclassified subsequently to profit or loss (317) (918) 226 (71) Foreign currency translation differences 1,935 7,708 (1,148) (4,274)
Subtotal of other comprehensive income for the period 6,731 6,517 4,259 8,474
Total comprehensive income for the period 79,543 229,985 77,124 230,765
Total comprehensive income attributable to: Equity holders of the parent company 79,019 229,264 77,167 230,128 Non-controlling interests 524 721 (43) 637
Yi Huiman Gu Shu Zhang WenwuChairman President General Manager of
the Finance and Accounting Department

16
Industrial and Commercial Bank of China LimitedConsolidated Statement of Financial Position — Based on IFRS30 September 2016(In RMB millions, unless otherwise stated)
30 September 2016
31 December 2015
(unaudited) (audited)
ASSETSCash and balances with central banks 3,302,564 3,059,633Due from banks and other financial institutions 724,055 683,793Financial assets held for trading 235,134 132,838Financial assets designated at fair value through profit or loss 257,858 210,434Derivative financial assets 69,860 78,870Reverse repurchase agreements 554,690 996,333Loans and advances to customers 12,629,838 11,652,812Financial investments 4,976,138 4,666,691Investments in associates and joint ventures 28,101 24,185Property and equipment 233,040 224,426Deferred income tax assets 15,158 21,066Other assets 620,036 458,699
TOTAL ASSETS 23,646,472 22,209,780

17
Industrial and Commercial Bank of China LimitedConsolidated Statement of Financial Position — Based on IFRS (continued)30 September 2016(In RMB millions, unless otherwise stated)
30 September 2016
31 December 2015
(unaudited) (audited)
LIABILITIESDue to central banks 178 210Financial liabilities designated at fair value through profit or loss 339,693 303,927Derivative financial liabilities 74,278 76,826Due to banks and other financial institutions 1,877,479 2,265,860Repurchase agreements 446,604 337,191Certificates of deposit 198,881 183,352Due to customers 17,754,418 16,281,939Income tax payable 40,126 63,266Deferred income tax liabilities 1,033 995Debt securities issued 338,651 306,622Other liabilities 621,136 589,073
TOTAL LIABILITIES 21,692,477 20,409,261
EQUITYEquity attributable to equity holders of the parent company Share capital 356,407 356,407 Other equity instrument 86,056 79,375 Including: preference shares 79,375 79,375 perpetual bond 6,681 — Reserves 578,776 571,704 Retained profits 921,048 781,988
1,942,287 1,789,474
Non-controlling interests 11,708 11,045
TOTAL EQUITY 1,953,995 1,800,519
TOTAL EQUITY AND LIABILITIES 23,646,472 22,209,780
Yi Huiman Gu Shu Zhang WenwuChairman President General Manager of
the Finance and Accounting Department

18
Industrial and Commercial Bank of China LimitedConsolidated Statement of Cash Flows — Based on IFRSFor the nine months ended 30 September 2016(In RMB millions, unless otherwise stated)
Nine months ended
30 September 2016
Nine months ended
30 September 2015
(unaudited) (unaudited)
Cash flows from operating activitiesProfit before taxation 289,866 290,521Adjustments for: Share of profits of associates and joint ventures (1,956) (1,768) Depreciation 10,244 12,247 Amortisation 4,614 4,742 Amortisation of financial investments (2,922) (2,666) Impairment losses on loans and advances to customers 63,245 61,253 Impairment losses on assets other than loans and advances to customers 661 316 Gain on unrealised foreign exchange (18,373) (1,917) Interest expense on debt securities issued 10,427 9,751 Accreted interest on impaired loans (3,900) (3,087) Gain on disposal of available-for-sale financial assets, net (3,462) (3,443) Net trading gain on equity investments (208) (36) Net loss on financial assets and liabilities designated at fair value through profit or loss 345 5,931 Net gain on disposal of property and equipment and other assets (other than repossessed assets) (101) (598) Dividend income (191) (150)
348,289 371,096
Net (increase)/decrease in operating assets:Due from central banks (212,231) 283,165Due from banks and other financial institutions 219,536 (224,304)Financial assets held for trading (101,359) (130,279)Financial assets designated at fair value through profit or loss (44,523) 13,623Reverse repurchase agreements 72,986 142,098Loans and advances to customers (997,888) (866,897)Other assets (401,801) (174,975)
(1,465,280) (957,569)

19
Industrial and Commercial Bank of China LimitedConsolidated Statement of Cash Flows — Based on IFRS (continued)For the nine months ended 30 September 2016(In RMB millions, unless otherwise stated)
Nine months ended
30 September 2016
Nine months ended
30 September 2015
(unaudited) (unaudited)
Net increase/(decrease) in operating liabilities:Financial liabilities designated at fair value through profit or loss 36,147 (123,973)Due to central banks (32) (293)Due to banks and other financial institutions (406,107) 506,295Repurchase agreements 109,413 (62,726)Certificates of deposit 11,304 (29,557)Due to customers 1,447,843 944,961Other liabilities 285,398 176,194
1,483,966 1,410,901
Net cash flows from operating activities before tax 366,975 824,428Income tax paid (83,172) (71,798)
Net cash flows from operating activities 283,803 752,630
Cash flows from investing activitiesPurchases of property and equipment and other assets (12,663) (29,037)Proceeds from disposal of property and equipment and other assets (other than repossessed assets) 973 1,393Purchases of financial investments (1,917,733) (1,455,087)Proceeds from sale and redemption of financial investments 1,605,275 936,493Investments in associates and joint ventures (1,186) —Proceeds from disposal of associates and joint ventures 17 —Dividends received 553 1,094
Net cash flows from investing activities (324,764) (545,144)

20
Industrial and Commercial Bank of China LimitedConsolidated Statement of Cash Flows — Based on IFRS (continued)For the nine months ended 30 September 2016(In RMB millions, unless otherwise stated)
Nine months ended
30 September 2016
Nine months ended
30 September 2015
(unaudited) (unaudited)
Cash flows from financing activitiesProceeds from issuance of perpetual bond 6,691 —Capital injection by non-controlling shareholders 1,520 323Proceeds from issuance of other debt securities 705,468 76,155Interest paid on debt securities (9,344) (7,428)Repayment of debt securities (681,011) (75,607)Dividends paid on ordinary shares (83,150) (91,026)
Net cash flows from financing activities (59,826) (97,583)
Net (decrease)/increase in cash and cash equivalents (100,787) 109,903Cash and cash equivalents at beginning of the period 1,441,298 994,264Effect of exchange rate changes on cash and cash equivalents 22,506 9,873
Cash and cash equivalents at end of the period 1,363,017 1,114,040
Net cash flows from operating activities include:Interest received 600,138 649,268Interest paid (232,616) (254,074)
Yi Huiman Gu Shu Zhang WenwuChairman President General Manager of
the Finance and Accounting Department

21
Appendix II Capital Adequacy Ratio, Leverage Ratio and Liquidity Coverage Ratio
I. Capital Adequacy Ratio
In RMB millions, except for percentages
Item
30 September 2016 31 December 2015
GroupParent
Company GroupParent
Company
Calculated in accordance with the Regulation Governing Capital of Commercial Banks (Provisional) promulgated by China Banking Regulatory Commission:Net core tier 1 capital 1,839,989 1,693,455 1,701,495 1,571,403
Net tier 1 capital 1,919,729 1,772,830 1,781,062 1,650,778
Net capital base 2,073,340 1,918,269 2,012,103 1,869,237
Core tier 1 capital adequacy ratio 12.58% 12.57% 12.87% 12.88%
Tier 1 capital adequacy ratio 13.13% 13.16% 13.48% 13.53%
Capital adequacy ratio 14.18% 14.24% 15.22% 15.32%
Calculated in accordance with the Regulation Governing Capital Adequacy of Commercial Banks and related regulations promulgated by China Banking Regulatory Commission:Core capital adequacy ratio 11.78% 12.12% 11.83% 12.09%
Capital adequacy ratio 14.55% 14.62% 14.75% 14.67%
II. Leverage Ratio
In RMB millions, except for percentages
Item30 September
201630 June
201631 March
201631 December
2015
Net tier 1 capital 1,919,729 1,847,634 1,854,320 1,781,062
Balance of adjusted on- and off-balance sheet assets 25,357,448 25,309,554 24,599,374 23,813,992
Leverage ratio 7.57% 7.30% 7.54% 7.48%

22
III. Quantitative Information Disclosure of Liquidity Coverage Ratio
In RMB millions, except for percentages
Third quarter 2016
No.
Total un-weighted
value
Total weighted
valueHIGH-QUALITY LIQUID ASSETS
1 Total high-quality liquid assets (HQLA) 4,662,765
CASH OUTFLOWS2 Retail deposits and deposits from small business
customers, of which: 8,947,696 884,769
3 Stable deposits 155,603 5,560
4 Less stable deposits 8,792,093 879,209
5 Unsecured wholesale funding, of which: 10,184,878 3,414,848
6 Operational deposits (excluding those generated from correspondent banking activities) 5,966,195 1,447,832
7 Non-operational deposits (all counterparties) 4,050,201 1,798,534
8 Unsecured debt 168,482 168,482
9 Secured funding 42,815
10 Additional requirements, of which: 2,894,787 1,079,217
11 Outflows related to derivative exposures and other collateral requirements 914,820 914,820
12 Outflows related to loss of funding on debt products — —
13 Credit and liquidity facilities 1,979,967 164,397
14 Other contractual funding obligations 35,168 35,147
15 Other contingent funding obligations 710,800 16,309
16 TOTAL CASH OUTFLOWS 5,473,105
CASH INFLOWS17 Secured lending (including reverse repos and
securities borrowing) 937,810 262,389
18 Inflows from fully performing exposures 1,255,000 789,902
19 Other cash inflows 922,749 918,400
20 TOTAL CASH INFLOWS 3,115,559 1,970,691
Total adjusted
value21 TOTAL HQLA 4,662,765
22 TOTAL NET CASH OUTFLOWS 3,502,414
23 LIQUIDITY COVERAGE RATIO (%) 133.14
Note: Data of the above table are all the simple arithmetic means of the month-end figures of the recent quarter.