indonesian fisheries research journal and...dr. fayakun satria (research institute for fisheries...
TRANSCRIPT
INDONESIAN FISHERIES RESEARCH JOURNAL
ISSN 0853–8980
Volume 20 Number 2 December 2014
Acreditation Number: 503/AU2/P2MI-LIPI/10/2012
(Period: October 2012-October 2015)
Indonesian Fisheries Research Journal is the English version of fisheries research journal.
The first edition was published in 1994 with once a year in 1994. Since 2005, this journal
has been published twice a year on JUNE and DECEMBER.
Head of Editor Board:
Prof. Dr. Ir. Ngurah Nyoman Wiadnyana, DEA (Fisheries Ecology-Research Center for Fisheries Management and
Conservation)
Members of Editor Board:
Prof. Dr. Ir. Hari Eko Irianto (Fisheries Technology-Research Center for Fisheries Management and Conservation)
Prof. Dr. Ir. Gadis Sri Haryani (Liminoligy-Liminology Reseach Center)
Dr. Ir. Subhat Nurhakim, M.S. (Pelagic Fisheries Biology-Marine and Fisheries Research and Development)
Ir. Badrudin, M.Sc. (Demersal Fisheries Biology-Marine and Fisheries Research and Development)
Dr. Purwito Martosubroto. (Fisheries Management-Marine and Fisheries Research and Development)
Referees for this Number:
Prof. Dr. Ir. Setyo Budi Susilo, M.Sc. (Bogor Agricultural Institute)
Dr. Ir. Augy Syahailatua (Research Center for Oceanography-The Indonesian Institute of Sciences)
Dr. Sudarto (Research Center and Development Aquaculture)
Dr. Estu Nugroho (Research Center and Development Aquaculture)
Language Editor:
Dr. Fayakun Satria (Research Institute for Fisheries Enhancement and Conservation)
Managing Editors:
Dra. Endang Sriyati
Amalia Setiasari, A.Md
Graphic Design:
Darwanto, S.Sos
Published by:
Agency for Marine and Fisheries Research
Manuscript send to the publisher:
Indonesian Fisheries Research Journal
Research Center for Fisheries Management and Conservation
Gedung Balitbang KP II, Jl. Pasir Putih II Ancol Timur Jakarta 14430 Indonesia
Phone: (021) 64700928, Fax: (021) 64700929
Website : http://p4ksi.litbang.kkp.go.id., Email: [email protected].
Indonesian Fisheries Research Journal is printed by Research Center for Fisheries Management and
Conservation Budgeting F.Y. 2014.
i
PREFACE
Indonesian Fisheries Research Journal Volume 20 Number 2 December 2014 is the first publication of
English journal of the Research Center for Fisheries Management and Conservation in 2014. The journal is
expected to be a source of newest science and technology for all scientists and researchers in Indonesia and
other countries. The financial for publication is provided by the Research Center for Fisheries Management
and Conservation budget in the fiscal year of 2014.
This volume contains: Reproductive characteristics of Indonesia mahseer (Tor tambroides, Bleeker, 1854),
in two different rivers in western Sumatera; Potential production of the five predominant small pelagic fish
species groups in the Java sea; Exploitation and catch fluctuation of small pelagic fishes in prigi waters,
south coast of Java; Productivity and economic analysis of the indian ocean longline fishery landed at Benoa
port Bali Indonesia; Initiation on ecosystem approach to fisheries management (EAFM): Case study on
Tarakan Fisheries; Cost-Effective approach to estimate unreported data: Rebuilding history of lift-net fishing in
Kwandang Waters.
We hope that all the articles on this volume may contribute significantly to the development of fishery
science and technology in Indonesia. We are grateful to the editorial board for their improvement and suggestion
on reviews of the manuscripts.
Editor
ISSN 0853–8980
INDONESIAN FISHERIES RESEARCH JOURNALVolume 20 Number 2 December 2014
CONTENSPage
i
iii
v
49-57
59-67
69-76
77-86
87-98
99-106
107
iii
PREFACE ……………………………………………………………………………………....................
CONTENTS …………………………………………………………………………………………………..
ABSTRACT...........................................................................................................................
Reproductive Characteristics of Indonesia Mahseer (Tor tambroides, Bleeker, 1854), in Two Different
Rivers in Western SumateraBy: Arif Wibowo and Siswanta Kaban…………………………………………………………………………………
Potential Production of the Five Predominant Small Pelagic Fish Species Groups in The Java SeaBy: Purwanto, Duto Nugroho, and Suwarso……………………………………………………………………........
Exploitation and Catch Fluctuation of Small Pelagic Fishes in Prigi Waters, South Coast of Java
By: Suwarso, Arief Wujdi and Moh. Fauzi…………………………………………………………………
Productivity and Economic Analysis of the Indian Ocean Longline Fishery Landed at Benoa Port
Bali IndonesiaBy: Fathur Rochman and Budi Nugraha…………………………………………………………………………......
Initiation on Ecosystem Approach to Fisheries Management (EAFM): Case Study on Tarakan FisheriesBy: Andhika Prima Prasetyo, Duto Nugroho, Wudianto, Hari Eko Irianto and Purwanto……………………….
Cost-Effective Approach to Estimate Unreported Data: Rebuilding History of Lift-Net Fishing in
Kwandang WatersBy: Andhika Prima Prasetyo, Duto Nugroho, Lilis Sadiyah, Rudy Masuswo Purwoko, Ria Faizah and
Agus Setiyawan…………………………………………………………………………………………………...
Index of Authors....................................................................................................................
INDONESIAN FISHERIES RESEARCH JOURNALVolume 20 Number 2 December 2014
ABSTRACT
v
REPRODUCTIVE CHARACTERISTICS OF
INDONESIA MAHSEER (Tor tambroides, Bleeker,
1854), IN TWO DIFFERENT RIVERS IN WESTERN
SUMATERA
Arif Wibowo
IFRJ, Vol. 20 No.2,Page: 49-57
ABSTRACT
The reproductive characteristics of mahseer, Tor.
tambroides, were studied in Manna River and Batang
Tarusan River, which are located on each side of Western
Sumatera River. The reproductive period of T. tambroides
is largely consistent with that described for the species
in other areas, however monthly variations in the extent
and timing of peak spawning are recorded. The analysis
of the sex ratio indicates an increase in the percentage
of females with size, more marked in largest sizes.
Seasonal patterns in the occurrences of spawning
showed that the spawning season in Manna River lasted
was similar with that in Batang Tarusan River, although
a second prominent increase of GSI was observed in
April and September in Manna River, meanwhile the GSI
of Batang Tarusan River fish were below 2 without an
apparent variation. L50s of Manna River and Batang
Tarusan River mahseer were estimated as 24.5 cm and
20.66 cm, respectively, indicating a high variability in size
at first maturity of the mahseer population. Our study
provides some important information on the reproductive
biology of T. tambroides that will be helpful in similar
studies and contributed to fisheries management of this
species.
KEYWORDS: Mahseer; Reproductive characteristics;
Manna River; Batang Tarusan River
POTENTIAL PRODUCTION OF THE FIVE
PREDOMINANT SMALL PELAGIC FISH SPECIES
GROUPS IN THE JAVA SEA
Purwanto
IFRJ,Vol.20 No.2,Page: 59-67
ABSTRACT
The Java Sea is one of the important fishing areas
for small pelagic fishery in Indonesia. The production of
the fishery was dominated by five fish species groups.
To support the management of that fishery, an
assessment of the stock of the five predominant small
pelagic fish species groups was conducted. Based on
the result of analysis, the maximum sustainable yield
(MSY) of the stock of five predominant small pelagic fish
species was about 244.6 thousand tons. Meanwhile,
the MSY of the stock of the whole exploitable small
pelagic fish species was about 315.5 thousand tons.
The optimum fishing effort (EMSY
) was 1032 units. The
total fishing effort was higher than EMSY
and the fish stock
was likely over-exploited since 2000. To ensure the
optimal fish production of the small pelagic fish stock in
the Java Sea, it is necessary to recover fish stock by
controlling fishing effort to EMSY
. The time which it takes
for the fish stock to recover was about two years when
fishing effort was reduced from its level in 2009 to EMSY
.
KEYWORDS: Potential production, optimal fishing
effort, small pelagic fishery, the Java Sea
EXPLOITATION AND CATCH FLUCTUATION OF
SMALL PELAGIC FISHES IN PRIGI WATERS,
SOUTH COAST OF JAVA
Suwarso
IFRJ,Vol.20 No.2,Page: 69-76
ABSTRACT
Studies on the exploitation and catch fluctuations of
pelagic fishes have been undertaken in order to
understand the fishery systems, annual and seasonal
change of fishing effort and catches, as well as species
composition. The study was based on the daily
monitoring data of the purse seiners. The results showed
that generally the fishing activities is one day fishing, the
increase of fishing effort reflected in the number of fishing
units and the number of trip, while the trend of production
and catch rate were fluctuated by either annual or
seasonal; the peak of catch rate was occurred in 2007,
2008 and 2012 periods, during December to June were
low catches, and are going in the peak season in
September-October. The lowest catch rate is about
100kg/trip and the maximum of 4.3 tons/trip (the average
of 1.3 tons/trip), however the fail of fishing was often
occurs and reached 30% of the total number of trips; the
failed fishing was decline from year to year. The catch
rate (kg/trip/day) was showed a pattern fluctuations; the
small pelagic fish mainly the scads (Decapterus spp.)
and clupeids (Bali sardine, Sardinella lemuru),
respectively 33% and17%, whereas the dominan large
pelagic fish is ‘tongkol’/frigate tuna (Auxis thazzard). The
changes of species domination was occurred either in
annually or seasonally
KEYWORDS: Exploitation, catch, purse seine, small
pelagic fishes, Prigi, South Coast of Java
vi
PRODUCTIVITY AND ECONOMIC ANALYSIS OF THE
INDIAN OCEAN LONGLINE FISHERY LANDED AT
BENOA PORT BALI INDONESIA
Fathur Rochman
IFRJ,Vol.20 No.2,Page: 77-86
ABSTRACT
This study highlighted the occurrence of productivity and
economic analysis of Indian Ocean longline fishery which
was landed in Benoa port Bali Indonesia. The aim of this
study is to determine feasibility of tuna longline effort based
on business analysis and current condition. The data used
in this study based on the Research Institute for Tuna
Fisheries (RITF) observer program in Benoa from 2010-
2011. This paper presents the current information on Catch
per Unit of Effort (CPUE) and feasibility analysis based on
the recent economic parameters. The CPUEs of tuna
longline vessel in 2010 and 2011 respectively were 288.35
kg/effort and 281.97 kg/effort. The feasibility analysis of
Indian Ocean tuna longline effort showed that tuna longline
efforts remains profitable and feasible with payback periods
(year-3, month - 2 and day- 18), internal rate of return (53%),
average rate of return (61.24%) and net present value
between Rp 1.709.897.950,- (first year) and Rp
85.331.099.211,- (at the end of 25 years).
KEYWORD: CPUE, payback periods, net present value,
internal rate of return and average rate of
return
INITIATION ON ECOSYSTEM APPROACH TO
FISHERIES MANAGEMENT (EAFM): CASE STUDY ON
TARAKAN FISHERIES
Andhika Prima Prasetyo
IFRJ,Vol.20 No.2,Page: 87-98
ABSTRACT
An EAFM from a global perspective is still moving
towards on implementation. EAFM is based on
conventional fisheries management but broadens the
perspective beyond seeing a fishery as simply “fish in the
sea, people in boats,” beyond consideration only of
commercially important species, and beyond management
efforts directed solely at the harvesting process. This
research aims to initiate implementing EAFM in Indonesia:
case in Tarakan Fisheries, North Kalimantan Province.
From the initiate implementation of EAFM, we found that
the possibility to improve the performance on arrange
fisheries management based on ecosystem approach.
EAFM could be used as tools to confirm scientific
findings and gathering initial information on fisheries.
In the case, fisheries community in Tarakan was put
human well-being as important point to determine
fisheries management, rather than ecological well-
being. To secure the fisheries the possible options
would arrange accepted and adaptable policy on
controlling fisheries i.e. temporary fishing closure in
term of area and season.
KEYWORDS:Uncertainty, FGD, IFM, EAFM, Tarakan
fisheries
COST-EFFECTIVE APPROACH TO ESTIMATE
UNREPORTED DATA: REBUILDING HISTORY
OF LIFT-NET FISHING IN KWANDANG WATERS
Andhika Prima Prasetyo
IFRJ,Vol.20 No.2,Page: 99-106
ABSTRACT
This paper aims to develop cost-effective
approach regarding the estimation unreported
annual catch data of lift-net fishery using Google Earth
imagery. Lift net fishery is one of the main fishing
activities of coastal community in Kwandang Bay, it
has been faced problem of uncertain fisheries status
due to limited recorded data. Combination of a Monte
Carlo procedure was applied by involving couple of
assumptions on parameters such as estimate
growth rate of the total number of lift-net per years
(10%), day at sea per unit per month (21 days) and
operated lift-net per month (50% and 80%). The
results showed that 101 units of lift-nets were found
around Kwandang waters based on Google Earth
imagery recorded in October, 7th 2010, and this were
used as a benchmark of calculation. This prediction
was 28 units higher than official data from North
Gorontalo District of Marine Affairs and Fisheries
Services (DKP Gorontalo Utara). Compared with
capture fisheries statistics issued by Kwandang CFP,
the estimated lift-net catches based on two-
scenarios represent additional catches of 46 % and
86 %. These results suggested and could be used
as a correction index to improve the reliability of
Kwandang District officially reported fisheries
statistics as a baseline to develop a local common
fisheries policy.
KEYWORDS: Cost-effective approach, unreported
data, lift-net fishing, Kwandang waters
77
Productivity and Economic Analysis of the ……………..at Benoa Port Bali Indonesia (Rochman, F & B Nugraha)
PRODUCTIVITY AND ECONOMIC ANALYSIS OF THE INDIAN OCEAN LONGLINEFISHERY LANDED AT BENOA PORT BALI INDONESIA
Fathur Rochman and Budi NugrahaResearch Institute for Tuna Fisheries, Benoa- Bali, Indonesia
Received February 11-2013; Received in revised form September 24-2014; Accepted September 26-2014
E-mail: [email protected]
ABSTRACT
This study highlighted the occurrence of productivity and economic analysis of Indian Oceanlongline fishery which was landed in Benoa port Bali Indonesia. The aim of this study is to determinefeasibility of tuna longline effort based on business analysis and current condition. The data usedin this study based on the Research Institute for Tuna Fisheries (RITF) observer program in Benoafrom 2010-2011. This paper presents the current information on Catch per Unit of Effort (CPUE)and feasibility analysis based on the recent economic parameters. The CPUEs of tuna longlinevessel in 2010 and 2011 respectively were 288.35 kg/effort and 281.97 kg/effort. The feasibilityanalysis of Indian Ocean tuna longline effort showed that tuna longline efforts remains profitableand feasible with payback periods (year-3, month - 2 and day- 18), internal rate of return (53%),average rate of return (61.24%) and net present value between Rp 1.709.897.950,- (first year) andRp 85.331.099.211,- (at the end of 25 years).
KEYWORD: CPUE, payback periods, net present value, internal rate of return and averagerate of return
INTRODUCTION
Tuna fisheries resource is one of the potentialfisheries resources that are widely spread in Indonesiawater and become an important economic value asthe local consumption and exports. Tuna fishery isan important product in the world characterized by atuna trade which was reached up to 65% for the sectorof fisheries biological resources (Zulham, 2003). Tunaproduct is the second biggest of the Indonesianfishery exports, contributing 14 percent of total exportvalue (USD 352 million in 2009). The main marketsfor tuna export from Indonesia are Japan (35%), theUnited States (20%), Thailand (12%), European Union(9%), and SaudiArabia (6%) (MMAF 2010). Indonesiais also the biggest fresh and frozen tuna supplier tothe US, contributing about 27 percent (or about 13thousand tons) of total US fresh and frozen tuna importin 2010, valued at USD 112 million. Indonesia wasthe leader of tuna supplying countries to Japan (mainlyyellowfin and bigeye), supplying about 20 thousandtons per year of tuna to Japan’s market. Indonesiaonly contributes about 2 percent of total canned tunaimport to the EU market, amounting to 9,800 tons in2008 (NMFS 2011).
Indonesia is the biggest tuna producing countries,contributing to 12.45% of total commercial tunaproduction in 2007, followed by Philippines (11.36%),Japan (10.23%), Taiwan (8.3%), and Korea (6.1%).Indonesia also holds important position for highlycommercial species, such as yellowfin tuna, big eye,albacore, southern bluefin tuna and skipjack.Indonesia is the second important countries to produce
yellowfin tuna, after Philippines, contributing to 7.5%of total global yellowfin tuna catches. Indonesia isthe third biggest producing country for bigeye,albacore and Southern bluefin tuna in the world,contributing to 9.5%, 8% and 9% of their globalcatches respectively (FAO, 2012).
Tuna fishing in Indonesia is dominated by industrialscale using tuna longline fishing gear (longline tuna).Directorate General of Capture Fisheries (2011), recordthe number of units of tuna longline fishing gear hasincreased an average of 3.46% from the year 2000-2010. Entering 2006, the tuna longline fisheries inIndonesia faced with many changes and challengesas a result of the rising prices of fuel oil (BBM). Theincrease in diesel prices greatly affected vesseloperating costs and total production of the catch.Hapsari (2006), the total production of tuna fishingeffort in the tuna longline vessels owned by PTPerikanan Samudera Besar (now PT PerikananNusantara), before and after the increase in dieselprices decreased by 14.37%. Another problemencountered in the tuna longline fishery is thereduction of hooking rate, which is one indication ofthe low abundance of tuna fish stocks in the waters,so many tuna longline company required to have theability to survive and compete in the sea.
This paper presents the development of production,productivity and economic analysis of tuna longlinefishing vessel in Indian Ocean. This paper alsopresents a feasibilityevaluation of tuna longline vesselsbased on Research Institute for Tuna Fisheriesobserver data.
_________________Corresponding author:IInstitute for Tuna Fisheries, Benoa- Bali, IndonesiaJl. Merta Sari, No. 140. Denpasar, Bali-Indonesia
Ind.Fish.Res.J. Vol.20 No.2 December 2014:
78
MATERIALS AND METHODSProductivity /Catch per Unit Effort (CPUE)
Productivity is commonly defined as a ratio of avolume measure of output to a measure of input useamong others productivity measure such as multi-factor productivity or capital productivity.Productivity is an average measure of the efficiencyof production. Productivity is a ratio of productionoutput to what is required to produce it (inputs ofcapital, labor, land, energy, materials, etc.). Themeasure of productivity is defined as a total outputper one unit of a total input (Freeman, 2008). Fishingproductivity according to Minister of Marine andFisheries Decision Number 38 of 2003 is a level offishing vessels to obtain fish catches per year.
Production per trip (Catch per Unit Effort) tuna longlinevessel calculated based on the volume of fish catchand the amount of tuna longliner trip (CPUE), withequation:
Production per Trip (CPUE)= ..1
Productivity is also based on Hook Rate (HR%)and Fishing Rate (Kg/Setting). The Hook Rate (%) isnumber of fish caught per 100 hooks (Klawe,1980).
HR(%)=(NumberofFish/NumberofHook)x100….......2
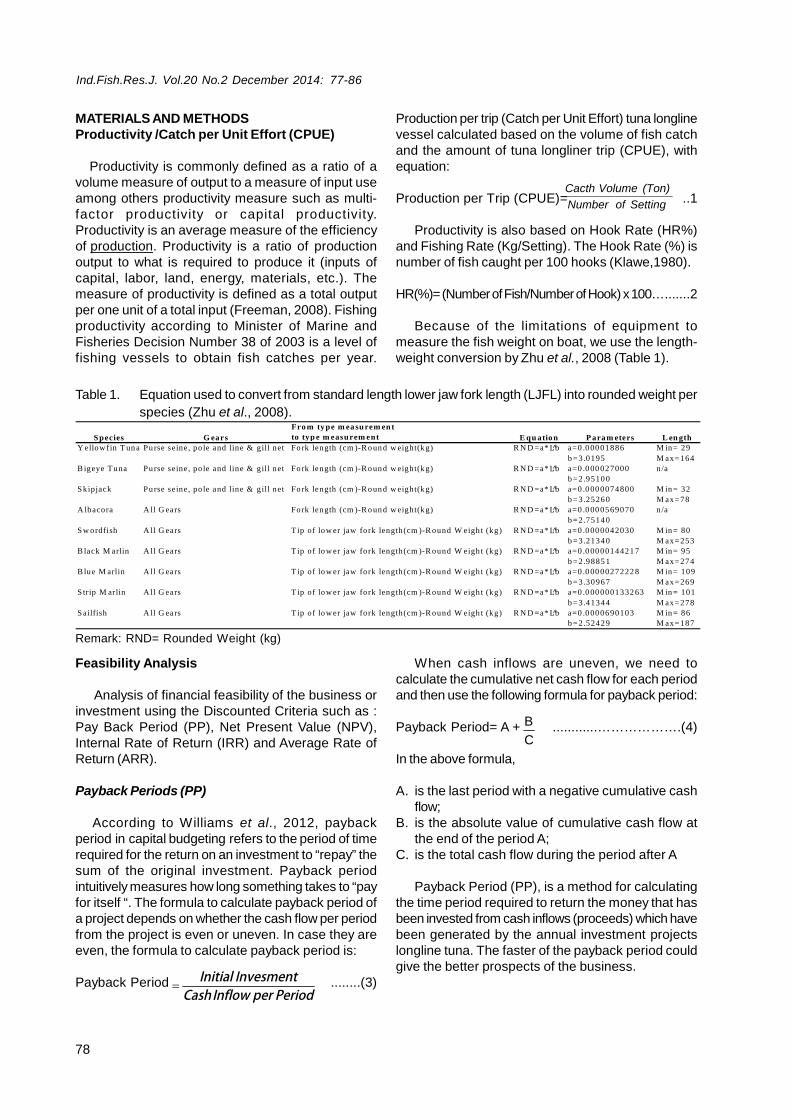
Because of the limitations of equipment tomeasure the fish weight on boat, we use the length-weight conversion by Zhu et al., 2008 (Table 1).
Table 1. Equation used to convert from standard length lower jaw fork length (LJFL) into rounded weight per
species (Zhu et al., 2008).Fro m ty pe m ea su rem en t
to typ e m easurem ent
Y ellow fin T un a Pu rse seine, pole and line & gill net Fo rk length (cm )-R o un d w eight(k g) R N D =a* L̂ b a=0 .0 00 01886 M in = 29
b =3.0195 M ax=164
B igeye Tu na Pu rse seine, pole and line & gill net Fo rk length (cm )-R o un d w eight(k g) R N D =a* L̂ b a=0 .0 00 027000 n/a
b =2.9510 0
S kipjack Pu rse seine, pole and line & gill net Fo rk length (cm )-R o un d w eight(k g) R N D =a* L̂ b a=0 .0 00 0074800 M in = 32
b =3.2526 0 M ax=78
A lbacora A ll G ears Fo rk length (cm )-R o un d w eight(k g) R N D =a* L̂ b a=0 .0 00 0569070 n/a
b =2.7514 0
S w ordfish A ll G ears T ip of lo w er jaw fork length(cm )-R ound W eigh t (kg) R N D =a* L̂ b a=0 .0 00 0042030 M in = 80
b =3.2134 0 M ax=253
B lack M arlin A ll G ears T ip of lo w er jaw fork length(cm )-R ound W eigh t (kg) R N D =a* L̂ b a=0 .0 00 0014421 7 M in = 95
b =2.9885 1 M ax=274
B lu e M arlin A ll G ears T ip of lo w er jaw fork length(cm )-R ound W eigh t (kg) R N D =a* L̂ b a=0 .0 00 0027222 8 M in = 109
b =3.3096 7 M ax=269
S trip M arlin A ll G ears T ip of lo w er jaw fork length(cm )-R ound W eigh t (kg) R N D =a* L̂ b a=0 .0 00 0001332 63 M in = 101
b =3.4134 4 M ax=278
S ailfish A ll G ears T ip of lo w er jaw fork length(cm )-R ound W eigh t (kg) R N D =a* L̂ b a=0 .0 00 0690103 M in = 86
b =2.5242 9 M ax=187
S pecies G ears E qu atio n P ara m eters L en gth
Remark: RND= Rounded Weight (kg)
Feasibility Analysis
Analysis of financial feasibility of the business orinvestment using the Discounted Criteria such as :Pay Back Period (PP), Net Present Value (NPV),Internal Rate of Return (IRR) and Average Rate ofReturn (ARR).
Payback Periods (PP)
According to Williams et al., 2012, paybackperiod in capital budgeting refers to the period of timerequired for the return on an investment to “repay” thesum of the original investment. Payback periodintuitively measures how long something takes to “payfor itself “. The formula to calculate payback period ofa project depends on whether the cash flow per periodfrom the project is even or uneven. In case they areeven, the formula to calculate payback period is:
Payback Period ........(3)
When cash inflows are uneven, we need tocalculate the cumulative net cash flow for each periodand then use the following formula for payback period:
Payback Period= A + ............……………….(4)
In the above formula,
A. is the last period with a negative cumulative cashflow;
B. is the absolute value of cumulative cash flow atthe end of the period A;
C. is the total cash flow during the period after A
Payback Period (PP), is a method for calculatingthe time period required to return the money that hasbeen invested from cash inflows (proceeds) which havebeen generated by the annual investment projectslongline tuna. The faster of the payback period couldgive the better prospects of the business.
77-86
C
B
PeriodperInflowCashInvesmentInitial
SettingofNumber
(Ton)VolumeCacth
79
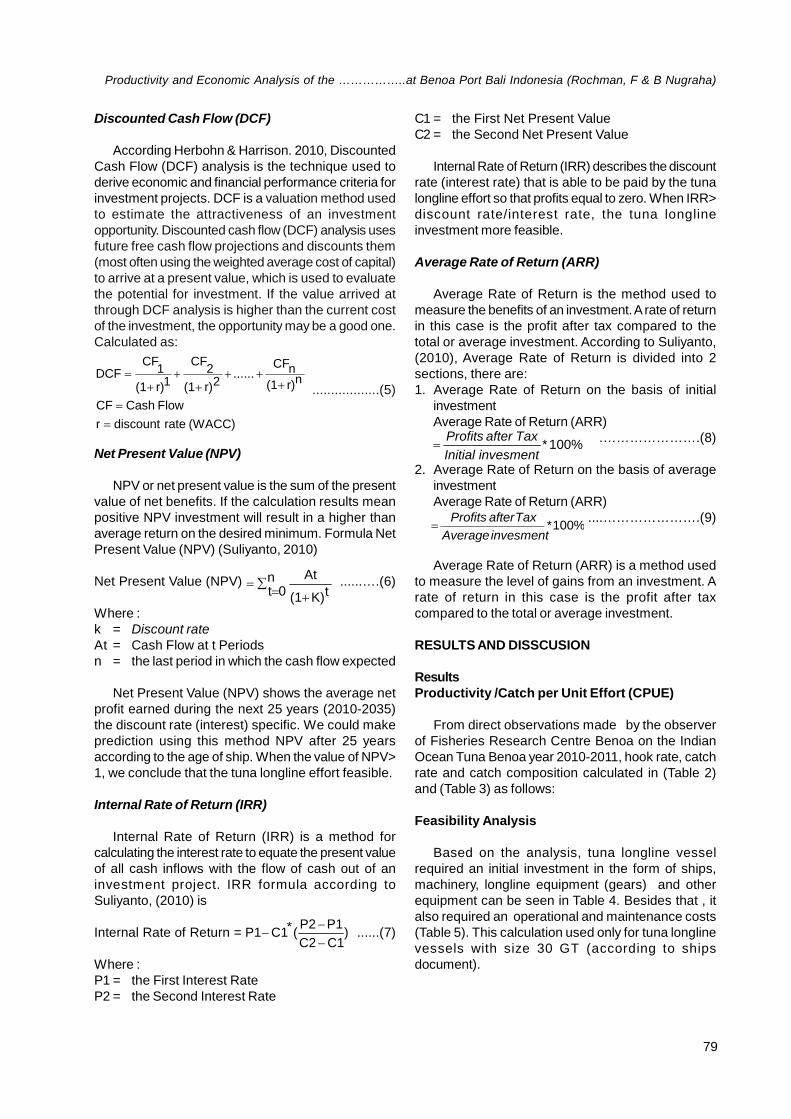
Discounted Cash Flow (DCF)
According Herbohn & Harrison. 2010, DiscountedCash Flow (DCF) analysis is the technique used toderive economic and financial performance criteria forinvestment projects. DCF is a valuation method usedto estimate the attractiveness of an investmentopportunity. Discounted cash flow (DCF) analysis usesfuture free cash flow projections and discounts them(most often using the weighted average cost of capital)to arrive at a present value, which is used to evaluatethe potential for investment. If the value arrived atthrough DCF analysis is higher than the current costof the investment, the opportunity may be a good one.Calculated as:
..................(5)
Net Present Value (NPV)
NPV or net present value is the sum of the presentvalue of net benefits. If the calculation results meanpositive NPV investment will result in a higher thanaverage return on the desired minimum. Formula NetPresent Value (NPV) (Suliyanto, 2010)
Net Present Value (NPV) ......….(6)
Where :k = Discount rateAt = Cash Flow at t Periodsn = the last period in which the cash flow expected
Net Present Value (NPV) shows the average netprofit earned during the next 25 years (2010-2035)the discount rate (interest) specific. We could makeprediction using this method NPV after 25 yearsaccording to the age of ship. When the value of NPV>1, we conclude that the tuna longline effort feasible.
Internal Rate of Return (IRR)
Internal Rate of Return (IRR) is a method forcalculating the interest rate to equate the present valueof all cash inflows with the flow of cash out of aninvestment project. IRR formula according toSuliyanto, (2010) is
Internal Rate of Return = ......(7)
Where :P1 = the First Interest RateP2 = the Second Interest Rate
C1 = the First Net Present ValueC2 = the Second Net Present Value
Internal Rate of Return (IRR) describes the discountrate (interest rate) that is able to be paid by the tunalongline effort so that profits equal to zero. When IRR>discount rate/interest rate, the tuna longlineinvestment more feasible.
Average Rate of Return (ARR)
Average Rate of Return is the method used tomeasure the benefits of an investment.A rate of returnin this case is the profit after tax compared to thetotal or average investment. According to Suliyanto,(2010), Average Rate of Return is divided into 2sections, there are:1. Average Rate of Return on the basis of initial
investmentAverage Rate of Return (ARR)
.………………….(8)
2. Average Rate of Return on the basis of averageinvestmentAverage Rate of Return (ARR)
....………………….(9)
Average Rate of Return (ARR) is a method usedto measure the level of gains from an investment. Arate of return in this case is the profit after taxcompared to the total or average investment.
RESULTS AND DISSCUSION
ResultsProductivity /Catch per Unit Effort (CPUE)
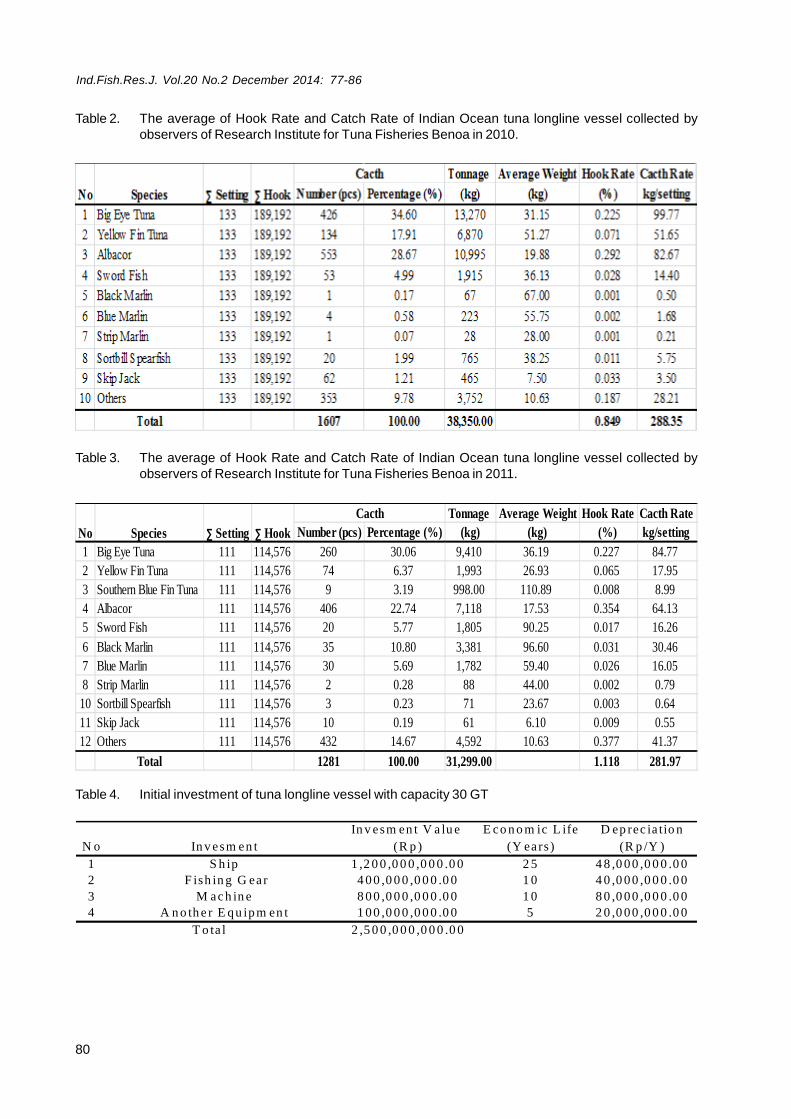
From direct observations made by the observerof Fisheries Research Centre Benoa on the IndianOcean Tuna Benoa year 2010-2011, hook rate, catchrate and catch composition calculated in (Table 2)and (Table 3) as follows:
Feasibility Analysis
Based on the analysis, tuna longline vesselrequired an initial investment in the form of ships,machinery, longline equipment (gears) and otherequipment can be seen in Table 4. Besides that , italso required an operational and maintenance costs(Table 5). This calculation used only for tuna longlinevessels with size 30 GT (according to shipsdocument).
Productivity and Economic Analysis of the ……………..at Benoa Port Bali Indonesia (Rochman, F & B Nugraha)
(WACC)ratediscountr
FlowCashCF
nr)(1
nCF......
2r)(1
2CF
1r)(1
1CF
DCF
tK)(1
Atn0t
)C1C2
P1P2(*C1P1
100%*invesmentInitial
TaxafterProfits
100%*invesmentAverage
TaxafterProfits
Ind.Fish.Res.J. Vol.20 No.2 December 2014:
80
Table 2. The average of Hook Rate and Catch Rate of Indian Ocean tuna longline vessel collected byobservers of Research Institute for Tuna Fisheries Benoa in 2010.
Table 3. The average of Hook Rate and Catch Rate of Indian Ocean tuna longline vessel collected byobservers of Research Institute for Tuna Fisheries Benoa in 2011.
Table 4. Initial investment of tuna longline vessel with capacity 30 GT
In v esm en t V a lu e E co n o m ic L ife D ep rec ia tio n
(R p ) (Y ears ) (R p /Y )
1 S h ip 1 ,2 0 0 ,0 0 0 ,0 0 0 .0 0 2 5 4 8 ,0 00 ,0 0 0 .0 0
2 F ish in g G ear 4 00 ,0 0 0 ,0 0 0 .0 0 1 0 4 0 ,0 00 ,0 0 0 .0 0
3 M ac h in e 8 00 ,0 0 0 ,0 0 0 .0 0 1 0 8 0 ,0 00 ,0 0 0 .0 0
4 A n o th e r E qu ipm en t 1 00 ,0 0 0 ,0 0 0 .0 0 5 2 0 ,0 00 ,0 0 0 .0 0
2 ,5 0 0 ,0 0 0 ,0 0 0 .0 0T o ta l
In v esm en tN o
Tonnage Average Weight Hook Rate Cacth Rate
Number (pcs) Percentage (%) (kg) (kg) (%) kg/setting
1 Big Eye Tuna 111 114,576 260 30.06 9,410 36.19 0.227 84.77
2 Yellow Fin Tuna 111 114,576 74 6.37 1,993 26.93 0.065 17.95
3 Southern Blue Fin Tuna 111 114,576 9 3.19 998.00 110.89 0.008 8.99
4 Albacor 111 114,576 406 22.74 7,118 17.53 0.354 64.13
5 Sword Fish 111 114,576 20 5.77 1,805 90.25 0.017 16.26
6 Black Marlin 111 114,576 35 10.80 3,381 96.60 0.031 30.46
7 Blue Marlin 111 114,576 30 5.69 1,782 59.40 0.026 16.05
8 Strip Marlin 111 114,576 2 0.28 88 44.00 0.002 0.79
10 Sortbill Spearfish 111 114,576 3 0.23 71 23.67 0.003 0.64
11 Skip Jack 111 114,576 10 0.19 61 6.10 0.009 0.55
12 Others 111 114,576 432 14.67 4,592 10.63 0.377 41.37
Total 1281 100.00 31,299.00 1.118 281.97
No Species ∑ Setting ∑ Hook
Cacth
77-86
81
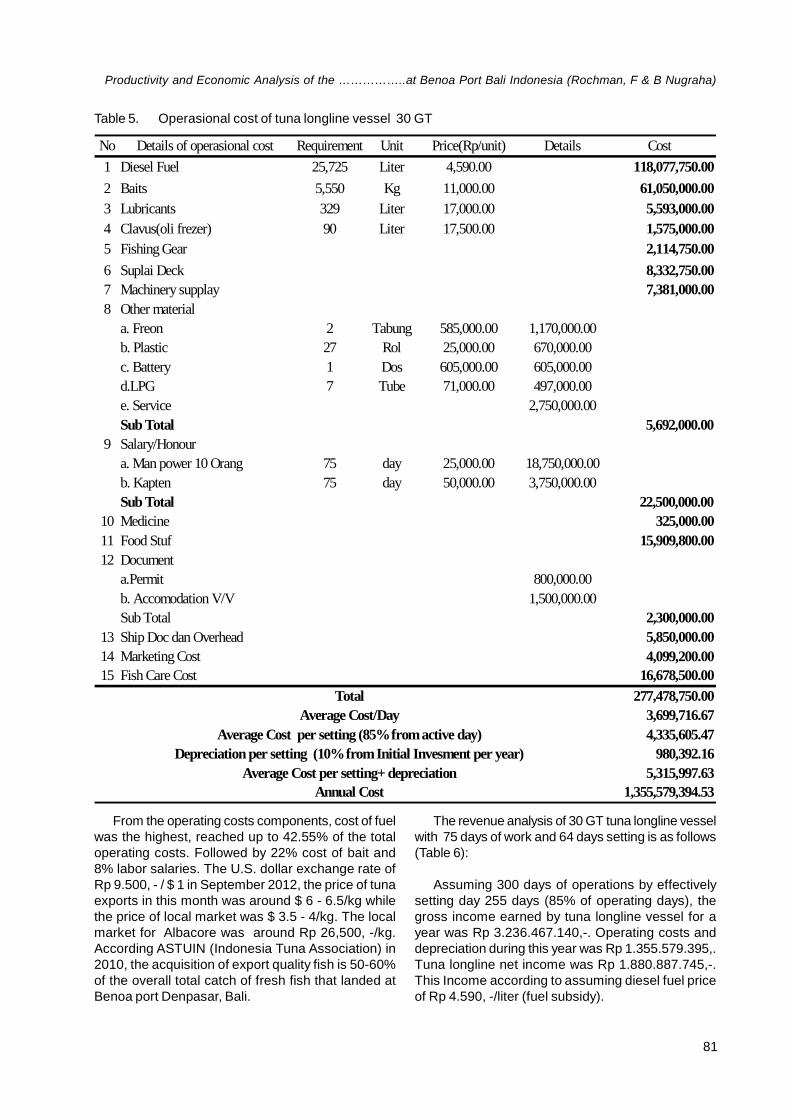
Table 5. Operasional cost of tuna longline vessel 30 GT
No Details of operasional cost Requirement Unit Price(Rp/unit) Details Cost
1 Diesel Fuel 25,725 Liter 4,590.00 118,077,750.00
2 Baits 5,550 Kg 11,000.00 61,050,000.00
3 Lubricants 329 Liter 17,000.00 5,593,000.00
4 Clavus(oli frezer) 90 Liter 17,500.00 1,575,000.00
5 Fishing Gear 2,114,750.00
6 Suplai Deck 8,332,750.00
7 Machinery supplay 7,381,000.00
8 Other material
a. Freon 2 Tabung 585,000.00 1,170,000.00
b. Plastic 27 Rol 25,000.00 670,000.00
c. Battery 1 Dos 605,000.00 605,000.00
d.LPG 7 Tube 71,000.00 497,000.00
e. Service 2,750,000.00
Sub Total 5,692,000.00
9 Salary/Honour
a. Man power 10 Orang 75 day 25,000.00 18,750,000.00
b. Kapten 75 day 50,000.00 3,750,000.00
Sub Total 22,500,000.00
10 Medicine 325,000.00
11 Food Stuf 15,909,800.00
12 Document
a.Permit 800,000.00
b. Accomodation V/V 1,500,000.00
Sub Total 2,300,000.00
13 Ship Doc dan Overhead 5,850,000.00
14 Marketing Cost 4,099,200.00
15 Fish Care Cost 16,678,500.00
277,478,750.00
3,699,716.67
4,335,605.47
980,392.16
5,315,997.63
1,355,579,394.53
Average Cost/Day
Average Cost per setting+ depreciation
Annual Cost
Average Cost per setting (85%fromactive day)
Total
Depreciation per setting (10%fromInitial Invesment per year)
From the operating costs components, cost of fuelwas the highest, reached up to 42.55% of the totaloperating costs. Followed by 22% cost of bait and8% labor salaries. The U.S. dollar exchange rate ofRp 9.500, - / $ 1 in September 2012, the price of tunaexports in this month was around $ 6 - 6.5/kg whilethe price of local market was $ 3.5 - 4/kg. The localmarket for Albacore was around Rp 26,500, -/kg.According ASTUIN (Indonesia Tuna Association) in2010, the acquisition of export quality fish is 50-60%of the overall total catch of fresh fish that landed atBenoa port Denpasar, Bali.
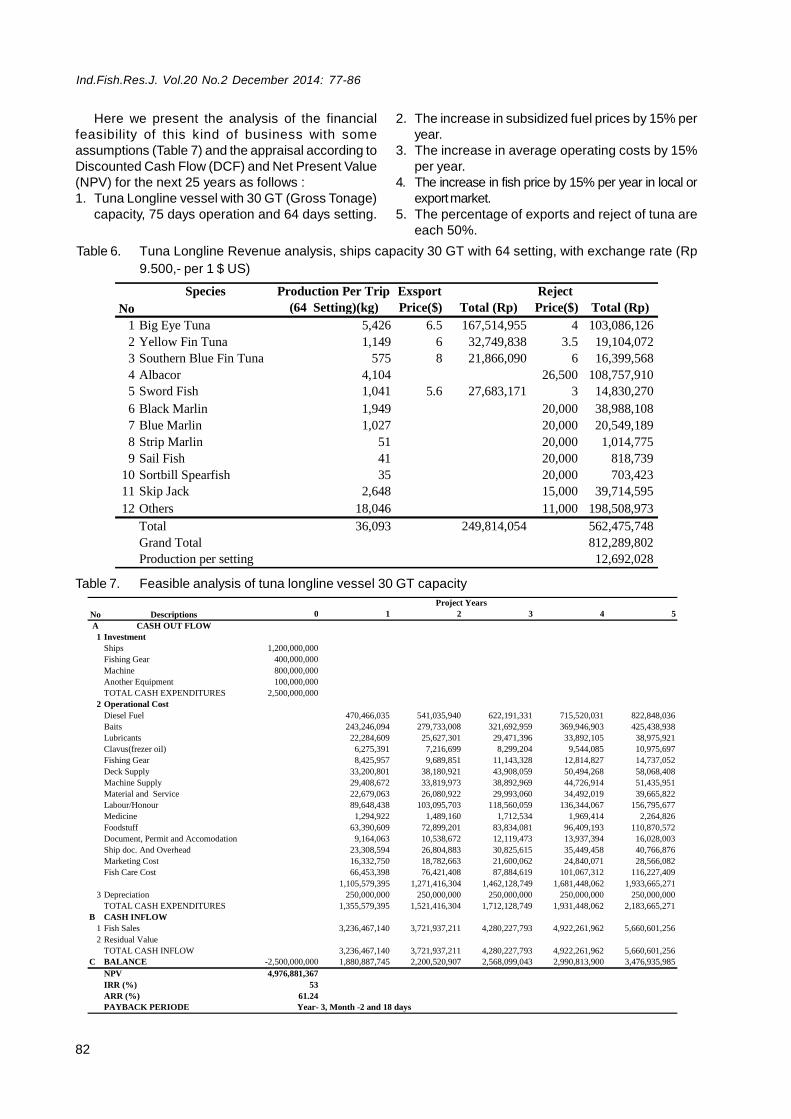
The revenue analysis of 30 GT tuna longline vesselwith 75 days of work and 64 days setting is as follows(Table 6):
Assuming 300 days of operations by effectivelysetting day 255 days (85% of operating days), thegross income earned by tuna longline vessel for ayear was Rp 3.236.467.140,-. Operating costs anddepreciation during this year was Rp 1.355.579.395,.Tuna longline net income was Rp 1.880.887.745,-.This Income according to assuming diesel fuel priceof Rp 4.590, -/liter (fuel subsidy).
Productivity and Economic Analysis of the ……………..at Benoa Port Bali Indonesia (Rochman, F & B Nugraha)
Ind.Fish.Res.J. Vol.20 No.2 December 2014:
82
Table 6. Tuna Longline Revenue analysis, ships capacity 30 GT with 64 setting, with exchange rate (Rp
9.500,- per 1 $ US)
Here we present the analysis of the financialfeasibility of this kind of business with someassumptions (Table 7) and the appraisal according toDiscounted Cash Flow (DCF) and Net Present Value(NPV) for the next 25 years as follows :1. Tuna Longline vessel with 30 GT (Gross Tonage)
capacity, 75 days operation and 64 days setting.
2. The increase in subsidized fuel prices by 15% peryear.
3. The increase in average operating costs by 15%per year.
4. The increase in fish price by 15% per year in local orexportmarket.
5. The percentage of exports and reject of tuna areeach 50%.
Species Production Per Trip Exsport Reject
(64 Setting)(kg) Price($) Total (Rp) Price($) Total (Rp)
1 Big Eye Tuna 5,426 6.5 167,514,955 4 103,086,126
2 Yellow Fin Tuna 1,149 6 32,749,838 3.5 19,104,072
3 Southern Blue Fin Tuna 575 8 21,866,090 6 16,399,568
4 Albacor 4,104 26,500 108,757,910
5 Sword Fish 1,041 5.6 27,683,171 3 14,830,270
6 Black Marlin 1,949 20,000 38,988,108
7 Blue Marlin 1,027 20,000 20,549,189
8 Strip Marlin 51 20,000 1,014,775
9 Sail Fish 41 20,000 818,739
10 Sortbill Spearfish 35 20,000 703,423
11 Skip Jack 2,648 15,000 39,714,595
12 Others 18,046 11,000 198,508,973
Total 36,093 249,814,054 562,475,748
Grand Total 812,289,802
Production per setting 12,692,028
No
Table 7. Feasible analysis of tuna longline vessel 30 GT capacity
0 1 2 3 4 5
A CASH OUT FLOW
1 Investment
Ships 1,200,000,000
Fishing Gear 400,000,000
Machine 800,000,000
Another Equipment 100,000,000
TOTAL CASH EXPENDITURES 2,500,000,000
2 Operational Cost
Diesel Fuel 470,466,035 541,035,940 622,191,331 715,520,031 822,848,036
Baits 243,246,094 279,733,008 321,692,959 369,946,903 425,438,938
Lubricants 22,284,609 25,627,301 29,471,396 33,892,105 38,975,921
Clavus(frezer oil) 6,275,391 7,216,699 8,299,204 9,544,085 10,975,697
Fishing Gear 8,425,957 9,689,851 11,143,328 12,814,827 14,737,052
Deck Supply 33,200,801 38,180,921 43,908,059 50,494,268 58,068,408
Machine Supply 29,408,672 33,819,973 38,892,969 44,726,914 51,435,951
Material and Service 22,679,063 26,080,922 29,993,060 34,492,019 39,665,822
Labour/Honour 89,648,438 103,095,703 118,560,059 136,344,067 156,795,677
Medicine 1,294,922 1,489,160 1,712,534 1,969,414 2,264,826
Foodstuff 63,390,609 72,899,201 83,834,081 96,409,193 110,870,572
Document, Permit and Accomodation 9,164,063 10,538,672 12,119,473 13,937,394 16,028,003
Ship doc. And Overhead 23,308,594 26,804,883 30,825,615 35,449,458 40,766,876
Marketing Cost 16,332,750 18,782,663 21,600,062 24,840,071 28,566,082
Fish Care Cost 66,453,398 76,421,408 87,884,619 101,067,312 116,227,409
1,105,579,395 1,271,416,304 1,462,128,749 1,681,448,062 1,933,665,271
3 Depreciation 250,000,000 250,000,000 250,000,000 250,000,000 250,000,000
TOTAL CASH EXPENDITURES 1,355,579,395 1,521,416,304 1,712,128,749 1,931,448,062 2,183,665,271
B CASH INFLOW
1 Fish Sales 3,236,467,140 3,721,937,211 4,280,227,793 4,922,261,962 5,660,601,256
2 Residual Value
TOTAL CASH INFLOW 3,236,467,140 3,721,937,211 4,280,227,793 4,922,261,962 5,660,601,256C BALANCE -2,500,000,000 1,880,887,745 2,200,520,907 2,568,099,043 2,990,813,900 3,476,935,985
NPV 4,976,881,367
IRR (%) 53
ARR (%) 61.24PAYBACK PERIODE
Project Years
No Descriptions
Year- 3, Month -2 and 18 days
77-86
83
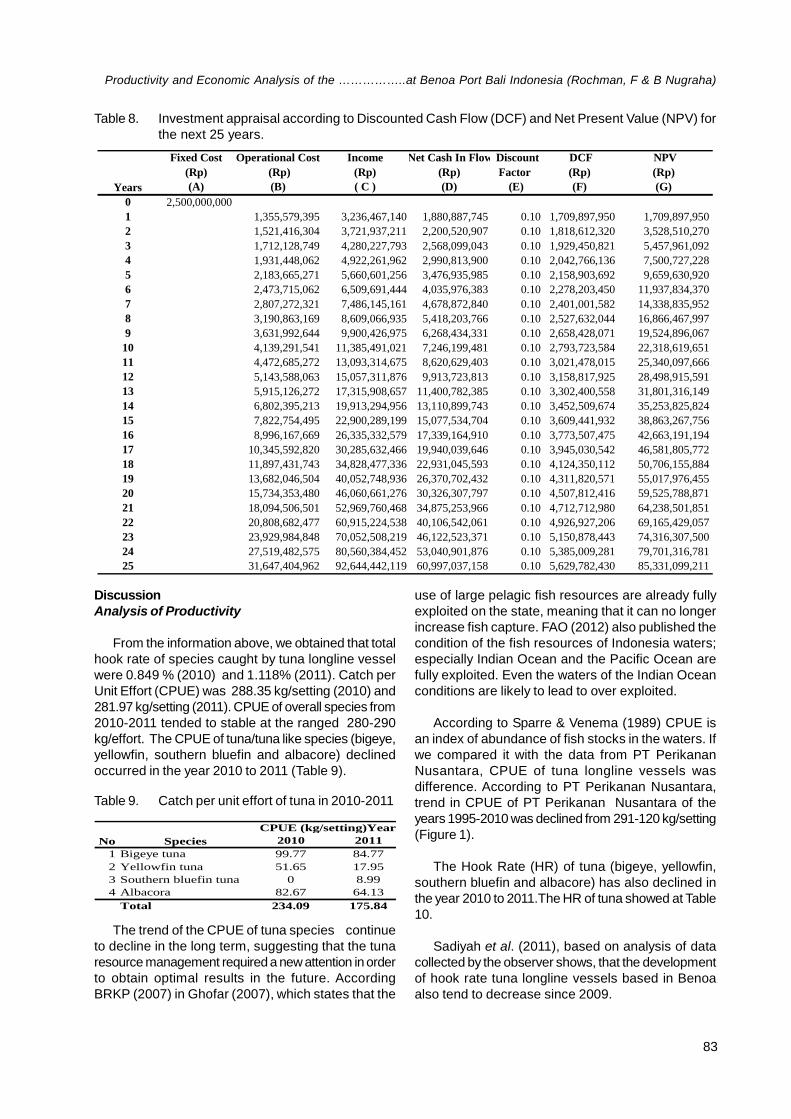
Table 8. Investment appraisal according to Discounted Cash Flow (DCF) and Net Present Value (NPV) forthe next 25 years.
Fixed Cost Operational Cost Income Net Cash In Flow Discount DCF NPV
(Rp) (Rp) (Rp) (Rp) Factor (Rp) (Rp)
(A) (B) ( C ) (D) (E) (F) (G)
0 2,500,000,000
1 1,355,579,395 3,236,467,140 1,880,887,745 0.10 1,709,897,950 1,709,897,950
2 1,521,416,304 3,721,937,211 2,200,520,907 0.10 1,818,612,320 3,528,510,270
3 1,712,128,749 4,280,227,793 2,568,099,043 0.10 1,929,450,821 5,457,961,092
4 1,931,448,062 4,922,261,962 2,990,813,900 0.10 2,042,766,136 7,500,727,228
5 2,183,665,271 5,660,601,256 3,476,935,985 0.10 2,158,903,692 9,659,630,920
6 2,473,715,062 6,509,691,444 4,035,976,383 0.10 2,278,203,450 11,937,834,370
7 2,807,272,321 7,486,145,161 4,678,872,840 0.10 2,401,001,582 14,338,835,952
8 3,190,863,169 8,609,066,935 5,418,203,766 0.10 2,527,632,044 16,866,467,997
9 3,631,992,644 9,900,426,975 6,268,434,331 0.10 2,658,428,071 19,524,896,067
10 4,139,291,541 11,385,491,021 7,246,199,481 0.10 2,793,723,584 22,318,619,651
11 4,472,685,272 13,093,314,675 8,620,629,403 0.10 3,021,478,015 25,340,097,666
12 5,143,588,063 15,057,311,876 9,913,723,813 0.10 3,158,817,925 28,498,915,591
13 5,915,126,272 17,315,908,657 11,400,782,385 0.10 3,302,400,558 31,801,316,149
14 6,802,395,213 19,913,294,956 13,110,899,743 0.10 3,452,509,674 35,253,825,824
15 7,822,754,495 22,900,289,199 15,077,534,704 0.10 3,609,441,932 38,863,267,756
16 8,996,167,669 26,335,332,579 17,339,164,910 0.10 3,773,507,475 42,663,191,194
17 10,345,592,820 30,285,632,466 19,940,039,646 0.10 3,945,030,542 46,581,805,772
18 11,897,431,743 34,828,477,336 22,931,045,593 0.10 4,124,350,112 50,706,155,884
19 13,682,046,504 40,052,748,936 26,370,702,432 0.10 4,311,820,571 55,017,976,455
20 15,734,353,480 46,060,661,276 30,326,307,797 0.10 4,507,812,416 59,525,788,871
21 18,094,506,501 52,969,760,468 34,875,253,966 0.10 4,712,712,980 64,238,501,851
22 20,808,682,477 60,915,224,538 40,106,542,061 0.10 4,926,927,206 69,165,429,057
23 23,929,984,848 70,052,508,219 46,122,523,371 0.10 5,150,878,443 74,316,307,500
24 27,519,482,575 80,560,384,452 53,040,901,876 0.10 5,385,009,281 79,701,316,781
25 31,647,404,962 92,644,442,119 60,997,037,158 0.10 5,629,782,430 85,331,099,211
Years
DiscussionAnalysis of Productivity
From the information above, we obtained that totalhook rate of species caught by tuna longline vesselwere 0.849 % (2010) and 1.118% (2011). Catch perUnit Effort (CPUE) was 288.35 kg/setting (2010) and281.97 kg/setting (2011). CPUE of overall species from2010-2011 tended to stable at the ranged 280-290kg/effort. The CPUE of tuna/tuna like species (bigeye,yellowfin, southern bluefin and albacore) declinedoccurred in the year 2010 to 2011 (Table 9).
The trend of the CPUE of tuna species continueto decline in the long term, suggesting that the tunaresource management required a new attention in orderto obtain optimal results in the future. AccordingBRKP (2007) in Ghofar (2007), which states that the
Table 9. Catch per unit effort of tuna in 2010-2011
2010 2011
1 Bigeye tuna 99.77 84.77
2 Yellowfin tuna 51.65 17.95
3 Southern bluefin tuna 0 8.99
4 Albacora 82.67 64.13
Total 234.09 175.84
CPUE (kg/setting)Years
SpeciesNo
use of large pelagic fish resources are already fullyexploited on the state, meaning that it can no longerincrease fish capture. FAO (2012) also published thecondition of the fish resources of Indonesia waters;especially Indian Ocean and the Pacific Ocean arefully exploited. Even the waters of the Indian Oceanconditions are likely to lead to over exploited.
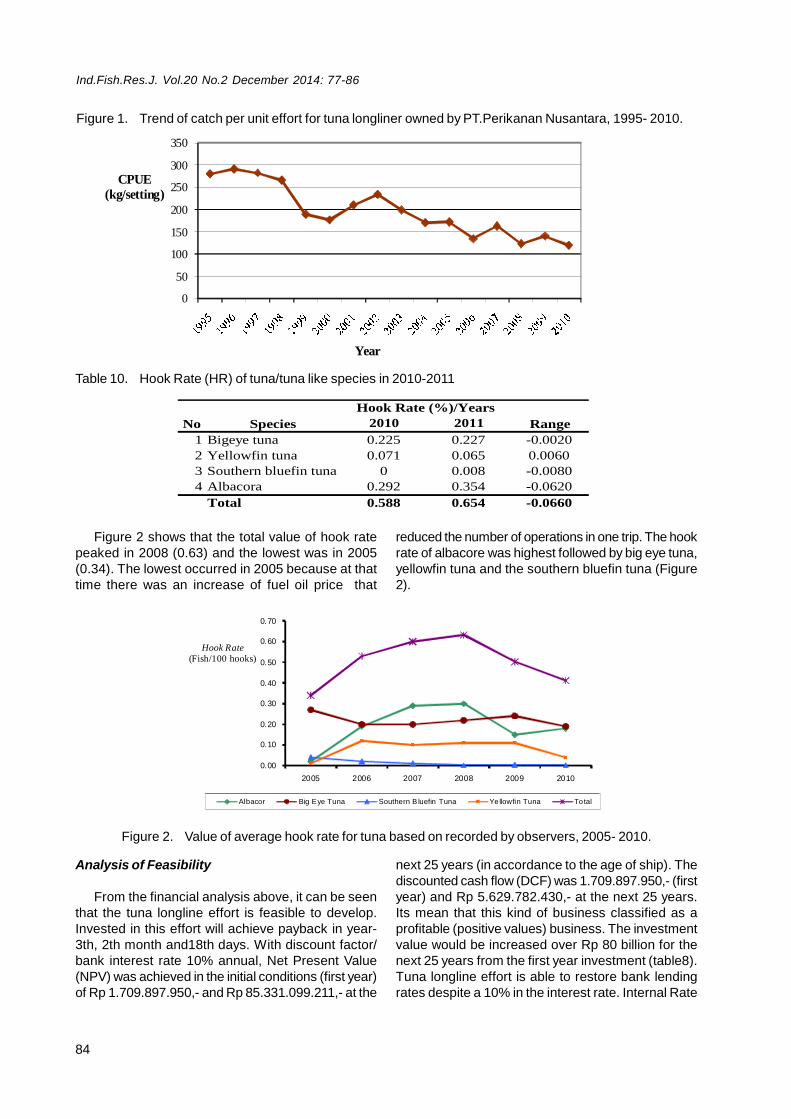
According to Sparre & Venema (1989) CPUE isan index of abundance of fish stocks in the waters. Ifwe compared it with the data from PT PerikananNusantara, CPUE of tuna longline vessels wasdifference. According to PT Perikanan Nusantara,trend in CPUE of PT Perikanan Nusantara of theyears 1995-2010 was declined from 291-120 kg/setting(Figure 1).
The Hook Rate (HR) of tuna (bigeye, yellowfin,southern bluefin and albacore) has also declined inthe year 2010 to 2011.The HR of tuna showed at Table10.
Sadiyah et al. (2011), based on analysis of datacollected by the observer shows, that the developmentof hook rate tuna longline vessels based in Benoaalso tend to decrease since 2009.
Productivity and Economic Analysis of the ……………..at Benoa Port Bali Indonesia (Rochman, F & B Nugraha)
Ind.Fish.Res.J. Vol.20 No.2 December 2014:
84
0
50
100
150
200
250
300
350
CPUE(kg/setting)
Year
Figure 1. Trend of catch per unit effort for tuna longliner owned by PT.Perikanan Nusantara, 1995- 2010.
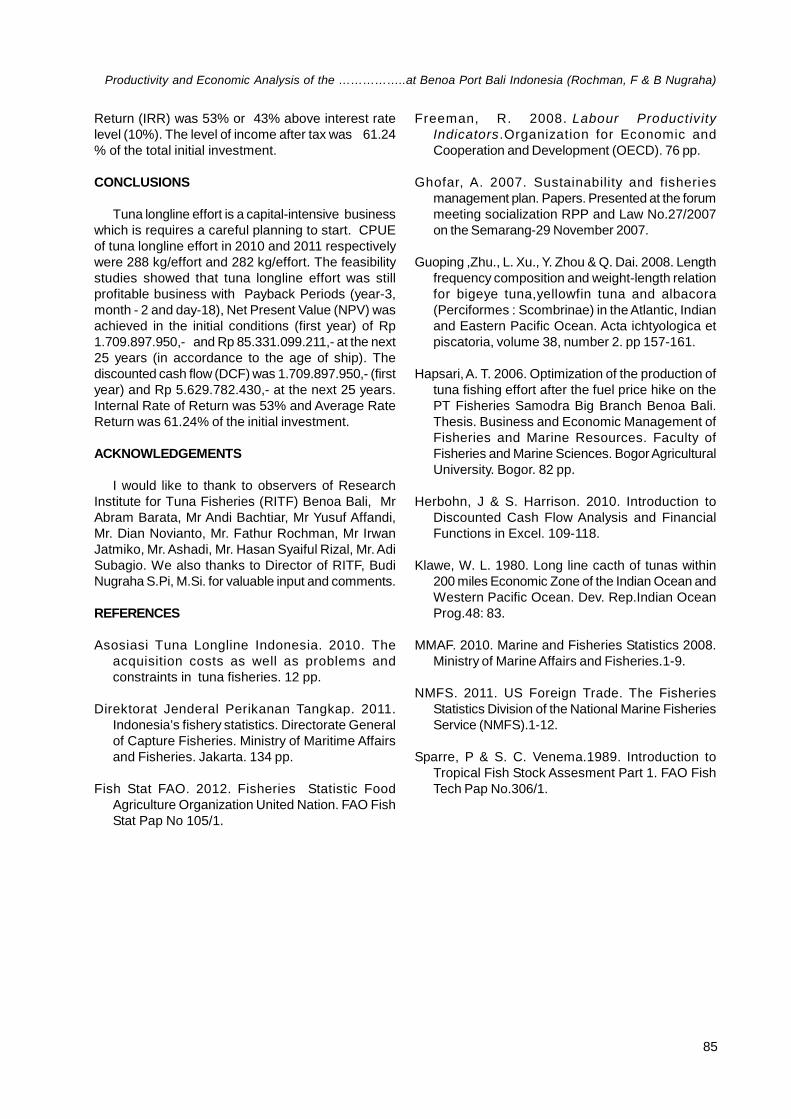
Table 10. Hook Rate (HR) of tuna/tuna like species in 2010-2011
2010 2011
1 Bigeye tuna 0.225 0.227 -0.0020
2 Yellowfin tuna 0.071 0.065 0.0060
3 Southern bluefin tuna 0 0.008 -0.0080
4 Albacora 0.292 0.354 -0.0620
Total 0.588 0.654 -0.0660
No Species
Hook Rate (%)/Years
Range
Figure 2 shows that the total value of hook ratepeaked in 2008 (0.63) and the lowest was in 2005(0.34). The lowest occurred in 2005 because at thattime there was an increase of fuel oil price that
reduced the number of operations in one trip. The hookrate of albacore was highest followed by big eye tuna,yellowfin tuna and the southern bluefin tuna (Figure2).
0.00
0.10
0.20
0.30
0.40
0.50
0.60
0.70
2005 2006 2007 2008 2009 2010
Hook Rate(Fish/100 hooks)
Albacor Big Eye Tuna Southern B luefin Tuna Yellowfin Tuna Total
Figure 2. Value of average hook rate for tuna based on recorded by observers, 2005- 2010.
Analysis of Feasibility
From the financial analysis above, it can be seenthat the tuna longline effort is feasible to develop.Invested in this effort will achieve payback in year-3th, 2th month and18th days. With discount factor/bank interest rate 10% annual, Net Present Value(NPV) was achieved in the initial conditions (first year)of Rp 1.709.897.950,- and Rp 85.331.099.211,- at the
next 25 years (in accordance to the age of ship). Thediscounted cash flow (DCF) was 1.709.897.950,- (firstyear) and Rp 5.629.782.430,- at the next 25 years.Its mean that this kind of business classified as aprofitable (positive values) business. The investmentvalue would be increased over Rp 80 billion for thenext 25 years from the first year investment (table8).Tuna longline effort is able to restore bank lendingrates despite a 10% in the interest rate. Internal Rate
77-86
85
Return (IRR) was 53% or 43% above interest ratelevel (10%). The level of income after tax was 61.24% of the total initial investment.
CONCLUSIONS
Tuna longline effort is a capital-intensive businesswhich is requires a careful planning to start. CPUEof tuna longline effort in 2010 and 2011 respectivelywere 288 kg/effort and 282 kg/effort. The feasibilitystudies showed that tuna longline effort was stillprofitable business with Payback Periods (year-3,month - 2 and day-18), Net Present Value (NPV) wasachieved in the initial conditions (first year) of Rp1.709.897.950,- and Rp 85.331.099.211,- at the next25 years (in accordance to the age of ship). Thediscounted cash flow (DCF) was 1.709.897.950,- (firstyear) and Rp 5.629.782.430,- at the next 25 years.Internal Rate of Return was 53% and Average RateReturn was 61.24% of the initial investment.
ACKNOWLEDGEMENTS
I would like to thank to observers of ResearchInstitute for Tuna Fisheries (RITF) Benoa Bali, MrAbram Barata, Mr Andi Bachtiar, Mr Yusuf Affandi,Mr. Dian Novianto, Mr. Fathur Rochman, Mr IrwanJatmiko, Mr. Ashadi, Mr. Hasan Syaiful Rizal, Mr. AdiSubagio. We also thanks to Director of RITF, BudiNugraha S.Pi, M.Si. for valuable input and comments.
REFERENCES
Asosiasi Tuna Longline Indonesia. 2010. Theacquisition costs as well as problems andconstraints in tuna fisheries. 12 pp.
Direktorat Jenderal Perikanan Tangkap. 2011.Indonesia’s fishery statistics. Directorate Generalof Capture Fisheries. Ministry of Maritime Affairsand Fisheries. Jakarta. 134 pp.
Fish Stat FAO. 2012. Fisheries Statistic FoodAgriculture Organization United Nation. FAO FishStat Pap No 105/1.
Freeman, R. 2008. Labour ProductivityIndicators.Organization for Economic andCooperation and Development (OECD). 76 pp.
Ghofar, A. 2007. Sustainability and fisheriesmanagement plan. Papers. Presented at the forummeeting socialization RPP and Law No.27/2007on the Semarang-29 November 2007.
Guoping ,Zhu., L. Xu., Y. Zhou & Q. Dai. 2008. Lengthfrequency composition and weight-length relationfor bigeye tuna,yellowfin tuna and albacora(Perciformes : Scombrinae) in the Atlantic, Indianand Eastern Pacific Ocean. Acta ichtyologica etpiscatoria, volume 38, number 2. pp 157-161.
Hapsari,A. T. 2006. Optimization of the production oftuna fishing effort after the fuel price hike on thePT Fisheries Samodra Big Branch Benoa Bali.Thesis. Business and Economic Management ofFisheries and Marine Resources. Faculty ofFisheries and Marine Sciences. BogorAgriculturalUniversity. Bogor. 82 pp.
Herbohn, J & S. Harrison. 2010. Introduction toDiscounted Cash Flow Analysis and FinancialFunctions in Excel. 109-118.
Klawe, W. L. 1980. Long line cacth of tunas within200 miles Economic Zone of the Indian Ocean andWestern Pacific Ocean. Dev. Rep.Indian OceanProg.48: 83.
MMAF. 2010. Marine and Fisheries Statistics 2008.Ministry of Marine Affairs and Fisheries.1-9.
NMFS. 2011. US Foreign Trade. The Fisheries
Statistics Division of the National Marine FisheriesService (NMFS).1-12.
Sparre, P & S. C. Venema.1989. Introduction toTropical Fish Stock Assesment Part 1. FAO FishTech Pap No.306/1.
Productivity and Economic Analysis of the ……………..at Benoa Port Bali Indonesia (Rochman, F & B Nugraha)

Ind.Fish.Res.J. Vol.20 No.2 December 2014:
86
Suliyanto. 2010. Feasibility study: a practicalapproach. Andi Publisher. Yogyakarta. 317 pp.
Williams, J. R., S. F. Haka & M. S. Bettner. 2012.FinancialAnd ManagerialAccounting, Mcgraw Hill,1117 pp.
77-86
Zulham, A. 2003. Observing Political of the OceanTuna Fisheries. Issue 2 March-April. Jakarta. 183pp.