indonesian climate change initiatives and green …asia/@ro-bangkok/@ilo-jakarta/... · indonesian...
TRANSCRIPT
Indonesian Climate Change Initiatives and Green Economy
Farhan Helmy Secretary of Mitigation Working Group
National Council on Climate Change -Indonesia (DNPI)
Jakarta, 17 January 2011
2
Outline
• Climate Change Policy: International Context and National Response
• Low Carbon Initiatives and Exercises: Lesson Learnt from the Ground
• Institutional Dynamics
• DNPI Initiatives
• Show Case: Eat Kalimantan Low Carbon Strategies
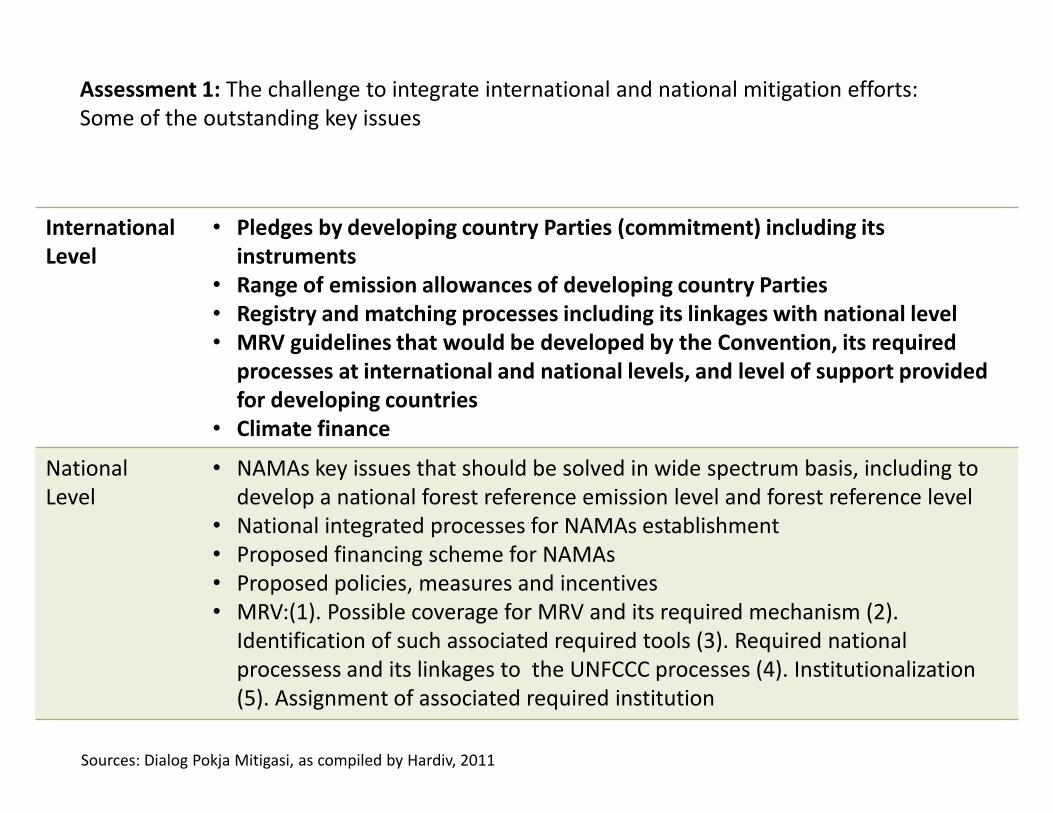
Assessment 1: The challenge to integrate international and national mitigation efforts: Some of the outstanding key issues
Sources: Dialog Pokja Mitigasi, as compiled by Hardiv, 2011
International Level
• Pledges by developing country Parties (commitment) including its instruments
• Range of emission allowances of developing country Parties • Registry and matching processes including its linkages with national level • MRV guidelines that would be developed by the Convention, its required
processes at international and national levels, and level of support provided for developing countries
• Climate finance
National Level
• NAMAs key issues that should be solved in wide spectrum basis, including to develop a national forest reference emission level and forest reference level
• National integrated processes for NAMAs establishment • Proposed financing scheme for NAMAs • Proposed policies, measures and incentives • MRV:(1). Possible coverage for MRV and its required mechanism (2).
Identification of such associated required tools (3). Required national processess and its linkages to the UNFCCC processes (4). Institutionalization (5). Assignment of associated required institution
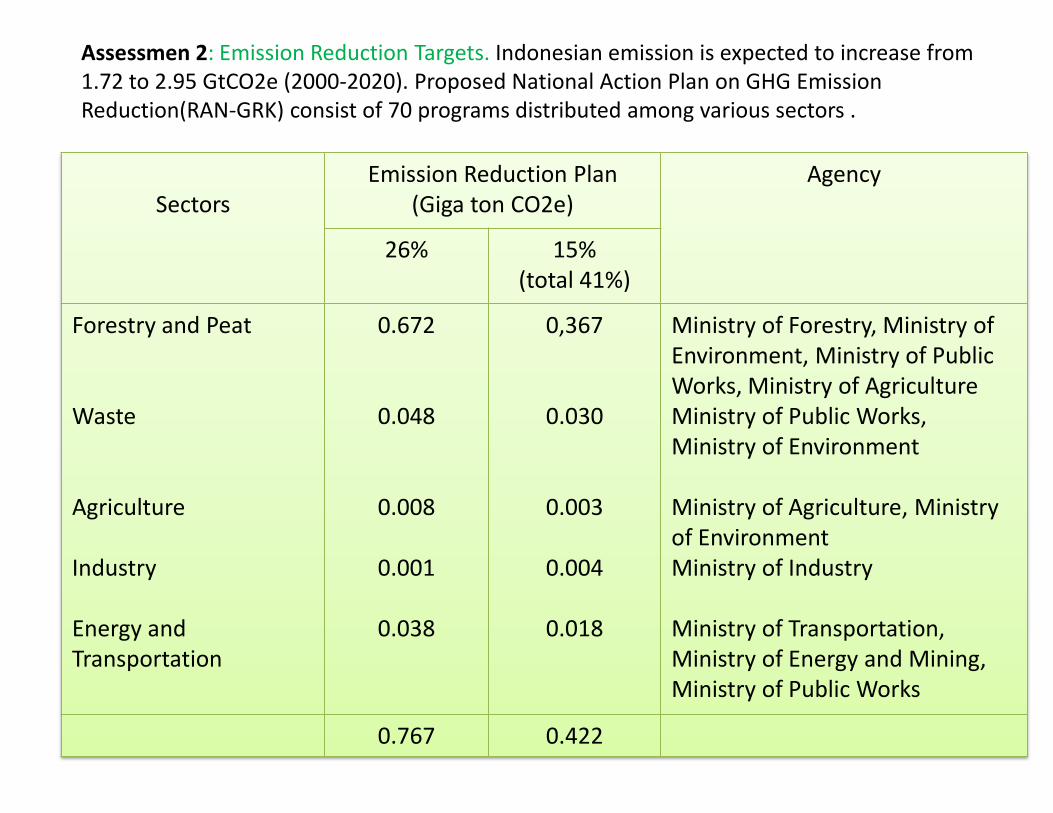
Assessmen 2: Emission Reduction Targets. Indonesian emission is expected to increase from 1.72 to 2.95 GtCO2e (2000-2020). Proposed National Action Plan on GHG Emission Reduction(RAN-GRK) consist of 70 programs distributed among various sectors .
Sectors
Emission Reduction Plan (Giga ton CO2e)
Agency
26% 15% (total 41%)
Forestry and Peat Waste Agriculture Industry Energy and Transportation
0.672
0.048
0.008
0.001
0.038
0,367
0.030
0.003
0.004
0.018
Ministry of Forestry, Ministry of Environment, Ministry of Public Works, Ministry of Agriculture Ministry of Public Works, Ministry of Environment Ministry of Agriculture, Ministry of Environment Ministry of Industry Ministry of Transportation, Ministry of Energy and Mining, Ministry of Public Works
0.767 0.422
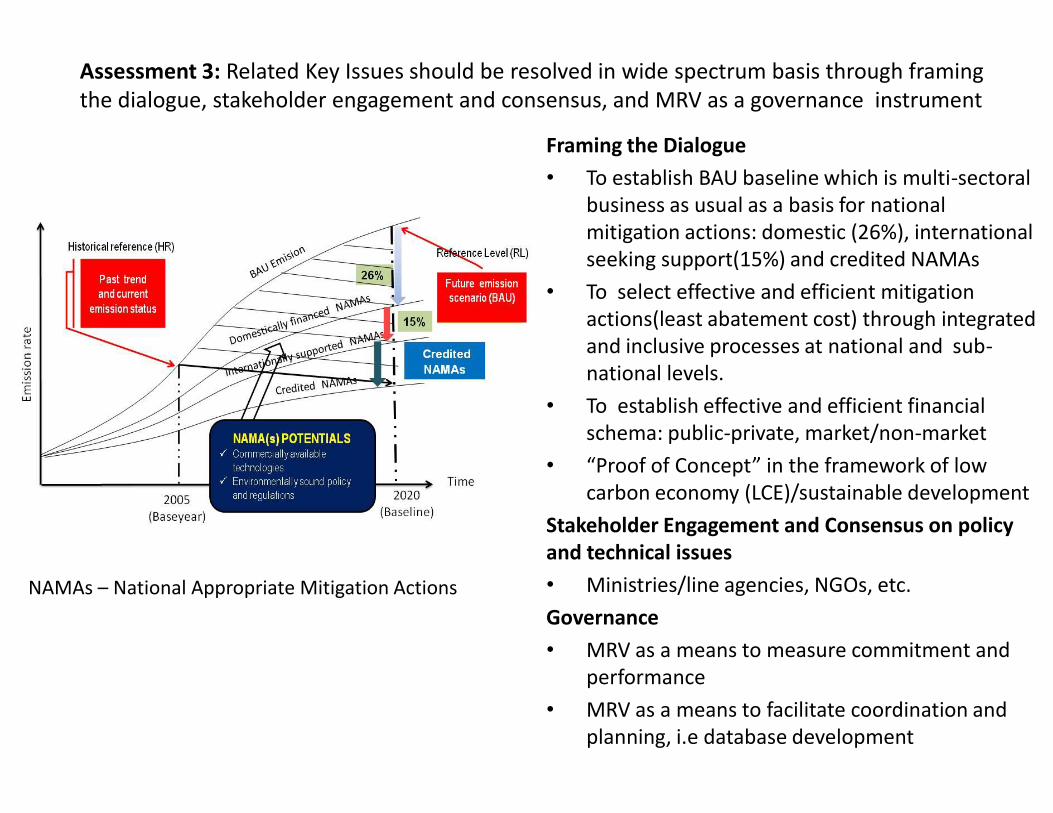
Assessment 3: Related Key Issues should be resolved in wide spectrum basis through framing the dialogue, stakeholder engagement and consensus, and MRV as a governance instrument
NAMAs – National Appropriate Mitigation Actions
Framing the Dialogue
• To establish BAU baseline which is multi-sectoral business as usual as a basis for national mitigation actions: domestic (26%), international seeking support(15%) and credited NAMAs
• To select effective and efficient mitigation actions(least abatement cost) through integrated and inclusive processes at national and sub-national levels.
• To establish effective and efficient financial schema: public-private, market/non-market
• “Proof of Concept” in the framework of low carbon economy (LCE)/sustainable development
Stakeholder Engagement and Consensus on policy and technical issues
• Ministries/line agencies, NGOs, etc.
Governance
• MRV as a means to measure commitment and performance
• MRV as a means to facilitate coordination and planning, i.e database development
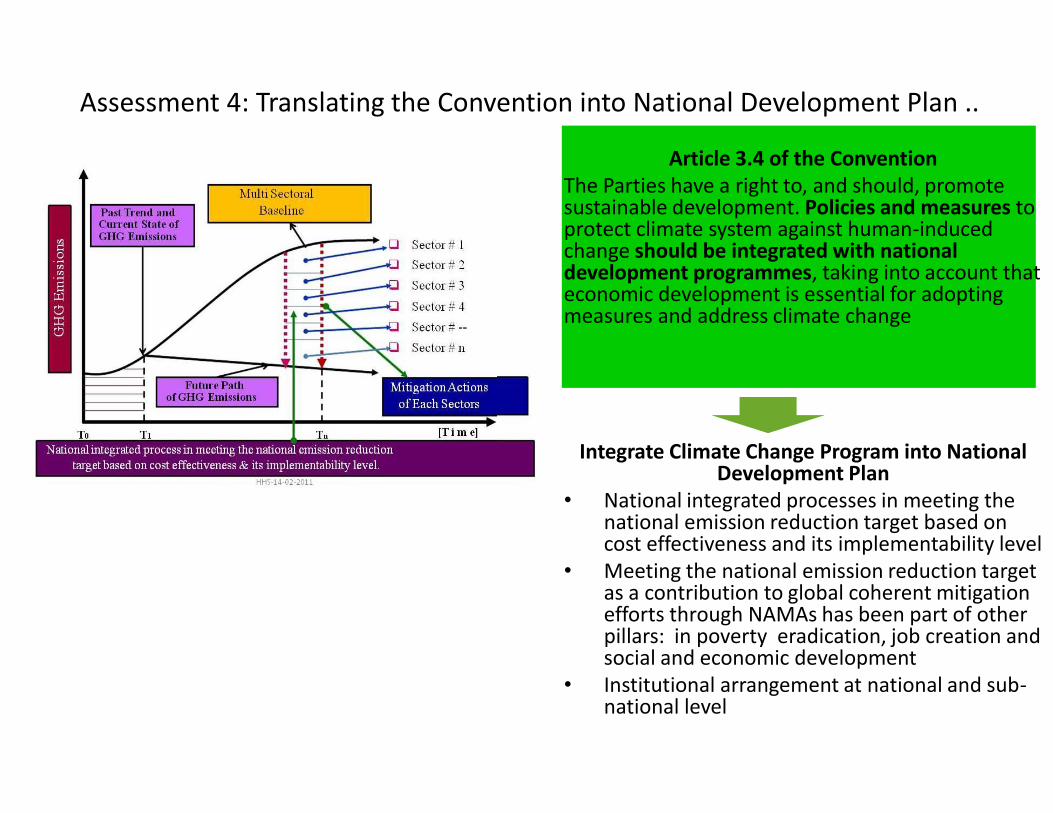
Assessment 4: Translating the Convention into National Development Plan ..
Article 3.4 of the Convention The Parties have a right to, and should, promote sustainable development. Policies and measures to protect climate system against human-induced change should be integrated with national development programmes, taking into account that economic development is essential for adopting measures and address climate change
Integrate Climate Change Program into National
Development Plan • National integrated processes in meeting the
national emission reduction target based on cost effectiveness and its implementability level
• Meeting the national emission reduction target as a contribution to global coherent mitigation efforts through NAMAs has been part of other pillars: in poverty eradication, job creation and social and economic development
• Institutional arrangement at national and sub-national level
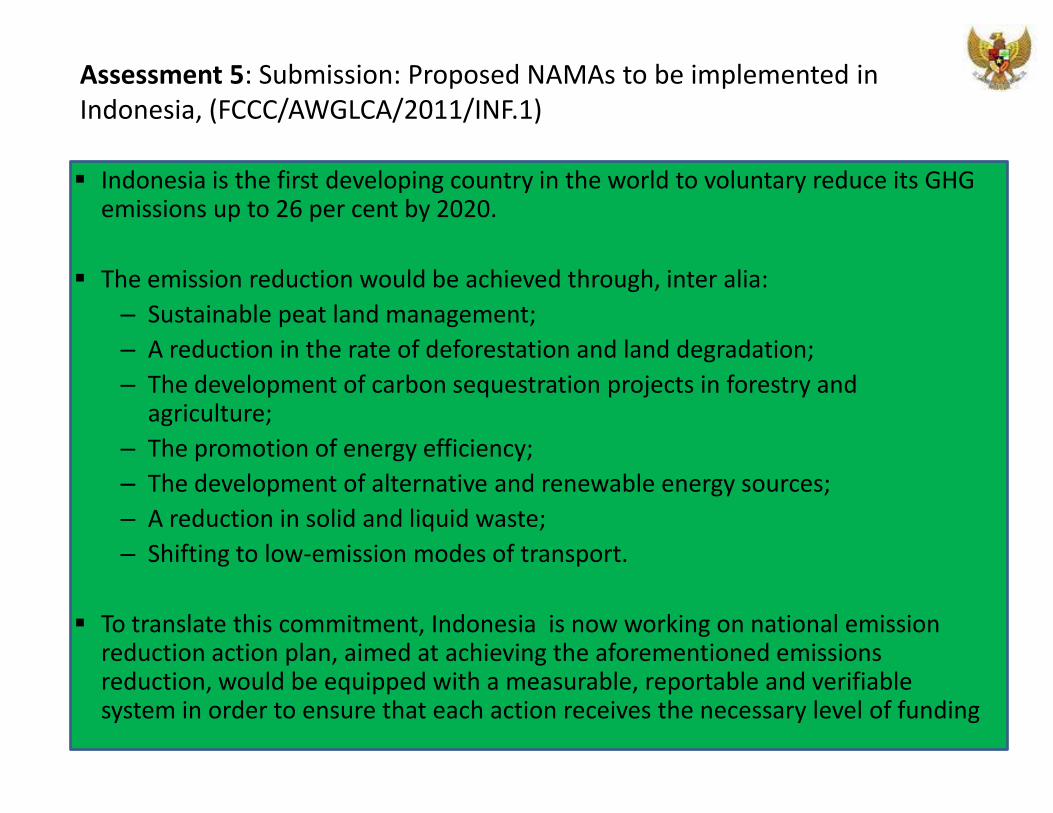
Assessment 5: Submission: Proposed NAMAs to be implemented in Indonesia, (FCCC/AWGLCA/2011/INF.1)
Indonesia is the first developing country in the world to voluntary reduce its GHG emissions up to 26 per cent by 2020.
The emission reduction would be achieved through, inter alia:
– Sustainable peat land management;
– A reduction in the rate of deforestation and land degradation;
– The development of carbon sequestration projects in forestry and agriculture;
– The promotion of energy efficiency;
– The development of alternative and renewable energy sources;
– A reduction in solid and liquid waste;
– Shifting to low-emission modes of transport.
To translate this commitment, Indonesia is now working on national emission reduction action plan, aimed at achieving the aforementioned emissions reduction, would be equipped with a measurable, reportable and verifiable system in order to ensure that each action receives the necessary level of funding
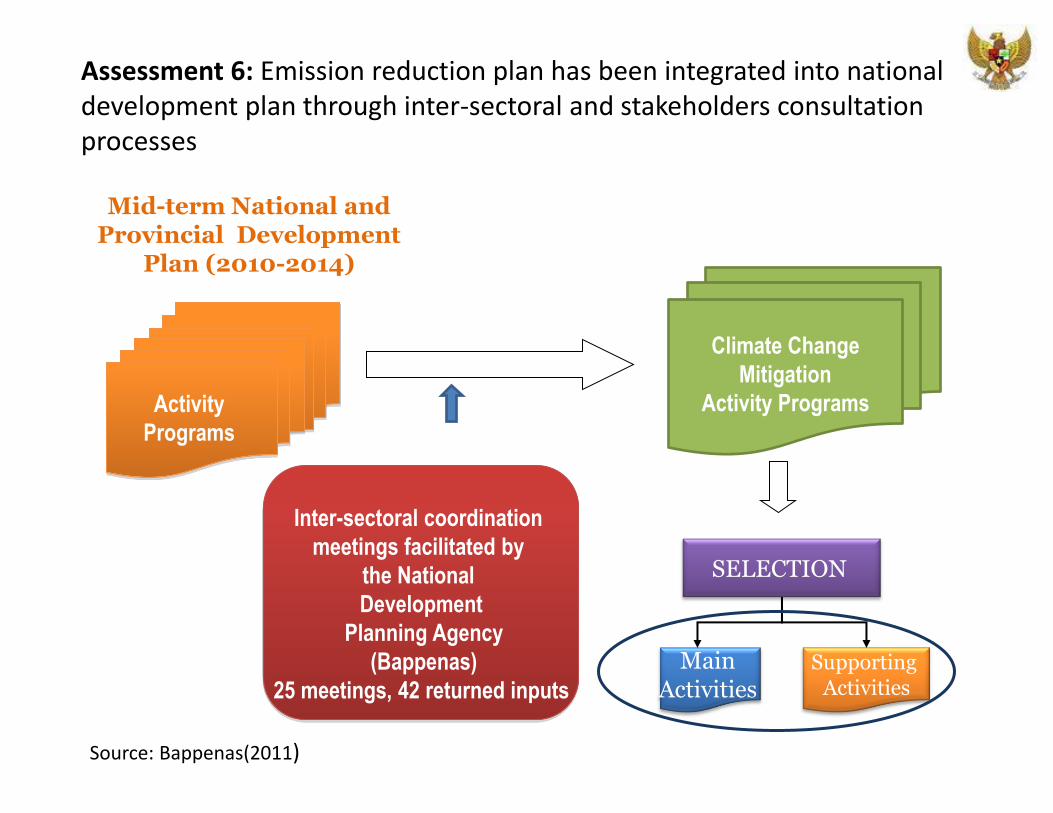
Mid-term National and Provincial Development
Plan (2010-2014)
Activity
Programs
Climate Change
Mitigation
Activity Programs
SELECTION
Main Activities
Supporting Activities
Inter-sectoral coordination
meetings facilitated by
the National
Development
Planning Agency
(Bappenas)
25 meetings, 42 returned inputs
Assessment 6: Emission reduction plan has been integrated into national development plan through inter-sectoral and stakeholders consultation processes
Source: Bappenas(2011)
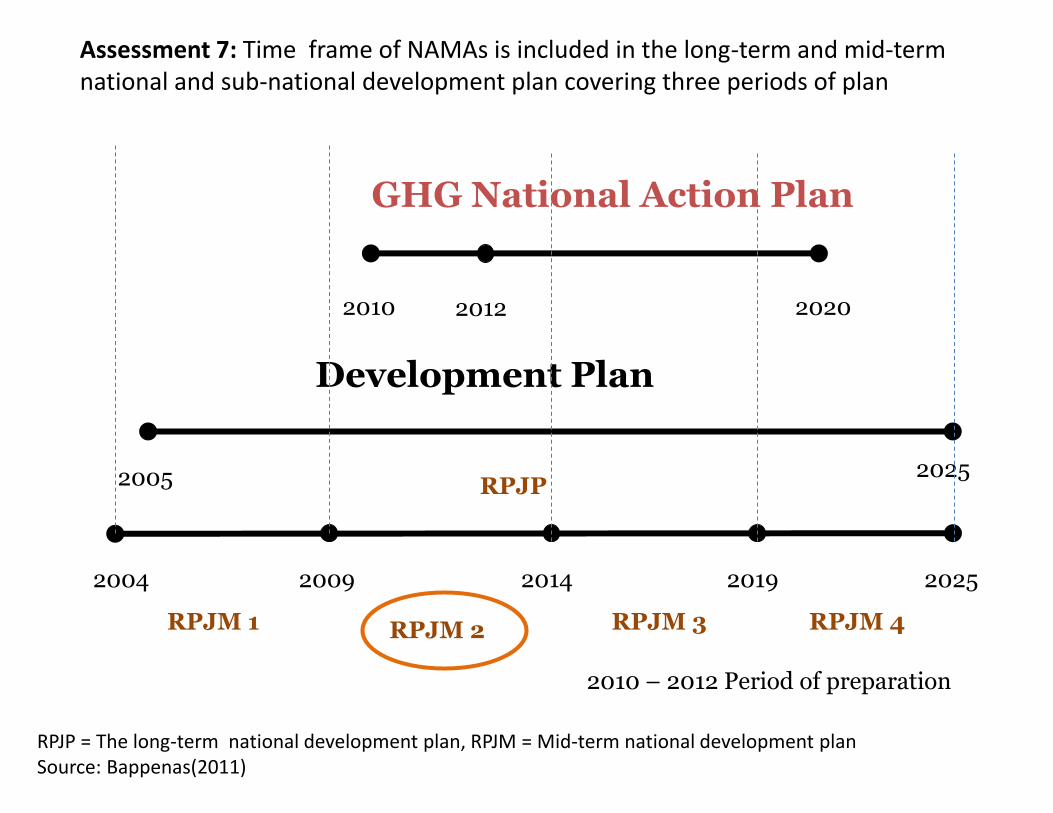
Assessment 7: Time frame of NAMAs is included in the long-term and mid-term national and sub-national development plan covering three periods of plan
GHG National Action Plan
2010 2020
Development Plan
RPJP 2005 2025
RPJM 1 RPJM 2 RPJM 3 RPJM 4
2004 2009 2014 2019 2025
2010 – 2012 Period of preparation
2012
RPJP = The long-term national development plan, RPJM = Mid-term national development plan Source: Bappenas(2011)
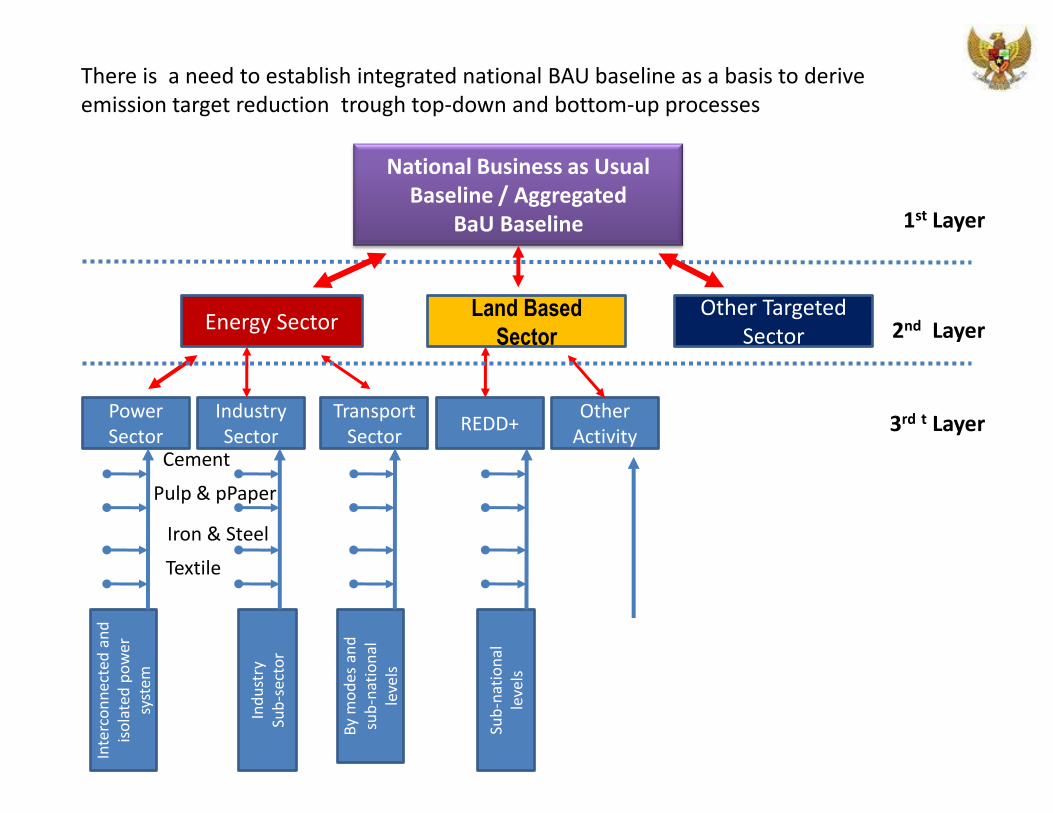
There is a need to establish integrated national BAU baseline as a basis to derive emission target reduction trough top-down and bottom-up processes
National Business as Usual Baseline / Aggregated
BaU Baseline
Energy Sector Land Based
Sector
Other Targeted Sector
Power Sector
Industry Sector
TransportSector
REDD+ Other
Activity
Inte
rco
nn
ect
ed a
nd
is
ola
ted
po
wer
sy
stem
Ind
ust
ry
Sub
-sec
tor
By
mo
des
an
d
sub
-nat
ion
al
leve
ls
Sub
-nat
ion
al
leve
ls
Cement
Pulp & pPaper
Iron & Steel
Textile
1st Layer
2nd Layer
3rd t Layer
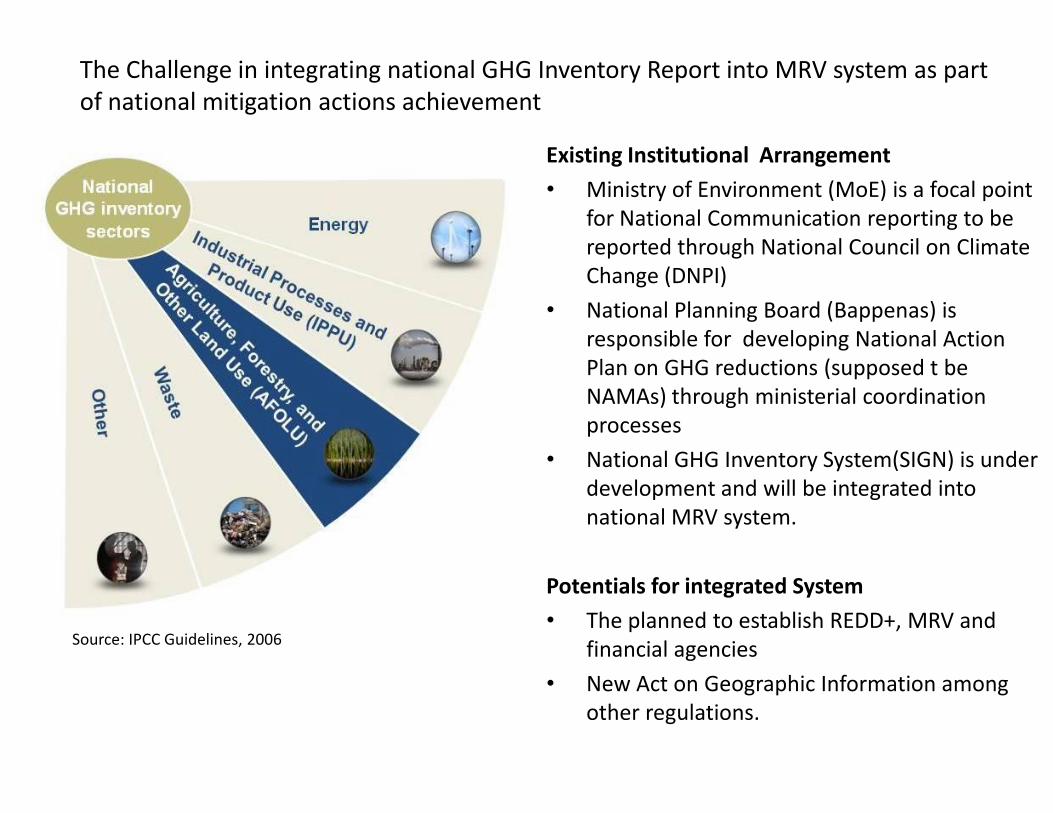
The Challenge in integrating national GHG Inventory Report into MRV system as part of national mitigation actions achievement
Source: IPCC Guidelines, 2006
Existing Institutional Arrangement
• Ministry of Environment (MoE) is a focal point for National Communication reporting to be reported through National Council on Climate Change (DNPI)
• National Planning Board (Bappenas) is responsible for developing National Action Plan on GHG reductions (supposed t be NAMAs) through ministerial coordination processes
• National GHG Inventory System(SIGN) is under development and will be integrated into national MRV system.
Potentials for integrated System
• The planned to establish REDD+, MRV and financial agencies
• New Act on Geographic Information among other regulations.
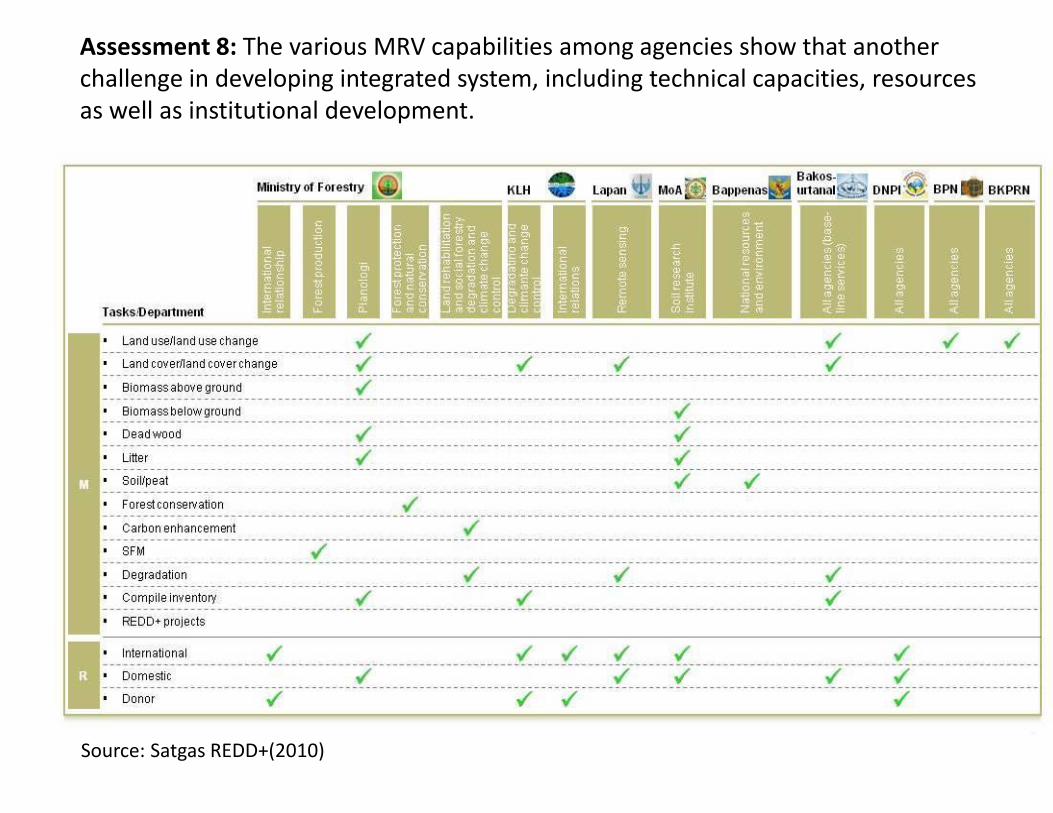
Assessment 8: The various MRV capabilities among agencies show that another challenge in developing integrated system, including technical capacities, resources as well as institutional development.
Source: Satgas REDD+(2010)
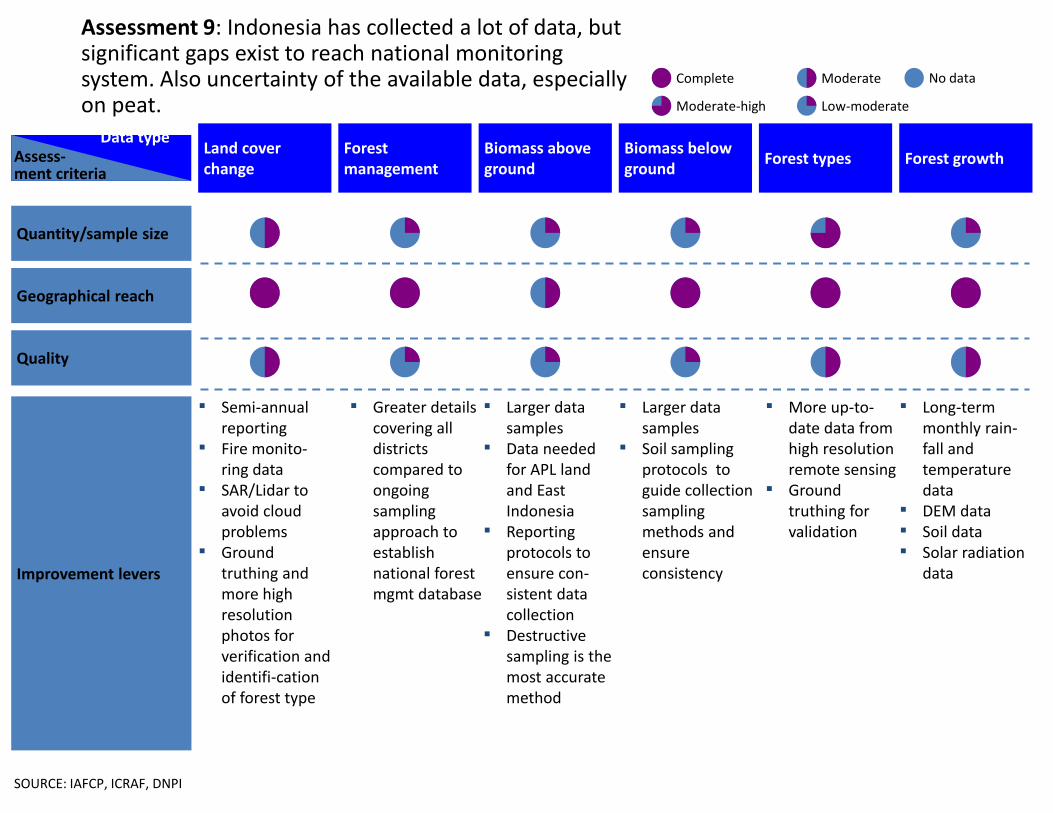
Assessment 9: Indonesia has collected a lot of data, but significant gaps exist to reach national monitoring system. Also uncertainty of the available data, especially on peat.
SOURCE: IAFCP, ICRAF, DNPI
No data
Low-moderate
Moderate
Moderate-high
Complete
Data type Assess- ment criteria
Forest growth Forest types Biomass below ground
Forest management
Land cover change
Biomass above ground
Improvement levers
▪ Semi-annual reporting
▪ Fire monito-ring data
▪ SAR/Lidar to avoid cloud problems
▪ Ground truthing and more high resolution photos for verification and identifi-cation of forest type
▪ Larger data samples
▪ Data needed for APL land and East Indonesia
▪ Reporting protocols to ensure con-sistent data collection
▪ Destructive sampling is the most accurate method
▪ Larger data samples
▪ Soil sampling protocols to guide collection sampling methods and ensure consistency
▪ Long-term monthly rain-fall and temperature data
▪ DEM data ▪ Soil data ▪ Solar radiation
data
Quantity/sample size
Quality
Geographical reach
▪ Greater details covering all districts compared to ongoing sampling approach to establish national forest mgmt database
▪ More up-to-date data from high resolution remote sensing
▪ Ground truthing for validation
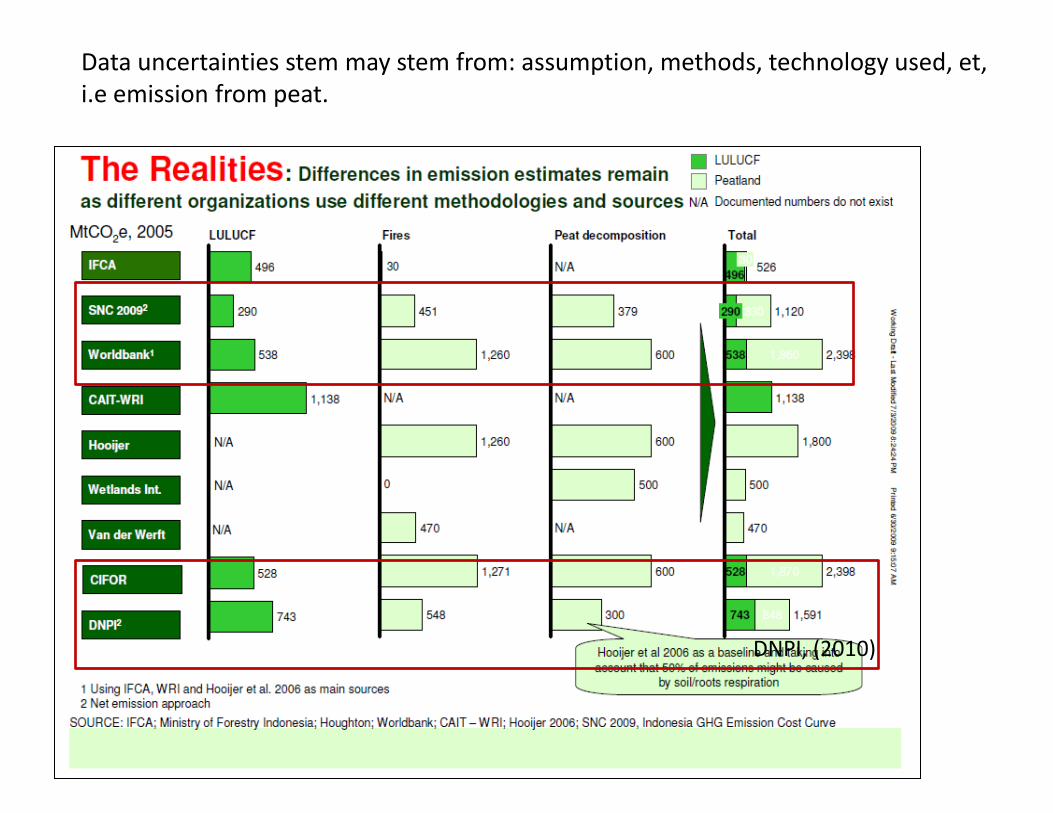
Data uncertainties stem may stem from: assumption, methods, technology used, et, i.e emission from peat.
DNPI, (2010)
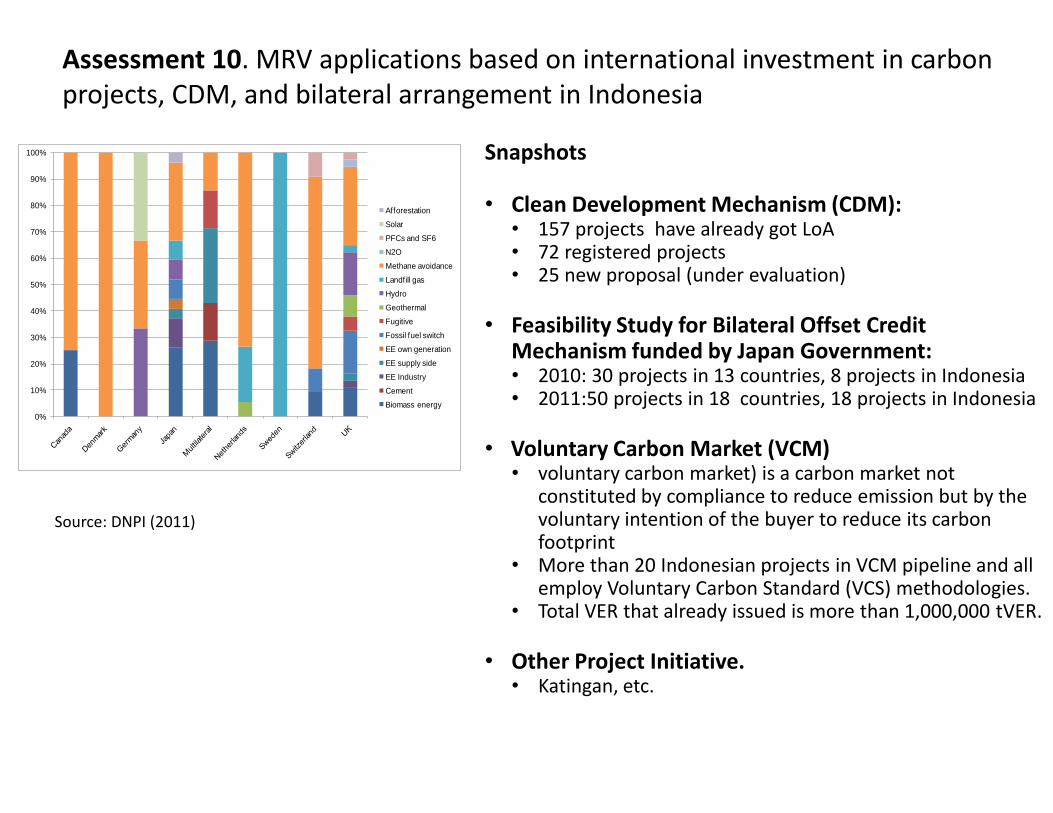
Assessment 10. MRV applications based on international investment in carbon projects, CDM, and bilateral arrangement in Indonesia
Source: DNPI (2011)
Snapshots • Clean Development Mechanism (CDM):
• 157 projects have already got LoA • 72 registered projects • 25 new proposal (under evaluation)
• Feasibility Study for Bilateral Offset Credit
Mechanism funded by Japan Government: • 2010: 30 projects in 13 countries, 8 projects in Indonesia • 2011:50 projects in 18 countries, 18 projects in Indonesia
• Voluntary Carbon Market (VCM) • voluntary carbon market) is a carbon market not
constituted by compliance to reduce emission but by the voluntary intention of the buyer to reduce its carbon footprint
• More than 20 Indonesian projects in VCM pipeline and all employ Voluntary Carbon Standard (VCS) methodologies.
• Total VER that already issued is more than 1,000,000 tVER. • Other Project Initiative.
• Katingan, etc.
0%
10%
20%
30%
40%
50%
60%
70%
80%
90%
100%
Afforestation
Solar
PFCs and SF6
N2O
Methane avoidance
Landfill gas
Hydro
Geothermal
Fugitive
Fossil fuel switch
EE own generation
EE supply side
EE Industry
Cement
Biomass energy
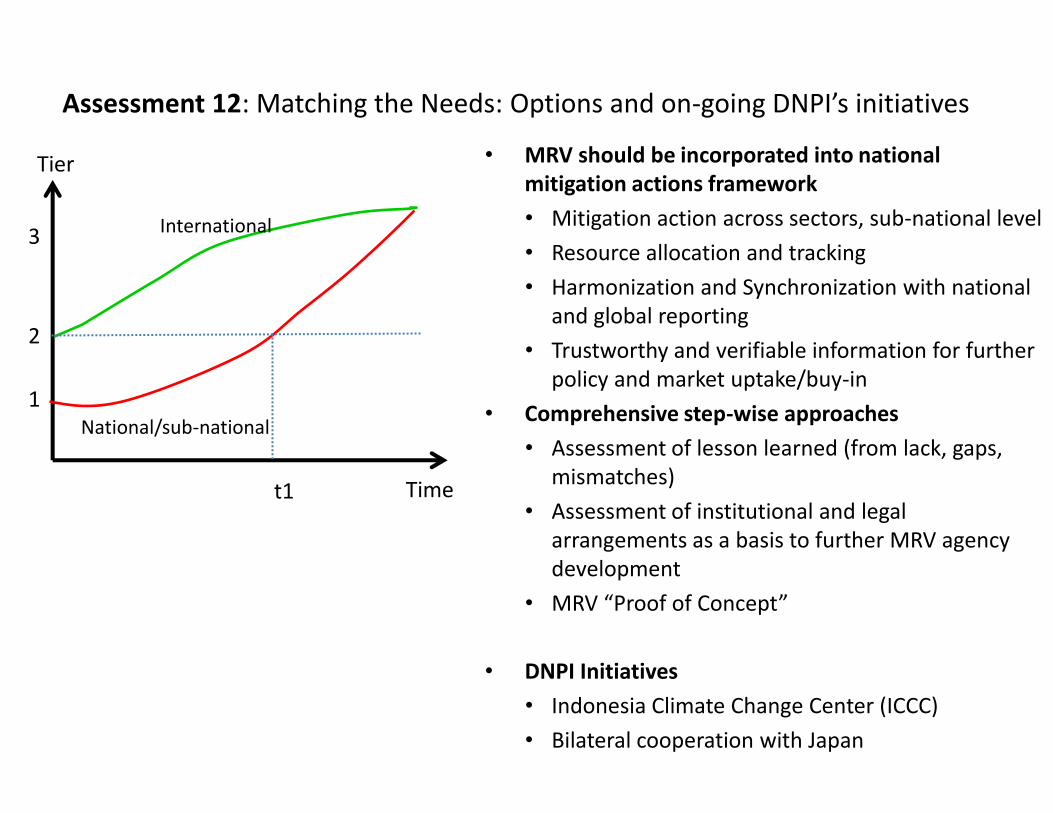
Assessment 12: Matching the Needs: Options and on-going DNPI’s initiatives
• MRV should be incorporated into national mitigation actions framework
• Mitigation action across sectors, sub-national level
• Resource allocation and tracking
• Harmonization and Synchronization with national and global reporting
• Trustworthy and verifiable information for further policy and market uptake/buy-in
• Comprehensive step-wise approaches
• Assessment of lesson learned (from lack, gaps, mismatches)
• Assessment of institutional and legal arrangements as a basis to further MRV agency development
• MRV “Proof of Concept”
• DNPI Initiatives
• Indonesia Climate Change Center (ICCC)
• Bilateral cooperation with Japan
Tier
1
2
3
Time t1
International
National/sub-national
17
Outline
• Climate Change Policy: International Context and National Response
• Low Carbon Initiatives and Exercises: Lesson Learnt from the Ground
• Institutional Dynamics
• DNPI Initiatives
• Show Case: Eat Kalimantan Low Carbon Strategies
18
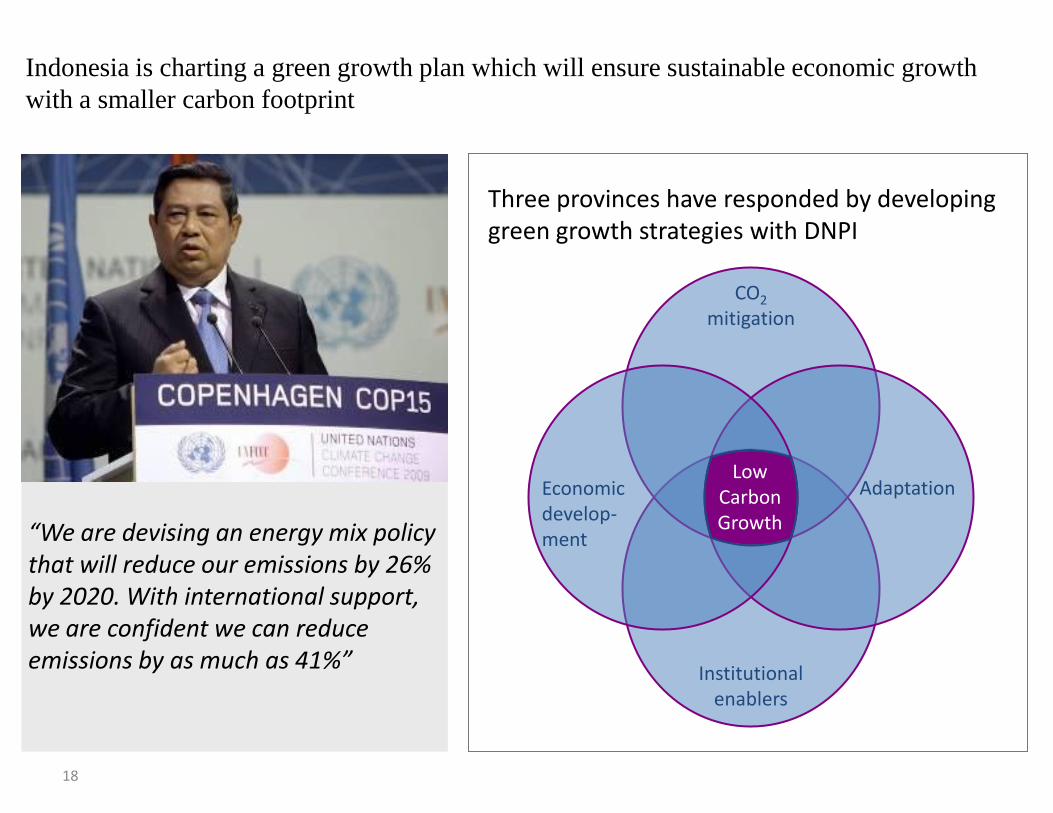
Indonesia is charting a green growth plan which will ensure sustainable economic growth
with a smaller carbon footprint
Three provinces have responded by developing green growth strategies with DNPI
“We are devising an energy mix policy that will reduce our emissions by 26% by 2020. With international support, we are confident we can reduce emissions by as much as 41%”
CO2
mitigation
Adaptation Economic develop- ment
Institutional enablers
Low Carbon Growth
19
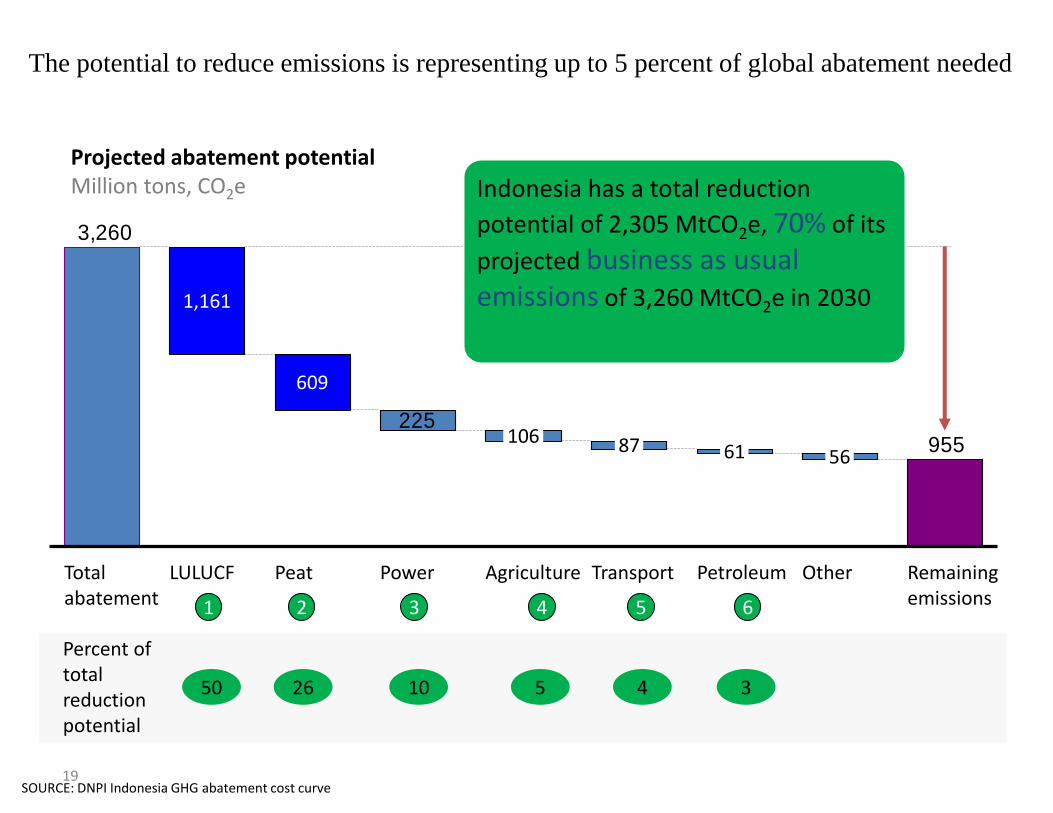
The potential to reduce emissions is representing up to 5 percent of global abatement needed
955225
3,260
Remaining emissions
Other Agriculture
106
Power Peat
56
Petroleum
61
Transport
87
609
LULUCF
1,161
Total abatement
Percent of total reduction potential
1 2 3 4 5
SOURCE: DNPI Indonesia GHG abatement cost curve
50 26 10 5 4 3
6
Projected abatement potential Million tons, CO2e Indonesia has a total reduction
potential of 2,305 MtCO2e, 70% of its
projected business as usual emissions of 3,260 MtCO2e in 2030
20
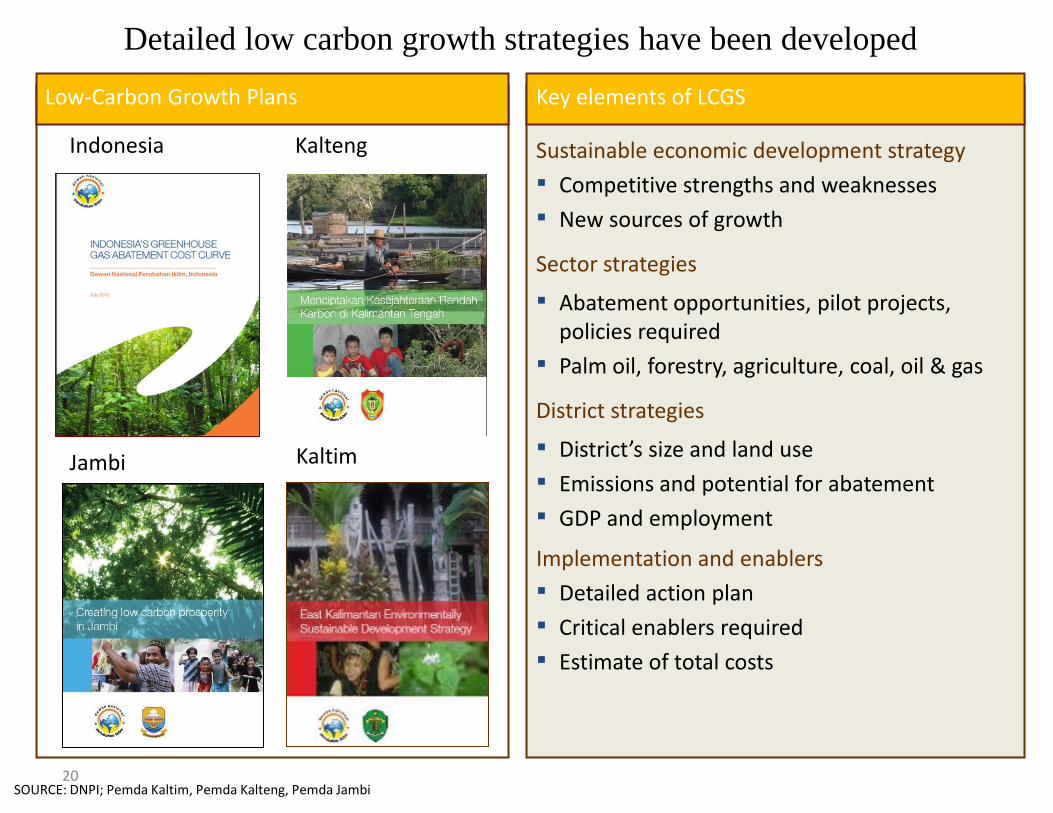
Detailed low carbon growth strategies have been developed
SOURCE: DNPI; Pemda Kaltim, Pemda Kalteng, Pemda Jambi
Low-Carbon Growth Plans
Sustainable economic development strategy
▪ Competitive strengths and weaknesses
▪ New sources of growth
Sector strategies
▪ Abatement opportunities, pilot projects, policies required
▪ Palm oil, forestry, agriculture, coal, oil & gas
District strategies
▪ District’s size and land use
▪ Emissions and potential for abatement
▪ GDP and employment
Implementation and enablers
▪ Detailed action plan
▪ Critical enablers required
▪ Estimate of total costs
Key elements of LCGS
Kalteng
Kaltim Jambi
Indonesia
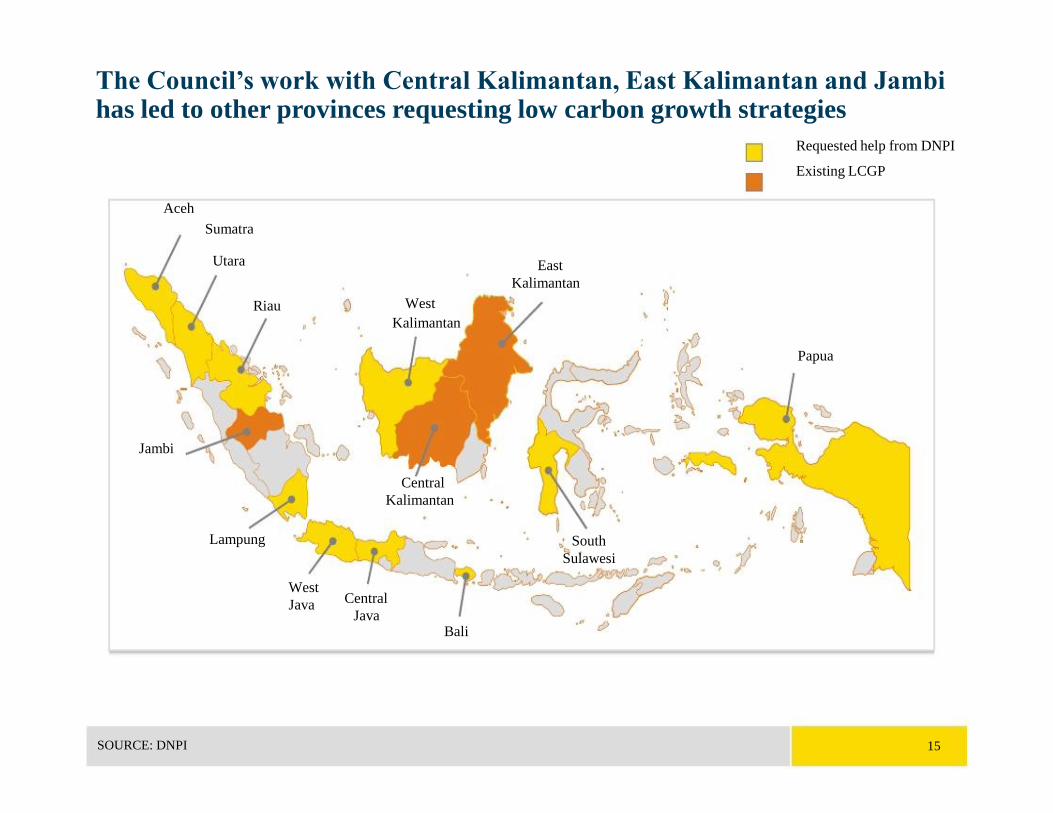
15 SOURCE: DNPI
The Council’s work with Central Kalimantan, East Kalimantan and Jambi has led to other provinces requesting low carbon growth strategies Requested help from DNPI
Existing LCGP
Aceh
Sumatra
Utara
Riau
East
Kalimantan
West
South
Sulawesi
Lampung
West
Java Central
Java Bali
Kalimantan
Papua
Jambi
Central
Kalimantan
Communities
Experts, resources
Policy makers
C C
= interface?
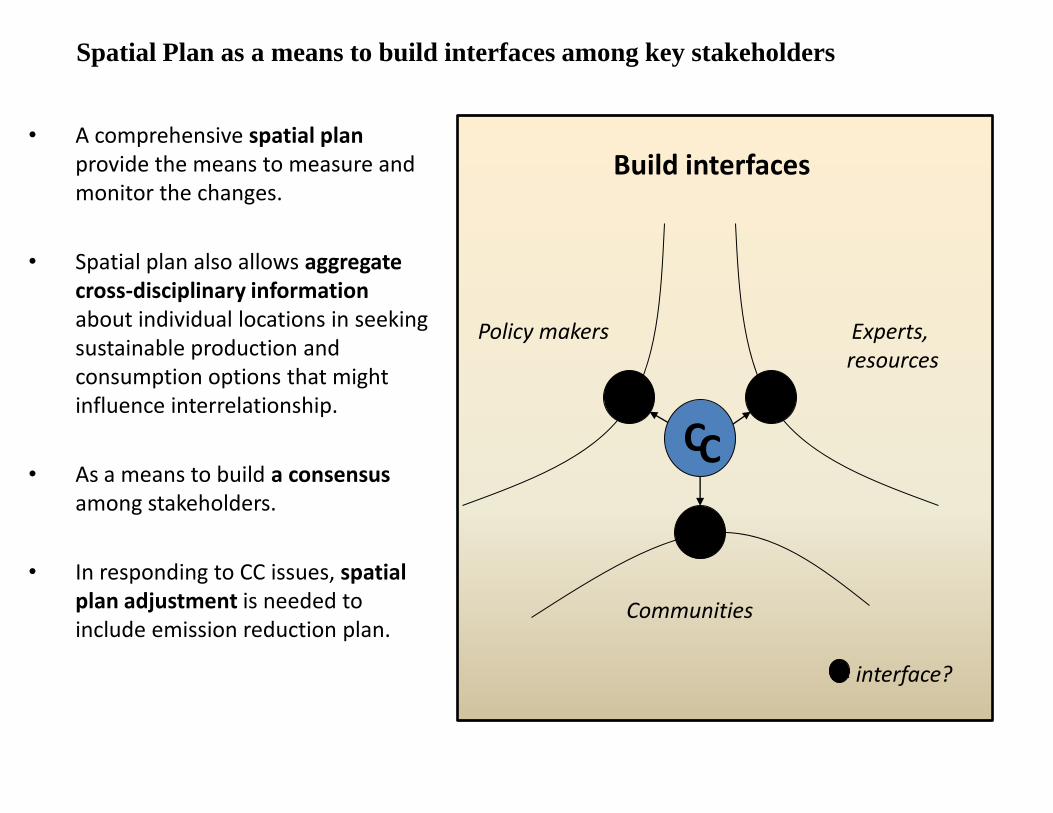
Build interfaces • A comprehensive spatial plan
provide the means to measure and monitor the changes.
• Spatial plan also allows aggregate cross-disciplinary information about individual locations in seeking sustainable production and consumption options that might influence interrelationship.
• As a means to build a consensus among stakeholders.
• In responding to CC issues, spatial plan adjustment is needed to include emission reduction plan.
Spatial Plan as a means to build interfaces among key stakeholders
23
Outline
• Climate Change Policy: International Context and National Response
• Low Carbon Initiatives and Exercises: Lesson Learnt from the Ground
• Institutional Dynamics
• DNPI Initiatives
• Show Case: Eat Kalimantan Low Carbon Strategies
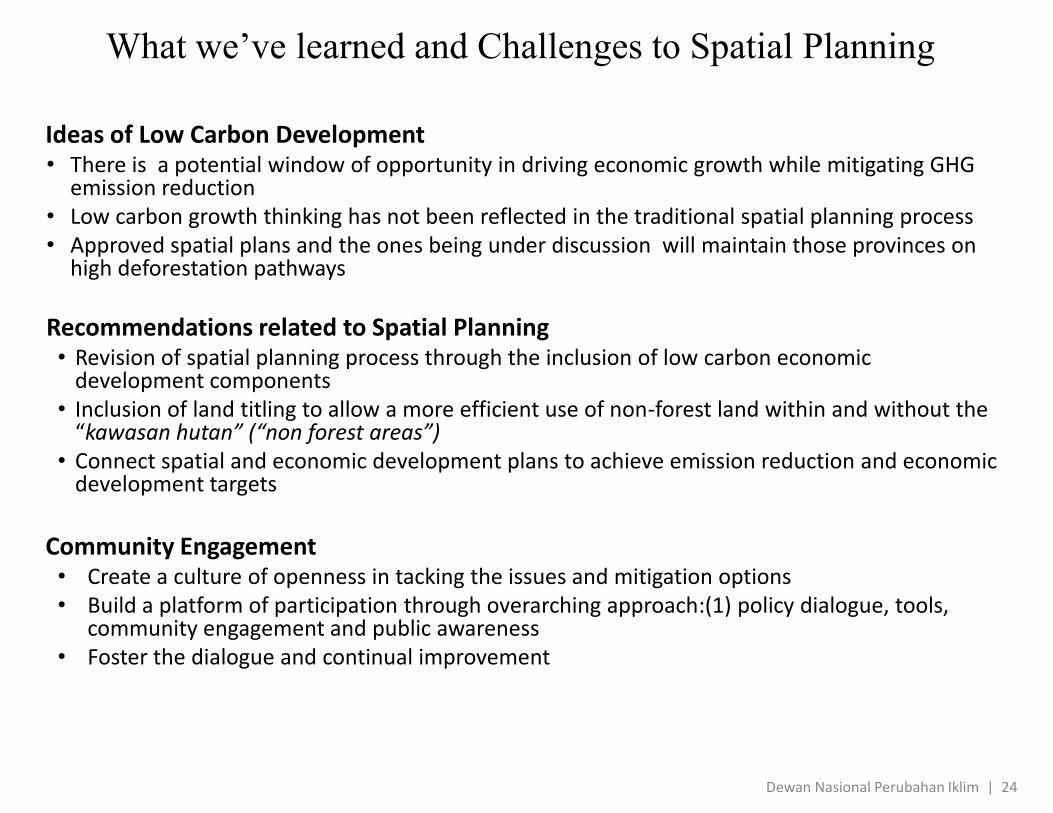
What we‟ve learned and Challenges to Spatial Planning
Ideas of Low Carbon Development • There is a potential window of opportunity in driving economic growth while mitigating GHG
emission reduction • Low carbon growth thinking has not been reflected in the traditional spatial planning process • Approved spatial plans and the ones being under discussion will maintain those provinces on
high deforestation pathways
Recommendations related to Spatial Planning • Revision of spatial planning process through the inclusion of low carbon economic
development components • Inclusion of land titling to allow a more efficient use of non-forest land within and without the
“kawasan hutan” (“non forest areas”) • Connect spatial and economic development plans to achieve emission reduction and economic
development targets
Community Engagement
• Create a culture of openness in tacking the issues and mitigation options • Build a platform of participation through overarching approach:(1) policy dialogue, tools,
community engagement and public awareness • Foster the dialogue and continual improvement
Dewan Nasional Perubahan Iklim | 24
25
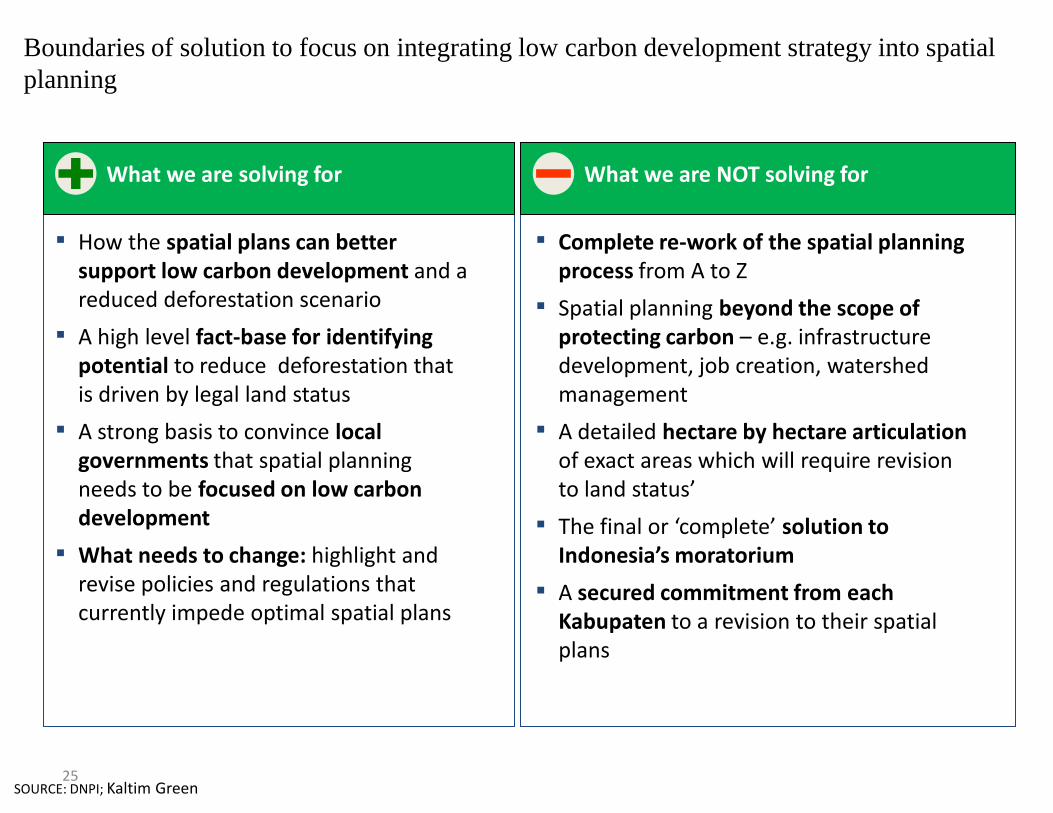
Boundaries of solution to focus on integrating low carbon development strategy into spatial
planning
SOURCE: DNPI; Kaltim Green
What we are solving for
▪ How the spatial plans can better support low carbon development and a reduced deforestation scenario
▪ A high level fact-base for identifying potential to reduce deforestation that is driven by legal land status
▪ A strong basis to convince local governments that spatial planning needs to be focused on low carbon development
▪ What needs to change: highlight and revise policies and regulations that currently impede optimal spatial plans
What we are NOT solving for
▪ Complete re-work of the spatial planning process from A to Z
▪ Spatial planning beyond the scope of protecting carbon – e.g. infrastructure development, job creation, watershed management
▪ A detailed hectare by hectare articulation of exact areas which will require revision to land status’
▪ The final or ‘complete’ solution to Indonesia’s moratorium
▪ A secured commitment from each Kabupaten to a revision to their spatial plans
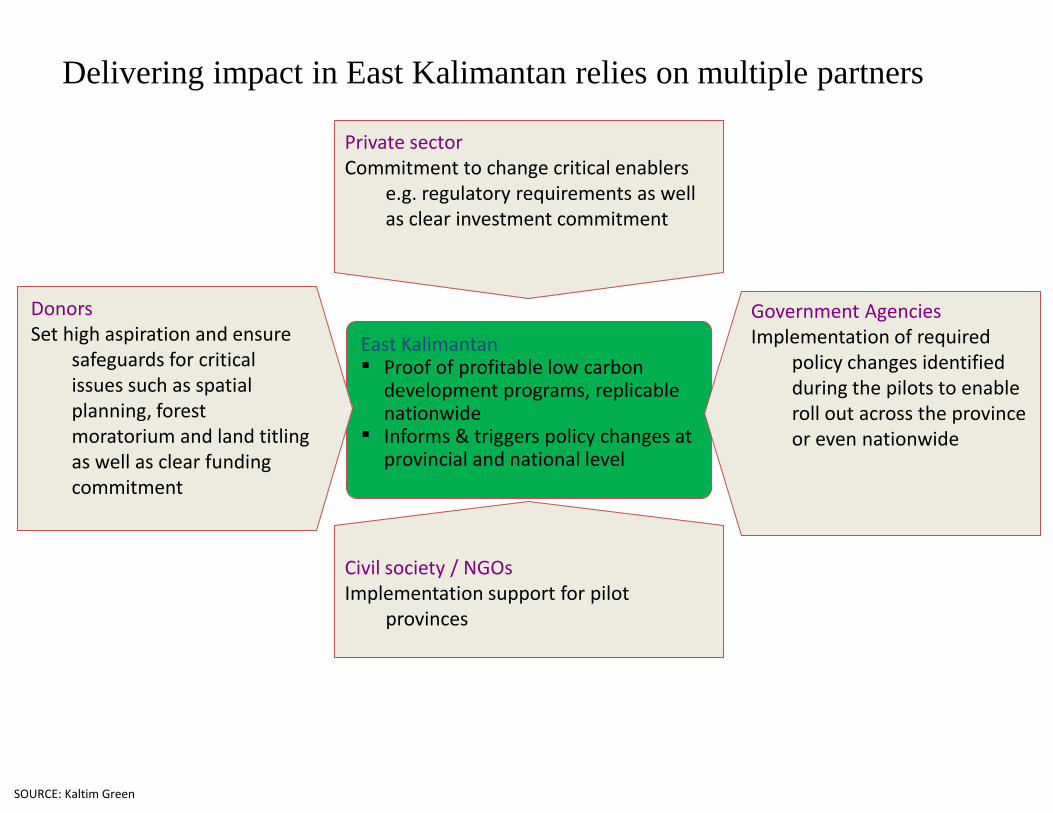
Delivering impact in East Kalimantan relies on multiple partners
Donors Set high aspiration and ensure
safeguards for critical issues such as spatial planning, forest moratorium and land titling as well as clear funding commitment
Civil society / NGOs Implementation support for pilot
provinces
Government Agencies Implementation of required
policy changes identified during the pilots to enable roll out across the province or even nationwide
East Kalimantan ▪ Proof of profitable low carbon
development programs, replicable nationwide
▪ Informs & triggers policy changes at provincial and national level
Private sector Commitment to change critical enablers
e.g. regulatory requirements as well as clear investment commitment
SOURCE: Kaltim Green
27
Outline
• Climate Change Policy: International Context and National Response
• Low Carbon Initiatives and Exercises: Lesson Learnt from the Ground
• Institutional Dynamics
• DNPI Initiatives
• Show Case: Eat Kalimantan Low Carbon Strategies
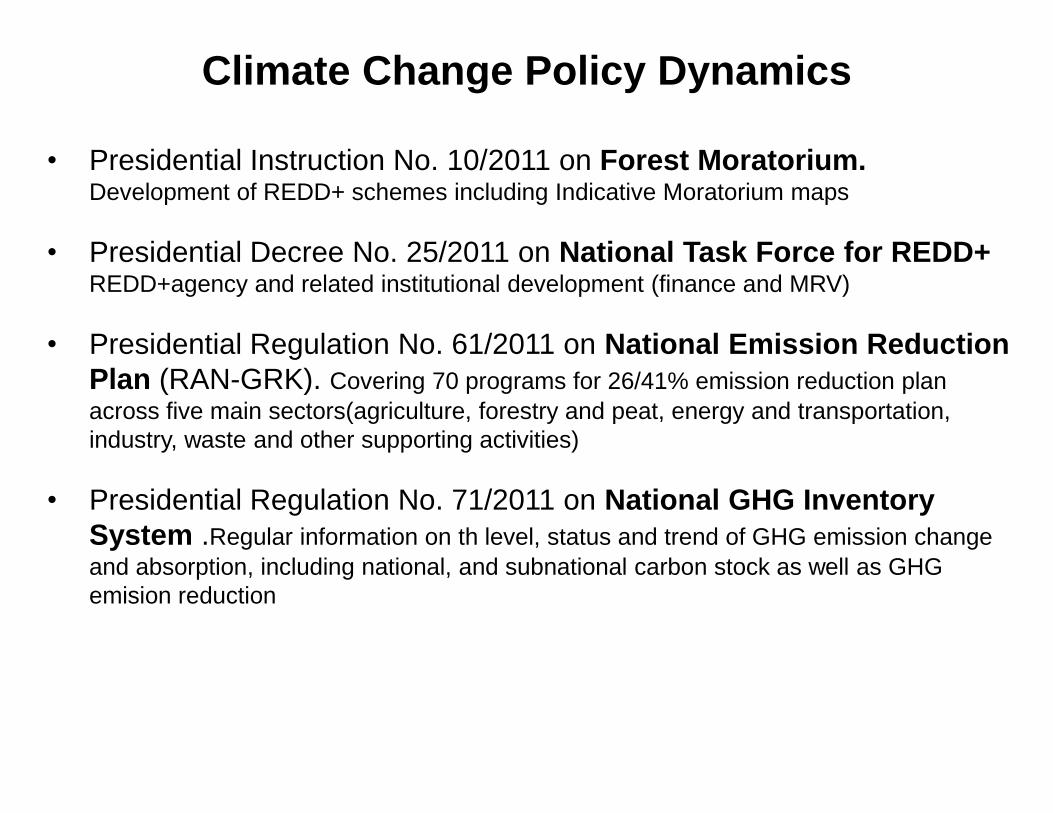
• Presidential Instruction No. 10/2011 on Forest Moratorium. Development of REDD+ schemes including Indicative Moratorium maps
• Presidential Decree No. 25/2011 on National Task Force for REDD+ REDD+agency and related institutional development (finance and MRV)
• Presidential Regulation No. 61/2011 on National Emission Reduction
Plan (RAN-GRK). Covering 70 programs for 26/41% emission reduction plan
across five main sectors(agriculture, forestry and peat, energy and transportation,
industry, waste and other supporting activities)
• Presidential Regulation No. 71/2011 on National GHG Inventory
System .Regular information on th level, status and trend of GHG emission change
and absorption, including national, and subnational carbon stock as well as GHG
emision reduction
Climate Change Policy Dynamics
Some Questions to be answered
• How are policies and strategies related to low carbon economy integrated
between the local, provincial and national levels? How is this integration also carried out among different priority themes, such as agriculture, development, environment, etc?
• What kinds of technologies and technology management systems can be adopted
to provide alternative livelihoods and income streams for the local communities in order for them to generate income beyond subsistence levels?
• How can a fair financing and incentive structure be developed that can address
the needs of the key stakeholders at the local level? • In order to address the problems related to low carbon economy, what kinds of
institutional arrangements be put in place in order to achieve collective/consensus goals by ensuring community engagement and dialogue?
Challenges: A robust foundation?
• (a) the existing data gaps, (b) a common/agreed understanding of the definitions and concepts that are being used, (c) setting the goals of land use and land use change (d) creating a baseline/reference point against which future action can be planned and progress measured.
31
Outline
• Climate Change Policy: International Context and National Response
• Low Carbon Initiatives and Exercises: Lesson Learnt from the Ground
• Institutional Dynamics
• DNPI Initiatives
• Show Case: Eat Kalimantan Low Carbon Strategies
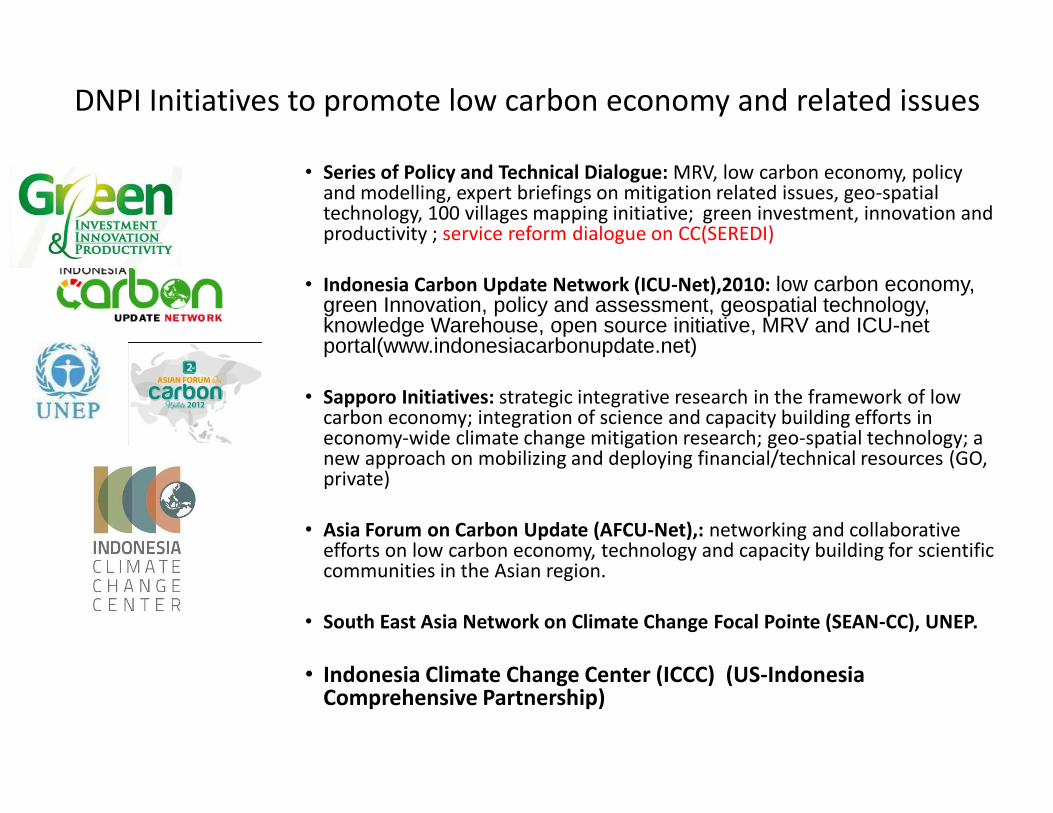
DNPI Initiatives to promote low carbon economy and related issues
• Series of Policy and Technical Dialogue: MRV, low carbon economy, policy and modelling, expert briefings on mitigation related issues, geo-spatial technology, 100 villages mapping initiative; green investment, innovation and productivity ; service reform dialogue on CC(SEREDI)
• Indonesia Carbon Update Network (ICU-Net),2010: low carbon economy, green Innovation, policy and assessment, geospatial technology, knowledge Warehouse, open source initiative, MRV and ICU-net portal(www.indonesiacarbonupdate.net)
• Sapporo Initiatives: strategic integrative research in the framework of low
carbon economy; integration of science and capacity building efforts in economy-wide climate change mitigation research; geo-spatial technology; a new approach on mobilizing and deploying financial/technical resources (GO, private)
• Asia Forum on Carbon Update (AFCU-Net),: networking and collaborative
efforts on low carbon economy, technology and capacity building for scientific communities in the Asian region.
• South East Asia Network on Climate Change Focal Pointe (SEAN-CC), UNEP.
• Indonesia Climate Change Center (ICCC) (US-Indonesia Comprehensive Partnership)
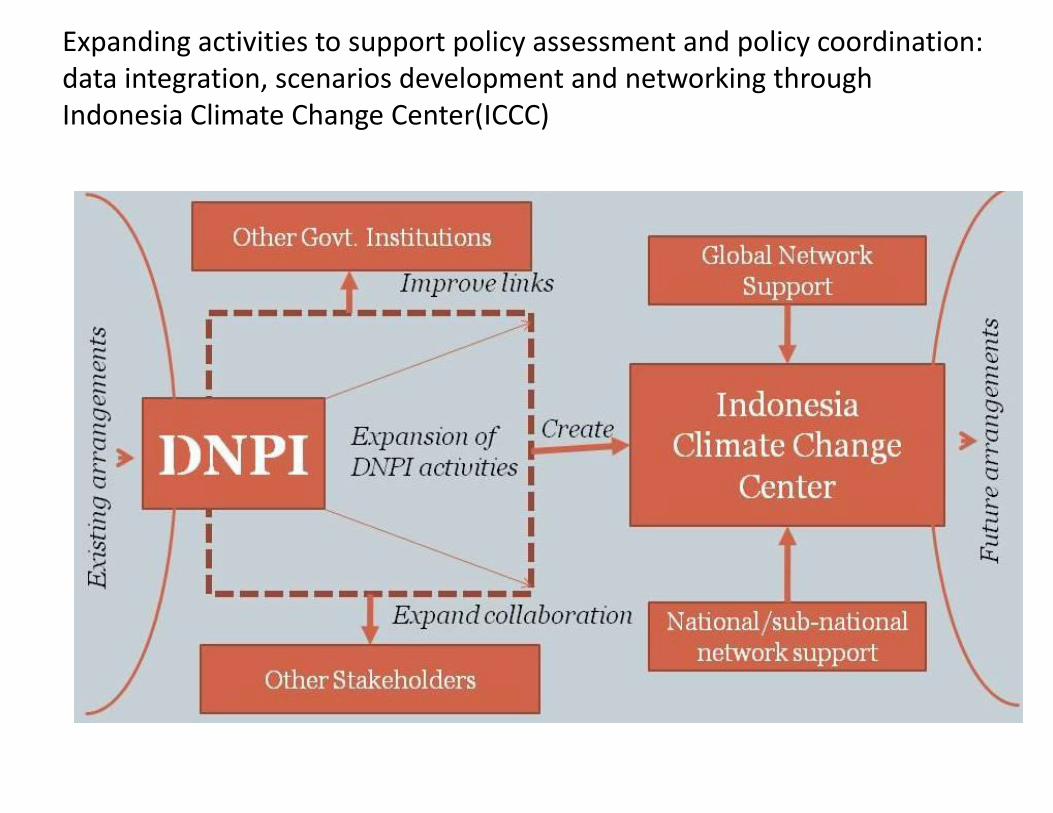
Expanding activities to support policy assessment and policy coordination: data integration, scenarios development and networking through Indonesia Climate Change Center(ICCC)
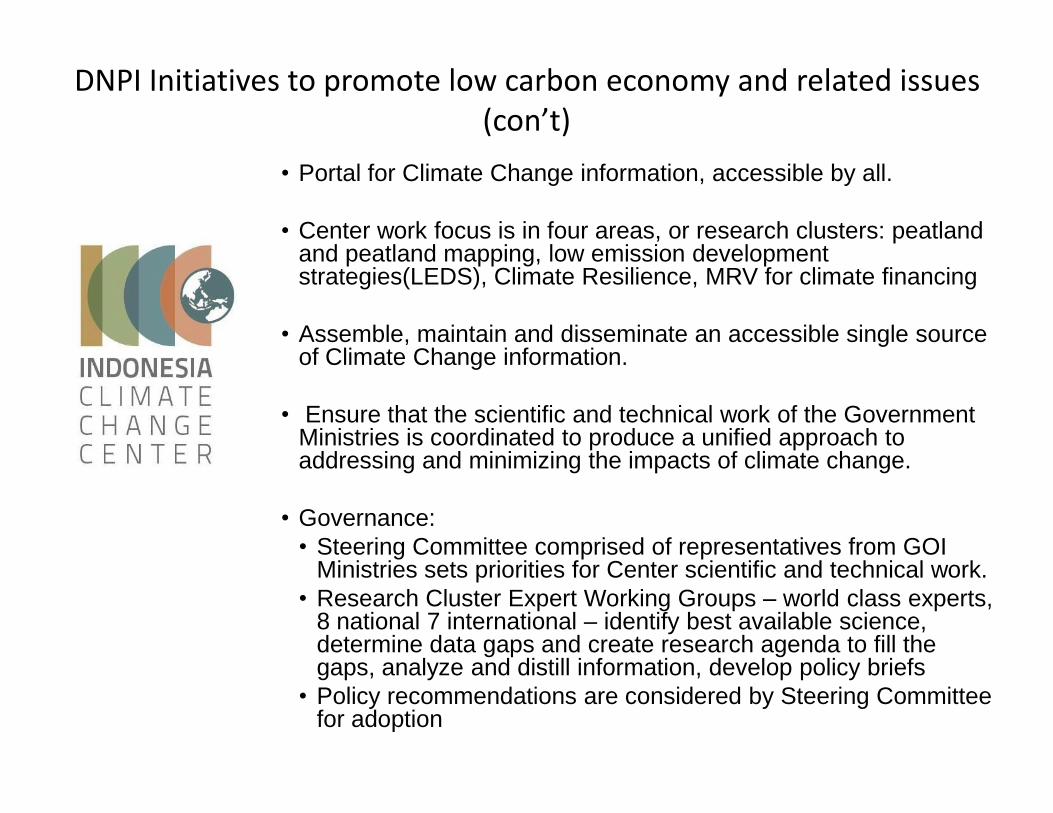
DNPI Initiatives to promote low carbon economy and related issues (con’t)
• Portal for Climate Change information, accessible by all.
• Center work focus is in four areas, or research clusters: peatland and peatland mapping, low emission development strategies(LEDS), Climate Resilience, MRV for climate financing
• Assemble, maintain and disseminate an accessible single source of Climate Change information.
• Ensure that the scientific and technical work of the Government Ministries is coordinated to produce a unified approach to addressing and minimizing the impacts of climate change.
• Governance:
• Steering Committee comprised of representatives from GOI Ministries sets priorities for Center scientific and technical work.
• Research Cluster Expert Working Groups – world class experts, 8 national 7 international – identify best available science, determine data gaps and create research agenda to fill the gaps, analyze and distill information, develop policy briefs
• Policy recommendations are considered by Steering Committee for adoption
35
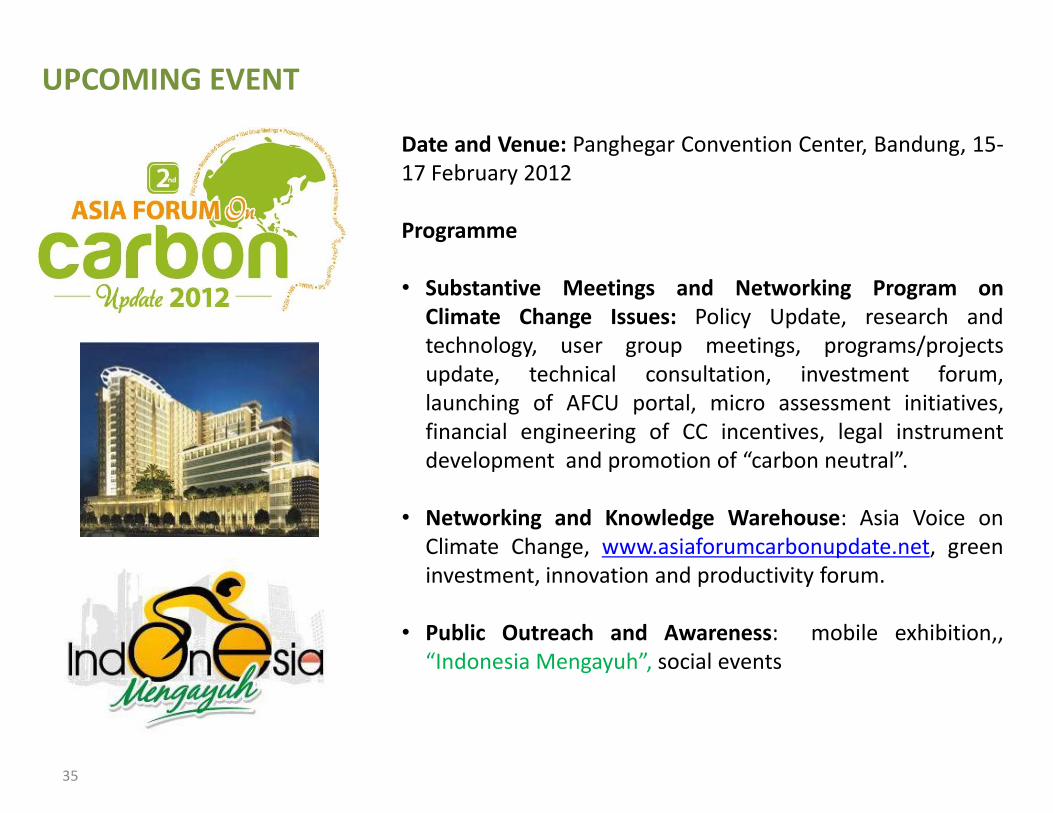
Date and Venue: Panghegar Convention Center, Bandung, 15-17 February 2012 Programme • Substantive Meetings and Networking Program on
Climate Change Issues: Policy Update, research and technology, user group meetings, programs/projects update, technical consultation, investment forum, launching of AFCU portal, micro assessment initiatives, financial engineering of CC incentives, legal instrument development and promotion of “carbon neutral”.
• Networking and Knowledge Warehouse: Asia Voice on Climate Change, www.asiaforumcarbonupdate.net, green investment, innovation and productivity forum.
• Public Outreach and Awareness: mobile exhibition,, “Indonesia Mengayuh”, social events
UPCOMING EVENT
36
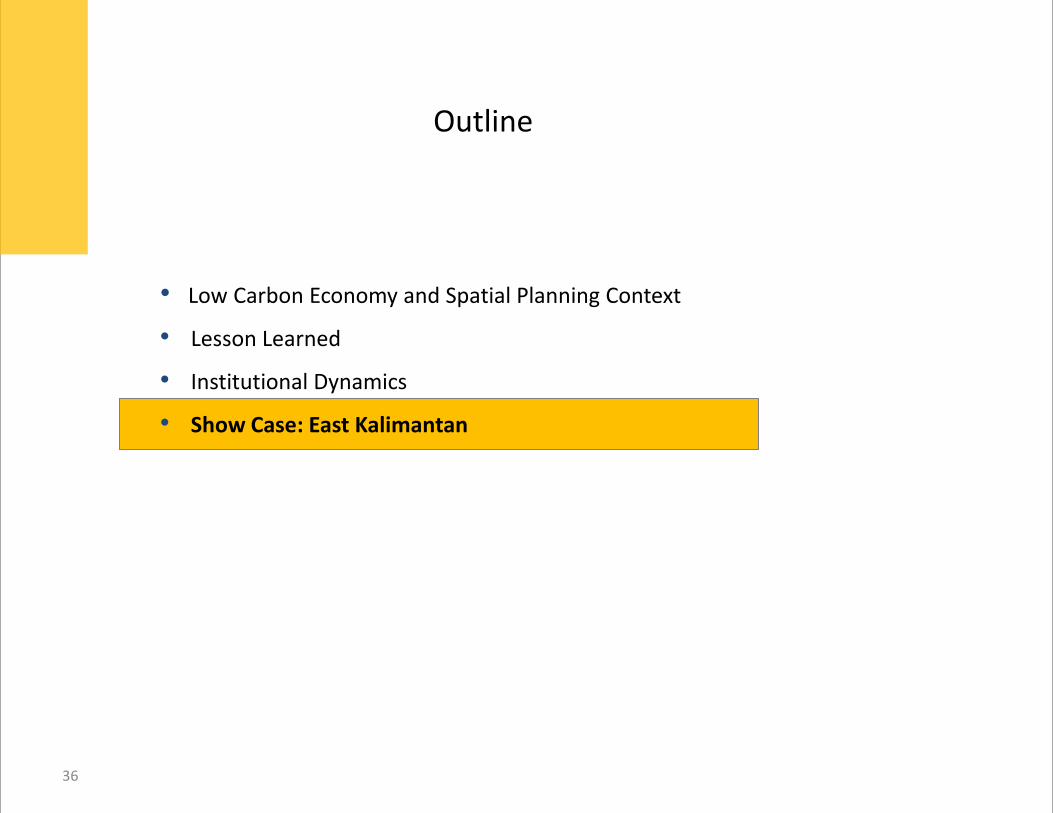
Outline
• Low Carbon Economy and Spatial Planning Context
• Lesson Learned
• Institutional Dynamics
• Show Case: East Kalimantan
Optimized land use for East
Kalimantan
Discussion document
January 2011
CONFIDENTIAL AND PROPRIETARY
Any use of this material without specific permission is strictly prohibited
Wo
rkin
g D
raft - Last M
odified
1/2
4/2
011 1
1:0
0:3
6 P
M P
rinted
1/2
5/2
011 1
2:4
7:3
2 A
M
DRAFT
78 SOURCE: ESRI, Ministry of Forestry – Rep. of Indonesia, Wetlands International; team analysis
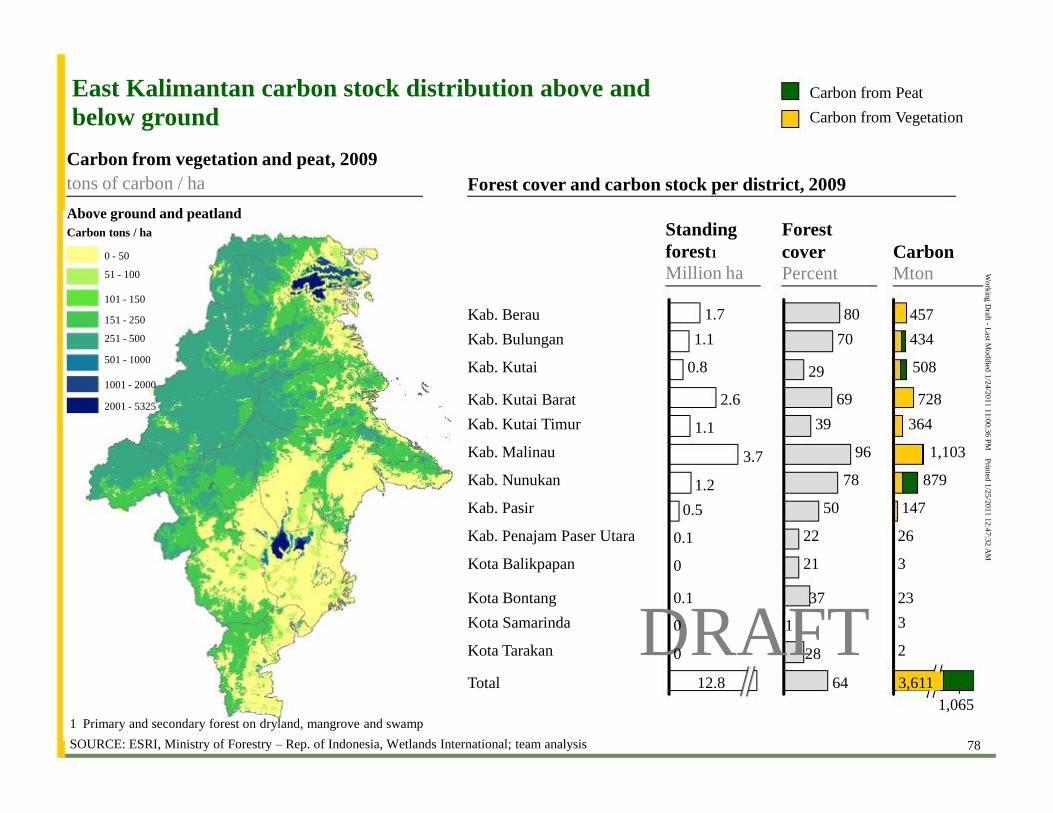
East Kalimantan carbon stock distribution above and
below ground Carbon from vegetation and peat, 2009
tons of carbon / ha Forest cover and carbon stock per district, 2009
Above ground and peatland
Carbon tons / ha
0 - 50
51 - 100
101 - 150
151 - 250
251 - 500
501 - 1000
1001 - 2000
2001 - 5325 69
39
96
78
50
22
21
29
80
70
64
457
434
508
3,611
23
3
2
728
364
1,103
879
147
26
3
Carbon from Peat
Carbon from Vegetation
Standing
forest1
Million ha Carbon
Mton
2.6 3.7
Kab. Berau
Kab. Bulungan
Kab. Kutai
1.1 1.2
0.5
0.1
0
0 1
0.1 37 0 28
Kota Bontang
Kota Samarinda
Kota Tarakan
1.7
1.1
0.8
Total
Kab. Kutai Barat
Kab. Kutai Timur
Kab. Malinau
Kab. Nunukan
Kab. Pasir
Kab. Penajam Paser Utara
Kota Balikpapan
12.8
Forest
cover
Percent
1,065 1 Primary and secondary forest on dryland, mangrove and swamp
Wo
rkin
g D
raft - Last M
odified
1/2
4/2
011 1
1:0
0:3
6 P
M P
rinted
1/2
5/2
011 1
2:4
7:3
2 A
M
place forest at risk
DRAFT
79
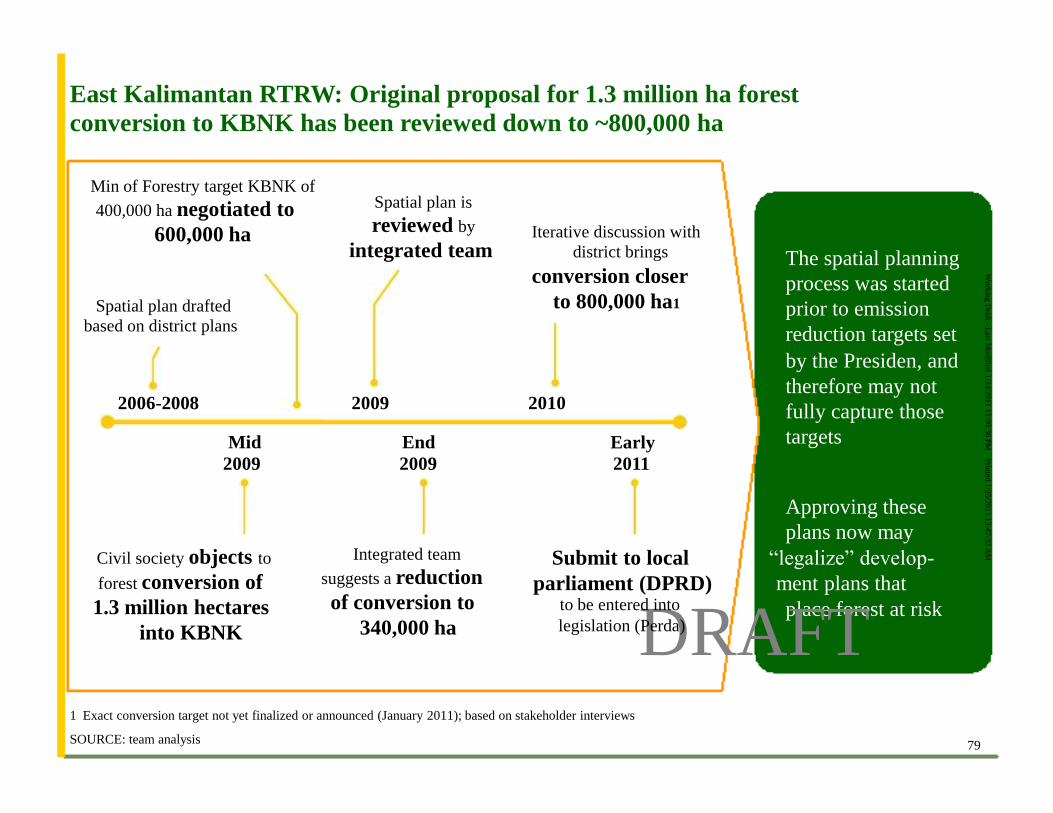
East Kalimantan RTRW: Original proposal for 1.3 million ha forest
conversion to KBNK has been reviewed down to ~800,000 ha
The spatial planning
process was started
prior to emission
reduction targets set
by the Presiden, and
therefore may not
fully capture those
targets
Approving these
plans now may
Civil society objects to
forest conversion of
1.3 million hectares
into KBNK
Integrated team
suggests a reduction
of conversion to
340,000 ha
Spatial plan is
reviewed by
integrated team
2006-2008
Mid
2009
2009
End
2009
2010
Iterative discussion with
district brings
conversion closer
to 800,000 ha1
Early
2011
Submit to local “legalize” develop-
parliament (DPRD) ment plans that to be entered into
legislation (Perda)
1 Exact conversion target not yet finalized or announced (January 2011); based on stakeholder interviews
SOURCE: team analysis
Min of Forestry target KBNK of
400,000 ha negotiated to
600,000 ha Spatial plan drafted
based on district plans
Wo
rkin
g D
raft - Last M
odified
1/2
4/2
011 1
1:0
0:3
6 P
M P
rinted
1/2
5/2
011 1
2:4
7:3
2 A
M
DRAFT
80
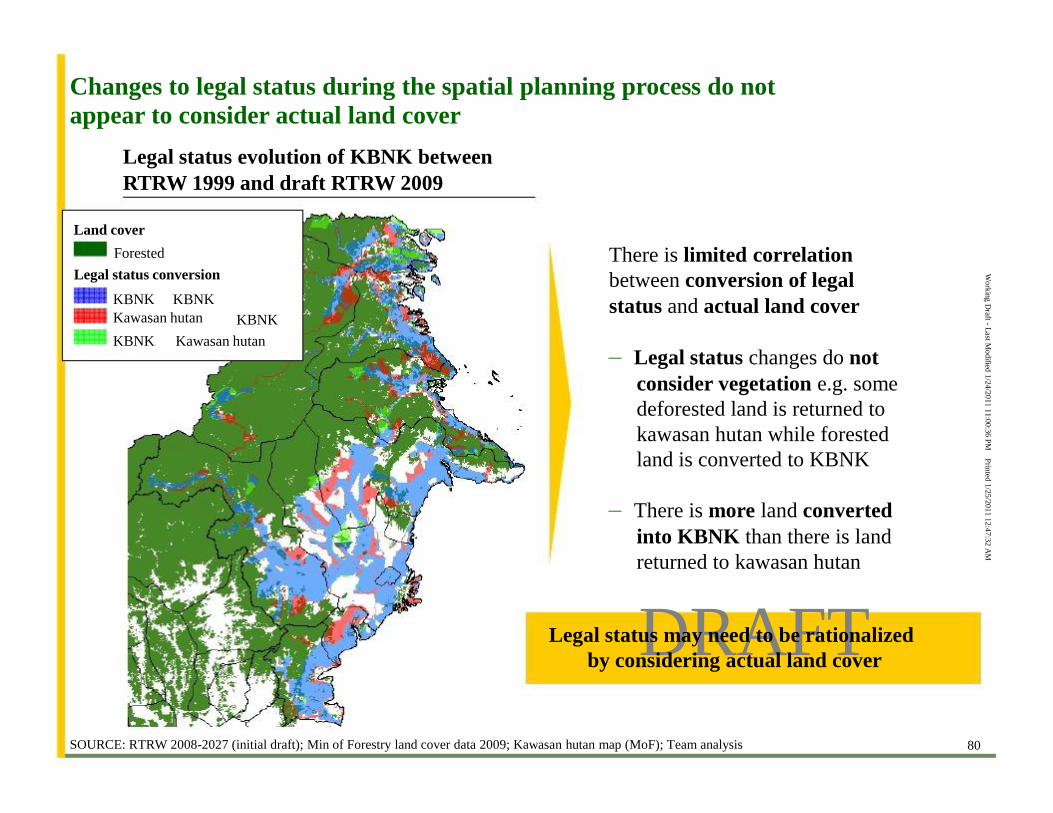
There is limited correlation
between conversion of legal
status and actual land cover
Forested
Legal status conversion
KBNK
KBNK KBNK
Kawasan hutan
KBNK Kawasan hutan
Changes to legal status during the spatial planning process do not
appear to consider actual land cover Legal status evolution of KBNK between
RTRW 1999 and draft RTRW 2009 Land cover
SOURCE: RTRW 2008-2027 (initial draft); Min of Forestry land cover data 2009; Kawasan hutan map (MoF); Team analysis
– Legal status changes do not
consider vegetation e.g. some
deforested land is returned to
kawasan hutan while forested
land is converted to KBNK – There is more land converted
into KBNK than there is land
returned to kawasan hutan Legal status may need to be rationalized
by considering actual land cover
Wo
rkin
g D
raft - Last M
odified
1/2
4/2
011 1
1:0
0:3
6 P
M P
rinted
1/2
5/2
011 1
2:4
7:3
2 A
M
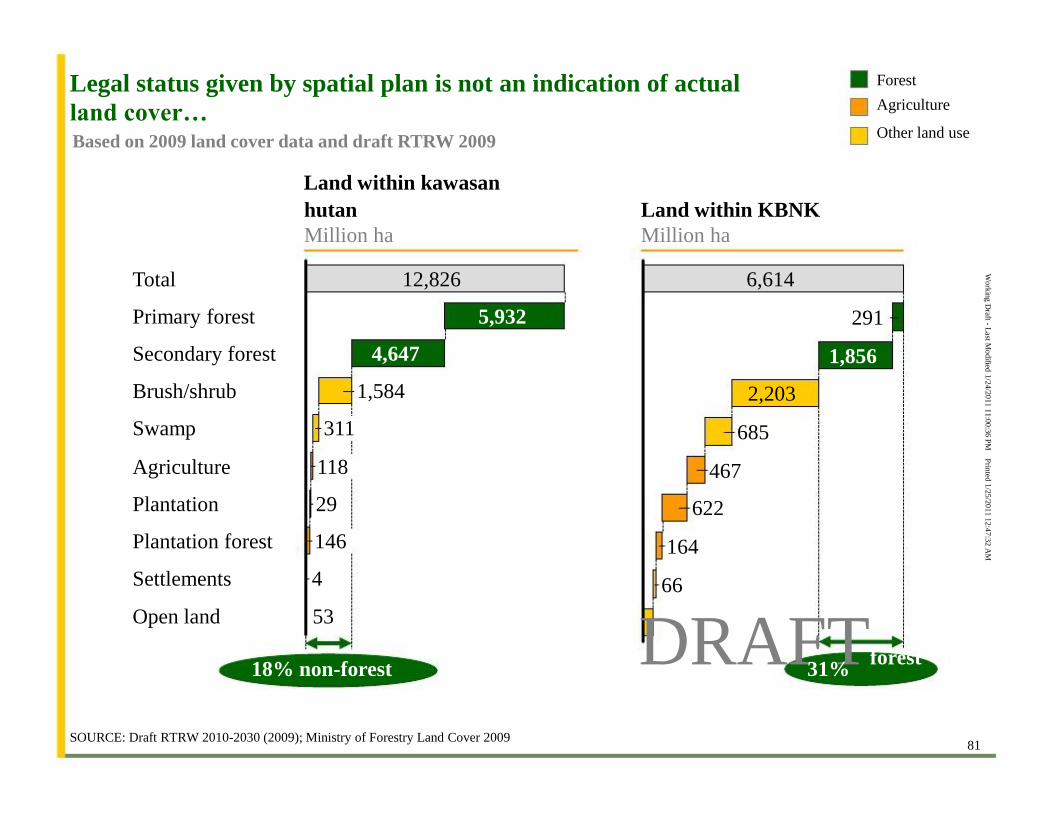
81
hutan
Million ha
Land within KBNK
Million ha
5,932
Open land
12,826 4,647 1,584 311 118 29 146 4
Total Primary forest Secondary forest Brush/shrub Swamp Agriculture Plantation Plantation forest Settlements
53
18% non-forest
SOURCE: Draft RTRW 2010-2030 (2009); Ministry of Forestry Land Cover 2009
Forest
Agriculture
Other land use
291 1,856
6,614 2,203 685 467 622 164 66
DRAFTforest 31%
Legal status given by spatial plan is not an indication of actual
land cover… Based on 2009 land cover data and draft RTRW 2009
Land within kawasan
Wo
rkin
g D
raft - Last M
odified
1/2
4/2
011 1
1:0
0:3
6 P
M P
rinted
1/2
5/2
011 1
2:4
7:3
2 A
M
DRAFT
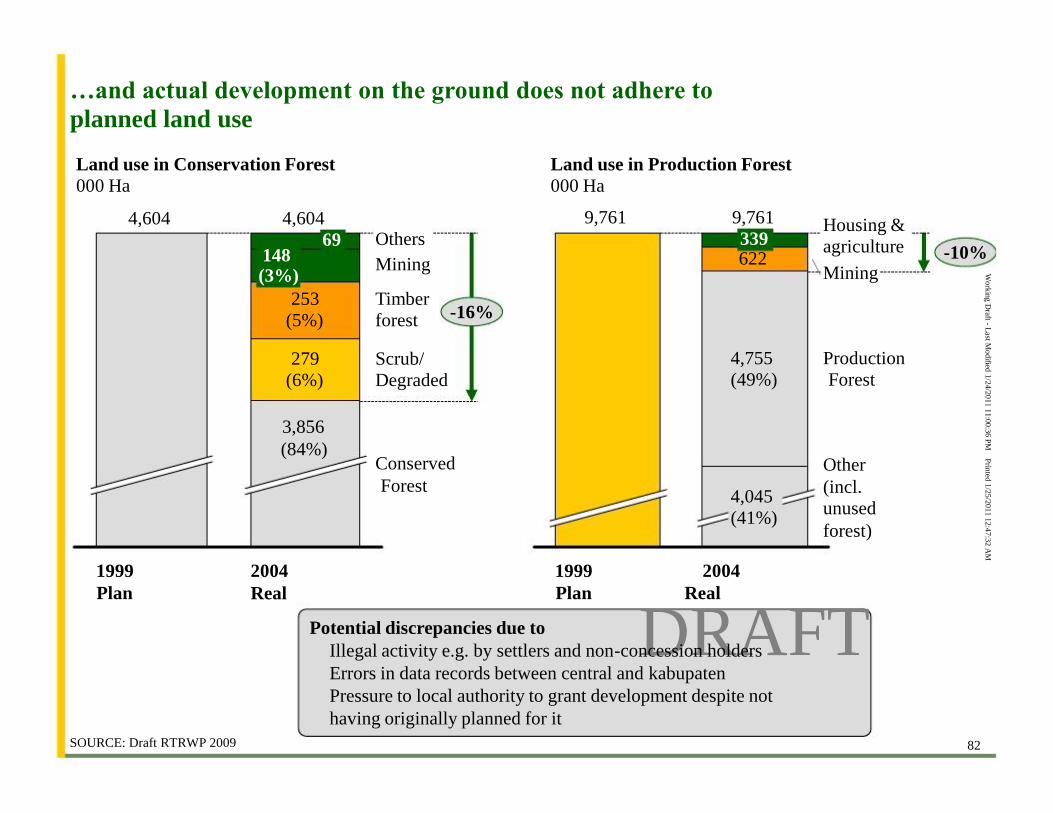
82
…and actual development on the ground does not adhere to
planned land use
Land use in Conservation Forest
000 Ha
Conserved
Forest
Scrub/
Degraded
Timber
forest
Others
Mining
2004
Real
3,856
(84%)
279
(6%)
253
(5%)
4,604
69 148 (3%)
1999
Plan SOURCE: Draft RTRWP 2009
4,604
-16%
Land use in Production Forest
000 Ha
Other
(incl.
unused
forest)
Production
Forest
Housing &
agriculture
Mining
2004
4,045
(41%)
4,755
(49%)
9,761
339 622
1999
9,761
-10%
Plan Real Potential discrepancies due to
Illegal activity e.g. by settlers and non-concession holders
Errors in data records between central and kabupaten
Pressure to local authority to grant development despite not
having originally planned for it
Wo
rkin
g D
raft - Last M
odified
1/2
4/2
011 1
1:0
0:3
6 P
M P
rinted
1/2
5/2
011 1
2:4
7:3
2 A
M
DRAFT
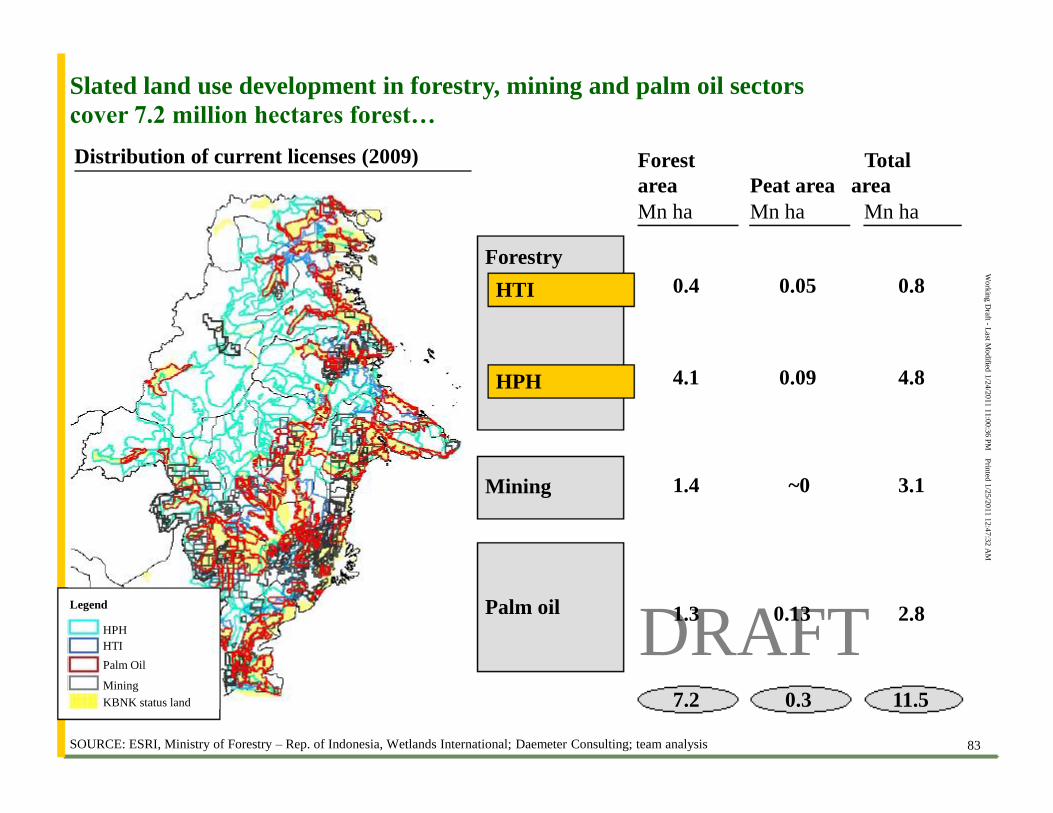
83
Slated land use development in forestry, mining and palm oil sectors
cover 7.2 million hectares forest…
Legend
HPH
HTI
Palm Oil
Mining
KBNK status land
Distribution of current licenses (2009)
SOURCE: ESRI, Ministry of Forestry – Rep. of Indonesia, Wetlands International; Daemeter Consulting; team analysis
Forestry
HTI HPH Mining
Palm oil
Mn ha
0.8 4.8
3.1
2.8
11.5
Forest
area
Mn ha
0.4 4.1
1.4
7.2
Total
Peat area area
Mn ha
0.05 0.09
~0
1.3 0.13
0.3
Wo
rkin
g D
raft - Last M
odified
1/2
4/2
011 1
1:0
0:3
6 P
M P
rinted
1/2
5/2
011 1
2:4
7:3
2 A
M
DRAFT
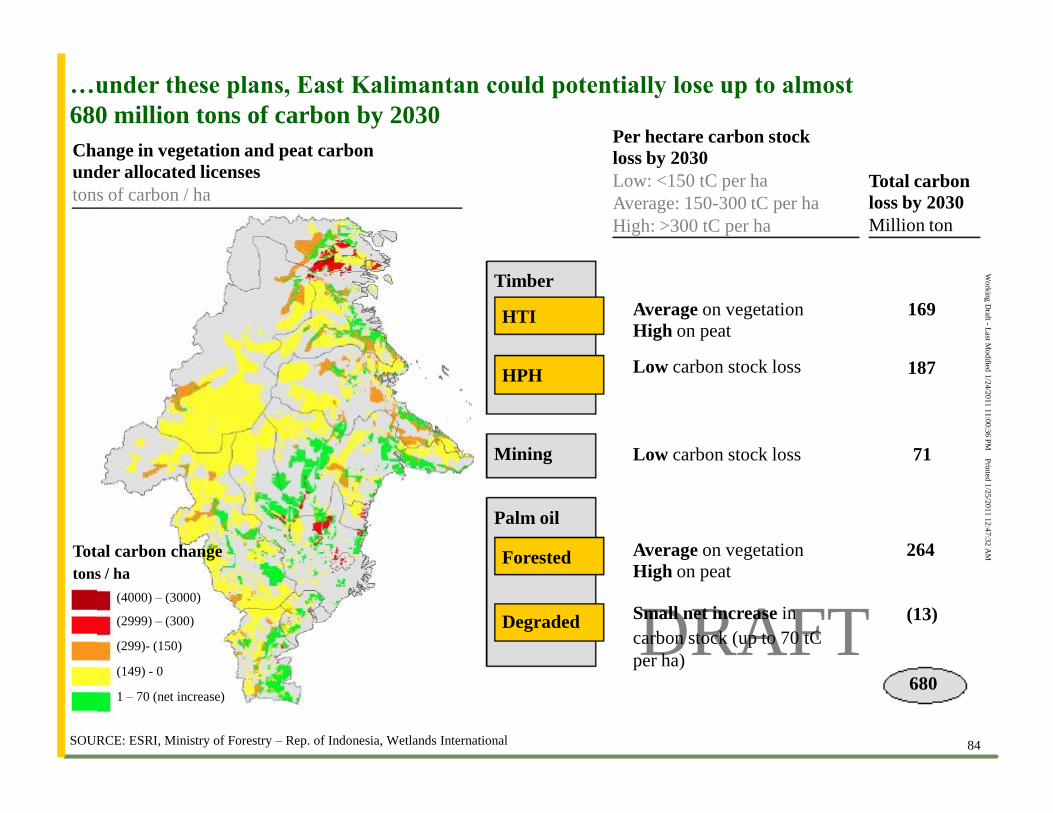
84
…under these plans, East Kalimantan could potentially lose up to almost
SOURCE: ESRI, Ministry of Forestry – Rep. of Indonesia, Wetlands International
680 million tons of carbon by 2030 Change in vegetation and peat carbon
under allocated licenses
tons of carbon / ha
Total carbon change
tons / ha
(4000) – (3000)
(2999) – (300)
(299)- (150)
(149) - 0
1 – 70 (net increase)
Per hectare carbon stock
loss by 2030
Low: <150 tC per ha
Average: 150-300 tC per ha
High: >300 tC per ha
Total carbon
loss by 2030
Million ton
Timber
HTI HPH
Mining Palm oil
Forested
Degraded
Average on vegetation
High on peat Low carbon stock loss Low carbon stock loss
Average on vegetation
High on peat
Small net increase in
carbon stock (up to 70 tC
per ha)
169 187 71
264
(13)
680
Wo
rkin
g D
raft - Last M
odified
1/2
4/2
011 1
1:0
0:3
6 P
M P
rinted
1/2
5/2
011 1
2:4
7:3
2 A
M
85
DRAFT
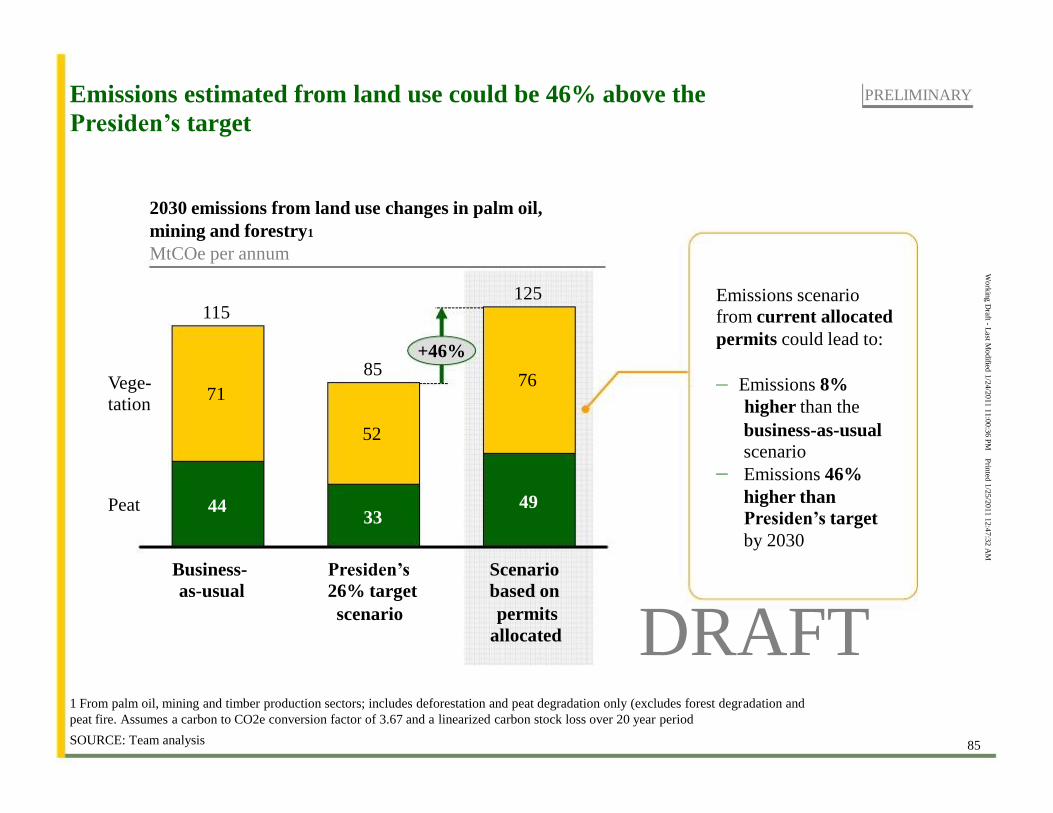
71
52
76
Peat
85 Vege-
tation
49
125
33
115
44
+46%
Emissions estimated from land use could be 46% above the
Presiden’s target 2030 emissions from land use changes in palm oil,
mining and forestry1
MtCOe per annum
Business-
as-usual
Scenario
based on
permits
allocated
Presiden’s
26% target
scenario
SOURCE: Team analysis
1 From palm oil, mining and timber production sectors; includes deforestation and peat degradation only (excludes forest degradation and
peat fire. Assumes a carbon to CO2e conversion factor of 3.67 and a linearized carbon stock loss over 20 year period
Emissions scenario
from current allocated
permits could lead to:
– Emissions 8%
higher than the
–
business-as-usual
scenario
Emissions 46%
higher than
Presiden’s target
by 2030
PRELIMINARY
Wo
rkin
g D
raft - Last M
odified
1/2
4/2
011 1
1:0
0:3
6 P
M P
rinted
1/2
5/2
011 1
2:4
7:3
2 A
M
DRAFT
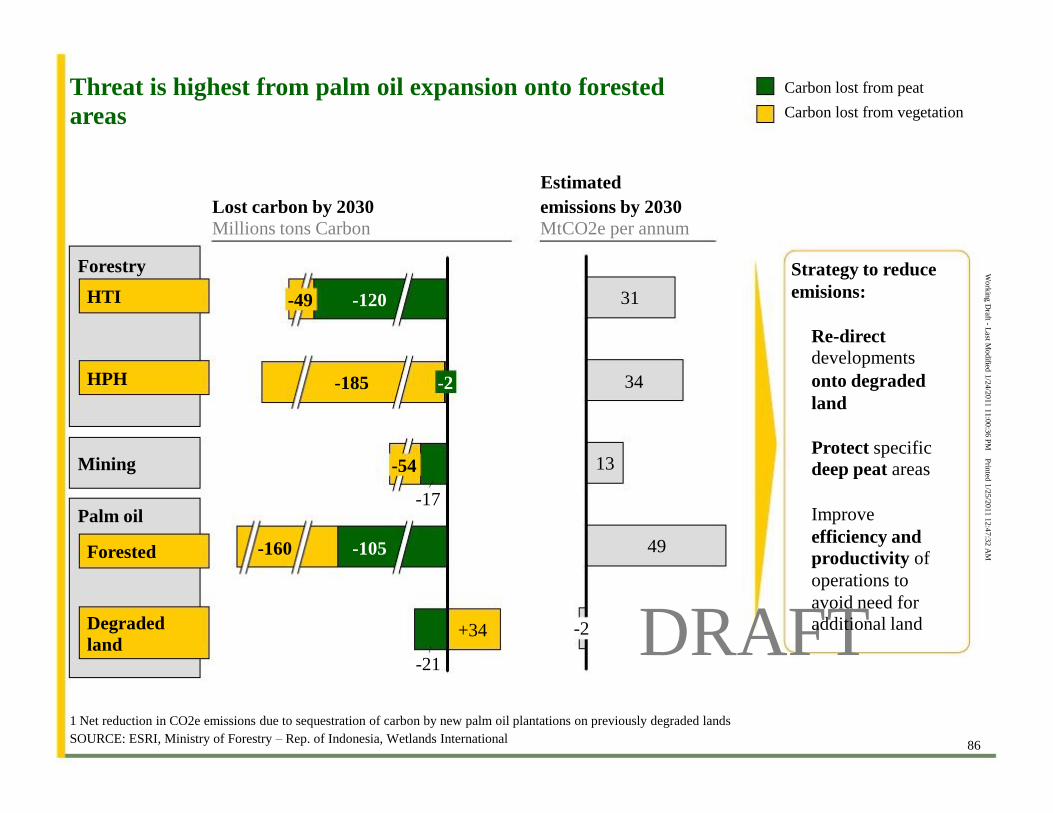
86 SOURCE: ESRI, Ministry of Forestry – Rep. of Indonesia, Wetlands International
Forestry
HTI
+34
-21
-160 -105
-54 -17
-185 -2
-120 -49
Lost carbon by 2030
Millions tons Carbon
HPH
Mining
Palm oil
Carbon lost from peat
Carbon lost from vegetation
Forested
Degraded
land
1 Net reduction in CO2e emissions due to sequestration of carbon by new palm oil plantations on previously degraded lands
Strategy to reduce
emisions:
Re-direct
developments
onto degraded
land
Protect specific
deep peat areas Improve
efficiency and
productivity of
operations to
avoid need for
additional land
49
13
34
31
-2
Threat is highest from palm oil expansion onto forested
areas Estimated
emissions by 2030
MtCO2e per annum
Wo
rkin
g D
raft - Last M
odified
1/2
4/2
011 1
1:0
0:3
6 P
M P
rinted
1/2
5/2
011 1
2:4
7:3
2 A
M
87
DRAFT
Contents
Optimizing East Kal land use
– Implication of land use plans – Optimizing land use
Wo
rkin
g D
raft - Last M
odified
1/2
4/2
011 1
1:0
0:3
6 P
M P
rinted
1/2
5/2
011 1
2:4
7:3
2 A
M
DRAFT
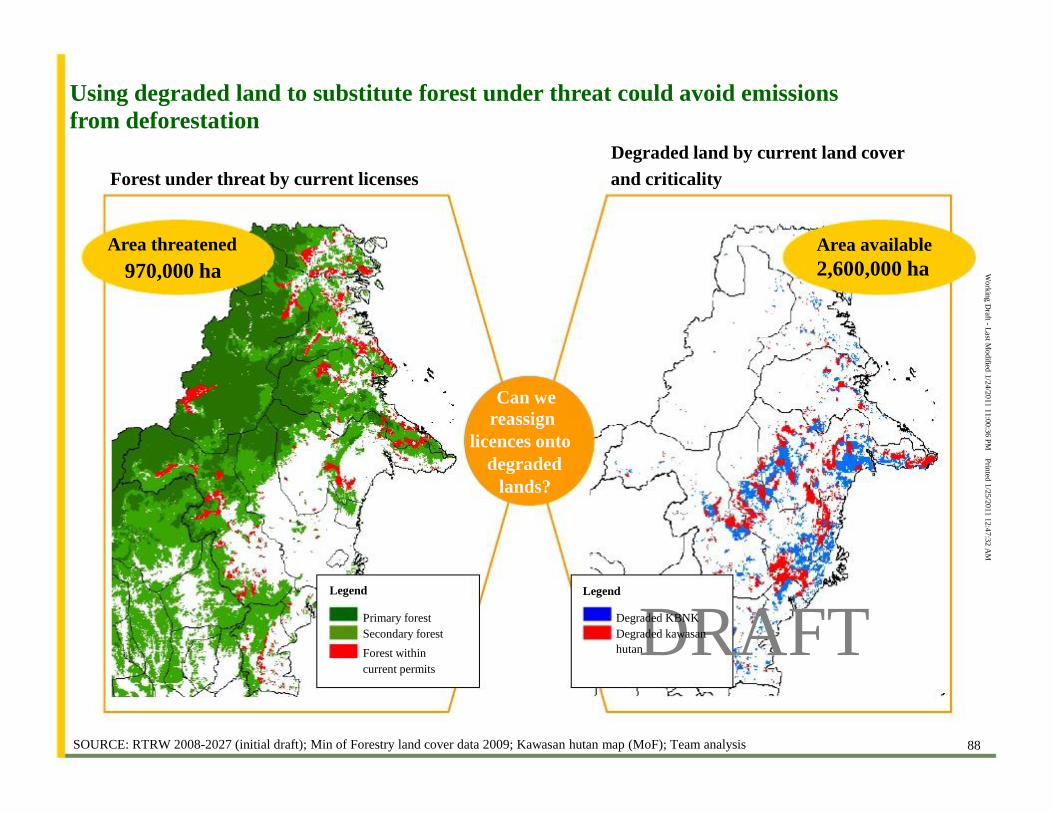
88 SOURCE: RTRW 2008-2027 (initial draft); Min of Forestry land cover data 2009; Kawasan hutan map (MoF); Team analysis
Using degraded land to substitute forest under threat could avoid emissions
from deforestation
Degraded land by current land cover
Forest under threat by current licenses
Area threatened
970,000 ha Legend
Primary forest
Secondary forest
Forest within
current permits
and criticality Can we
reassign
licences onto
degraded
lands? Legend
Degraded KBNK
Degraded kawasan
hutan
Area available
2,600,000 ha
Wo
rkin
g D
raft - Last M
odified
1/2
4/2
011 1
1:0
0:3
6 P
M P
rinted
1/2
5/2
011 1
2:4
7:3
2 A
M
DRAFT
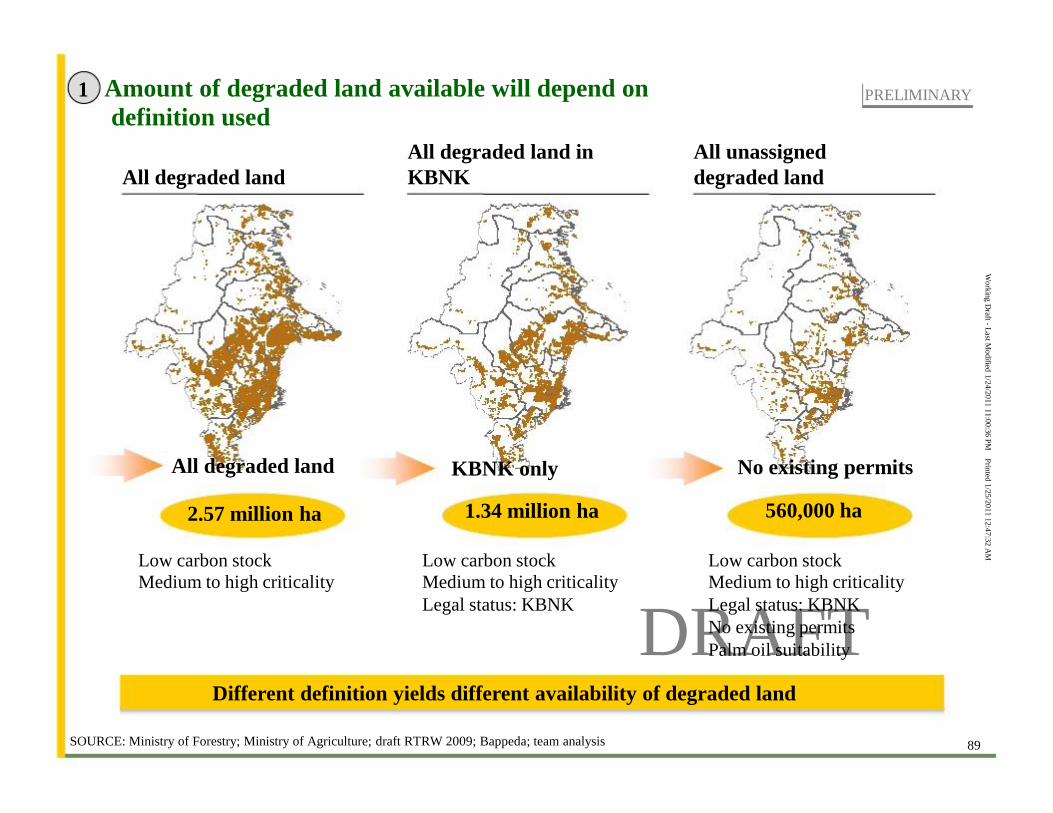
89 SOURCE: Ministry of Forestry; Ministry of Agriculture; draft RTRW 2009; Bappeda; team analysis
All degraded land in All unassigned
KBNK KBNK only
1.34 million ha Low carbon stock
Medium to high criticality
Legal status: KBNK
degraded land No existing permits
560,000 ha Low carbon stock
Medium to high criticality
Legal status: KBNK
No existing permits
Palm oil suitability
All degraded land All degraded land 2.57 million ha Low carbon stock
Medium to high criticality
Different definition yields different availability of degraded land
1 Amount of degraded land available will depend on
definition used PRELIMINARY
Wo
rkin
g D
raft - Last M
odified
1/2
4/2
011 1
1:0
0:3
6 P
M P
rinted
1/2
5/2
011 1
2:4
7:3
2 A
M
90
DRAFT
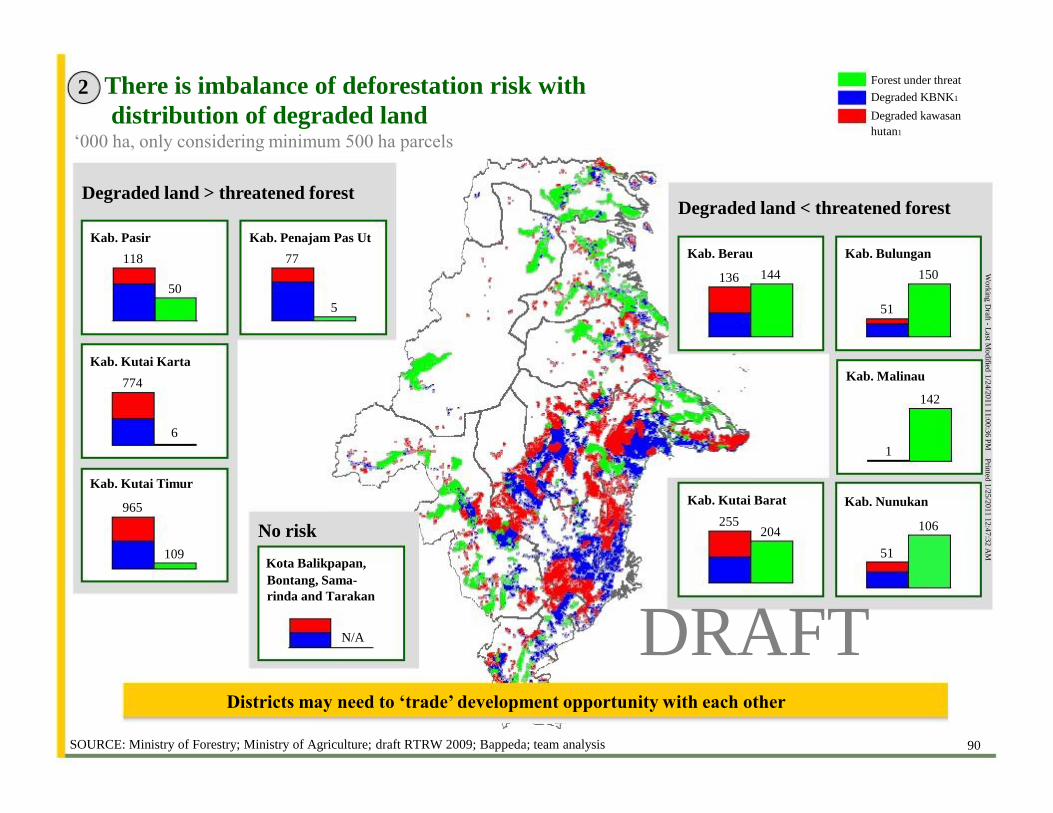
SOURCE: Ministry of Forestry; Ministry of Agriculture; draft RTRW 2009; Bappeda; team analysis
Kab. Berau Kab. Bulungan
Kab. Pasir Kab. Penajam Pas Ut
Kab. Kutai Karta
Kab. Kutai Barat
Bontang, Sama-
144 136
Kab. Malinau
Kab. Nunukan
150
51
774
204 255
109
965
142
6
1
Kab. Kutai Timur
106
51
50
118
5
77
rinda and Tarakan N/A
Forest under threat
Degraded KBNK1
Degraded kawasan
hutan1
Degraded land < threatened forest
No risk Kota Balikpapan,
2 There is imbalance of deforestation risk with
distribution of degraded land „000 ha, only considering minimum 500 ha parcels
Degraded land > threatened forest
Districts may need to ‘trade’ development opportunity with each other
All
sta
tus’
Wo
rkin
g D
raft - Last M
odified
1/2
4/2
011 1
1:0
0:3
6 P
M P
rinted
1/2
5/2
011 1
2:4
7:3
2 A
M
Leg
al
sta
tus
KB
NK
DRAFT
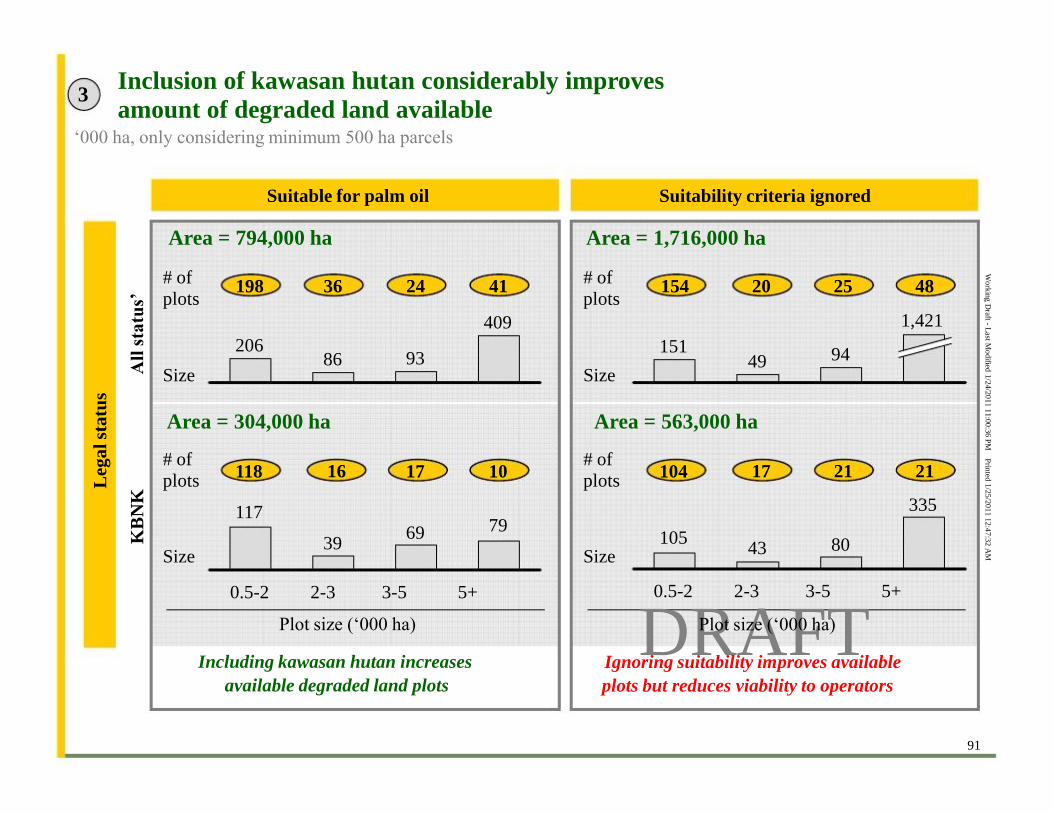
91
Inclusion of kawasan hutan considerably improves
amount of degraded land available
409
93 86 206
Area = 563,000 ha Area = 304,000 ha
Suitable for palm oil
Area = 794,000 ha
1,421
94 49 151
198 36 24 41
118
117
16 39
17 69
10
79
154 20 25 48
104
105
17
43
21 80
21 335
# of
plots
# of
plots
3
„000 ha, only considering minimum 500 ha parcels
0.5-2 2-3 3-5 5+ Plot size („000 ha)
Including kawasan hutan increases
available degraded land plots
0.5-2 2-3 3-5 5+ Plot size („000 ha)
Ignoring suitability improves available
plots but reduces viability to operators
# of
plots Size
# of
plots Size
Size Size
Suitability criteria ignored
Area = 1,716,000 ha
Wo
rkin
g D
raft - Last M
odified
1/2
4/2
011 1
1:0
0:3
6 P
M P
rinted
1/2
5/2
011 1
2:4
7:3
2 A
M
92
DRAFT
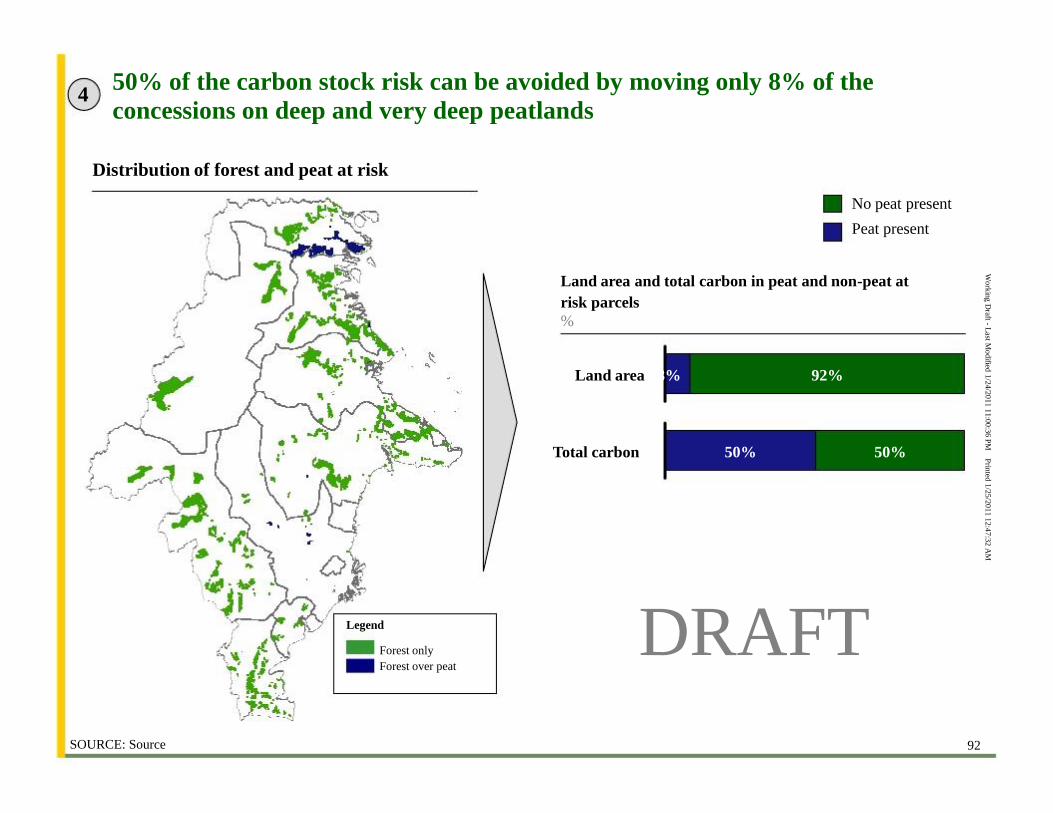
SOURCE: Source
Legend
Forest only
Forest over peat
Land area 8% 92%
Total carbon 50% 50%
50% of the carbon stock risk can be avoided by moving only 8% of the
concessions on deep and very deep peatlands Distribution of forest and peat at risk No peat present
Peat present
Land area and total carbon in peat and non-peat at
risk parcels
%
4