indonesia social research, faculty of economics, university of indonesia; umar juoro, senior...
TRANSCRIPT

As Indonesia recovers from its severe financial crisis, new opportunities for
Australian trade and investment are emerging. To attract foreign investors to
government sales of banking and corporate assets the Indonesian Government
has significantly reduced barriers to foreign investment. Dramatically lower trade
barriers in most sectors, but especially in agricultural product and automotive
markets, will assist growth in the traditionally strong commercial relationship
between Australia and Indonesia.
This balanced report helps Australian business face the commercial challenge in
Indonesia. It analyses economic reform progress including bank and corporate
sector restructuring, highlights on-going reform agendas and risks, assesses
recent and projected economic performance, explores the business environment
and identifies key opportunities for Australian investors and exporters.
D E PA R T M E N T O F F O R E I G N A F F A I R S A N D T R A D E
IndonesiaFacing the Challenge IndonesiaIndonesia
Facing the ChallengeFacing the Challenge
13769/eaau cover/new 15/11/00 12:13 PM Page 1
w w w . d f a t . g o v. a u / e a a u
D E PA R T M E N T O F F O R E I G N A F F A I R S A N D T R A D E
IndonesiaIndonesiaFacing the ChallengeFacing the Challenge
13769/eaau titlepg 29/11/00 2:30 PM Page 1
© Commonwealth of Australia 2000
This work is copyright. Apart from any use permitted under the Copyright Act 1968, no part may be
reproduced by any process without prior written permission from the East Asia Analytical Unit. Requests
and inquiries concerning reproduction and rights should be addressed to the Executive Director,
East Asia Analytical Unit, Department of Foreign Affairs and Trade, RG Casey Building, John McEwen
Crescent, Barton ACT 0221.
AusAID and Austrade contributed to the cost of producing this report.
National Library of Australia Cataloguing-in-Publication data: 12 December 2000
Indonesia: Facing the Challenge
Bibliography
Includes index
ISBN 0 642 70501 1
ISBN 0 642 70509 7 (CD Rom)
Design by Green Advertising
� � � � � � � � � � � � �
� ��� ����
�������������
Brendan Berne, Deputy Director, East Asia Analytical Unit directed this report and Dr Frances Perkins,Executive Director, provided overall editorial direction and input. James Bloomfield provided research
assistance in the final preparation stages; Robyn Leason did the typesetting and assisted with chartdesign; Katrina Sargent provided valuable pre-production coordination and logistical support; and
Julie Roberts and Nathan Backhouse provided administrative assistance.
The Australian Embassy in Jakarta provided invaluable assistance in producing this report, coordinating
East Asia Analytical Unit visits to Indonesia, providing relevant material, data and comments on thereport. We thank HE John McCarthy, Ambassador; Les Rowe, Deputy Head of Mission; Tony Urbanski,
Counsellor; and Kate Duff, Second Secretary. Greg Moriarty, Counsellor; Karen Lanyon, First Secretary;David Engel, First Secretary; Piter Edward, Researcher and Policy Analyst; and Cecilia Wibowo,
Administrative Assistant also provided valuable support.
Austrade also provided invaluable assistance, advice and support. We thank Michael Abrahams,
Minister and Senior Trade Commissioner, Austrade; Rob Bridge, Counsellor and Trade Commissioner;and Paul Martins, First Secretary and Trade Commissioner.
AusAID also provided assistance, advice and support, and we thank Sam Zappia, Director, IndonesiaSection, Canberra and Chris Tinning, Second Secretary, Jakarta.
From Treasury, Mike Waslin, Treasury Representative, South East Asia; Nhon Tran, Director, AsiaSection; and Robert Greig, Desk Officer, Indonesia, also provided valuable information and comments
on the report.
Within the Department of Foreign Affairs and Trade in Canberra, we thank John Dauth, DeputySecretary; Pamela Fayle, Deputy Secretary; Gillian Bird, First Assistant Secretary, South and Southeast
Asia Division; Paul Grigson, Assistant Secretary, Maritime South East Asia Branch; Bassim Blazey,Director Indonesia Section; and Desk Officers Kathy Wong, Paul Griffiths, Lynette Wood and
Jeff Roach.
The East Asia Analytical Unit wishes to acknowledge the valuable contribution made by the following
consultants: Hadi Soesastro, Tubagus Feridhanusetyawan, Kurnya Roesad and Haryo Aswicahyono,Department of Economics, Centre for Strategic and International Studies, Jakarta; Dr Greg Fealy,
Australian National University; Usmanto Njo, Andrew Rosser, Gitte Heij, and Richard Robison, AsianResearch Centre, Murdoch University; Gary Dean, PT Okusi, Jakarta; Rob Hogarth, Todd Hargreaves,
Peter Russell, Patrick Vath, Naveen Chandra and Kevin Raghu, KPMG; Kerry Ryan, Phillip Crowley,Rick Beckman, Thomas Siregar, Teguh Maramis and Elizabeth Hallet, Deacons; Brendan Millane,
Key Economics; and Helen Cabalu, Curtin University.
We thank the Australia-Indonesia Business Coucil, in particular, Australian President Peter Nevile,
and his predecessor, Rob Hogarth. We thank also Katrina Morgan, and David Ingris, NSW andVictorian Presidents of the Australia-Indonesia Business Council.
In Jakarta, we thank the following within the Indonesian G overnment: Bacelius Ruru, Deputy Ministerfor Supervision and Control, Office of State Minister for Investment and State Owned Enterprises;
Amir Sambodo, Adviser to Chairman, IBRA; Tony Silitonga, Senior Manager, Investor Relations,IBRA; Soemardi, Ministry of Finance; Muchtar, Secretary General, Ministry of Industry and Trade;

� � � � � � � � � � � � � � � � � � � �� � � � � � � � �
���� ���
Yoopi Abimanyu, Ministry of Finance; Endi Achmadi, Ministry of Finance; Adikelana Adiwoso, SeniorVice President, IBRA; Gonthor Aziz, Head of Bilateral Affairs Subdivision, Bapepam; Edison Bako,Account Manager, Investor Relations, IBRA; Soediono Basuki, Investment Coordinating Board; RoyBasoeki, IBRA; Muliaman Hadad, Executive Analyst, Bank Indonesia; Syafruddin Temenggung,Secretary, Financial Sector Policy Committee and Deputy Minister for Investment and BusinessDevelopment; William Wallace, Macroeconomist, Bappenas; Sunu Widyatmoko, Case Manager andZaki Mansoer and Denaldy Mauna, Jakarta Initiative Task Force; Sumitro, Chairman, IndonesianDebt Restructuring Agency; Sri Sunarni, Ministry of Finance; Indra Surya, Head of International AffairsDivision, Bapepam; Kelly Bird, Bappenas; Heru Subiyantoro, Division Head of Balance of Paymentsand International Trade Analysis, Ministry of Finance; Lee Niedringhaus, Director, Inter-DepartmentalRestructuring Committee, IBRA; and Merly Khouw, Senior Vice President, Advisor to FORSAT, IBRA.
We thank the following people employed in Jakarta’s corporate sector for their time and assistance;Justin Breheny, Senior Executive Advisor, and Scott Armstrong, ANZ-Panin Bank; Ken Farrell andHarriet Richards, President Directors, BHP; Dennis Heffernan, Publisher, Van Zorge, Heffernan andAssociates; Tony Hudson, Partner, Blake Dawson Waldron; John Richardson, Group General Manager,Corporate Affairs, P&O Australia; Raden Pardede, Chief Research Officer, Head of Forecasting andModelling, Danareksa; Scott Younger, Chairman, Strategic Intelligence; and Roger Stinton, Directorof Operations, Strategic Intelligence.
We thank the following people from international organisations represented in Jakarta for their timeand assistance; Bert Hofman, Senior Economist, World Bank; Kevin Evans, Program Coordinator,Governance, United Nations Development Program; Geoff Forrester, Program Manager, TechnicalAssistance Management Facility; Jimming Ha, Resident Representative, International Monetary Fund;Iyanatul Islam, Senior Employment and Labour Market Specialist, Employment Recovery Project,United Nations; Anthony Keuk, Senior Advisor, Asian Development Bank; William Mako, PrivateSector Development Specialist, and Lloyd McKay, Principal Economist, World Bank; Satish Misra,Chief Economist, and Widjajanti Suharyo, Regional Policy Analyst, United Nations Support Facilityfor Indonesian Recovery.
We thank the following Jakarta based academics: Sri Adiningsih, Faculty of Economics, GadjahMada University; Anton Hermanto Gunawan, Associate Director for Research, Institute for Economicand Social Research, Faculty of Economics, University of Indonesia; Umar Juoro, Senior Economist,Center for Information and Development Studies; Sri Indrawati Mulyani, Director, Institute for Economicand Social Research, Faculty of Economics, University of Indonesia; Mari Pangetsu, Member, Boardof Directors, Centre for Strategic and International Studies; and Thee Kian Wee, Senior ResearchAssociate, Centre for Economic and Development Studies, Indonesian Institute of Sciences.
In Australia we thank Hal Hill, Professor of Southeast Asian Economics, Asia Pacific School ofEconomics and Management, Australian National University; Ross McLeod, Indonesia Project,Australian National University; Andrew Stoeckel, Executive Director, Centre for InternationalEconomics; Charles Stott, General Manager, International Marketing, AWB Limited; Ken Waller, SeniorEconomic Adviser, Colonial Group; Julie Beatty, Economist, BHP; and Paul Carter,PricewaterhouseCoopers.
We also thank BHP and Pacific Power who are the East Asia Analytical Unit’s corporate sponsors,and AusAID, who sponsored the report.
Editing was by Ann Duffy.
� � � � � � � � � � � � � � � �
���� ��
�� ��� ������������������
The East Asia Analytical Unit was established in 1990 as the main agency within the Australian
Government responsible for publishing analyses of major economic and political issues in Asia.
Located within the Department of Foreign Affairs and Trade, the East Asia Analytical Unit has
undertaken 25 studies on major issues related to Australia’s trade policy interests in the region. From
2000, the East Asia Analytical Unit commenced a new series covering important emerging markets
outside East Asia.
Staffed with nine professionals, the East Asia Analytical Unit also contracts a range of consultants
with specific areas of expertise. It draws on a wide range of data and information sources, including
interviews with decision-makers, analyses throughout the world and input from Australia’s diplomatic
and trade missions.
Reports and briefing papers produced by the unit are intended to assist analysts and decision makers
in business, the Australian Government and the academic community.
Full copies of previous reports and executive summaries now can be downloaded from the Internet.
See web site details below.
����������������
East Asia Analytical Unit
Department of Foreign Affairs and Trade
RG Casey Building
John McEwen Crescent
Barton ACT 0221
Australia
Telephone: 61 2 6261 2237
Facsimile: 61 2 6261 3493
Email: [email protected]
www.dfat.gov.au/eaau
Executive Director
Dr Frances Perkins
Directors
William Brummitt
Stephen Scott
Deputy Directors
Brendan Berne
James Bloomfield
Joanne Frederiksen
Michael Growder
Administration
Chris Ambler
Internet and Information Technology
Robyn Leason

� � � � � � � � � � � � � � � � � � � �� � � � � � � � �
���� ���

� � � � � � � � � � � � � � � �
� ��� ����
����������������
������������� ��
��������� ������������������� �
Macroeconomic Stability Returns 5
Small Firms Prospering 10
Recovery Set to Continue in Short Term 11
Legacy of the Crisis Remains 13
Regaining Sustainable Growth 16
Medium Term Forecasts 16
Reform Indicators for Business 18
Implications 19
References 20
��������� ������������������������������������ ��
A New Cabinet 22
Economic and Political Stability Links 22
A Changing Political Landscape 23
Impact of Political Change on Economic Recovery 25
Regional Decentralisation 28
Issues for Investors 29
Tracking Progress 30
Conclusion 30
References 33
��������� ������������������������������ ��
FutureTrends in FDI 36
Foreign Investment Regime Reforms 38
Opportunities in the Export Sector 39
Sale of IBRA’s Assets 40
Sale of Bank Equity 40
Sale of Non-performing Loans 41
Sale of Corporate Assets 41
Issues for Investors 43
Case Studies of Asset Sales 45
Timetable for IBRA Asset Sales 45
Sale of State Enterprises 46

� � � � � � � � � � � � � � � � � � � �� � � � � � � � �
� ��� �����
Issues for Investors 49
Case Studies 50
Devolution and FDI 51
Other Emerging Sectors for FDI 51
Government Incentives 53
Implications 53
References 55
��������� ������������������������������������ ��
Crisis and Reform 58
Trade Liberalisation since the Crisis 61
Regional Trade Liberalisation 64
WTO Commitments 64
AFTA 66
APEC Trade Liberalisation 68
Political Obstacles to Trade Liberalisation 69
Recent Trade Trends 69
References 79
��������� ������������������ ������������������ !�
Australian-IndonesianTrade Flows 82
Crisis’ Impact on Trade 82
Australian Exports to Indonesia 85
Australian Imports from Indonesia 91
Potential Export Growth Sectors 95
Trends in Direct Investment 101
Australian Direct Investment in Indonesia 101
Indonesian Direct Investment in Australia 105
Indonesian Direct Investment Outlook and Opportunities 105
Factors Boosting Foreign Investment 106
Investor Issues to Evaluate 108
Australian Business Links with Indonesia 108
Implications 108
References 109
��������" ������ ����������������� ���
Indonesian Business Culture 112
Impact of Recent Reforms on the Business Environment 113
Managing a Business in Indonesia 114
The Regulatory Environment 116
Implications 118
References 119

� � � � � � � � � � � � � � � �
���� ��
��������� ��������������������������������������� ���
Responses to the Crisis 123
IBRA’s Asset Sales 127
IBRA Debt Restructuring 129
Prudential Supervision 129
Transparency 131
Capital Market Reform 132
Prospects 133
References 134
��������! ��������������������������������������� ���
Levels of Indebtedness 136
Debt Restructuring Progress 137
IBRA’s Asset Management Unit, Credits 140
The Jakarta Initiative Task Force 144
Corporate Governance 145
Markets Governing Corporations 146
Implications 147
References 148
��������# ��������������� � ��#
Key Role of the Resources Sector 150
Recent Developments 153
Regional Devolution 153
Illegal Mining 154
New Legislation 155
New Taxes and Royalties 156
Foreign Investment 157
Long Term Outlook for Mining 159
Support Networks for Australian Miners 161
Prospects 161
References 163
���������$ �������������������� ����� �"�
Agriculture in the Economy 166
Agricultural Liberalisation and Opportunities for Australia 170
Agricultural Trade Opportunities 173
Foreign Investment Reform 176
Investments in Agricultural Production 178
Prospects 179
References 181
� � � � � � � � � � � � � � � � � � � �� � � � � � � � �
���� �
���������� ��������������� ������������������� �!�
Implications for Business 184
Implications for Government 187
Enhancing Investment Links 187
Strengthening People-to-People Links 188
Conclusions 191
��������������� ����� �#�
Contacts in Indonesia 193
Contacts in Australia 194
������ �#�
���� ����������������� ���������� �$�
� � � � ! "
���� � �
�� ���
ADU Asset Disposal Unit.
AFTA ASEAN Free Trade Area.
AIBC Australia-Indonesia Business Council.
AIDA Australia-Indonesia Development Area.
AMC IBRA’s Asset Management Credit Unit.
AMI IBRA’s Asset Management Investments.
APEC Asia Pacific Economic Cooperation; a cooperative grouping of Asian, North
American, Latin American economies and Australia and New Zealand.
APRISINDO Indonesian Footwear Association.
ASEAN Association of South East Asian Nations.
AusAID Australian aid program.
Bapepam Badan Pelaksana Pasar Modal, Capital Market Supervisory Agency.
Bappenas Indonesia di Badan Perencanaan Pembangunan Nasional, National Planning
Agency.
BBKU Banks frozen by IBRA.
BIS Bank for International Settlements.
BKPM Badan Kordinasi Penanaman Modal, Investment Coordinating Board.
BPK Supreme Auditor’s Board.
BPPC Badan Penyangga dan Pemasaran Domestic Clove Monopoly.
BPS Badan Pusat Statistik, Statistics Indonesia.
BULOG Badan Urusan Logistik, Indonesia’s national logistics agency.
Capital Account A process of removing capital controls and restrictions on the convertibility
Liberalisation of currency.
Capital Adequacy A risk management concept requiring financial institutions to have sufficient
capital to protect their counterparties and depositors from on- and off-balance
sheet risks, including non-performing loans. Capital adequacy requirements
tend to be simple mechanical rules. Ability to provide banking services to the
public while maintaining the legally required ratio of capital to assets.

� � � � � � � � � � � � � � � � � � � �� � � � � � � � �
���� � ��
Capital Adequacy A ratio of capital to a financial institution’s risk weighted assets, used in financial
Ratio sector regulation. The minimum Bank for International Settlements capital
adequacy ratio is 8 per cent of risk weighted loans.
CBU Motor vehicle that is completely built up.
CEPT Common effective preferential tariff.
cif Cost-insurance-freight.
CKD Motor vehicle that is completely knocked down.
Depnaker Department of Manpower.
DPDE Departemen Pertambangan Dan Energi, Department of Mines and Energy.
DPR Dewan Perwakilan Rakyat, People’s Representative Assembly.
EU European Union.
FDI Foreign direct investment; investment in overseas branches, subsidiaries or
associated companies in which the investor owns 10 per cent or more equity.
fob Free on board.
FSPC Financial Sector Policy Committee.
FY Fiscal year.
Gaji Pokok Basic wage.
GAPIPA Indonesian Association of Steel Pipe Producers.
GBHN Broad Guidelines of State Policy.
GDP Gross domestic product; the value of all goods and services produced in an
economy in a specified time period.
IBRA Indonesian Bank Restructuring Agency.
IMF International Monetary Fund.
INDRA Indonesian Debt Restructuring Agency.
I$ International dollars; provide parity based international comparisons of the
purchasing power of national incomes.
IPO Initial public offer.
IT Information technology.
Jamsotek Government funded worker insurance scheme.
JITF Jakarta Initiative Task Force.
KADI Indonesian Antidumping Committee.
KAPETS Integrated economic development zones.

� � � � ! "
� �� � � ���
KPKPN Office for Audit of State Officials.
Lebaran Annual Islamic holiday.
LNG Liquefied natural gas.
MPR Majelis Permusyawaratan Rakyat, People’s Consultative Assembly.
Musyawarah Local approach to dispute settlement.
National Interest Australian Government agreement to act as insurer of last resort for payment
Provisions for exports, usually bulk agricultural commodities, to nations with poor credit ratings.
NCCG National Committee on Corporate Governance.
OECD Organisation for Economic Cooperation and Development.
OPEC Organisation of Petroleum Exporting Countries.
PAN Partai Amanat Nasional, National Mandate Party.
PDI-P Partai Demokrasi Indonesia, Indonesian Democratic Party of Struggle.
Pegawai negeri National officials.
PKB Partai Kebangkitan Bangsa, National Awakening Party.
PPP Partai Persatuan Pembangunan, United Development Party.
PPP Purchasing power parity; estimated by determining the number of units of a
country’s currency required in-country to buy a standard bundle of goods and
services that US$1 would buy in the United States. This information then is
used to adjust the country’s US dollar per capita income to better reflect its
actual purchasing power.
Refinancing Using new financing to pay off or extend an old loan.
Rp. Rupiah; Indonesian currency unit.
SE State owned enterprise.
SMEs Small and medium enterprises.
TAFE Australian tertiary institution for technical and further education.
TNI Indonesia’s military.
VAT Value added tax; a tax on value added at each stage of industrial production,
wholesaling and retailing.
WTO World Trade Organization.
� � � � � � � � � � � � � � � � � � � �� � � � � � � � �
���� � ��
���������
The information and advice set out in this document is believed to be correct at the time of
publication. However, the Commonwealth of Australia and the Department of Foreign Affairs
and Trade, their officers, employees and agents, accept no liability for any loss, damage or
expense arising out of, or in connection with, any reliance on or any omissions in or inaccuracies
in the material contained in this publication.
Where identified, material in this publication is drawn from third party submissions and the
Department of Foreign Affairs and Trade neither endorses those submissions, nor vouches
for the accuracy or completeness of their information.
This publication is intended to provide general information only and before relying on the
information and advice contained in the report, and before entering into any particular
transaction, users should:
• rely on their own enquiries, skill and care in using the information
• check with primary sources in respect of third party submissions
• seek independent advice.
� # � � $ � % & � � � $ � � � ! "
���� � �
� �����!�� ������
Since 1998, Indonesia has made notable gains in developing democracy, freedom of the press, civil-
military relations and broader social participation in the political system. However, the Indonesian
Government recognises the challenges ahead also are significant. Indonesia must continue to
restructure its financial and corporate sectors, develop a more reliable legal framework and implement
decentralisation. If it successfully builds this foundation, it would underpin more sustainable and
equitable economic growth over the next decade and beyond.
This report details major post crisis developments in Indonesia to inform Australian business,
governments and the community, enhance commercial, official and people-to-people relationships
and contribute to Australia’s development assistance to Indonesia. The report tracks Indonesia’s
progress in facing these challenges, focusing on major economic reforms and developments since
the financial crisis. It identifies achievements, highlights the ongoing reform agenda and assesses
probable timing of progress in these areas to determine the likelihood of timely and sustainable
economic recovery, and signals opportunities for Australian business.
�����"����#����$
In late 1999, the Indonesian economy started a reasonably strong short term recovery, with gross
domestic product, GDP, growing at about 4 per cent in the first half of 2000 and growth is likely to
reach 5 per cent for 2000. All sectors are expanding, as are net exports and consumption. Wages
and salaries are recovering from post crisis falls, growing at an annual rate of 17 per cent. Reflecting
private bank refinancing and increasing interest margins, bank lending also is resuming, rising
Rp. 12 trillion (US$1.1 billion) in June and July 2000, or 6 per cent of bank assets, although this
includes significant debt restructuring.
Inflation has been low but is rising, with prices increasing 8 per cent in the year to September 2000.
Higher wages, imported inflation from rupiah depreciation, and higher utilities and oil prices are
causing this rise. Furthermore, new investment, which since December 1999 had been recovering
slowly from major crisis induced falls, declined again in the September quarter of 2000.
Indonesia’s trade performance is recovering. Exports rose almost 28 per cent in the year to
September 2000, due to higher oil prices and growing non-oil export volumes, and are now 17 per
cent above pre-crisis levels in US dollar terms. While imports also are rising as exports and domestic
consumption recover, and in US dollar terms were up almost 16 per cent in the year to September
2000, they were still 34 per cent below pre-crisis peaks. Hence, Indonesia ran a significant trade
surplus, equal to 11 per cent of GDP in the September quarter of 2000.
However, 1999 capital account transactions were less promising; Indonesia’s net private direct capital
outflow of about US$4 billion was about 65 per cent of the 1999 trade surplus of US$6 billion. Foreign
debt repayments due to loan restructuring and portfolio investment also generated large negative
capital flows.
� � � � � � � � � � � � � � � � � � � �� � � � � � � � �
���� � ��
�%��#��������"&
By late 2000, a marked divide, characteristic of a dual economy, was emerging between the
performance of export-oriented and small and medium enterprises, SMEs, and large corporates.
The low rupiah assists exporters, especially those able to access external funds for trade credit and
investment, and many SMEs, previously denied access to bank credit, are debt free, and can capitalise
on growing domestic and foreign demand. For example, a September 2000 survey of mostly export-
oriented foreign enterprises in an industrial estate outside Jakarta, indicated output was 50 per cent
above pre-crisis levels. Surveyed firms mainly used capital from foreign parent companies, and
reported the estate’s operating environment was highly flexible and profitable; permits were easy to
obtain; and labour was cheap, plentiful and efficient.
On the other hand, most large corporates, particularly those in construction, real estate and tourism,
remain mired in unreconstructed debt and are technically insolvent. Many corporates that have
restructured debt may not have restructured sufficiently their operations and management, leaving
them highly leveraged and vulnerable to future downturns. Progress in corporate restructuring is slow,
inhibiting new borrowing and investment, and reducing the corporate sector’s scope to sustain growth.
Whether healthy SME and export-oriented firms can continue to grow and be able to access credit,
or whether the credit demands of over-leveraged corporates will squeeze out more successful firms,
will be critical. Further, the use of public money to restructure corporates could increase the tax
burden on healthy firms, constraining their growth. All these issues imply growth could remain below
pre-crisis levels for at least the next two years, or until restructuring is complete.
'����������(���)"����
In the three years since the financial crisis began, Indonesians have achieved considerable political
reform, ending authoritarianism, reinstating Indonesian democracy and addressing the challenge of
broadly based political, economic and military reform. A new, more vibrant polity has replaced the
highly centralised New Order regime.
This political change eventually should create a fairer and more predictable investment environment
for Australian business. New parties with weaker affiliations to previously powerful vested interests
have constrained initial political resistance to asset sales and debt restructuring. Newly established
independent auditors and, eventually, greater central bank independence should make policy
implementation and governance more efficient. Also, a more active civil society gradually should
increase government and other stakeholder accountability. Increased regional autonomy will
decentralise many government responsibilities, in the long term potentially improving economic
efficiency and community participation.
However, investors face some short term risks during the transition to a new democratic and decentralised
political system. Opposition to some aspects of the reform program could become more vocal. Some
newly empowered bureaucrats and political parties oppose foreign ownership, threatening the sale of
corporate and state assets. Bureaucratic, union and regional resistance also hamper the reform and
sale of state enterprises. Finally, devolution will affect central government revenue, and could affect the
foreign investment environment by complicating transparency and consistency issues.
� # � � $ � % & � � � $ � � � ! "
� �� � � ���
Largely to respond to mounting concerns about lack of progress in implementing the economic reform
program, President Wahid reshuffled his cabinet immediately after the People’s Consultative Assembly,
MPR, annual session in August 2000. The new, smaller cabinet, including Dr Rizal Ramli as
Coordinating Minister for Economics is more cohesive. At his first ministerial press conference, Dr
Ramli signalled the urgent need to address key economic problems, including giving priority to selling
assets the Indonesian Bank Restructuring Agency, IBRA, took over after many private banks failed.
Some IBRA assets, principally those belonging to the Salim Group, now are being sold, but problems
have emerged with the purchase of other IBRA assets.
Although the interaction between politics and economics is complex, business can interpret the political
system’s progress in implementing economic reform over 2001 and 2002, using the key indicators
this report identifies.
��*��+����(���"�����))�*�#������
Unlike in other crisis affected economies, Indonesia’s foreign direct investment flows are still negative.
However, Indonesia’s foreign investment regime is more open than before the crisis and the foreign
investment outlook of export-oriented and import competing sectors is improving with the weaker
rupiah and stronger macroeconomic outlook. Sales of state held assets and enterprises also
should attract investors.
Post crisis foreign investment opportunities are more wide ranging, with few sectors precluding
100 per cent foreign owned firms. Already, foreigners can operate retail outlets, distribute goods
produced locally, and apply to import and distribute other products. Foreign investors also can enter
joint ventures for medical services and telecommunications. Agribusiness and most infrastructure
sectors also are open to foreign investors, although failure to resolve disputes with independent
power producers over Soeharto era contracts is reducing market confidence. In 2001 and beyond,
foreign banks should be able to purchase bank equity assets from IBRA’s sizeable holdings. Corporate
assets under IBRA’s control also will be sold. While these purchases can involve risks, buyers can
reduce these by commissioning independent audits to collaborate IBRA’s appraisals, completing
comprehensive due diligence assessments before acquiring assets, insuring for risk and monitoring
closely the Indonesian economic, political and institutional environment. New draft legislation before
the parliament would further liberalise the investment environment, but opposition to its passage
may be mounting.
�*�����))�*�#������
Since the financial crisis began, the Indonesian Government has accelerated trade reform. Indonesia
now is moving towards a liberal trade regime similar to Singapore’s or Hong Kong’s in the 1960s and
1970s. By mid 2000, 60 per cent of tariff lines had duties of 0 to 5 per cent, and more than 70 per cent
had tariffs of 10 per cent or less. The unweighted average tariff rate now is below 9 per cent. Only
1 per cent of all tariff lines have tariffs over 40 per cent. While major lines like completely knocked
down and fully built motor vehicles still have tariffs of 35 to 80 per cent, even these are down from
200 per cent. Significant non-tariff barriers, like the national car project, were removed after the crisis.

� � � � � � � � � � � � � � � � � � � �� � � � � � � � �
� �� � � ����
The Government also extended earlier programs to reduce tariffs on agricultural products; this
lowered the unweighted average tariff rate on agricultural products from 19 per cent in 1995 to
8.6 per cent in 1998. It removed many non-tariff barriers on agricultural imports, notably import
licensing requirements on commodities the national logistics agency, BULOG, controlled. This
liberalisation permits competitive imports and distribution of wheat, flour, sugar, soy beans and garlic.
However, some less competitive heavy industry sectors and broadacre farmers oppose further trade
liberalisation, and in some cases, want to reinstate trade barriers.
�#��*������������������#��������))�*�#������
Despite Indonesia’s financial crisis, Australia and Indonesia continue to enjoy a good commercial
relationship. Indonesia ranks as Australia’s tenth largest trading partner and bilateral trade is recovering.
Australian exports to Indonesia rose 18 per cent in the year to September 2000 to A$2.7 billion, but
still were 26 per cent below pre-crisis peaks. Australia’s share of Indonesia’s import market recovered
to 5.2 per cent during 1999. Before the crisis, Australia’s merchandise and services trade ran an
A$1.8 billion surplus with Indonesia, but since the crisis, strong growth in Indonesia’s exports to
Australia has shifted the trade balance to an A$780 million surplus in Indonesia’s favour.
The strong complementarity of the two economies, recent trade liberalisation, Indonesia’s growing
population, recovering disposable incomes and, currently, the weak Australian dollar vis-a-vis the
US dollar makes Indonesia a prospective growth market for Australian exporters. While the low value
of the rupiah has undermined many export markets, good opportunities exist in agricultural commodities
and manufactures, including motor vehicles, which now face much lower trade barriers. Service
exports, including education, financial and IT services, also are well placed to expand, as foreign
investment restrictions in these sectors decline and economic recovery continues. New direct foreign
investment opportunities in the export-oriented and SME sectors, and from Indonesian Government
asset sales, could deepen commercial links.
�#���������(�*��"���
The Indonesian business environment is changing as the Government implements reforms. New
commercial legislation and regulations, sales of major conglomerates and rising levels of foreign
investment eventually could reshape the corporate environment. However, despite these changes,
Indonesian business culture will continue to emphasise relationships, hierarchy and the local
community. Businesses understanding and working with these features of the business environment
are more likely to succeed.
In most sectors, foreign investors no longer need to enter joint ventures; their business ownership
and management options are wider. However, knowledge of the local business environment is important
to investors choosing between establishing a 100 per cent foreign owned business or entering a joint
venture. Local partners can bring access to distribution and bureaucratic channels, create greater
acceptability in the local community and assist new entrants with cultural and language issues.
However, local agencies, legal notaries and business consultants also can provide some of these
services, and 100 per cent foreign ownership can give greater managerial flexibility.
� # � � $ � % & � � � $ � � � ! "
� ��� � �
���������� ����*�����*#��#*��+
The new banking sector has fewer banks, more stringent capitalisation requirements and tighter
bank supervision, especially of lending practices. These changes, based on international best practice,
should strengthen financial sector foundations. The performance of the newly recapitalised private
sector banks improved during 2000, and lending expanded modestly. While banks must raise their
capital adequacy ratios from 4 to 8 per cent by the end of 2001, the capital adequacy of the seven
recapitalised private banks averaged over 11 per cent by mid 2000. Most private banks also are
provisioned against potential losses from remaining non-performing loans. State banks, which hold
most bank deposits, should be recapitalised by the end of 2000. However, state banks have
lower capital adequacy ratios, hold most non-performing loans and have undergone only limited
operational restructuring.
Non-performing loan levels remain high at 30 per cent, and banks remain weak by international
standards. The slow pace and inadequate operational restructuring involved in some recent corporate
debt workouts could cause problems for recapitalised banks, as restructured loans may become
non-performing again. Furthermore, most banks prefer to hold sovereign bonds rather than expand
corporate lending in the current environment where many corporate borrowers are not servicing
their loans.
The Government’s efforts to refinance, restructure and reform Indonesia’s financial sector have
generated many opportunities for foreign financial service suppliers; ongoing debt workouts will
continue to require these skills. To encourage new market entrants, the Government has relaxed
foreign investment laws in the financial sector, and while sales stalled in 2000, it has affirmed it
intends to complete sales of its holdings of restructured loans and bank and corporate assets before
2004. In the medium term, new prudential standards and the need for improved risk and credit
management systems also generate opportunities for professional service providers in these areas.
��*)�*��������*#��#*��+
IBRA estimates a large share of the Indonesian corporate sector is insolvent. Of the loans large
corporates owe, at least three quarters are distressed and need restructuring. In late 2000, corporate
debt restructuring was accelerating, although concerns about its depth remain. In September 2000,
IBRA reported it had resolved 40 per cent of its credits with the top 21 debtors, which totalled
Rp. 87 trillion (US$10 billion) through agreed restructuring or legal action. By mid September 2000,
the Jakarta Initiative Task Force also had restructured 25 cases involving around US$5 billion of
debt, out of 51 cases worth US$10 billion actively engaged in mediation. However, operational
restructuring may be less than optimal with most workouts involving long grace periods before
repayments resume, lower interest rates and debt equity swaps, rather than debt write offs and
management changes.

� � � � � � � � � � � � � � � � � � � �� � � � � � � � �
���� �
The Government recognises that to avoid another banking crisis, banks and corporates must improve
their corporate governance and have better incentives to manage risk and improve investment
efficiency. The Government is upgrading prudential supervision, and firms must adopt international
standards in reporting their financial positions. However, developing strong supervision skills and
capacity involves a long term commitment. Commercial court reforms gradually are improving how
new bankruptcy laws are implemented, although this also is a long term process. Eventually, harsher
penalties for illegal commercial activity, increased foreign and local competition, and new accounting
requirments should lift the corporate governance standards of large conglomerates and state enterprises.
�����+
Indonesia’s highly prospective mining sector, with world class reserves in leading minerals, oil,
petroleum, coal and gas, significantly contributes to GDP and exports. It also helped buffer the economy
during the crisis. However, the mining sector’s investment environment has changed significantly
since the financial crisis. Now four challenges confront the mining sector: political decentralisation,
as most mines are in regional Indonesia; social stability in some regional areas; increased illegal
mining; and stringent new environmental standards and forestry regulations. In the long term, political
devolution may make government more responsive to local population and investor needs, but in the
short term, it generates uncertainty for investors. The challenges highlight the importance of building
strong relationships between mining firms, all three levels of government, landowners and local
communities.
Foreign companies contribute significantly to mining sector activity, with their investment in Indonesia
exceeding US$10 billion in the last three decades. Australian firms account for about one third of
foreign investment approvals in this sector and are well placed to use their mining expertise and
geographical proximity to help Indonesia develop its mineral resources. Opportunities include assessing
and extracting resources, refining and distributing mineral output, and exporting mining related
equipment, supplies, training and other services.
�+*��#��#*�
Since 1998, Indonesia has liberalised significantly its agricultural trade and investment regimes;
eventually, this should promote a more efficient use of agricultural land and resources, which will
raise rural incomes. Agriculture makes a shrinking but still important contribution to the economy,
generating under 20 per cent of GDP but over 40 per cent of employment. Agricultural productivity
often is below world averages and invariably is below world best practice. However, the Government’s
new ten point plan prioritises raising agricultural productivity and farmers’ welfare. Along with programs
to increase rural credit facilities, infrastructure and agricultural extension services, trade and investment
reforms should support this objective.
Significantly lower tariff and non-tariff barriers for key agricultural commodities also will benefit
Australian agricultural exporters, and more efficient agricultural policies should generate opportunities
for agricultural equipment and services exporters. Mid 1998 reforms liberalised foreign investor
participation in plantations, freshwater fisheries, milk processing and agricultural product distribution.
� # � � $ � % & � � � $ � � � ! "
� ��� � �
Several regional areas offer good opportunities for agribusiness investment, usually based on
technology transfer. Consequently, in 1999, Indonesian agribusiness and food sectors attracted
significant foreign investment applications.
�")���������
Indonesia’s large population, strong growth potential, geographic proximity and economic
complementarity ensure its commercial partnership with Australia will remain important. These features
also mean maintaining strong political and strategic ties are an important foreign policy priority for
Australia. As Indonesia becomes a more democratic civil society and recovers from the financial
crisis, Australia has strong reasons to offer effective support for this challenging process.
Economic recovery, post crisis trade and investment liberalisation, the competitive Australian dollar
and IBRA asset sales are generating some significant commercial opportunities in Indonesia for
Australian business. While the rupiah’s low value depresses overall imports, trade and investment
reforms offer potential to expand traditional and new export markets in agricultural commodities,
manufactures and educational, financial, IT and health services. Investment opportunities also are
emerging in export-oriented manufacturing and in financial, retailing, tourism and infrastructure sectors
through IBRA asset sales. While risks remain high, careful due diligence and appropriate risk
management can reduce investor exposure.
Throughout the post crisis period, strong commercial and people-to-people links between Australia
and Indonesia have supported the bilateral relationship. Promoting the commercial relationship and
increasing productive, development enhancing people-to-people links are important in strengthening
ties between the two countries. Promoting viable Australian direct investment in Indonesia would
help deepen the long term bilateral commercial relationship.
The Australian Government can increase Australian business awareness of opportunities by organising
and leading Australian business delegations to Indonesia, and encouraging capital flows by helping
to enhance Indonesian prudential and corporate governance by offering opportunities for Indonesians
and government and private sector institutions to learn from Australia’s own experience in this area.
Continuing to develop people-to-people links through educational institution cooperation, student
and young worker exchanges and promoting private-public sector cooperation on Australian sponsored
economic governance strengthening projects in Indonesia also are valuable means of strengthening
and deepening bilateral ties. Longer term partnerships between major Australian and Indonesian
public sector institutions providing economic governance could enhance the effectiveness of Australia’s
already substantial economic governance assistance program in Indonesia. Such partnerships could
help Indonesia strengthen its economic governance capacity, as well as deepen productive long
term ties between the two countries’ institutions.
Assuming Indonesia’s economic recovery and reform continues and the political environment remains
stable, Australian business would be well advised to carefully examine new trade and investment
opportunities with a view to identifying profitable strategic positions in the Indonesian market.

� � � � � � � � � � � � � � � � � � � �� � � � � � � � �
� ��� � ��

� � � � � � � �
�� �
������������������
��������
• The 1997 financial crisis interrupted two decades of impressive
economic growth, which lifted Indonesia’s per capita income from
US$310 in 1976 to US$1 144 in 1996.
• After contracting sharply in 1998, Indonesia’s economy returned to
positive growth in 2000 led by stimulatory macroeconomic policy,
a low exchange rate, stable prices, lower interest rates and stronger
private consumption. Export-oriented and small and medium
enterprises, SMEs, have grown well since the crisis.
• GDP should grow by about 5 per cent in 2000 and at least 4 per cent
in 2001. Indonesia’s short term recovery prospects therefore are
relatively good.
• Strong growth beyond 2001 requires investment in new capacity.
The Government’s new Ten Point Recovery Program recognises the
importance of repairing the banking sector and restructuring the large
stock of debt major corporates currently owe, to ensure new
investment can occur.
• The Government also is implementing a new framework of bank and
corporate governance to reduce the economy’s vulnerability to
another financial crisis. Progress in these areas will determine
medium to long term economic prospects.
• The Government’s economic reform program is opening up new
opportunities for Australian business through selling assets currently
held by the Indonesian Bank Restructuring Agency, lowering barriers
to investing in most sectors and liberalising trade.
• Investors should remain well informed about developments in key
government reform areas, including corporate debt and bank
restructuring, corporate governance, devolution and legal reform.
These developments could guide decisions on when to best invest
in Indonesia.
� � � � � � � � � � � � � � � � � � � � � � � � �
�� ��
Throughout 1999, Indonesian authorities stabilised inflation and the exchange rate, enabling the
economy to rebound from the deep recession of 1998. Slowly increasing consumption, relaxed
monetary and fiscal policy, and a low exchange rate expanding exports are driving a modest expansion
in gross domestic product, GDP. Lifted by strong growth in the September quarter, GDP should
increase by close to 5 per cent in 2000, with an increase of at least 4 per cent likely in 2001. While
this is less than growth in most other crisis affected economies in Asia, it is a marked improvement
on 1998 economic performance when output fell 13 per cent, and 1999, when growth was negligible.
These forecasts indicate the environment and prospects for Australian exporters and investors are
improving.
Export-oriented and smaller firms less affected by the financial crisis increasingly drive much of the
recovery, benefiting from the low exchange rate, their lower reliance on the banking system and
recovering consumption. However, the Government recognises a recovery in investment is essential
for Indonesia to regain pre-crisis growth (Coordinating Ministry for Economic Affairs, 2000).
The Government is attempting to restructure bank and corporate sector balance sheets damaged
during the crisis, improve corporate and banking sector governance, and strengthen legal and
economic institutions. While economic recovery is still fragile, this reform process also should present
major new opportunities to Australian business, especially through the sale of corporate and banking
assets, which the Government recently took over. (See Chapter 3 - Foreign Investment.)
This chapter first analyses the nature of the current recovery, and the relatively favourable outlook for
short term growth, focusing on its sustainability. It then considers medium to long term growth
prospects. To do this, it examines the continuing legacy of the crisis, highlighting the impact of economic
governance in the financial, corporate and public sectors, and briefly examines government efforts to
sustain the recovery by addressing bank and corporate sector insolvency. Finally, the chapter assesses
the implications of this outlook for Australian business and the new opportunities it provides.
� � � � � � � � � � � � � � � � � � � �
�� �
����������������� �������
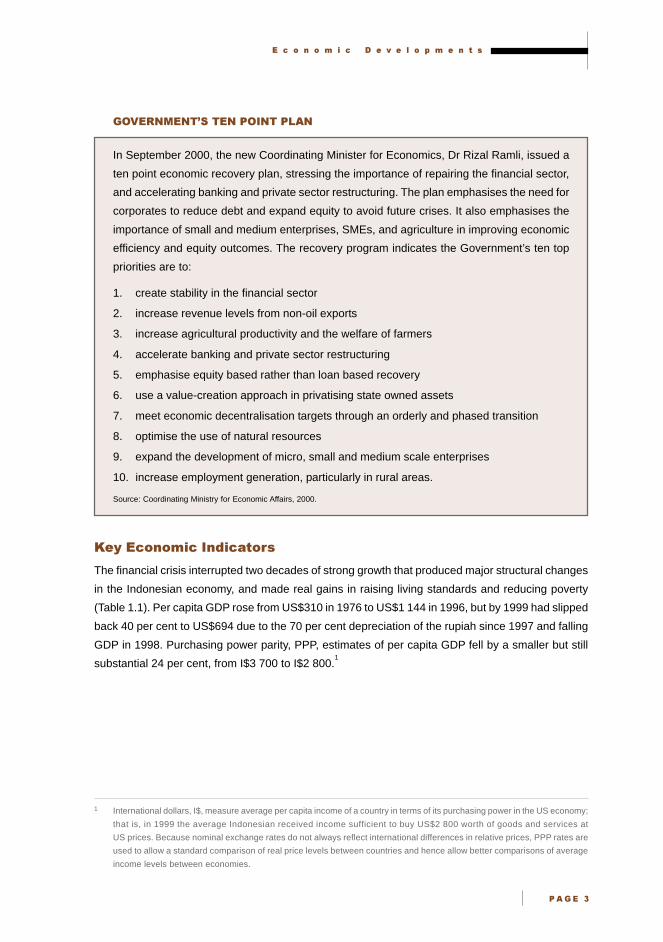
In September 2000, the new Coordinating Minister for Economics, Dr Rizal Ramli, issued a
ten point economic recovery plan, stressing the importance of repairing the financial sector,
and accelerating banking and private sector restructuring. The plan emphasises the need for
corporates to reduce debt and expand equity to avoid future crises. It also emphasises the
importance of small and medium enterprises, SMEs, and agriculture in improving economic
efficiency and equity outcomes. The recovery program indicates the Government’s ten top
priorities are to:
1. create stability in the financial sector
2. increase revenue levels from non-oil exports
3. increase agricultural productivity and the welfare of farmers
4. accelerate banking and private sector restructuring
5. emphasise equity based rather than loan based recovery
6. use a value-creation approach in privatising state owned assets
7. meet economic decentralisation targets through an orderly and phased transition
8. optimise the use of natural resources
9. expand the development of micro, small and medium scale enterprises
10. increase employment generation, particularly in rural areas.
Source: Coordinating Ministry for Economic Affairs, 2000.
�����������������������
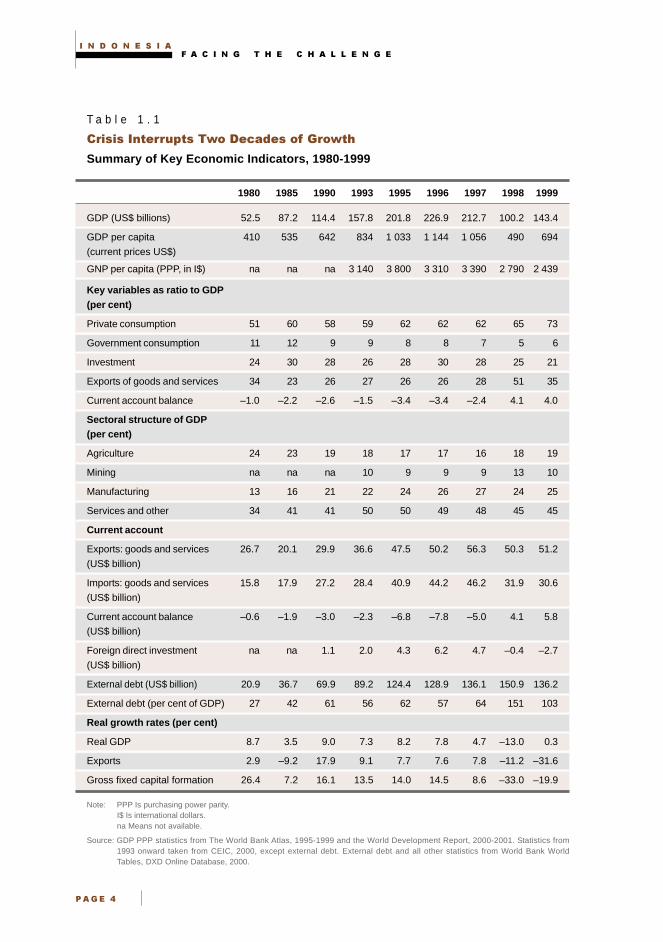
The financial crisis interrupted two decades of strong growth that produced major structural changes
in the Indonesian economy, and made real gains in raising living standards and reducing poverty
(Table 1.1). Per capita GDP rose from US$310 in 1976 to US$1 144 in 1996, but by 1999 had slipped
back 40 per cent to US$694 due to the 70 per cent depreciation of the rupiah since 1997 and falling
GDP in 1998. Purchasing power parity, PPP, estimates of per capita GDP fell by a smaller but still
substantial 24 per cent, from I$3 700 to I$2 800.1
1 International dollars, I$, measure average per capita income of a country in terms of its purchasing power in the US economy;
that is, in 1999 the average Indonesian received income sufficient to buy US$2 800 worth of goods and services at
US prices. Because nominal exchange rates do not always reflect international differences in relative prices, PPP rates are
used to allow a standard comparison of real price levels between countries and hence allow better comparisons of average
income levels between economies.
� � � � � � � � � � � � � � � � � � � � � � � � �
�� �!
T a b l e 1 . 1
�� � ���������������������������������
Summary of Key Economic Indicators, 1980-1999
1980 1985 1990 1993 1995 1996 1997 1998 1999
GDP (US$ billions) 52.5 87.2 114.4 157.8 201.8 226.9 212.7 100.2 143.4
GDP per capita 410 535 642 834 1 033 1 144 1 056 490 694
(current prices US$)
GNP per capita (PPP, in I$) na na na 3 140 3 800 3 310 3 390 2 790 2 439
Key variables as ratio to GDP(per cent)
Private consumption 51 60 58 59 62 62 62 65 73
Government consumption 11 12 9 9 8 8 7 5 6
Investment 24 30 28 26 28 30 28 25 21
Exports of goods and services 34 23 26 27 26 26 28 51 35
Current account balance –1.0 –2.2 –2.6 –1.5 –3.4 –3.4 –2.4 4.1 4.0
Sectoral structure of GDP(per cent)
Agriculture 24 23 19 18 17 17 16 18 19
Mining na na na 10 9 9 9 13 10
Manufacturing 13 16 21 22 24 26 27 24 25
Services and other 34 41 41 50 50 49 48 45 45
Current account
Exports: goods and services 26.7 20.1 29.9 36.6 47.5 50.2 56.3 50.3 51.2
(US$ billion)
Imports: goods and services 15.8 17.9 27.2 28.4 40.9 44.2 46.2 31.9 30.6
(US$ billion)
Current account balance –0.6 –1.9 –3.0 –2.3 –6.8 –7.8 –5.0 4.1 5.8
(US$ billion)
Foreign direct investment na na 1.1 2.0 4.3 6.2 4.7 –0.4 –2.7
(US$ billion)
External debt (US$ billion) 20.9 36.7 69.9 89.2 124.4 128.9 136.1 150.9 136.2
External debt (per cent of GDP) 27 42 61 56 62 57 64 151 103
Real growth rates (per cent)
Real GDP 8.7 3.5 9.0 7.3 8.2 7.8 4.7 –13.0 0.3
Exports 2.9 –9.2 17.9 9.1 7.7 7.6 7.8 –11.2 –31.6
Gross fixed capital formation 26.4 7.2 16.1 13.5 14.0 14.5 8.6 –33.0 –19.9
Note: PPP Is purchasing power parity.I$ Is international dollars.na Means not available.
Source: GDP PPP statistics from The World Bank Atlas, 1995-1999 and the World Development Report, 2000-2001. Statistics from1993 onward taken from CEIC, 2000, except external debt. External debt and all other statistics from World Bank WorldTables, DXD Online Database, 2000.
� � � � � � � � � � � � � � � � � � � �
�� �"
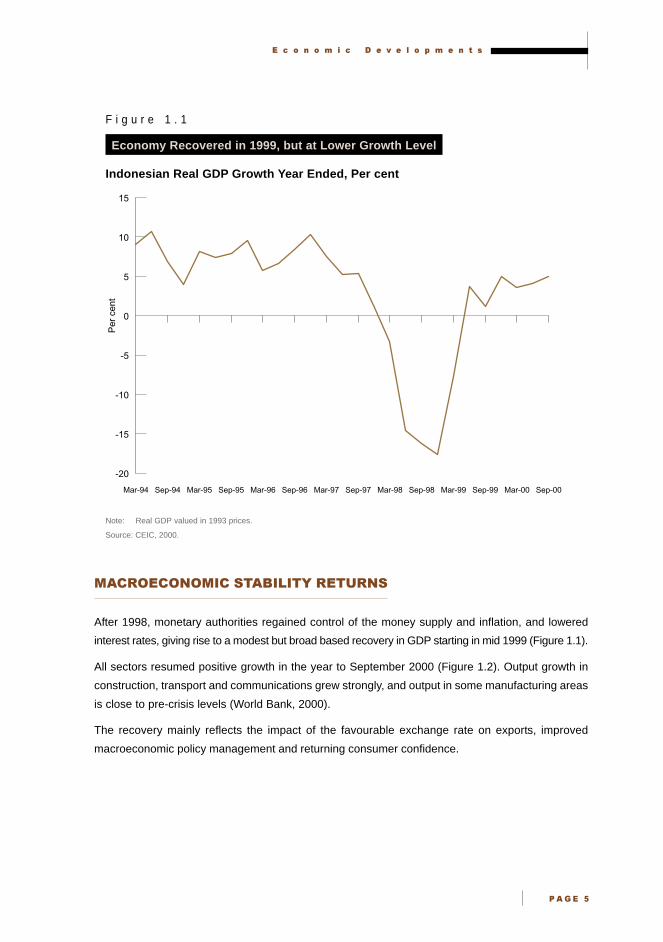
F i g u r e 1 . 1
Economy Recovered in 1999, but at Lower Growth Level
Indonesian Real GDP Growth Year Ended, Per cent
Note: Real GDP valued in 1993 prices.
Source: CEIC, 2000.
�������������� ��������������
After 1998, monetary authorities regained control of the money supply and inflation, and lowered
interest rates, giving rise to a modest but broad based recovery in GDP starting in mid 1999 (Figure 1.1).
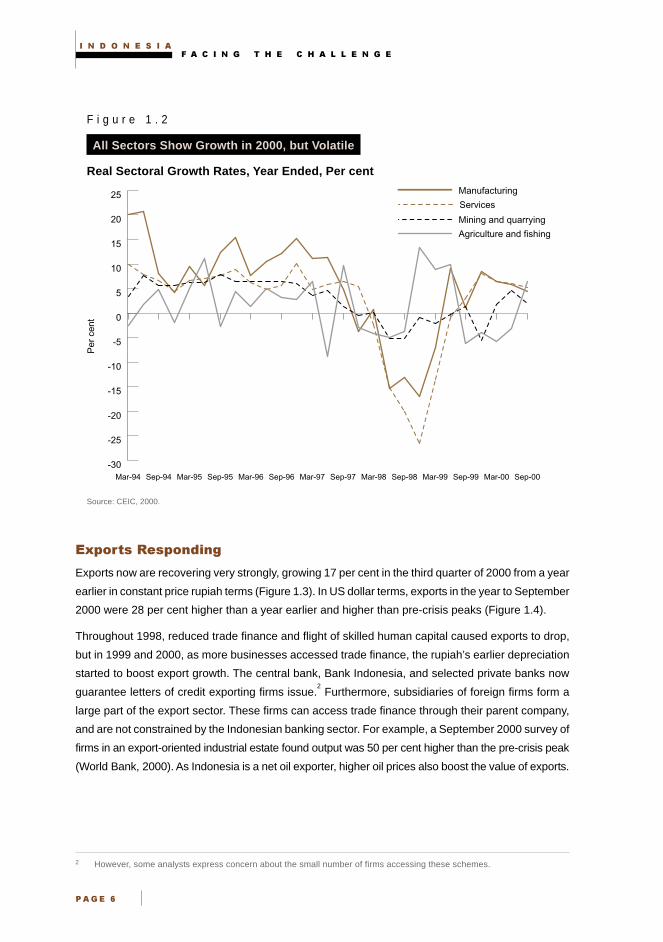
All sectors resumed positive growth in the year to September 2000 (Figure 1.2). Output growth in
construction, transport and communications grew strongly, and output in some manufacturing areas
is close to pre-crisis levels (World Bank, 2000).
The recovery mainly reflects the impact of the favourable exchange rate on exports, improved
macroeconomic policy management and returning consumer confidence.
-20
-15
-10
-5
0
5
10
15
Sep-00Mar-00Sep-99Mar-99Sep-98Mar-98Sep-97Mar-97Sep-96Mar-96Sep-95Mar-95Sep-94Mar-94
Per
cen
t
� � � � � � � � � � � � � � � � � � � � � � � � �
�� �#
F i g u r e 1 . 2
All Sectors Show Growth in 2000, but Volatile
Real Sectoral Growth Rates, Year Ended, Per cent
Source: CEIC, 2000.
� !��������!�����"
Exports now are recovering very strongly, growing 17 per cent in the third quarter of 2000 from a year
earlier in constant price rupiah terms (Figure 1.3). In US dollar terms, exports in the year to September
2000 were 28 per cent higher than a year earlier and higher than pre-crisis peaks (Figure 1.4).
Throughout 1998, reduced trade finance and flight of skilled human capital caused exports to drop,
but in 1999 and 2000, as more businesses accessed trade finance, the rupiah’s earlier depreciation
started to boost export growth. The central bank, Bank Indonesia, and selected private banks now
guarantee letters of credit exporting firms issue.2 Furthermore, subsidiaries of foreign firms form a
large part of the export sector. These firms can access trade finance through their parent company,
and are not constrained by the Indonesian banking sector. For example, a September 2000 survey of
firms in an export-oriented industrial estate found output was 50 per cent higher than the pre-crisis peak
(World Bank, 2000). As Indonesia is a net oil exporter, higher oil prices also boost the value of exports.
2 However, some analysts express concern about the small number of firms accessing these schemes.
-30
-25
-20
-15
-10
-5
0
5
10
15
20
25Services
Manufacturing
Mining and quarrying
Agriculture and fishing
Sep-00Mar-00Sep-99Mar-99Sep-98Mar-98Sep-97Mar-97Sep-96Mar-96Sep-95Mar-95Sep-94Mar-94
Per
cen
t
� � � � � � � � � � � � � � � � � � � �
�� �$
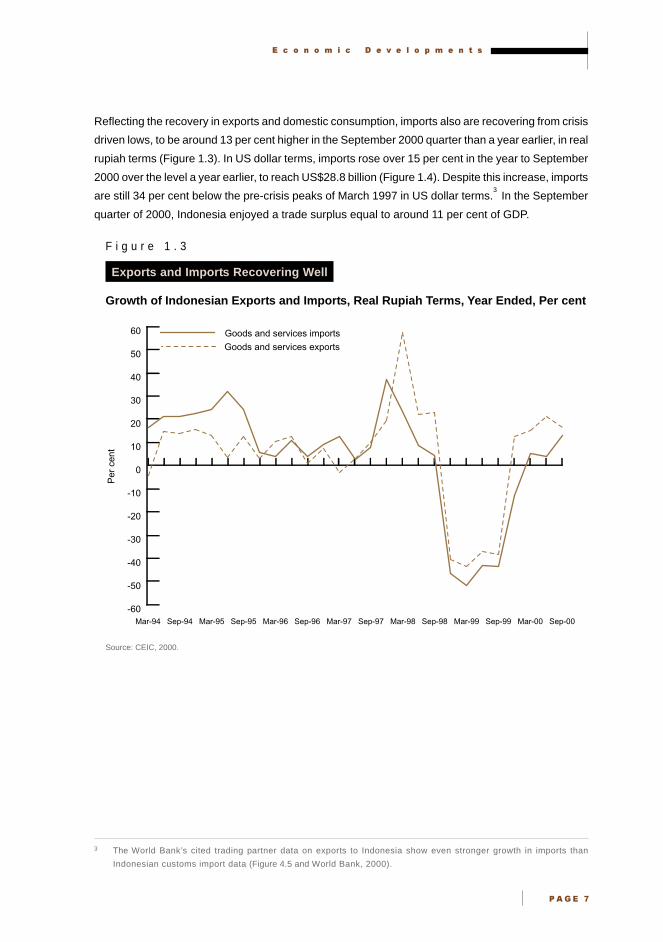
Reflecting the recovery in exports and domestic consumption, imports also are recovering from crisis
driven lows, to be around 13 per cent higher in the September 2000 quarter than a year earlier, in real
rupiah terms (Figure 1.3). In US dollar terms, imports rose over 15 per cent in the year to September
2000 over the level a year earlier, to reach US$28.8 billion (Figure 1.4). Despite this increase, imports
are still 34 per cent below the pre-crisis peaks of March 1997 in US dollar terms.3 In the September
quarter of 2000, Indonesia enjoyed a trade surplus equal to around 11 per cent of GDP.
F i g u r e 1 . 3
Exports and Imports Recovering Well
Growth of Indonesian Exports and Imports, Real Rupiah Terms, Year Ended, Per cent
Source: CEIC, 2000.
3 The World Bank’s cited trading partner data on exports to Indonesia show even stronger growth in imports than
Indonesian customs import data (Figure 4.5 and World Bank, 2000).
-60
-50
-40
-30
-20
-10
0
10
20
30
40
50
60 Goods and services imports Goods and services exports
Sep-00Mar-00Sep-99Mar-99Sep-98Mar-98Sep-97Mar-97Sep-96Mar-96Sep-95Mar-95Sep-94Mar-94
Per
cen
t
� � � � � � � � � � � � � � � � � � � � � � � � �
�� �%
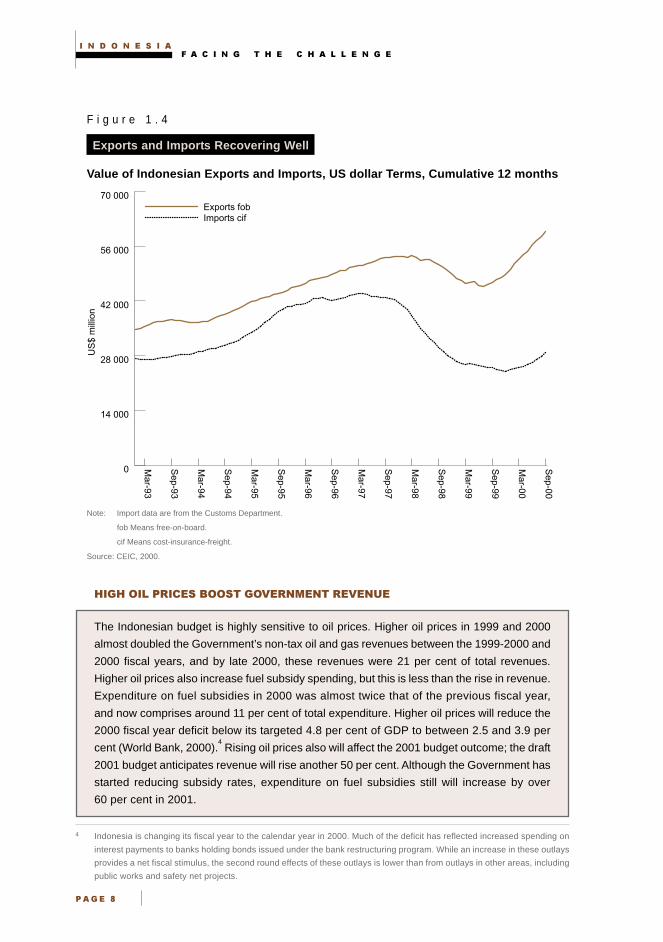
F i g u r e 1 . 4
Exports and Imports Recovering Well
Value of Indonesian Exports and Imports, US dollar Terms, Cumulative 12 months
Note: Import data are from the Customs Department.
fob Means free-on-board.
cif Means cost-insurance-freight.
Source: CEIC, 2000.
� ���� ���� ��������������������������
The Indonesian budget is highly sensitive to oil prices. Higher oil prices in 1999 and 2000
almost doubled the Government’s non-tax oil and gas revenues between the 1999-2000 and
2000 fiscal years, and by late 2000, these revenues were 21 per cent of total revenues.
Higher oil prices also increase fuel subsidy spending, but this is less than the rise in revenue.
Expenditure on fuel subsidies in 2000 was almost twice that of the previous fiscal year,
and now comprises around 11 per cent of total expenditure. Higher oil prices will reduce the
2000 fiscal year deficit below its targeted 4.8 per cent of GDP to between 2.5 and 3.9 per
cent (World Bank, 2000).4 Rising oil prices also will affect the 2001 budget outcome; the draft
2001 budget anticipates revenue will rise another 50 per cent. Although the Government has
started reducing subsidy rates, expenditure on fuel subsidies still will increase by over
60 per cent in 2001.
4 Indonesia is changing its fiscal year to the calendar year in 2000. Much of the deficit has reflected increased spending on
interest payments to banks holding bonds issued under the bank restructuring program. While an increase in these outlays
provides a net fiscal stimulus, the second round effects of these outlays is lower than from outlays in other areas, including
public works and safety net projects.
US
$ m
illio
n
0
14 000
28 000
42 000
56 000
70 000Exports fobImports cif
Sep-00
Mar-00
Sep-99
Mar-99
Sep-98
Mar-98
Sep-97
Mar-97
Sep-96
Mar-96
Sep-95
Mar-95
Sep-94
Mar-94
Sep-93
Mar-93
� � � � � � � � � � � � � � � � � � � �
�� �&
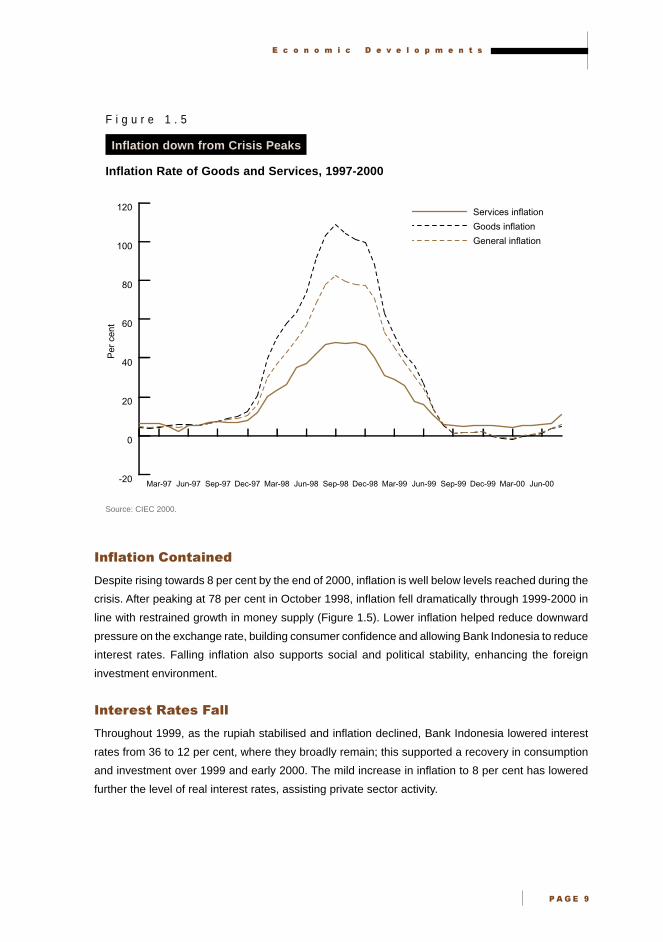
F i g u r e 1 . 5
Inflation down from Crisis Peaks
Inflation Rate of Goods and Services, 1997-2000
Source: CIEC 2000.
��#$���������������
Despite rising towards 8 per cent by the end of 2000, inflation is well below levels reached during the
crisis. After peaking at 78 per cent in October 1998, inflation fell dramatically through 1999-2000 in
line with restrained growth in money supply (Figure 1.5). Lower inflation helped reduce downward
pressure on the exchange rate, building consumer confidence and allowing Bank Indonesia to reduce
interest rates. Falling inflation also supports social and political stability, enhancing the foreign
investment environment.
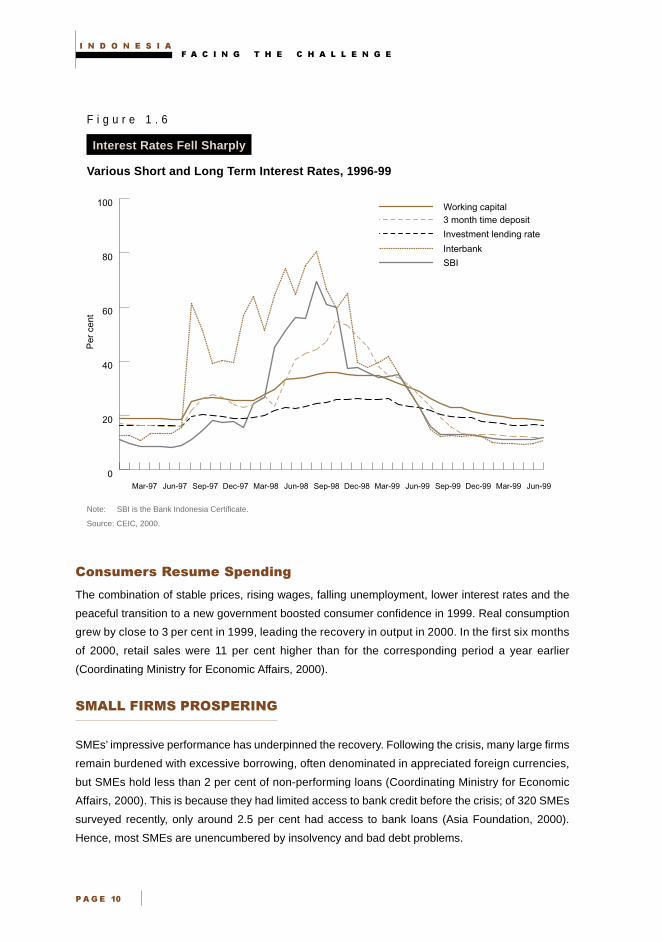
���������������%�$$
Throughout 1999, as the rupiah stabilised and inflation declined, Bank Indonesia lowered interest
rates from 36 to 12 per cent, where they broadly remain; this supported a recovery in consumption
and investment over 1999 and early 2000. The mild increase in inflation to 8 per cent has lowered
further the level of real interest rates, assisting private sector activity.
-20
0
20
40
60
80
100
120 Services inflation
Goods inflation
General inflation
Jun-00Mar-00Dec-99Sep-99Jun-99Mar-99Dec-98Sep-98Jun-98Mar-98Dec-97Sep-97Jun-97Mar-97
Per
cen
t
� � � � � � � � � � � � � � � � � � � � � � � � �
�� �'
F i g u r e 1 . 6
Interest Rates Fell Sharply
Various Short and Long Term Interest Rates, 1996-99
Note: SBI is the Bank Indonesia Certificate.
Source: CEIC, 2000.
����&��������&��� !�����"
The combination of stable prices, rising wages, falling unemployment, lower interest rates and the
peaceful transition to a new government boosted consumer confidence in 1999. Real consumption
grew by close to 3 per cent in 1999, leading the recovery in output in 2000. In the first six months
of 2000, retail sales were 11 per cent higher than for the corresponding period a year earlier
(Coordinating Ministry for Economic Affairs, 2000).
���%��� ���� �����'
SMEs’ impressive performance has underpinned the recovery. Following the crisis, many large firms
remain burdened with excessive borrowing, often denominated in appreciated foreign currencies,
but SMEs hold less than 2 per cent of non-performing loans (Coordinating Ministry for Economic
Affairs, 2000). This is because they had limited access to bank credit before the crisis; of 320 SMEs
surveyed recently, only around 2.5 per cent had access to bank loans (Asia Foundation, 2000).
Hence, most SMEs are unencumbered by insolvency and bad debt problems.
0
20
40
60
80
100
SBI
Interbank
3 month time deposit
Investment lending rate
Working capital
Jun-99Mar-99Dec-99Sep-99Jun-99Mar-99Dec-98Sep-98Jun-98Mar-98Dec-97Sep-97Jun-97Mar-97
Per
cen
t
� � � � � � � � � � � � � � � � � � � �
�� �
Mostly, SMEs are supplying recovering domestic demand. Output from small domestically oriented
firms recovered strongly in 2000 in response to the pick up in local consumption, and the low
exchange rate helped small export-oriented firms during 1999 (Asia Foundation, 2000).5
However, constraints in accessing capital are likely to limit SME output growth. Internally generated
funds finance most SME investment, and this limits scope for rapid expansion. A recent survey
indicated almost 50 per cent of the garment manufacturers in Central Java and nearly 75 per cent of
furniture producers in South Sulawesi interviewed, were constrained financially (Asia Foundation, 2000).
To boost their output since the crisis, SMEs have cooperated to obtain finance, as well as access to
raw materials, production processes and marketing (Asia Foundation, 2000). While the Government’s
ten point plan prioritises SME development, recognising the need for credit schemes and other
facilities, it also acknowledges repairing the large corporate sector is central to restoring medium
term economic growth (Coordinating Ministry for Economic Affairs, 2000).
�������� ������������������ (��������
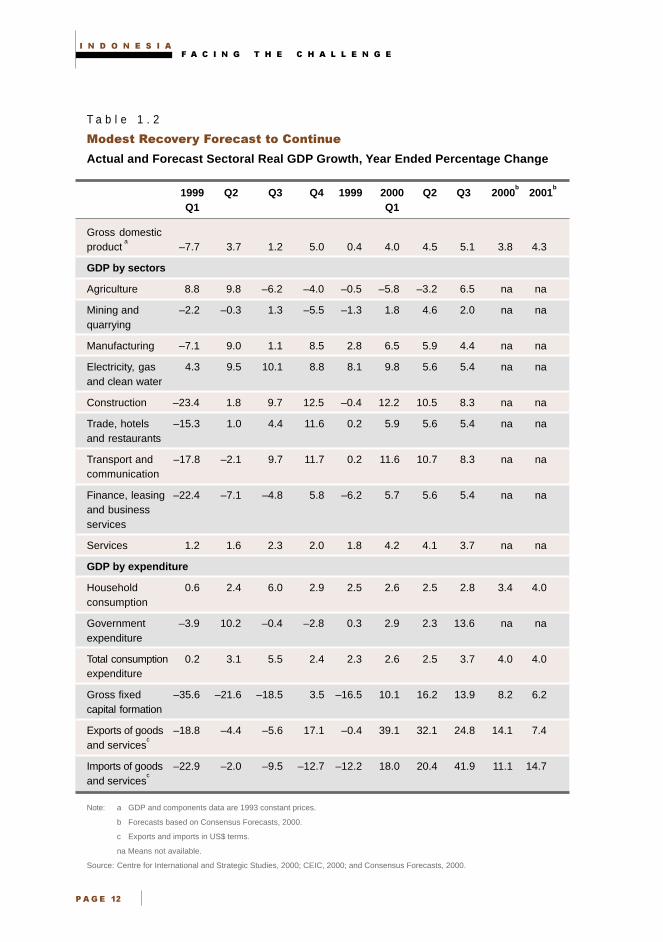
The relatively stable macroeconomic environment and weak rupiah should ensure the economy
continues to expand in the short to medium term. The Indonesian Government and IMF forecast
GDP will grow by between 4.5 and 5 per cent during 2000 (Table 1.2). Private sector economists
currently forecast 3.8 per cent growth in real GDP in 2000 and 4.3 per cent in 2001 (Consensus
Forecasts, 2000). GDP data for the September quarter suggest 2000 growth will be closer to 5 per
cent, and 2001 growth could be more than 4 per cent.
As real GDP is still about 10 per cent below its pre-crisis level and unused capacity remains high,
except in rapidly growing export sectors, modest short term GDP growth could occur in 2001 without
much new investment, but will be constrained after that if investment does not recover. Forecast
growth levels, while modest, should improve the environment for foreign investors and boost trade flows.
5 These firms included Balinese furniture makers and garment producers in West Sumatra. However, as the exchange rate
appreciated and stabilised in 1999, growth in these firms’ output moderated.
� � � � � � � � � � � � � � � � � � � � � � � � �
�� ��
T a b l e 1 . 2
�������������� �!��������������� ���
Actual and Forecast Sectoral Real GDP Growth, Year Ended Percentage Change
1999 Q2 Q3 Q4 1999 2000 Q2 Q3 2000b
2001b
Q1 Q1
Gross domesticproduct
a–7.7 3.7 1.2 5.0 0.4 4.0 4.5 5.1 3.8 4.3
GDP by sectors
Agriculture 8.8 9.8 –6.2 –4.0 –0.5 –5.8 –3.2 6.5 na na
Mining and –2.2 –0.3 1.3 –5.5 –1.3 1.8 4.6 2.0 na naquarrying
Manufacturing –7.1 9.0 1.1 8.5 2.8 6.5 5.9 4.4 na na
Electricity, gas 4.3 9.5 10.1 8.8 8.1 9.8 5.6 5.4 na naand clean water
Construction –23.4 1.8 9.7 12.5 –0.4 12.2 10.5 8.3 na na
Trade, hotels –15.3 1.0 4.4 11.6 0.2 5.9 5.6 5.4 na naand restaurants
Transport and –17.8 –2.1 9.7 11.7 0.2 11.6 10.7 8.3 na nacommunication
Finance, leasing –22.4 –7.1 –4.8 5.8 –6.2 5.7 5.6 5.4 na naand businessservices
Services 1.2 1.6 2.3 2.0 1.8 4.2 4.1 3.7 na na
GDP by expenditure
Household 0.6 2.4 6.0 2.9 2.5 2.6 2.5 2.8 3.4 4.0consumption
Government –3.9 10.2 –0.4 –2.8 0.3 2.9 2.3 13.6 na naexpenditure
Total consumption 0.2 3.1 5.5 2.4 2.3 2.6 2.5 3.7 4.0 4.0expenditure
Gross fixed –35.6 –21.6 –18.5 3.5 –16.5 10.1 16.2 13.9 8.2 6.2capital formation
Exports of goods –18.8 –4.4 –5.6 17.1 –0.4 39.1 32.1 24.8 14.1 7.4and services
c
Imports of goods –22.9 –2.0 –9.5 –12.7 –12.2 18.0 20.4 41.9 11.1 14.7and services
c
Note: a GDP and components data are 1993 constant prices.
b Forecasts based on Consensus Forecasts, 2000.
c Exports and imports in US$ terms.
na Means not available.
Source: Centre for International and Strategic Studies, 2000; CEIC, 2000; and Consensus Forecasts, 2000.
� � � � � � � � � � � � � � � � � � � �
�� �
Consumer spending should continue to support economic expansion in 2000 and 2001, boosting
durable goods sales (Danareksa Research, 2000).6 Private sector economists forecast private
consumption should expand by close to 4 per cent in 2000 and 2001. This will continue to underpin
modest GDP growth. Indonesian exports also should continue to expand with the lower rupiah and
more accessible trade finance. Private sector economists forecast exports will increase by almost
15 per cent in 2000 and about 7 per cent in 2001 (Table 1.2 and Consensus Forecasts, 2000).
Macroeconomic policy, on balance, should support expanding demand, creating a more positive
outlook for foreign investment and trade. Despite the impact of higher oil prices, fiscal policy should
provide a small stimulus in 2000, although its flow on effects will be limited. The increase in inflation
towards the end of 2000 may require Bank Indonesia to tighten monetary policy, raising interest rates
to defend its inflation target of 5 to 7 per cent; this may dampen growth. A recent acceleration in
wages and depreciation in the rupiah pose added risks to inflation in early 2001. Nevertheless, the
economy’s large excess capacity suggests additional rises in inflation should be limited, and any
interest rate increases by Bank Indonesia should be too moderate to derail the recovery.7
By 2001, increasing demand probably will deplete stocks in the manufacturing sector, boosting
production and absorbing excess capacity. Probably by late 2001 and 2002, higher production levels
will require investment in new facilities across the economy. Economic performance then will depend
on how successfully the government restructures corporate debt, so the banking system can resume
lending.
�'�����%��(����� � �������
The financial crisis affected Indonesia’s economy significantly more than other East Asian economies
(International Monetary Fund, 2000a). Weak banking sector regulation and easy access to foreign
credit at a fixed exchange rate led to a build up of foreign liabilities, making Indonesia vulnerable to
deteriorating international investor sentiment. Implicit government guarantees of bank deposits,
a fixed exchange rate, lack of bank supervision and poor incentives for sound corporate investment,
all contributed to this exposure. When confidence in the economic structure of some Asian economies
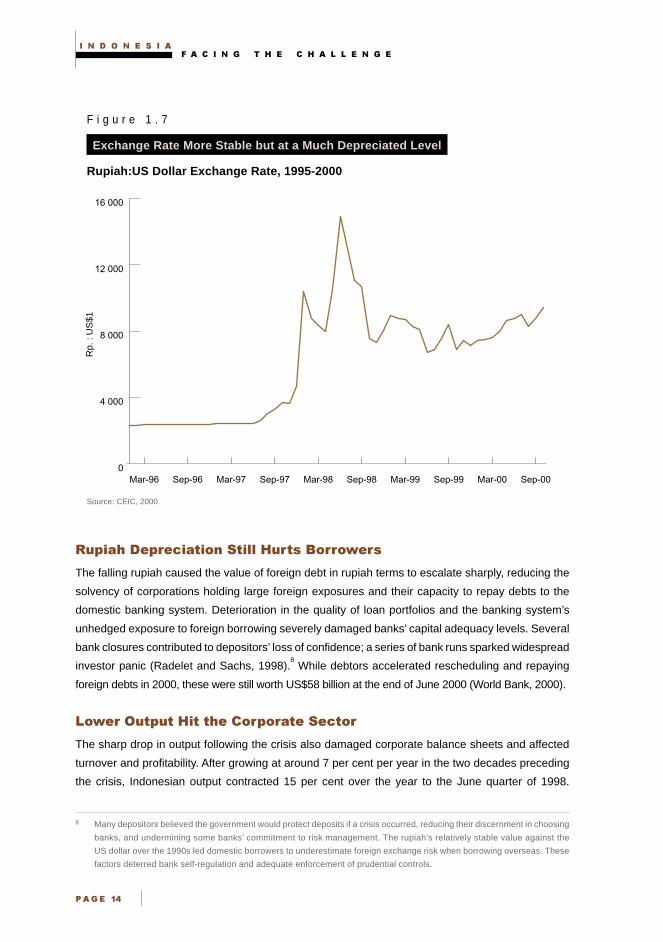
sharply deteriorated, the rupiah’s value plunged in early 1998 (Figure 1.7). This vulnerability
transformed a sharp exchange rate depreciation into a major financial crisis by mid 1998
(Feridhanusetyawan and Anas, 2000). In November 2000, the rupiah still remained over 70 per cent
below its June 1997 level of Rp. 2 450 : US$1 at approximately Rp. 9 200 : US$1, making foreign
loan repayments impossible for many highly leveraged debtors.
6 Consumer confidence dropped from April to August 2000, but recovered in September. Throughout this period, however,
the number of optimists consistently outnumbered pessimists.
7 A renewed weakness in the rupiah may increase pressure for Bank Indonesia to increase interest rates, although in the
past, this policy was largely ineffective; Bank Indonesia is more likely to actively purchase the rupiah in currency markets.
� � � � � � � � � � � � � � � � � � � � � � � � �
�� �!
F i g u r e 1 . 7
Exchange Rate More Stable but at a Much Depreciated Level
Rupiah:US Dollar Exchange Rate, 1995-2000
Source: CEIC, 2000.
�&!��)���!���������� ��$$�(&���������*���
The falling rupiah caused the value of foreign debt in rupiah terms to escalate sharply, reducing the
solvency of corporations holding large foreign exposures and their capacity to repay debts to the
domestic banking system. Deterioration in the quality of loan portfolios and the banking system’s
unhedged exposure to foreign borrowing severely damaged banks’ capital adequacy levels. Several
bank closures contributed to depositors’ loss of confidence; a series of bank runs sparked widespread
investor panic (Radelet and Sachs, 1998).8 While debtors accelerated rescheduling and repaying
foreign debts in 2000, these were still worth US$58 billion at the end of June 2000 (World Bank, 2000).
�*����&�!&��(����)�����!������ �����
The sharp drop in output following the crisis also damaged corporate balance sheets and affected
turnover and profitability. After growing at around 7 per cent per year in the two decades preceding
the crisis, Indonesian output contracted 15 per cent over the year to the June quarter of 1998.
8 Many depositors believed the government would protect deposits if a crisis occurred, reducing their discernment in choosing
banks, and undermining some banks’ commitment to risk management. The rupiah’s relatively stable value against the
US dollar over the 1990s led domestic borrowers to underestimate foreign exchange risk when borrowing overseas. These
factors deterred bank self-regulation and adequate enforcement of prudential controls.
0
4 000
8 000
12 000
16 000
Sep-00Mar-00Sep-99Mar-99Sep-98Mar-98Sep-97Mar-97Sep-96Mar-96
Rp.
: U
S$1

� � � � � � � � � � � � � � � � � � � �
�� �"
Expenditure shrank, with contraction most marked in private investment, as undercapitalised banks
virtually ceased extending credit to corporates. Falling investment and diminishing confidence reduced
consumption, further damaging investment and employment prospects. As in most severely affected
crisis economies, the lower exchange rate did not immediately benefit exports.9 However, activities
based on natural resources largely withstood the crisis.10
��+����������������,��-
Investment started to recover in late 1999 and early 2000, but fell again in the September quarter of
2000 (Figure 1.8). Spending on investment, adjusted for price movements, remains over 40 per cent
below pre-crisis peaks. The drop in investment spending in September underscores the importance
of improving the condition of the banking sector and repairing corporate balance sheets.
F i g u r e 1 . 8
Investment Faltering at Low Levels
Index of Real Gross Investment, March 1993=100
Source: CEIC, 2000.
9 Exports continued to decline well into 1998, due to an international rejection of Indonesian letters of credit; a lack of working
capital and capacity to buy imports reduced some exporters’ capacity to meet delivery deadlines and fill orders (Pardede, 1999).
By 1999, as trade finance became more available, export-oriented sectors could capitalise on the low exchange rate and
grew strongly.
10 In particular, minerals and energy relied less on bank financing and external creditors, and their costs benefited from the
lower exchange rate. In 1997 and early 1998, agriculture suffered from El Nino induced drought, but later recovered.
80
90
100
110
120
130
140
150
160
170
180
Sep-00Mar-00Sep-99Mar-99Sep-98Mar-98Sep-97Mar-97Sep-96Mar-96Sep-95Mar-95Sep-94Mar-94
Inde
x
� � � � � � � � � � � � � � � � � � � � � � � � �
�� �#
��'�����'� � ��������'��,�(
Having achieved macroeconomic stability by adopting appropriate monetary and fiscal policies,
the Government realises sustaining this growth will require new investment in productive assets, and
now is focusing on repairing the banking and corporate sectors, as its new ten point plan indicates
(Coordinating Ministry for Economic Affairs, 2000). The Government purchased many non-performing
loans from the banking system in return for bank equity; this effectively nationalised most of the
banking sector. The Government has begun selling these banks to the private sector. The corporate
sector remains heavily indebted to banks and foreigners, but government efforts to restructure these
loans now are moving ahead.
The following sections briefly discuss progress on the main restructuring and reform priorities,
as this directly affects Indonesia’s macroeconomic prospects. (Details of bank and corporate
restructuring are discussed in Chapter 7 - Financial Sector Restructuring and Chapter 8 -
Corporate Restructuring.)
���-��"� ��������!���
The Indonesian Bank Restructuring Agency, IBRA, established in January 1998 to oversee banking
sector rehabilitation, soon will have reviewed, closed, merged, recapitalised or taken over all private
and state banks. The Government has announced that by 2004, it will have completed banking
sector restructuring and returned nationalised banks to private owners, including foreign investors.11
However, this timetable suffered some delays in 2000; the Government has indicated IBRA is
waiting for market conditions to improve.
�����&��&���"��)�����!������ �����
Current estimates suggest around 70 per cent of Indonesia’s corporate sector is insolvent. However,
the Government has prioritised rescheduling outstanding debt, so the corporate sector can undertake
new investment. As creditor to some Rp. 235 trillion (US$37 billion) of corporate debt, IBRA plays a
central role in this process. After delays in 1998 and 1999, the Government is addressing the obstacles
to more rapid debt restructuring, including the weak legal system, and corporate restructuring is
starting to accelerate.
������������%����� �
Indonesia’s growth prospects depend largely on the pace of corporate and financial restructuring. As
the timing of restructuring is uncertain, considering alternative growth scenarios is useful (Figure 1.9).
The baseline scenario reflects the situation if no crisis had occurred, and assumes GDP growth of
7 per cent per year from 1996 to 2010, roughly equal to Indonesia’s potential long term growth rate.
This provides a benchmark against which to estimate output lost due to the crisis. Under the baseline
scenario, 2006 GDP is about double 1996 GDP and 2010 GDP is roughly two and a half times higher
than 1996 GDP.
11 These sales could provide opportunities for Australian business seeking to enter the Indonesian financial sector.
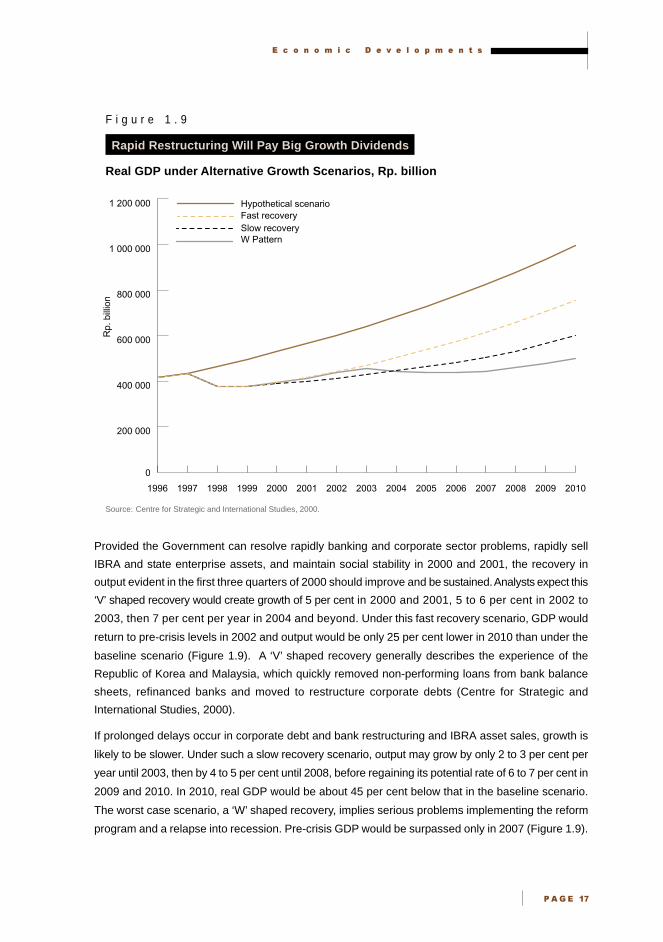
� � � � � � � � � � � � � � � � � � � �
�� �$
F i g u r e 1 . 9
Rapid Restructuring Will Pay Big Growth Dividends
Real GDP under Alternative Growth Scenarios, Rp. billion
Source: Centre for Strategic and International Studies, 2000.
Provided the Government can resolve rapidly banking and corporate sector problems, rapidly sell
IBRA and state enterprise assets, and maintain social stability in 2000 and 2001, the recovery in
output evident in the first three quarters of 2000 should improve and be sustained. Analysts expect this
‘V’ shaped recovery would create growth of 5 per cent in 2000 and 2001, 5 to 6 per cent in 2002 to
2003, then 7 per cent per year in 2004 and beyond. Under this fast recovery scenario, GDP would
return to pre-crisis levels in 2002 and output would be only 25 per cent lower in 2010 than under the
baseline scenario (Figure 1.9). A ‘V’ shaped recovery generally describes the experience of the
Republic of Korea and Malaysia, which quickly removed non-performing loans from bank balance
sheets, refinanced banks and moved to restructure corporate debts (Centre for Strategic and
International Studies, 2000).
If prolonged delays occur in corporate debt and bank restructuring and IBRA asset sales, growth is
likely to be slower. Under such a slow recovery scenario, output may grow by only 2 to 3 per cent per
year until 2003, then by 4 to 5 per cent until 2008, before regaining its potential rate of 6 to 7 per cent in
2009 and 2010. In 2010, real GDP would be about 45 per cent below that in the baseline scenario.
The worst case scenario, a ‘W’ shaped recovery, implies serious problems implementing the reform
program and a relapse into recession. Pre-crisis GDP would be surpassed only in 2007 (Figure 1.9).
0
200 000
400 000
600 000
800 000
1 000 000
1 200 000
W PatternSlow recoveryFast recoveryHypothetical scenario
201020092008200720062005200420032002200120001999199819971996
Rp.
bill
ion

� � � � � � � � � � � � � � � � � � � � � � � � �
�� �%
�� ��� ���������������
Despite the generally negative impact of the crisis on employment and consumption, some
parts of the community adapted to the crisis (known as krismon) better than others. Living
standards fell sharply between 1996 and 1998, with the number of people living below the
poverty line increasing by around 65 per cent, from around 11 to 18 per cent of the total
population, depending on the survey. However, this was still well below the poverty rate of
40 per cent recorded in the 1970s.
The flexible labour market provided a buffer to shrinking output, employment and profits, with
the agricultural sector absorbing a large share of workers dismissed from the urban economy.
Rural employment growth increased from 0.6 per cent before the crisis to 2.3 per cent after it.
Growth in urban employment, which had averaged around 5 per cent between 1990 and
1996, slowed dramatically (Feridhanusetyawan, 1999; and Sakernas, various issues).
Many urban workers also moved into the informal sector, where employment grew by around
7 per cent during 1997-98, to 65.4 per cent of total employment (Feridhanusetyawan, 1999).
���� ���������������������������
To achieve rapid, longer term growth, Indonesia will require new investment in public
infrastructure, education and institutional capital; required investment in public infrastructure
alone is estimated to be around US$100 billion over the next ten years (Younger, 2000).
Indonesia also faces human capital constraints with international comparisons showing
investments in public primary and secondary education are low. Government’s new obligations
to service the greatly expanded public debt are likely to constrain its investment in these
areas. The IMF estimates the ratio of public debt to GDP is 93 per cent in 2000 (International
Monetary Fund, 2000a, 2000b and 2000c).
��%������������� �%����� ���
Business needs to remain informed of government reforms in key areas, including corporate debt
and bank restructuring, asset sales, corporate governance and legal reform. These could guide
when it is best to invest in Indonesia.
���!�����������&��&���".������� �$����������-�&!����%&��������"
A key indicator is the success of debt restructuring, as this is critical to restoring the economy’s long
term prospects. Business should interpret government success in prosecuting major debtors who
refuse to participate in the debt restructuring process as a sign that the investment environment will
improve. Investors also should interpret positively announcements of sales of major IBRA assets and
a continuation of recent, more rapid progress in debt workouts, particularly if they generate viable
long term restructuring.

� � � � � � � � � � � � � � � � � � � �
�� �&
&�����#&$����-������&��&���"��������!������'�+�������
IBRA has nearly recapitalised the banking sector, and is readying banks for sale to the private sector.
Timing of these sales and willingness to offer banks to capable private investors, including well
qualified foreign banks, indicate important reform progress.
The Government has passed many new laws to improve corporates’ reporting and accounting
standards, directors’ obligations and minority shareholders’ rights. Success in enforcing new
requirements, including by prosecuting non-compliers, will indicate a likely improvement in corporate
governance standards and an enhanced investment environment.
����������
The Indonesian economy is experiencing a short term macroeconomic recovery from the crisis, but
the Government clearly understands more work needs to be done to sustain it (Coordinating Ministry
for Economic Affairs, 2000). Sustaining growth depends on successfully restructuring corporate balance
sheets and the banking sector. Limiting risks to investors and achieving sustainable economic growth
also requires an efficiently functioning legal system, political stability and maintenance of basic security.
Indonesia is trying to establish these foundations for sustainable growth. This is occurring in an
environment of rapid political change, adding to this challenge, and at times reducing the pace of
necessary economic and institutional reform. Hence, plausible scenarios indicate medium term
economic growth could be slower than in other crisis affected economies.
� � � � � � � � � � � � � � � � � � � � � � � � �
�� ��'
��%������
Asia Foundation, 2000, ‘Small Business and the Indonesian Economic Crisis’, October, Jakarta.
CEIC, 2000, Asian Economic Database, Hong Kong, accessed on 3 October 2000.
Centre for International and Strategic Studies, 2000, ‘Report to the East Asia Analytical Unit on the
Indonesian Economy’, July, Jakarta.
Consensus Economics, 2000, ‘Consensus Forecasts’, 9 October.
Coordinating Ministry for Economic Affairs, 2000, ‘Update on the Indonesian Economy’, Government
of the Republic of Indonesia, October, Jakarta.
Danareksa Research, 2000, ‘March 2000 Survey’, Jakarta.
Feridhanusetyawan, T., 1999, ‘ Security Implications of the Economic Crisis for Indonesian Workers’,
Centre for Strategic and International Studies, Jakarta.
Feridhanusetyawan, T. and Anas, T., 2000, ‘Revisiting the Causes of the Indonesian Economic Crisis’,
in Ishida Masami (ed.), Economic Crisis in Indonesia, Institute of Developing Economies, Japan
External Trade Organisation, Tokyo.
International Economic Data Base, 2000, Consultancy for East Asia Analytical Unit, Australian National
University, Canberra.
International Monetary Fund, 2000a, Letter of Intent, January 2000.
___ 2000b, Letter of Intent, May 2000.
___ 2000c, Letter of Intent, July 2000.
Pardede, R., 1999, ‘ Survey of Recent Developments’, Bulletin of Indonesian Economic Studies, Vol. 35,
No. 2, August pp. 3-39.
Radelet, S. and Sachs, J., 1998, ‘The East Asian Financial Crisis: Diagnosis, Remedies, Prospects’,
mimeo, Harvard Institute for International Development, Harvard.
World Bank, 2000, Indonesia: Accelerating Recovery in Uncertain Times, World Bank, Washington DC.
Younger, S., 2000, Information supplied to the East Asia Analytical Unit by Mr Scott Younger, Director
of Business Development, Thames Water International, February, Jakarta.
� � � � � � � �
�� ��
��������������� ���� ��������
��������
• The Government recognises economic recovery and political survival
are inextricably linked, so delivering economic recovery is a priority;
the August cabinet reshuffle emphasises this.
• The new Indonesian polity has more stakeholders, promises more
transparent and active policy making, and is devolving more power
and responsibility to regions.
• Increased political participation also increases the importance of
convincing the electorate and stakeholders that foreign investment
and free trade promote growth and equity objectives. Many interests
presently do not recognise these links.
• In the long term, devolution of power to the regions could generate
benefits if regional governments become more responsive to investor
and local population needs.
• However, in the short to medium term, the investment climate in the
regions could deteriorate as the Government decentralises revenue,
expenditure and many aspects of decision making. Investors need
to monitor the effects of this transition closely, and be aware that
regional level agencies may need time to develop their capacity.
� � � � � � � � � � � � � � � � � � � � � � � � �
�� �
The commercial viability of Indonesia for foreign business rests largely on the Government’s success
in implementing its economic reform program. This chapter reviews recent political events and the
historical interplay between Indonesia’s political system and economic outcomes. It assesses how
recent political reforms affect the economic reform program, particularly the sale of foreign assets
and corporate restructuring, and provides indicators to measure the Government’s progress in
achieving political outcomes that will support economic reform.
�� ������ �
In August 2000, the Wahid administration appointed a new cabinet. It is smaller and more cohesive,
potentially reducing the power struggles that characterised the previous cabinet. The President also
agreed to increase the powers of Vice President Megawati Sukarnoputri to supervise and coordinate
the day-to-day management of the economic reform program. The Coordinating Minister for
Economics, Dr Rizal Ramli, has said he will increase efforts to resolve key economic problems,
stressing the priority of IBRA asset sales. (See Chapter 1 - Economic Developments.)
Delivering economic recovery is a key priority for the Wahid Government, reflecting the close historical
relationship between economic outcomes and political survival.
�� ������ ����������������������� ��
The Wahid administration, the first democratic government for two generations, is attempting to build
its economic credentials with an increasingly empowered electorate. However, the transition to a
new political system and its associated political instability complicates the implementation of the
economic reform program in the short term, while holding out the promise of more effective and open
governance over the longer term.
������������������ �!��!"�#$%&'($%))*
Responding to the political volatility of the early 1950s, Sukarno’s regime was highly centralised and
executive dominated; it restricted political rights in the name of national stability and unity. However,
increasingly strident anti-western rhetoric and the forced nationalisation of Dutch enterprises slowed
foreign investment and depressed the economy. Poor economic outcomes aggravated tensions
between the Communist Party, the army and Islamic groups, culminating in the abortive coup of
September 1965. Soon after, Soeharto led the military dominated New Order regime.
���+��,���� �-�������#$%))($%%.*
For over 30 years, Soeharto’s New Order regime sustained high rates of economic growth by
encouraging foreign investment, adhering to IMF structural adjustment polices and appointing western
trained technocrats to key positions in the government and state enterprises. Although Soeharto
restricted political freedoms, manipulated the electoral process and parliament, and suppressed the
press, the delivery of ever increasing living standards quelled agitation for political reform.

� � � � � � � � � � � � � � � � � � � � �
�� �
The longevity of the regime provided investor certainty, encouraging investment and economic growth.
However, the highly centralised political system with increasingly patronage driven economic policies
produced a weakly governed economy that was vulnerable to the 1997-98 regional financial crisis.
�+��� �����/����+��,�
The financial crisis, Krismon, dashed Soeharto’s legitimacy, culminating in the fall of the New Order.
Unable to respond effectively to the crisis, an ailing Soeharto resigned as civil unrest increased, and
support from within the military and cabinet crumbled. Vice President Habibie took over in May 1998.
Implementing the IMF program, Habibie quickly stabilised the macroeconomy, restored the value of
the rupiah and reduced inflation. He lifted restrictions on the press, freed political prisoners and
introduced regional autonomy laws.1 The first free and fair general elections in 44 years were held in
June 1999.
�+��0�����/���+��
Despite his economic achievements, Habibie never enjoyed widespread support within the political
elite or general community. Facing almost certain defeat at the presidential election of October 1999,
Habibie withdrew his nomination, leaving Abdurrahman Wahid and Megawati Sukarnoputri as the
main contenders.
Wahid became President, with support from Islamic parties, Golkar and the military. The newly formed
national government comprised Megawati’s PDI-P with 34 per cent of the vote, Golkar with 22 per
cent, Abdurrahman Wahid’s PKB with 13 per cent, PPP with 11 per cent and Amien Rais’s PAN with
7 per cent. Wahid drew his first 34 member cabinet largely from PKB, PDI-P, PAN, Golkar and the
Armed Forces, TNI.2
Since the election, support for the Wahid Government has fallen, in part because the Government
has not implemented effectively the economic reform program. This partly reflects the ambitious
nature of the economic program, but the transition to a new political system exacerbates policy
implementation, making it more complicated than in the past.
���1� �� �������������� ����
Political power within Indonesia gradually is ebbing away from the largely Jakarta based civilian and
military elite Soeharto’s New Order favoured, towards a more fragmented array of players, including
newly elected representatives, their respective parties, and bureaucrats. This increases the number
of stakeholders in the economic reform program and in the long term, promises more transparent
and active policy making, but also introduces new obstacles to achieving economic reform and recovery.
1 Habibie abolished permits for publishing and substantially reduced the intimidation of journalists.
2 PKB is the National Awakening Party; PDI-P is the Indonesian Democratic Party of Struggle; PAN is the National
Mandate Party; and PPP is the United Development Party.
� � � � � � � � � � � � � � � � � � � � � � � � �
�� �!
The August 2000 Cabinet rectifies some of the problems of coordinating Wahid’s initial governing
coalition (Appendix Table 2.1). Significant doubts persist, however, about the enthusiasm and ability
of the bureaucracy to implement the economic reform program. Devolving economic responsibility to
the regions will further complicate this.
0�����/���2�,�!�2����,���
New political parties and more stakeholders in the economic reform program increase pressure on
the administration to deliver on policies outlined in IMF Letters of Intent. By demanding a more
accountable government and using parliament’s authority to amend or reject government bills, the
parties create a hybrid presidential parliamentary system. This contrasts with the ‘rubber stamping’
of government bills in the Sukarno and Soeharto eras. The ruling coalition is pressing to implement
the economic agenda, as the August People’s Consultative Assembly, MPR, session demonstrated.
There, they strongly criticised Wahid’s performance on economic matters.
���������������� �����������������
Indonesia has a five year election cycle, beginning with parliamentary elections and followed
by a general session of the MPR. The MPR is Indonesia’s supreme decision making institution.
It elects the president and vice president, and sets the Broad Guidelines of State Policy,
GBHN, which provide the blueprint for executive government. It also can amend the constitution
and impeach a president who has violated the constitution or the GBHN. Following a
constitutional amendment in 1999, the MPR now meets annually.
The People’s Representative Assembly, DPR, has 500 members; 462 are popularly elected
and 38 are appointed representatives of the armed forces and the police. The DPR meets
regularly throughout the year.
The electoral system used in the 1999 election was a complex mix of proportional and district
representation. Each province formed an electoral region, but a party’s performance in districts
(kabupaten/kota madya) within the province affected seat allocation. For example, a party
winning 25 per cent of the vote in a province, theoretically was entitled to one quarter of the seats.
It then gained seats in districts where it recorded its highest vote. In practice, the system has
many anomalies and outcomes do not necessarily reflect the intention of the legislation.
Over the next few years, the political and electoral systems could change significantly. Support
has grown for district based elections. Most major parties supported a constitutional
amendment at the August 2000 MPR session allowing for direct presidential elections. However,
this and other major constitutional issues were deferred for further consultation and negotiation
because of a lack of consensus among the parties. PDI-P in particular remains opposed to
the idea. The MPR would be weakened substantially under direct presidential elections, but
probably would retain its powers of impeachment and constitutional amendment.

� � � � � � � � � � � � � � � � � � � � �
�� �"
���������������� �
On assuming the presidency, President Wahid acted quickly to curtail the influence of the
military in political life, appointing reform minded officers to strategic positions and weakening
the dominance of the army by appointing naval officers to senior posts. The dismantling of
key elements of the military’s intelligence network also weakened its power base. The military’s
role in provoking riots in 1998, human rights abuses and failure to contain regional social
unrest further diminished its public standing.
However, the military is far from a spent force politically. Considerable representation in national
and regional parliaments provides the military with substantial leverage, and civilian politicians
and parties are wary of alienating it. A new constitutional amendment extending the military’s
tenure in the legislature until 2009 was a victory for Soeharto loyalists and the military
(Australian, 8 September 2000, p. 6).
�+��������!��!"
While the bureaucracy is required to implement the economic reform program, its resolve and ability
to achieve this is in doubt. Many parts of the bureaucracy do not understand the need for reform and
perceive that many proposed changes threaten established patterns of operating. Although the
Government has tried to boost administrative capacity through harnessing international aid programs
to improve internal processes, levels of training and technology, and raise bureaucratic governance
through public audits, shortages of high quality human resources cannot be overcome rapidly. Also,
despite recent pay increases for senior bureaucrats, corruption remains a serious problem.
��!������3���-���,��,+��0�3����
In the longer term, more regional autonomy could make the political system more responsive to
regional needs; however, in the short term, competition in formulating policy and problems in devolving
government powers threaten economic reform implementation. Regional devolution could increase the
complexity of the regulatory environment, affecting foreign investment and slowing corporate restructuring.
��������4������������1� ��� ��� �����0���0�
Political change and reform have assisted several aspects of economic reform. First, many new
parties are less affiliated to powerful vested interests than was the case during the New Order.
Secondly, newly strengthened independent auditors and greater central bank independence should
make policy implementation and governance more efficient.
Nevertheless, the transition to a new political system creates short term risks for many key aspects
of the Government’s programs. Elements of the bureaucracy and some political parties oppose foreign
ownership, threatening the sale of corporate and state assets; such sales are vital to reducing the
fiscal debt and restoring economic activity. Bureaucratic, union and regional resistance also hampers
the reform and sale of state enterprises. Involvement of all key stakeholders therefore is necessary
to ensure positive outcomes for intending investors.
� � � � � � � � � � � � � � � � � � � � � � � � �
�� �#
����,���2��
While some aspects of political reform assist in economic restructuring, the transition to a new political
system also creates new obstacles to asset sales. For example, newly formed and independent
bureaucracies such as IBRA and the Jakarta Initiative Task Force, are at least notionally free from
political interference in their efforts to restructure loans and divest assets. However, some parts of
the bureaucracy resist rapid sales of government held assets to foreigners. Even IBRA and the
Ministry of Finance increasingly favour a gradual sale of assets, claiming this will maximise revenues
for retiring the large stock of government debt. However, this approach is likely to delay these assets’
return to productive use within the market economy, and many assets are deteriorating while in limbo
(World Bank, 2000). Further, the Government still has to convince many in the electorate of the need
for and benefits of foreign investment (Fealy, 2000).
0�/�� ��/��,�,���,��5�����
Nationalist sentiment within the Wahid Government also affects the sale of state enterprises.
Bureaucrats within the Ministry of State Owned Enterprises increasingly seek to financially rehabilitate
these enterprises before their sale, delaying privatisation. Newly empowered regional governments
also want local state enterprises to be transferred to regional public ownership, preventing their
privatisation. Various interest groups, representing industry and labour, argue some enterprises are
strategically significant and should be retained as national assets. Countering this resistance will
require strong leadership, and key economic cabinet members will need to understand the importance
of these reforms.
0���!��3������5,���
Reducing corruption is critical to solving Indonesia’s economic problems; however, it will require
strong political will. The move to a new political system is a good start. Further, the Wahid administration
strengthened the role and independence of the Supreme Auditor’s Board, BPK, and a freer press
now scrutinises politicians and officials, who are more aware that public exposure of corruption can
jeopardise their careers.
At the same time, the rise of political parties and regional devolution create new forms of patronage.
Many elements of the business sector, the bureaucracy, community groups and the military have
realigned with one or more parties, allowing parties to expand their financial bases and widen their
community support. At the regional level, patronage is particularly acute, resulting in little internal
cohesion within parties and unexpected electoral outcomes.
0���!��3����6��2�,"
Policy makers face a key challenge of reducing income inequality by region and class (Figure 2.1).
Greater democracy and the rise of new parties is likely to increase the pressure for more equitable
outcomes in future. The two largest parties in the Wahid Government, PKB and PDI-P, favour directing
resources to less privileged communities to reduce the prospect of attacks on Sino-Indonesian and
foreign businesses, and lessen the risk of politically motivated unrest against the Government.
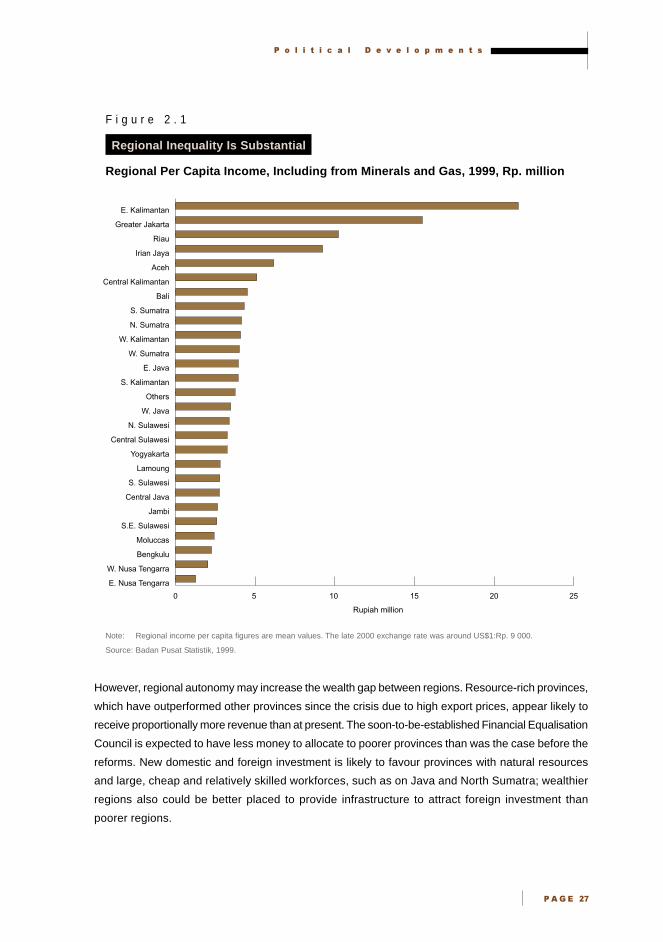
� � � � � � � � � � � � � � � � � � � � �
�� �$
F i g u r e 2 . 1
Regional Inequality Is Substantial
Regional Per Capita Income, Including from Minerals and Gas, 1999, Rp. million
Note: Regional income per capita figures are mean values. The late 2000 exchange rate was around US$1:Rp. 9 000.
Source: Badan Pusat Statistik, 1999.
However, regional autonomy may increase the wealth gap between regions. Resource-rich provinces,
which have outperformed other provinces since the crisis due to high export prices, appear likely to
receive proportionally more revenue than at present. The soon-to-be-established Financial Equalisation
Council is expected to have less money to allocate to poorer provinces than was the case before the
reforms. New domestic and foreign investment is likely to favour provinces with natural resources
and large, cheap and relatively skilled workforces, such as on Java and North Sumatra; wealthier
regions also could be better placed to provide infrastructure to attract foreign investment than
poorer regions.
0 5 10 15 20 25
E. Nusa Tengarra
W. Nusa Tengarra
Bengkulu
Moluccas
S.E. Sulawesi
Jambi
Central Java
S. Sulawesi
Lamoung
Yogyakarta
Central Sulawesi
N. Sulawesi
W. Java
Others
S. Kalimantan
E. Java
W. Sumatra
W. Kalimantan
N. Sumatra
S. Sumatra
Bali
Central Kalimantan
Aceh
Irian Jaya
Riau
Greater Jakarta
E. Kalimantan
Rupiah million

� � � � � � � � � � � � � � � � � � � � � � � � �
�� �%
0��� ���� �0��������
The Government of Indonesia is decentralising many key responsibilities to the regions, redefining
the role of government in Indonesian society. Increased regional autonomy will decentralise many
government responsibilities, potentially improving economic efficiency and community participation.
However, devolution also will affect the revenue available to the centre and could affect the foreign
investment environment.
The Government of Indonesia has responded to the regions’ demands for greater control of decisions
affecting them by decentralising revenue, expenditure and decision making over many areas of
government to the provinces, starting in January 2001. Devolution could create significant economic
and social benefits for Indonesia. Local government often can better respond to local needs and be
more accountable to local people, supporting the development of democracy and improving
development outcomes. Citizens also are more likely to identify with local government objectives,
increasing their willingness to pay taxes. The Government is aware building the necessary bureaucratic
capacity of many provinces will take time, particularly at the district and sub-provincial level. Foreign
investors should remain sensitive to the transition to a more decentralised environment.
This section assesses the likely impact of the new decentralisation laws, including their potential long
term economic and political benefits, and issues for foreign investors.
�7�2�,������-�
Two laws defining the devolution program come into effect on 1 January 2001. The regional government
law No. 22/1999 increases regional political autonomy. Law No. 25/1999 on the fiscal balance between
the centre and the regions increases the share of royalties of resource-rich provinces like Aceh,
Irian Jaya, and East Kalimantan, and increases regions’ spending responsibilities for routine items.
The recently established Regional Autonomy Advisory Council, and a coordinating team will implement
the laws.3
��2�,�!�2���,��� "
These laws will change the relationship between the centre, the provinces (dearah tingkat satu) and
the districts (kabupaten) (Booth, 1999). Law No. 22/1999 provides for the election of regional
parliaments at the provincial and district level. Representatives will be accountable only to their own
parliaments, not to a central body.
Decentralisation may encourage more local participation in policy making and government
responsiveness to people’s needs. Already some local elections have changed significantly the local
political environment.
3 Presidential Decree No. 49, No. 52/2000, 7 April 2000 established these bodies. The Regional Autonomy Advisory Council,
a national consultative forum reporting to the President, became operational in July 2000.
� � � � � � � � � � � � � � � � � � � � �
�� �&
!��� �!��7�2�,���
These laws also delegate significant responsibility to districts and regions for public expenditure and
revenue raising. The regions are expected to spend an estimated 8 to 9 per cent of GDP, and well
over 40 per cent of general government spending, once devolution takes place (World Bank, 2000).
Law No. 22/1999 makes districts or sub-provincial levels responsible for a large range of tasks,
including public works, health, education and culture, agriculture, communications, industry and trade.
The central government retains responsibility for international relations, defence, justice, monetary
and fiscal policy, and religious matters.
Additional regulations in mid 2000 clarified the authority of the central and regional governments.4
Additional supporting regulations should govern the relocation of personnel and management, and
define local government accountability, financial management practices and information systems,
local tax bases and procedures for asset transfers.
The Government is conducting negotiations with provinces and districts on transfers of current projects,
revenue shares, required reporting and auditing standards, and domestic borrowing rules (to ensure
consistency with the macroeconomic framework). The coordinating team and the Regional Autonomy
Advisory Council are cooperating with relevant ministries, provinces and districts to coordinate
these negotiations.
Economic decentralisation provides funding to the regions comprising general and special allocations,
supplemented by equalisation grants. Under general allocations, to be used for routine budget
expenditures, at least 25 per cent of central government domestic revenues amounting to an estimated
4 per cent of GDP will go to lower levels of government; 90 per cent of this will go to districts and
10 per cent to provinces (World Bank, 2000). Special allocations from the central budget will be
based on the development needs of the region. Regions also will receive 15 per cent of their net oil
revenues, 30 per cent of their natural gas taxes and 80 per cent of their tax revenue from other
mining, forestry and fishery activities conducted within their regional borders.5 Regional governments
will be able to borrow, but a ceiling for total debt and debt services will apply for each region. Foreign
loans will require approval by the Ministry of Finance (World Bank, 2000). Regional allocations under
the draft 2001 budget suggest a gradual transition towards new revenue arrangements.
������4�0�� ����0�
In the long term, devolution may benefit foreign investors. As autonomous regions develop, competition
between regional governments for foreign investment should grow. Regions offering the most
favourable taxation rates, infrastructure and regulatory environment will be best placed to attract new
investment. Local responsibility for public works could make infrastructure provision more responsive.
4 For example, Decree No. 25/2000 on the Authority of the Central Government and of Provinces as Autonomous Regions,
dated 6 May 2000.
5 Whether this revenue will accrue to the district or provincial level is unclear.

� � � � � � � � � � � � � � � � � � � � � � � � �
�� � '
More governments may provide potential investors with more regulatory environment choice. Also,
regional areas the central government neglected may achieve higher governance standards and
public investment under regional administrations.
However, the transition to a new system of government will take time, and investors need to be
aware of several issues that may affect their activities over the short term. Devolution may temporarily
increase the time taken to process applications as new agencies at the regional level will take time to
develop their capacity. Consequently, compliance costs may increase, especially where regulatory
responsibility is unclear. While the Government also is ensuring new regional laws do not conflict
with central laws, this could take time.
�0���� ���0��0��
Although the interaction between politics and economics is complex, some key indicators should
help business signpost the political system’s progress in implementing economic reform over 2001
and 2002. Flows of Sino-Indonesian capital, stock prices and exchange rate movements provide
useful short term indicators of the Government’s success in managing the economy.6 A consortium
comprising Singapore’s Cycle and Carriage recently acquired a 39.5 per cent share in Astra, IBRA’s
largest sale so far, suggesting greater interest in Indonesian assets by regional investors. The
composition of the Cabinet, especially the inclusion of relevant experts, also signposts the likely
direction of policy. The appointment of Dr Rizal Ramli, a US educated economist as Coordinating
Minister for Economics was, on balance, viewed positively.
The longer term capacity of the political system to implement economic reform depends partly on
prospective constitutional reforms that may include direct presidential elections, and measures to strengthen
the executive’s accountability. Achieving these goals also would represent positive developments.
�� ������
A year after Indonesia’s historic 1999 democratic election, the political environment remains very
fluid. Although it has delivered macroeconomic stability and the beginnings of a broader economic
recovery, structural reforms represent a more complex challenge and will require strong political will.
The transition to democracy eventually should help in developing a proactive civil society, including a
robust press and vocal middle class, who will support the creation of stronger, more transparent
institutions, and eventually underpin consensus support for more equitable and sustainable economic
growth. However, in the short term, shifting alliances and the resulting power vacuum in many parts
of the bureaucracy, may allow the state owned sector and provinces to undermine efforts to achieve
economic reforms and recovery, and permit opportunistic behaviour by a minority.
6 While data on Sino-Indonesian capital inflows are not available officially, evidence of overseas Chinese and Singaporean
interest in asset sales forms a good proxy.

� � � � � � � � � � � � � � � � � � � � �
�� � �
A p p e n d i x T a b l e 2 . 1
�� ������������������������ ����������������
Name Position
Abdurrahman Wahid President
Megawati Sukarnoputri Vice President
Lt Gen (Ret) Susilo Bambang Yudhoyono Coordinating Minister for Political, Social andSecurity Affairs
Dr Alwi Shihab Minister of Foreign Affairs
M. Mahfud Minister of Defence
Dr Rizal Ramli Coordinating Minister for Economics,Finance and Industry
Prijadi Praptosuhardjo Minister of Finance
Dr Purnomo Yusgiantoro Minister of Energy and Mineral Resources
Luhut Panjaitan Minister of Industry and Trade
Dr Bungaran Saragih Minister of Agriculture and Forestry
Sarwono Kusumaatmadja Minister for Maritime Affairs and Fisheries
Agum Gumelar Minister for Transportation and Telecommunications
Alhilal Hamdi Minister of Manpower and Transmigration
Dr Achmad Sujudi Minister of Health and Social Welfare
Dr Yahya Muhaimin Minister of National Education
Tolchah Hasan Minister of Religious Affairs
Erna Witoelar Minister of Settlement and Regional Infrastructure
Lt Gen (Ret) S. Soedirdja Minister for Home Affairs and Regional Autonomy
Gede Ardika Minister for Culture and Tourism
Lt Gen (Ret) Luhut Binsar Pandjaitan Minister for Trade and Industry
Dr Yusril Ihza Mahendra Minister for Justice and Human Rights
Zarkasih Nur State Minister for Cooperatives, Small and MediumEnterprises
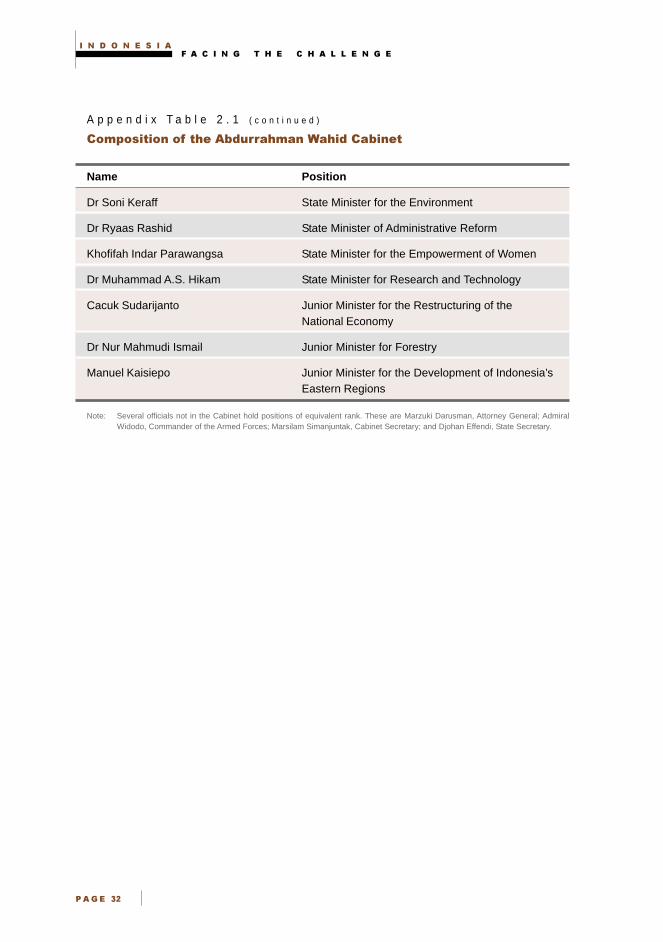
� � � � � � � � � � � � � � � � � � � � � � � � �
�� �
A p p e n d i x T a b l e 2 . 1 ( c o n t i n u e d )
�� ������������������������ ����������������
Name Position
Dr Soni Keraff State Minister for the Environment
Dr Ryaas Rashid State Minister of Administrative Reform
Khofifah Indar Parawangsa State Minister for the Empowerment of Women
Dr Muhammad A.S. Hikam State Minister for Research and Technology
Cacuk Sudarijanto Junior Minister for the Restructuring of theNational Economy
Dr Nur Mahmudi Ismail Junior Minister for Forestry
Manuel Kaisiepo Junior Minister for the Development of Indonesia’sEastern Regions
Note: Several officials not in the Cabinet hold positions of equivalent rank. These are Marzuki Darusman, Attorney General; AdmiralWidodo, Commander of the Armed Forces; Marsilam Simanjuntak, Cabinet Secretary; and Djohan Effendi, State Secretary.
� � � � � � � � � � � � � � � � � � � � �
�� �
040 ��
Badan Pusat Statistik, 1999, ‘Gross Regional Domestic Product of Provinces in Indonesia by Industrial
Origin 1995-1998’, BPS, Jakarta.
Booth, A., 1999, ‘The Indonesian Economy: a Survey of Recent Developments’, Indonesia Project,
Research School of Pacific and Asian Studies, Australian National University, Canberra.
Fealy, G., 2000 (forthcoming), ‘Islamic Politics: a Rising or Declining Force’, in Damien Kingsbury
(ed.), Rethinking Indonesia, Crawford House, London.
World Bank, 2000, Indonesia: Accelerating Recovery in Uncertain Times, World Bank, Washington DC.

� � � � � � � � � � � � � � � � � � � � � � � � �
�� � !

� � � � � � � �
�� ��
������������������ ���������
��������
• Indonesia’s foreign direct investment, FDI, has not yet recovered from
post crisis falls. However, its foreign investment regime is more open
than before the crisis, generating potential opportunities in an
environment of ongoing reform.
• Already, investors can operate 100 per cent foreign owned enterprises
in most sectors and no longer need to sell down equity at a later
date. Only a few sectors restrict foreign investment; in most of these
joint ventures are possible.
• The outlook for foreign investment in Indonesia also is assisted by
the sale of state held assets and enterprises, more competitive export-
oriented and import substitution sectors due to the weaker rupiah
and a more open economy.
• Opportunities are diverse. Foreign investors can purchase assets
from IBRA’s sizeable bank equity holdings, operate retail outlets,
distribute goods produced locally and apply to import and distribute
other products. They also can enter joint ventures to supply
educational, medical and infrastructure services including
telecommunications.
• The sale of corporate assets under IBRA’s control also should
generate significant foreign investment opportunities. The
Government also is selling many state enterprises.
• Major issues for investors include the difficulty of valuing distressed
assets given weak accountancy standards, workforce management and
sometimes political resistance to sales, and legal and sovereign risks.
• Buyers can manage risks by commissioning independent audits to
corroborate IBRA’s risk appraisal, completing comprehensive due
diligence assessments before acquiring assets, insuring against risk
and monitoring closely the local social and institutional environment.
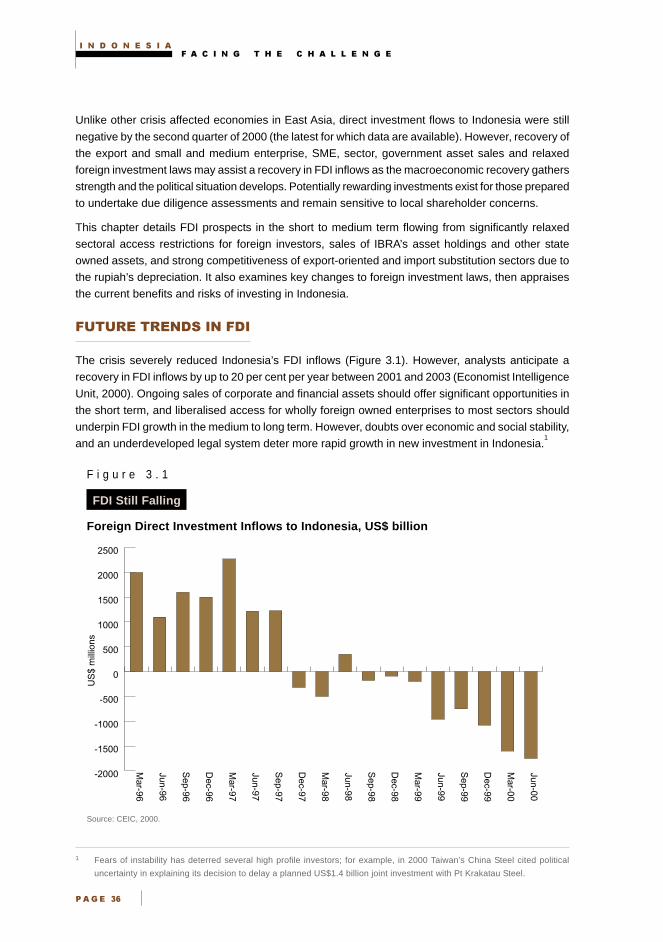
� � � � � � � � � � � � � � � � � � � � � �
� � � ���
Unlike other crisis affected economies in East Asia, direct investment flows to Indonesia were still
negative by the second quarter of 2000 (the latest for which data are available). However, recovery of
the export and small and medium enterprise, SME, sector, government asset sales and relaxed
foreign investment laws may assist a recovery in FDI inflows as the macroeconomic recovery gathers
strength and the political situation develops. Potentially rewarding investments exist for those prepared
to undertake due diligence assessments and remain sensitive to local shareholder concerns.
This chapter details FDI prospects in the short to medium term flowing from significantly relaxed
sectoral access restrictions for foreign investors, sales of IBRA’s asset holdings and other state
owned assets, and strong competitiveness of export-oriented and import substitution sectors due to
the rupiah’s depreciation. It also examines key changes to foreign investment laws, then appraises
the current benefits and risks of investing in Indonesia.
�����������������
The crisis severely reduced Indonesia’s FDI inflows (Figure 3.1). However, analysts anticipate a
recovery in FDI inflows by up to 20 per cent per year between 2001 and 2003 (Economist Intelligence
Unit, 2000). Ongoing sales of corporate and financial assets should offer significant opportunities in
the short term, and liberalised access for wholly foreign owned enterprises to most sectors should
underpin FDI growth in the medium to long term. However, doubts over economic and social stability,
and an underdeveloped legal system deter more rapid growth in new investment in Indonesia.1
F i g u r e 3 . 1
FDI Still Falling
Foreign Direct Investment Inflows to Indonesia, US$ billion
Source: CEIC, 2000.
1 Fears of instability has deterred several high profile investors; for example, in 2000 Taiwan’s China Steel cited political
uncertainty in explaining its decision to delay a planned US$1.4 billion joint investment with Pt Krakatau Steel.
US
$ m
illio
ns
-2000
-1500
-1000
-500
0
500
1000
1500
2000
2500
Jun-00
Mar-00
Dec-99
Sep-99
Jun-99
Mar-99
Dec-98
Sep-98
Jun-98
Mar-98
Dec-97
Sep-97
Jun-97
Mar-97
Dec-96
Sep-96
Jun-96
Mar-96
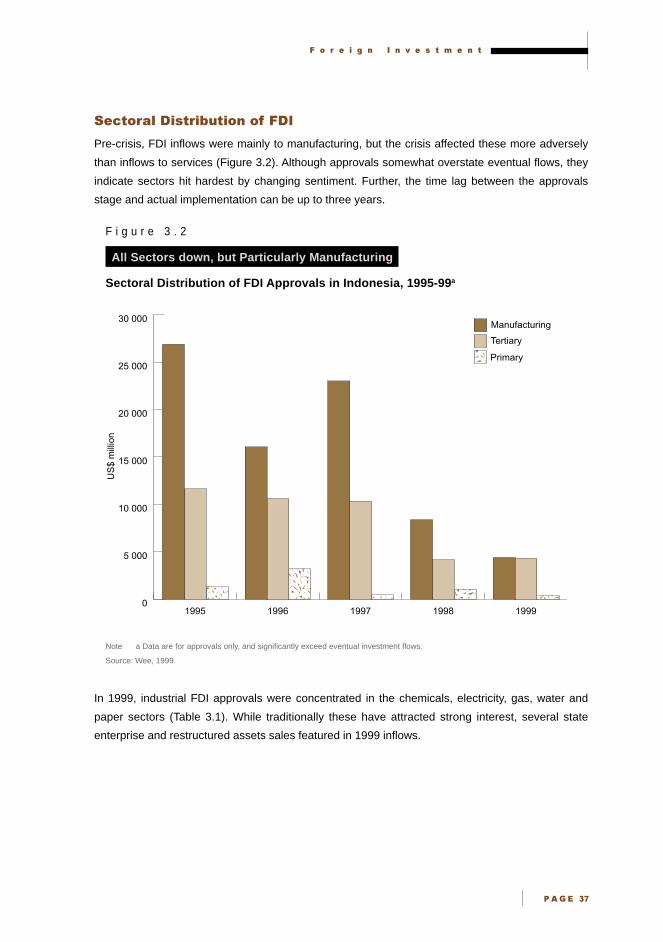
� � � � � � � � � � � � � � � � � �
�� �
���������������������������
Pre-crisis, FDI inflows were mainly to manufacturing, but the crisis affected these more adversely
than inflows to services (Figure 3.2). Although approvals somewhat overstate eventual flows, they
indicate sectors hit hardest by changing sentiment. Further, the time lag between the approvals
stage and actual implementation can be up to three years.
F i g u r e 3 . 2
All Sectors down, but Particularly Manufacturing
Sectoral Distribution of FDI Approvals in Indonesia, 1995-99a
Note: a Data are for approvals only, and significantly exceed eventual investment flows.
Source: Wee, 1999.
In 1999, industrial FDI approvals were concentrated in the chemicals, electricity, gas, water and
paper sectors (Table 3.1). While traditionally these have attracted strong interest, several state
enterprise and restructured assets sales featured in 1999 inflows.
0
5 000
10 000
15 000
20 000
25 000
30 000
Primary
Tertiary
Manufacturing
19991998199719961995
US
$ m
illio
n

� � � � � � � � � � � � � � � � � � � � � � � � �
�� �!
T a b l e 3 . 1
�� ����������������� ����������������
Industrial Foreign Investment Approvals by Sectors, 1999a
Sector Projects Total
(US$ millions)
Chemicals 75 3 266
Electricity/gas/water 2 2 310
Paper 15 1 412
Food industry 48 681
Metal goods 85 593
Basic metals 9 501
Plantations 17 284
Trade 348 279
Textiles 121 240
Food crops 10 224
Other 357 1 101
Total 1 164 10 891
Note: a Data are for approvals only and do not include oil and gas, and financial and insurance sectors.
Source: Deacons, 2000.
������������������������������
To attract foreign capital to post crisis asset sales and boost foreign exchange reserves, the Government
significantly liberalised foreign investment laws, extending the liberalisation started in the mid 1990s.
A new draft foreign investment law released in October 2000 would allow wholly foreign owned
enterprises to invest in most sectors of the economy. Although opposition to its passage may be
mounting, the new draft law only requires investors to register, rather than seek approval for new
investment. This law also proposes the removal of all regulations that discriminate against foreign
firms, introducing full national treatment of foreign investors (Investment Review Board, BKPM, 2000).
������������������� ����!���������������
Even without the new draft law, foreign companies can own all the issued capital of a newly established
Indonesian company and need not divest a majority of shares at some future date. FDI is restricted
in a few sectors because of national interest; in those sectors, investors need only sell a nominal
percentage of equity after 15 years. These reforms augment successive changes since 1994 to
Indonesia’s 1967 foreign investment law.
� � � � � � � � � � � � � � � � � �
�� �"
Reforms in 1998 allowed foreign companies to operate retail outlets in Indonesia, with some restrictions,
and fully opened the distribution sector to foreign investment. Foreign manufacturers now can distribute
goods produced locally and apply for permits to import and distribute other products.2 Foreigners can
establish holding companies to facilitate debt restructuring in local businesses.
In August 2000, the foreign investment law’s negative list was amended to allow foreign investors
to enter joint ventures with local partners for medical services and telecommunications.3 Maximum
permissible foreign ownership is unspecified as yet, but expected to be 95 per cent. If passed, the
Government’s new draft law would reduce further the number of sectors prohibiting foreign investment.
Since 1994, Indonesia has allowed foreign investment in infrastructure sectors including sea ports,
electricity generation and distribution for public use, shipping, airlines, drinking water supply, public
railways and nuclear power generation. These projects require a joint venture with the Indonesian
partner holding at least 5 per cent of shares in the investment.
Indonesian law does not recognise freehold land rights. Instead, the Government holds all land
under a system of land titling. Hence neither foreigners nor nationals can own land, but they take out
long term leases which grant the right to use or improve the land. Investors take over an existing
lease when investing in commercial property.
���� ��������"��!##��������� ������
In early 2000, the Government streamlined licensing procedures for foreign investment; this reform
promises to reduce the number and duration of application procedures. Approved applications remain
valid for up to three years without being implemented, instead of only one year under the previous law.
Despite recent reforms to foreign investment regulation and laws, implementation is lagging.
The Investment Review Board, BKPM, still applies conditions before approving foreign investment
applications. BKPM often requires foreign buyers to reserve a percentage of shares for local or
original owners. If the local firm is distressed, BKPM may ask foreign buyers to inject capital in
addition to assuming outstanding loans. In certain sectors, foreign investors also must cooperate
with small and medium sized firms through partnerships.
� ��������������$���% �����&���
Indonesia’s competitively valued exchange rate and large supply of relatively low cost labour is
generating good investment prospects in export-oriented industries. Large industrial estates across
Indonesia, but particularly concentrated on Java, are enjoying rapid export growth and already play
host to a wide range of foreign operators. These investors report they are unaffected by banking
sector problems because they can access offshore funds, and their output and profits have risen
significantly since 1998. Locating close to population centres ensures a good supply of workers.
The approval process for investing in these estates also is very efficient (World Bank, 2000).
2 Companies involved in distribution cannot retail directly, but can form separate foreign investment retail companies to do this.
3 The negative list defines sectors closed or partially closed to foreign investment; prior to August 2000 it was last revised in July 1998.
� � � � � � � � � � � � � � � � � � � � � � � � �
�� �#$
!�������'�!(�!��
Before 2004, the Indonesian Bank Restructuring Agency, IBRA, responsible for most government
asset sales, plans to sell up to 80 per cent of the Rp. 564 trillion (US$65 billion) of assets it holds; this
equals around 57 per cent of Indonesia’s GDP (World Bank, 2000).4 (See Chapter 7 - Financial
Sector Restructuring and Chapter 8 - Corporate Restructuring.) As domestic savings are insufficient
to purchase these assets, foreign investment will be crucial for the success of this program.
IBRA’s assets fall into three categories:
• government equity in recapitalised and taken over banks, Rp. 139 trillion (US$16 billion)
• non-performing and performing loans, and associated collateral transferred from recapitalised,
state owned, frozen and taken over banks, Rp. 298 trillion (US$34 billion)
• corporate assets transferred by banks to IBRA in return for Bank Indonesia liquidity credits,
Rp. 127 trillion (US$14.6 billion).
!������'!�)��*���+
Despite delays in 2000 with some planned bank sales, the ongoing sale of IBRA’s sizeable bank
equity holdings may present good opportunities for foreign banks and other investors wishing to
expand into Indonesia. New regulations allow foreign investors to acquire up to 99 per cent of bank
equity. IBRA has removed the non-performing loans of transferred banks and is close to fully
recapitalising them; it hopes to sell them via public offerings of shares and private placements with
strategic investors. Australian banks are efficient, large by international standards and have high
standards of prudential and risk management; they should be well placed to access these opportunities.
In October 2000, the Government announced the planned sales of Bank Central Asia and
Bank Niaga would be delayed until 2001. IBRA previously had announced it would complete all
��������������������������� �������
While the Asian financial crisis severely weakened most Indonesian banks, Australian financial
institutions and investors still can acquire sound Indonesian banks. In late 1999 and early
2000, ANZ increased its share in Bank Panin from 4.9 to 11 per cent, and holds an option to
increase its share further to 28 per cent. ANZ also has a technical service agreement to
support Panin in human resources, information technology, trade and risk management
(Asia Pulse, 15 April 2000). In addition, in May 1999, ANZ acquired the credit card operation
of Bank Papan Sejahtera from IBRA for US$4 million.5
Source: ANZ, 2000.
4 The total value of the assets IBRA holds could increase further as bank shareholders unable to repay the liquidity assistance
provided by Bank Indonesia and who exceeded the legal lending limits on loans to their affiliated companies transfer
additional assets to IBRA’s holding companies.
5 This business cost ANZ A$7 million. ANZ also has negotiated with IBRA on behalf of clients interested in buying industrial assets.
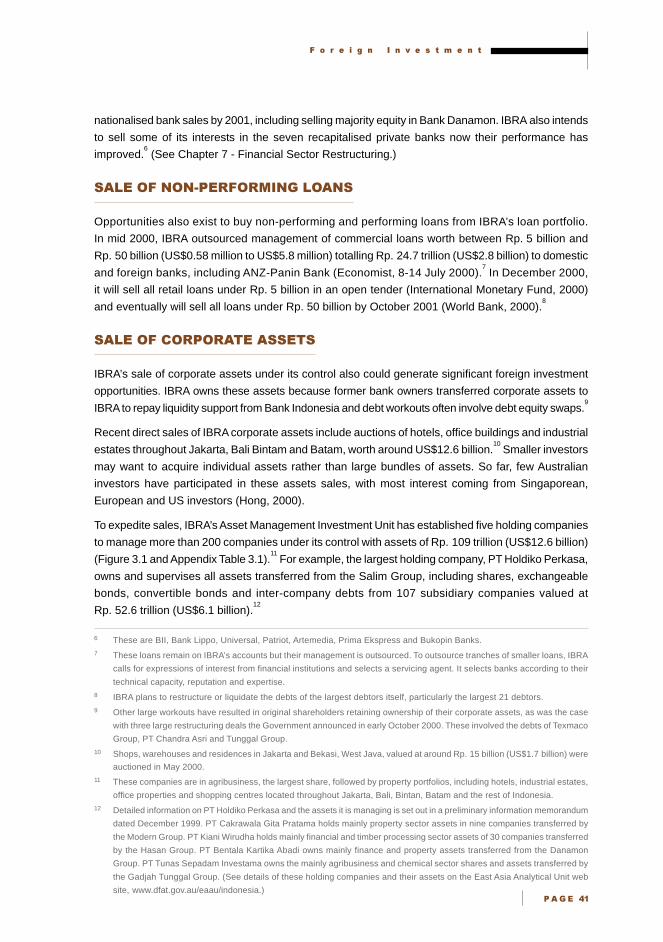
� � � � � � � � � � � � � � � � � �
�� �#%
nationalised bank sales by 2001, including selling majority equity in Bank Danamon. IBRA also intends
to sell some of its interests in the seven recapitalised private banks now their performance has
improved.6 (See Chapter 7 - Financial Sector Restructuring.)
!���������, ������������!�
Opportunities also exist to buy non-performing and performing loans from IBRA’s loan portfolio.
In mid 2000, IBRA outsourced management of commercial loans worth between Rp. 5 billion and
Rp. 50 billion (US$0.58 million to US$5.8 million) totalling Rp. 24.7 trillion (US$2.8 billion) to domestic
and foreign banks, including ANZ-Panin Bank (Economist, 8-14 July 2000).7 In December 2000,
it will sell all retail loans under Rp. 5 billion in an open tender (International Monetary Fund, 2000)
and eventually will sell all loans under Rp. 50 billion by October 2001 (World Bank, 2000).8
!������&�� ��!���!��
IBRA’s sale of corporate assets under its control also could generate significant foreign investment
opportunities. IBRA owns these assets because former bank owners transferred corporate assets to
IBRA to repay liquidity support from Bank Indonesia and debt workouts often involve debt equity swaps.9
Recent direct sales of IBRA corporate assets include auctions of hotels, office buildings and industrial
estates throughout Jakarta, Bali Bintam and Batam, worth around US$12.6 billion.10
Smaller investors
may want to acquire individual assets rather than large bundles of assets. So far, few Australian
investors have participated in these assets sales, with most interest coming from Singaporean,
European and US investors (Hong, 2000).
To expedite sales, IBRA’s Asset Management Investment Unit has established five holding companies
to manage more than 200 companies under its control with assets of Rp. 109 trillion (US$12.6 billion)
(Figure 3.1 and Appendix Table 3.1).11
For example, the largest holding company, PT Holdiko Perkasa,
owns and supervises all assets transferred from the Salim Group, including shares, exchangeable
bonds, convertible bonds and inter-company debts from 107 subsidiary companies valued at
Rp. 52.6 trillion (US$6.1 billion).12
6 These are BII, Bank Lippo, Universal, Patriot, Artemedia, Prima Ekspress and Bukopin Banks.7 These loans remain on IBRA’s accounts but their management is outsourced. To outsource tranches of smaller loans, IBRA
calls for expressions of interest from financial institutions and selects a servicing agent. It selects banks according to their
technical capacity, reputation and expertise.8 IBRA plans to restructure or liquidate the debts of the largest debtors itself, particularly the largest 21 debtors.9 Other large workouts have resulted in original shareholders retaining ownership of their corporate assets, as was the case
with three large restructuring deals the Government announced in early October 2000. These involved the debts of Texmaco
Group, PT Chandra Asri and Tunggal Group.10 Shops, warehouses and residences in Jakarta and Bekasi, West Java, valued at around Rp. 15 billion (US$1.7 billion) were
auctioned in May 2000.11 These companies are in agribusiness, the largest share, followed by property portfolios, including hotels, industrial estates,
office properties and shopping centres located throughout Jakarta, Bali, Bintan, Batam and the rest of Indonesia.12 Detailed information on PT Holdiko Perkasa and the assets it is managing is set out in a preliminary information memorandum
dated December 1999. PT Cakrawala Gita Pratama holds mainly property sector assets in nine companies transferred by
the Modern Group. PT Kiani Wirudha holds mainly financial and timber processing sector assets of 30 companies transferred
by the Hasan Group. PT Bentala Kartika Abadi owns mainly finance and property assets transferred from the Danamon
Group. PT Tunas Sepadam Investama owns the mainly agribusiness and chemical sector shares and assets transferred by
the Gadjah Tunggal Group. (See details of these holding companies and their assets on the East Asia Analytical Unit web
site, www.dfat.gov.au/eaau/indonesia.)
� � � � � � � � � � � � � � � � � � � � � � � � �
�� �#&
F i g u r e 3 . 3
Agribusiness and Property Dominate IBRA Assets
IBRA’s Corporate Assets for Eventual Sale, by Sector
Source: Deacons, 2000.
Independent accounting firms under IBRA’s direction have valued all corporate assets IBRA controls
and determined appropriate sale prices. However, IBRA has indicated it will not offer ‘fire sale’ prices
and will wait until the market improves before offering many assets for sale; the August 2000 sale of
a package of Bank Central Asia shares demonstrates this approach.13
IBRA’s disposal of corporate assets started in 1999 and will continue until 2004 and include:
• initial public offers, selling shares to the public through the Jakarta or Surabaya Stock Exchanges
• share placements, selling shares to identified purchasers
• asset sales, selling specific assets to third parties
• settlement with joint venture partners, selling shares in companies under IBRA’s control to joint
venture partners, such as shares in PMA company to joint venture partner, Dow Chemical Company
• strategic sales, involving the sale of shares to identified strategic buyers, where purchasers need
particular expertise in the relevant business (Indonesian Bank Restructuring Agency, 2000b).
Asset sales to strategic investors are more likely to maximise revenue than other approaches, so
increasingly IBRA may favour this strategy. IBRA recommends investors interested in specific sectors
13 IBRA stated it would set a fair price for the public offering (Jakarta Post, 29 April 2000). The sale price of Rp.1 400 per share
was at the lower end of the indicated range of Rp. 1 350 to Rp. 1 750 per share.
Others 3%
Cement 3%
Plywood 5%
Coal and granite mining 3%
Chemicals 14%
Manufacturing products 3%
Food 4%
Motor vehicles 6%
Property 24%
Agribusiness 35%

� � � � � � � � � � � � � � � � � �
�� �#
register their interest with it, so it can inform them of relevant upcoming asset sales.14
IBRA does not
recommend prices for assets on sale, encouraging prospective investors to undertake detailed
accounting and legal due diligence of assets.
��������������
Although purchasing IBRA’s assets can be risky, especially for investors unfamiliar with Indonesia,
buyers can apply strategies to minimise risk. Major risks include the distressed nature of many
assets, and lack of financial information, especially potential undisclosed liabilities. Independent
auditing in collaboration with IBRA’s own appraisal can help manage risks. While IBRA encourages
investors to complete comprehensive due diligence assessments before acquiring assets, in some
cases, incomplete record keeping makes this a time-consuming process, particularly if former owners
are uncooperative. Other risks relate to the broad uncertainty surrounding the future of the Indonesian
social and institutional environment, and the volatility of the rupiah.
����������������-
The Wahid administration, the first democratic government for two generations, is attempting to build
its economic credentials with an increasingly empowered electorate. However, the transition to a
new political system and its associated political instability complicates the implementation of the
economic reform program in the short term, posing risks to the investment environment. (See Chapter 2 -
Political Developments).
����������������.�!�����
Complex financial relationships, including inter-firm obligations, often feature in corporate assets
originally part of an industrial conglomerate. Detailed financial information on assets generally
is not publicly available.15
Once the asset is sold, investors can face third party claims. Normally,
obtaining the information on claims on assets is difficult, given the level of enforcement of financial
disclosure before the crisis; however, IBRA independently assessed assets under its control and fully
discloses claims on assets to interested investors. IBRA also ensures investors receive full title when
purchasing an asset; this reduces the risks of third party claimants.16
14 IBRA holding companies have sent to investors more than 200 requests for bids, with approximately 50 per cent expressing
interest. Around 20 per cent have submitted preliminary bids, with around 80 per cent of these from investors in Singapore,
Malaysia, Japan, Germany, UK and the United States (Indonesian Bank Restructuring Agency, 2000a).
15 The relevant holding company appoints a financial advisor for each asset disposal, who prepares a detailed information
memorandum on the asset and distributes this to all interested parties. However, all parties must sign a confidentiality
agreement before conducting due diligence of the asset. As of October 2000, IBRA had valued assets of PT Holdiko
Perkasa, but its information memorandums are not yet publicly available.
16 In the case of equity, investors can conduct due diligence to confirm the legitimacy of the title. IBRA also provides indemnity
in some cases, as reflected in the asset price. IBRA signed Asset Transfer Agreements with all debtors when assets were
transferred, so it has sole ownership. However, this process ultimately relies on the willingness of courts to enforce these
titles. In some instances, such as Bank Bali, the court failed to do so.
� � � � � � � � � � � � � � � � � � � � � � � � �
�� �##
Potential investors should seek access to shareholder agreements drafted between IBRA and the
original owners; these define the assets transferred to IBRA and strategies for meeting debts owed to
banks IBRA took over or closed down.17
A new compliance team for each holding company monitors
individual companies and identifies specific problems. IBRA also intends to adopt a corrective action
program, including changing company management. Potential investors must ask company directors
about undisclosed tax liabilities, as these need to be factored into the asset’s purchase price.
/��0�����.������� ��������������
Remaining sensitive to the interests of stakeholders, including the workforce, is critical to a smooth
transition of asset ownership. Existing management retains considerable influence in many companies.
Unions, long suppressed under the New Order regime, now operate more freely and are becoming
very active. Consequently, a successful investment would include existing management, labour
representatives and possibly the local community in the acquisition process. It would advise them of
the long term management strategy, stressing the likely benefits of the takeover, including financial
rehabilitation of the company, employment maintenance and creation, management and marketing
expertise, and technology transfer.
���������0�
Because courts have questioned IBRA’s ownership of assets, investors must confirm the transfer of
assets to IBRA was legitimate. To overcome past problems in this area, the Government is
working to improve the legal system. Amendments to Indonesia’s bankruptcy law and a new commercial
court system aim to improve outcomes, especially the prosecution of debtors. The Government
also has responded by establishing an official watchdog, the Ombudsman Committee, to oversee
IBRA transactions.18
Importantly, foreign investors may be restricted to acquiring a minority of a company’s shares,
depending on the terms of the shareholder agreement reached between IBRA and bank shareholders.
Potential investors should investigate this issue before registering their interest. Where such restrictions
do not apply, smaller investors are advised to form consortiums with other interested investors to
secure a controlling interest, as occurred in the sale of Astra.
Foreign investors buying shares must ensure shares are not the subject of third party claims, and the
relevant company was incorporated properly and approved by the Ministry of Law and Legislation.19
17 In all cases, original shareholders committed not to reduce the value of the holding company assets. However, IBRA is not
yet legally obliged to supply these agreements to prospective investors. Further, where shareholders provide IBRA with a
fiduciary transfer (a form of Indonesian security over tangible and non-tangible assets), they cannot sell or transfer the
assets to third parties without IBRA’s consent. IBRA confirmed in the July 2000 Letter of Intent, it would exercise greater
control over the pledged assets and take steps to preserve the value of companies in the holding companies.
18 The Ombudsman Committee monitors the conduct of IBRA’s employees and is chaired by individuals of high standing. The
Ombusdman Committee collects and processes public and internal complaints.
19 The difficulties faced by Canadian insurer Manulife in buying the shares of its bankrupt joint venture partner illustrate some
of the obstacles to purchasing corporate assets.
� � � � � � � � � � � � � � � � � �
�� �#�
Indonesia does not have a complete central Register of Companies, so the onus is on purchasers to
confirm these conditions are met. Investors taking over a going concern also must ensure all operating
licences are valid, particularly if investors plan to expand or diversify the business.
&!�����������!���!��
!����
Building on lessons learned from the failed sale of Bank Bali, IBRA’s sale of 39.5 per cent of Astra to
a foreign consortium was highly transparent, sought to include key stakeholders, and generally was
welcomed by the market. IBRA adopted a strategic bidding process involving several rounds and
including the winning consortium, led by Singapore’s vehicle distributor Cycle and Carriage Ltd,
US Newbridge Capital and Gilbert Global Equity consortium.20
By March 2000, PT Astra International
was IBRA’s biggest sale.
'��0�&�������!���
In May 2000, IBRA divested 22 per cent of Bank Central Asia, one of Indonesia’s largest private
banks, previously owned by the Salim family.21
The sale was highly transparent, via an initial public
offering that was fully subscribed. Foreign investors including from Hong Kong, Europe and Singapore,
purchased 25 per cent of the 662.4 million shares offered, exceeding the 20 per cent sales target for
foreign investors (Asia Daily News, 26 May 2000). IBRA rejected strategic offers by investors,
publicly stating that to maximise transparency, it would only offer shares through the initial public
offering. While the offer was successful, it achieved only 13 per cent of the book value of the shares
(World Bank, 2000).
�����!'��������'�!�!���!��
The Indonesian Government has directed IBRA to complete its assets sales by 2004. IBRA plans to
sell assets worth Rp.18.9 trillion (US$2.2 billion) in the nine month financial year to the end of
December 2000; Rp. 16.3 trillion should come from corporate and banking asset sales. It had realised
Rp. 12 billion by the end of September (World Bank, 2000). While IBRA delayed asset sales in 1999
and into 2000, including shares in Bank Central Asia and Bank Niaga, in the belief that flooding the
market would lower prices, it plans to reach its target by substituting other assets for sale (Table 3.2).
IBRA now is trying to attract foreign investors using road shows.22
Sale timetables are on IBRA’s web
site, www.bppn.go.id. IBRA is targeting a range of assets sales over 2000-01 (Appendix Table 3.1).
20 The consortium also included Batavia Investment Management Ltd; Lazard Asia Fund, a unit of the French group Lazard
Freres; PT Bhakti Investama; and the Government of Singapore Investment Corporation, GSIC.
21 Bank Central Asia booked a net profit of Rp. 641.29 billion (US$85 million) in 1999 compared to a loss of US$5 billion in 1998.
22 Road shows to Singapore, Hong Kong, the United States and Europe took place in mid 2000. One to Australia is planned for
early December 2000.

� � � � � � � � � � � � � � � � � � � � � � � � �
�� �#�
T a b l e 3 . 2
��������������� ��
IBRA’S Planned Sale Details and Methods
Company Industry Method of Sale Advisor
Indomarket Mini market chain Initial public Danareksa,
offering Nikko Securities
Indomilk/Indolakto Milk processing Strategic sale Chase Jardine
Indomiwon Food seasoning Strategic sale KPMG
Indosiar Television station Loan refinancing, PWC, Trimegah
initial public offering Securities
Mosquito Coil Group Mosquito repellant coils Strategic sale Chase Jardine
Salim Oleochemicals Chemicals Strategic sale Chase Jardine
Salim Palm Plantation CPO palm oil plantations Strategic sale Goldman Sachs
Salim Coal Mining Strategic sale BNP Peregrine
Sulfindo Chemicals Strategic sale Chase Jardine,
Bhakti Investama
Pangansari Utama Industrial catering Strategic sale Deloittes
Puri Imperium Apartment Property Auction na
Bentala Property Auction na
Diners Jaya Indonesia Credit card Strategic sale na
Ficor Sekuritas Securities Strategic sale AAJ Associates
Bank Hanvit Indonesia Bank Sale of minority na
interest
Source: Indonesian Bank Restructuring Agency, 2000b.
In 2000, the Singaporean Government and Singaporean investors showed strong interest in acquiring
assets, including hotels and buildings. To encourage Singaporean interest, the Singaporean
Government pledged US$500 million in loan facilities for its investors to acquire IBRA assets and
another US$400 million in guarantees for its businesses investing in Indonesia.
!�������!�������� ���
Another opportunity for investment arises from the Government’s privatisation program. In 1999, to
increase enterprise efficiency and fund expensive financial sector restructuring, the Indonesian
Government committed to privatising around 140 state enterprises, SEs. SEs operate alongside
private businesses in all major sectors, including natural resources, infrastructure, finance, agriculture
and transport (Table 3.3). A government masterplan outlines the firms to be privatised, preferred
method of privatisation and sales timetable.
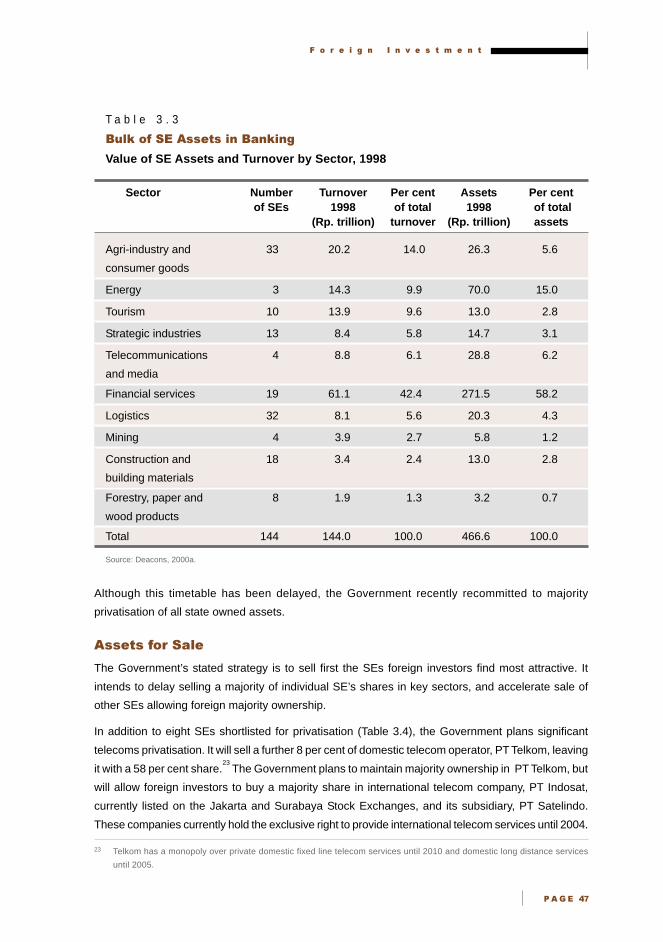
� � � � � � � � � � � � � � � � � �
�� �#
T a b l e 3 . 3
!� "��#�������������! �"���
Value of SE Assets and Turnover by Sector, 1998
Sector Number Turnover Per cent Assets Per centof SEs 1998 of total 1998 of total
(Rp. trillion) turnover (Rp. trillion) assets
Agri-industry and 33 20.2 14.0 26.3 5.6
consumer goods
Energy 3 14.3 9.9 70.0 15.0
Tourism 10 13.9 9.6 13.0 2.8
Strategic industries 13 8.4 5.8 14.7 3.1
Telecommunications 4 8.8 6.1 28.8 6.2
and media
Financial services 19 61.1 42.4 271.5 58.2
Logistics 32 8.1 5.6 20.3 4.3
Mining 4 3.9 2.7 5.8 1.2
Construction and 18 3.4 2.4 13.0 2.8
building materials
Forestry, paper and 8 1.9 1.3 3.2 0.7
wood products
Total 144 144.0 100.0 466.6 100.0
Source: Deacons, 2000a.
Although this timetable has been delayed, the Government recently recommitted to majority
privatisation of all state owned assets.
!�������������
The Government’s stated strategy is to sell first the SEs foreign investors find most attractive. It
intends to delay selling a majority of individual SE’s shares in key sectors, and accelerate sale of
other SEs allowing foreign majority ownership.
In addition to eight SEs shortlisted for privatisation (Table 3.4), the Government plans significant
telecoms privatisation. It will sell a further 8 per cent of domestic telecom operator, PT Telkom, leaving
it with a 58 per cent share.23
The Government plans to maintain majority ownership in PT Telkom, but
will allow foreign investors to buy a majority share in international telecom company, PT Indosat,
currently listed on the Jakarta and Surabaya Stock Exchanges, and its subsidiary, PT Satelindo.
These companies currently hold the exclusive right to provide international telecom services until 2004.
23 Telkom has a monopoly over private domestic fixed line telecom services until 2010 and domestic long distance services
until 2005.

� � � � � � � � � � � � � � � � � � � � � � � � �
�� �#!
T a b l e 3 . 4
$ %����������� ���� ����
Shortlisted SEs for Early Sale
State enterprise Industry
PT Pupuk Kaltim Fertiliser maker
PT Bukit Asam Coal mining
PT Aneka Tambang Coal mining
PT Perkebunan Nusantara PN III Plantation
PT Perkebunan Nusantara PN IV Plantation
PT Indo Farma Pharmaceuticals
PT Kimia Farma Pharmaceuticals
PT Angkasa Pura II Airport operator
Source: Deacons, 2000a.
In both cases, the Government plans to rationalise their telecom operations, including reviewing their
non-core business before their privatisation (International Monetary Fund, 2000).
�����������-
Eventually, the Government is expected to sell a majority of all state assets. As part of the revised
masterplan, the Government set out the criteria for selecting suitable privatisation methods for each SE.
Initial public offering
SEs will seek to sell shares though initial public offerings on the stock exchange to attract new capital
for debt refinancing or business expansion, and when business prospects are relatively strong.
Before listing, firms must record positive profits for two consecutive years, and the Capital Markets
Regulator, Bapepam, must determine the SE’s accounts comply with capital market laws.
Strategic sales
The Government will pursue strategic sales if a SE is deemed profitable, has good prospects, and
needs a particular technology, marketing network or professional staff. In the bidding process, it will
favour firms offering these qualities.
Liquidation
When a SE’s business prospects are poor and declining; it has a high and unsustainable level of
gearing; and it is projected to be consistently loss making, the Government is likely to liquidate it.
Firms that are difficult to restructure or lack qualified management also are more likely to be liquidated.
The Government will consider the possible effects on public service provision before it decides whether
to liquidate.

� � � � � � � � � � � � � � � � � �
�� �#"
Employee buy outs
Employee buy outs will be used where the SE is profitable or has reasonable business prospects, owns
a relatively low level of fixed assets, and has relatively highly skilled employees and/or management.
�����������������������
The Government retains its in principle commitment to improve SEs’ financial structures before sale.
Steps include replacing directors, improving internal governance and reviewing existing contracts.
The Government is auditing boards of commissioners and, especially for SEs likely to remain in
government hands, developing statements of corporate intent. SEs also will be publicly audited and
announce their financial statements through a company registry. The Government indicated it will
consider the costs and benefits of restructuring to determine if this will increase the asset’s
attractiveness to investors. Also, the Government recently canvassed having a long term, share buy
back option in profitable SEs (Jakarta Post, 5 September 2000).
�� ������
The US$400 million raised from privatising five SEs24
by the end of 1999-2000 was considerably less
than the US$1.5 billion originally targeted from selling 12 enterprises. This shortfall is due to government
attempts to restructure SEs before sale, poor market conditions that threatened to reduce prices and
resistance from SE management.
��������������
Managing risks is critical to investing successfully in SEs. Potential investors must thoroughly audit
accounts and explain their intentions to shareholders, workers and managers.
&��#����������������
The Government advises potential investors to conduct due diligence before registering their interest
in assets, as information on SEs’ financial position is difficult to access. Prevailing accounting standards
and potentially uncooperative management may make SE due diligence complex.
Potential investors must examine closely a SE’s viability before outlaying large amounts of capital.
Contracts between the enterprise and third parties may not be commercially viable; consequently,
investors need to clarify their right to nullify these before purchase. New government laws ensuring
access to relevant financial information, and government efforts to restructure and clarify the financial
position of these enterprises should help.
24 These included part sale of PT Telkom, PT Semen Gresik, PT Pelindo and PY Krakatau Steel.
� � � � � � � � � � � � � � � � � � � � � � � � �
�� ��$
������ ����&������
As most government assets are slated for selling in stages, full control of a SE may not be a medium
term option. Before purchase, investors will need to clarify and formalise their rights to manage the
financial affairs of the enterprise, if they hold a minority share. Investors also should ensure
management agrees to their business plan before the purchase.
�##������� � �������������� ���
Investors must consult with and include existing management in new initiatives. Privatisation must be
transparent to avoid shareholder, staff or public accusations that foreigners are being favoured.
Selling the benefits of the privatisation to the community and labour groups is an important part of
this process.
&!�������
The following case studies highlight the importance of managing these issues when investing in a SE.
�� ����.�������.����
Privatisation of Indonesia’s leading ports at Jakarta and Surabaya was transparent and inclusive,
and received widespread public and management support. P&O Ports Australia successfully bid for
Surabaya port operator, PT Pelindo III, from a field of four foreigners, see box below (P&O Ports
Australia, 2000a).25
Hong Kong based Hutchison Whampoa acquired a 51 per cent interest in Pelindo II,
outbidding the AP Moller Group, International Container Terminal Services of the Philippines,
P&O Ports Australia, Peony Investment SA and a joint venture between US based Stevedoring Services
and the locally controlled shipping line, Samudera Indonesia.
��)��0���������
Poor transparency prevented the sale of PT Krakatau Steel to foreigners. Dutch company, Ispat
International NV, signed a memorandum of understanding with Krakatau Steel allowing it alone to
conduct a due diligence of the company (Ispat, 1998).26
This feature of the sale, along with concerns
the share price was too low, and considerable labour and management resistance, caused the
privatisation to be abandoned.
��� ��������0
Labour resistance also thwarted the majority sale of Semen Gresik. Mexican company Cemex secured
a 35 per cent share in the company following the first round of bidding, and expected to purchase a
further 16 per cent in a second bidding round that included three other firms.27
Workers at Gresik’s
Semen Padang unit in Sumatra protested against majority foreign ownership, forcing the Government
to sell only a further 14 per cent to Cemex.
25 These were American Samudra Indonesia, Fountain Head of France, International Container Terminal Services of the
Philippines and P&O Ports Australia.
26 Ispat decided not to proceed with the terms of its memorandum of understanding to conduct the due diligence.
27 These included Germany’s Heidelberger Zement, Switzerland’s Holderbank and France’s Lafarge Asia Pacific.

� � � � � � � � � � � � � � � � � �
�� ��%
�������������������
P&O Ports acquired 49 per cent of the SE container terminal at Tanjung Perak, Surabaya in
1999, resulting in a joint venture company, PT Terminal Petikemas Surabaya. This follows
P&O’s joint venture investment in APT Kuala Pelabuhan Indonesia in Irian Jaya in 1995, to
perform logistics functions at the Freeport Copper and Gold Mine.
An international bank administered the public bidding process that led to the Surabaya port
investment. P&O carefully sought to understand the needs of stakeholders, including the
partner company, management and employees, to ensure the sale was a success. As a
result, management, labour and existing shareholders have cooperated since the investment
was made. While some delays occurred in government approval of a necessary stevedoring
tariff rise, this rise was approved. P&O advise investors interested in Indonesia to research the
market carefully and seek advice from many sources to ensure they form a balanced view.
Source: P&O Ports Australia, 2000b.
����������!������
Devolving government responsibilities to the regions introduces new complexities to the investment
application process, and companies should remain sensitive to increasing decision making authority
in the regions. The increasing prominence of regional agencies in the investment process introduces
potential inconsistencies. New regional levies and charges could be introduced. (See Chapter 2 -
Political Developments.) For most potential investments in Java, investors are reasonably protected from
many of these risks; however, infrastructure and mining companies are likely to be affected.
��$�������������&�����������
Rapidly growing demand for infrastructure, education and health services reflects Indonesia’s
development priorities and provides scope for foreign investment.
��������������
FDI opportunities are emerging in privately provided infrastructure, given expanding demand
and the Government’s reduced capacity to fund new infrastructure over the medium term.
Priority areas include transport, public sanitation, water treatment, telecommunications and
possibly electricity (Table 3.5). However, ongoing disputes with foreign joint venture independent
power producers over US dollar denominated power supply contracts signed by the Soeharto
Government will reduce market confidence in Indonesia unless a mutually acceptable outcome can
be negotiated.28
The Government recently announced it would continue to implement 27 infrastructure
projects suspended in 1997. It has identified a further 190 priority project proposals costing a total
of Rp. 5.3 trillion (US$6.2 billion) (BAPPENAS, 2000).
28 A few of these power producers are selling power to the Indonesian electricity authority, PLN, but for well below the contracted
price. Electricity demand is expected to exceed supply again reasonably soon, so incentives will increase to reach a
solution to outstanding IPP contract disputes.
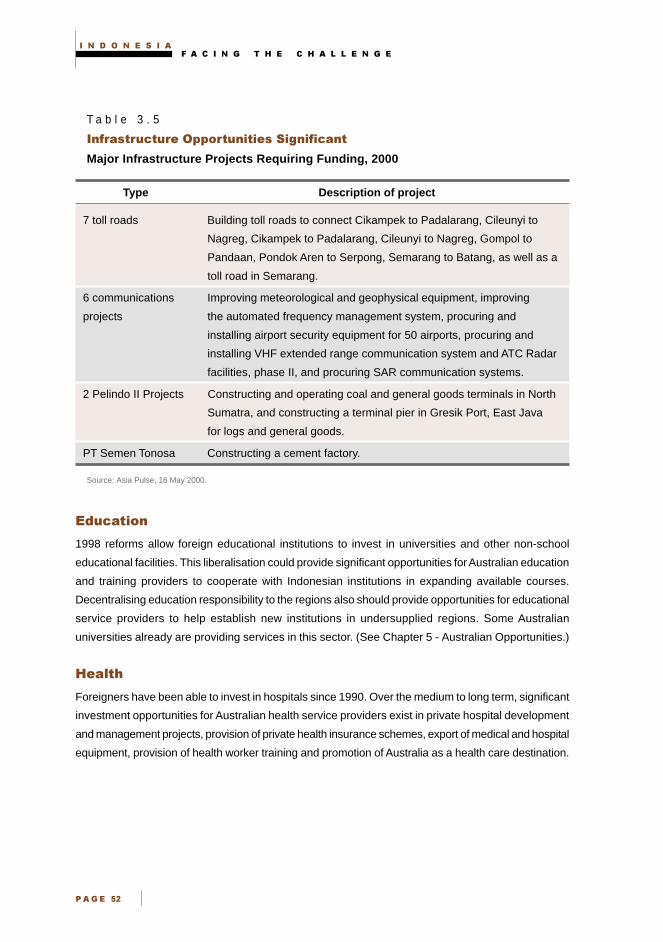
� � � � � � � � � � � � � � � � � � � � � � � � �
�� ��&
T a b l e 3 . 5
��#� ����������������������������#�� ��
Major Infrastructure Projects Requiring Funding, 2000
Type Description of project
7 toll roads Building toll roads to connect Cikampek to Padalarang, Cileunyi to
Nagreg, Cikampek to Padalarang, Cileunyi to Nagreg, Gompol to
Pandaan, Pondok Aren to Serpong, Semarang to Batang, as well as a
toll road in Semarang.
6 communications Improving meteorological and geophysical equipment, improving
projects the automated frequency management system, procuring and
installing airport security equipment for 50 airports, procuring and
installing VHF extended range communication system and ATC Radar
facilities, phase II, and procuring SAR communication systems.
2 Pelindo II Projects Constructing and operating coal and general goods terminals in North
Sumatra, and constructing a terminal pier in Gresik Port, East Java
for logs and general goods.
PT Semen Tonosa Constructing a cement factory.
Source: Asia Pulse, 16 May 2000.
�.�������
1998 reforms allow foreign educational institutions to invest in universities and other non-school
educational facilities. This liberalisation could provide significant opportunities for Australian education
and training providers to cooperate with Indonesian institutions in expanding available courses.
Decentralising education responsibility to the regions also should provide opportunities for educational
service providers to help establish new institutions in undersupplied regions. Some Australian
universities already are providing services in this sector. (See Chapter 5 - Australian Opportunities.)
$����"
Foreigners have been able to invest in hospitals since 1990. Over the medium to long term, significant
investment opportunities for Australian health service providers exist in private hospital development
and management projects, provision of private health insurance schemes, export of medical and hospital
equipment, provision of health worker training and promotion of Australia as a health care destination.
� � � � � � � � � � � � � � � � � �
�� ��
������������&�����
Due to fiscal pressures, the Government is reassessing many foreign investment incentives.
However, it has shelved plans to abandon tax concessions in the Batam free trade zone, at least for
the present; and new tax exemptions encourage investment in pioneer industries, including machinery
and electronic products.29
So these incentives do not favour entrenched interests, the Government
only allows new companies to apply for tax exemptions. Tax exemptions can last up to eight years for
companies located outside Java and Bali, and up to five years for companies located in Java and
Bali. An additional year may be granted if companies:
• employ at least 2 000 Indonesians once commercial production is underway
• have at least 20 per cent ownership by cooperatives
• invest more than US$200 million in assets other than land and buildings.
A project must be completed within five years of government approval. The tax exemption takes
effect when the company completes project development and begins commercial production. Foreign
investors and local investors must apply to the Minister of Trade and Industry for these exemptions.
�� ��&!����
Recent foreign investment regime liberalisation and major IBRA and SE asset sales expected from
2000 to 2004 should provide foreign investors with good opportunities to acquire some strategic shares
in Indonesian industries. While social instability in some provinces and the need for ongoing economic
and legal reforms may affect the assessment of investment opportunities, investors undertaking
thorough due diligence and negotiating sensitively with stakeholders may make valuable acquisitions.
While IBRA and SE asset sales were delayed in 1999 and 2000, progress should be steadier in 2001
and beyond. Potential investors need to be prepared by completing their due diligence, so they can
participate as asset sales proceed.
29 Pursuant to Presidential Decree No. 7/1999.

� � � � � � � � � � � � � � � � � � � � � � � � �
�� ��#
A p p e n d i x T a b l e 3 . 1
�!&���������'������ �������
Sectoral Distribution of IBRA’s Five Holding Companies
Holding companies Sectors represented Number ofcompanies
PT Holdiko Perkasa Chemicals 13
Coal and granite 5
Communications 1
Food and consumer products 10
Multi industry 6
Oil and fats 3
Palm plantations 24
Plywood 4
Property 25
Publicly listed companies 6
Sugar 4
Textiles and garments 3
Trading 3
PT Cakrawala Gita Pratama Hotels and resorts 1
Property 8
PT Kiani Wirudha Catering and food distribution 1
Glue and chemicals 2
Timber/logging 8
Financial services and others 9
Plywood 4
Pulp 4
Shipping 2
PT Bentala Kartika Abadi Financial services/related business 10
Property 12
PT Tunas Sepadan Investama Automotive/tyre 3
Chemical/petrochemical 6
Agribusiness/shrimp aquaculture 12
Source: PT Holdiko, 1999; PT Cakrawala Gita, 1999; PT Tunas Sepadan Investama, 1999; PT Kiani Wirudha, 2000; PT Bentala KartikaAbadi, 2000.

� � � � � � � � � � � � � � � � � �
�� ���
�������&�
ANZ, 2000, Information supplied to the East Asian Analytical Unit, October, Jakarta.
BAPPENAS (National Development and Planning Board), 2000, Project and Technical Assistance
Proposal, BAPPENAS, Jakarta.
CEIC, 2000, Asian Economic Database, Hong Kong, accessed on 1 December 2000.
Deacons 2000a, ‘Report to the East Asia Analytical Unit on Foreign Investment Opportunities in
Indonesia’, July-October, Jakarta.
___ 2000b, ‘Investment in Infrastructure’ and ‘Mergers and Acquisitions’ DGJ Consultant Summaries,
May, Jakarta.
Economist Intelligence Unit, 2000, ‘Country Forecast Indonesia’, EIU, London.
Hong, J., 2000, Deacons’ interview with the head of Jones Lang La Salle, July, Jakarta.
Indonesian Bank Restructuring Agency, 2000a, ‘Investment in Indonesia Strategy and Opportunity,
IBRA’s Asset Divestiture Policy’, www.bppn.go.id, accessed on 25 April 2000.
___ 2000b, IBRA Roadshow Presentation, October, Jakarta.
International Monetary Fund, 2000, Letter of Intent, May 2000.
Investment Review Board, BKPM, 2000, Information supplied to Deacons, May, Jakarta.
Ispat, 1998, ‘Ispat International Announces Intention to Participate in Open Bid for Privatisation of
PT Krakatau Steel in Indonesia’, news release,18 June, Jakarta.
P&O Ports Australia, 2000a, Information supplied to Deacons, May, Jakarta.
___ 2000b, Information supplied to East Asia Analytical Unit, October.
PT Bentala Kartika Abadi, 2000, Information Booklet, Jakarta.
PT Cakrawala Gita Pratama, 1999, Information Booklet, Jakarta.
PT Holdiko Perkasa, 1999, Preliminary Information Memorandum, Jakarta.
PT Kiani Wirudha, 2000, Preliminary Information Memorandum, Jakarta.
PT Tunas Sepadan Investama, 1999, Preliminary Information Memorandum, Jakarta.
Wee, Thee Kian, 1999, ‘Foreign Investment in Indonesia’, Jakarta.
World Bank, 2000, Indonesia: Accelerating Recovery in Uncertain Times, World Bank, Washington DC.

� � � � � � � � � � � � � � � � � � � � � � � � �
�� ���

� � � � � � � �
�� ���
���������������������������� �����
��������
• Since the onset of the financial crisis, the Indonesian Government
has accelerated trade reform. Indonesia now is moving towards
a liberal trade regime, similar to Singapore’s or Hong Kong’s in the
1960s and 1970s.
• By mid 2000, 60 per cent of tariff lines had duties of 0 to 5 per cent,
and over 70 per cent had tariffs of 10 per cent or less. The unweighted
average tariff rate now is below 9 per cent.
• Tariff reductions include agricultural products; these reductions
lowered the unweighted average tariff rate on agricultural
products from 19 per cent in 1995 to 8.6 per cent in 1998.
• The Government has removed many non-tariff barriers on agricultural
imports, notably import licensing requirements on commodities the
national logistics agency, BULOG, controlled, permitting competitive
imports and distribution of wheat, flour, sugar, soy beans and garlic.
• Reductions in tariffs and local content requirements also are boosting
prospects for Australian car exporters in Indonesia.

� � � � � � � � � � � � � � � � � � � � � � � � �
�� ���
In response to the financial crisis and its participation in multilateral trade reforms, the Indonesian
Government has accelerated its trade reform program since 1995. By encouraging labour intensive
manufacturing, increased openness to international markets complements other post crisis government
reforms to improve efficiency in the Indonesian business sector and promote more equitable
development. Lower trade barriers also benefit Australia, as it is a natural trading partner with Indonesia,
with complementary resource and human capital endowments.
This chapter briefly reviews the history of trade policy in Indonesia. Although in the past, economic
down turns and oil price volatility often forced Indonesia to liberalise trade, its renewed free trade
agenda in the mid to late 1990s reflected a growing regional consensus favouring trade liberalisation,
as expressed through Asia Pacific Economic Cooperation, APEC, and ASEAN Free Trade Area,
AFTA, resolutions.
The chapter also identifies opportunities for Australia, through Indonesia’s market opening, and
concludes by assessing the risks associated with current liberalisation efforts.
���������������
Trade barriers have declined markedly over recent decades due to consecutive reform efforts. The
1997 financial crisis promoted bold trade liberalisation. While other regional governments also are
adopting freer trade arrangements, Indonesia currently has one of East Asia’s most liberal trade
regimes, outside Hong Kong and Singapore.
������������������
Indonesia’s first major trade reforms occurred in 1985 when falling oil prices and concerns about its
high cost economy resulted in the Soeharto Government lowering tariff ceilings to 60 per cent and
reducing the number of tariff levels from 25 to 11. These reforms also converted several import
licences, which at their peak covered 43 per cent of tariff lines, into tariff equivalents (Centre for
Strategic and International Studies, 2000). The 1985 recession and 1986 collapse of oil prices prompted
more aggressive trade reforms, which reduced the unweighted tariff rate from 27 per cent in 1986 to
20 per cent in 1991 (Figure 4.1). Other reforms abolished import monopolies for plastic, steel and
cotton, and introduced a more transparent quota system for textiles. In 1990, the Government also
reduced non-tariff barriers to electronics imports, and removed import bans on cold rolled steel,
sheets and tin plates. These reforms underpinned Indonesia’s rapid economic growth in the late
1980s and 1990s.
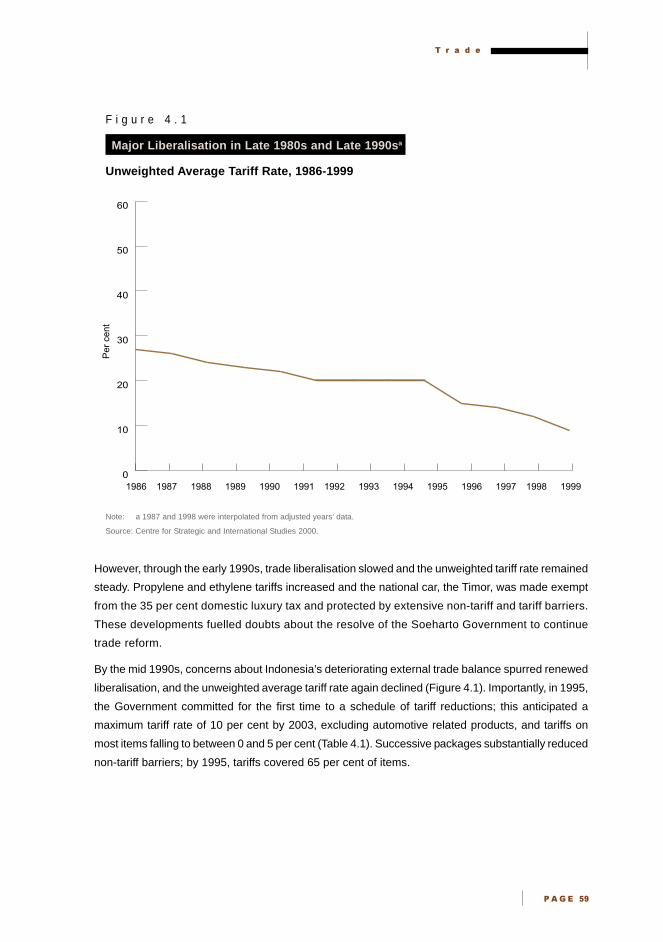
� � � � �
�� ���
F i g u r e 4 . 1
Major Liberalisation in Late 1980s and Late 1990sa
Unweighted Average Tariff Rate, 1986-1999
Note: a 1987 and 1998 were interpolated from adjusted years’ data.
Source: Centre for Strategic and International Studies 2000.
However, through the early 1990s, trade liberalisation slowed and the unweighted tariff rate remained
steady. Propylene and ethylene tariffs increased and the national car, the Timor, was made exempt
from the 35 per cent domestic luxury tax and protected by extensive non-tariff and tariff barriers.
These developments fuelled doubts about the resolve of the Soeharto Government to continue
trade reform.
By the mid 1990s, concerns about Indonesia’s deteriorating external trade balance spurred renewed
liberalisation, and the unweighted average tariff rate again declined (Figure 4.1). Importantly, in 1995,
the Government committed for the first time to a schedule of tariff reductions; this anticipated a
maximum tariff rate of 10 per cent by 2003, excluding automotive related products, and tariffs on
most items falling to between 0 and 5 per cent (Table 4.1). Successive packages substantially reduced
non-tariff barriers; by 1995, tariffs covered 65 per cent of items.
199919981997199619951994199319921991199019891988198719860
10
20
30
40
50
60
Per
cen
t
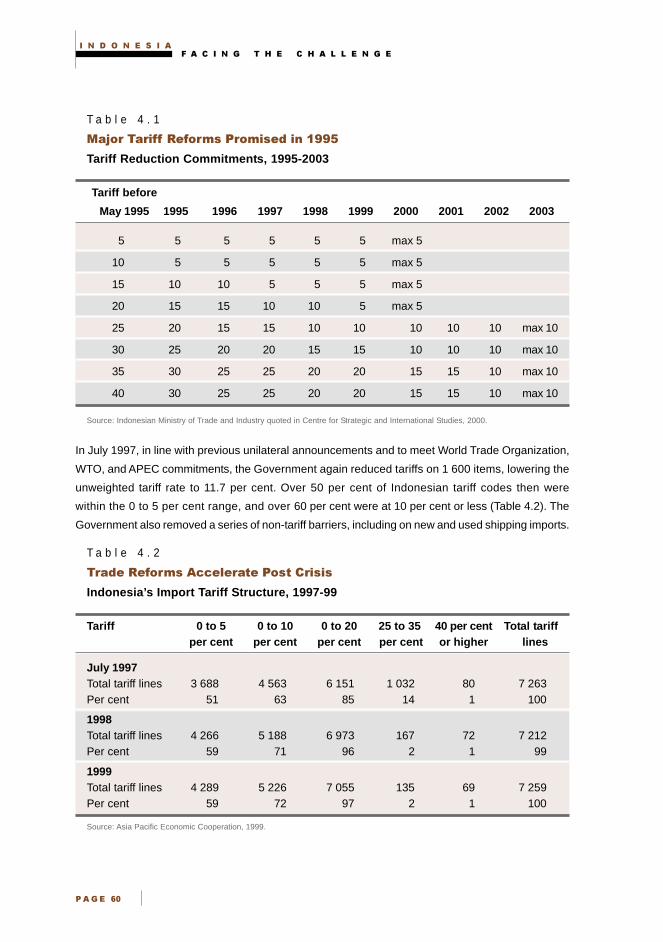
� � � � � � � � � � � � � � � � � � � � � � � � �
�� ���
T a b l e 4 . 1
�� ���������������������������������
Tariff Reduction Commitments, 1995-2003
Tariff before
May 1995 1995 1996 1997 1998 1999 2000 2001 2002 2003
5 5 5 5 5 5 max 5
10 5 5 5 5 5 max 5
15 10 10 5 5 5 max 5
20 15 15 10 10 5 max 5
25 20 15 15 10 10 10 10 10 max 10
30 25 20 20 15 15 10 10 10 max 10
35 30 25 25 20 20 15 15 10 max 10
40 30 25 25 20 20 15 15 10 max 10
Source: Indonesian Ministry of Trade and Industry quoted in Centre for Strategic and International Studies, 2000.
In July 1997, in line with previous unilateral announcements and to meet World Trade Organization,
WTO, and APEC commitments, the Government again reduced tariffs on 1 600 items, lowering the
unweighted tariff rate to 11.7 per cent. Over 50 per cent of Indonesian tariff codes then were
within the 0 to 5 per cent range, and over 60 per cent were at 10 per cent or less (Table 4.2). The
Government also removed a series of non-tariff barriers, including on new and used shipping imports.
T a b l e 4 . 2
�����������������������������������
Indonesia’s Import Tariff Structure, 1997-99
Tariff 0 to 5 0 to 10 0 to 20 25 to 35 40 per cent Total tariffper cent per cent per cent per cent or higher lines
July 1997Total tariff lines 3 688 4 563 6 151 1 032 80 7 263Per cent 51 63 85 14 1 100
1998Total tariff lines 4 266 5 188 6 973 167 72 7 212Per cent 59 71 96 2 1 99
1999Total tariff lines 4 289 5 226 7 055 135 69 7 259Per cent 59 72 97 2 1 100
Source: Asia Pacific Economic Cooperation, 1999.
� � � � �
�� ���
�����������������������������������
Responding to the financial crisis, the Government further accelerated trade regime reform efforts,
especially eliminating non-tariff barriers for agricultural products and measures to protect the national
car. The rupiah’s dramatic 80 per cent depreciation in the year to mid 1998 made most Indonesian
products very competitive at world prices, so many trade barriers became redundant. As the rupiah
was unlikely to rebound quickly, the crisis offered an opportunity to remove many remaining trade
barriers. Indonesia now is moving towards a liberal trade regime similar to that of Singapore or Hong
Kong in the 1960s and 1970s.
These developments clearly benefit Australia as lower tariffs offer Australian exporters better access
to the Indonesian market.1
����������� !��"����" ��!#��������
Building on Indonesia’s WTO and APEC commitments, the four-year IMF program recommended a
three-tier tariff structure by 2003, with rates of 0, 5 and 10 per cent for all items except cars and
alcohol. The Government committed to reducing immediately high tariff rates on some items not
previously slated for liberalisation, including reducing tariffs of 15 to 25 per cent on iron and steel by
5 percentage points to reach 10 per cent by 2003. It also committed to reduce tariffs on chemical,
metal and fishery products to 5 to 10 per cent by 2003.
By mid 2000, 60 per cent of tariff lines had tariffs of 0 to 5 per cent, and more than 70 per cent had
tariffs of 10 per cent or less; this reduced the unweighted average tariff rate to below 9 per cent
(Figure 4.1 and Table 4.2).
Post crisis, the Government also extended earlier programs to reduce tariffs on agricultural products;
this lowered the unweighted average tariff rate on agricultural products from 19 per cent in 1995 to
8.6 per cent in 1998. Tariffs on food-related agricultural products fell to 0 to 5 per cent and non-food
agricultural tariffs fell by 5 percentage points from prevailing levels. By 2002, the maximum tariff on
non-food agricultural products will be 10 per cent.
As major exporters of agricultural products and manufactures to Indonesia, Australian producers will
benefit from tariff reductions (Table 4.3).
Tariff reductions behind schedule
Despite these successes, actual tariff reductions are behind targets set in the May 1995 trade
liberalisation package. Even after the December 1999 trade reform package, which reduced rates on
232 tariff lines, 2 142 lines remain above the 1995 target.
1 Foreign suppliers should observe newly established anti-dumping measures in Indonesia.
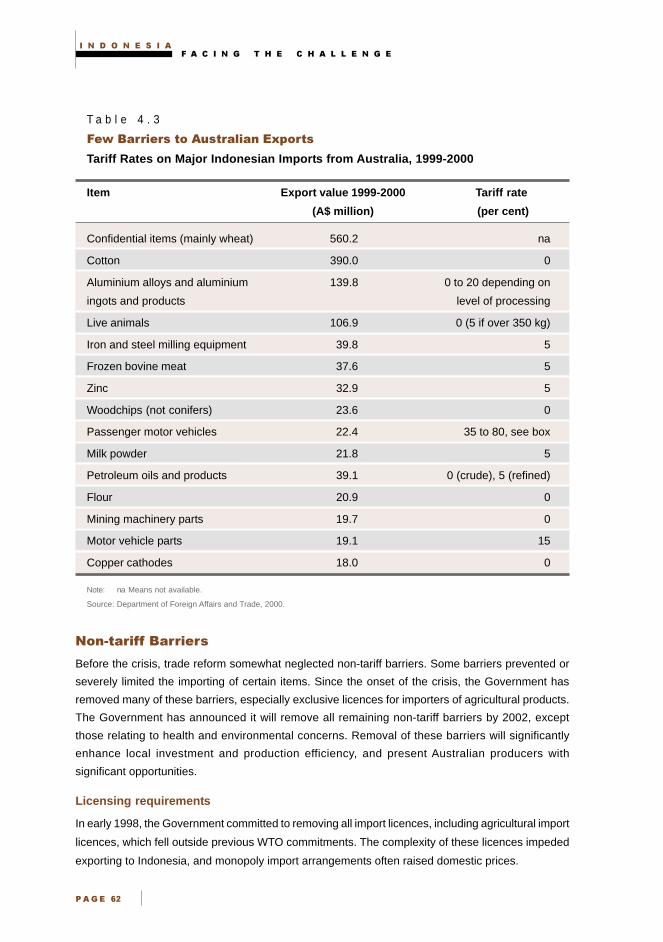
� � � � � � � � � � � � � � � � � � � � � � � � �
�� ���
T a b l e 4 . 3
�!�"������������#����������$%����
Tariff Rates on Major Indonesian Imports from Australia, 1999-2000
Item Export value 1999-2000 Tariff rate
(A$ million) (per cent)
Confidential items (mainly wheat) 560.2 na
Cotton 390.0 0
Aluminium alloys and aluminium 139.8 0 to 20 depending on
ingots and products level of processing
Live animals 106.9 0 (5 if over 350 kg)
Iron and steel milling equipment 39.8 5
Frozen bovine meat 37.6 5
Zinc 32.9 5
Woodchips (not conifers) 23.6 0
Passenger motor vehicles 22.4 35 to 80, see box
Milk powder 21.8 5
Petroleum oils and products 39.1 0 (crude), 5 (refined)
Flour 20.9 0
Mining machinery parts 19.7 0
Motor vehicle parts 19.1 15
Copper cathodes 18.0 0
Note: na Means not available.
Source: Department of Foreign Affairs and Trade, 2000.
�"�!��������������
Before the crisis, trade reform somewhat neglected non-tariff barriers. Some barriers prevented or
severely limited the importing of certain items. Since the onset of the crisis, the Government has
removed many of these barriers, especially exclusive licences for importers of agricultural products.
The Government has announced it will remove all remaining non-tariff barriers by 2002, except
those relating to health and environmental concerns. Removal of these barriers will significantly
enhance local investment and production efficiency, and present Australian producers with
significant opportunities.
Licensing requirements
In early 1998, the Government committed to removing all import licences, including agricultural import
licences, which fell outside previous WTO commitments. The complexity of these licences impeded
exporting to Indonesia, and monopoly import arrangements often raised domestic prices.
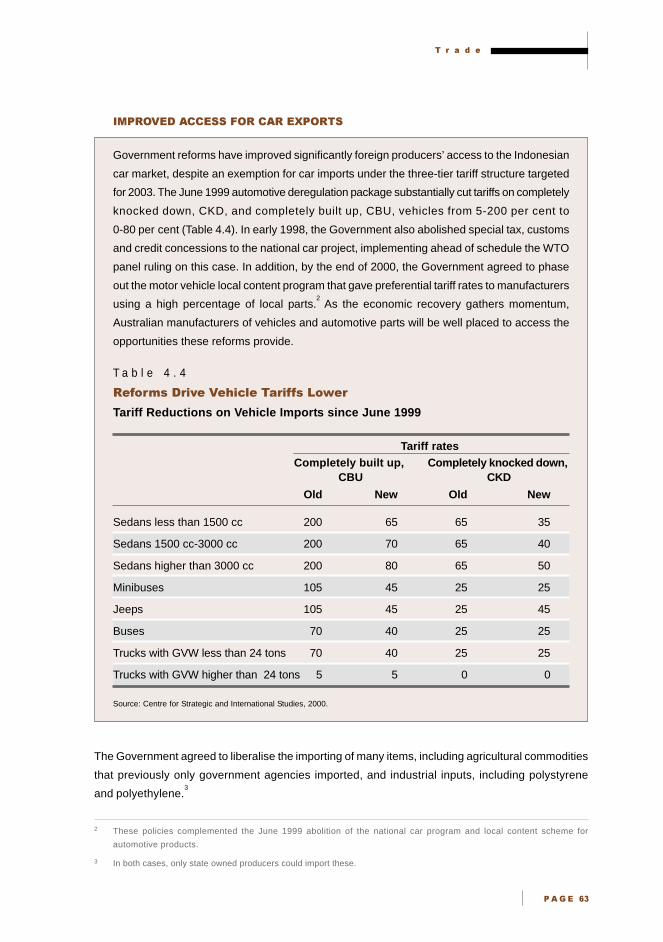
� � � � �
�� ��
2 These policies complemented the June 1999 abolition of the national car program and local content scheme for
automotive products.
3 In both cases, only state owned producers could import these.
������������� �����������
Government reforms have improved significantly foreign producers’ access to the Indonesian
car market, despite an exemption for car imports under the three-tier tariff structure targeted
for 2003. The June 1999 automotive deregulation package substantially cut tariffs on completely
knocked down, CKD, and completely built up, CBU, vehicles from 5-200 per cent to
0-80 per cent (Table 4.4). In early 1998, the Government also abolished special tax, customs
and credit concessions to the national car project, implementing ahead of schedule the WTO
panel ruling on this case. In addition, by the end of 2000, the Government agreed to phase
out the motor vehicle local content program that gave preferential tariff rates to manufacturers
using a high percentage of local parts.2 As the economic recovery gathers momentum,
Australian manufacturers of vehicles and automotive parts will be well placed to access the
opportunities these reforms provide.
T a b l e 4 . 4
��������&��'��(�)������������*�!��
Tariff Reductions on Vehicle Imports since June 1999
Tariff ratesCompletely built up, Completely knocked down,
CBU CKD
Old New Old New
Sedans less than 1500 cc 200 65 65 35
Sedans 1500 cc-3000 cc 200 70 65 40
Sedans higher than 3000 cc 200 80 65 50
Minibuses 105 45 25 25
Jeeps 105 45 25 45
Buses 70 40 25 25
Trucks with GVW less than 24 tons 70 40 25 25
Trucks with GVW higher than 24 tons 5 5 0 0
Source: Centre for Strategic and International Studies, 2000.
The Government agreed to liberalise the importing of many items, including agricultural commodities
that previously only government agencies imported, and industrial inputs, including polystyrene
and polyethylene.3
� � � � � � � � � � � � � � � � � � � � � � � � �
�� ��
After November 1997, the Government removed import licensing requirements on commodities the
national logistics agency, BULOG, controlled. This liberalisation permitted import competition for
wheat, wheat flour, soy beans and garlic, the sale and distribution of flour, and the importing and
marketing of sugar. This major reform should reduce prices of these commodities for consumers,
and has obvious benefits for Australian exporters.
In late 1998, the Government opened rice imports to competition. However, in January 2000, because
of the sharp fall in world rice prices, the Government placed a temporary Rp. 430 per kilogram import
tariff on rice to protect local farmers’ incomes; this is due for review in 2001 (International Monetary
Fund, 2000a). As a regional exporter of rice, Australia is well positioned to take advantage of
this liberalisation.
To smooth the transition to a fully open market, tariffs replaced import licences on some products,
including for soy beans and dried garlic (which have a 20 per cent tariff) and wheat flour (which has
a 10 per cent tariff). These tariffs are slated to fall to 5 per cent or less by 2003. A 25 per cent tariff on
sugar also should be phased out by 2003.
In January 1998, the Government dismantled controls on wood panel exports and shipments, and on
dairy product imports; these are markets in which Australia is very competitive. The Government also
disbanded Badan Penyangga dan Pemasaran Cengkeh, BPPC, and its monopoly over the domestic
marketing and distribution of cloves.
As part of the June 1999 automotive deregulation package, the Government permitted general
importers to import completely built up vehicles. Given Australia’s increasing success in exporting
cars, this represents a major opportunity for Australian vehicle manufacturers.
Local content requirements
In addition to reforms in the car market, in February 1998, the Government announced the phasing
out of local content requirements for dairy products, well ahead of Indonesia’s commitment under the
Uruguay Round, again offering opportunities for Australian exporters.
��$������������������������
Indonesia’s participation in multilateral trade groupings, including the WTO, AFTA and APEC, also
influences the pace of Indonesian trade liberalisation.
%����������
Indonesia joined GATT in 1947, but like other developing economies, was not actively involved in
GATT negotiations until 1986. In the Uruguay Round, Indonesia offered trade liberalisation
commitments including binding new tariffs (Appendix Table 4.1). It bound 6 714 tariffs or 72 per cent
of all manufactured import tariff lines, agreed to eliminate quantitative restrictions, opened up trade in
services and liberalised foreign direct investment by offering to apply national treatment by 2000.
� � � � �
�� ���
����������������������������� �����������
Before the crisis, the Government offered exporters incentives to locate within the Batam
Island, Rempang and Galang special economic zones, by exempting all products produced
and imported there from value added tax and import duties. These concessions, and the
zones’ proximity to Singapore, attracted significant foreign direct investment; this rose from
US$684 million in 1990 to US$2 332 million in 1999. Exports from the region increased from
US$568 million in 1992 to US$3 152 million in 1998, with non-oil exports increasing through
the crisis years. Because of concerns about the fiscal cost of these concessions, in July
1999, the Government indicated it would commission a comprehensive study to review the
tax free status of Batam, Rempang and Galang islands.4 However, objections by Batam
residents and businesses delayed the removal of the tax exemptions to the beginning of
2001, at the earliest.5
The Government also has reviewed tariff exemptions for all capital equipment, machinery
and raw materials for businesses in export processing zones or export-oriented manufacturing
entrepots. This scheme was based on firms’ self assessment of imported value, and despite
random government audits, was prone to corruption. In January 2000, the Government
committed to remove all such import duty exemptions by May 2000. However, this equipment
only carries a 5 per cent import duty.
Source: Centre for Strategic and International Studies, 2000.
However, Indonesia was disappointed by relatively limited concessions western economies offered
to liberalise the Multi Fibre Agreement, and many of Indonesia’s tariffs were bound at well above
existing applied levels.6 Other concessions Indonesia made were relatively modest compared to
previously announced unilateral trade liberalisation.
Indonesia started implementing Uruguay Round tariff commitments to reduce general tariff schedules
in June 1996 (World Trade Organization, 1998). By 2000, Uruguay Round commitments had reduced
the maximum applied tariff to 15 per cent (Table 4.1). Indonesia also committed to removing 96 non-
tariff barrier measures, meeting its remaining Uruguay Round non-tariff barrier commitments by 2004,
although post crisis reforms supersede many of these.7 These involved simplifying import licensing
and gradually eliminating producer-importer and trade-importer licensing.
4 These were signed on 22 July 1999 and 20 January 2000.
5 In January 2000, the Government also announced it would remove all tax exemptions currently applying to the integrated
economic development zones, KAPET, especially income and indirect tax concessions (International Monetary Fund, 2000a).
Businesses within KAPET no longer will receive duty exemptions on their import of capital goods, raw materials and other
equipment directly related to production activities. Value added tax and luxury sales taxes on domestic purchases also are
applied now.
6 Australia is not a member of the Multi Fibre Agreement and hence does not use it to restrict clothing and textile imports.
7 By April 1996, Indonesia had eliminated 75 non-tariff barriers, 77 per cent of its Uruguay Round commitments, and by June
1996, had abolished 83 non-tariff barriers, over 80 per cent of its commitments. Indonesia will continue to reduce export
taxes on logs, sawn timber, rattan and minerals to achieve these goals.
� � � � � � � � � � � � � � � � � � � � � � � � �
�� ���
����
At the fourth ASEAN summit in 1992, the six ASEAN economies, Brunei, Indonesia, Malaysia,
Philippines, Singapore and Thailand agreed to establish the ASEAN Free Trade Area, AFTA.8 Since
1992, Vietnam, Laos, Cambodia and Myanmar have joined ASEAN and AFTA. AFTA aims to achieve
free trade among the ASEAN economies, reducing intra ASEAN tariffs to 0 to 5 per cent and removing
non-tariff barriers by 2002.9 ASEAN members regard AFTA as complementing WTO and APEC trade
and investment liberalisation commitments, not substituting for them.
AFTA tariff reductions only apply to tariff items ASEAN members designate as ‘included’. Included
items carry the common economic preferential tariff; initially, this comprised 41 147 tariff lines,
with 3 321 tariff lines placed on a temporary exclusion list and another 523 tariff lines permanently
excluded on the general exception list.10
Since then, the inclusion list has increased to 53 144 tariff
lines, covering 83 per cent of tariff lines. Unprocessed agricultural products were included in 1994.
AFTA helped increase regional integration and intra ASEAN trade from 19 per cent of ASEAN
trade in 1992 to 25 per cent in 1997. The crisis has not reduced commitment to AFTA, although
recently, Malaysia indicated it would exclude its car tariffs from common effective preferential
tariff, CEPT, reductions.11
The success of AFTA also inspired ASEAN members to strengthen, streamline and harmonise non-
border measures to facilitate intra ASEAN and international trade and investment. For example, the
1995 Bangkok Summit Declaration agreed to enhance cooperation in liberalising trade in services,
and synchronise national regulations to improve members’ access to markets for financial services,
maritime transport, telecommunications, air transport, construction and business services. In 1998,
ASEAN members agreed on protocols to implement their 1995 trade in services liberalisation
commitment. Indonesia, along with other ASEAN members, submitted details of service sectors it
was ready to liberalise. However, little practical progress has occurred on services trade liberalisation;
most ASEAN members are reluctant to move quickly in this sector.
8 Indonesia joined ASEAN in 1967, and since 1976, has participated actively in its economic cooperation.
9 Members agreed at the sixth ASEAN summit in 1998 to accelerate AFTA, achieving free internal ASEAN trade by 1 January 2002.
This shortened the initial 2008 target.
10 Submitting products for liberalisation under AFTA is voluntary. When AFTA was first initiated, all members submitted their
lists of products under each category: included, temporarily excluded and general exception lists, based on each member’s
willingness to liberalise. Items under the temporary exclusion list initially included sensitive products such as paper and
paper products, transport equipment, including motor vehicles, iron and steel, certain electrical products and petroleum
products. They gradually were phased into the included list between January 1996 and January 2000, in five equal instalments
of 20 per cent of the list.
11 In 1999, the AFTA Council agreed to implement AFTA according to schedule.

� � � � �
�� ���
����������!��"!�
By January 2000, Indonesia had 7 173 tariff lines in the CEPT inclusion list, leaving 21 tariff
lines in the temporary exclusion list, four on the sensitive list (mostly unprocessed agricultural
products, such as rice, sugar, tobacco and meat products) and 68 on the general exception list.12
Indonesia’s original CEPT-AFTA schedule was similar to its Uruguay Round commitments. However,
in 1998, ASEAN economies agreed not to apply tariffs over 20 per cent to products on the inclusion
list; this was more liberal than Indonesia’s Uruguay Round commitment (Table 4.5). By 2000, with the
1998 CEPT package and IMF liberalisation, Indonesia’s average CEPT tariff was below 5 per cent,
hence falling within AFTA’s target band two years ahead of schedule. AFTA included items now
represent 98.7 per cent of all Indonesian tariff items.
T a b l e 4 . 5
�����������)�������� ��*�+�������������)��#��
CEPT-AFTA Tariff Reduction Schedule, 1995-2003, Per cent
Tariff before 23 May 1995 1995 1998 2000 2003
5 5 max 5 max 5
10 5 max 5 max 5
15 10 max 5 max 5
20 15 max 5 max 5
25 20 max 20 max 10
30 25 max 20 max 10
35 30 max 20 max 10
40 30 max 20 max 10
Average CEP Tariff (2000-03) 2000 2001 2002 2003
Indonesia 4.77 4.36 3.73 2.16
Source: Centre for Strategic and International Studies, 2000.
12 AFTA has four categories of products. Firstly, Inclusion List products are subject to preferential tariff reductions and should
reach 0 to 5 per cent in 2002. Secondly, Temporary Exclusion List products are temporarily excluded from the tariff reductions
schedule but items in it should be phased into the Inclusion List in five instalments. Thirdly, Sensitive List products are
declared sensitive, mainly unprocessed agriculture products such as rice, sugar, tobacco and meat products, and will take
longer to be phase into the Inclusion List. Fourthly, General Exception products excluded mainly to protect human, animal
or plant life, or artistic, historical or archaeological values and for national security and public morality reasons; examples
include arms, ammunition and narcotics.
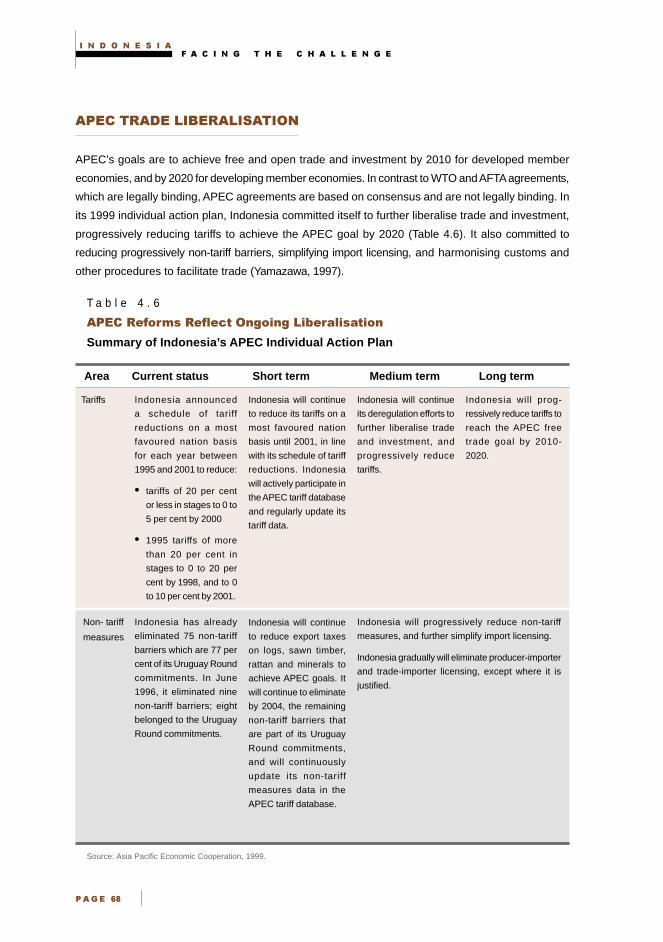
� � � � � � � � � � � � � � � � � � � � � � � � �
�� ���
������������������������
APEC’s goals are to achieve free and open trade and investment by 2010 for developed member
economies, and by 2020 for developing member economies. In contrast to WTO and AFTA agreements,
which are legally binding, APEC agreements are based on consensus and are not legally binding. In
its 1999 individual action plan, Indonesia committed itself to further liberalise trade and investment,
progressively reducing tariffs to achieve the APEC goal by 2020 (Table 4.6). It also committed to
reducing progressively non-tariff barriers, simplifying import licensing, and harmonising customs and
other procedures to facilitate trade (Yamazawa, 1997).
T a b l e 4 . 6
�����������������������,���,�*�+�����������
Summary of Indonesia’s APEC Individual Action Plan
Area Current status Short term Medium term Long term
Tariffs Indonesia announced
a schedule of tariff
reductions on a most
favoured nation basis
for each year between
1995 and 2001 to reduce:
• tariffs of 20 per cent
or less in stages to 0 to
5 per cent by 2000
• 1995 tariffs of more
than 20 per cent in
stages to 0 to 20 per
cent by 1998, and to 0
to 10 per cent by 2001.
Indonesia will continue
to reduce its tariffs on a
most favoured nation
basis until 2001, in line
with its schedule of tariff
reductions. Indonesia
will actively participate in
the APEC tariff database
and regularly update its
tariff data.
Indonesia will continue
its deregulation efforts to
further liberalise trade
and investment, and
progressively reduce
tariffs.
Indonesia will prog-
ressively reduce tariffs to
reach the APEC free
trade goal by 2010-
2020.
Non- tariff
measures
Indonesia has already
eliminated 75 non-tariff
barriers which are 77 per
cent of its Uruguay Round
commitments. In June
1996, it eliminated nine
non-tariff barriers; eight
belonged to the Uruguay
Round commitments.
Indonesia will continue
to reduce export taxes
on logs, sawn timber,
rattan and minerals to
achieve APEC goals. It
will continue to eliminate
by 2004, the remaining
non-tariff barriers that
are part of its Uruguay
Round commitments,
and will continuously
update its non-tariff
measures data in the
APEC tariff database.
Indonesia will progressively reduce non-tariff
measures, and further simplify import licensing.
Indonesia gradually will eliminate producer-importer
and trade-importer licensing, except where it is
justified.
Source: Asia Pacific Economic Cooperation, 1999.

� � � � �
�� ���
������������������������������������������
Trade reform may threaten significant existing interests in industries like broadacre agriculture, iron
and steel, petrochemicals, flour milling, sugar and transport equipment, as Indonesia is less
internationally competitive in these sectors. These interests have sought to rally government support
and nationalist sentiments to retain trade barriers. While democracy has weakened the influence of
some vested interests, import competing constituencies, including farmers and capital intensive
manufacturers, still seek to influence trade policy outcomes.
In particular, liberalisation of certain agricultural commodity imports arouses considerable opposition.
For example, rice farmers concerned about the market penetration of lower cost, foreign rice called
for rice tariffs to jump from 30 per cent to between 90 and 120 per cent. Sugar industry representatives
also argued the 20 to 25 per cent tariff on sugar was too low compared with some developed country
tariffs of 140 to 240 per cent (Bisnis Indonesia, 30 May 2000).13
Steel industry representatives, led by state owned Krakatau Steel, argue strongly to maintain indefinitely
steel tariffs at 25 per cent, claiming Japanese, Chinese and Korean imports often are dumped
(Centre for Strategic and International Studies, 2000). The Indonesian Association of Steel Pipe
Producers, GAPIPA, also is calling for an anti-dumping duty on steel pipe imports (Jakarta Post,
5 April 2000). The petrochemical industry, led by Chandra Asri, the country’s largest ethylene producer,
continues to oppose trade liberalisation, seeking to maintain indefinitely its tariff at 25 per cent
(Jakarta Post, 10 May 2000).
Even labour intensive manufacturers like the Indonesian Footwear Association, APRISINDO, demand
import duties on Chinese footwear, again because of suspicions of dumping; despite rupiah
depreciation, prices for Chinese footwear are 25 per cent lower than domestic prices. The Indonesian
Antidumping Committee, KADI, currently is investigating the issue.14
�����������������
Trade reforms throughout the 1980s and 1990s drove rapid trade growth; exports grew from
23 per cent of GDP in 1985 to 35 per cent in 1999. In most years, net exports (exports minus imports)
significantly contributed to Indonesian GDP growth. The Indonesian Government recognises the
importance of net exports to sustaining medium term economic growth. Before the crisis, Indonesia
had run trade deficits but by the September quarter of 2000, Indonesia enjoyed a trade surplus equal
to around 11 per cent of GDP.
13 Four Java based sugar cane farmer associations and members of Asosiasi Petani Tebu Rakyat expressed these concerns
in May 2000. However, their proposal to ban raw sugar imports was rejected (Republika, 4 May 2000). In April 2000, at the
regional multilateral level, the Asian Farmers Group for Cooperation demanded the WTO respond to its demands for greater
agricultural protection, especially on key staples including rice (Suara Karya, 19 April 2000).
14 The Minister for Trade, Luhut Pandjaitan announced an investigation into ways to curb Chinese imports, where unfair
business practices or smuggling is evident. He emphasised that any measures must not disturb bilateral relations between
the two countries (Jakarta Post, 29 June 2000).
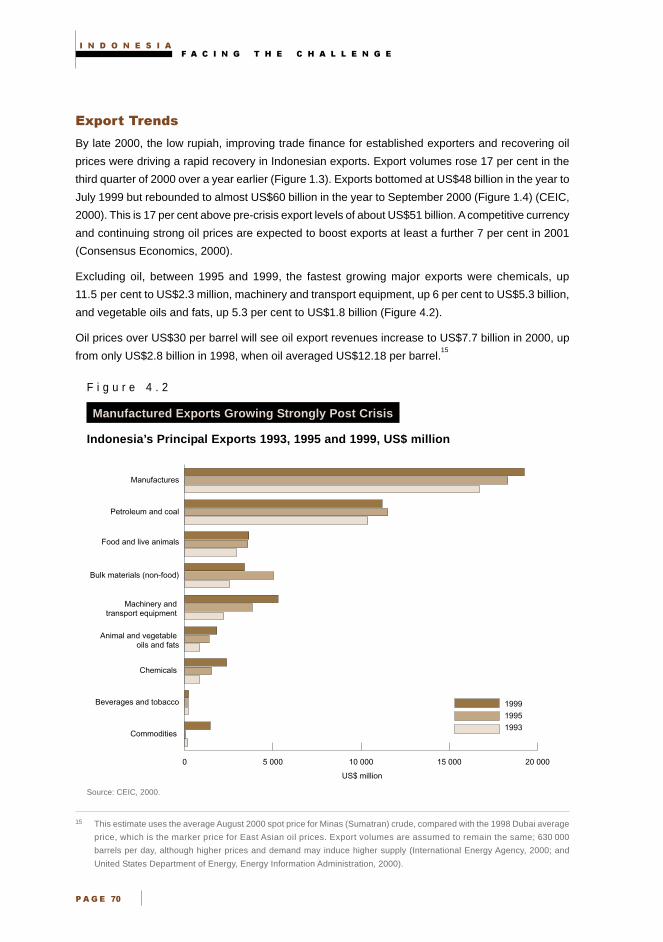
� � � � � � � � � � � � � � � � � � � � � � � � �
�� ���
�&'��!����"��
By late 2000, the low rupiah, improving trade finance for established exporters and recovering oil
prices were driving a rapid recovery in Indonesian exports. Export volumes rose 17 per cent in the
third quarter of 2000 over a year earlier (Figure 1.3). Exports bottomed at US$48 billion in the year to
July 1999 but rebounded to almost US$60 billion in the year to September 2000 (Figure 1.4) (CEIC,
2000). This is 17 per cent above pre-crisis export levels of about US$51 billion. A competitive currency
and continuing strong oil prices are expected to boost exports at least a further 7 per cent in 2001
(Consensus Economics, 2000).
Excluding oil, between 1995 and 1999, the fastest growing major exports were chemicals, up
11.5 per cent to US$2.3 million, machinery and transport equipment, up 6 per cent to US$5.3 billion,
and vegetable oils and fats, up 5.3 per cent to US$1.8 billion (Figure 4.2).
Oil prices over US$30 per barrel will see oil export revenues increase to US$7.7 billion in 2000, up
from only US$2.8 billion in 1998, when oil averaged US$12.18 per barrel.15
F i g u r e 4 . 2
Manufactured Exports Growing Strongly Post Crisis
Indonesia’s Principal Exports 1993, 1995 and 1999, US$ million
Source: CEIC, 2000.
15 This estimate uses the average August 2000 spot price for Minas (Sumatran) crude, compared with the 1998 Dubai average
price, which is the marker price for East Asian oil prices. Export volumes are assumed to remain the same; 630 000
barrels per day, although higher prices and demand may induce higher supply (International Energy Agency, 2000; and
United States Department of Energy, Energy Information Administration, 2000).
0 5 000 10 000 15 000 20 000
1993
1995
1999
Commodities
Beverages and tobacco
Chemicals
Animal and vegetable oils and fats
Machinery and transport equipment
Bulk materials (non-food)
Food and live animals
Petroleum and coal
Manufactures
US$ million

� � � � �
�� ���
�� #�"�������'��!����"��
By late 2000, imports also were recovering slowly. During the crisis, much of the adjustment in
Indonesia’s balance of payments came through imports, which bottomed at US$24 billion in the year
to December 1999, down from their peak of almost US$44 billion in the year to March 1997 (Figure 1.4).16
Capital goods and cars led the decline (Figure 4.3). However, reflecting the recovery in exports and
domestic consumption in the year to September 2000, imports rose almost 16 per cent over a year earlier.
Despite this increase, in September 2000, imports were still 34 per cent below pre-crisis peaks at
US$28.8 billion (Figure 1.4).
F i g u r e 4 . 3
Capital Goods and Cars Dominate Imports but Plunge during Crisis
Indonesia’s Principal Imports, 1990-99
Source: CEIC, 2000.
Indonesia’s major import suppliers, Japan and the European Union, saw their annual exports to
Indonesia fall by 65 and 54 per cent respectively between 1997 and 1999. Partially due to depreciation
of several of these currencies, and the composition of their exports, imports from ASEAN, China,
the Republic of Korea and Australia experienced more modest declines (Figure 4.4). ASEAN exports
to Indonesia fell by just 14 per cent, China’s by 19 per cent, Australia’s by 41 per cent and the
Republic of Korea’s by 43 per cent. However, all countries’ exports to Indonesia are recovering in
2000. (See Chapter 5 - Australian Opportunities.)
16 Capital goods imports fell by 67 per cent from US$17.5 billion in 1997 to US$5.7 billion in 1999. Manufactures also fell
57 per cent over the same period, from US$6.5 billion to US$3.5 billion. This decline parallels the fall in investment. Other
imports, particularly inputs for the export sector, fell less markedly; chemicals fell by 24 per cent, and ores and other crude
materials fell by 14 per cent.
0
5
10
15
20
25
30
35
40
45 Ores
Food and live animals
Manufactures
Fuels and lubricants
Chemicals
Vehicles and capital goods
1999199819971996199519941993199219911990
US
$ bi
llion

� � � � � � � � � � � � � � � � � � � � � � � � �
�� ���
F i g u r e 4 . 4
Japan and EU Exports Suffered Most
Imports Supplied by Indonesia’s Largest Import Suppliers, 1990-99
Source: CEIC, 2000.
�"��"����(������")���'��!����)"����������������*�"������
Although official Indonesian Customs Department data (which, in general, exclude duty free imports
by free trade zones) show imports fell from mid 1997 to January 1999, major trading partner data
show imports began to increase from April 1998, and have almost doubled since. The significant
discrepancy between official and partners’ trading data has widened since the crisis (Figure 4.5)
(World Bank, 2000). Import categories with the most pronounced difference between official and
partners’ import data are products used in export processing zones, such as textiles, electronics
parts and machinery for specialist industrial applications; bulk commodities, ores and motor vehicles,
which typically are not imported to duty free zones, do not exhibit this gap. This supports the hypothesis
that the widening import data gap is due to the increasing importance of export processing zones as
a destination for Indonesia’s imports.
US
$ bi
llion
0
2
4
6
8
10
ChinaRepublic of KoreaAustralia
United States
JapanEU
ASEAN
1999199819971996199519941993199219911990
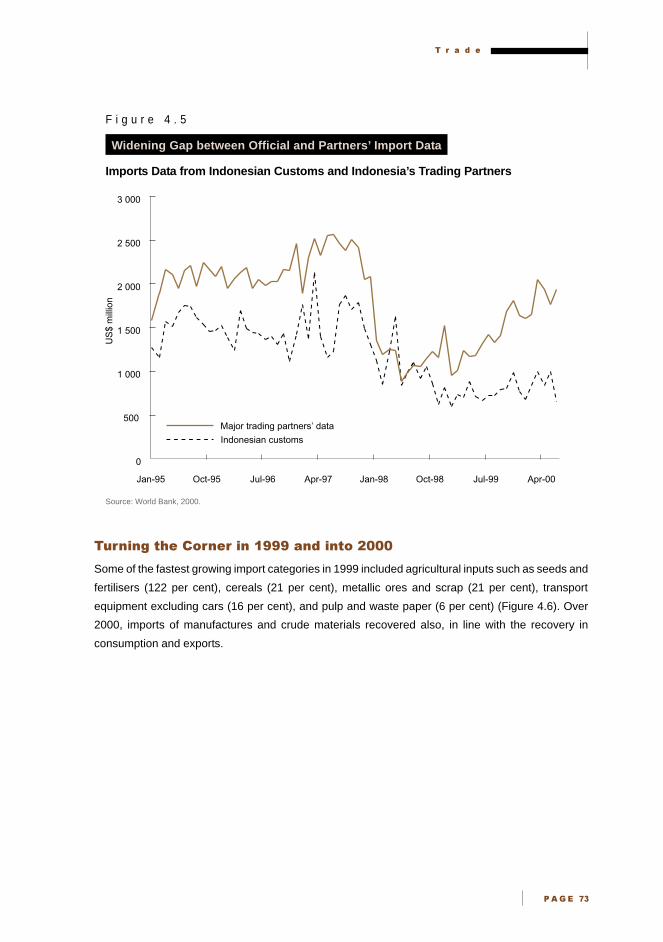
� � � � �
�� ��
F i g u r e 4 . 5
Widening Gap between Official and Partners’ Import Data
Imports Data from Indonesian Customs and Indonesia’s Trading Partners
Source: World Bank, 2000.
���"�")�!#�����"����"�+,,,��"���"!��-...
Some of the fastest growing import categories in 1999 included agricultural inputs such as seeds and
fertilisers (122 per cent), cereals (21 per cent), metallic ores and scrap (21 per cent), transport
equipment excluding cars (16 per cent), and pulp and waste paper (6 per cent) (Figure 4.6). Over
2000, imports of manufactures and crude materials recovered also, in line with the recovery in
consumption and exports.
US
$ m
illio
n
0
500
1 000
1 500
2 000
2 500
3 000
Jan-95 Oct-95 Jul-96 Apr-97 Jan-98 Oct-98 Jul-99 Apr-00
Major trading partners’ data
Indonesian customs
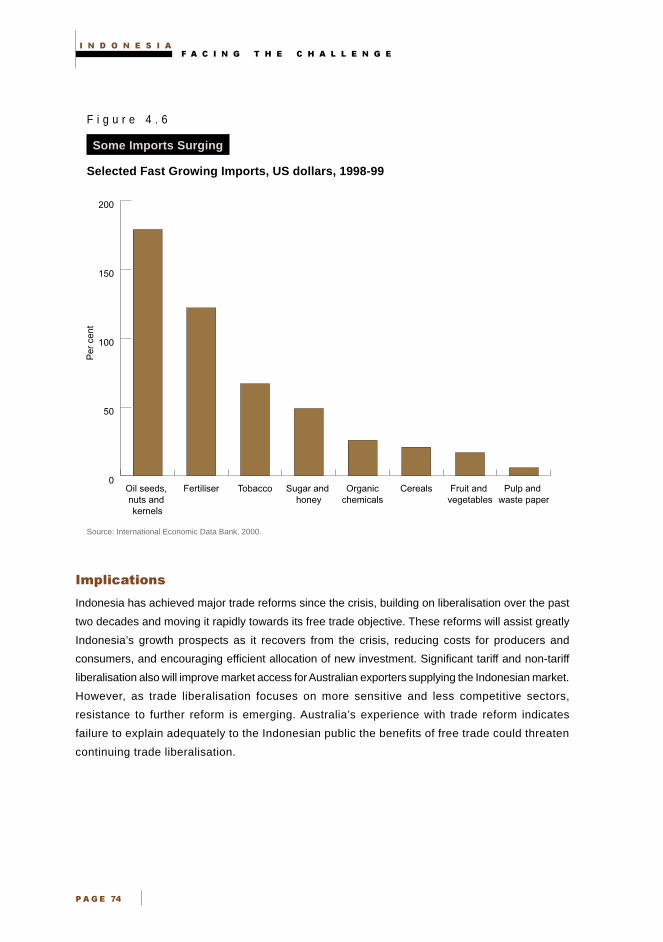
� � � � � � � � � � � � � � � � � � � � � � � � �
�� ��
F i g u r e 4 . 6
Some Imports Surging
Selected Fast Growing Imports, US dollars, 1998-99
Source: International Economic Data Bank, 2000.
��'�� �!��"�
Indonesia has achieved major trade reforms since the crisis, building on liberalisation over the past
two decades and moving it rapidly towards its free trade objective. These reforms will assist greatly
Indonesia’s growth prospects as it recovers from the crisis, reducing costs for producers and
consumers, and encouraging efficient allocation of new investment. Significant tariff and non-tariff
liberalisation also will improve market access for Australian exporters supplying the Indonesian market.
However, as trade liberalisation focuses on more sensitive and less competitive sectors,
resistance to further reform is emerging. Australia’s experience with trade reform indicates
failure to explain adequately to the Indonesian public the benefits of free trade could threaten
continuing trade liberalisation.
0
50
100
150
200
Pulp and waste paper
Fruit and vegetables
CerealsOrganicchemicals
Sugar and honey
TobaccoFertiliserOil seeds, nuts and kernels
Per
cen
t
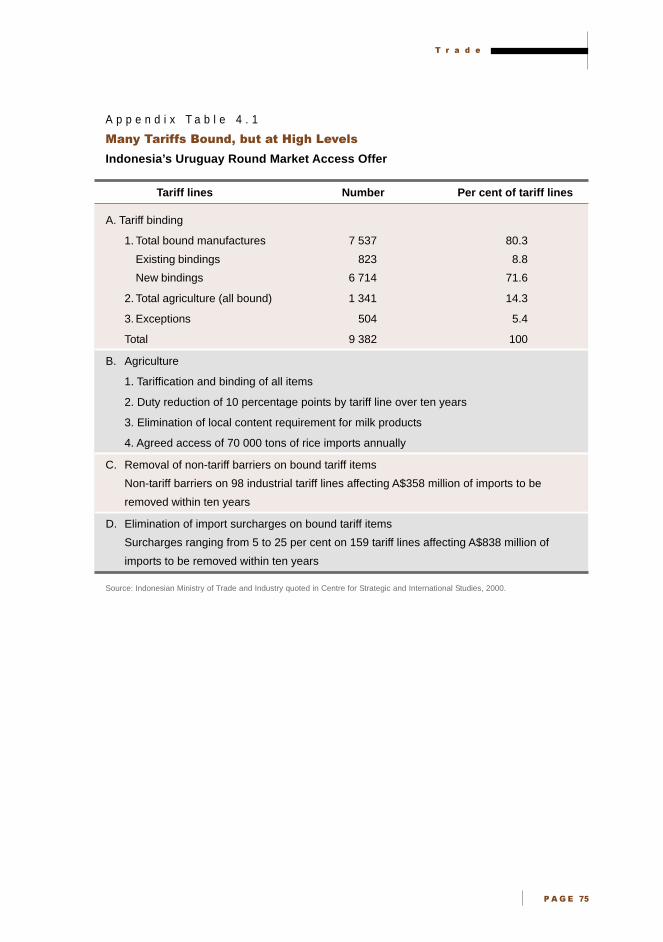
� � � � �
�� ���
A p p e n d i x T a b l e 4 . 1
���-��������"�#��.�+#�����/�,)�*�'���
Indonesia’s Uruguay Round Market Access Offer
Tariff lines Number Per cent of tariff lines
A. Tariff binding
1. Total bound manufactures 7 537 80.3
Existing bindings 823 8.8
New bindings 6 714 71.6
2. Total agriculture (all bound) 1 341 14.3
3. Exceptions 504 5.4
Total 9 382 100
B. Agriculture
1. Tariffication and binding of all items
2. Duty reduction of 10 percentage points by tariff line over ten years
3. Elimination of local content requirement for milk products
4. Agreed access of 70 000 tons of rice imports annually
C. Removal of non-tariff barriers on bound tariff items
Non-tariff barriers on 98 industrial tariff lines affecting A$358 million of imports to be
removed within ten years
D. Elimination of import surcharges on bound tariff items
Surcharges ranging from 5 to 25 per cent on 159 tariff lines affecting A$838 million of
imports to be removed within ten years
Source: Indonesian Ministry of Trade and Industry quoted in Centre for Strategic and International Studies, 2000.

� � � � � � � � � � � � � � � � � � � � � � � � �
�� ���
A p p e n d i x T a b l e 4 . 2
������������������-���������#������)���� ����,���
Policy action Target date
Tariffs
Reduce tariffs on items currently subject to tariffs of 15 to 25 per cent 31 March 1998by 5 percentage points
Cut tariffs on all food items to a maximum of 5 per cent 1 February 1998
Reduce tariffs on non-food agricultural products by 5 percentage points 1 February 1998
Gradually reduce tariffs on non-food agricultural products to a 2003maximum of 10 percentage points
Reduce tariffs on chemical products by 5 percentage points 1 January 1998
Reduce tariffs on steel/metal products by 5 percentage points 1 January 1998
Reduce tariffs on chemical, steel/metal and fishery products to 20035 to 10 per cent
Import restrictions
Abolish import restrictions on all new and used ships 1 February 1998
Phase out remaining quantitative import restrictions and other End of programnon-tariff barriers
Export restrictions
Abolish export taxes on leather, cork, ores and waste aluminium products 1 February 1998
Reduce export taxes on logs, sawn timber, rattan and minerals to a First step bymaximum of 30 per cent by 15 April 1998, 20 per cent by end of 22 April 1998December 1998, 15 per cent by end of December 1999 and10 per cent by end of December 2000
Phase in resource rent taxes on logs, sawn timber and minerals First step by22 April 1998
Replace remaining export taxes and levies by resource rent taxes as Over program periodappropriate
Eliminate all other export restrictions Over program period
Remove ban on palm oil exports and replace with export tax of 22 April 199840 per cent. Review the level of the export tax based on market pricesand exchange rates, and reduce to 10 per cent by end of December 1999
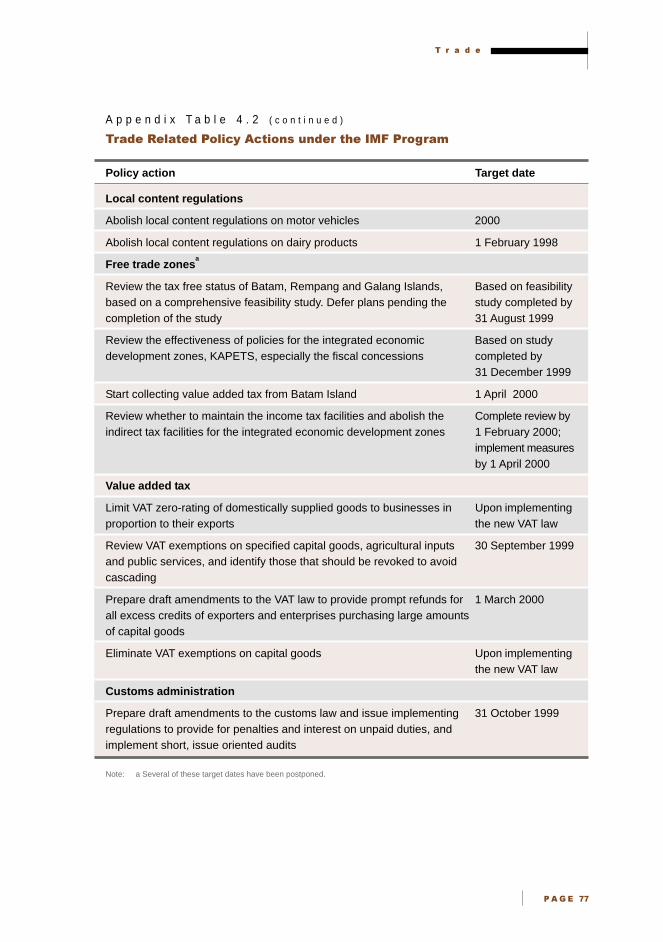
� � � � �
�� ���
A p p e n d i x T a b l e 4 . 2 ( c o n t i n u e d )
������������������-���������#������)���� ����,���
Policy action Target date
Local content regulations
Abolish local content regulations on motor vehicles 2000
Abolish local content regulations on dairy products 1 February 1998
Free trade zonesa
Review the tax free status of Batam, Rempang and Galang Islands, Based on feasibilitybased on a comprehensive feasibility study. Defer plans pending the study completed bycompletion of the study 31 August 1999
Review the effectiveness of policies for the integrated economic Based on studydevelopment zones, KAPETS, especially the fiscal concessions completed by
31 December 1999
Start collecting value added tax from Batam Island 1 April 2000
Review whether to maintain the income tax facilities and abolish the Complete review byindirect tax facilities for the integrated economic development zones 1 February 2000;
implement measuresby 1 April 2000
Value added tax
Limit VAT zero-rating of domestically supplied goods to businesses in Upon implementingproportion to their exports the new VAT law
Review VAT exemptions on specified capital goods, agricultural inputs 30 September 1999and public services, and identify those that should be revoked to avoidcascading
Prepare draft amendments to the VAT law to provide prompt refunds for 1 March 2000all excess credits of exporters and enterprises purchasing large amountsof capital goods
Eliminate VAT exemptions on capital goods Upon implementingthe new VAT law
Customs administration
Prepare draft amendments to the customs law and issue implementing 31 October 1999regulations to provide for penalties and interest on unpaid duties, andimplement short, issue oriented audits
Note: a Several of these target dates have been postponed.

� � � � � � � � � � � � � � � � � � � � � � � � �
�� ���
A p p e n d i x T a b l e 4 . 2 ( c o n t i n u e d )
������������������-���������#������)���� ����,���
Policy action Target date
Develop and implement a plan to combat valuation fraud by: 31 October 1999
• strengthening physical inspections
• establishing special valuation units in the regions
• undertaking special valuation audits
• developing a valuation database to help detect fraud
Reduce exemptions to import tariffs on capital goods; rationalise 1 April 2000and make transparent the remaining exemptions
Dissolve restrictive marketing arrangements for cement, paper 1 February 1998and plywood
Eliminate price controls on cement 3 November 1997
Allow cement producers to export with only a general export licence 1 February 1998
Allow free traders to buy, sell and transfer all commodities, 1 February 1998including cloves, cashew nuts and vanilla, across districts andprovincial boundaries
Eliminate the Clove Marketing Board 30 June 1998
Abolish quotas limiting the sale of livestock 30 September 1998
Prohibit provincial governments from restricting trade within and 1 February 1998between provinces
Enforce prohibition of provincial and local export taxes January 1998
Take effective action to allow free competition in:
• wheat, wheat flour, soy bean and garlic imports 30 September 1998
• flour sale or distribution 30 September 1998
• sugar imports and marketing 31 December 1998
• rice imports Ongoing
Source: International Monetary Fund, 2000b.

� � � � �
�� ���
���������
Asia Pacific Economic Cooperation, 1999, ‘Indonesia Individual Action Plan’, APEC, Jakarta.
CEIC, 2000, Asian Economic Database, Hong Kong, accessed on 3 November 2000.
Centre for Strategic and International Studies, 2000, ‘Report to the East Asia Analytical Unit on the
Trade Environment in Indonesia’, July, Jakarta.
Consensus Economics, 2000, ‘Consensus Forecasts’, 9 October.
Department of Foreign Affairs and Trade, 2000, Stars Database.
International Economic Data Bank, 2000, International Economic Data Bank, Australian National
University, Canberra.
International Energy Agency, 2000, www.iea.org/omrep/oneann.pdf, accessed on 10 November 2000.
International Monetary Fund, 2000a, Letter of Intent, January 2000.
___ 2000b, www.imf.org, accessed on 21 April 2000.
United States Department of Energy, Energy Information Administration, 2000, ‘Country Analysis
Briefs’, www.eia.doe.gov/emeu/cabs/indonesa.html, accessed on 13 November 2000.
World Bank, 2000, Indonesia: Accelerating Recovery in Uncertain Times, World Bank, Washington DC.
World Trade Organization, 1998, Trade Policy Review: Indonesia, WTO, Geneva.
Yamazawa, I., 1997, ‘APEC’s Progress towards the Bogor Target: a Quantitative Assessment of
Individual Action Plans’, May, Osaka.

� � � � � � � � � � � � � � � � � � � � � � � � �
�� ���
� � � � � � � �
�� ���
���������������� ������� ������������
��������
• In the long term, Indonesia’s ongoing trade liberalisation,
complementary economy, growing population and disposable
incomes create a very prospective market for Australian exporters.
Despite the fall in Australian exports during the crisis, Australia’s share
of total Indonesian imports recovered to 5.2 per cent during 1999.
• Total two-way Australian-Indonesian goods and services trade was
A$6.9 billion in the year to June 2000, ranking Indonesia as Australia’s
tenth largest trading partner. Before the financial crisis, the balance
of merchandise and service trade was heavily in Australia’s favour,
but since the crisis, strong Indonesian exports to Australia and lower
imports have shifted the trade balance in Indonesia’s favour.
• Significant export opportunities exist in manufactures especially with
the relatively low value of the Australian dollar vis-a-vis the US dollar.
Trade reforms are providing new opportunities in agricultural exports.
Exports of services, including education and financial services, also
are well placed to increase.
• A rapidly growing export sector, government asset sales through the
economic reform program and a liberalised investment regime create
new opportunities for Australian investment in Indonesia. This would
deepen the the commercial relationship. However, adopting
appropriate risk management strategies is important.
� � � � � � � � � � � � � � � � � � � � � � � � �
�� ���
Despite Indonesia’s financial crisis, Australia and Indonesia continue to enjoy a good commercial
relationship. Trade is recovering from crisis induced falls, and with their complementary economies
and ongoing trade liberalisation, this should continue. Further, new direct foreign investment
opportunities in the strong export and small and medium enterprise sectors, and from Indonesian
government asset sales could deepen commercial engagement between the two countries.
This chapter briefly describes the current bilateral trade and investment relationship, then explores
emerging trade and investment opportunities for Australian business that Indonesia’s ongoing economic
reforms and recovery present.
���������������� ���� �����
Australia and Indonesia enjoy a strong trading relationship.1 Based on 1999 merchandise trade flows,
Indonesia ranked as Australia’s tenth largest trading partner. Before the financial crisis, the balance of
merchandise and service trade was strongly in Australia’s favour, with rapid growth and the relatively
strong rupiah pushing up Indonesian import demand. However, with the crisis, Indonesian domestic
demand contracted sharply and the rupiah depreciated, cutting Indonesian imports and boosting Indonesian
exports to Australia. This shifted the trade balance strongly in Indonesia’s favour (Figure 5.1). Increasing
manufactures and services trade since the crisis indicates a more sophisticated trading relationship.
������� ������ � ����
Following the crisis, Australia’s exports to Indonesia fell by more than 15 per cent and imports rose
by 8 per cent between 1997-98 and 1998-99 (Figure 5.1). By June 1999, Australia held a A$780 million
trade deficit with Indonesia, a significant turnaround from the 1996-97 surplus peak of A$1.8 billion.
1 Total two-way trade in goods and services in the year to September 2000 was A$6.9 billion.
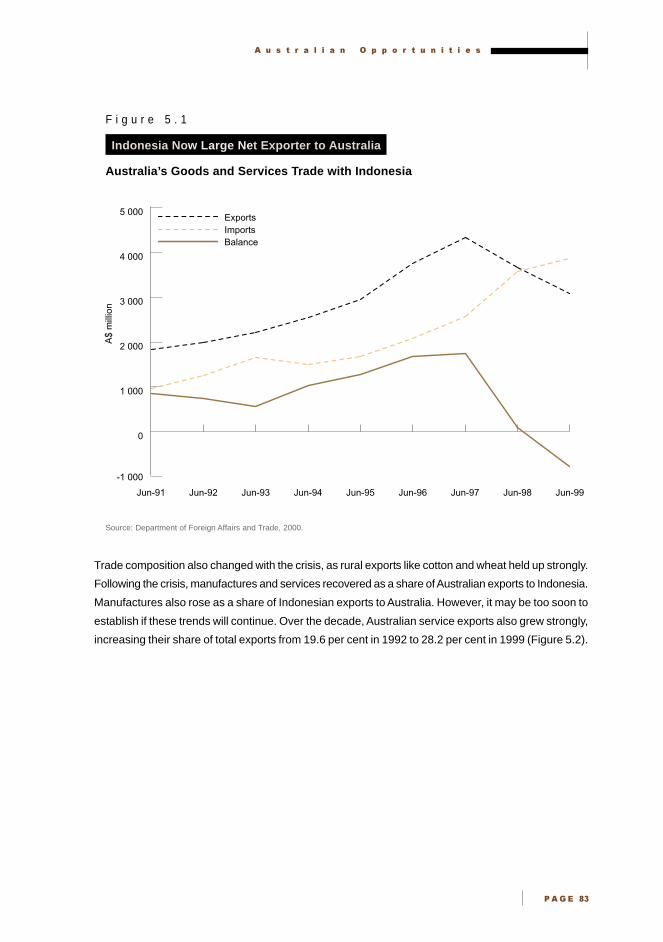
� � � � � � � � � � � � � � � � � � � � � � � �
�� ��
F i g u r e 5 . 1
Indonesia Now Large Net Exporter to Australia
Australia’s Goods and Services Trade with Indonesia
Source: Department of Foreign Affairs and Trade, 2000.
Trade composition also changed with the crisis, as rural exports like cotton and wheat held up strongly.
Following the crisis, manufactures and services recovered as a share of Australian exports to Indonesia.
Manufactures also rose as a share of Indonesian exports to Australia. However, it may be too soon to
establish if these trends will continue. Over the decade, Australian service exports also grew strongly,
increasing their share of total exports from 19.6 per cent in 1992 to 28.2 per cent in 1999 (Figure 5.2).
-1 000
0
1 000
2 000
3 000
4 000
5 000
BalanceImportsExports
Jun-99Jun-98Jun-97Jun-96Jun-95Jun-94Jun-93Jun-92Jun-91
A$
mill
ion

� � � � � � � � � � � � � � � � � � � � � � � � �
�� ��!
F i g u r e 5 . 2
Rural and Service Exports More Important after 1997
Shares of Major Categories in Australian Exports to Indonesia, Per cent
Source: Department of Foreign Affairs and Trade, 2000.
Throughout the 1990s, Australia supplied about 5 per cent of Indonesia’s imports, peaking at 5.6 per
cent in 1996. Despite the absolute fall in Australian exports in 1998 and 1999, and the decline in market
share in 1997 and 1998, Australia’s market share recovered to 5.2 per cent during 1999 (Figure 5.3).
10
20
30
40
50
60 Resources
Rural
ManufacturesServices
19991998199719961995199419931992
Per
cent
age
shar
e of
tota
l exp
orts

� � � � � � � � � � � � � � � � � � � � � � � �
�� ��
F i g u r e 5 . 3
Australia’s Market Share Recovering
Australia’s Share of Indonesia’s Imports, Per cent
Source: Department of Foreign Affairs and Trade, 2000; and Datastream, 2000.
��������� ������� �� ������
In 1999, merchandise and service exports from Australia to Indonesia started to recover from sharp
falls during the crisis, and continued to grow through 2000.
����������� �� !�"�
After a decade of rapid growth, in 1998, the financial crisis and ensuing recession severely reduced
Australia’s merchandise exports to Indonesia. Between 1992 and 1997, Australia’s merchandise
exports to Indonesia rose at an average annual rate of almost 14 per cent. Rural, resource and
manufactured exports to Indonesia all performed strongly, with annual growth rates averaging over
10 per cent. However, plummeting Indonesian demand following the crisis and a sharply depreciating
rupiah cut Australian merchandise exports to Indonesia by over 30 per cent between 1996-97 and
1998-99, with resource, rural and manufactured exports all hit hard (Figure 5.4). All Australia’s major
merchandise exports to Indonesia, except cotton, experienced negative or zero growth during 1998.
Merchandise exports to Indonesia fell from around 4.0 per cent of Australia’s total merchandise
exports at the end of 1997 to around 2.5 per cent by the end of 1999.
Per
cen
t
4.0
4.2
4.4
4.6
4.8
5.0
5.2
5.4
5.6
5.8
19991998199719961995199419931992
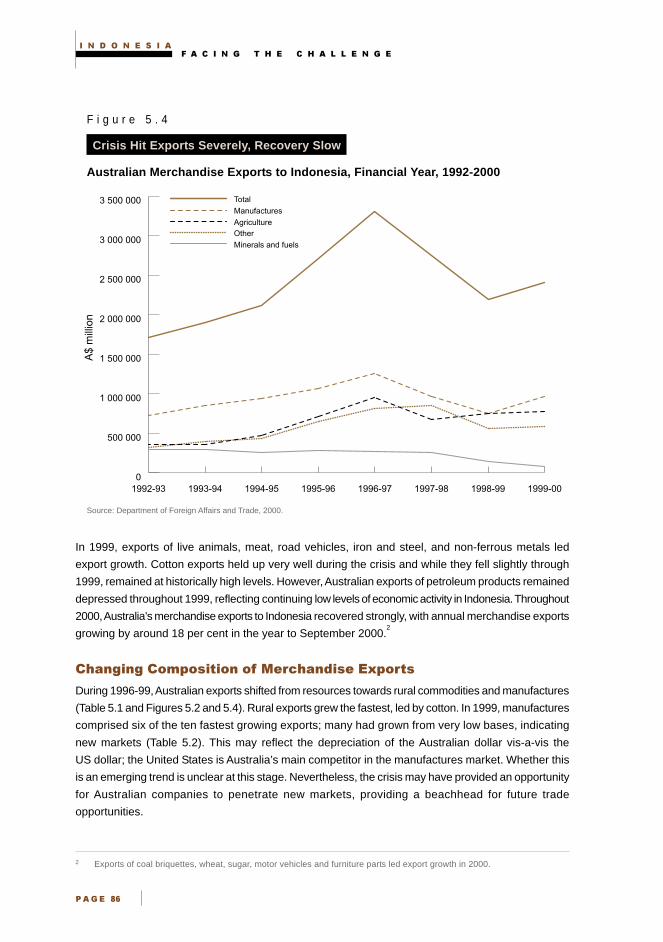
� � � � � � � � � � � � � � � � � � � � � � � � �
�� ��"
F i g u r e 5 . 4
Crisis Hit Exports Severely, Recovery Slow
Australian Merchandise Exports to Indonesia, Financial Year, 1992-2000
Source: Department of Foreign Affairs and Trade, 2000.
In 1999, exports of live animals, meat, road vehicles, iron and steel, and non-ferrous metals led
export growth. Cotton exports held up very well during the crisis and while they fell slightly through
1999, remained at historically high levels. However, Australian exports of petroleum products remained
depressed throughout 1999, reflecting continuing low levels of economic activity in Indonesia. Throughout
2000, Australia’s merchandise exports to Indonesia recovered strongly, with annual merchandise exports
growing by around 18 per cent in the year to September 2000.2
����#��# �!$ !��"�!� !% ����������� �� !�"�
During 1996-99, Australian exports shifted from resources towards rural commodities and manufactures
(Table 5.1 and Figures 5.2 and 5.4). Rural exports grew the fastest, led by cotton. In 1999, manufactures
comprised six of the ten fastest growing exports; many had grown from very low bases, indicating
new markets (Table 5.2). This may reflect the depreciation of the Australian dollar vis-a-vis the
US dollar; the United States is Australia’s main competitor in the manufactures market. Whether this
is an emerging trend is unclear at this stage. Nevertheless, the crisis may have provided an opportunity
for Australian companies to penetrate new markets, providing a beachhead for future trade
opportunities.
2 Exports of coal briquettes, wheat, sugar, motor vehicles and furniture parts led export growth in 2000.
A$
mill
ion
0
500 000
1 000 000
1 500 000
2 000 000
2 500 000
3 000 000
3 500 000 Total
Other
Manufactures
Minerals and fuels
Agriculture
1999-001998-991997-981996-971995-961994-951993-941992-93

� � � � � � � � � � � � � � � � � � � � � � � �
�� ��#
T a b l e 5 . 1
�� ������� ���� �������������
Sectoral Contributions to Growth of Australian Exports to Indonesia, 1996-99, Per centa
1996 1997 1998 1999 Share of Share oftotal exports total exports
1996 1999(per cent) (per cent)
Rural 9.5 4.8 -10.6 6.3 26.3 34.5
Live animals 3.0 0.0 -5.8 2.4 6.9 3.2
Meat 0.6 0.6 -1.8 1.6 1.8 2.1
Dairy products 0.9 0.3 -1.0 0.9 2.3 3.0
Sugar 1.0 0.5 -1.7 0.0 1.5 0.1
Textile materials 4.1 3.1 1.8 -0.7 10.3 21.5
Cereals 0.2 -0.1 0.0 1.0 0.4 1.3
Other rural -0.1 0.4 -2.1 2.1 3.5 4.6
Manufactures 5.4 2.8 -10.6 3.9 23.6 25.1
Road vehicles 0.4 -0.2 -0.5 2.9 1.3 3.7
Other transport 0.5 2.0 -2.0 0.4 0.7 1.1
Electric machinery 0.1 -0.6 -1.5 -0.7 3.2 0.7
General machinery 1.9 -0.8 -0.9 0.3 3.0 2.1
Other manufactures 2.5 2.4 -5.7 1.0 15.4 17.6
Resources -0.7 1.8 -11.2 1.1 23.3 19.4
Iron and steel -1.4 1.6 -2.9 1.3 2.8 3.0
Non-ferrous metals 1.9 -0.6 -3.7 1.8 11.0 10.9
Petroleum -1.4 0.7 -3.8 -3.6 8.2 3.1
Natural gas 0.0 0.0 0.0 0.9 0.0 0.9
Other resources 0.1 0.1 -0.8 0.8 1.2 1.5
Other (including confidential) 14.7 0.5 -4.1 -11.7 26.8 21.0
Total 28.9 9.9 -36.5 -0.3 100.0 100.0
Note: a Contribution to growth is calculated as the percentage change in the item’s exports multiplied by its share in total exports.
Source: Department of Foreign Affairs and Trade, 2000.

� � � � � � � � � � � � � � � � � � � � � � � � �
�� ���
F i g u r e 5 . 5
Rural Exports Still Dominate, Manufactures Significant
Composition of Australian Merchandise Exports to Indonesia, 1999
Source: Department of Foreign Affairs and Trade, 2000.
T a b l e 5 . 2
��������� ����� ��������������� ���������� ��!����
Ten Fastest Growing Australian Exports to Indonesia, 1999
Export Share of total Sector Growthmerchandise (per cent)
exports (per cent)
Liquefied propane and butane 0.89 Manufactures 132 879
Road vehicles 0.02 Manufactures 53 000
Steam and other vapour turbines 0.01 Manufactures 3 025
Men’s or boys’ clothing (knitted) 0.00a
Manufactures 2 600
Heavy transport vehicles 1.50 Manufactures 2 517
Other cereal flours 0.00a
Rural 1 550
Other non-ferrous base metals 0.01 Resources 1 393
Flour 1.00 Rural 1 177
Jewellery 0.01 Manufactures 995
Confectionery 0.02 Rural 922
Note: a Means rounded down to zero.
Source: Department of Foreign Affairs and Trade, 2000.
Rural 35%
Resources 19%
Other 21%
Manufactures 25%
Electric machinery 1%Other transport 1%General machinery 2%
Road vehicles 4%
Other manufactures 17%
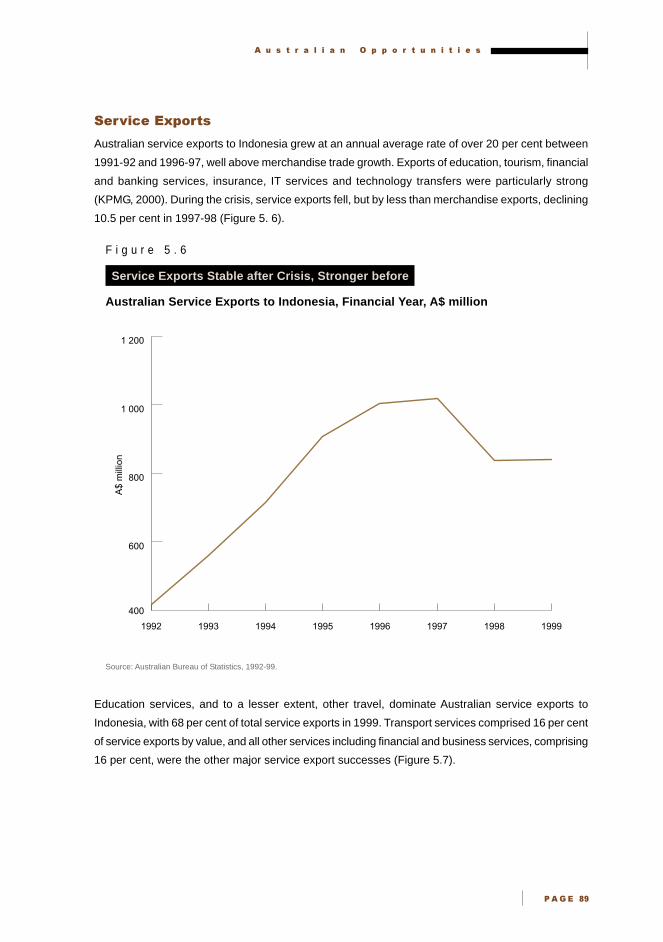
� � � � � � � � � � � � � � � � � � � � � � � �
�� ��$
���&��� �� !�"�
Australian service exports to Indonesia grew at an annual average rate of over 20 per cent between
1991-92 and 1996-97, well above merchandise trade growth. Exports of education, tourism, financial
and banking services, insurance, IT services and technology transfers were particularly strong
(KPMG, 2000). During the crisis, service exports fell, but by less than merchandise exports, declining
10.5 per cent in 1997-98 (Figure 5. 6).
F i g u r e 5 . 6
Service Exports Stable after Crisis, Stronger before
Australian Service Exports to Indonesia, Financial Year, A$ million
Source: Australian Bureau of Statistics, 1992-99.
Education services, and to a lesser extent, other travel, dominate Australian service exports to
Indonesia, with 68 per cent of total service exports in 1999. Transport services comprised 16 per cent
of service exports by value, and all other services including financial and business services, comprising
16 per cent, were the other major service export successes (Figure 5.7).
A$
mill
ion
400
600
800
1 000
1 200
19991998199719961995199419931992

� � � � � � � � � � � � � � � � � � � � � � � � �
�� �$%
F i g u r e 5 . 7
Education Dominates Service Exports
Australian Service Exports to Indonesia, Financial Year, A$ million
Source: Australian Bureau of Statistics, 2000b.
Indonesia’s more severe crisis caused Australia’s exports to Indonesia to fall more than exports to
other ASEAN economies (Figure 5.8). In the three years before the crisis, Australia’s exports to
Indonesia grew by around 30 per cent annually, exceeding the growth in exports to Thailand, Malaysia,
Philippines and Singapore. However, during the crisis, exports to Indonesia fell more sharply than
those to its ASEAN neighbours.
F i g u r e 5 . 8
Indonesian Trade Has Been Volatile
Growth in Australian Exports to Selected ASEAN Economies, 1996-99
Source: Department of Foreign Affairs and Trade, 2000.
Education and other travel 68%
Transport 16%
Other 16%
-40
-35
-30
-25
-20
-15
-10
-5
0
5
10
15
20
25
30
Thailand
Singapore
Philippines
Malaysia
Indonesia
1999199819971996
Per
cen
t
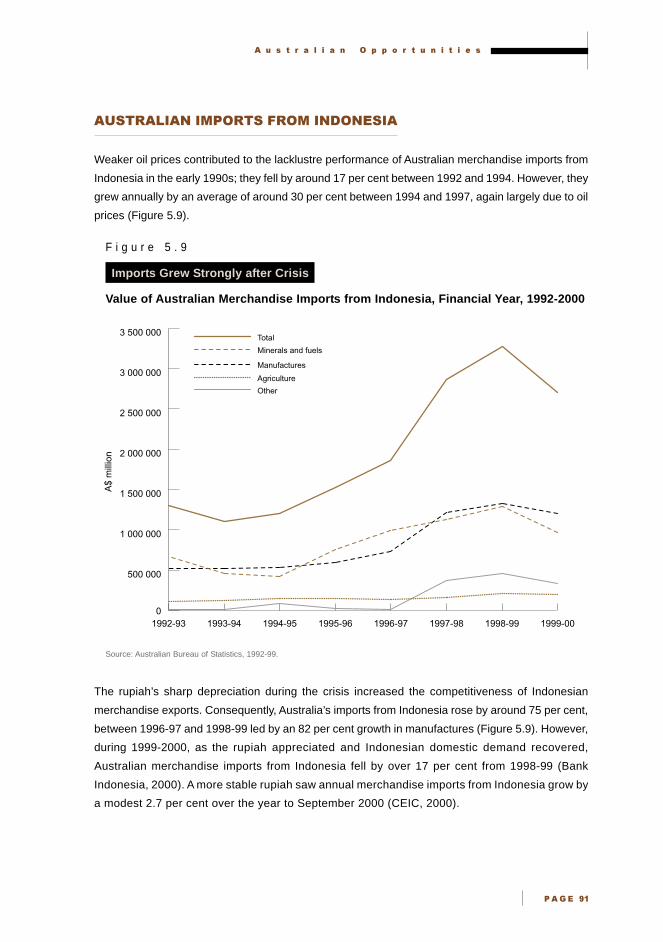
� � � � � � � � � � � � � � � � � � � � � � � �
�� �$�
��������� ������� ���� ������
Weaker oil prices contributed to the lacklustre performance of Australian merchandise imports from
Indonesia in the early 1990s; they fell by around 17 per cent between 1992 and 1994. However, they
grew annually by an average of around 30 per cent between 1994 and 1997, again largely due to oil
prices (Figure 5.9).
F i g u r e 5 . 9
Imports Grew Strongly after Crisis
Value of Australian Merchandise Imports from Indonesia, Financial Year, 1992-2000
Source: Australian Bureau of Statistics, 1992-99.
The rupiah’s sharp depreciation during the crisis increased the competitiveness of Indonesian
merchandise exports. Consequently, Australia’s imports from Indonesia rose by around 75 per cent,
between 1996-97 and 1998-99 led by an 82 per cent growth in manufactures (Figure 5.9). However,
during 1999-2000, as the rupiah appreciated and Indonesian domestic demand recovered,
Australian merchandise imports from Indonesia fell by over 17 per cent from 1998-99 (Bank
Indonesia, 2000). A more stable rupiah saw annual merchandise imports from Indonesia grow by
a modest 2.7 per cent over the year to September 2000 (CEIC, 2000).
A$
mill
ion
0
500 000
1 000 000
1 500 000
2 000 000
2 500 000
3 000 000
3 500 000Total
Other
Manufactures
Minerals and fuels
Agriculture
1999-001998-991997-981996-971995-961994-951993-941992-93

� � � � � � � � � � � � � � � � � � � � � � � � �
�� �$�
����#��# �!$ !��"�!� !% ����������� �$ !�"�
Australia’s post crisis imports from Indonesia comprise more manufactures and other imports, including
confidential and non-monetary gold, than before the crisis. Paper imports drive the increase in
manufactures. However, it is too soon to determine whether this trend is likely to continue. Resource
imports, mainly petroleum, remain the largest component of imports. By 1999, resources and
manufactured imports accounted for around 80 per cent of Australia’s merchandise imports from
Indonesia (Table 5.3 and Figure 5.10).
T a b l e 5 . 3
��������� �"�� �� ������ ����������� �� �����
Contributions to Growth of Australian Imports from Indonesia, 1996-99
1996 1997 1998 1999 Share of Share of total imports total imports
1996 1999(per cent) (per cent)
Rural -1.6 0.7 1.3 0.3 8.0 6.8
Rubber -1.0 -0.4 -0.3 0.0 2.0 0.7
Paper 0.1 0.1 0.5 0.5 0.2 1.2
Wood -0.4 0.1 0.0 -0.1 1.6 1.0
Coffee -0.3 0.2 0.8 -0.3 1.8 1.5
Other rural 0.1 0.6 0.3 0.3 2.4 2.4
Manufactures 5.9 10.0 29.0 -9.1 37.2 41.0
Paper manufactures 2.7 1.8 3.1 1.8 4.4 8.6
Furniture 0.3 1.0 0.4 0.1 3.0 2.9
Explosives 0.1 1.0 1.6 -0.3 0.3 1.7
Other manufactures 2.7 6.3 23.9 -10.6 29.4 27.9
Resources 27.5 16.0 3.5 -3.4 54.0 41.5
Petroleum 28.1 13.5 4.5 -3.3 51.8 39.6
Other resources -0.7 2.5 -1.0 -0.1 2.2 1.9
Other (including confidential) -4.5 6.0 23.0 -9.6 0.8 10.7
Total 27.3 32.6 56.9 -21.7 100.0 100.0
Note: Contribution to growth is calculated as the percentage change in the item’s exports multiplied by its share in total exports.
Source: Department of Foreign Affairs and Trade, 2000.
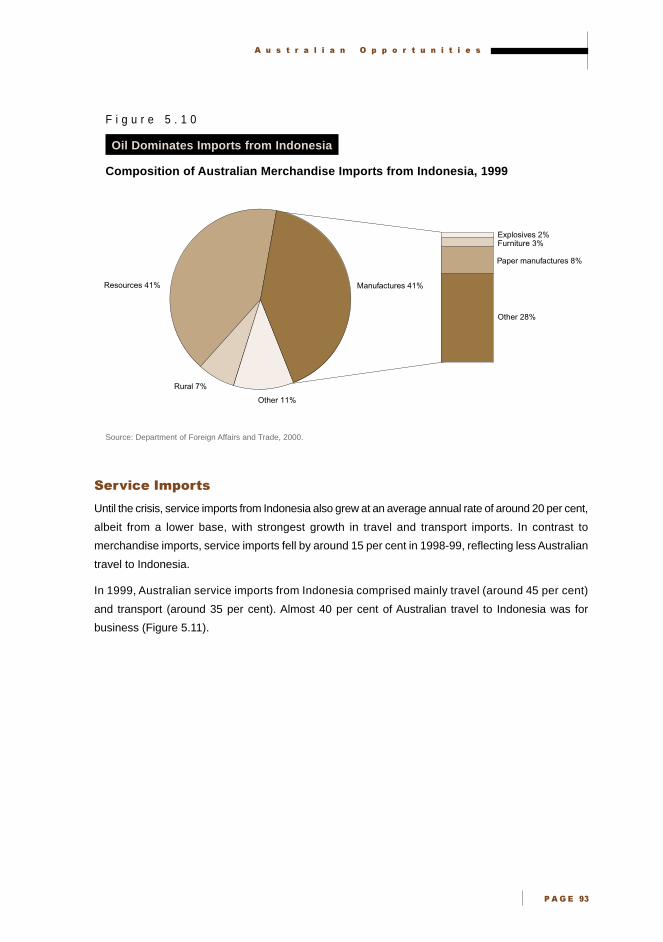
� � � � � � � � � � � � � � � � � � � � � � � �
�� �$
F i g u r e 5 . 1 0
Oil Dominates Imports from Indonesia
Composition of Australian Merchandise Imports from Indonesia, 1999
Source: Department of Foreign Affairs and Trade, 2000.
���&��� �$ !�"�
Until the crisis, service imports from Indonesia also grew at an average annual rate of around 20 per cent,
albeit from a lower base, with strongest growth in travel and transport imports. In contrast to
merchandise imports, service imports fell by around 15 per cent in 1998-99, reflecting less Australian
travel to Indonesia.
In 1999, Australian service imports from Indonesia comprised mainly travel (around 45 per cent)
and transport (around 35 per cent). Almost 40 per cent of Australian travel to Indonesia was for
business (Figure 5.11).
Resources 41%
Rural 7%
Other 11%
Manufactures 41%
Explosives 2%Furniture 3%
Paper manufactures 8%
Other 28%
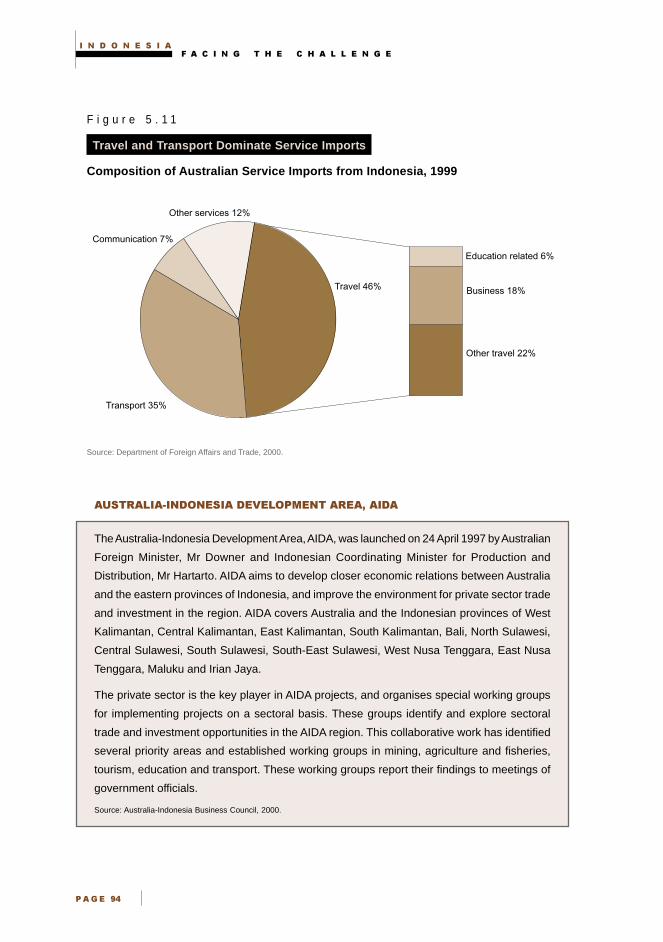
� � � � � � � � � � � � � � � � � � � � � � � � �
�� �$!
F i g u r e 5 . 1 1
Travel and Transport Dominate Service Imports
Composition of Australian Service Imports from Indonesia, 1999
Source: Department of Foreign Affairs and Trade, 2000.
���������������� ��������� ����� ���
The Australia-Indonesia Development Area, AIDA, was launched on 24 April 1997 by Australian
Foreign Minister, Mr Downer and Indonesian Coordinating Minister for Production and
Distribution, Mr Hartarto. AIDA aims to develop closer economic relations between Australia
and the eastern provinces of Indonesia, and improve the environment for private sector trade
and investment in the region. AIDA covers Australia and the Indonesian provinces of West
Kalimantan, Central Kalimantan, East Kalimantan, South Kalimantan, Bali, North Sulawesi,
Central Sulawesi, South Sulawesi, South-East Sulawesi, West Nusa Tenggara, East Nusa
Tenggara, Maluku and Irian Jaya.
The private sector is the key player in AIDA projects, and organises special working groups
for implementing projects on a sectoral basis. These groups identify and explore sectoral
trade and investment opportunities in the AIDA region. This collaborative work has identified
several priority areas and established working groups in mining, agriculture and fisheries,
tourism, education and transport. These working groups report their findings to meetings of
government officials.
Source: Australia-Indonesia Business Council, 2000.
Travel 46%
Other services 12%
Communication 7%
Transport 35%
Education related 6%
Business 18%
Other travel 22%

� � � � � � � � � � � � � � � � � � � �
� � � � ��
����������������� ���������
Recent trends in Australian exports to Indonesia indicate an emerging comparative advantage in
manufactures and service exports. At the same time, Indonesia has liberalised domestic agricultural
markets, dramatically improving access and opportunities for Australian agricultural exporters.
�������������������
Manufactures were the fastest growing Australian merchandise exports to Indonesia in 1999, reflecting
in part increased competitiveness from the depreciated Australian dollar. Rising domestic demand
and a recovering rupiah boosted Australia’s manufactured exports to Indonesia by 19 per cent in
1999, to A$538 million. Indonesia’s manufacturing sector also is recovering from the crisis, recording
growth of 2.2 per cent in 1999, raising its share of GDP to around 26 per cent (KPMG, 2000).
Vehicle related exports
After the Government lifted tight controls on vehicle imports, they increased five fold in 1999, boosting
Australia’s manufactured exports to Indonesia (Table 5.4). The June 1999 automotive deregulation
package allows Indonesia to import completely built up vehicles, providing a major opportunity for
Australian car manufacturers. By the end of 2000, preferential tariff rates for manufacturers using a
high percentage of local parts also will be phased out, further benefiting Australian exporters.3
Indonesian demand for cars is expected to rise by 10 per cent per year between 2000 and 2005, well
above the projected average for ASEAN economies (Tables 5.4 and 5.5).
T a b l e 5 . 4
�������������� ������������������
Australian Exports of Road Vehicles to Indonesia, A$ Thousands
Export sub-category 1998 1999 Growthin 1999
(per cent)
Passenger motor vehicles 6 587 22 947 248
Heavy transport vehicles 1 211 31 697 2 517
Other road motor vehicles 1 531 53 000
Motor vehicle parts 7 038 19 917 182
Motor cycles 85 364 328
Trailers and semi-trailers 795 3 086 288
Total 15 717 78 542 400
Source: Economist Intelligence Unit, 2000.
3 These policies complemented the June 1999 abolition of the national car program and local content scheme for automotive
products.
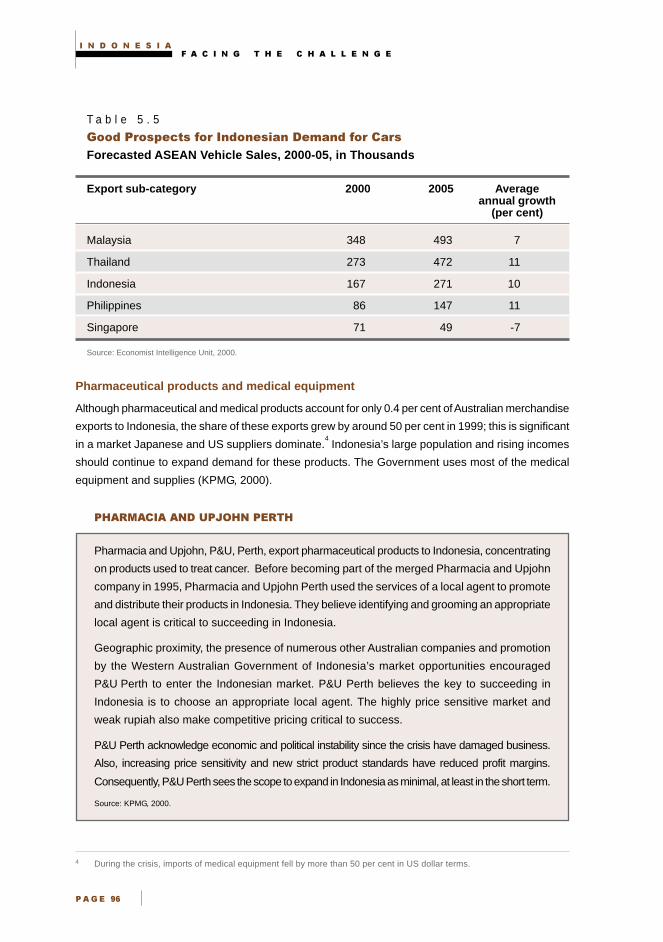
� � � � � � � � � � � � � � � � � � � � � � � � �
�� �$"
T a b l e 5 . 5
���"�� ���������� ���"���������� ��"��� �#� �
Forecasted ASEAN Vehicle Sales, 2000-05, in Thousands
Export sub-category 2000 2005 Averageannual growth
(per cent)
Malaysia 348 493 7
Thailand 273 472 11
Indonesia 167 271 10
Philippines 86 147 11
Singapore 71 49 -7
Source: Economist Intelligence Unit, 2000.
Pharmaceutical products and medical equipment
Although pharmaceutical and medical products account for only 0.4 per cent of Australian merchandise
exports to Indonesia, the share of these exports grew by around 50 per cent in 1999; this is significant
in a market Japanese and US suppliers dominate.4 Indonesia’s large population and rising incomes
should continue to expand demand for these products. The Government uses most of the medical
equipment and supplies (KPMG, 2000).
��������� � ����� �����
Pharmacia and Upjohn, P&U, Perth, export pharmaceutical products to Indonesia, concentrating
on products used to treat cancer. Before becoming part of the merged Pharmacia and Upjohn
company in 1995, Pharmacia and Upjohn Perth used the services of a local agent to promote
and distribute their products in Indonesia. They believe identifying and grooming an appropriate
local agent is critical to succeeding in Indonesia.
Geographic proximity, the presence of numerous other Australian companies and promotion
by the Western Australian Government of Indonesia’s market opportunities encouraged
P&U Perth to enter the Indonesian market. P&U Perth believes the key to succeeding in
Indonesia is to choose an appropriate local agent. The highly price sensitive market and
weak rupiah also make competitive pricing critical to success.
P&U Perth acknowledge economic and political instability since the crisis have damaged business.
Also, increasing price sensitivity and new strict product standards have reduced profit margins.
Consequently, P&U Perth sees the scope to expand in Indonesia as minimal, at least in the short term.
Source: KPMG, 2000.
4 During the crisis, imports of medical equipment fell by more than 50 per cent in US dollar terms.

� � � � � � � � � � � � � � � � � � � � � � � �
�� �$#
Consumer ready food products
Australia gained considerable market share in consumer ready food products after the crisis, reflecting
lower prices than major competitors such as the United States offered (KPMG, 2000). In 1999,
Australian exporters recorded excellent sales growth in meat (around 300 per cent), fruit (80 per
cent), and vegetable and dairy markets (50 per cent), mainly to the middle classes. Providing Australia
maintains its relative exchange rate advantage over competitors, continues to produce at competitive
prices and Indonesian incomes improve, growth in this export sector should continue.
Security and safety equipment
The Indonesian security and safety equipment market continues to offer good potential for Australian
exporters. According to 1998 estimates, Australia dominates the foreign players in Indonesia’s security
and safety equipment sector, holding around 30 per cent of the import market.5
Industrial, commercial, oil/gas and mining sector demand for this type of equipment is forecast to
increase over the next five years (KPMG, 2000). Particularly active sectors include equipment relating
to personal security, fire fighting and building protection.
�#���)*")��*
During the crisis, Indonesia’s agricultural imports were relatively durable, resisting the recession,
increasing their interest to Australian business (Australia-Indonesia Business Council, 1999c).
Significantly reduced barriers to agricultural imports are part of the post crisis economic reform program,
further supporting opportunities.
Grains
In November 1997, the Government removed import licensing requirements on commodities the
national logistic agency, BULOG, previously controlled; consequently, private imports of wheat, wheat
flour and soy beans, and the sale and distribution of flour, now are allowed, with obvious benefits for
Australian exporters. To smooth the transition to a fully open market, tariffs have replaced import
licences; a tariff of 20 per cent applies to soy beans and 10 per cent to wheat flour. These tariffs
should drop to 5 per cent or less by 2003.
In late 1998, the Government opened rice imports to competition, but applied a temporary import
duty of Rp. 430 per kilogram. As a regional exporter of rice, Australia is well positioned to take
advantage of this liberalisation. (See Chapter 10 - Agriculture.)
Australia remains Indonesia’s major supplier of wheat. Wheat-flour based industries, particularly
millers and downstream manufacturers of pasta, noodles, bread and biscuits, have considerable
potential; Australian producers are well placed to invest in these sectors (KPMG, 2000).
5 This is well above the market shares of Australia’s major competitors such as the United States (with 17 per cent), France
(with 11 per cent) and Singapore (with 10 per cent).

� � � � � � � � � � � � � � � � � � � � � � � � �
�� �$�
Cotton
With a large textiles industry and negligible domestic cotton production, Indonesia remains the world’s
largest cotton importer (KPMG, 2000). Despite Australian exports of cotton falling slightly in 1999,
they have performed particularly well in the past few years, with annual growth averaging around
20 per cent since 1995, and particularly strong growth in 1997 and 1998. With the depreciated
rupiah, the export-oriented textiles sector will continue its high demand for cotton.
Fishing vessels, handling and processing
Deregulation has lifted bans on importing fishing vessels, and fishing industry liberalisation is ongoing;
both moves provide significant opportunities for Australia. Demand for new fishing vessels should
grow considerably over coming years and fishing sector liberalisation provides excellent opportunities
for Australians to provide post-catch handling facilities such as refrigeration (Australia-Indonesia
Business Council, 1999d).
Sugar
A 25 per cent tariff on sugar is set to drop to 5 per cent or less by 2003. Australia, with a highly
efficient sugar industry, is well placed to take advantage of this opportunity. Australian sugar and wheat
exports to Indonesia are classified as confidential because of the small numbers of exporters involved.
Dairy and other sectors
In January 1998, the Indonesian Government dismantled controls on dairy product imports and wood
panel exports and shipment, industries in which Australia has considerable comparative advantage.
Local content requirements for dairy products were phased out in February 1998, well ahead of
Indonesia’s Uruguay Round commitment. These developments offer significant opportunities to
Australian exporters.
�����#
Indonesia is Australia’s most important market for mining equipment and services, absorbing exports
of A$300 million annually (Australia-Indonesia Business Council, 1999a). The presence of a strong
Australian mining network provides a foundation to expand Australian mining technology, service
and equipment exports (Indonesia-Australia Business Council News, May 2000, p. 1). The mining
sector accounts for around 10 per cent of Indonesia’s GDP and, after contracting by only 1.5 per cent
in 1999, should rebound strongly in 2000.6 Austmine, comprising several leading Australian mining
equipment exporters, supports industry exports. However, ongoing security issues may constrain
mining sector growth. (See Chapter 9 - Mining.)
���&����
As the Indonesian economy continues its reform process, the trend of strong growth in Australian
service exports should continue.
6 Mining activity declined by 2.8 per cent in 1998 (CEIC, 1998).
� � � � � � � � � � � � � � � � � � � � � � � �
�� �$$
Financial services
Australia’s financial service professionals, with considerable expertise in risk management and
regulatory compliance, are well placed to assist in the reform of Indonesia’s financial sector. Demand
is strong for corporate finance professionals who can help Indonesia attract new partners and strategic
alliances (Colley, 1999). Several Australian financial service providers are pursuing merger and
acquisition opportunities in Indonesia.
For example, in November 1999, ANZ increased its 4.9 per cent share in Bank Panin to 10 per cent
(with an option to increase its share to 28 per cent). ANZ also has a technical service agreement
supporting Bank Panin in developing human resources, information technology, trade and risk
management (Asia Pulse, 19 November 1999).
Legal, accounting and consulting services
Indonesia’s demand for legal and accounting services presents significant opportunities for professional
firms in Australia. Major opportunities exist in corporate debt restructuring, particularly providing
corporate recovery and due diligence services. Australian firms are at the forefront of debtor/creditor
negotiations and use Australian personnel to provide these services. Australia’s legal and accounting
professionals also can contribute to developing Indonesia’s judicial and corporate governance systems.
As debt restructuring concludes over the medium term, demand will increase for consultants assisting
in implementing new accounting and risk management systems, establishing business plans and
preparing feasibility studies (Colley, 1999).
Environmental services
New regulations rating manufacturers by their compliance with environmental standards offer
opportunities for Australian operators in this field.7 Rising demand by Indonesian firms to control
pollution presents an opportunity for Australian exporters, especially in construction, waste water
treatment, water supply and solid waste disposal facilities. For example, the South Australian Water
Corporation provided technology and expertise to the West Java Government to help it develop and
manage water resources, water supply and waste water treatment (Australia-Indonesia Business
Council, 1999b).
IT services
The number of Internet users in Indonesia is expected to increase from 1 million in 1999 to 1.5 million
in 2000 (KPMG, 2000). Although it still is in its infancy, Indonesia’s e-commerce industry should
increase nearly ten fold between 2000 and 2003 (KPMG, 2000). The Government recently allowed
IT start-up companies to raise capital on the Jakarta Stock Exchange. Australia possesses the
technological capabilities and human capital necessary to contribute to this expansion.
7 The Government publicises these ratings. Around 300 firms participate in this program, but the Government aims to raise
this to 750 firms by the end of 2000 (KPMG, 2000).

� � � � � � � � � � � � � � � � � � � � � � � � �
�� ��%%
������ �������� ����������
Perth based Surpac Software International produces, markets and sells mining software in
Indonesia, via an agency which Australians and Indonesians staff. Indonesia is a critical
market, with a sizeable proportion of South East Asia’s modern mines. The Surpac brand is
well known in Indonesia, especially among Australian mining companies, and Surpac’s Perth
headquarters ensures relatively easy access to the Indonesian export market.
Surpac provides regular upgrades and product support for its main software to its Indonesian
clients, and sales demonstrations to prospective clients. Perth based sales and support staff
regularly visit Indonesia. Surpac also trains its technical staff.
Surpac started to export to Indonesia in the mid 1980s. Initially, it undertook all marketing and
support services from Perth, making frequent visits to Indonesia to learn about the market.
Then it combined marketing trips with local staff training, to cover travelling costs. However,
to market its technical products, Surpac realised it needed more permanent local support.
After deciding against establishing a joint venture with a local firm, it tried to establish a joint
office with another Australian company, but this option proved untenable as the financial
crisis progressed. Finally, an established Australian surveying contractor, PT Globecon, familiar
with Surpac’s product, agreed to assist with marketing. The marketing agent receives a
commission for seeking out new clients, and Surpac provides quotations and sales support,
including sales presentations.
Surpac believes flexibility is critical to succeeding in Indonesia, particularly in marketing
strategies. Technical aspects of the product were adapted to Bahasa Indonesian. Commitment
to client service and after sales service were important, and local Indonesian support was
vital to understand the subtleties of doing business in Indonesia.
Political instability remains a concern. Civil unrest disrupts marketing and sales trips, especially
in regions where the mining sector is concentrated. The weak rupiah makes Surpac’s products,
invoiced in Australian dollars, much more expensive than before the crisis. Lack of language
training and poor English amongst Indonesians can be a problem. Nevertheless, Surpac
generally is comfortable with the prospects for its current Indonesian operations.
Source: KPMG, 2000.
Education services
Australian educational institutions’ good reputation, effective marketing strategies and relatively low
tuition fees mean Australia attracts around 40 per cent of all Indonesian students pursuing overseas
studies; this proportion is higher than any other education provider achieves (Table 5.6). In one
innovative approach, Monash University and University of New South Wales in conjunction with an
Indonesian company, have opened pre-university classes in Jakarta, guaranteeing placements for
graduates at either institution.
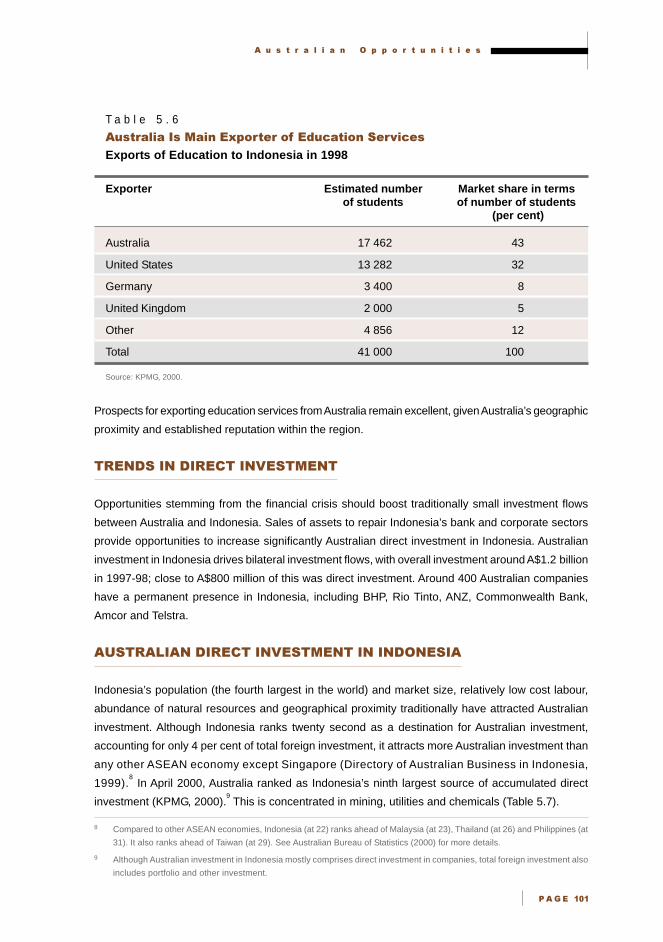
� � � � � � � � � � � � � � � � � � � � � � � �
�� ��%�
T a b l e 5 . 6
'��� ����������������� �� �����"��������� (����
Exports of Education to Indonesia in 1998
Exporter Estimated number Market share in termsof students of number of students
(per cent)
Australia 17 462 43
United States 13 282 32
Germany 3 400 8
United Kingdom 2 000 5
Other 4 856 12
Total 41 000 100
Source: KPMG, 2000.
Prospects for exporting education services from Australia remain excellent, given Australia’s geographic
proximity and established reputation within the region.
���� � ����� �+������
Opportunities stemming from the financial crisis should boost traditionally small investment flows
between Australia and Indonesia. Sales of assets to repair Indonesia’s bank and corporate sectors
provide opportunities to increase significantly Australian direct investment in Indonesia. Australian
investment in Indonesia drives bilateral investment flows, with overall investment around A$1.2 billion
in 1997-98; close to A$800 million of this was direct investment. Around 400 Australian companies
have a permanent presence in Indonesia, including BHP, Rio Tinto, ANZ, Commonwealth Bank,
Amcor and Telstra.
��������� ����� �+������ � ������
Indonesia’s population (the fourth largest in the world) and market size, relatively low cost labour,
abundance of natural resources and geographical proximity traditionally have attracted Australian
investment. Although Indonesia ranks twenty second as a destination for Australian investment,
accounting for only 4 per cent of total foreign investment, it attracts more Australian investment than
any other ASEAN economy except Singapore (Directory of Australian Business in Indonesia,
1999).8 In April 2000, Australia ranked as Indonesia’s ninth largest source of accumulated direct
investment (KPMG, 2000).9 This is concentrated in mining, utilities and chemicals (Table 5.7).
8 Compared to other ASEAN economies, Indonesia (at 22) ranks ahead of Malaysia (at 23), Thailand (at 26) and Philippines (at
31). It also ranks ahead of Taiwan (at 29). See Australian Bureau of Statistics (2000) for more details.
9 Although Australian investment in Indonesia mostly comprises direct investment in companies, total foreign investment also
includes portfolio and other investment.
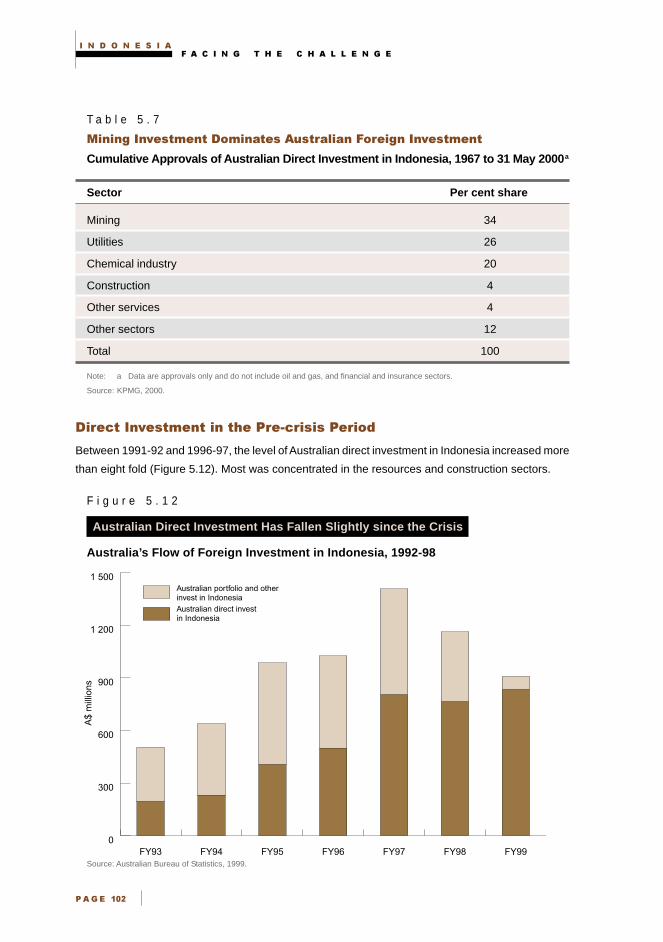
� � � � � � � � � � � � � � � � � � � � � � � � �
�� ��%�
T a b l e 5 . 7
���������(��� ������ �������'��� �������� �������(��� ���
Cumulative Approvals of Australian Direct Investment in Indonesia, 1967 to 31 May 2000a
Sector Per cent share
Mining 34
Utilities 26
Chemical industry 20
Construction 4
Other services 4
Other sectors 12
Total 100
Note: a Data are approvals only and do not include oil and gas, and financial and insurance sectors.
Source: KPMG, 2000.
����" ��&��"$��" �� "�� ���������� ����!�
Between 1991-92 and 1996-97, the level of Australian direct investment in Indonesia increased more
than eight fold (Figure 5.12). Most was concentrated in the resources and construction sectors.
F i g u r e 5 . 1 2
Australian Direct Investment Has Fallen Slightly since the Crisis
Australia’s Flow of Foreign Investment in Indonesia, 1992-98
Source: Australian Bureau of Statistics, 1999.
A$
mill
ions
0
300
600
900
1 200
1 500Australian portfolio and otherinvest in IndonesiaAustralian direct investin Indonesia
FY99FY98FY97FY96FY95FY94FY93
� � � � � � � � � � � � � � � � � � � � � � � �
�� ��%
Mining companies BHP and Rio Tinto are particularly active in Indonesia. They established large scale
operations for mining coal, gold and tin; BHP alone employed around 4 000 people in Indonesia by 1996
(BHP, 2000a).10
Indonesia’s extensive infrastructure requirements also generated significant investment
opportunities for Australian infrastructure and construction companies during this period. As tariffs decline,
clothing, footwear and textile manufacturing enterprises, increasingly attract Australian investment.
����� ������ ���� ���������
BHP has a significant coal mining presence in Indonesia. In Kalimantan, PT Arutmin Indonesia
(80 per cent BHP, 20 per cent PT Bakrie and Brothers) operates the Senakin and Satui
mines, and North Pulau Laut coal terminal. PT Kendilo Coal (80 per cent BHP, 20 per cent
Mitsui Mining Company) manages the Petangis mine, also in Kalimantan.
BHP’s Indonesian mines exported 6.8 million tonnes of coal in 1999, up 15.7 per cent on the
tonnage exported in 1998. The Satui mine was constructed in 1989 and the Senakin mine,
constructed in 1991, was expanded in 1994 to increase its capacity to 4 million tonnes per
year. The Petangis deposit, developed in 1994, produces 1 million tonnes per year.
Source: BHP, 2000b.
����������� ���11
Manufacturing firm XYZ, a prominent Australian company, has maintained a direct investment
presence in Indonesia since the mid 1970s, producing both for the local market and export.
Manufacturer XYZ is a joint venture with two local partners; it holds a majority, but not a
controlling interest. Since the financial crisis, XYZ’s profit has increased. This is because the
depreciated rupiah increased export competitiveness, and the company’s access to foreign
currency funding during the financial system collapse gave it a significant competitive
advantage. Access to capital allowed the company to guarantee clients of product supply, a
priority when doing business in Indonesia. Manufacturer XYZ maintains close relationships
with business partners and the local community who highly regard the Australian manager.
Manufacturer XYZ has learned to deal effectively with intra-firm politics.
Manufacturer XYZ points out companies now entering Indonesia may face legal uncertainty
and difficulties in obtaining finance, even from foreign institutions. It also considers slowing
economic reforms a concern.
Source: KPMG, 2000.
10 Other Australian companies with substantial investments in Indonesia in mineral exploration and production include Aberfoyle
Ltd (copper and gold), Aurora Gold Ltd (gold), Laverton Gold (gold), Meekatharra Minerals (gold and silver), Newcrest
Mining Ltd (gold and silver), Pelsart (gold), Placer Pacific (gold and base metals), Wesfarmers Coal Pty Ltd (coal), North
Ltd (gold) and WMC (coal). (See Australia-Indonesia Business Council web site, OzIndo Online).
11 This firm’s name was suppressed at the request of the company for commercial-in-confidence reasons.

� � � � � � � � � � � � � � � � � � � � � � � � �
�� ��%!
Several financial institutions, including ANZ and Colonial have established banking and insurance
joint ventures.
������� ������ � �������� ������� ������
With the life insurance market’s strong recovery from the financial crisis, Astra CMG Life, a
joint venture between Australia’s Colonial Mutual Group and the Astra Group, saw income
from premiums jump 55 per cent in 1998. By the end of 1998, the company had 315 000 customers
and 1 500 employees. In 1999, to respond to strong growth, Astra CMG Life opened five new
branches, adding to the existing branch network of 20 offices.
The low coverage of the national pension scheme and a growing middle class generate
considerable growth opportunities for insurance companies in Indonesia that now can be
100 per cent foreign owned. Life insurance requires a long term strategic commitment; Colonial
Mutual Group’s commitment is based on market potential. The current penetration of life
insurance is less than 3 per cent of the Indonesian population; in other Asian neighbours, the
penetration rate is more than 20 per cent. Indonesia’s population is large; the economy is
improving; and consumers’ disposable income is increasing. Therefore, the life insurance
industry should flourish. Consumer awareness of the value of creating wealth for retirement
and family protection is increasing rapidly; this also strengthens confidence that the growth
potential for the life insurance industry in Indonesia is strong.
Astra CMG Life, a 50:50 joint venture of the Colonial Group (Australia) and Astra International
(Indonesia), was established in October 1992, after a two year market appraisal. As the life
insurance market matured, Astra CMG Life expanded, and developed new products and
services to meet the changing needs of the Indonesian market, providing savings, investment,
health and traditional risk products. The joint venture offers the strong branding, consumer
awareness and success of a large local partner that survived the financial crisis and Colonial’s
financial strength. Colonial contributes growth via shareholder capital injections and its
international experience, allowing transfers of state-of-the-art products, systems and services
to Indonesia.
Despite the financial crisis, Astra CMG Life grew by more than 20 per cent per year, and
recorded profits in both 1998 and 1999. Unlike in other Asian economies, the insurance
industry does not suffer excessive legal and regulatory restrictions. However, the rupiah
continues to be volatile, and tools such as currency swaps and options to hedge against
currency fluctuations are limited.
Consumers and businesses overwhelmingly support foreign financial service companies which
offer secure investments. Therefore, Astra CMG Life believes growth opportunities in this
market are equal to or better than those elsewhere. From the Indonesian Government’s
perspective, foreign financial service companies help retain savings in Indonesia.
Source: KPMG, 2000.

� � � � � � � � � � � � � � � � � � � � � � � �
�� ��%
����" ��&��"$��" ����� "�� ��������* ������
With increased perceptions of risk, Australians divested A$40 million from Indonesia in 1997-98,
reducing the level of Australian direct investment by around 5 per cent (Figure 5.12).
In 1999, programs reforming the financial and corporate sectors bolstered investor confidence, although
sensitivity to slippage in implementation remains. A low exchange rate and assets sales encouraged
Australian investors to return to Indonesia. In 1999, Australian companies gained approval for
54 new investment projects and expansions on existing investment valued at US$2.5 billion,
placing Australia second in terms of the value of approvals.12
In October 1999, P&O Ports
(Australia) invested US$170 million acquiring a 49 per cent share in the Surabaya Tanjung Perak
port container (Buchannan, 2000). Australian firms continue to pursue new investments in 2000,
with approvals for 34 new projects worth a total of US$32 million given between January and
July 2000. In July 2000, BHP announced it had reached agreement with Falconbridge Limited to form
a joint venture which may develop the Gag Island nickel laterite project (BHP, 2000c).13
Foreign investor confidence appears to be increasing; Indonesian balance of payments show foreign
direct investment approvals during the third quarter of 1999 exceeded all 1998 approvals. Foreign
interest was concentrated in the chemicals, electricity, gas, water and paper sectors; these traditionally
have attracted strong interest. (See Chapter 3 - Foreign Investment, particularly Table 3.1.)
������ ����� �+������ � ���������
Official data indicate Indonesia’s direct investment presence in Australia was A$55 million in 1997-98
and has risen somewhat since the crisis (Figure 5.13). Low investment levels partly reflect Indonesian
investor preference for Australian portfolio and other financial assets. Also, some Indonesian investment
may arrive via Singapore, and be included in Singaporean data.
������ ����� �+������ ������, � ������������
The Economist Intelligence Unit forecasts foreign direct investment in Indonesia will grow by 20 per cent
per year between 2001 and 2003 (Buchannan, 2000). A dynamic and competitive export sector
provides an ideal environment for start-up investment. Ongoing sales of corporate and financial
assets also promise new opportunities for Australian investment in Indonesia. Australia is well placed
to consolidate its commercial presence in the mining sector, as well as increase its presence in the
infrastructure, manufacturing and financial sectors. However, doubts over economic, political and
social stability, and an underdeveloped legal system could dampen new direct investment prospects.
(See Chapter 3 - Foreign Investment.)
12 However, approval for a large waste water project in Riau province, worth US$2.2 billion, was the main reason for this
very sharp increase.
13 At this stage, the basis of the agreement is that Falconbridge would spend US$75 million to gain a 37.5 per cent interest in
the Gag Island project, with BHP and PT Aneka Tambang holding 37.5 per cent and PT Aneka Tambang holding 25 per cent
interests in the project. Currently, BHP holds a 75 per cent interest in the project and PT Aneka Tambang holds the remaining
25 per cent.
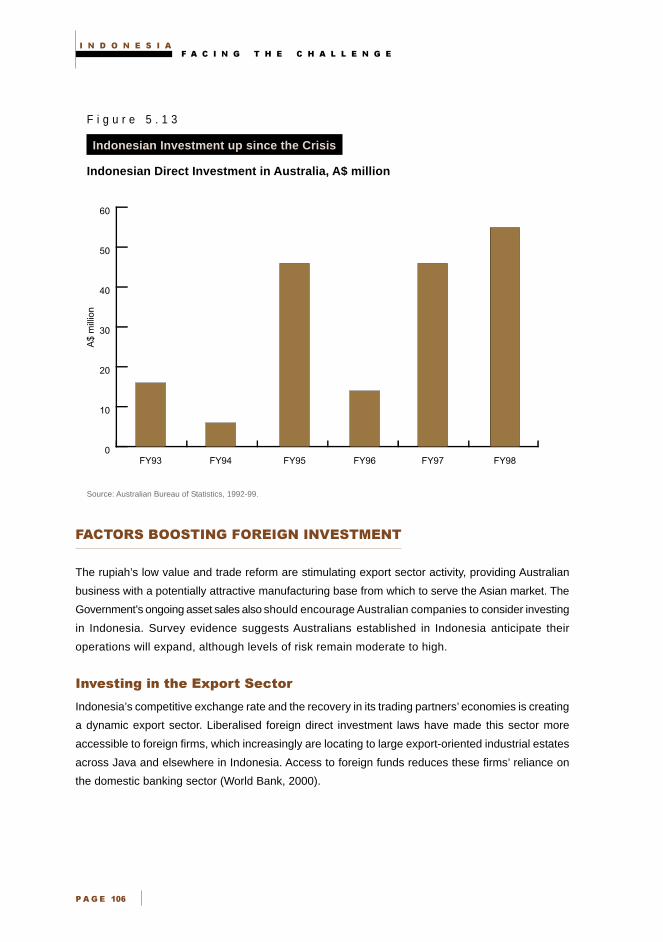
� � � � � � � � � � � � � � � � � � � � � � � � �
�� ��%"
F i g u r e 5 . 1 3
Indonesian Investment up since the Crisis
Indonesian Direct Investment in Australia, A$ million
Source: Australian Bureau of Statistics, 1992-99.
������� ������' �����' �+������
The rupiah’s low value and trade reform are stimulating export sector activity, providing Australian
business with a potentially attractive manufacturing base from which to serve the Asian market. The
Government’s ongoing asset sales also should encourage Australian companies to consider investing
in Indonesia. Survey evidence suggests Australians established in Indonesia anticipate their
operations will expand, although levels of risk remain moderate to high.
��&��"��# �� "�� �� !�" ���"!�
Indonesia’s competitive exchange rate and the recovery in its trading partners’ economies is creating
a dynamic export sector. Liberalised foreign direct investment laws have made this sector more
accessible to foreign firms, which increasingly are locating to large export-oriented industrial estates
across Java and elsewhere in Indonesia. Access to foreign funds reduces these firms’ reliance on
the domestic banking sector (World Bank, 2000).
0
10
20
30
40
50
60
FY98FY97FY96FY95FY94FY93
A$
mill
ion
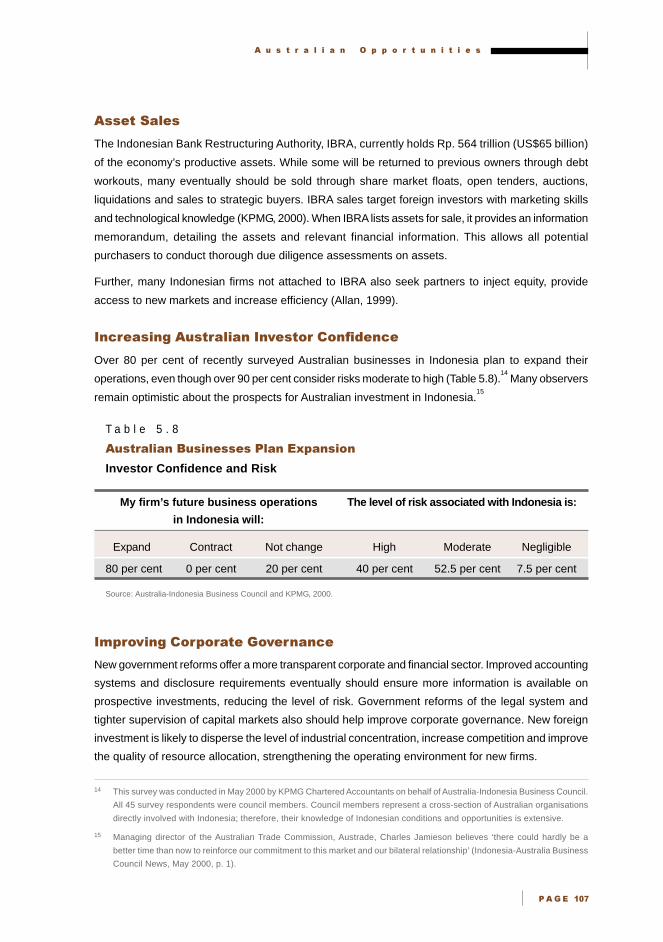
� � � � � � � � � � � � � � � � � � � � � � � �
�� ��%#
����" ��*��
The Indonesian Bank Restructuring Authority, IBRA, currently holds Rp. 564 trillion (US$65 billion)
of the economy’s productive assets. While some will be returned to previous owners through debt
workouts, many eventually should be sold through share market floats, open tenders, auctions,
liquidations and sales to strategic buyers. IBRA sales target foreign investors with marketing skills
and technological knowledge (KPMG, 2000). When IBRA lists assets for sale, it provides an information
memorandum, detailing the assets and relevant financial information. This allows all potential
purchasers to conduct thorough due diligence assessments on assets.
Further, many Indonesian firms not attached to IBRA also seek partners to inject equity, provide
access to new markets and increase efficiency (Allan, 1999).
���������# �)�"��*��� ��&��"!� �!�%������
Over 80 per cent of recently surveyed Australian businesses in Indonesia plan to expand their
operations, even though over 90 per cent consider risks moderate to high (Table 5.8).14
Many observers
remain optimistic about the prospects for Australian investment in Indonesia.15
T a b l e 5 . 8
'��� ������$������������������������
Investor Confidence and Risk
My firm’s future business operations The level of risk associated with Indonesia is:
in Indonesia will:
Expand Contract Not change High Moderate Negligible
80 per cent 0 per cent 20 per cent 40 per cent 52.5 per cent 7.5 per cent
Source: Australia-Indonesia Business Council and KPMG, 2000.
�$ �!&��# �!� !��"� '!&�������
New government reforms offer a more transparent corporate and financial sector. Improved accounting
systems and disclosure requirements eventually should ensure more information is available on
prospective investments, reducing the level of risk. Government reforms of the legal system and
tighter supervision of capital markets also should help improve corporate governance. New foreign
investment is likely to disperse the level of industrial concentration, increase competition and improve
the quality of resource allocation, strengthening the operating environment for new firms.
14 This survey was conducted in May 2000 by KPMG Chartered Accountants on behalf of Australia-Indonesia Business Council.
All 45 survey respondents were council members. Council members represent a cross-section of Australian organisations
directly involved with Indonesia; therefore, their knowledge of Indonesian conditions and opportunities is extensive.
15 Managing director of the Australian Trade Commission, Austrade, Charles Jamieson believes ‘there could hardly be a
better time than now to reinforce our commitment to this market and our bilateral relationship’ (Indonesia-Australia Business
Council News, May 2000, p. 1).

� � � � � � � � � � � � � � � � � � � � � � � � �
�� ��%�
�+����� ������ �� �+������
However, Indonesia’s rapidly changing environment introduces uncertainties that may weigh on foreign
investment flows. These include decentralisation and the possibility of higher taxes.
����"��*���"�!� !% "�� � �!&�* ��!����
Regional devolution is shifting responsibility for reviewing foreign investment applications to regional
foreign investment boards, raising the risk that new taxes and charges may be introduced, making
the application process more complex. (See Chapter 2 - Political Developments.)
�����* �����"���"-
The need to reduce government debt incurred to refinance the banking sector may lead to higher
corporate tax rates in the medium term, possibly deterring foreign direct investment. However, higher
oil revenue in 2000 and 2001 should help the fiscal situation.
���.������ �� "�� ��#�* �-�"�$
While recent commercial court developments have been encouraging, the Government’s reform of
the legal system will take time, and some foreign investors may defer investments until the new
system is functioning fully.
��������� ������� ��,� ���( ������
The Australia-Indonesia Business Council is the main industry group promoting business relationships
between the two countries, and comprises more than 700 members including large corporations,
medium and small enterprises. The council aims to represent the interests of members in bilateral
commercial and trade matters relating to Indonesia, and foster friendship and cultural understanding
between the business communities and people of Australia and Indonesia.
Each year, the council and the Indonesia-Australia Business Chamber of Commerce, based in
Indonesia, hold a joint business conference, alternating between venues in Australia and Indonesia.
Business people from both countries and officials from both governments attend this conference.
Contact details of the Australia-Indonesia Business Council are at the end of the report.
�����������
Australia’s proximity and complementarity to Indonesia’s economy suggest significant potential for
further developing the already healthy commercial relationship. A flourishing export and small and
medium enterprise sector provide new opportunities for Australian investment. New laws further
opening the Indonesian economy to trade and foreign investment, coupled with the program of asset
sales, provide a unique opportunity for the Australian business community to increase its engagement
with Indonesia. A growing middle class points to new opportunities for a range of Australian producers
and service providers. Appropriate risk management strategies continue to be important.
� � � � � � � � � � � � � � � � � � � � � � � �
�� ��%$
���������
Australia-Indonesia Business Council, 2000, www.aibc.net.au/aida, accessed on 17 October 2000.
___ 1999a, ‘Mining Shows Resilience’ OzIndo Online, Vol. 5, No. 5, December, www.tcn.com.au/
~ozindo/html/past_issues.shtml., accessed on 29 August 2000.
___ 1999b, ‘Water – the Fuel for Development’, OzIndo Online, Vol. 5, No. 2, July, www.tcn.com.au/
~ozindo/html/past_issues.shtml., accessed on 29 August 2000.
___ 1999c, ‘A Natural Target’, OzIndo Online, Vol. 5, No. 3, December, www.tcn.com.au/~ozindo/
html/past_issues.shtml., accessed on 29 August 2000.
Australia-Indonesia Business Council and KPMG, 2000, ‘Survey on Australian Investment in Indonesia’,
provided to East Asia Analytical Unit as part of a consultancy by KPMG.
Australian Bureau of Statistics, 2000, International Investment Position 1998/1999: Supplementary
Country Statistics, ABS, Canberra.
___ 1999, International Investment Position 1997/1998: Supplementary Country Statistics, ABS, Canberra.
___ 1992 to 1999, ‘Balance of Payments and International Investment Position’, ABS, Canberra.
Bank Indonesia, 2000, ‘Review of Economy, Monetary and Banking’, www.bi.go.id, accessed on
10 May 2000.
BHP, 2000a, www.bhp.com.au, accessed on 18 May 2000.
___ 2000b, ‘Coal – Indonesia Coal’, www.bhp.com.au, accessed on 29 August 2000.
___ 2000c, ‘ BHP Announce Discussions on Gag Island Nickel Project’ www.bhp.com.au, accessed
on 29 August 2000.
Buchannan, I., 2000, ‘Southeast Asia: Managing Opportunities and Risk’, paper presented at The
Economist Conference Asia-Pacific Forecasting Roundtable Asia to 2004 – the Challenge of
Profitable Growth, 23 August, Sydney.
Colley, I., 1999, ‘Business Impacts: New Institutions and New Opportunities’, speech presented to
the Australia Indonesia Business Forum on the Next Chapter, www.tcn.com.au/~ozindo/html/
past_issues.shtml., accessed on 29 August 2000.
CEIC, 2000, Asian Economic Database, Hong Kong, accessed on 2 July 2000.
Datastream, 2000, Economic Database, London.
Department of Foreign Affairs and Trade, 2000, Stars Database, accessed on 23 November 2000.
Economist Intelligence Unit, 2000, ‘ASEAN Auto Report’, EIU, London.
KPMG, 2000, ‘Report to East Asia Analytical Unit on the Australia-Indonesia Business Relationship’,
July, Sydney.
World Bank, 2000, Indonesia: Accelerating Recovery in Uncertain Times, World Bank, Washington DC.

� � � � � � � � � � � � � � � � � � � � � � � � �
�� ���%

� � � � � � � �
�� ����
���������������������
��������
• The Government’s reform program, including measures addressing
corporate governance and the legal system, is changing the
business culture.
• The Indonesian market rewards Australian businesses that take time
to develop strong personal relationships and community ties.
• Managing a business in Indonesia requires a sound understanding
of the culture’s influence on hiring, training and managing staff.
• Navigating Indonesia’s legal and regulatory system is best done with
the aid of a notary; consulting a notary when setting up a company,
obtaining approval for foreign investment and drafting a contract is
strongly advised.
� � � � � � � � � � � � � � � � � � � � � � � � �
�� ����
Operating successfully in Indonesia requires patience and an understanding of influences affecting
business culture, and legal and regulatory environments. Many promising changes underway in the
Indonesian business environment eventually should help Indonesia emerge as an attractive investment
destination and profitable market for Australian companies.
This chapter analyses cultural influences on business and identifies ways to use these to commercial
advantage. It assesses the possible impact on the commercial environment of reforms introduced
since the financial crisis. Finally, the chapter analyses significant aspects of the changing regulatory
and legal environment relevant to undertaking business.
���������������� ���
Businesses understanding and capitalising on cultural influences are more likely to succeed than
those simply ‘coping’ with them. This section identifies how foreign firms can use local approaches to
their advantage.
�������������������������������� ���
Investing in relationships is critical to succeeding in Indonesia. Establishing a relationship requires
time, preferably with face-to-face contact with a person of similar age and status. Demonstrating
loyalty and trustworthiness is critical to maintaining a relationship. The longer term returns of investing
in relationships can be significant and include:
• expediting bureaucratic processes where the relationship is with a government official
• accessing information and distribution networks
• opening joint venture opportunities, especially in manufacturing.
Relationships can determine many facets of commercial life, including granting credit, placing orders
and awarding contracts. A longstanding obligation between two people can affect commercial
outcomes. Showing patience and flexibility in commercial dealings builds trust and improves the
chances of a successful outcome; contrasting expectations can have adverse consequences.
Australian business people should not ‘force’ a relationship, or overestimate its depth.
Variables including age, gender, educational and marital status, also affect how easily personal and
commercial relationships are formed. Western firms may find it more productive to send older, more
mature executives rather than young personnel to negotiate or work in Indonesia. Men especially are
not considered mature until they are 40 years old, and younger people can be excluded from decision
making processes. In all spheres, younger people defer in language and attitude to older people,
even if the age difference is negligible.
� � � � � � � � � � � � � � � � � �
�� ���!
������������!�����������������"
The group’s welfare predominates in Indonesian culture, so the local community is very important.
Foreign businesses fulfilling their obligations to those living and working in their immediate
neighbourhood stand to gain significant advantages.
The local community centres around the neighbourhood council, comprising a group of five to
40 houses (a RT or Rukun Tetangga), that together form a larger unit (a RW or Rukun Warga).
Informal meetings of RT and RW are held monthly, and businesses are expected to notify each of
these bodies of their arrival in the local community.1
The neighbourhood council can assist local firms, including:
• expediting bureaucratic processes, such as obtaining permits
• resolving disputes through the musyawarah, an important process of conflict resolution involving
all concerned parties. A policeman convenes the musyawarah, and the results are based on
community consensus. Its concluding communique outlines the consensus decision. Its decisions
have a very strong legitimacy in the community, as all parties have been consulted and involved
in the process. An official materai (tax stamp) is often affixed, increasing this legitimacy
• forming the first line of defence against acts of crime through surveillance and information sharing.
Businesses in Indonesia are well advised to develop a genuine awareness of their surrounding
community. Demonstrating a business contributes to community welfare helps ensure the community
has an interest in protecting the business. Unless a venture seeks local community involvement,
providing employment and investment will not ensure good relations or security.
The concept of traditional land ownership remains strong across Indonesia, and irrespective of
contractual rights the Government may award, local communities will act to protect their environment.
Hence, mining companies adopting consensus based approaches to secure their rights are more
likely to receive local community support than those relying on legal solutions.2
�#!�����$�������$��#�����%�������&����#��
Government and broader society are responding to the financial crisis and the ending of the New
Order regime, and gradually changing business practices. Indonesians are increasingly proactive in
championing social justice and transparency.
New government reforms and laws passed since 1997 governing corporations are changing the
business environment. For example, new corporate financial reporting and shareholder accountability
laws increase business transparency and information, especially for those seeking to invest in existing
1 These meetings commonly are held on the seventeenth of each month.
2 Under the Soeharto regime, local communities often were by-passed in the consultation process for projects, or were
pressured to accept very unfavourable terms. Foreign mining companies often were unaware of this, and many are shocked
by recent developments at their mines.
� � � � � � � � � � � � � � � � � � � � � � � � �
�� ���"
ventures (Jakarta Post, 28 April 2000). New bankruptcy and capital market laws conform with
international best practice, clarifying firms’ obligations to creditors and shareholders. Newly introduced
laws covering anti-competitive behaviour also protect new entrants from predatory behaviour by
existing market players. Recent audits of government institutions and investigation of state officials
and bureaucrats eventually should improve the quality of the public service. Indonesian Bank
Restructuring Agency, IBRA, sales of Indonesian corporations and banks may dilute the concentration
of asset ownership in the economy over coming years, especially through increasing foreign ownership
and competition between companies and industrial groups. (See Chapter 8 - Corporate Restructuring.)
Nevertheless, implementing these new laws will take time and resources, so gains will not be
immediate; the Government recognises this is the case with legal system reforms.
#�������������������������
The gradual change in business culture since the crisis generates both opportunities and uncertainties
for foreign managers. Basic features of society are likely to adapt to, rather than be replaced by new
approaches to doing business. Corporations investing in training and language skills are best placed
to take advantage of these opportunities.
������� ������#���������
Firms should devise management systems to interface as far as possible with local approaches,
accommodating hierarchy and encouraging social interaction in the workplace. While these may
appear less efficient from an Australian perspective, they usually suit the Indonesian environment.
Firms need to recruit carefully at all levels, as unsatisfactory performance is not sufficient reason to
dismiss a worker. Dismissal for misconduct can occur only after issuing three warnings, spaced
three months apart. More culturally acceptable ways of dismissing a worker include negotiating,
facilitating a face-saving exit or paying a lump sum. As a preventative step, firms can engage employees
on pre-agreed one to three month contracts.3
Remuneration packages usually have several components, a basic wage (gaji pokok) and allowances
for transport, meals, attendance, and occasionally, productivity. Sometimes, married men with children
receive an additional sum. Annual bonuses equal to one month’s wages are paid either just before
Lebaran (the annual Islamic celebration) or Christmas, depending on the worker’s religion. Foreign
owned companies generally pay higher wages.4
3 The Department of Manpower, Depnaker, regulates employment practices in Indonesia, including conditions of employment
and labour-employer relations. Work contracts for groups and individual workers are common in Indonesia; the Depnaker
approves them, and typically they operate for one to three years.
4 Worker insurance is very underdeveloped; Jamsostek, the government backed insurance scheme, only nominally protects
workers for accidents, health and old age pensions. Premiums add 7 to 11 per cent to total wage bills. As Jamsostek’s
compensation rarely covers medical or living expenses, the employer supplements the payment if an accident occurs
(Depnaker, 1997).
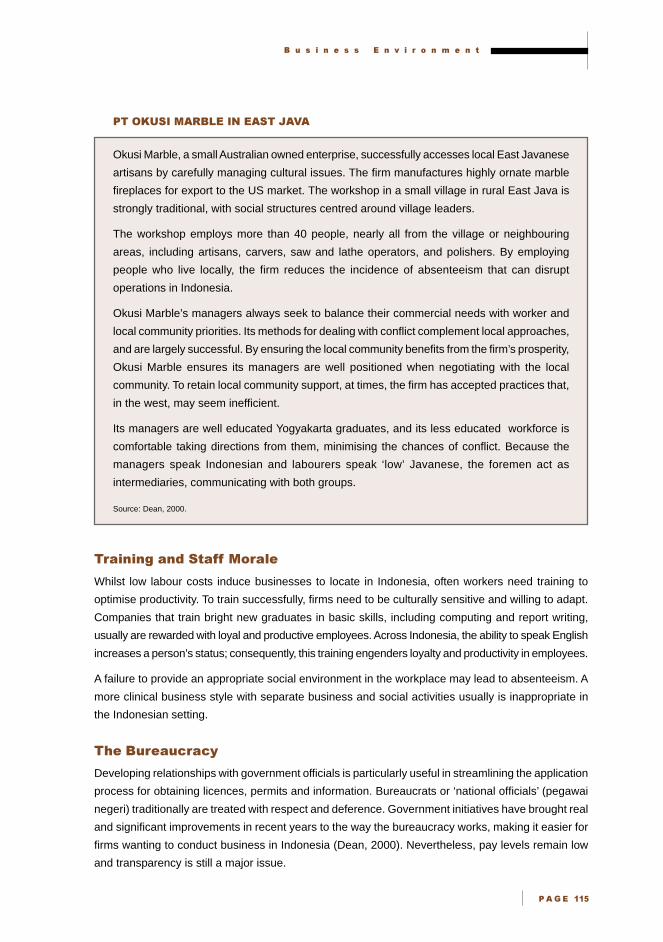
� � � � � � � � � � � � � � � � � �
�� ���#
����������� �����������
Okusi Marble, a small Australian owned enterprise, successfully accesses local East Javanese
artisans by carefully managing cultural issues. The firm manufactures highly ornate marble
fireplaces for export to the US market. The workshop in a small village in rural East Java is
strongly traditional, with social structures centred around village leaders.
The workshop employs more than 40 people, nearly all from the village or neighbouring
areas, including artisans, carvers, saw and lathe operators, and polishers. By employing
people who live locally, the firm reduces the incidence of absenteeism that can disrupt
operations in Indonesia.
Okusi Marble’s managers always seek to balance their commercial needs with worker and
local community priorities. Its methods for dealing with conflict complement local approaches,
and are largely successful. By ensuring the local community benefits from the firm’s prosperity,
Okusi Marble ensures its managers are well positioned when negotiating with the local
community. To retain local community support, at times, the firm has accepted practices that,
in the west, may seem inefficient.
Its managers are well educated Yogyakarta graduates, and its less educated workforce is
comfortable taking directions from them, minimising the chances of conflict. Because the
managers speak Indonesian and labourers speak ‘low’ Javanese, the foremen act as
intermediaries, communicating with both groups.
Source: Dean, 2000.
������������������#�����
Whilst low labour costs induce businesses to locate in Indonesia, often workers need training to
optimise productivity. To train successfully, firms need to be culturally sensitive and willing to adapt.
Companies that train bright new graduates in basic skills, including computing and report writing,
usually are rewarded with loyal and productive employees. Across Indonesia, the ability to speak English
increases a person’s status; consequently, this training engenders loyalty and productivity in employees.
A failure to provide an appropriate social environment in the workplace may lead to absenteeism. A
more clinical business style with separate business and social activities usually is inappropriate in
the Indonesian setting.
� ������������"
Developing relationships with government officials is particularly useful in streamlining the application
process for obtaining licences, permits and information. Bureaucrats or ‘national officials’ (pegawai
negeri) traditionally are treated with respect and deference. Government initiatives have brought real
and significant improvements in recent years to the way the bureaucracy works, making it easier for
firms wanting to conduct business in Indonesia (Dean, 2000). Nevertheless, pay levels remain low
and transparency is still a major issue.
� � � � � � � � � � � � � � � � � � � � � � � � �
�� ���
�%���� ����'��&����#��
Recent government initiatives have streamlined the regulatory environment for western firms, through
relaxing laws governing foreign company structures and simplifying the processes for forming a
company. Despite these initiatives, traditional notaries are vital in legal and regulatory matters,
especially in drafting contracts. Business contracts should be seen in their broader cultural significance,
and are more likely to be adhered to where key relationships are maintained.
�����"����
Indonesia’s new bankruptcy, capital market and company laws now are based on international best
practice, but the Government is aware implementation needs to be improved. In several instances,
courts failed to prosecute prominent figures of the New Order regime, often on technical grounds.
(Straits Times, 6 April 2000; and Straits Times, 12 April 2000). Hence the Government’s new initiatives
include appointing ad hoc judges to commercial courts to improve the operation of the legal system.
(See Chapter 8 - Corporate Restructuring.) Together, these initiatives aim to provide greater certainty
to creditors and investors across the Indonesian corporate sector.
����������������
Hiring a notary, or local legal expert, is the most efficient way of navigating the Indonesian legal and
regulatory system. These government registered legal officers play an important role in commercial
dealings in Indonesia; companies should invest in building a relationship with a reputable notary.
Apart from understanding the law, notaries have extensive networks of contacts and high social
standing; they can expedite many bureaucratic processes. Notaries can obtain investment approvals,
incorporate a company, and secure licences and permits to operate a company. While most of this
paperwork does not legally require a notary, often one person can more conveniently handle all
these matters. A contract drawn up and co-signed by a notary carries more legitimacy than one
drawn up by a non-notary. Elaborate signing ceremonies have important symbolic value and increase
the contract’s prestige and legitimacy.
However, many notaries are unfamiliar with processes relevant to foreign investors, and their
knowledge and fee structures vary considerably. Provincial offices of the Investment Coordinating
Board, BKPM, can suggest notaries experienced in foreign investment, although their rates often are
higher than those of other notaries. Indonesian based business consultants normally use their own
experienced notaries.
�����������������
Contracts have a very important place in Indonesian business, although their role may differ from
western practice. Individuals are unlikely to breach contracts reached through consensus with a
group of distinguished peers. Compared with their foreign counterparts, many Indonesian contracts
� � � � � � � � � � � � � � � � � �
�� ���$
are less detailed and the negotiations are more likely to influence their meaning. While contracts
often outline specific details, including obligations and dates, Indonesians commonly assume contracts
will be subject to ongoing negotiation and interpretation, if circumstances change.
To honour contractual obligations, firms cannot simply rely on a signed document. They also must
maintain relationships at many different layers of business, government and the community. To secure
binding business agreements, social pressure is more important than legal documents.
Contracts generally are in Indonesian, except where large Indonesian corporations are involved;
here English often is used. Firms should obtain more than one English translation.
$�������������������������
Recent legislation allows 100 per cent foreign owned companies to operate in most sectors. In many
cases, however, foreign investors may seek joint venture partners to complement their skills and
resources. (See Chapter 3 - Foreign Investment.) The foreigner’s depth of knowledge of the local
business environment should influence the level of local cooperation sought. Local partners generally
have knowledge of the Indonesian economy and society. However, those already familiar with the
local business environment often choose outright foreign ownership. The need to access local
distribution channels, and business and bureaucratic contacts also will influence a decision to enter
a joint venture.
In some instances, businesses opt for long term, performance based contractual arrangements with
Indonesian companies rather than joint ventures. Fully owned structures allow complete control by
the foreign entity, and remove the potential for disagreement inherent in joint ventures and partnerships.
In many joint ventures, Indonesian partners with local expertise exercise on-the-ground control,
although the Australian partner maintains an important presence. Joint ventures require careful
research, as mistakes can be costly and withdrawal difficult. However, well chosen joint venture
partners should provide access to local expertise and cultural knowledge, distribution networks and
links to the corporate sector and bureaucracy. When seeking a joint venture partner, Australian
companies should seek Indonesian partners with a similar company structure and culture, although
these may not be common. Major differences in perceptions and expectations amongst foreign and
local partners are common, with disagreement over the organisation and management of the joint
venture most problematic (Dean, 1999).
������������������"
Recent reforms streamline procedures for foreign firms establishing operations.5 Investors must submit
a brief business plan and outline the proposed structure of the company to the provincial office of the
BKPM; approval takes at least ten working days.6 However, a good relationship between the investor
and the relevant bureaucrat helps reduce processing time. Local officers undertaking the preliminary
5 See Presidential Decrees KP 96/1998 and KP 99/1998.
6 The firm then receives a letter of agreement (surat percetujuan).
� � � � � � � � � � � � � � � � � � � � � � � � �
�� ���%
work may request a very small processing fee. Once the company structure is approved, the investor
must apply for licences from local authorities, a process often fraught with bureaucratic chicken and
egg situations. For example, before obtaining company articles of association with the central office
of the Law Department in Jakarta, a firm must provide documentary evidence that it has deposited
share capital in its bank account. However, to open a company bank account, a firm must produce
registered articles of association. Depending on the quality of the relationship between the investor
and BKPM officials, the latter can assist in these processes.
�#! �������
Understanding Indonesian culture and applying it to management and negotiating situations can
generate substantial commercial and personal benefits for foreign businesses operating in Indonesia.
Given the time required to establish relationships and networks, business people should plan for
longer horizons to achieve returns. Also, with the rapid economic and political change currently
underway, firms must remain responsive to the evolving business culture.

� � � � � � � � � � � � � � � � � �
�� ���&
�$���
Dean, G., 2000, ‘Report to the East Asia Analytical Unit on the Indonesian Business Environment’,
July, Jakarta.
___ 1999, ‘Joint Venture or 100 per cent Foreign-Owned?’, OzIndo, Vol. 5, No. 1, www.okusi.net/
garydean/works/jv.html, accessed on 16 May 2000.
Depnaker, 1997, Government Publication on Business Environment, Jakarta.
KP 96/1998 (Presidential Decree 96/1998), 1998, concerning Business Sectors Closed for Investment,
2 July, Jakarta.
KP 99/1998 (Presidential Decree 99/1998), 1998, concerning Business Sectors Reserved for Small
Business and Sectors Open for Medium or Large Businesses on Condition of Partnership,
14 July, Jakarta.

� � � � � � � � � � � � � � � � � � � � � � � � �
�� ���'
� � � � � � � �
�� ����
������������������ � ��������������
��������
• The new banking sector has fewer banks, more stringent capitalisation
requirements and tighter bank supervision, especially of lending
practices. These changes, based on international best practice,
should provide firm foundations for the future.
• The Government’s determination to repair and reform Indonesia’s
financial sector and ensure the economic recovery continues is
generating opportunities for foreign financial institutions and
service suppliers.
• These opportunities stem from the Government’s sale of restructured
loans, and bank and corporate assets it currently holds, as well as
the relaxation of foreign investment laws in the financial sector.
• Performance of the newly recapitalised private sector banks improved
over 2000, and they resumed modest credit expansion.
• However, the banks’ non-performing loan levels remain high at
30 per cent, and the slow pace and in some cases, shallow nature of
corporate restructuring is slowing a return to health. State banks,
which hold the majority of the bank deposits, should be recapitalised
by the end of 2000, but they have the highest share of non-
performing loans and concerns exist regarding the extent of
their managerial restructuring.

� � � � � � � � � � � � � � � � � � � � � � � � �
�� ����
The Government recognises repair and reform of Indonesia’s financial sector is key to restoring
sustainable economic growth, and drives the significant changes occurring in this sector. The
Government has announced it will use the reform process to re-position Indonesia’s financial sector
in line with international best practice, adopting substantial measures to reduce and limit exposure to
risk, introduce international capital adequacy ratio, CAR, standards, sell assets to the private sector
and increase sector-wide supervision using an independent agency.1 As these reforms are
implemented, the financial sector should become more transparent, open and regulated. However,
in the short term, the Government is balancing national concerns about employment and maximising
returns on assets with these longer term objectives.
By late 2000, the Government’s major program of restructuring and refinancing the banking system
was essentially complete, and in 2000, some banks were starting to extend new loans. Bank Indonesia
reported new bank lending in June and July 2000 reached 6 per cent of bank assets, although this
also included restructured loans (World Bank, 2000a). However, this refinancing program was
expensive, costing at least 75 per cent of GDP.
Central to restoring banking sector efficiency is the Government’s return of nationalised bank assets
to efficient private ownership. Australia’s financial institutions and dynamic financial sector are well
placed to access these opportunities and provide support for associated reforms. This chapter
describes the impact of the crisis on the financial sector, and details the Government’s response. It
outlines the opportunities for foreign direct investment in Indonesia’s financial sector and exports of
financial services to Indonesia.
�����������������
The Asian financial crisis much more severely affected the Indonesian banking sector, and through it,
the corporate sector, than occurred elsewhere in the region. Inadequately monitored deregulation
intensified the banking sector’s vulnerability to crisis and the crisis’ effects on the sector.
����������������� ����!� ��"
The rapid growth of undercapitalised banks and their lack of supervision made the Indonesian banking
sector highly vulnerable to the crisis. As the financial sector was deregulated in the 1980s, bank
numbers more than doubled from 111 in 1988 to 240 in 1994. Large conglomerates founded many
banks to serve their own commercial funding requirements and often to lend to related parties. Where
lending was at arm’s length, collateral values rather than credit and cash flow analysis determined
loan suitability. Expectations of persistent strong economic growth and ever increasing asset prices
encouraged and disguised risky lending practices. Finally, many banks undertook significant unhedged,
short term foreign currency liabilities.
As in many other regional economies in the 1990s, and Australia in the 1980s, bank deregulation
inadvertently weakened banking system prudential controls. For example, when regulators removed
controls on banks’ foreign borrowing and asset allocations, some banks did not increase their own
risk management strategies, exposing themselves to risky foreign borrowing and domestic lending.
Regulations allowed banks to minimise reporting of under-performing loans in their portfolios through
1 Capital adequacy ratio is the ratio of bank equity to total bank assets, weighted by assets’ level of risk.
� � � � � � � � � � � � � � � � � � � � � � � � � � � !
�� ���"
various practices, including reclassifying loans as performing after only one payment (International
Monetary Fund, 2000a). Banks made limited provisions against non-performing loans and were
significantly undercapitalised, increasing their vulnerability to a deterioration in loan quality.
�#$��������%���������� �������
The Asian financial crisis quickly exposed these financial sector weaknesses. By early 1998, the
rupiah’s 70 per cent depreciation had damaged most banks’ balance sheets. Firstly, it increased
dramatically the domestic value of banks’ own unhedged foreign currency borrowing. Secondly, the
corporate sector’s over-exposure to short term foreign currency debt impaired its ability to service
domestic loans, causing non-performing loans to escalate. This reduced further banks’ CARs, in
many cases to negative values. Thirdly, throughout early 1998, as Bank Indonesia lifted interest
rates on deposits in response to the depreciating exchange rate, bank revenue flows fell as banks
could not pass higher rates on to distressed corporate borrowers. During most of 1998, this resulted
in negative interest rate spreads, reducing banks’ net income and damaging their capital adequacy.
������������������
Initially, the Government responded to the crisis with an ‘emergency’ program to guarantee bank
deposits and quickly repair the banking system using public funds to recapitalise it. The Government’s
longer term, ongoing response is to restructure non-performing loans in the banking sector, return
the nationalised banks and associated assets to the private sector, and thoroughly overhaul the
regulations governing the financial system.
������ ���&$��&�
In January 1998, the Government announced its immediate priorities were to:
• restore confidence in the financial system by guaranteeing deposits2
• consolidate the banking industry by liquidating insolvent banks which failed to meet minimum
CAR and non-performing loan standards
• recapitalise banks with weak CARs, but which met minimum capital adequacy levels.
To implement the first objective, Bank Indonesia allocated large amounts of liquidity support to banks
facing runs on their deposits. To achieve the remaining objectives, the Government established the
Indonesian Bank Restructuring Authority, IBRA, under a January 1998 presidential decree.
2 In an attempt to boost depositor confidence and demonstrate a commitment to reform, the Government liquidated
16 insolvent private domestic banks in November 1997. However, the announcement of bank closures intensified runs on
private domestic banks, threatening a collapse of the banking system in early 1998. Bank Indonesia responded with liquidity
support to the affected banks, and in January 1998, the Government announced a blanket guarantee for all depositors and
creditors of domestically incorporated banks. Presidential Decree No. 26 stipulated the Government Guarantee for
Commercial Bank Liabilities, pledging all payments related to the liabilities of commercial banks would be covered, including
inter-bank transactions and trade finance (Indonesian Bank Restructuring Agency, 2000).
� � � � � � � � � � � � � � � � � � � � � � � � �
�� ���#
&��! �&%��������
On behalf of the Government, IBRA oversees financial sector rehabilitation. Its role is to:
• assess the adequacy of bank capital, and restructure viable banks through merger andrecapitalisation, starting with private banks then state banks
• close non-viable banks and take over their assets; these functions were delegated to the BankRestructuring Unit, BRU
• manage and sell corporate assets received as collateral for Bank Indonesia liquidity support; thisfunction was delegated to IBRA’s Asset Management Unit, Investments, AMI, with asset salesundertaken by the Asset Disposal Unit, ADU
• transfer non-performing loans from banks’ balance sheets to its Asset Management Unit, Credits,
AMC, to manage and maximise recovery of these loans.
��&��������������'��������&
During 1998, IBRA employed international accounting firms to assess the capital adequacy of all
private banks. Then banks were classified as:
• category A, with CAR above 4 per cent, which were deemed healthy and not needingrecapitalisation
• category B, with CAR between 4 and –25 per cent, which the Government decided to recapitaliseproviding they could demonstrate sound management and future viability; those unable to do sowere liquidated
• category C, with CAR below –25 per cent, which were liquidated immediately.
IBRA classified 74 banks as category A banks, mainly small foreign joint ventures, holding
only 5 per cent of total deposits. Of the 36 banks classified as category B, 21 subsequently failed
to meet the IBRA’s sound management criteria and were liquidated; IBRA took over a further seven
banks; and the Government and their private owners identified a further eight for merger and
recapitalisation. Seventeen banks, accounting for 0.9 per cent of total banking assets, fell into
category C, and were liquidated immediately; their assets were transferred to IBRA in March 1999
(East Asia Analytical Unit, 1999).
��$��� ��(�)���"������&���(����*$��+��#��������&
The Government continues to determine whether a bank will come under IBRA supervision by using
the minimum 4 per cent CAR. By the end of 2000, all Indonesian banks will be subject to this
requirement. If a bank’s CAR falls below 2 per cent, it will be transferred to IBRA. By the end of 2001,
bank CARs must reach 8 per cent and non-performing loans must fall below 5 per cent. This
requirement could continue to restrain banks’ willingness to lend in 2001.
In March 2000, Bank Indonesia also required banks with non-performing loans exceeding 35 per cent
of their outstanding loans to be placed under IBRA surveillance. In late 2000, average non-performing
loan levels were 30 per cent of bank assets (Figure 7.1). If a bank’s non-performing loan level exceeds
35 per cent, IBRA will monitor the bank for three to six months. By the end of 2001, bank non-
performing loans must fall below 5 per cent.

� � � � � � � � � � � � � � � � � � � � � � � � � � � !
�� ���$
��+�������������&
Bank refinancing has been very costly; the Government has issued about Rp. 650 trillion (US$75 billion)
of sovereign bonds, equal to about 76 per cent of 1999 GDP.3 Around Rp. 268 trillion (US$31 billion)
of these went to refinance state banks, and this program requires a further Rp. 18 trillion by the end
of 2000 to complete it. IBRA also issued sovereign bonds worth Rp. 158 trillion (US$18.3 billion) to
refinance 11 category B private banks and 12 regional development banks to raise their CARs to
4 per cent.4 Before receiving capital injections, banks must receive IBRA acceptance for their business
plans and sign a performance contract.
������������������ ��
The Asian financial crisis has profoundly affected the Indonesian banking sector, reducing
the number of banks from 237 to 161 (Table 7.1). Government control of around 70 per cent
of banking system deposits in Indonesia compares with 40 per cent in the Republic of Korea.
Four state banks, Mandiri, BNI, BRI and BTN represent 50 per cent of banking system assets.
In addition, through recapitalisation, the Government holds significant shares in private banks.
Despite banks transferring Rp. 256 trillion (US$30 billion) of non-performing loans to IBRA,
non-performing loans still represent 30 per cent of bank assets (Figure 7.1). However, banks
have provisioned for 94 per cent of these (World Bank, 2000a).
In 2000, banks were beginning to lend again, and some were even starting to show profits.
A June 2000 Bank Indonesia survey of 15 banks representing 75 per cent of total deposits
showed these banks had extended Rp. 15.8 trillion (US$1.8 billion) new loans since the
beginning of 2000, representing 5.7 per cent year to year growth. However, as this included
restructured loans, the extent of new lending is unclear (World Bank, 2000a).
��&���������������������&
The Government anticipates state banks, which account for over 70 per cent of bank deposits, will be
recapitalised by late 2000. State banks also have the highest share of banking system non-performing
loans, reflecting weak credit analysis, risk management and accounting practices. Ongoing efforts
have yet to produce adequate operational restructuring, including cutting staff and branch numbers
or strengthening senior management teams. IBRA merged into Bank Mandiri, four state banks under
its initial surveillance; this alone required Rp. 178 trillion (US$20.5 billion) in recapitalisation.
Recapitalisation of the other state banks, including BRI, BNI and BTN followed.5 These banks’ non-
performing loans were transferred to IBRA’s AMC.
3 Around Rp. 220 trillion (US$25 billion) of this was used to cover Bank Indonesia liquidity to the banking system
(World Bank, 2000b).
4 The Government also issued Rp. 218 trillion (US$25 billion) in bonds to honour its guarantee of bank deposits, including
reimbursing Bank Indonesia for the liquidity support it issued to banks at the height of the crisis (World Bank, 2000b).
To refinance undercapitalised private banks, IBRA issued banks with government bonds in return for government equity in
these banks and a proportion of their non-performing loans; these were transferred to IBRA.
5 In April 1998, IBRA merged eight nationalised banks into Bank Danamon, which had a CAR of 32.5 per cent.

� � � � � � � � � � � � � � � � � � � � � � � � �
�� ���%
T a b l e 7 . 1
��� ������������������ ����������� ������������� �
Structure of Indonesian Banking System, 1997 and 2000
Number of banks Share of depositsJune 1997 June 2000 June 1997 June 2000
State owned 34 43a
37 70
Private 160 79 57 18
Foreign and joint venture 43 39 6 12
Total 237 161 100 100
Note: a Of the 43 state owned banks in mid 2000, four were state owned before the crisis, 12 were nationalised recently, 26 were ruraldevelopment banks and one was the export import bank.
Source: World Bank, 2000a.
F i g u r e 7 . 1
Non-performing Loan Levels Falling, but Still High
Banking System Assets, Rp. trillion
Source: World Bank, 2000a.
0
100
200
300
400
500
600Loans transferred to IBRA
Non-performing loans
Reportedly performing loans
Jun-00Dec-99199819971996
Rp.
Tril
lions

� � � � � � � � � � � � � � � � � � � � � � � � � � � !
�� ���
����,����������
Now bank sector restructuring is nearly complete, IBRA’s priority is to sell its large stock of assets to
the private sector to return them to productive use and reduce government debt accumulated through
bank recapitalisation. However, IBRA does not intend to sell assets unless it receives what it regards
as a fair price, and the sale does not threaten employment and output in the economy. Consequently,
the Government has delayed asset sales. If IBRA asset sales resume in 2001 as announced, they
should generate significant opportunities for foreign financial institutions and service providers.
���$���+�������&&��&
IBRA’s assets have a face value of Rp. 564 trillion (US$65 billion).6 This includes loan portfolios
transferred as part of bank restructuring (categories 1 to 4), non-performing loans (category 5), and
equity in recapitalised banks and corporate assets, including banks, pledged as collateral for liquidity
support (Table 7.2). Compiling, valuing and transferring these assets, with international accounting
firm assistance, involved considerable effort and took IBRA until 2000 to complete.
IBRA recently enhanced its control over these assets by establishing compliance teams to monitor
individual enterprises and identify specific problems. It also replaced the management of several
enterprises under its control to maximise their sale value.
T a b l e 7 . 2
������������� ���������� ����� �����
IBRA Assets by Category, October 2000
Asset Value Value
(Rp. trillion) (US$ billion)
Category 1 to 4 loans transferred from frozen banksa
40 4.6
Category 5, non-performing loans transferred from
recapitalised, state owned, taken over and frozen banksb
258 29.7
Indonesian government investment in recapitalised
and taken over banks 139 16.5
Assets from shareholder loan settlements for Bank
Indonesia liquidity credits 127 14.6
Total 564 65.0
Note: a IBRA categorises loans into five groups. Category 1 to 4 loans range from normal to special notice, but essentially currentlyperform, using the five-tier international criteria.
b Category 5 loans are non-performing, having interest and capital outstanding for more than six months.
Source: World Bank, 2000a.
6 Asset sales so far suggest the real value is significantly lower.
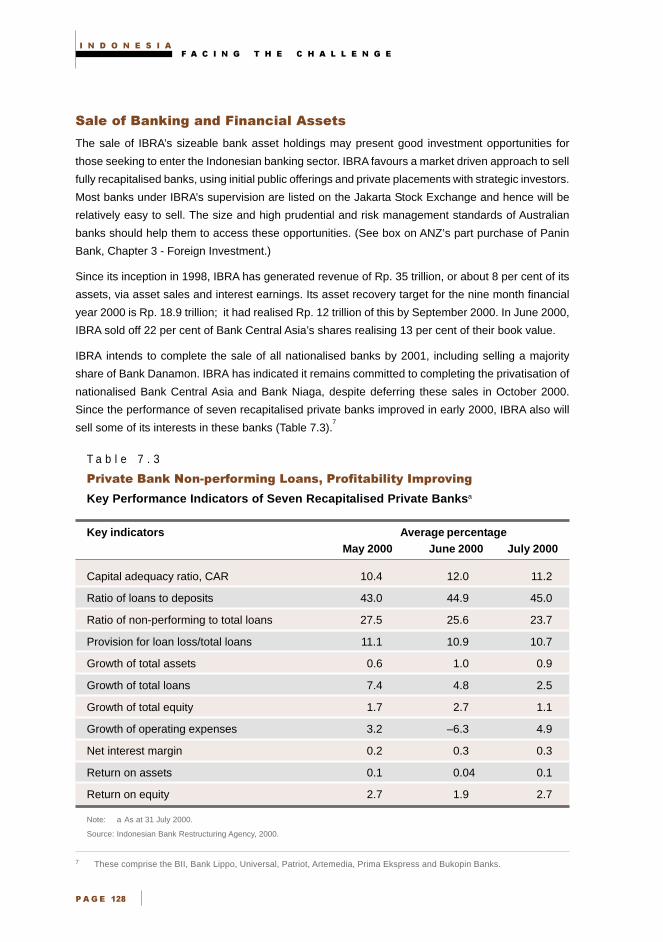
� � � � � � � � � � � � � � � � � � � � � � � � �
�� ���&
�� ���+�����������(��������� ��&&��&
The sale of IBRA’s sizeable bank asset holdings may present good investment opportunities for
those seeking to enter the Indonesian banking sector. IBRA favours a market driven approach to sell
fully recapitalised banks, using initial public offerings and private placements with strategic investors.
Most banks under IBRA’s supervision are listed on the Jakarta Stock Exchange and hence will be
relatively easy to sell. The size and high prudential and risk management standards of Australian
banks should help them to access these opportunities. (See box on ANZ’s part purchase of Panin
Bank, Chapter 3 - Foreign Investment.)
Since its inception in 1998, IBRA has generated revenue of Rp. 35 trillion, or about 8 per cent of its
assets, via asset sales and interest earnings. Its asset recovery target for the nine month financial
year 2000 is Rp. 18.9 trillion; it had realised Rp. 12 trillion of this by September 2000. In June 2000,
IBRA sold off 22 per cent of Bank Central Asia’s shares realising 13 per cent of their book value.
IBRA intends to complete the sale of all nationalised banks by 2001, including selling a majority
share of Bank Danamon. IBRA has indicated it remains committed to completing the privatisation of
nationalised Bank Central Asia and Bank Niaga, despite deferring these sales in October 2000.
Since the performance of seven recapitalised private banks improved in early 2000, IBRA also will
sell some of its interests in these banks (Table 7.3).7
T a b l e 7 . 3
��� �� ���������!" �#�������$����%����#���&��������"�� ���
Key Performance Indicators of Seven Recapitalised Private Banksa
Key indicators Average percentageMay 2000 June 2000 July 2000
Capital adequacy ratio, CAR 10.4 12.0 11.2
Ratio of loans to deposits 43.0 44.9 45.0
Ratio of non-performing to total loans 27.5 25.6 23.7
Provision for loan loss/total loans 11.1 10.9 10.7
Growth of total assets 0.6 1.0 0.9
Growth of total loans 7.4 4.8 2.5
Growth of total equity 1.7 2.7 1.1
Growth of operating expenses 3.2 –6.3 4.9
Net interest margin 0.2 0.3 0.3
Return on assets 0.1 0.04 0.1
Return on equity 2.7 1.9 2.7
Note: a As at 31 July 2000.
Source: Indonesian Bank Restructuring Agency, 2000.
7 These comprise the BII, Bank Lippo, Universal, Patriot, Artemedia, Prima Ekspress and Bukopin Banks.

� � � � � � � � � � � � � � � � � � � � � � � � � � � !
�� ���'
���������$��� �&���������(&
Bank recapitalisation bonds now are on sale on the secondary market, clearing the way for banks to
reduce their bond holdings as opportunities arise to increase lending. The coupon rate on these
bonds ranges from 12 to 14 per cent, providing reasonable returns for potential foreign investors.
However, the current thin trading in recapitalisation bonds reflects bank reluctance to sell interest
bearing assets, given limited opportunities to lend to viable firms.
����������� � ����
Another IBRA priority is to negotiate restructuring and repayment of over Rp. 298 trillion (US$33 billion)
in debts transferred to it as part of bank restructuring. While IBRA has sought to restructure large
loans itself, it sells most smaller loans to the private market.8 The sale of loans may provide opportunities
for Australian business experienced in debt restructuring (International Monetary Fund, 2000b).
The Government’s AMC aims to collect Rp. 10.3 trillion (US$1.2 billion) in fiscal year 2000, mostly
from selling restructured loans (Indonesian Bank Restructuring Agency, 2000).9 (See Chapter 8 - Corporate
Restructuring for IBRA’s progress in this area.)
�������� �+�����������&�����
As the restructuring of non-performing loans advances, banks increasingly could use securitisation
of their under-performing loan portfolio to improve their capital adequacy ratios. Australia possesses
significant expertise in asset securitisation, and is well placed to assist with this emerging business.
���������������������������������
The Government has indicated it aims to establish a sound and resilient financial sector to increase
the long term growth potential of the Indonesian economy and safeguard against future financial
shocks. It has implemented substantial financial sector reforms since the crisis, including improving
prudential supervision, financial reporting and relevant commercial laws. Australia also can
assist in the ongoing process of strengthening Indonesia’s financial system, and access
commercial opportunities.
�� ������� ��������
The Government is upgrading its prudential regulatory and supervisory framework in response to the
crisis. To achieve this, it has relied on a mix of self regulation, to tighten loan classifications, reporting
requirements and capital adequacy standards, and direct prudential supervision to deter high risk
lending practices.
8 The AMC loan portfolio crosses a range of industries, including primary industry (41 per cent), trading and distribution
(11 per cent), building and construction (9 per cent) and real estate and finance (8 per cent each).
9 The remainder comes from payment of interest on debts to IBRA.

� � � � � � � � � � � � � � � � � � � � � � � � �
�� ��"(
��$��� ��(�)���"
Ensuring capital adequacy is crucial to protect depositors and other creditors from excessive risk
taking. To assist bank rehabilitation and promote lending, the Government temporarily lowered minimum
bank CARs to 4 per cent during the crisis, but banks must reach the minimum internationally acceptable
CAR of 8 per cent by the end of 2001.
������ �&&�+����������(����'�&������
Bank Indonesia now requires banks to adopt more stringent loan classifications, more closely in line
with internationally accepted practice. Banks must classify loans into four categories: normal, special
mention, doubtful and loss (East Asia Analytical Unit, 1999).10
�������$��'�&���
Bank Indonesia already has strengthened bank supervision and plans further improvements. It now
conducts annual on-site inspections of all banks. Further, all banks must employ a compliance director
to ensure daily compliance with prudential regulations. Bank Indonesia has established a permanent
supervisory presence at all banks and is monitoring, on a quarterly basis, all banks’ progress against
their business plans, including ensuring they will achieve 8 per cent capital adequacy by the end of
2001. If a bank cannot comply, Bank Indonesia will take prompt corrective action in accordance with
recently enacted criteria (International Monetary Fund, 2000d).
The Government also introduced laws establishing a new independent bank supervisor, the Financial
Supervisory Agency, to supervise banks from the end of 2002. As well as banks, the Financial
Supervisory Agency will supervise insurance companies, pension funds and other non-bank financial
institutions (East Asia Analytical Unit, 1999).
The Government also established a special unit monitoring state owned banks within the Ministry of
Finance. It will conduct quarterly reviews of banks’ compliance with their performance contracts,
including business plans, and monitor closely data on financial activities, including credit and loan
restructuring activities. It will tender publicly annual audits of state owned banks to international firms
(International Monetary Fund, 2000c).
-$�&������#��&
Limiting financial institutions’ exposure to foreign and related party transactions is critical to prevent
another crisis like the 1997 crisis. Authorities are keen to discourage widespread, short term, unhedged
foreign currency exposures. Since March 2000, all banks have had to report foreign exchange
transactions exceeding US$10 000 to Bank Indonesia, and detail the financial relationship between
sender and receiver. Regulations controlling related party lending accord with best practice. Bank
Indonesia also is working to increase its supervision capacity.
10 IBRA uses a five-tier classification but Bank Indonesia uses a four-tier system. Special mention loans are overdue from 1 to
90 days, requiring provision of 5 per cent; doubtful loans are overdue more than 180 days, requiring provision of 50 per cent;
and loss loans are overdue more than 270 days, requiring 100 per cent provision.
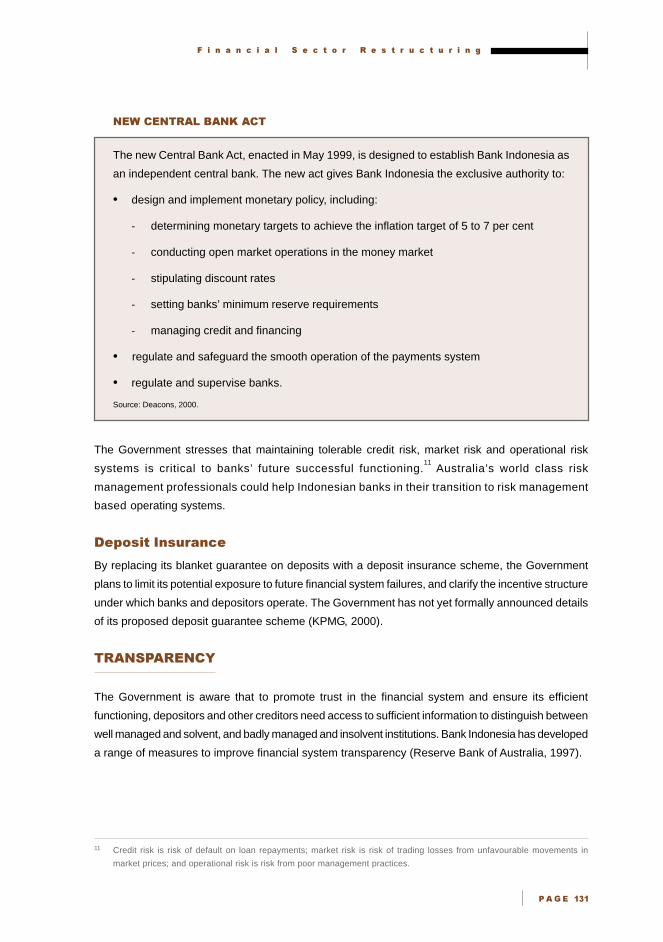
� � � � � � � � � � � � � � � � � � � � � � � � � � � !
�� ��"�
������� �����������
The new Central Bank Act, enacted in May 1999, is designed to establish Bank Indonesia as
an independent central bank. The new act gives Bank Indonesia the exclusive authority to:
• design and implement monetary policy, including:
- determining monetary targets to achieve the inflation target of 5 to 7 per cent
- conducting open market operations in the money market
- stipulating discount rates
- setting banks’ minimum reserve requirements
- managing credit and financing
• regulate and safeguard the smooth operation of the payments system
• regulate and supervise banks.
Source: Deacons, 2000.
The Government stresses that maintaining tolerable credit risk, market risk and operational risk
systems is critical to banks’ future successful functioning.11
Australia’s world class risk
management professionals could help Indonesian banks in their transition to risk management
based operating systems.
��$�&�����&������
By replacing its blanket guarantee on deposits with a deposit insurance scheme, the Government
plans to limit its potential exposure to future financial system failures, and clarify the incentive structure
under which banks and depositors operate. The Government has not yet formally announced details
of its proposed deposit guarantee scheme (KPMG, 2000).
���������.
The Government is aware that to promote trust in the financial system and ensure its efficient
functioning, depositors and other creditors need access to sufficient information to distinguish between
well managed and solvent, and badly managed and insolvent institutions. Bank Indonesia has developed
a range of measures to improve financial system transparency (Reserve Bank of Australia, 1997).
11 Credit risk is risk of default on loan repayments; market risk is risk of trading losses from unfavourable movements in
market prices; and operational risk is risk from poor management practices.
� � � � � � � � � � � � � � � � � � � � � � � � �
�� ��"�
Since April 1999, banks must publish quarterly financial statements. They also report fortnightly on
their consolidated global operations, outlining their domestic and foreign currency liquidity profile and
any need to cover potential liquidity shortages (International Monetary Fund, 2000d). Bank Indonesia
also introduced significant penalties for non-compliance.12
����������/������
Well functioning capital markets compete with the banking sector as a source of investment funding,
encouraging banks to operate more efficiently and prudently. Significant regulatory reform of Indonesian
capital markets is underway, although increasing the depth of these markets will be gradual.
������������
Since late 1997, the Government has augmented the power of Bapepam, the capital market supervisory
agency, to encourage broader participation in the share market through strengthening minority
shareholder rights and attracting institutional investors to the market. A new code of conduct, as well
as more staff, should help to enforce these new laws. Bapepam also intends to improve coordination
with other capital market players, including the Indonesian stock exchanges (Bapepam, 2000a).
To improve corporate sector risk management, both the Jakarta and Surabaya Stock Exchanges
offer options and futures products. This should increase corporate participation in the equity market
(Bapepam, 2000b).
Technology upgrades are improving Indonesia’s stock markets. The Jakarta Stock Exchange has
over 500 personal computers and a sophisticated computer facility enables remote trading for brokers.
These facilities, wide use of email and high quality corporate web pages suggest significant potential
for e-commerce business. Since June 2000, the Jakarta Stock Exchange has traded in Internet start
up companies, further boosting e-commerce. Australian e-business operators can help the Jakarta
Stock Exchange exploit these opportunities.
���(�������&
In 1995, the Government significantly improved the corporate bond market’s regulatory regime, bringing
it into line with international best practice. Bapepam is taking steps to better enforce these regulations.
Banks’ short term reluctance to lend to companies should encourage larger, more reputable corporates
to seek access to other forms of finance, including the domestic corporate bond market. In the
Republic of Korea and Thailand, the economic crisis promoted corporate bond market growth, as
larger, more reputable corporates have better credit ratings than most banks, still suffering from high
non-performing loans.
12 Australia’s legal and accounting professionals and banks have significant expertise in sound financial reporting, providing
them with opportunities to assist their Indonesian counterparts in implementing these requirements.

� � � � � � � � � � � � � � � � � � � � � � � � � � � !
�� ��""
However, without a deep secondary market and investor confidence, the bond market offers limited
competition to the banking sector. The development of a government bond market, as banks sell
their sovereign recapitalisation bonds, should support creation of a benchmark yield curve, assisting
corporate bond market development. In the medium to long term, corporate restructuring and ongoing
economic recovery should improve Indonesian corporates’ credit ratings, promoting local bond
market growth.
�#$��'�����%����"#���&��"&��#
An efficient payments system is important in restoring confidence in the Indonesian financial system.
Bank Indonesia plans to replace the current manual settlement system with a real time gross settlement
system by the end of 2000 (Deacons, 2000).13
Improvements in the payments system should encourage credit card market development. Only
4 per cent of Indonesians hold a payments card, well below the 20 per cent average for the Asia
Pacific region. As ANZ recognised, this could provide opportunities for Australian business to develop
the credit card market (Jakarta Post, 14 July 1999, p. 8).
�������
Indonesia’s financial system, particularly its banking system, was highly exposed in 1997-98, and
nearly collapsed as a result of bank runs. However, over the past three years, the Government has
succeeded in restructuring and refinancing a viable group of private banks. Government recognises
the main problems remain the slow pace of restructuring corporate non-performing loans and the
continuing problems in the state banking sector. Also, while Bank Indonesia has raised prudential
control standards, in many cases to international levels, in the short term, limits on human resources
and operational effectiveness may affect supervision.
In the medium term, as the Government implements more effectively new prudential standards, and
completes bank and corporate asset sales, significant commercial opportunities may emerge for
Australian financial institutions and service providers.
13 During the 1990s, most South East Asian economies moved to an electronic payments system to reduce systemic and
settlement risk. Bank Indonesia planned to move to a real time gross settlement, RTGS, system in 1997, but the Asian
financial crisis put this plan on hold.

� � � � � � � � � � � � � � � � � � � � � � � � �
�� ��"#
������
Bapepam, 2000a, Information supplied to East Asia Analytical Unit, Jakarta, October.
___ 2000b, Capital Market Blueprint, 2000-2004, www.bapepam.go.id, accessed on 16 May 2000.
Deacons, 2000, ‘Report to the East Asia Analytical Unit on Foreign Direct Investment in Indonesia’,
May, Sydney.
East Asia Analytical Unit, 1999, Asia’s Financial Markets: Capitalising on Reform, Department of
Foreign Affairs and Trade, Canberra.
Indonesian Bank Restructuring Agency, 2000, ‘Monthly Report, May, Jakarta.
International Monetary Fund, 2000a, Letter of Intent, January 2000.
___ 2000b, Letter of Intent, July 2000.
___ 2000c, Letter of Intent, September 2000.
___ 2000d, ‘Financial Sector Crisis and Restructuring: Lessons from Asia’, www.imf.org, accessed
on 17 April 2000.
KPMG, 2000, ‘Report to the East Asia Analytical Unit on Financial Sector Restructing’ Sydney, July.
Reserve Bank of Australia,1997, ‘The Changing Nature of Economic Crises’, RBA, Sydney.
World Bank, 2000a, Indonesia: Accelerating Recovery in Uncertain Times, World Bank, Washington DC.
___ 2000b, ‘World Bank Quarterly Update: Indonesia, 20 March 2000’, World Bank, Washington DC.

� � � � � � � �
� � ����
������������������������ �������������
��������
• Restructuring corporate sector debt is a priority for the Government
and a key component of its ten-point economic plan.
• A significant share of Indonesia’s corporate sector is estimated to
be insolvent, with debts of about US$120 billion. The Government
has improved the capacity of its main debt restructuring agencies,
IBRA and the Jakarta Initiative; by late 2000, the pace of debt
restructuring was accelerating.
• However, the Government remains concerned about the ability of
the legal system to implement properly new bankruptcy laws, and
has embarked on a program of legal reform; this program has started
to achieve success, but progress is slow.
• The Government is strengthening and upgrading its corporate
governance framework by strengthening enforcement of company
law, reducing entry barriers for new firms and selling restructured
assets; again, implementation will take time.
• These reforms eventually should create a more competitive and
efficient corporate sector that can sustain stronger economic growth.

� � � � � � � � � � � � � � � � � � � � � � � � �
� � ����
In late 2000, after a slow start, the pace of corporate debt restructuring is accelerating somewhat.
Some debtors and creditors have started to reach agreements under the Indonesian Bank
Restructuring Agency, IBRA, and the Jakarta Initiative Task Force, JITF. IBRA also has started winning
some important bankruptcy cases in the courts, increasing incentives for debtors to negotiate debt
restructuring. While taxation, regulatory and bankruptcy system weaknesses continue to impede
efforts to accelerate restructuring, the Government is attempting to address these problems.
Nevertheless, concerns exist about the depth of recent debt restructuring agreements, as superficial
workouts are likely to leave the corporate sector over leveraged and exposed to future default.
Government policy makers recognise they must ensure massive non-performing corporate debt is
restructured, as restoring corporate sector health is key to sustaining economic recovery in 2001 and
beyond. The Government acknowledges the weak legal system has impeded the progress of key
government initiatives, particularly IBRA and JITF. Hence, since the crisis, Indonesia has upgraded
significantly its bankruptcy system and corporate governance framework. Reducing barriers to entry
for new firms, selling government assets to foreign and domestic investors, and introducing anti-trust
legislation also will boost competition and corporate sector efficiency. Together, these reforms
eventually should create a business environment able to sustain strong economic growth and improve
Indonesia’s attractiveness as a destination for foreign business.
Restructuring non-performing corporate debt is important for many reasons. First, firms with non-
performing loans usually cannot borrow new funds or invest; this constrains economic growth. (See
Chapter 1 - Economic Developments.) Second, high levels of unrestructured debt and the expectation
much collateral will be sold makes assets less attractive to potential investors, and inhibits the
Government from selling assets it holds to reduce public debt. Finally, the banking system cannot
recover until corporate debts are restructured or written off (See Chapter 7 - Financial Sector
Restructuring.) Hence completion of corporate debt restructuring is essential for Indonesia’s recovery.
Improving macroeconomic conditions are likely to expedite negotiations on outstanding debts
(International Monetary Fund, 2000a). As the economy recovers, asset sales will be more feasible
and rewarding, and companies will need new loans to fund investment.
This chapter maps the scale of Indonesia’s corporate debt restructuring task, and assesses the
efficacy of recent efforts to accelerate corporate restructuring. It details the strengthening of Indonesia’s
corporate regulatory framework and analyses the economic reform program’s likely impact on corporate
performance. Finally, the chapter draws out the implications of these developments for Indonesia’s
economic prospects and opportunities for Australian business.
���������� ���� ��
In the aftermath of the crisis, analysts estimated a majority of Indonesia’s corporate sector was
technically insolvent. The sector still carries debts of about US$120 billion (World Bank, 2000). Large
corporates owe US$85 billion of this, and state enterprises and small firms owe the remainder
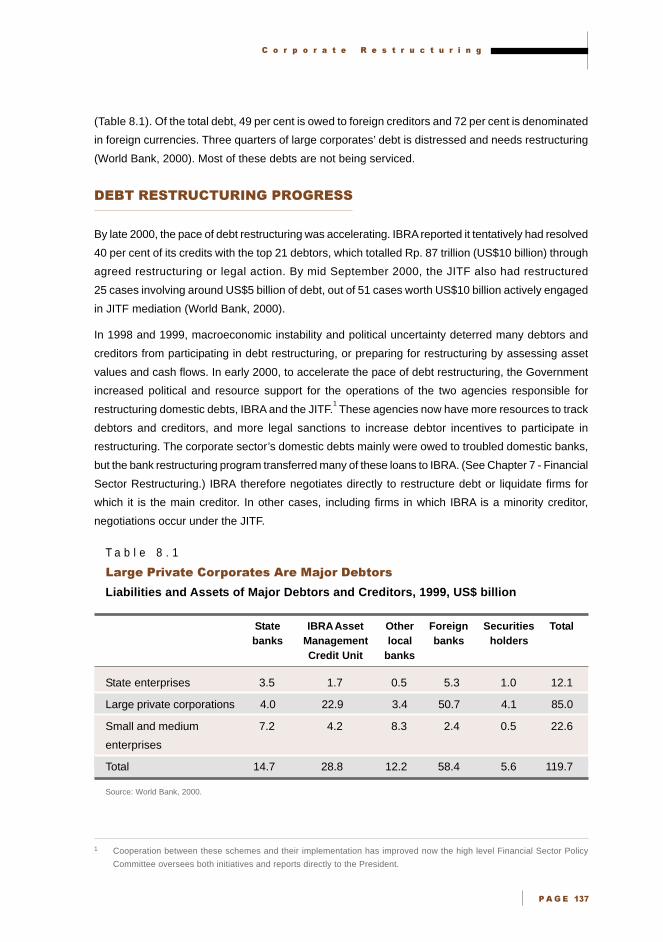
� � � � � � � � � � � � � � � � � � � � ! "
� � ���#
(Table 8.1). Of the total debt, 49 per cent is owed to foreign creditors and 72 per cent is denominated
in foreign currencies. Three quarters of large corporates’ debt is distressed and needs restructuring
(World Bank, 2000). Most of these debts are not being serviced.
�����������������������
By late 2000, the pace of debt restructuring was accelerating. IBRA reported it tentatively had resolved
40 per cent of its credits with the top 21 debtors, which totalled Rp. 87 trillion (US$10 billion) through
agreed restructuring or legal action. By mid September 2000, the JITF also had restructured
25 cases involving around US$5 billion of debt, out of 51 cases worth US$10 billion actively engaged
in JITF mediation (World Bank, 2000).
In 1998 and 1999, macroeconomic instability and political uncertainty deterred many debtors and
creditors from participating in debt restructuring, or preparing for restructuring by assessing asset
values and cash flows. In early 2000, to accelerate the pace of debt restructuring, the Government
increased political and resource support for the operations of the two agencies responsible for
restructuring domestic debts, IBRA and the JITF.1 These agencies now have more resources to track
debtors and creditors, and more legal sanctions to increase debtor incentives to participate in
restructuring. The corporate sector’s domestic debts mainly were owed to troubled domestic banks,
but the bank restructuring program transferred many of these loans to IBRA. (See Chapter 7 - Financial
Sector Restructuring.) IBRA therefore negotiates directly to restructure debt or liquidate firms for
which it is the main creditor. In other cases, including firms in which IBRA is a minority creditor,
negotiations occur under the JITF.
T a b l e 8 . 1
�� ���� �������� �� ������ ������ ������ �
Liabilities and Assets of Major Debtors and Creditors, 1999, US$ billion
State IBRA Asset Other Foreign Securities Totalbanks Management local banks holders
Credit Unit banks
State enterprises 3.5 1.7 0.5 5.3 1.0 12.1
Large private corporations 4.0 22.9 3.4 50.7 4.1 85.0
Small and medium 7.2 4.2 8.3 2.4 0.5 22.6
enterprises
Total 14.7 28.8 12.2 58.4 5.6 119.7
Source: World Bank, 2000.
1 Cooperation between these schemes and their implementation has improved now the high level Financial Sector Policy
Committee oversees both initiatives and reports directly to the President.

� � � � � � � � � � � � � � � � � � � � � � � � �
� � ���
�������������������������������� !� ����
Despite changes in 1998 to the bankruptcy laws, only around one third of debtors appearing before
the commercial courts by late 2000 had been found bankrupt (Table 8.2). This has meant the threat
of bankruptcy has been minimal, and debtors had little incentive to enter debt restructuring processes.
By mid 2000, frustrated by these outcomes, the Government and IBRA demanded the commercial
court assign cases to ad hoc judges, leading to the replacement of around 70 per cent of judges in
Jakarta courts. Commercial court judges’ dissenting opinions now are published to improve the court
system’s credibility and transparency. Four new commercial courts will open in regional areas to
accelerate the corporate debt restructuring process. Finally, the President is appointing well regarded
judges to the Supreme Court, including a new Chief Justice.
To improve legal outcomes, the Government and IBRA threatened to invoke government Decree 17
of 1999 and seize the assets of recalcitrant debtors. In mid 2000, it established the inter-ministerial
Committee for Resolving the Cases of Recalcitrant Debtors to coordinate a strategy for IBRA’s
difficult debtors, including prosecuting them and imposing administrative sanctions on their firms.
The Government also issued a regulation providing IBRA staff with indemnity from personal lawsuits
filed against them for restructuring bad debts.2
T a b l e 8 . 2
���� ��� !���"��#������$�%�&���'��
New Commercial Court Findings on Bankruptcy Cases, April 2000
Number of cases Outcome
37 Bankruptcy
27 Debt moratorium
45 Rejected/not accepted by the court
5 Void
6 Withdrawn by applicant
2 No jurisdiction
Source: Deacons, 2000a.
2 However, analysts argued an October 2000 decision to halt bankruptcy proceedings against three large corporate debtors
because of their export contribution was counter productive, even though the announcement stressed this decision would
not affect smaller bankruptcy cases.

� � � � � � � � � � � � � � � � � � � � ! "
� � ���$
����������� �����
August 1998 legislation amending the 1905 Bankruptcy Ordinance provides for two insolvency
regimes, bankruptcy and debt moratorium, and a recognised procedure for debtors to suspend
payments. The new laws introduce claw-back provisions, enabling creditors to void
transactions, establish a panel of professionals to act as receivers and administrators, and
impose tighter timetables for hearing petitions and granting judgements. To successfully file a
bankruptcy petition, the debtor must fail to pay at least one debt that is due and payable, and
have two or more creditors. A bankrupt debtor cannot control and manage its assets. The
laws also established a commercial court to hear bankruptcy proceedings.
Despite the amendments, the new bankruptcy law creates several uncertainties as it fails to:
• establish clear criteria for establishing whether a debt is due and payable
• introduce a concept of insolvency as a prerequisite to bankruptcy proceedings. It is sufficient
only to show the debtor has more than one creditor and has failed to pay at least one debt
• prevent minor creditors from commencing bankruptcy proceedings contrary to the wishes
of more significant creditors.
Source: Deacons, 2000a.
The Government established the Independent Commission for the Audit of State Officials to prosecute
corrupt officials, and has increased judges’ salaries. Under new laws, a new Joint Investigating Team
can refer corrupt officials to the Attorney General for prosecution. The National Ombudsman
Commission, an independent body established to act on complaints from the public relating to
governance issues, also can refer cases to the Joint Investigating Team.
As a result of these measures, some positive developments are apparent. In July 2000, the Supreme
Court overruled an earlier Jakarta commercial court verdict rejecting bankruptcy on technical grounds
for PT Bakrie Finance Corporation, one of Indonesia’s largest conglomerates. In July 2000,
the Jakarta commercial court declared PT Landasan Terus Sentosa bankrupt for failing to pay
Rp. 270 trillion (US$30.8 billion) in debts to IBRA.
��"�������������������������� !� ����
The taxation law also hampers effective debt restructuring, by taxing any capital gains debtors make
in reducing their liabilities under debt workouts. Recognising this, in late 2000, the Government
approved amendments to the taxation law, effective January 2001, which should reduce debtors’
tax burdens on debt equity swaps and debt forgiveness agreements by about Rp. 600 billion
(US$70 million) (Ha, 2000). Measures also include removing withholding taxes on accrued but unpaid
interest, transferring duties on debt/asset swaps involving real estate and reducing limits on the
carry-forward of net operating losses.
� � � � � � � � � � � � � � � � � � � � � � � � �
� � ��%&
The Government has committed to address capital market regulations that impede debt restructuring,
including rules that prevent new equity raising and par value restrictions on the issue of new equity.
Regulators also have waived some regulations on new issues to expedite IBRA’s equity sales to
strategic investors. Together, these government reforms should improve the quality of debt
restructuring outcomes.
# �������$� �%������� !� ����
As new government incentives and legal powers accelerate the pace of debt restructuring, some
concerns about its quality are emerging. Corporate Indonesia still is highly leveraged. At the end of
1999, the 135 non-financial companies listed on the Jakarta Stock Exchange had a collective
debt to equity ratio of 1 046 per cent. Among restructured firms, debt to equity ratios remain high
(World Bank, 2000). A sample of 34 cases involving debts of US$8 billion showed 59 per cent were
resolved using a combination of reduced interest rates, extended loan terms and grace periods;
38 per cent through conversions of debt to equity; and only 3 per cent through debt write offs.
Hence most workouts only rescheduled debt, rather than improving internal operations or significantly
reducing leveraging. A reluctance to write off debt, sell assets or seek equity injections maintains
debt to equity ratios at high levels, and leaves corporate balance sheets vulnerable; cash flows
may be insufficient to service debts once grace periods expire (World Bank, 2000). Hence in the
future, restructured loans could become non-performing again. Most insolvent firms continue to operate
under their original management, often limiting operational restructuring.3
����&��������������������'���� ��
The Asset Management Unit, Credits, AMC within IBRA is the largest creditor in the economy,
managing all non-performing loans transferred to IBRA from banks the Government took over.
AMC presides over total debts with a face value of Rp. 281 trillion (US$32 billion), mainly owed by
large debtors (Table 8.3). Its stated objective is to restructure or auction these non-performing
loans or dispose of collateral backing them by court initiated liquidation proceedings, so as to
maximise returns to the taxpayer.
3 Limited government resources and consensus that former owners are best placed to operate their companies means
administrators usually are not installed while debts are restructured or firms are liquidated.

� � � � � � � � � � � � � � � � � � � � ! "
� � ��%�
T a b l e 8 . 3
�� �����������(��������&���� �)�'��
Classification of IBRA Loans by Debtor Size, May 2000
Number of Total amount Per cent debtors outstanding of total
(Rp. trillion)
More than Rp. 50 billion (US$7 million) 1 820 232.5 82.8
Between Rp. 5 billion and Rp. 50 billion 2 093 33.6 11.9
(US$0.7 to $7 million)
Between Rp. 1 billion and 5 billion 2 206 5.4 1.9
(US$0.12 to $0.7 million)
Less than Rp. 1 billion (US$120 000) 129 924 9.5 3.4
Total 136 043 280.9 100
Source: Indonesian Bank Restructuring Agency, 2000a.
To expedite results, IBRA has prioritised restructuring the loans of the 21 largest debtor groups.
Together these account for around 36 per cent of all IBRA’s loans (about US$10.2 billion) and involve
around 340 individual companies (Table 8.4) (International Monetary Fund, 2000b).
T a b l e 8 . 4
��&��� �����*+��� ���������� �, ����
Value of Debts of 21 Largest Debtors, September 2000
Debtor Debts Debtor Debts
(Rp. billion) (Rp. billion)
Texmaco 16 966 Raja Garuda Mas 2 376
Barito Group 7 521 Bahana Pembinaan Usaha Indonesia 2 989
Humpuss Group 5 689 Dharmala Group 2 732
M Hasan 5 212 Ongko Group 2 490
Bakrie Group 5 932 Gunung Sewu Group 2 833
PSP Group 4 280 Danamon Group 3 451
Tirtamas Group 3 195 Nugra Santana Group 2 149
Napan Group 3 678 Kodel Group 1 847
Tirtobumi 2 902 Rajawali Group 2 677
Djajanti Group 2 853 Argo Pantes 1 924
Bimantara 3 362
Total 87 059
Source: Indonesian Bank Restructuring Agency, 2000g.
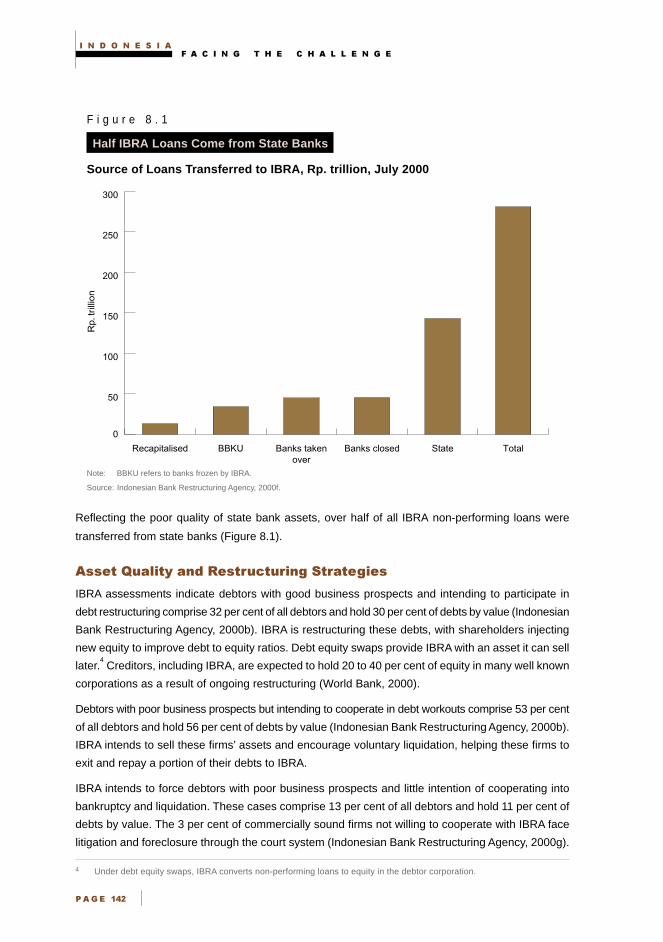
� � � � � � � � � � � � � � � � � � � � � � � � �
� � ��%'
F i g u r e 8 . 1
Half IBRA Loans Come from State Banks
Source of Loans Transferred to IBRA, Rp. trillion, July 2000
Note: BBKU refers to banks frozen by IBRA.
Source: Indonesian Bank Restructuring Agency, 2000f.
Reflecting the poor quality of state bank assets, over half of all IBRA non-performing loans were
transferred from state banks (Figure 8.1).
������# ��������(������ !� ��������������
IBRA assessments indicate debtors with good business prospects and intending to participate in
debt restructuring comprise 32 per cent of all debtors and hold 30 per cent of debts by value (Indonesian
Bank Restructuring Agency, 2000b). IBRA is restructuring these debts, with shareholders injecting
new equity to improve debt to equity ratios. Debt equity swaps provide IBRA with an asset it can sell
later.4 Creditors, including IBRA, are expected to hold 20 to 40 per cent of equity in many well known
corporations as a result of ongoing restructuring (World Bank, 2000).
Debtors with poor business prospects but intending to cooperate in debt workouts comprise 53 per cent
of all debtors and hold 56 per cent of debts by value (Indonesian Bank Restructuring Agency, 2000b).
IBRA intends to sell these firms’ assets and encourage voluntary liquidation, helping these firms to
exit and repay a portion of their debts to IBRA.
IBRA intends to force debtors with poor business prospects and little intention of cooperating into
bankruptcy and liquidation. These cases comprise 13 per cent of all debtors and hold 11 per cent of
debts by value. The 3 per cent of commercially sound firms not willing to cooperate with IBRA face
litigation and foreclosure through the court system (Indonesian Bank Restructuring Agency, 2000g).
4 Under debt equity swaps, IBRA converts non-performing loans to equity in the debtor corporation.
0
50
100
150
200
250
300
TotalStateBanks closedBanks takenover
BBKURecapitalised
Rp.
trill
ion

� � � � � � � � � � � � � � � � � � � � ! "
� � ��%�
Cooperating debtors enter meetings with creditors, led by IBRA, and sign a letter of commitment to
participate in negotiations. Often debtors agree to sign a ‘stand still agreement’ that freezes the firm’s
operations, although this is optional. Once IBRA and its private sector subcontractors conduct due
diligence, debts can be restructured. Negotiations with viable businesses culminate in debtors and
creditors signing a debt restructuring agreement.
����� !� �������������
By September 2000, IBRA reported over 40 per cent of the value of debt owed by the top 200 debtors
had entered the final stage of negotiation. Restructuring of close to three quarters of the value of
debts owed by the top 21 debtors was complete or close to completion (Table 8.5). Debt restructuring
has accelerated due to IBRA’s more vigorous and flexible approach, enhanced government support
for prosecutions, and government action to improve the operation of the courts.
T a b l e 8 . 5
�� �������� �������������%��� �%
Resolution of IBRA Credits, 30 Sep 2000, Rp. trillion (Per cent of total in brackets)
Debtors Early stagea
Middle stageb
Late stagec
Total
Top 21 8.3 16.5 62.3 87.1 (9) (19) (72)
22 to 200 21.7 52.1 13.1 86.9 (25) (60) (15)
Top 200 30 68.5 75.4 173.9 (17) (40) (43)
Note: a Includes initial negotiations, stand still agreements or legal processes not initiated.
b Includes assignment of advisers, due diligence and restructuring negotiations.
c Includes finalising of restructuring memorandums of understanding, implementation, full payment or commencement of legal action.
Source: World Bank, 2000.
By August 2000, IBRA had initiated legal proceedings against around 450 debtors, accounting for
less than 4 per cent of the total value of debt. IBRA seeks to bankrupt around 50 of these and pursue
another 150 in civil courts. It has indicated it intends to reach agreement or initiate legal action
against all 21 large debtors by the end of 2000. In late 2000, out of some 340 companies the top
21 debtors owned, the AMC was prosecuting 16 non-cooperative borrowers, with total debts over
Rp. 6 trillion (US$685 million).5
)��*� �������
Depending on the firm’s projected cash flows, IBRA can reschedule repayments for up to ten years
and allow grace periods of up to two years. IBRA also indicates it encourages asset sales, injections
of capital by existing shareholders and debt buy outs by new investors to create acceptable debt to
equity levels. IBRA waives interest payments for large borrowers only under special circumstances,
5 Also in mid 2000, IBRA used 1999 regulations to threaten to seize assets from Mas Murnia, a large conglomerate debtor
with debts totalling US$44 million, which refused to enter debt workout negotiations.
� � � � � � � � � � � � � � � � � � � � � � � � �
� � ��%%
providing the financial accounts show no irregularities. However, for small loans under Rp. 5 billion,
it has launched an accelerated settlement scheme waiving all interest and fees owed by small and
medium enterprise and retail borrowers (except home, car and credit card borrowers) who repay the
full principal due (World Bank, 2000).
%!�����!�����������������
In mid 2000, to speed debt restructuring, IBRA outsourced the servicing of around 2 000 commercial
loans worth between Rp. 5 billion and Rp. 50 billion with a total face value of Rp. 30 trillion (US$3.4 billion)
to refinanced banks through competitive bidding. While these loans remain on IBRA books, it believes
commercial banks could collect and restructure these loans more actively, before their planned sale
by October 2001. IBRA also intends to dispose of all its loans worth below Rp. 5 billion totalling
around Rp. 8.43 trillion (US$960 million) and involving 127 461 debtors by the end of 2000
(Indonesian Bank Restructuring Agency, 2000b; and World Bank, 2000). Its first two tranches of
mortgage loans sold via open public tender for US$140 million, or close to 40 per cent of face value.
It also sold a smaller group of larger restructured commercial loans; to date, the average recovery
value of commercial and retail loans is 57 per cent.
�+��,�-������������������-�����
The JITF coordinates debt restructuring when IBRA is not a majority creditor. The initiative, established
in September 1998, facilitated out-of-court voluntary corporate debt restructuring. Mainly private
sector officers staff it and since January 2000, the Government has boosted significantly its resources
to improve its capabilities.
Initially, each debtor has to form a steering committee with major creditors to agree on a debt
restructuring strategy. The debtor submits a financial rescue plan to the steering committee that all
creditors must accept. If a minimum number of creditors and the debtor cannot agree, a ‘pre-negotiated’
plan, which new bankruptcy laws define, then comes into force. A task force of senior representatives
from relevant ministries and agencies, and advised by a private Advisory Restructuring Committee,
removes regulatory and tax obstacles, and provides a one stop shop to approve filings (International
Monetary Fund, 2000c).
In April 2000, debt restructuring delays caused the Government to initiate time-bound processes
under JITF, and improve incentives and sanctions to encourage debtor participation.6 Reforms included
establishing the Financial Sector Policy Committee; all relevant ministers sit on this. The committee
now oversees corporate and bank restructuring, and refers major cases to the JITF for action, instead
of relying on debtors to volunteer for the scheme. The committee also can refer uncooperative debtors
to the Attorney General’s office to initiate bankruptcy proceedings.7 Where necessary, the task force
now assists debt restructuring on IBRA’s behalf. Government tax incentives for debt forgiveness,
6 Under the early form of the JITF, progress was very slow; it attracted only 25 companies by November 1998, in its first two
months of operation.
7 The Financial Sector Policy Committee also can act on the Jakarta Initiative Task Force’s recommendation to impose other sanctions
against recalcitrant debtors, including publishing the names of non-cooperative debtors and requesting relevant government
agencies to revoke or refuse to extend licences, concessions and other facilities uncooperative parties previously held.
� � � � � � � � � � � � � � � � � � � � ! "
� � ��%�
debt to asset and equity swaps, and easier requirements for banks to swap non-performing debts for
equity also assist task force debt restructuring (International Monetary Fund, 2000c).
These new government initiatives have markedly improved JITF outcomes. The task force now
carries a case load of close to US$10 billion (Rp. 87.6 trillion), projected to increase to over
US$15 billion (Rp. 131 trillion) by the end of 2000, due to eight cases with debts totalling Rp. 48 trillion
(US$5.5 billion) that the Financial Sector Policy Committee referred. After restructuring debts worth
US$5 billion (Rp. 26 trillion) by July 2000, it should complete restructures worth a further US$3 billion
by December 2000 and a total of US$12 billion by April 2001 (International Monetary Fund, 2000c
and 2000d). The task force aims to restructure each debt within three to six months, depending on
the complexity of the case, and releases quarterly surveys monitoring the progress of corporate
restructuring (International Monetary Fund, 2000c and 2000d).
������� �%������� !� ����
By late 2000, building on earlier initiatives, foreign banks indicated agreements with several large
debtors either have been reached or were imminent (World Bank, 2000).8 Nearly half the corporate
sector debt owed to foreigners is being restructured under the JITF.
��������������������
The Government also is embarking on a program to strengthen corporate regulation and governance.
It recognises improving corporate governance not only will support corporate debt restructuring,
but should help prevent another round of bad investment decisions and banking crises. While laws
governing Indonesian companies generally are sound, the Government believes a weak legal system
and lack of surveillance capacity results in generally poor corporate compliance. Therefore, the
corporate governance enhancement program centres on increasing court system and bureaucratic
capacity by augmenting their financial and human resources. The Government also is aware that
returning the corporate sector to private hands will increase market competition, enhancing corporate
governance. A National Committee on Corporate Governance established in 1999 drives corporate
governance reform. Its 20 public and private sector members represent legal and accounting
professionals, banks, state enterprises, private corporates and some government agencies.
��.��/������������������(� .��/�����
Although Indonesian corporate legislation is relatively sound, the Government is aiming to bring
corporate regulations closer to best practice. Efforts focus on improving minority shareholders’ rights
and majority shareholders’ responsibilities; better defining the functions and responsibilities of
management, directors and the company secretary; and increasing management and financial
disclosure requirements.
8 This progress builds on previous government efforts to resolve private foreign debts. In June 1997, the Government and a
group of international private creditors entered the Frankfurt Agreement, requiring Indonesian debtors to pay trade credit in
arrears and restructure some inter-bank and corporate external debt.
� � � � � � � � � � � � � � � � � � � � � � � � �
� � ��%�
Proposed government amendments to the company law and the company registration law would
make firms’ ownership and financial performance more transparent. Amendments to the capital market
law require listed companies to have at least one independent director; this should increase the board’s
commitment to maximising the wealth of all shareholders, not merely the main shareholder’s wealth.
Regulations governing reporting requirements for new share issuers also have been tightened.
Increasing resources for the Capital Market Supervisory Board, Bapepam, to supervise the stock
market and introducing international standards to supervise pension, insurance and finance companies
will improve capital markets’ governance. Sanctions against listed companies failing to report financial
performance and conduct independent audits are tighter, and prosecution of criminal conduct by
Bapepam increased significantly over 2000. The Jakarta Stock Exchange has introduced specialised
trading boards for established companies, start up companies and companies offering stocks with a
nominal value below Rp. 500 per share. With capital market listing for second tier companies to be
relaxed, start up companies will be better placed to raise funds to enter the corporate sector.9 The
Government intends to establish a new consolidated supervisory body for banks and non-bank financial
institutions in 2002.
���-������������������������
Increasing corporate sector competition should complement improving formal regulations to strengthen
corporate governance. Selling bankrupt conglomerate assets, improving new entrants’ access to
capital, including by developing stock and bond markets, introducing new laws prohibiting anti-
competitive behaviour and reducing the role of state corporations all should boost competition.
����������
The Government’s and IBRA’s break up and sale of large corporate conglomerates should reduce
substantially the degree of concentration within the corporate sector, improving the level of competition.
Removing banks from large scale conglomerate structures should stop the channelling of funds to
related companies. Asset sales to new domestic and foreign company entrants promise to increase
competition across most sectors. In particular, foreign companies entering the market should offer
price, product innovation and marketing competition, as well as generally higher standards of corporate
governance. Increasingly, markets should discipline firms in their use of credit and other scarce resources.
�/���.������.��������*���
Developing corporate equity and bond markets provide new sources of corporate credit; they also
will enforce commercial discipline. As corporates and banks compete more for savings, funds are
more likely to be allocated to more viable investments, reducing the risks of a new banking crisis.
Increasing share ownership should increase turnover in corporate ownership, discipline corporate
9 Under pre-existing regulations, only well established companies with adequate financial records could use the market to
raise funds; however, enforcement was relatively weak.

� � � � � � � � � � � � � � � � � � � � ! "
� � ��%#
investment practices and separate ownership from management. With so many government bonds
issued as part of bank restructuring, a deeper government bond market eventually should emerge,
providing a benchmark yield curve that supports corporate bond market development (East Asia
Analytical Unit, 1999).
�0�����������������
Many other post crisis reforms should reduce market entry barriers, increase competition and
strengthen market discipline on corporate behaviour. Lower tariffs and improved access to import
licences should increase competition from foreign suppliers. In reforming and privatising state
enterprises, the Government has removed monopolies in several sectors, reduced subsidies to
inefficient state enterprises and improved access for new entrants. In October 2000, as part of its
overall policy to increase business competition, the Government released a draft new foreign
investment law. (See Chapter 3 - Foreign Investment.) If this law overcomes resistance in the
legislature, the more liberal foreign direct investment environment would allow new entrants in many
previously protected industries. By eliminating preferential treatment for the national car program
and the national aircraft industry, the Government also has improved access for new entrants in
these sectors (Deacons, 2000b).
����1�� ��������������
The anti-monopoly and unfair competition law passed in 1999 aims to prevent anti-competitive business
activities and agreements (Deacons, 2000b).10
The Business Supervisory Commission which enforces
the law is accountable to the President. The commission concentrates on listed companies; up until
October 2000, it had investigated 29 companies for manipulating prices and insider trading, and
exonerated 11 of these (Jakarta Post, 19 April 2000).
�����������
The Government is aware that restructuring the corporate sector’s huge non-performing loans must
continue speedily if new investment is to occur and the recovery is to continue. New government
initiatives, including action to increase the integrity and capacity of the legal system, are encouraging
many more corporates to participate in debt restructuring programs. However, this process is ongoing
and corporate debts remain huge. Concerns about the depth of operational restructuring also are
emerging as the pace of workouts accelerates.
The Government’s new corporate governance framework, drawing on new legislation and supported
by stronger market competition, should ensure better corporate governance standards in future.
While major improvements in corporate culture and governance will take some time to achieve,
eventually these reforms should provide a corporate environment which will support more efficient
investment and improve Indonesia’s investment standing.
10 The law was issued on 5 March 1999, but only became effective a year later.

� � � � � � � � � � � � � � � � � � � � � � � � �
� � ��%
��������
Deacons, 2000a, ‘Report to the East Asia Analytical Unit on Corporate Sector Restructuring in
Indonesia’, Jakarta, July.
___ 2000b,‘Anti-monopoly and Unfair Competition’ and ‘The New Bankruptcy Law’ DGJ Consultant
Summaries, Jakarta.
East Asia Analytical Unit, 1999, Asia’s Financial Markets: Capitalising on Reform, Department of
Foreign Affairs and Trade, Canberra.
Ha, Jiming, 2000, East Asia Analytical Unit interview with Senior Economist, Resident Representative,
Jakarta Office of the International Monetary Fund, Jakarta, October.
Indonesian Bank Restructuring Agency, 2000a, ‘Monthly Report’, Jakarta, May.
___ 2000b, ‘Monthly Report’, Jakarta, August.
___ 2000c, ‘Monthly Report’, Jakarta, October.
___ 2000e, Information supplied to Deacons, April, Jakarta.
___ 2000f, www.bppn.go.id accessed on 5 May 2000.
___ 2000g, www.bppn.go.id, accessed on 16 April 2000.
International Monetary Fund, 2000a, Letter of Intent, January 2000.
___ 2000b, Letter of Intent, May 2000.
___ 2000c, Letter of Intent, July 2000.
___ 2000d, Letter of Intent, September 2000.
World Bank, 2000, ‘Accelerating Recovery in Uncertain Times’, report for the Tokyo Consultative
Group on Indonesia meeting, 13 October, Jakarta.
� � � � � � � �
�� ���
���������������
��������
• With world class reserves in leading minerals, oil, petroleum, coal
and gas, Indonesia’s mining and oil sector generates significant
exports and foreign currency. This helps buffer the economy against
downturns and makes the sector critical to Indonesia sustaining
economic growth.
• Four key challenges confront Indonesia’s mining community:
devolution, as most mines are in regional Indonesia; social stability
in some regional areas; increased illegal mining; and new regulations
on environmental standards. These challenges highlight the
importance of strong relationships between mining firms, all three
levels of government and local communities.
• Foreign companies contribute significantly to mining sector activity,
with their investment exceeding US$10 billion in the last three
decades. Australian firms account for about one third of this
foreign investment.
• Australian firms are well placed to use their geographical proximity
and mining expertise to help Indonesia develop its mineral
resources. Opportunities include assessing resources, refining and
distributing mineral output, and exporting mining related equipment,
supplies and services.
• As in other sectors, potential investors should undertake thorough
due diligence assessments. The need to modernise, improve
management and create financial transparency may be major issues.

� � � � � � � � � � � � � � � � � � � � � � � � �
�� ����
Australia’s ongoing participation in Indonesia’s mining sector contributes significantly to the bilateral
commercial relationship. Indonesia is a major international producer of oil and gas, as well as several
metallic minerals and coal; this contributes significantly to Indonesia’s GDP and balance of payments,
providing a major source of foreign currency.
The investment environment in the mining sector has changed rapidly since the financial crisis.
Political devolution, for example, may make government more responsive to the needs of local
investors, but generates uncertainty. Miners also have concerns about social stability in some regional
areas, stringent new environmental requirements and illegal mining.
This chapter briefly surveys Indonesia’s mineral resource endowments, outputs and exports, then
analyses post crisis developments in the mining sector. After discussing the likely impact of new
regulatory and fiscal measures on mining, it reviews Australian business opportunities in the sector.
���� ����������������������
Indonesia enjoys world class reserves in leading minerals, coal, oil and gas. Sizeable reserves, as
yet unproven, may lie in remote and less accessible eastern Indonesia. Proven oil reserves, mainly
onshore, amount to 5 billion barrels. Oil production from new, smaller fields has increased over
recent years, offsetting the decline of larger, more mature oil fields. Oil exploration is concentrated in
the frontier regions, particularly eastern Indonesia (Energy Information Administration, 2000). Joint
offshore petroleum cooperation areas between Indonesia and Australia offer mutually beneficial
prospects. Indonesia’s total proven natural gas reserves amount to 72.3 trillion cubic feet; the domestic
gas market remains underdeveloped; and opportunities to provide a distribution network and pipeline
infrastructure are likely to attract Australian interest (Energy Information Administration, 2000).
Indonesia’s significant coal reserves have a sulphur and ash content of less than 1 per cent and are
close to major Asian markets. Copper and gold reserves also are substantial, and already attract
significant investment.
The mining and oil sector contributes a large share of Indonesia’s exports and foreign currency
earnings, and provides an important buffer against economic downturns. Hence, the sector’s health
is critical to Indonesia’s medium term economic outlook.
������������������������
In 1998, the value of mining sector output declined by much less than GDP, somewhat buffering the
economy from the crisis (Figure 9.1). The output value of non-oil and gas mining grew 38 per cent
between 1997 and 1999, largely driven by export-oriented coal, gold, copper and silver production.
Overall mining and energy sector output contracted mildly, because of a 6 per cent fall in oil and gas
production, a response to low oil prices, and falling extractive quarrying due to reduced construction
activity (Figure 9.2 and Appendix Table 9.1).
However, the output volume of most other minerals and precious metals has risen significantly since
1994 and continued to rise even during the crisis (Figure 9.2).
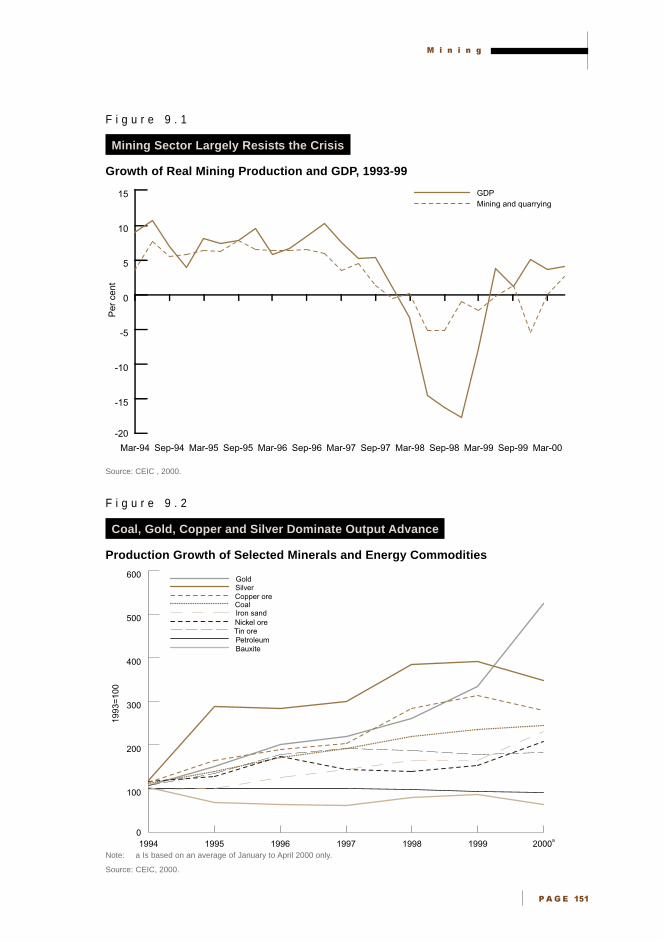
� � � � � �
�� ����
F i g u r e 9 . 1
Mining Sector Largely Resists the Crisis
Growth of Real Mining Production and GDP, 1993-99
Source: CEIC , 2000.
F i g u r e 9 . 2
Coal, Gold, Copper and Silver Dominate Output Advance
Production Growth of Selected Minerals and Energy Commodities
Note: a Is based on an average of January to April 2000 only.
Source: CEIC, 2000.
0
100
200
300
400
500
600
BauxitePetroleumTin oreNickel oreIron sandCoalCopper ore SilverGold
2000a199919981997199619951994
1993
=100
-20
-15
-10
-5
0
5
10
15Mining and quarryingGDP
Mar-00Sep-99Mar-99Sep-98Mar-98Sep-97Mar-97Sep-96Mar-96Sep-95Mar-95Sep-94Mar-94
Per
cen
t
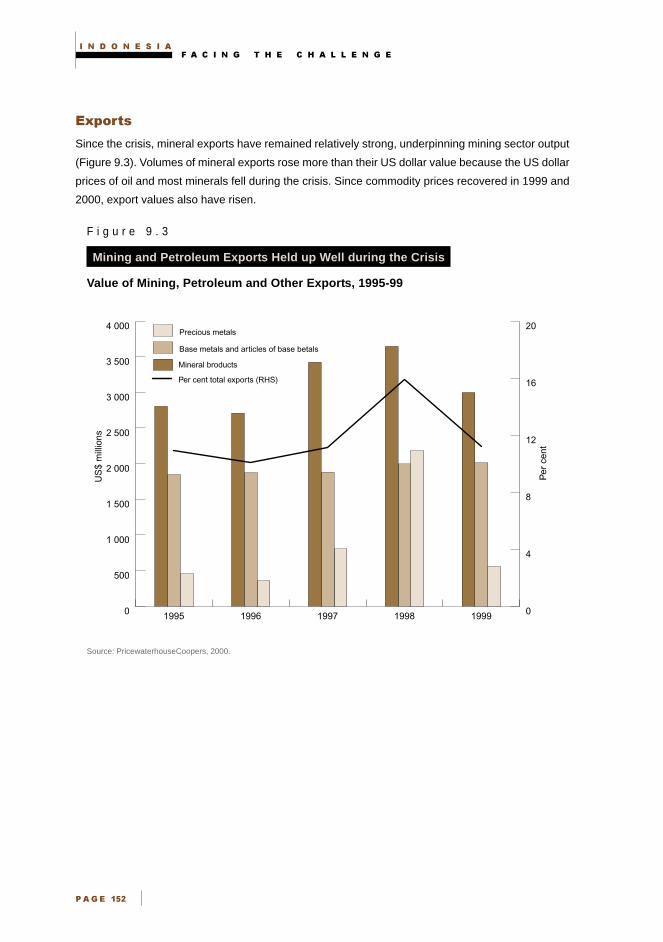
� � � � � � � � � � � � � � � � � � � � � � � � �
�� ����
��� ���
Since the crisis, mineral exports have remained relatively strong, underpinning mining sector output
(Figure 9.3). Volumes of mineral exports rose more than their US dollar value because the US dollar
prices of oil and most minerals fell during the crisis. Since commodity prices recovered in 1999 and
2000, export values also have risen.
F i g u r e 9 . 3
Mining and Petroleum Exports Held up Well during the Crisis
Value of Mining, Petroleum and Other Exports, 1995-99
Source: PricewaterhouseCoopers, 2000.
0
500
1 000
1 500
2 000
2 500
3 000
3 500
4 000
0
4
8
12
16
20
Per cent total exports (RHS)
Precious metals
Base metals and articles of base betals
Mineral broducts
19991998199719961995
Per
cen
t
US
$ m
illio
ns

� � � � � �
�� ���
��������!� �"�����
Four new developments are challenging the mining community. First, devolution is likely to have
significant effects as most mines are in regional Indonesia.1 Consequently, investors are encouraged
to develop fresh strategies during the transition to a new, decentralised political system. Second,
issues of social stability and security concern mine operators in several regions. Third, the increase
in illegal mining since the crisis concerns both the Government and the mining community. Fourth,
the Government has introduced stringent new regulations on environmental standards, some of
which exceed international norms.
������ ���!� �����
Devolution eventually may improve the investment environment for miners. It offers the regions a
greater share of mining revenues, ensuring local communities benefit more directly from mining
activity. In future, local governments, rather than the central government may sign miners’ contracts
of work, potentially strengthening local support for miners (Millane, 2000). Devolution delegates the
issuing of permits for mining investment and exploration to the regions; eventually this may reduce
the cost of obtaining approval. It also requires local government to conduct environmental inspections
(Department of Mines and Energy, 2000). Devolution may encourage regions to compete for new
foreign investment, benefiting miners.
However, the transition to a new system of government is raising some concerns amongst miners.
Miners are uncertain whether contracts of work drawn up between mining companies and the central
government will remain relevant.2 Devolution may reduce coordination between neighbouring districts,
increasing administrative costs for mining projects encompassing more than one district. The central
government is seeking to quell these concerns. New Ministry of Mines and Energy regulations establish
procedures for provinces to issue mining permits for investment, exploration and production in areas
lying within two or more districts and up to 12 miles offshore from their coasts. Initially, some regions
may find it difficult to meet previous standards in issuing permits and inspecting environmental
performance. If some regions are unable to control the environmental degradation associated with
illegal mining, this could undermine public support for the operations of legitimate miners.
Some analysts also are concerned transparency issues at the local government level may increase risk
(Transparency International, 2000). As the allocation of taxation responsibilities between central and local
governments is not fully clarified, concerns exist local governments may seek to impose ad hoc taxes.
During the transition phase, investors should seek to strengthen relationships with all three levels of
government and local communities. New firms should seek assistance from firms with established
networks of contacts and information.
1 Unlike manufacturing and service sectors, which mainly centre on Java, oil and natural gas are concentrated in Riau and
Aceh, in Sumatra, and East Kalimantan, on the island of Borneo; copper is concentrated in Irian Jaya, which has one of the
world’s largest copper mines, PT Freeport Indonesia.
2 Some local interest groups are using the transition period to devolution to urge the rewriting of contracts of work with foreign
mining companies.
� � � � � � � � � � � � � � � � � � � � � � � � �
�� ����
3 Indonesian Constitution, Article 33, paragraph 3.
���������������
Indonesia’s constitution stipulates the state owns all natural resources.3 The Indonesian
Government or state enterprises therefore retain exclusive authorisation rights for all stages
of mining activity from survey, exploration, exploitation, production, refining, transport and
marketing. Consequently, state enterprises are prominent in the mining and petroleum sectors.
Contracts of work evolved to attract private sector investment to resource development,
originally for oil production, then minerals and coal mining. Like miners operating leases in
other countries, private sector miners holding contracts of work can extract and sell minerals
and energy resources from defined leases, and in return, pay levies including land rent and
royalties. Successive generations of contracts increasingly have favoured the state and
imposed more fiscal and other obligations on contractors.
�� �������������������� �����
Individual contracts result from negotiations between the state and company, but ultimately
are at the government’s discretion. Contracts assign to the contractor full commercial and
operational risks. Contractors relinquish rights to all areas examined during exploration and
evaluation, and the government must receive the results of work done. Contractors must
employ Indonesian nationals to the maximum extent possible and implement training programs.
Companies also must include Indonesian capital as soon as production begins and commonly
must transfer 51 per cent of company shares to Indonesian ownership after ten years. Contracts
last 30 years but can be extended by mutual agreement. The contract defines royalties and
rents payable, in addition to normal corporation and general sales taxes.
Source: Millane, 2000
Increasing demands for greater autonomy in many provinces where mines are located has given rise
to civil unrest and some instances of violence, adversely affecting mining operations and the safety
of workers. Although regional devolution may reduce some of these tensions, miners need to remain
sensitive to these risks.
� ��� �������
The increase in illegal mining since the crisis is concerning the Government and the mining community
alike. Illegal mining is most serious in the gold, coal and diamond sectors; estimates of its value vary
widely, but in the case of gold, range from 12 to 33 per cent of output (Kuo, 1999). For example, in 1992,
state mining company PT Aneka Tambang, Antam, reported large numbers of illegal miners had
arrived and by 1998, they had halved output and exports from its Pongkor gold and silver mine (Millane,
2000; and Antam, 1998). BHP’s subsidiary, PT Arutmin, in South Kalimantan, also suffers from large
scale illegal mining.

� � � � � �
�� ����
The Government is attempting to reduce illegal mining by warning against the purchase of illegal
output and banning the use of government roads to transport illegally mined material. It also has
introduced tough new environmental regulations in response to the damage caused by illegal operators.
Emerging regional institutions could reduce the incidence of illegal mining over the medium term.
New reforms redistributing mining royalties to regions also should increase incentives for district
governments and their communities to eradicate illegal mining.
Mining companies can assist the Government reduce illegal mining by working with authorities to
detect and eradicate illegal mining. Some miners are pooling their surveillance and security resources.
Mining companies also should maintain good relationships with local communities and authorities,
so they can actively deter illegal miners.
�������������������������������������������������
Illegal mining often is large scale. BHP’s subsidiary, PT Arutmin, in South Kalimantan, is
subject to illegal miners who use a fleet of 200 trucks and 16 excavators. They transport their
output using a road and a jetty built across environmentally sensitive coastal marshlands.
Illegal miners account for as much as 4 million of the 22 million tonnes of coal mined in South
Kalimantan annually; this represents a loss of output worth A$92 million at current prices.
Much of the province’s illegal coal comes from the mine area PT Arutmin owns. Industry
sources report an environment of intimidation and threats of violence.
Source: McBeth, 1999; and BHP, 2000.
��#� ���� �����
The Government is negotiating several important mining sector laws, including new environmental
and contract laws. Mining companies should watch closely these developments.
��$���%�� �&���'(� '$�
Public reaction to the damage caused by illegal miners has prompted tighter environmental legislation
(Department of Mines and Energy, 2000). The Environmental Protection Agency, BAPEDAL, issued
Decree PP18 in February 1999, imposing stricter standards on waste discharge. The 1999 forest law
reserves large areas for water catchment and limits new mining activity in these areas. These new
standards in some cases exceed international norms. The Government has provided assurances the
law does not seek to restrict established exploration or mining agreements. Mining companies should
improve contact with local environmental bodies, including non-government organisations, to reassure
these groups about the firm’s environmental credentials, and share information on environmental strategies.4
4 In Indonesia, often mining occurs in rainforests with up to 180 cm of rainfall per year, so soil erosion, sediment, contamination
of offsite water bodies and land reclamation for post-mining uses are important issues. Another environmental issue in coal
mining is the loss of fine coal particulates; here loss of coal revenue and royalties can be up to 20 per cent of production,
and mining can pollute water supplies (Hamilton, 1998).

� � � � � � � � � � � � � � � � � � � � � � � � �
�� ���!
�������������������������������������
The Ministry of Environment requires firms to prepare environmental impact assessments for
activities which may affect the environment, and enforces environmental quality standards
(Millane, 2000). However, under devolution, these responsibilities will be delegated to regional
governments. The Bureau of Environment and Technology reviews, develops and coordinates
environmental polices and regulations within the Ministry of Mines and Energy. The Directorate
of Technical Mining, also within the ministry, inspects and enforces environmental policy.
Both agencies will retain their roles after regional devolution.
��#���)��������� ����
Contracts of work signed since the financial crisis include higher royalty rates on key minerals, although
in most cases, these continue to be offset by the lower costs of exploration and corporate tax rate in
Indonesia (Figure 9.4 and Table 9.1). For example, under Regulation No. 13 of 2000, gold royalties
rose to 3.75 per cent from between 1 and 1.5 per cent, and copper royalties rose to 4 per cent from
2 per cent. Indonesian investment guidelines provide a refund of the 10 per cent value added tax,
VAT, paid on imported mining capital equipment. The Government is aware that some mining firms
have expressed concern about difficulties in obtaining this refund (Aurora Gold, 1999). As devolution
occurs, potential investors should watch carefully developments in taxation and royalties applied to
mining revenues.
F i g u r e 9 . 4
Effective Tax Rates Rise
Net Mining Return and Effective Government Tax Rate, 1994-98
Note: a Calculated as share of gross profit (after interest) paid as tax.
Source: PricewaterhouseCoopers, 2000.
0
10
20
30
40
50Total government effective corporate tax rate
Company net return on assetsa
19991998199719961995
Per
cen
t

� � � � � �
�� ���"
T a b l e 9 . 1
��� ��������������� ������������������������������ �������
International Comparison of Fiscal Regimes for Mining, 1998
Factor Indonesia Australia Philippines Chile United States
Royalties 3.75 per cent 2.50 per cent 2.00 per cent Nil Nilon gold and (gold)copper 4 per cent
(copper)
Exploration 0.35 0.30 1.30 2.90 Nildead rentUS$/ha/yr
Mining dead 1.50 10.00 1.30 2.90 Nilrent US$/ha/yr
Corporate 30 per cent 36 per cent 35 per cent 15 per cent 15 to 35tax rate per cent
Source: Jakarta Post, 22 May 2000.
���������!�������
Foreign companies contribute significantly to mining sector activity, investing a cumulative
US$10.8 billion over the last 30 years. Of this, US companies account for US$6.4 billion while Australian
mining investment approvals to 31 May 2000 account for US$3.2 billion (34 per cent of total
applications). US mining company, PT Freeport Indonesia, one of the largest foreign investors in
Indonesia, accounts for the bulk of US investment in the mining sector (Millane, 2000).
Applications to invest in the mining sector, excluding oil and gas, have declined significantly since 1996
(Table 9.2). If this trend continues over the medium term, replacement investment may be insufficient
to maintain current production levels. The Department of Mines and Energy reports foreign and
domestic mining investment intentions falling sharply in 1999. Imports of surface mining equipment
fell from US$815.4 million in 1997 to US$650.3 million in 1998, corroborating this. In 1999, oil and
gas sector investments improved slightly, reflecting higher oil prices. However, foreign oil producers,
who produce 95 per cent of petroleum output, increased their total investment to an estimated
US$5.3 billion from US$4.3 billion in 1998 (Millane, 2000).
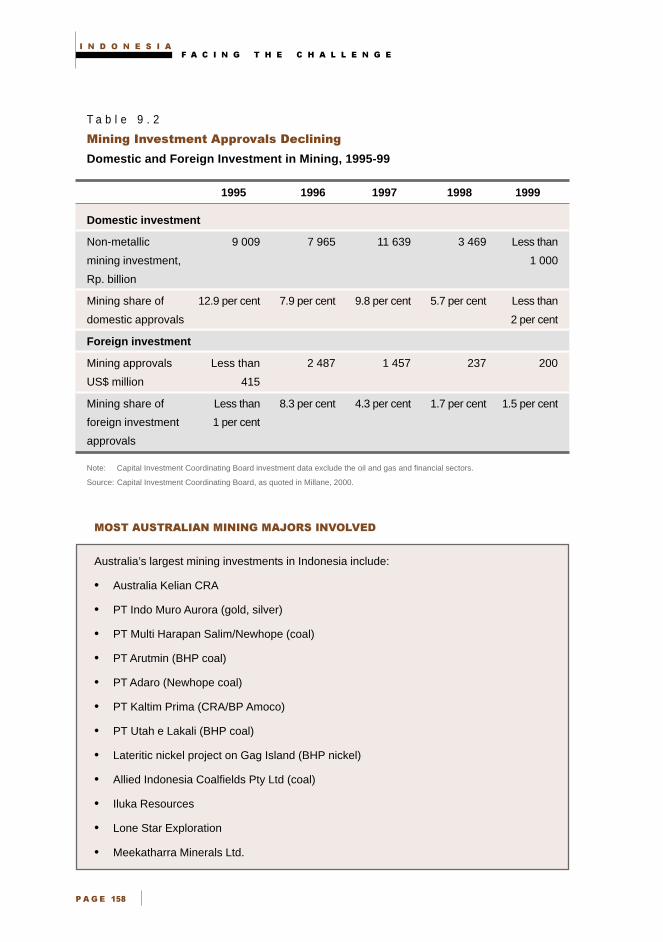
� � � � � � � � � � � � � � � � � � � � � � � � �
�� ���#
T a b l e 9 . 2
������������������ ��� �������!������
Domestic and Foreign Investment in Mining, 1995-99
1995 1996 1997 1998 1999
Domestic investment
Non-metallic 9 009 7 965 11 639 3 469 Less than
mining investment, 1 000
Rp. billion
Mining share of 12.9 per cent 7.9 per cent 9.8 per cent 5.7 per cent Less than
domestic approvals 2 per cent
Foreign investment
Mining approvals Less than 2 487 1 457 237 200
US$ million 415
Mining share of Less than 8.3 per cent 4.3 per cent 1.7 per cent 1.5 per cent
foreign investment 1 per cent
approvals
Note: Capital Investment Coordinating Board investment data exclude the oil and gas and financial sectors.
Source: Capital Investment Coordinating Board, as quoted in Millane, 2000.
������������������������� ������������
Australia’s largest mining investments in Indonesia include:
• Australia Kelian CRA
• PT Indo Muro Aurora (gold, silver)
• PT Multi Harapan Salim/Newhope (coal)
• PT Arutmin (BHP coal)
• PT Adaro (Newhope coal)
• PT Kaltim Prima (CRA/BP Amoco)
• PT Utah e Lakali (BHP coal)
• Lateritic nickel project on Gag Island (BHP nickel)
• Allied Indonesia Coalfields Pty Ltd (coal)
• Iluka Resources
• Lone Star Exploration
• Meekatharra Minerals Ltd.

� � � � � �
�� ���
�����������������������������!������������"�������
In 2000, Australia’s Austindo Resources Corporation, ARX, formed a strategic relationship
with the Austindo Group of Indonesia. ARX holds 63 per cent of a high grade epithermal gold
vein system at Cibaliung, 150 km south-west of Jakarta in West Java, in a joint venture
involving PT Aneka Tambang and International Antam Resources Ltd. ARX exploration inferred
resources equal to 312 230 ounces of gold and 1.83 million ounces of silver; the company
wants to confirm these results and explore possible extensions.
ARX has strengthened its capacity to manage government and community relations over
recent years, improving its effectiveness in coping with new regional devolution laws.
The company’s strategic relationships within Indonesia help it manage its operations effectively.
Despite the crisis, ARX has maintained its focus on Indonesia, hoping to benefit from economic
revival and recovering gold prices. The company expects Cibaliung to become a major new
gold mine.
Source: Austindo Resources Corporation, 2000.
����������� �������������
Australia’s proximity to Indonesia and mining expertise position it well to assist Indonesia develop its
mineral resources. Opportunities range from assessing resources through to refining and distributing
mineral output, as well as supplying mining related equipment, supplies and services.
���( �'�� �
Opportunities exist across the archipelago, particularly in the rugged eastern reaches. Australian
expertise in identifying resources, mapping geology and collecting geophysical data, particularly in
remote areas, suits these conditions.
� ���'*�����'������� ������%�*��
Providing contracting and support services to other mining companies reduces exposure to risks
associated with mining. Services include the design and construction of mines, materials handling,
environmental engineering, infrastructure provision, and supply of mineral transport systems and
mining equipment. Major Australian companies, including Theiss and Clough, have large contracts to
operate mines, although they face stiff competition from US firms.
��'�������+����&����
Local partners and bureaucracies have rising human resource needs; these generate opportunities
for providing training in mining technologies, mine operation and environmental monitoring.
� � � � � � � � � � � � � � � � � � � � � � � � �
�� ��!�
5 Pertamina, the state company responsible for distributing oil and gas throughout Indonesia, also is involved in crude
oil production.
��(���*� ����� ���������
The abolition of Pertamina’s monopoly on oil production and liberalisation of oil refining and distribution
offer substantial opportunities for Australia.5 New arrangements proposed in 1999 allow the
Department of Mines and Energy to award private companies oil production contracts which
Pertamina currently undertakes.
�����,��- �&�
In January 2000, after initial delays, the Government initiated a panel to oversee the reform of
Pertamina, including installing new management. In September 2000, the Government reaffirmed its
strong commitment to reform comprehensively the energy sector, submitting to the legislature two
new laws to privatise and reform the electric power and the oil and natural gas sectors (Energy
Information Administration, 2000; and International Monetary Fund, 2000).
"��%'���'�� ����� ���������
Privatisation may offer opportunities for Australians to acquire established mining enterprises.
Australian mining investors could assist these firms with business management, technical and
accountancy expertise.
Two state mining enterprises will be sold in 2000 or early 2001. PT Aneka Tambang, specialising in
gold and nickel mining, currently is 65 per cent government owned. A further small share will be sold
in 2000 or 2001, and eventually the balance will be sold. PT Tambang Batubara Bukit Asam, specialising
in coal mining, currently is 100 per cent government owned, with a minority share earmarked for
privatisation. Shares in both enterprises will be sold either through initial public offerings or by attracting
a strategic partner. In addition, the remainder of mining company, Antam, partially floated on the
Sydney stock exchange in August 1999, eventually will be sold under commitments to privatise the
majority share of all state enterprises. A standby list of state mining enterprises for sale includes
PT Tambang Timah (tin mining), currently 65 per cent government owned.
However, as in other state enterprise privatisations, potential investors should undertake thorough
due diligence assessments of enterprises offered for privatisation. Minority ownership may constrain
efforts to modernise and improve management, and financial transparency may be lacking. Investors
may need to convert current exploration and mining titles to contracts of work, especially if they
acquire majority foreign ownership.
� � � � � �
�� ��!�
�������#����������"�� �������������
Newcrest Mining Ltd set up a small office in Jakarta in 1991 and explored the Halmehera
region in cooperation with local firm, PT Aneka Tambang. Newcrest holds 82.5 per cent of the
joint venture. They discovered the Gosowong gold deposit in September 1993, and the
Government approved a sixth generation contract of work in April 1997. Between September 1997
and November 1998, with a sound understanding of the application process and good
communications with relevant government agencies, the venture acquired the necessary
permits. Construction started late in 1998 and the plant was commissioned in July 1999.
The project achieved its targets despite the financial crisis of 1997-99, and exceptionally
heavy rainfall during construction. The firm gave priority to recruiting and training local people,
fostering local business development, and carefully managing environmental issues.
The Gosowong project’s success demonstrates maintaining effective communication with all
levels of government, as well as local community representatives, is invaluable.
Source: Carmichael and Corp, 1999.
��""������#������������ ���������
Austrade maintains a directory of Australian companies able to provide equipment and services to
Indonesia’s mining, quarrying and construction industries. Australian export promotion groups,
Austmine and Austenergy, support firms seeking to export mining equipment, related supplies and
services to Indonesia.
Austrade assigns a high priority to assisting export companies, visiting major mines, identifying new
opportunities, and promoting Australian companies and expertise in the mining sector. Austrade and
a range of mining companies participate in Indonesia’s annual Mining Indonesia exhibition. The
Australian Embassy in Jakarta also facilitates high level contact with relevant ministers and officials.
"��"����
Mining is likely to remain an important sector in the Indonesian economy. New developments in
governance and politics may promise a better environment for harnessing Indonesia’s substantial mineral
wealth. However, the transition to political devolution raises taxation, legal and governance issues for
miners, creating uncertainty, and illegal mining problems are increasing. Investors need to remain alert
to local developments and the interests of stakeholders.

� � � � � � � � � � � � � � � � � � � � � � � � �
�� ��!�
A p p e n d i x T a b l e 9 . 1
� ��"�# ��"�� ���������������� ��������$��$�� ����!�
Production Growth and Volumes of Selected Minerals and Petroleum, ‘000s tons
1994 1995 1996 1997 1998 1999
Petroleuma
15992.9 15992.6 16179.5 15963.5 15843.8 14513.4
Tin ore concentrate 30.6 38.4 51.0 55.2 53.9 47.8
Copper ore concentrate 1095.8 1516.6 1758.9 1840.7 2640.0 2645.2
Nickel ore 2302.0 2513.3 3426.9 2829.9 2734.0 3245.3
Bauxite 1342.4 904.5 841.9 808.7 1055.6 1142.5
Coal 31238.5 41516.7 47338.6 52074.3 60320.8 69357.6
Iron sand concentrate 334.9 348.4 425.1 487.4 561.0 562.3
Goldb
42.6 62.8 83.6 90.0 124.0 129.0
Silverb
107.2 265.2 254.9 270.4 349.9 292.3
Note: a Thousands of barrels.
b Thousands of kilograms.

� � � � � �
�� ��!
��������
Antam, 1998, ‘Preliminary Report of Damages, and Chronology of Events Leading to the December 3rd
Fires at the Pongkor Gold Mine’, PT Aneka Tambang press release, 7 December,
www.antam.co.id/press28.htm, accessed on 21 May 2000.
Aurora Gold, 1999, Quarterly report ending 31 Dec 1998, www.auroragold.com.au, accessed on
14 May 2000.
Austindo Resources Corporation, 2000, Information Provided to Brendan Millane on Company’s
Operations in Indonesia, May, Jakarta.
Badan Pusat Statistik, 2000, www.bps.go.id. accessed on 16 May 2000.
Carmichael, T.J., and Corp, D.J., 1999, ‘Permitting, Construction and Commissioning of the
Gosowong Gold Mine, Halnahera, Indonesia’, paper delivered to PACRIM Conference 1999,
10-13 October, Bali.
CEIC, 2000, Asian Economic Database, Hong Kong, accessed on 8 October 2000.
Department of Mines and Energy (Departemen Pertambangan Dan Energi), 2000, Siaran Pers No. 01/
26/01/2000, press release, 26 January, Jakarta.
Energy Information Administration, 2000, ‘Indonesia’, www.eia.gov, accessed on 5 June 2000.
Hamilton, M.S., 1998, Mining Environmental Policy in Indonesia: Program Evaluation of the Joint
BLT-OSM Mining Environmental Project, Third Year of Effort, United States Department of Interior
for Office of Surface Mining Reclamation and Enforcement, Washington DC.
Indonesian Constitution, 1947, Article 33, paragraph 3, Jakarta.
International Monetary Fund, 2000, Letter of Intent, July, 2000.
Kuo, Chin S., 1999, ‘The Mineral Industry of Indonesia’ in United States Department of the Interior,
Minerals Yearbook 1998, Vol. 3, May, Washington, DC.
Millane, B., 2000, ‘Report to the East Asia Analytical Unit on the Indonesian Mining Sector’, July,
Adelaide.
PricewaterhouseCoopers, 2000, ‘Indonesian Mining Industry Survey 1999’, Global Energy and Mining
Group, Jakarta.
Transparency International, 2000, www.transparency.de, accessed on 16 May 2000.

� � � � � � � � � � � � � � � � � � � � � � � � �
�� ��!�

� � � � � � � �
�� � ���
����������������� ������
��������
• Since 1998, Indonesia has liberalised significantly its agricultural trade
and investment regimes; this should promote more efficient use of
agricultural land and resources, and rural income growth.
• Agriculture’s contribution to the economy is important but
diminishing, generating under 20 per cent of GDP but over 40 per cent
of employment.
• However, agricultural productivity in several sectors is below world
averages; the Government’s new ten point plan prioritises raising
agricultural productivity and farmers’ welfare, using programs to
increase rural credit facilities and infrastructure.
• Since the crisis, Indonesian markets have opened for key agricultural
commodities; this should benefit Australian exporters. More efficient
agricultural policies also should generate opportunities for
agricultural equipment and service exporters.
• Reforms liberalising foreign investor participation in plantations,
freshwater fisheries, milk processing and agricultural product
distribution offer good opportunities for agribusiness investment
based on technology transfer. Foreign investment in the food sector
markedly increased during 1999.

� � � � � � � � � � � � � � � � � �� � � � � � � � �
�� � ���
New reforms in agricultural trade and investment regimes should assist stronger and more efficient
growth in Indonesia’s agricultural sector. Furthermore, Indonesian demand for agricultural produce
will grow and diversify as incomes grow. Rising domestic demand, moderately low levels of agricultural
productivity and recent reforms generate many opportunities for Australian businesses, including
agricultural producers, agricultural and related equipment exporters, and agribusiness investors.
Agriculture is important to the Indonesian economy and society; it contributed around 19 per cent of
output and 41 per cent of employment in 1999 (Table 10.1).1 The Government is removing monopoly
importing and distribution mechanisms and high trade barriers that in the past hampered agricultural
trade and productivity growth. This chapter identifies recent reforms and developments, and the opportunities
for Australian agricultural product and equipment exporters and investors these reforms generate.
��������������������
Indonesia’s agricultural sector employs over 40 per cent of the population and is significant in world
terms, despite its declining share of output and exports. Indonesia is the world’s largest producer of
coconuts, second largest producer of copra, palm kernels, palm oil and natural rubber, and third
largest rice producer. The country has 19 million hectares of arable land, with rice and corn farming
representing almost 80 per cent of the total food crop area (Food and Agriculture Organisation, 1998).
Small scale subsistence farms account for about 87 per cent of total cultivated land; are labour
intensive; and grow predominantly food crops. Concentrated in Java, Sumatra and Sulawesi, these
farms produce 90 per cent of the country’s rice and corn.2 Large state owned and private estates
account for the remaining 13 per cent of cultivated land; they use hired or contracted labour and
engage in agribusiness and export cropping. Although estates account for a small share of total
agricultural output, they dominate agricultural exports. Major producers of rubber, palm oil, coffee
and cocoa are in Sumatra; rubber, cocoa and cashew nut plantations are in Sulawesi.
1 Until the mid 1970s, agriculture’s share of GDP exceeded that of other major sectors; however, this share fell as Indonesia’s
industrial development advanced.
2 Java accounts for around 60 per cent, Sumatra 20 per cent and Sulawesi 10 per cent.

� � � � � � � � � � �
� � � ���
T a b l e 1 0 . 1
�� ������ ��� ������������������ �������� � ��
Agricultural Growth, Share of GDP, Employment and Exports
Agriculture Industry Services
Per cent of GDP
1977 29.6 34.3 36.1
1987 23.4 36.3 40.3
1997 16.1 44.3 39.6
1999 19.5 45.3 35.2
Average annual growth
1980-90 3.4 6.9 7.0
1990-98 2.8 9.9 7.2
1997 1.0 5.2 5.6
1998 0.8 -15.1 -16.2
Per cent of employment
1996 44.0 14.7 41.3
1997 41.1 14.0 44.9
1998 44.9 11.3 43.8
1999 41.0 14.1 44.9
Per cent of total exports Oil/gas Industry
1994 7.0 24.7 63.3 5.0
1995 6.1 22.1 66.7 5.2
1996 5.9 24.2 64.8 5.1
1997 5.6 20.8 66.8 6.8
1998 7.2 14.7 73.6 4.5
1999 5.8 20.0 68.2 6.1
Note: Industrial exports also include processed metals and minerals.
Source: Asian Development Bank, 1999; and CIEC, 2000.
Given rural workers generally have small plots and low wages, dismantling agricultural trade barriers,
along with improved rural credit and agricultural extension services should help rationalise agricultural
production and raise productivity; this is generally low compared to other sectors and agricultural
sectors elsewhere (Table 10.2). At the margin, land use could shift from low value, low return crops
like rice and maize into more labour intensive, higher value added crops and activities including fruit
and vegetable growing, chicken and livestock rearing, and fish farming.
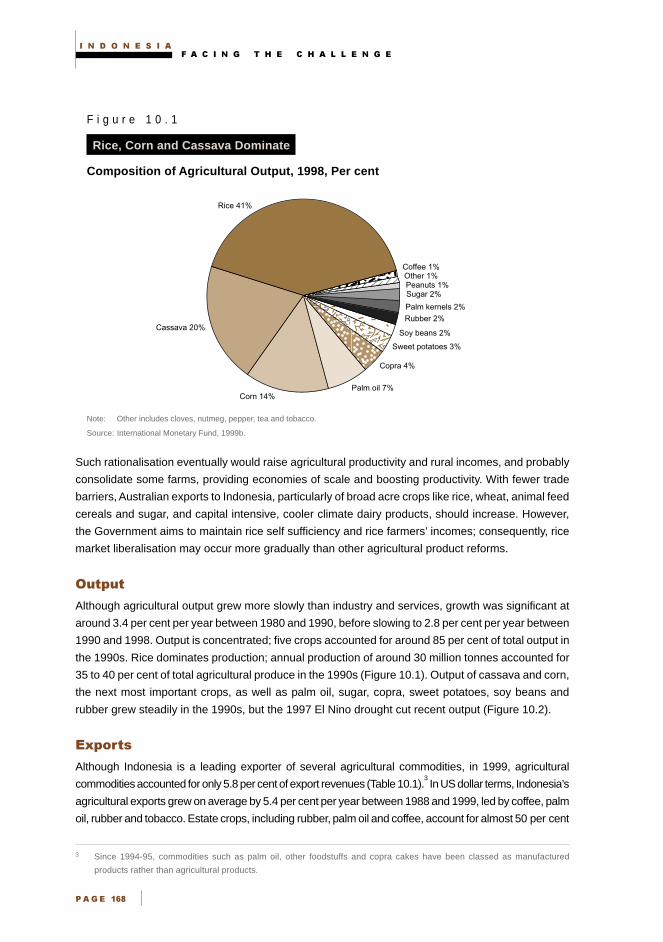
� � � � � � � � � � � � � � � � � �� � � � � � � � �
�� � ��
F i g u r e 1 0 . 1
Rice, Corn and Cassava Dominate
Composition of Agricultural Output, 1998, Per cent
Note: Other includes cloves, nutmeg, pepper, tea and tobacco.
Source: International Monetary Fund, 1999b.
Such rationalisation eventually would raise agricultural productivity and rural incomes, and probably
consolidate some farms, providing economies of scale and boosting productivity. With fewer trade
barriers, Australian exports to Indonesia, particularly of broad acre crops like rice, wheat, animal feed
cereals and sugar, and capital intensive, cooler climate dairy products, should increase. However,
the Government aims to maintain rice self sufficiency and rice farmers’ incomes; consequently, rice
market liberalisation may occur more gradually than other agricultural product reforms.
������
Although agricultural output grew more slowly than industry and services, growth was significant at
around 3.4 per cent per year between 1980 and 1990, before slowing to 2.8 per cent per year between
1990 and 1998. Output is concentrated; five crops accounted for around 85 per cent of total output in
the 1990s. Rice dominates production; annual production of around 30 million tonnes accounted for
35 to 40 per cent of total agricultural produce in the 1990s (Figure 10.1). Output of cassava and corn,
the next most important crops, as well as palm oil, sugar, copra, sweet potatoes, soy beans and
rubber grew steadily in the 1990s, but the 1997 El Nino drought cut recent output (Figure 10.2).
������
Although Indonesia is a leading exporter of several agricultural commodities, in 1999, agricultural
commodities accounted for only 5.8 per cent of export revenues (Table 10.1).3 In US dollar terms, Indonesia’s
agricultural exports grew on average by 5.4 per cent per year between 1988 and 1999, led by coffee, palm
oil, rubber and tobacco. Estate crops, including rubber, palm oil and coffee, account for almost 50 per cent
3 Since 1994-95, commodities such as palm oil, other foodstuffs and copra cakes have been classed as manufactured
products rather than agricultural products.
Rice 41%
Cassava 20%
Corn 14%Palm oil 7%
Copra 4%
Sweet potatoes 3%
Soy beans 2%
Rubber 2%Palm kernels 2%
Sugar 2%Peanuts 1%
Coffee 1%Other 1%

� � � � � � � � � � �
� � � ��!
F i g u r e 1 0 . 2
Production of Most Crops Static
Output of Key Agricultural Commodities
Source: Cabalu, 2000.
of agricultural exports (International Monetary Fund, 1999a). Rupiah devaluations helped boost
agricultural exports, particularly during the post crisis period (Appendix Table 10.1) (United States
Department of State, 2000). Despite this, except for the 1998 crisis year, the share of agricultural
exports in total exports declined steadily throughout the 1990s, reflecting rapid growth in manufacturing
and oil exports.
������������
The agricultural sector’s disproportionately large share of employment compared to output implies
labour productivity is lower than in industry and services. Small scale subsistence farming dominates,
with few economies of scale, reliance on labour intensive technologies, and poor access to credit
and other key inputs.4
A rapidly growing population and slowly growing productivity cause periodic shortages of key foods
including rice, and failure to achieve the government’s objective of rice self sufficiency. Rice productivity
grew strongly during the 1980s owing to new high yield varieties, new irrigation schemes and state
assistance through subsidised inputs and technical advice. Indonesian rice productivity now is above
world average and significantly higher than that of Thailand and the Philippines, although below
China and Australia (Table 10.2). However, productivity growth waned in the early 1990s, due mainly
to lack of competition with imports and minimal consolidation of producers; hence the Government
imported 5 million tonnes of rice between 1995 and 1997. With the 1997 drought, rice imports rose
further to 5.9 million tonnes in 1998 and 3.6 million tonnes in 1999 (Table 10.4) (Economist Intelligence
Unit, 2000).
4 Typically, farms are less than 5 hectares, with the average size around 1 hectare.
0
5
10
15
20
25
30
CoffeeTeaDry Rubber
20001999199819971996199519940
10 000
20 000
30 000
40 000
50 000
60 000
MaizeCassava Rice
199919981997199619951994
Ton
nes
(’000
)
Ton
nes
(’000
)

� � � � � � � � � � � � � � � � � �� � � � � � � � �
�� � ��
���������������� ������ ����
Since the mid 1960s, the Indonesian Government has targeted self sufficiency particularly in
rice, at stable and affordable prices. Government schemes provided price support for domestic
producers, reduced agriculture taxes, erected extensive import barriers, provided irrigation
infrastructure, subsidised credit, fertilisers and pesticides, and disseminated high yield seed
varieties. By the mid 1980s, 85 per cent of rice farmers used high yield variety seeds, compared
with 50 per cent in 1975, and Indonesia was self sufficient in rice.
The Government established Badan Urusan Logistik, BULOG, to control the domestic price
of rice using a buffer stock arrangement. BULOG also monopolised the import of staples
such as wheat, flour, sugar and garlic (Department of Foreign Affairs and Trade, 2000; and
Library of Congress, 2000).
Rice shortages in the late 1990s and new reforms led authorities to restructure BULOG’s role
in the rice market. Now BULOG targets food security through subsidising rice, rather than
stabilising retail prices or building up large, costly public stocks (International Monetary Fund,
1999b). Rice varieties only BULOG previously imported attract a transitional 30 per cent
import duty of Rp. 430 per kilogram, to protect domestic producers against a fall in income
(Cabalu, 2000). Following a critical state audit, BULOG also plans to adopt a more transparent
accounting system and efficient operating structure.
Several key crops, including maize and soy beans which do not receive intensive public
assistance, suffer from low productivity (Table 10.2).
Post crisis agricultural trade reform should assist Indonesia meet its food security objectives,
even if Indonesia moves away from its rice self-sufficiency policy. This is because major food
exporting countries like Australia and Thailand will increase capacity to meet Indonesian food
production shortfalls, reducing variations in food prices due to local weather patterns.
�������������� ������������������������� �����������
New reforms extended the Government’s mid 1990s trade liberalisation program into agricultural
trade and marketing. Extensive agricultural trade and market reforms provide important opportunities
for Australian exporters, and more relaxed foreign investment laws allow Australian investment in
commercial plantations.
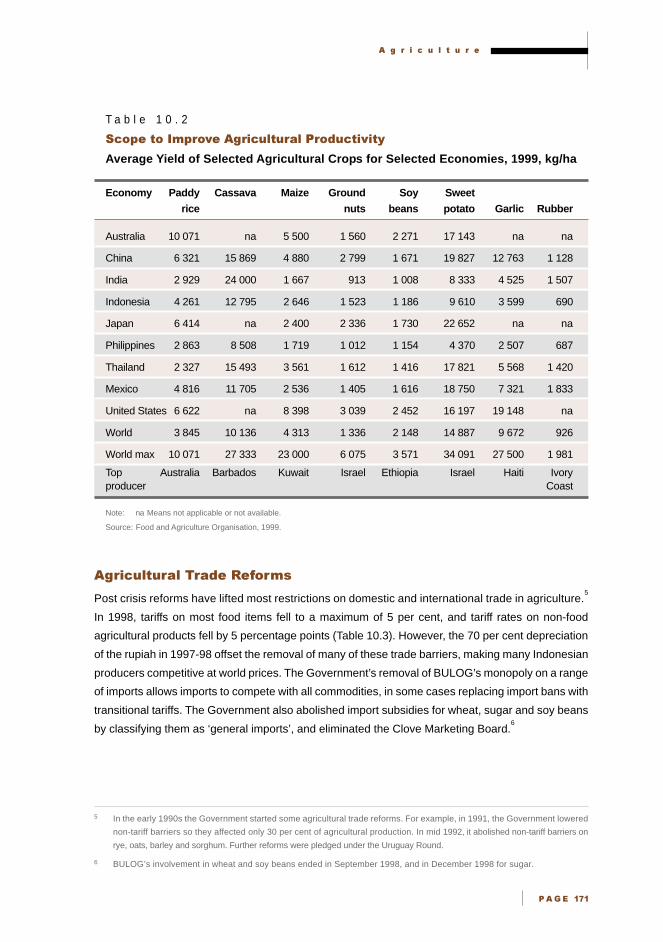
� � � � � � � � � � �
� � � ��
T a b l e 1 0 . 2
�� ������! ������ ������ ���� ���������"
Average Yield of Selected Agricultural Crops for Selected Economies, 1999, kg/ha
Economy Paddy Cassava Maize Ground Soy Sweet
rice nuts beans potato Garlic Rubber
Australia 10 071 na 5 500 1 560 2 271 17 143 na na
China 6 321 15 869 4 880 2 799 1 671 19 827 12 763 1 128
India 2 929 24 000 1 667 913 1 008 8 333 4 525 1 507
Indonesia 4 261 12 795 2 646 1 523 1 186 9 610 3 599 690
Japan 6 414 na 2 400 2 336 1 730 22 652 na na
Philippines 2 863 8 508 1 719 1 012 1 154 4 370 2 507 687
Thailand 2 327 15 493 3 561 1 612 1 416 17 821 5 568 1 420
Mexico 4 816 11 705 2 536 1 405 1 616 18 750 7 321 1 833
United States 6 622 na 8 398 3 039 2 452 16 197 19 148 na
World 3 845 10 136 4 313 1 336 2 148 14 887 9 672 926
World max 10 071 27 333 23 000 6 075 3 571 34 091 27 500 1 981
Top Australia Barbados Kuwait Israel Ethiopia Israel Haiti Ivoryproducer Coast
Note: na Means not applicable or not available.
Source: Food and Agriculture Organisation, 1999.
�!����"���#"��#�$�$%��&�
Post crisis reforms have lifted most restrictions on domestic and international trade in agriculture.5
In 1998, tariffs on most food items fell to a maximum of 5 per cent, and tariff rates on non-food
agricultural products fell by 5 percentage points (Table 10.3). However, the 70 per cent depreciation
of the rupiah in 1997-98 offset the removal of many of these trade barriers, making many Indonesian
producers competitive at world prices. The Government’s removal of BULOG’s monopoly on a range
of imports allows imports to compete with all commodities, in some cases replacing import bans with
transitional tariffs. The Government also abolished import subsidies for wheat, sugar and soy beans
by classifying them as ‘general imports’, and eliminated the Clove Marketing Board.6
5 In the early 1990s the Government started some agricultural trade reforms. For example, in 1991, the Government lowered
non-tariff barriers so they affected only 30 per cent of agricultural production. In mid 1992, it abolished non-tariff barriers on
rye, oats, barley and sorghum. Further reforms were pledged under the Uruguay Round.
6 BULOG’s involvement in wheat and soy beans ended in September 1998, and in December 1998 for sugar.
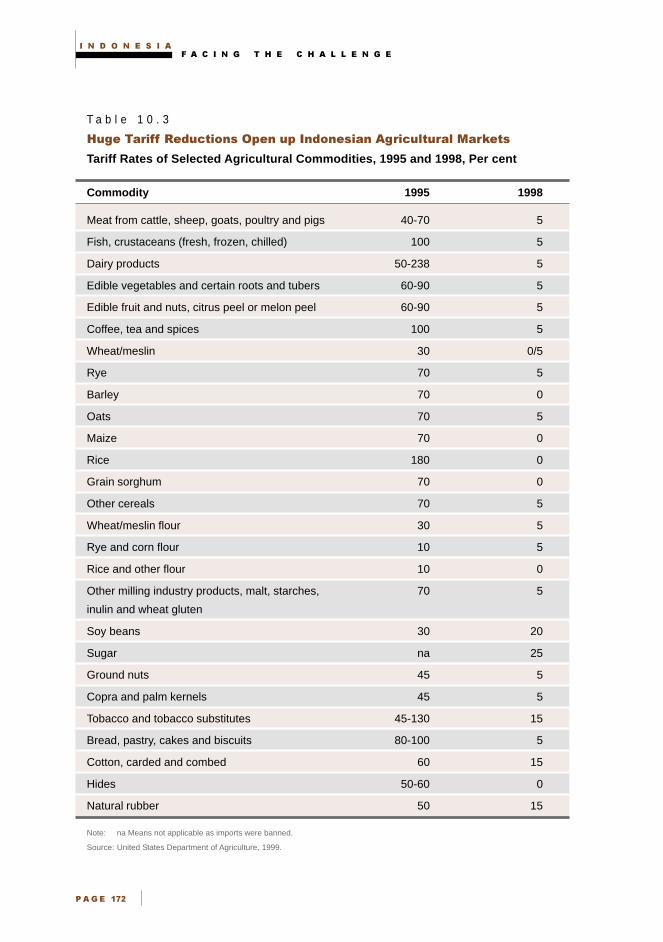
� � � � � � � � � � � � � � � � � �� � � � � � � � �
�� � ��"
T a b l e 1 0 . 3
#����� �$$������������� ���� �������������� ������ ���%� &���
Tariff Rates of Selected Agricultural Commodities, 1995 and 1998, Per cent
Commodity 1995 1998
Meat from cattle, sheep, goats, poultry and pigs 40-70 5
Fish, crustaceans (fresh, frozen, chilled) 100 5
Dairy products 50-238 5
Edible vegetables and certain roots and tubers 60-90 5
Edible fruit and nuts, citrus peel or melon peel 60-90 5
Coffee, tea and spices 100 5
Wheat/meslin 30 0/5
Rye 70 5
Barley 70 0
Oats 70 5
Maize 70 0
Rice 180 0
Grain sorghum 70 0
Other cereals 70 5
Wheat/meslin flour 30 5
Rye and corn flour 10 5
Rice and other flour 10 0
Other milling industry products, malt, starches, 70 5
inulin and wheat gluten
Soy beans 30 20
Sugar na 25
Ground nuts 45 5
Copra and palm kernels 45 5
Tobacco and tobacco substitutes 45-130 15
Bread, pastry, cakes and biscuits 80-100 5
Cotton, carded and combed 60 15
Hides 50-60 0
Natural rubber 50 15
Note: na Means not applicable as imports were banned.
Source: United States Department of Agriculture, 1999.
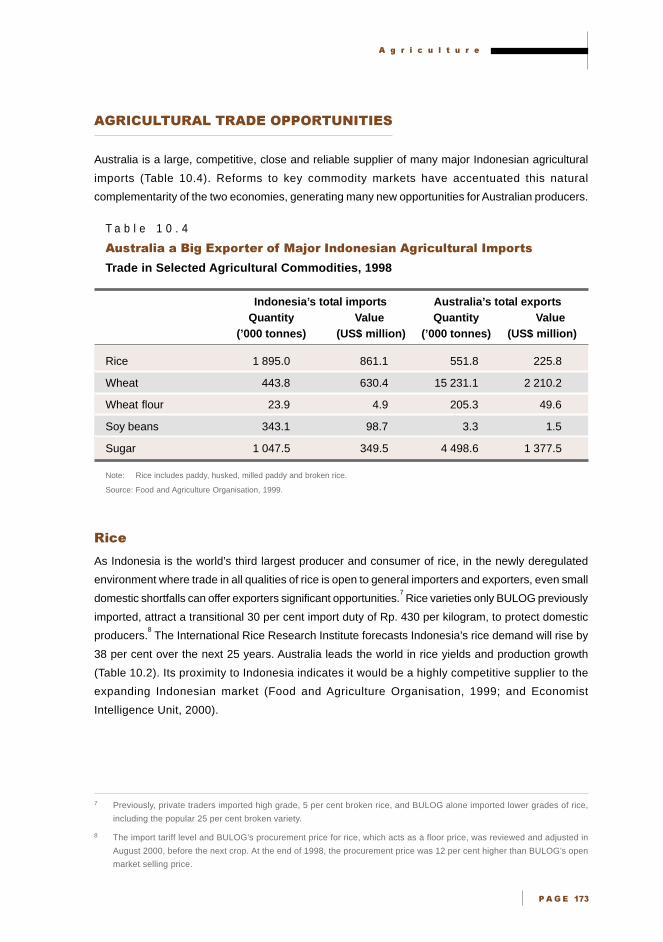
� � � � � � � � � � �
� � � ��#
����������������������������
Australia is a large, competitive, close and reliable supplier of many major Indonesian agricultural
imports (Table 10.4). Reforms to key commodity markets have accentuated this natural
complementarity of the two economies, generating many new opportunities for Australian producers.
T a b l e 1 0 . 4
���� �������'����� � �� ��$�%�(� �������������� ������ ����! � ��
Trade in Selected Agricultural Commodities, 1998
Indonesia’s total imports Australia’s total exportsQuantity Value Quantity Value
(’000 tonnes) (US$ million) (’000 tonnes) (US$ million)
Rice 1 895.0 861.1 551.8 225.8
Wheat 443.8 630.4 15 231.1 2 210.2
Wheat flour 23.9 4.9 205.3 49.6
Soy beans 343.1 98.7 3.3 1.5
Sugar 1 047.5 349.5 4 498.6 1 377.5
Note: Rice includes paddy, husked, milled paddy and broken rice.
Source: Food and Agriculture Organisation, 1999.
���$
As Indonesia is the world’s third largest producer and consumer of rice, in the newly deregulated
environment where trade in all qualities of rice is open to general importers and exporters, even small
domestic shortfalls can offer exporters significant opportunities.7 Rice varieties only BULOG previously
imported, attract a transitional 30 per cent import duty of Rp. 430 per kilogram, to protect domestic
producers.8 The International Rice Research Institute forecasts Indonesia’s rice demand will rise by
38 per cent over the next 25 years. Australia leads the world in rice yields and production growth
(Table 10.2). Its proximity to Indonesia indicates it would be a highly competitive supplier to the
expanding Indonesian market (Food and Agriculture Organisation, 1999; and Economist
Intelligence Unit, 2000).
7 Previously, private traders imported high grade, 5 per cent broken rice, and BULOG alone imported lower grades of rice,
including the popular 25 per cent broken variety.
8 The import tariff level and BULOG’s procurement price for rice, which acts as a floor price, was reviewed and adjusted in
August 2000, before the next crop. At the end of 1998, the procurement price was 12 per cent higher than BULOG’s open
market selling price.

� � � � � � � � � � � � � � � � � �� � � � � � � � �
�� � ��$
'($#�#)�'($#� "���
Currently, Indonesia is Australia’s second largest wheat export market, consuming up to 4 million tonnes
of wheat annually. Wheat is used primarily in noodles and bread. With all wheat import barriers
recently removed, new opportunities should open for wheat exports, but the removal of subsidies on
wheat flour imports may partially offset them.9 Liberalisation of flour milling has increased raw wheat
imports as domestic flour now competes with imports. Six months after the market was liberalised,
Indonesia imported a substantial 150 000 metric tonnes of flour and wheat based pre-mixes (Cabalu, 2000).
��� $#)�
Soy beans are an increasingly important and popular secondary source of protein in the Indonesian
diet, primarily as tofu and tempe, with annual per capita consumption of over six kilograms. Most
current soy bean imports come from the United States, Latin America and India. Since BULOG’s
monopoly ended, private sector imports of soy beans have increased due to their significantly lower
prices.10
Australia’s soy bean production is concentrated in the high quality market, for which demand
is currently small. However, as incomes rise, so should consumption, boosting opportunities for
Australian producers (Austrade, 2000).
��!#�
Current annual per capita consumption of sugar of 14 to 15 kilograms should grow rapidly with rising
incomes, boosting imports. A transitional 25 per cent tariff replaced a sugar import ban, opening the
market. Australia’s efficient sugar industry, with yields well above world average and a significant
export capacity, is well placed to access these opportunities (Tables 10.2 and 10.4).11
$���"��$��
New reforms have opened up the import and distribution of fertilisers, including urea, super phosphate,
ammonium sulphate and potassium chloride, providing an opportunity for Australian exporters.12
����$��$� ����
Lower tariffs and a growing market boost export opportunities in the processed food industry (Table 10.3).
Although the local processed food sector is relatively large, valued at US$5.94 billion in 1997,
cooking oil and frozen seafood for export dominate and domestic per capita consumption is only
US$30 per year.13
Hence, potential for market growth is considerable. The urban middle class, which
comprise 20 per cent of the population, consume most processed food; the staple unprocessed
village diet consists mainly of rice, vegetables, eggs, chicken and meat.
9 The pre-crisis subsidy on wheat flour imports reduced flour prices by about 40 per cent. However, without the subsidy,
prices of wheat products are likely to rise, so wheat import demand probably will fall. Despite lower import demand, Australian
wheat exports are more competitive than competing exports from the United States because of the weaker Australian dollar.
10 Domestic retail prices are about US$395 per tonne, over US$100 per tonne above world prices (United States Department
of Agriculture, 1999).
11 Australia was the world’s sixth largest producer of sugar cane and second largest exporter in 1999.
12 PT Pusri, a state owned firm, previously was the monopoly distributor of all types of fertilisers, such as urea, super phosphate,
ammonium sulphate and potassium chloride, for farmers. PT Pusri now is responsible only for procuring and distributing
subsidised fertilisers, and maintaining buffer stocks.
13 The most recent year for which data are published.

� � � � � � � � � � �
� � � ���
F i g u r e 1 0 . 3
Oils Dominate Food Processing Industry
Indonesia’s Food Processing Industry, 1997, Total Value: US$5.9 billion
Source: Cabalu, 2000.
Australian export opportunities exist in frozen and chilled meat, which is highly competitive and popular
in the Indonesian market. In addition, fresh fruit, dairy products, snack foods, wine and niche products
like frozen french fries and seasonings have gained good market acceptance. Demand for
confectionery and baking ingredients for the biscuit and snack food industry, and whey products for
the dairy and baking industry also is expanding.
�!����"���#"*���&$)�
Export opportunities for Australian suppliers also exist in food processing and packaging equipment.
Palm oil and sugar industry liberalisation is increasing demand for sugar processing machinery,
milling machinery, tractors, hydraulic excavators, motor graders, dryers for agricultural products,
backhoe loaders, machinery to extract fats or oils, and water tube boilers. The Indonesian market for
palm oil equipment has averaged 40 per cent growth per year since 1997. Total imports of palm oil
equipment, worth US$397 million in 1997, should grow at a rate of 30 per cent per year over the
next five years.
Development of Indonesia’s cold chain infrastructure also offers opportunities for the export of frozen
produce and cold storage equipment. Gradually, supermarkets are replacing village wet markets,
offering additional opportunities for exporters.
������+����)�% �$�(������$
Indonesian retailers vary greatly in their capacity and handling capabilities, constraining the distribution
of fresh produce, but providing opportunities for exporters to the distribution sector. Forklifts are rare
and only a few importers use pallets. Cold storage equipment is scarce. Although refrigerated truck
Other24%
Coffee beans2%
Bakery3%Food seasonings
4%
Wheat flour4%
Salt 5%
Noodles5%
Dairy products6%
Granulated sugar7%
Frozen seafood9%
Cooking oil14%
Crude vegetable oils17%

� � � � � � � � � � � � � � � � � �� � � � � � � � �
�� � ���
numbers are limited, trucking remains the preferred means to distribute fresh produce. Failure to
maintain adequate temperatures, lack of humidity control, scarcity of ethylene oxidisers to prevent
premature ripening and limited experience in implementing storage guidelines also hamper fresh
produce distribution. These factors may constrain short term exports of fresh produce, but imply opportunities
for Australian equipment exporters and logistics firms who could help overcome these difficulties.
�������������������� ������������
New reforms weaken the dominance of state banks in providing credit to the agricultural
sector, and provide opportunities for the Australian finance sector. Before the crisis, a network
of state owned regional development banks, village banks and cooperatives, and people’s
credit banks distributed subsidised credit, primarily for rice production (Lapenu, 1998). With
post crisis reforms, only commercial banks meet farmers’ credit requirements; they bear all
risks of non-repayment of principal and are fully autonomous in credit decision making. The
Government also will eliminate all lending quotas and targets for these institutions. Large
commercial banks, possibly including some Australian operators, are better suited to managing
risks in the sector.
Source: International Monetary Fund, 2000.
�������,������ ���
Reforms in mid 1998 liberalised foreign investment in plantations, including those producing palm oil
and sugar and finished/semi-finished rattan products, and eliminated restrictions on foreign investment
in the wholesale and retail trade, including distributing agricultural products. Foreign firms now can
operate retail outlets in most major urban areas, although restrictions remain in the provinces (United
States Department of Commerce, 1998; and Austrade, 1999).
In August 2000, the Government opened the freshwater fishery sector to foreign investment, including
freshwater turtles, tilapia nilotica, anguila, bullfrogs, freshwater giant shrimp, milk fish and thillapya.
Foreigners now can fish for demersal fish such as grouper, snapper and other varieties, except in the
Malacca Strait and Arafura Sea exclusive economic zones. The Government also liberalised milk
processing, in addition to repackaging powdered and sweetened condensed milk. Agricultural sectors
totally closed to any form of investment include exploiting natural forests, lumbering, collecting and
exploiting sponges, and producing alcoholic beverages such as spirits, wine and beer.14
The agriculture and food sectors attracted significant foreign investment applications from 1995 to 1997;
while these dipped sharply in 1998, domestic investment in some sectors started to recover in 1999
(Table 10.5). While foreign investment in plantations and food crops is still below pre-crisis peaks,
food industry investment is recovering well.
14 Indonesia’s New Negative Investment List can be retrieved electronically from www.usembassyjakarta.org/econ/
investment0800.html.

� � � � � � � � � � �
� � � ���
Since the agricultural sector opened to foreign investment, some established plantation firms have
sought foreign joint venture partners to boost expertise and capital investment. Some state agribusiness
enterprises also are available for purchase under the privatisation program.
T a b l e 1 0 . 5
)� ���������*�!������������!������+�
Domestic and Foreign Investment Approvals, 1995-99
1995 1996 1997 1998 1999
Domestic
Plantation and food crops
Number of projects 55 123 127 33 16
Value of projects (US$ millions) 723.3 1 598.3 1 531.1 405.7 147.4
Food industry
Number of projects 72 53 53 32 28
Value of projects (US$ millions) 595.2 1 585.7 1 505.1 774.2 1 468.1
Total
Number of projects 775 810 718 324 237
Value of projects (US$ millions) 8 056.9 11 616.5 13 826.2 7 006.8 6 176.5
Foreign
Plantation and food crops
Number of projects 61 18 3 32 27
Value of projects (US$ millions) 1 104 1 168 234 949 508
Food industry
Number of projects 38 37 26 32 48
Value of projects (US$ millions) 1 332 691 573 342 681
Total
Number of projects 799 959 790 1 035 1 164
Value of projects (US$ millions) 39 945 29 929 33 833 13 563 10 891
Source: Cabalu, 2000.

� � � � � � � � � � � � � � � � � �� � � � � � � � �
�� � ��
���������������������� ��� �����
Strategically located on the world’s busiest shipping lane, Sumatra offers significant
opportunities for Australia. Agriculture contributes 35 per cent of the total provincial GDP, with
local firms profiting from rubber, palm oil, cocoa and coffee plantations, particularly since the
crisis. These operators plan to diversify, especially into processing and downstream activities,
providing considerable investment opportunities for Australia, including exporting agricultural
automation and equipment (Cabalu, 2000).
Increasingly, food, beverages and fishery businesses are interested in joint ventures with
foreigners. Australia’s success in the region’s agribusiness sector, including developing sugar
farming and feedlots, means it is well placed to contribute. A new Austrade office and branch
of the Indonesia-Australia Business Council, both in Medan, the capital, add to the support
network for Australian firms in the area.
Source: Austrade, 1999.
��,������������������������������
Investment opportunities in agriculture are promising, especially in agri-industry. Although scattered,
small scale farms can challenge foreign operators familiar with larger scale operations, rewards exist
for investors seeking joint ventures with local operators and offering networks disseminating technology,
credit, quality inputs and expertise.
��-)���$#&����$���)!
Investment opportunities exist in producing and processing estate crops like sugar and palm oil
milling; developing fisheries such as shrimp farming; capturing, producing and processing fish based
on deep sea fisheries and aquaculture; and raising livestock such as sheep and cattle by integrated
animal husbandry. Eastern Indonesia, Kawasan Timur Indonesia, including Kalimantan, Sulawesi,
Nusa Tenggara Barat and Irian Jaya are the most promising provinces for these sectors. Kawasan
Timur Indonesia offers relatively abundant underdeveloped natural resources, although infrastructure
and skilled human resources are considerably less developed than in the western region, Kawasan
Barat Indonesia.
Significant opportunities also exist in downstream processing of agricultural products. Investment in
food processing, including sauces, drink concentrates, noodles, biscuits, infant formulas and snack
foods, is increasing as local companies seek joint venture partners to inject much needed capital. Other
opportunities include food and estate crops and their downstream industries, aquaculture, including
inland and brackish water fisheries, marine fisheries and related processing industries. Palm oil
plantation and related processing; wood processing, including pulp, paper mill and medium density
fibres; furniture and handicrafts; and fruit processing, including pineapple canning and producing banana
puree, all are promising sectors. Investment in these sectors is prominent in foreign investment inflows.15
15 Of the 94 foreign investment plans approved in July 2000, around half were for investments in export and import
replacement sectors.
� � � � � � � � � � �
� � � ��!
Sale of IBRA assets and privatisation of state enterprises also presents opportunities for Australian
companies to acquire established agribusiness firms. Around 35 per cent of corporate assets held by
IBRA are in the agribusiness sector, with some to be sold in early 2001, including Indomarket, Indomilk
and Indomiwon. Thirty three state enterprises are in the agribusiness and consumer goods sector,
accounting for close to 15 per cent of all state enterprises by turnover. (See Chapter 3 - Foreign Investment.)
������������������������������� ����������
In August 2000, the Government opened the caged fish culture sector to foreign investment,
providing opportunities for investment, technology transfer and research. Australian has
expertise in caged fish culture and technology, with strong ties between the scientific community
and fishing industry, such as with Southern Bluefin Tuna. Australia also has expertise in
marketing live fish to markets in Asia and elsewhere.
Some Australian private companies accessing these opportunities include Western High Pty Ltd,
which began its association with a fish farm in Seram Island in 1997. This linkage helped the
original operators access Australian technologies, products and marketing networks. The
new operation has a centralised hatchery producing fingerlings grown cheaply in local village
waterways, with satellite aquaculture production based around the hatchery. Western High
supplied fingerlings, constructed cages and distributes premium fish in established markets
in western Indonesia, Hong Kong and Singapore.
This operation is part of a network of Australian and Indonesian expertise under the Australia
Indonesia Investment Area, with breeding research underway at the University of Tasmania
and Patimura University in Indonesia. (See box on Australia-Indonesia Development Area,
Chapter 5 - Australian Opportunities.) A Tasmanian net manufacturer and an Australian feed
provider, Pivot Nutrition, also are involved.
Source: Australia-Indonesia Development Area, 2000.
��������
Recent reforms in Indonesia’s agricultural trade and foreign investment regimes promise more rapid
and efficient growth in Indonesia’s agricultural sector. They also provide good prospects for Australia
to contribute expertise and investment to assist the sector’s growth. Australia’s competitive agricultural
exporters also are well placed to benefit from these reforms. Many bulk agricultural products like
wheat, rice and sugar now are freed from monopoly import arrangements and high non-tariff barriers.
The growth of Indonesia’s middle class suggests strong growth in demand for value added processed
agricultural products.
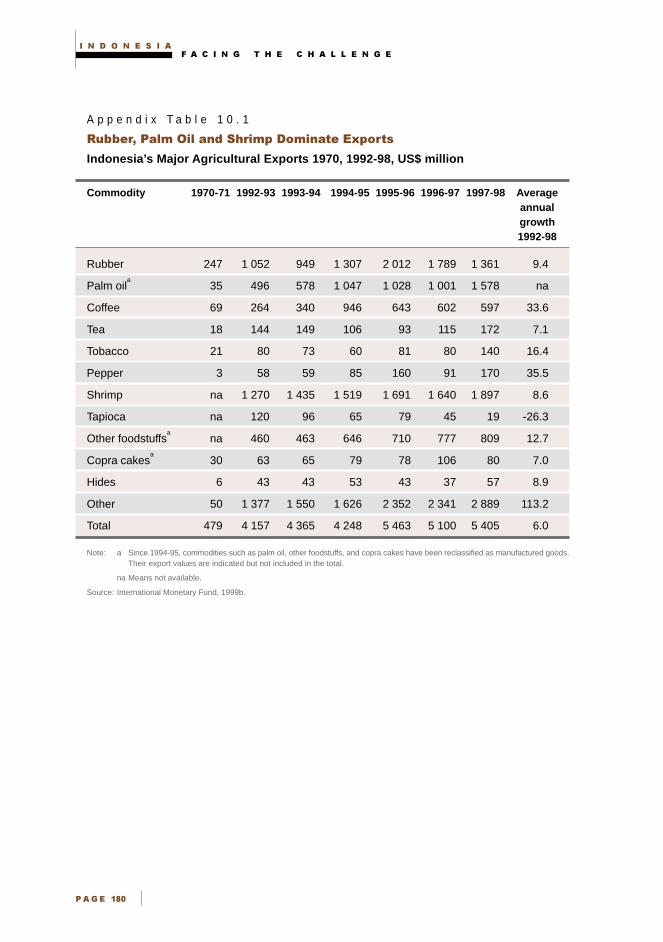
� � � � � � � � � � � � � � � � � �� � � � � � � � �
�� � �
A p p e n d i x T a b l e 1 0 . 1
����� �����!���������� �! �*�!�������� � ��
Indonesia’s Major Agricultural Exports 1970, 1992-98, US$ million
Commodity 1970-71 1992-93 1993-94 1994-95 1995-96 1996-97 1997-98 Averageannualgrowth1992-98
Rubber 247 1 052 949 1 307 2 012 1 789 1 361 9.4
Palm oila
35 496 578 1 047 1 028 1 001 1 578 na
Coffee 69 264 340 946 643 602 597 33.6
Tea 18 144 149 106 93 115 172 7.1
Tobacco 21 80 73 60 81 80 140 16.4
Pepper 3 58 59 85 160 91 170 35.5
Shrimp na 1 270 1 435 1 519 1 691 1 640 1 897 8.6
Tapioca na 120 96 65 79 45 19 -26.3
Other foodstuffsa
na 460 463 646 710 777 809 12.7
Copra cakesa
30 63 65 79 78 106 80 7.0
Hides 6 43 43 53 43 37 57 8.9
Other 50 1 377 1 550 1 626 2 352 2 341 2 889 113.2
Total 479 4 157 4 365 4 248 5 463 5 100 5 405 6.0
Note: a Since 1994-95, commodities such as palm oil, other foodstuffs, and copra cakes have been reclassified as manufactured goods.Their export values are indicated but not included in the total.
na Means not available.
Source: International Monetary Fund, 1999b.

� � � � � � � � � � �
� � � �
� ����
Asian Development Bank, 1999, Key Indicators of Developing Asian and Pacific Countries, Oxford
University Press, New York.
Austrade, 2000, Information supplied to the East Asia Analytical Unit by Paul Martins and Timotius
Wirawan, November, Jakarta.
___ 1999, ‘General Investment Policy’ in Establishing a Business Presence: Indonesia,
www.austrade.gov.au/IOOM/INDONESIA, accessed on 17 May 2000.
Australia-Indonesia Development Area, 2000, ‘Opportunities in AIDA’, www.aibc.net.au/aidaopps.htm,
accessed on 11 October 2000.
Cabalu, H., 2000, ‘Report to the East Asia Analytical Unit on the Indonesian Agricultural Sector’, Perth.
CEIC, 2000, Asian Economic Database, Hong Kong, accessed on 5 October 2000.
Department of Foreign Affairs and Trade, 2000, Indonesia: Country Fact Sheet, www.dfat.gov.au/
geo/fs/indo.pdf, accessed on 11 October 2000.
Economist Intelligence Unit, 2000, Country Report First Quarter 2000: Indonesia, EIU, London.
Food and Agriculture Organisation, 1999, ‘The State of Food Insecurity in the World 1999’, www.fao.org,
accessed on 10 May 2000.
___ 1998, ‘Special Report: FAO/WFP Crop and Food Supply Assessment Mission to Indonesia’,
www.fao.org/giews/english/alertes/1998/srins984.htm, accessed on 8 May 2000.
International Monetary Fund, 2000, ‘Letter of Intent’, May, 2000.
___ 1999a, ‘Indonesia: Statistical Appendix’, IMF Staff Country Report 99/39, IMF, Washington DC.
___ 1999b, IMF, ‘Statement of Development Policy’, IMF, Washington DC.
Lapenu, C., 1998, ‘Indonesia’s Rural Financial System: the Role of the State and Private Institutions,
Sustainable Banking with the Poor’, Discussion Paper, www-esd.worldbank.org/html/esd/agr/sbp/.
Library of Congress, 2000, lcweb2.loc.gov, accessed on 17 October 2000.
United States Department of Agriculture, 1999, ‘Indonesia Agricultural Situation Food and Agricultural
Update: April 1999’, Global Agriculture Information Network Report No. ID9 028, Foreign
Agricultural Service, www.usda.gov, accessed on 17 May 2000.
United States Department of Commerce, 1998, ‘Investment Climate in Indonesia’, Washington DC.
United States Department of State, 2000, ‘FY 2000 Country Commercial Guide: Indonesia’,
Washington DC.

� � � � � � � � � � � � � � � � � �� � � � � � � � �
�� � � "

� � � � � � � �
�� ���
������������� ������������� ���
��������
• Indonesia’s relatively strong, short term recovery and post crisis
reforms are producing potential commercial opportunities for
Australian business. With fewer foreign investment barriers and some
acceleration in corporate restructuring, Indonesia could become a
more attractive investment prospect.
• Export-oriented and import replacing small and medium enterprise,
SME, sectors, are performing well. The weak rupiah, improving trade
finance and recovery in Indonesia’s trading partners favour export-
oriented industries and agribusiness; and as the low exchange rate
makes imports expensive, import substitution sectors are expanding
to supply the local market.
• Ongoing and planned sales of state owned assets in finance,
infrastructure, telecommunications, agribusiness and building
materials may offer a relatively narrow window of opportunity to
investors seeking to secure significant market shares.
• However, those considering such investments will need to undertake
thorough due diligence assessments and employ appropriate risk
management strategies.
• Australia and Indonesia’s commercial, bilateral relationship largely
withstood the financial crisis. However, viable Australian direct
investment in the Indonesian economy would strengthen ties further.
• Increasing productive, development enhancing, people-to-people
links, through student, academic and work exchanges between the
two countries is important.
• Developing longer term cooperation between major Australian and
Indonesian public institutions via long term training and technical
assistance should aid the Indonesian Government’s economic
governance program.

� � � � � � � � � � � � � � � � � � � � � � � � �
�� ���
With a population of 207 million, growth potential, strong people-to-people-links, complementary
economies and geographical proximity, Indonesia will remain an important commercial partner of
Australia. These factors also ensure maintaining strong commercial and political ties are an enduring
foreign policy priority for Australia.
������������� �����
While the financial crisis more seriously affected Indonesia than other East Asian economies, and
the political transition has delayed restructuring, Indonesia now is experiencing a relatively strong,
short term recovery. In late 2000, exports, consumption and all major sectors of the economy were
growing well, and GDP should expand 5 per cent over the full year. This growth should continue into
2001, but investment dipped again in late 2000, and medium to long term growth will depend on
whether the financial system can accommodate lending for new investment, which in turn, largely will
depend on effective corporate sector debt workouts and restructuring.
While debt workouts accelerated in late 2000 after two years of delays, a significant majority of the
corporate sector was insolvent; the Indonesian Bank Restructuring Agency, IBRA, considered 70 per
cent of these debtor firms could not be restructured and would be liquidated. This difficult and possibly
acrimonious process may take many years to resolve.1 However, until this is completed, and major
Indonesian commercial assets are relieved of their massive leveraging and can raise capital to expand,
this will constrain growth.
As in the Republic of Korea and Thailand, efficient export-oriented firms will be the first to access
new investment funds through the banks and share market, and generate growth. Currently many
small and medium enterprises, SMEs, which carry little debt, also are prospering as they meet robust
domestic demand, including for many previously imported goods. However, unless SMEs can access
finance, they will reach maximum capacity, and this will limit their further growth.
������������������������
Both export-oriented and import replacing SME sectors can provide opportunities for Australian
investors, as can ongoing and planned sales of state owned assets. Subdued foreign investment
should recover as Indonesia’s economic recovery gathers pace, and increased trade competitiveness
and opportunities in the import-substitution sectors boost interest. Already the low real exchange
rate and the recovery in Indonesia’s trading partners are helping export-oriented industries and
agribusiness. Consumption is rebounding but imports are costly with the weak rupiah, so import
substitution sectors are in a strong position to supply the local market.
With balance sheets largely unaffected by the financial crisis, SMEs are performing particularly well.
Because many successful local firms find growth constrained by lack of access to bank finance,
some seek joint venture partners.
1 Court liquidations of the much smaller number of corporates that failed during Australia’s late 1980s banking crisis took
about a decade to resolve.
� � � � � � � � � � �
�� ��!
The increasingly liberal foreign investment regime also enables 100 per cent foreign ownership in
most sectors. Firms with sufficient local knowledge and experience may seek the flexibility of this
ownership and management model.
The crisis severely affected sectors of the economy like banking, real estate, retailing and tourism,
and the large conglomerate sector; however, increasingly these are undergoing government driven
restructuring, and in some cases, liquidation. As restructuring continues, binding fiscal imperatives
should ensure the Government eventually sells a significant share of these firms’ assets. Many of
these assets could provide good investment opportunities. However, thorough due diligence is essential
to ensure assets have valid titles and are unencumbered by debt and other claims. When investors
consider acquiring ongoing commercial enterprises, they need to discuss their intended business
plans with existing management, workers and in some cases, landowners and the local community,
to ensure support.
To date, with a few notable exceptions, Australian business has shown little interest in investing in
Indonesian banking and corporate sector assets. However, in 2001, the Indonesian economy should
continue to recover, and if reform and restructuring progress, the exchange rate stabilises or
appreciates, and sovereign risk remains manageable, interest in these assets is likely to grow.
From 1998 to September 2000, the Indonesian Bank Restructuring Agency, IBRA, earned US$4 billion
from asset sales, and interest and dividends on its assets; however, it still controls assets with a face
value of US$65 billion; 50 to 70 per cent of these may be liquidated. Given the rupiah’s low value,
assets in export-oriented and import replacing sectors, particularly those with a high local content,
could attract Australian investors. In addition, for those seeking to secure significant market shares
in major sectors like finance, infrastructure, telecommunications, agribusiness and building materials,
government asset sales may represent a relatively narrow window of opportunity. Those interested in
government asset sales should visit IBRA’s web site, www.bppn.go.id.
Although potential investors may face variable accounting standards, related company liabilities,
debt obligations on assets, non-commercial contracts, an unpredictable legal system and
uncooperative management and staff, many potentially attractive assets should be for sale as the
economy recovers. Austrade and major Australian legal, accounting and consulting firms operating
in Jakarta can assist interested Australian investors in investigating potential investments. (See the
end of this report for contact details.)
������
Mining provides an important source of export earnings and budget revenue. Indonesia is highly
prospective, and despite recent tax increases, still has an internationally competitive tax and royalty
regime. As an export-oriented sector not reliant on local financing, some mines have become more
profitable since the crisis, particularly as commodity prices have recovered. However, since the
crisis, security and illegal mining in the isolated regions in which mining occurs, have developed as
major challenges. Recent changes to environmental regulations, which often now exceed international
norms, undermine the sector’s competitiveness and expose miners to regulatory and legal risks.

� � � � � � � � � � � � � � � � � � � � � � � � �
�� ��"
Political devolution also creates uncertainty for miners, including concern about the status of contracts
of work, future taxation liabilities and likely changes in approval procedures. These developments
increase the need for miners to monitor closely regulatory and political developments, and strengthen
relationships with landowners, communities and all three levels of government.
� ���!"��#������������������
Significant opportunities exist for Australian exporters to consolidate and expand their presence in
traditional Indonesian markets, as well as to access many new market opportunities resulting from
the Indonesian Government’s trade reforms.
Agricultural commodities
Reduced trade barriers, the weak Australian dollar and recovering Indonesian consumption are helping
demand for Australian agricultural exports to Indonesia recover. In the medium term, demand for
broadacre crops like cotton, rice, wheat, soy beans, sugar and other cereals, including animal feed,
should expand well. Indonesian land allocation increasingly should favour higher value added, more
labour intensive agricultural activities like tropical fruit and vegetable growing, and several plantation
crops. Australia’s cotton exports were very resilient throughout the crisis, and should expand further,
given Indonesia’s internationally competitive export-oriented textile sector. Live animal exports are
recovering well from crisis induced falls and should continue to recover. Demands for greater
productivity in the agricultural sector provide new opportunities for exports of fertilisers and agricultural
machinery. In all these commodities, Australia compares well to major competitors like the United
States.
Processed food
Improved consumer confidence, recovering middle class incomes, declining trade barriers and the
weak Australian dollar have helped Australian exports of processed foods resume their pre-crisis
expansion, providing new trade and investment opportunities. In the short to medium term, these
factors should drive rapid growth in Indonesian imports of Australian products like frozen meat and
dairy products. They also should generate opportunities to expand exports of land and capital intensive
products, like temperate climate fruit juices, breakfast cereals, and canned and dried temperate
climate fruits.
Transport vehicles
Since 1998, the Indonesian Government has reduced significantly tariffs on components and many
vehicles, and abolished non-tariff barriers embodied in the national car plan, opening up significant
export opportunities in this market. While car tariffs are still high at 35 to 80 per cent, they are well
below the pre-crisis 200 per cent, and Australian car exports are increasing rapidly from a low base.
Educational exports
Australia is the largest exporter of education services to Indonesia. While the crisis cut into education
exports, these are recovering strongly, reflecting the competitive Australian dollar, robust demand from

� � � � � � � � � � �
�� ��#
middle class Indonesians, and strong links between Australian and Indonesian educational institutions.
These factors should underpin continued medium term growth, offering new opportunities for Australian
educational institutions to supply vocational, undergraduate and graduate training both in Australia
and Indonesia. Post crisis reforms allow foreign investment in educational institutions, including joint
Australian-Indonesian campuses in Indonesia.
Other services
Fewer foreign investment restrictions also drive new opportunities in providing medical, financial, IT,
legal and accounting services. Opportunities for joint private-public sector partnerships to provide
support services to corporate and economic governance programs under the Australian aid program
are discussed below.
������������� ����� ���
The strong commercial relationship between Australia and Indonesia largely withstood the financial
crisis. Promoting this aspect of the relationship and increasing productive, development enhancing,
people-to-people links are important in strengthening ties between the two countries.
�$���������������%
While Australia traditionally has a strong trading relationship with Indonesia, Australian direct investment
is weaker outside the mining sector. Major post crisis foreign investment reforms and government
asset sales provide a historical opportunity to strengthen Australian direct investment in Indonesia,
thereby securing a more significant Australian presence in Indonesian markets, and deepening
commercial and people-to-people ties. The Australian Government can help Australian business
recognise and access viable opportunities.
This report highlights emerging commercial opportunities in Indonesia; seminars around Australia
based on this report should increase business awareness of developments. Further the Australian
Government’s support for IBRA’s Australian roadshow in December 2000 should promote knowledge
of Indonesian investment opportunities associated with asset sales. In 2001, similar events may
occur. Other activities to promote business awareness of, and realistic assessment of investment
opportunities also could be valuable.
�������������"��!�����
Australian governments could help expand Australia’s trade and investment presence in Indonesia
by leading high level business missions to the country. For example, in March 2000, the Australia-
Indonesia Institute led a delegation of senior Australian business people to Indonesia. The delegation
was welcomed by President Wahid, the Coordinating Minister for Economics, the Minister for Trade
and Industry, and the Attorney General.
� � � � � � � � � � � � � � � � � � � � � � � � �
�� ���
�� ���!�������&���������������"�'�
By increasing market confidence in Indonesian capital markets, ongoing Australian assistance to
support Indonesia’s economic and corporate governance strengthening programs also could help
increase Australian portfolio and other capital flows, including bank credit and trade financing to
Indonesia. Assistance to establish ratings firms and strengthen prudential controls on banks, securities
and bond markets and corporate governance all could encourage more Australian institutional and
private investors to consider investing in Indonesia.
� ���$����������(��(���������%
Developing people-to-people links through educational institution cooperation, and student and young
worker exchanges can strengthen and deepen bilateral ties. Australia already offers considerable
support for Indonesia’s democratisation process, including supporting institutions with key roles in
promoting civil and political rights, legal system operation and transparency.
�)� !����!"����*�
Many Australian universities already have strong links with Indonesian universities at the faculty
level, and expanding these could enhance bilateral ties. Australian institutions could play a valuable
role in strengthening course development, assisting lecturer education and training, through long
and short term courses, and helping develop and staff new postgraduate courses in Indonesian
universities. Australian universities also could consider establishing Indonesian campuses, as they
have in several other East Asian economies. Offshore masters courses are in particularly high demand.
Assistance could fund full in-country course delivery of appropriate courses more cost effectively
than bringing students to Australia.2
AusAID’s TechVoc project already provides considerable assistance for delivering technical courses
in Indonesia. However, Australian TAFE colleges could be encouraged to develop and deliver appropriate
technical and vocational training courses, including at joint campuses, on a fee paying basis.
��)�����# &!����
Several Australian educational institutions already send students to Indonesia and receive Indonesian
students for periods of a semester to a year, as part of their degree courses. This is valuable for the
students concerned and the host institutions, and important in increasing people-to-people links. The
Department of Education, Training and Youth Affairs, DETYA, currently funds approved Australian
student exchanges under University Mobility in Asia and the Pacific program grants. Thailand also
contributes to this scheme to send its students to Australia, but Indonesia has not yet put funding into
this scheme. DETYA already provides some facilitation services so compatible institutions can contact
each other; AusAID could consider subsidising appropriate Indonesian students’ fares, fees and
living expenses while in Australia.
2 Where Australian institutions develop appropriate graduate courses in Indonesia on a full fee paying basis, assistance
could broaden the scope of courses provided and assist Indonesian students who cannot pay full commercial fees to
access these institutions and courses.

� � � � � � � � � � �
�� ��$
+���&�,��*��#������ �� &���
Another important means of deepening people-to-people links and future commercial ties is through
youth work exchanges. The Australian Government already conducts an annual youth exchange
program with Indonesia under the auspices of the Australia-Indonesia Institute. However, its scope is
limited. Up to 36 participants undertake unpaid job placements and community service work from
home-stay accommodation. The Australia-Indonesia Institute funds the program. The Indonesian
Department of Education occasionally has made informal approaches regarding the possibility of a
scheme to enable young entrepreneurs from each country to gain paid work experience and business
qualifications. Australia could consider ways of expanding the Australia-Indonesia Institute program
to allow more young Indonesians and Australians with relevant educational and skill backgrounds to
gain knowledge of each others’ countries and undertake valuable in-country work experience. This
could run in tandem with internships at universities, in public agencies and with major Australian
firms with a presence in Indonesia, and could enable participants to undertake paid work.
&�"!��&����!�)���!�����
The Australian aid program already provides around A$27 million per year to fund scholarships for
750 Indonesian students to study in Australian universities. Scholarships provide valuable training to
help gifted young Indonesians contribute more to Indonesian development, and develop important
long term people-to-people linkages. Australia could consider using more of these scholarships for
officers from key economic and legal institutions to support Indonesia’s economic reform agenda.
����������������������-"� ������������!"����*�
AusAID’s new Australia-Indonesia Development Cooperation Program (2000-03) continues to give
high priority to supporting Indonesian Government efforts to strengthen economic governance and
promoting longer term partnerships between key governance institutions in the two countries (AusAID,
2000). Australia already supports many Indonesian economic governance strengthening programs;
the Technical Assistance Management Facility based in Jakarta and the Government Sector Linkages
Program fund most of these activities. The developmental impact of Australia’s economic governance
assistance to Indonesia is expected to be enhanced through targeted follow-up activities promoting
longer term partnerships between major Australian and Indonesian public sector institutions. Such
partnerships should progress Indonesia’s aims of strengthening economic governance capacity and
deepening productive long term ties between the two countries’ institutions.
Examples of potential long term institutional partnerships include: Bank Indonesia and the Reserve
Bank of Australia (monetary policy); Bank Indonesia and the Australian Prudential Regulatory Authority
(bank supervision); Indonesia’s Capital Market Supervisory Agency, Bapepam and the Australian
Securities and Insurance Commission (capital market supervision); the Jakarta and Surabaya Stock
Exchanges and the Australian Stock Exchange (stock market management); the Australian Competition
and Consumer Commission, the Ministry of Industry and Trade, and Indonesia’s anti-monopoly
commission, the Business Supervisory Commission (competition policy); the Indonesian Ministry of
� � � � � � � � � � � � � � � � � � � � � � � � �
�� �$%
Finance and Australian Departments of Finance and Treasury (budget and fiscal policy); and the
Indonesian and Australian Attorney Generals departments (legal reform). Consideration also could
be given to expanding this program to include some state government departments, including those
associated with SME development. Realistically it may be possible to establish only three to four
such major relationships in the short term. Already the Technical Assistance Management Facility
has initiated short term technical assistance programs with most of these Indonesian institutions,
and is exploring developing links with some into larger, more long term programs. A program for
closer cooperation with Bapepam is well advanced.
Developing long term links ideally would require programs to run over at least two five-year periods
subject to reviews, and provide scholarships for significant numbers of young, qualified Indonesian
counterpart staff to study in Australia during this period. Such training would be important in securing
long lasting improvements in institutional capacity, but also to demonstrate to the senior management
of these institutions Australia’s long term commitment to the relationship and deepen people-to-
people and institutional links. The highly successful AusAID sponsored graduate diploma course in
International Economics, specially designed to train young officials from the Chinese Ministry of
Foreign Trade and Technical Cooperation, by the Economics Department of Adelaide University, is
an excellent potential model for this training. Several Australian institutions offer appropriate
postgraduate courses in financial and prudential supervision, macroeconomic policy and financial
law, which if developed, could support institutional partnership programs of this kind. Other assistance
under such programs could include policy seminars for senior bureaucrats in Australia and Indonesia,
IT training, and administrative system and policy development support. Usually these approaches
are more successful in developing long term local capacity than short term technical assistance by
Australian experts.
��������������!���� ����������!��������������!���������!� �
Australia already is providing considerable development assistance to enhance corporate governance
objectives in Indonesia. However, the effectiveness of these programs and commercial and people-
to-people links could be enhanced and deepened by employing more frequently the Indonesian
expertise and goodwill of Australian legal, accounting and auditing professional associations.
Cooperation could include organising, via professional organisations, groups of Australian lawyers,
judges, auditors and accountants with Indonesian or East Asian experience to help draft appropriate
new commercial statutes and regulations, and provide training and seminars in legal, auditing and
accounting practices, ethics and corporate governance issues. Such bodies also could be approached
to provide internships for young Indonesian professionals in Indonesia and Australia.
���!� �!"�� �������������!)���.���������������!"�!
The Australian Government, in association with the Australian Graduate School of Management in
Sydney and corporate sponsors, will support, as a contribution to APEC, a six month training forum
and workshop for future APEC member country financial leaders in Australia in 2001. The forum
� � � � � � � � � � �
�� �$
aims to develop multilateral approaches to common regulatory problems and networks among future
financial and regulatory policy decision makers. The forum may provide a useful model for similar
cooperation and training programs in other economic and corporate governance areas.
����������'��&��� ����!"��!����
Many opportunities exist to assist the Indonesian central and regional government bureaucracies
prepare for decentralisation, as this will stretch the administrative capacity of all levels of government,
particularly regional levels. Assistance could include support for local officials to study short and long
courses in Australia and in-country, as well as for administrative system and policy development.
Australia’s aid program already assists the skill development of local officials. For the long term, it
may be more appropriate to use Indonesian based institutions such as the Institute for Economic and
Social Research at the Faculty of Economics of the University of Indonesia, to deliver this training.
�������
As Australia’s largest and closest neighbour, with a long history of friendship, and strong commercial,
diplomatic and strategic links, Indonesia is a country of enduring importance to Australia. As Indonesia
navigates its transition to a democratic civil society and recovers from the financial crisis, Australia
has a strong interest in supporting this challenging process. Throughout this period, the strong
commercial and people-to-people links between Australia and Indonesia have supported the bilateral
relationship.
The Australian Government has a significant interest in deepening these ties by encouraging Australian
business to consider viable newly emerging trade and particularly direct investment opportunities,
and promoting a wide range of educational, professional, and institutional cooperation programs and
exchanges. As the Indonesian economy recovers and the political situation develops, Australian
business should examine carefully new trade and investment opportunities, with a view to developing
strategic and profitable long term positions in this potentially valuable market.

� � � � � � � � � � � � � � � � � � � � � � � � �
�� �$&
� � � � � � � � � � � � � � � � �
���� ���
������������������ ��
��������������� ���
��������������������
���������������
Australian Embassy
Jl. H.R Rasuna Said Kav C 15-16
Jakarta Selatan 12 490
Tel: (62 21) 255 0555 5
Fax: (62 21) 522 7101
Email: [email protected]
www.austembjak.or.id
Australian Consulate, Denpasar, Bali
Jl. Prof Moh Yamin 4 Renon
Denpasar, Bali
Tel: (62 361) 235 092-3
Fax: (62 361) 231 990
Email: [email protected]
Austrade Jakarta
C/-Australian Embassy
Tel: (62 21) 526 1701
Fax: (62 21) 522 7103
Austrade Surabaya
4th Floor, World Trade Centre
Jl. Pemuda 27-31
Surabaya, East Java
Tel: (62 31) 531 9191
Fax: (62 31) 531 9288
Australia Indonesia Institute Secretariat
Cultural Office
Australian Embassy
Tel: (62 21) 255 0526 5 (Ext 745)
Fax: (62 21) 522 7104
��������������������
��������
Badan Koordinasi Penanaman Modal, BKPM
Investment Coordinating Board of the
Republic of Indonesia
Jl. Jenderal Gatot Subroto No. 44
Jakarta 12 190
Tel: (62-21) 525 2008, 525 2649, 525 4981
Fax: (62-21) 5254945
Telex: 626 54 BKPM IA
PO Box 3186
Email: [email protected]
www.bkpm.go.id/
Indonesian Bank Restructuring Agency, IBRA
Wisma Danamon Aetna, 15th Floor
Jl. Jenderal Sudirman Kav 45-46
Jakarta 12 930
Tel: (62 21) 677 2776
Fax: (62 21) 577 2274, 577 2301
www.bppn.go.id/
National Development Information Office
Yayasan Bina Pembangunan Building
1st Floor
Jl. Pejaten Raya No. 5E
Jakarta 12 510
Tel: (62 21) 790 1933, 790 1934
Fax: (62 21) 790 1936
www.ndio.co.id/
� � � � � � � � � � � � � � � � � �� � � � � � � � �
���� ���
Statistics Indonesia
Badan Pusat Statistik, Republik Indonesia
Jl. Dr. Sutomo 6-8
Jakarta 10 710
Tel: (62 21) 350 7057
Fax: (62 21) 385 7046
Email: [email protected]
www.bps.go.id/
National Agency for Export Development
Jl. Gajah Mada No. 8
Jakarta 10 130
Tel: (62-21) 634 1082
Fax: (62-21) 633 8360
��������������� ����������
World Bank
Indonesia Country Manager
Jakarta Stock Exchange Building
Tower 2, 12th Floor
Jl. Jendral Sudirman, Kav 52-53
Jakarta 12 190
Tel: (62-21) 529 9300 0
Fax: (62-21) 529 9311 1
�!��"����#��������������������������
Indonesian Chamber of Commerce and
Industry, KADIN
Menara Kadin, 29th Floor
Jl. H.R. Rasuna Said X-5 Kav 2-3
Jakarta 12 940
Tel: (62-21) 916 5535, 916 5538, 527 4485
Fax: (62-21) 527 4486
Indonesia Australia Business Council
IABC Secretariat,
11th Floor
World Trade Centre,
Jl. Jenderal Sudirman, Kav 29-31
Jakarta 12 920
Tel: (62 21) 521 1540
Fax: (62 21) 521 1541
Email: [email protected]
www.iabc.nlc.net.au/
Importers Association of Indonesia, GINSI
Gedung Bank Niaga, 1st Floor
Jl. Raya Pasar Minggu No. 45
Jakarta Selatan
Tel: (62 21) 791 9898 6, 791 9898 7,
791 9898 8
Fax: (62 21) 790 0808
Indonesian Exporters Association, GPEI
21 Jl. Wolter Monginsidi No. 88A
Jakarta 12 170
Tel: (62 21) 725 2612, 725 2613
Fax: (62 21) 725 2615
����������������$��
���������������������
�����������##����
Embassy of the Republic of Indonesia
8 Darwin Avenue
Yarralumla ACT 2600
Tel: (02) 6250 8600
Fax: (02) 6273 6017
Email: [email protected]
www.deplu.go.id
Consulate General of the Republic of
Indonesia, Sydney
236-238 Maroubra Road
Maroubra NSW 2035
Tel: (02) 9344 9933
Fax: (02) 9349 6854
Consulate General of the Republic of
Indonesia, Melbourne
72 Queens Road
Melbourne, Victoria 3004
Tel: (03) 9525 2755
Fax: (03) 9525 1588

� � � � � � � � � � � � � � � � �
���� ��
Consulate of the Republic of Indonesia, Perth
134 Adelaide Terrace
East Perth, WA 6004
Tel: (08) 9221 5858
Fax: (08) 9221 5688
Consulate of the Republic Indonesia, Darwin
20 Harry Chan Avenue, Darwin
Northern Territory 0801
Tel: (08) 8941 0048
Fax: (08) 8941 2709
���������������������� ����������
Department of Foreign Affairs and Trade
Indonesia Section
RG Casey Building
John McEwen Crescent
Barton ACT 0221
Tel: (02) 6261 1111
Fax: (02) 6261 3111
www.dfat.gov.au
Austrade (Head Office, Sydney)
22nd Floor, AIDC Tower
201 Kent Street
Sydney NSW 2000
Export Hotline: 13 2878
Tel: (02) 9390 2000
Fax: (02) 9390 2922
www.austrade.gov.au
Australia-Indonesia Institute
Department of Foreign Affairs and Trade
RG Casey Building
John McEwen Crescent
Barton ACT 0221
Postal Address
Australia-Indonesia Institute
PO Box E8
Kingston ACT 2604
Tel: (02) 6261 3827
Fax: (02) 6261 1743
Email: [email protected]
www.dfat.gov.au/aii/index.html
�!��"����#�����������
�������������������
Australia Indonesia Business Council
11th Floor, 100 Collins Street
Melbourne VIC 3000
Tel: (03) 9639 8623
Fax: (03) 9654 6784
Email: [email protected]
www.aibc.net.au

� � � � � � � � � � � � � � � � � �� � � � � � � � �
���� ��!
� � " � #
���� ��$
��� %
�accounting services, 99AFTA, 66–67age, 112agricultural equipment, 175agriculture and agribusiness, 6, 18, 165–83
exports, 70, 168, 171, 180foreign investment, 38, 168–71gross domestic product, GDP, share, 4, 12, 167IBRA assets and asset sales, 42, 46, 54imports, 73- 74, 154: from Australia, 62, 83–88,97–98, 173state enterprises, 47: for sale, 48tariffs and trade liberalisation, 62, 64, 69, 171–74
AIDA, 94airports, 48aluminium, 62Aneka Tambang, 160animals, 62, 86–87anti-trust legislation, 147ANZ, 40APEC trade liberalisation, 68APRISINDO, 69aquaculture, 54, 181armed forces, 25ASEAN, Australian exports to, 90, 96ASEAN Free Trade Area, AFTA, 66–67Asia Pacific Economic Cooperation, 68Asset Disposal Unit, 126Asset Management Unit, Credits 137, 140–44asset sales, 26, 40–49, 127–29, 146asset transfer to IBRA, 124, 126, 140–42Astra CMG Life, 104Astra International, 45Austindo Resources Corporation, 160Austrade, 161, 178, 183, 185Australia-Indonesia Business Council, 108, 178, 194Australia-Indonesia Development Area, AIDA, 94Australian Agency for International Development,
AusAID, 188–90Australian Government representatives and
delegations, 183, 185, 193–95Australian Graduate School of Management, 190automotive industry, 62-63
imports from Australia, 62, 86–88, 95–96IBRA assets, 42, 54
autonomy, see regional decentralisation
Badan Koordinasi Penanaman Modal, BKPM, 39, 193Badan Urusan Logistik, BULOG, 170–72Bakri Finance Corporation, 139Bali, 27, 94Bank Central Asia, 41, 45
Bank Indonesia, 125, 130–32interest rates, 10payments system, 133
Bank Mandiri, 126Bank Niaga, 41Bank Panin, 40Bank Papan Sejahtera, 40bank recapitalisation bonds, 129Bank Restructuring Unit, 124bankruptcy, 136, 138–41, 142banks and banking, 13–14, 16–17, 122–32
asset sales, 40–41, 45–46, 127–29interest rates, 10liabilities and assets, 137non-performing loans transferred to IBRA, 142SMEs access to credit, 11
Bapepam, 132, 146barley, 172Batam free trade zone, 53, 77bauxite, 152, 162BBKU non-performing loans, 142BHP, 103, 105BKPM, 39, 116, 193bond markets, 132–33building and construction, 12, 47, 102BULOG, 170–72bureaucracy, 25–26, 115
environmental governance, 156Bureau of Environment and Technology, 156business associations, 178, 187–89business culture, 112–13business environment, 113–14business relationship, 81–109business structures, 117Business Supervisory Commission, 147business travel, 94butane and propane, 88
�Cabinet, composition of, 31–32caged fish culture sector, 181capital adequacy ratios, CARs, 123–25, 130Capital Market Supervisory Board, 132, 146capital markets, 132–33, 140, 146–47cars, see automotive industrycassava, 168–69, 171cement, 42, 51–52Central Bank Act, 131Central Java, 11, 27Central Kalimantan, 27, 94Central Sulawesi, 27, 94CEP tariff, 66–67cereals, 73–74, 87, 169–70, 171–72
see also rice; wheatchambers of commerce, 108, 195Chandra Asri, 69chemicals, 38, 70, 72, 74, 102
asset sales, 42, 46, 54clothing (garments), 11, 54, 88cloves, 64

� � � � � � � � � � � � � � � � � �� � � � � � � � �
���� ��%
coal, 150, 152, 162coal mining, 42, 54, 103
state enterprises, 48, 160coffee, 92, 168–170, 172, 180cold storage equipment, 175Colonial Mutual Group, 104commercial courts, 138–39commercial relationship, 81–111Committee for Resolving the Cases of Recalcitrant
Debtors, 138common effective preferential tariff, CEPT, 66–67communications, 46, 52, 54, 94community, 113companies, setting up, 117–19compliance directors, 130computing (information technology), 99–100, 132concentration within corporate sector, 146confectionery, 88conflict resolution, 113construction, 12, 47, 102consulting services, 99consumer confidence, 10consumption, 4, 10, 12–13contracting and support services (mining), 161contracts, 116–17, 154copper cathodes, 62copper ore, 152
royalties, 157–59copra, 168, 172, 180corn (maize), 168–69, 171–72corporate governance, 50, 145–46corporate sector, 41–44, 135–48corruption, 26, 139cotton, 62, 98, 86, 172courts, 138–39, 142culture, 112–13current account, 4customs administration, 77–78
�dairy products, 46, 87, 98, 172, 176debt restructuring, 16–17, 129, 136–46debt to equity ratios, 140deposit insurance, 131depreciation, 13–14devolution, see regional decentralisationdiplomatic missions, 193–94Directorate of Technical Mining, 156distressed assets, valuing, 43–44distribution, 39
fresh produce, 175–76downstream processing, 178–79dried garlic, 64
e-commerce, 99East Kalimantan, 27, 94East Nusa Tenggara, 27, 94, 178Eastern Indonesia, 178economic developments, 1–20, 25–27, 29
education services, 52, 89–90, 94, 100–01, 188–91electoral system, 24electric machinery, 87–88electricity, gas and clean water, 12, 99, 158
foreign investment, 38–39electronic commerce, 99employees, 44, 114–15employment, 18, 167energy, see mining and energyentry barriers, 58–69, 75–78, 171–72environmental laws, 155environmental services, 99equality, 26–27estates, 38, 46, 48, 54, 166, 170
industrial, 39ethylene, 69exchange exposure limits, 132–33exchange rates, 13–14exploration for minerals, 159–61explosives, 92export-oriented industries, 39exports, 4, 6–8, 12, 70, 91–94, 167
agricultural, 70, 167, 169, 180: to Australia, 83, 91–94mining, 70, 152–53: to Australia, 91–93
exposure limits, 130–31external debt, 4, 14, 145
�Falconbridge Limited, 105fertilisers, 48, 73–74, 174Finance Equalisation Council, 27financial services/sector, 12, 46, 54, 99, 104, 190
IBRA assets and asset sales, 46, 54, 127–29restructuring, 121–34state enterprises, 47see also banks and banking
Financial Supervisory Agency, 130fiscal policy, 13fish and sea food, 54, 98, 172, 176, 180flour, 62, 88, 97, 172–74food industry, 11, 38, 174–75, 184
IBRA assets and asset sales, 42, 46, 54see also agriculture and agribusiness
food security, 170footwear, 69foreign banks, 126 137foreign currency exposure limits, 130–31foreign debt, 4, 14, 145foreign exchange rates, 13–14foreign investment, 4, 35–55, 101–08, 185–86
agricultural sector, 38, 176–79mining sector, 38, 51, 157–59notaries, 116setting up companies, 117–18
foreign loans, 13–14regional governments, 29
foreign ownership, 39forestry, paper and wood products, 62, 64
exports to Australia, 92foreign investment, 38, 176

� � " � #
���� ���
IBRA assets and asset sales, 42, 54imports, 73–74: from Australia, 62state enterprises, 47
free trade zones, 53, 77freshwater fishery sector, 178frozen produce, 175fruit and nuts, 74, 170, 171–72, 175fuels, see coal; petroleum and petroleum productsfurniture industry, 11, 92
�Gag Island nickel laterite project, 105GAPIPA, 69garlic, 64, 171garments, 11, 54, 88gas, 29, 87–88, 152, 160
see also electricity, gas and clean water; petroleumand petroleum products
GDP, 3–5, 8, 11–12, 17, 151, 167gold, 152, 160, 160, 162
royalties, 157–58Gosowong gold deposit, 161governance, 145–46, 190–92
environmental, 156financial sector, 129, 190state enterprises, 50
government, 21–33, 187–88assets sales, 26, 40–9, 127–29, 146consumption, 4, 12see also state enterprises
government incentives, 53, 65grain, see cereals; rice; wheatgrain sorghum, 174gross domestic product, GDP, 3–5, 8, 11–12, 17, 151, 167gross fixed capital formation, 4ground nuts, 171–72
&health and medical services, 39, 53, 96hides, 172, 180higher education services, 52, 100hotels and resorts, 54household consumption, 12
�illegal mining, 155–58imports, 4, 6–8, 12, 71–74
from Australia, 62, 82–90, 95–101, 175entry barriers, 58–64, 64–69, 75–78, 171–72surface mining equipment, 159
income, 26–27Independent Commission for the Audit of State Officials, 139Indonesia-Australia Business Chamber of Commerce, 108Indonesia Australia Business Council, 178–179Indonesian Association of Steel Pipe Producers, 69Indonesian Bank Restructuring Agency, IBRA, 124–29,
136–39address and contact information, 193Asset Management Unit, Credits, 137, 140–44assets sale, 40–49, 54
Indonesian Footwear Association, 69
Indonesian contacts, 193–95industrial estates, 39industry, see manufacturingindustry sectors, 4, 5–6, 12
foreign investment, 37–39: Australian, in Indonesia, 102IBRA assets and asset sales, 42, 46, 54state enterprises, 47–48
inequality, 26–27inflation, 9information technology, 99–100, 132infrastructure sectors, 39, 47, 50–52
see also electricity, gas and clean waterinsolvency, 136, 138–39, 142insurance, 104
bank deposits, 131interest rates, 10Internet, 99investment, 4, 15, 44–45, 158, 178
see also foreign investmentInvestment Coordinating Board, 116Investment Review Board, 39, 193Irian Jaya, 94, 178iron and steel, 51, 69, 86–87
milling equipment, 62iron sand, 152, 162IT, 99–100, 132
'Jakarta Initiative Task Force, JITF, 136–37, 144–45Jakarta Stock Exchange, 132, 146Java, 11, 27, 38, 166jewellery, 88Joint Investigating Team, 139joint ventures, 39, 103–04, 117, 126
(Kalimantan, 27, 94, 178Kawasan Timur Indonesia, 178Krakatau Steel, 51, 69
$labour costs, 116labour productivity, in agriculture, 169–71land ownership, 115Landasan Terus Sentosa, 139large debtors, 137, 141laws, 44–45, 116
anti-trust, 147banking, 130–31bankruptcy, 138–40corporate governance, 145–46energy reforms, 160environmental, 156foreign investment regime, 38–39, 170natural resource ownership, 155regional devolution, 28–29taxation, 139
legal services, 99

� � � � � � � � � � � � � � � � � �� � � � � � � � �
���� &''
legal system, 118, 138–39see also laws
leverage, 140licensing requirements, for imports, 62–64liquefied propane and butane, 88live animals, 62, 86–87living standards, 18loan classifications, 130local content requirements, 64, 77logging, see forestry, paper and wood productslong term outlooks, 18, 161–63
�machinery, 70, 87–88macroeconomics, 5–10, 13maize, 170–71Malaysia, 90, 96Maluku, 94management, 44, 114–16manufacturing (industry), 5–6, 12–13
exports, 70, 171: to Australia, 83, 91–93foreign investment, 37–38, 101gross domestic product, GDP, share, 4, 12IBRA assets, 42, 54imports, 72: from Australia, 62, 83–88, 95–97small firms, 11tariffs, 62, 64, 69
market entry barriers, 58–69, 75–78, 173–74meat, 62, 86–87, 174, 177medical services, 39, 53, 96medium term forecasts, 16–18men, 112meslin, see wheatmetals, see mining and energymilitary, 25milk powder, 62
see also dairy productsmineral royalties, 157–58mining and energy, 6, 149–65
exports, 70, 152–53: to Australia, 91–93foreign investment, 38, 51, 158–60: Australian,102–103, 105gross domestic product (GDP) share, 4, 12, 151imports, 72–73, 161; from Australia, 62, 84, 86–88IBRA assets and asset sales, 42, 46, 54machinery parts, 62software, 100state enterprises, 47: privatisation, 48, 51tariffs, 62
Ministry of Environment, 156Ministry of Mines and Energy, 156Ministry of State Owned Enterprises, 26Monash University, 100motor cycles, 95motor vehicles, see automotive industryMulti Fibre Agreement, 65
�National Committee on Corporate Governance, 145National Ombudsman Commission, 139natural gas, 29, 87, 150, 161
see also electricity, gas and clean water;petroleum and petroleum products
natural resources, see mining and energyneighbourhood councils, 113Newcrest Mining Ltd, 162nickel, 105, 152, 162non-performing loans, 123–26, 128, 140–41non-tariff barriers, 62–64, 68North Sulawesi, 27, 94notaries, 116Nusa Tenggara Barat, 27, 94, 178Nusa Tenggara Timur, 27, 94, 178
�oats, 174oil, see petroleum and petroleum productsoilseeds, 73–74Okusi Marble, 115overseas investment, see foreign investmentownership, 39
asset sales, 26, 40–49, 127–29, 146land, 113natural resources, 155
)paddy rice, see ricepalm kernels, 170, 174palm oil, 46, 168, 170, 180
equipment, 177palm plantations, 46, 54, 168, 178paper, see forestry, paper and wood productspassenger motor vehicles, see automotive industryPatimura University, 179pay, 114payments system, 133peanuts, 170Pelindo, 50, 52people-to-people links, 188–89pepper, 180per capita GDP, 3–4personal relationships, 112–13Pertamina, 161petrochemical industry, 69
see also chemicalspetroleum and petroleum products, 29, 150, 152, 161
exports, 153, 169: to Australia, 92–93foreign investment, 159imports, 72: from Australia, 62, 86–87prices, 8–9
Pharmacia and Upjohn, 96pharmaceuticals, 48, 96Philippines, 90, 96plantations (estates), 38, 46, 48, 54, 168, 172plywood, see forestry, paper and wood productsP&O Ports, 51political developments, 21–33political parties, 23–24, 26pollution control services, 99port sales, 50–52power generation, see electricity, gas and clean water

� � " � #
���� &'�
prices, 8–9private banks, 124–26, 128private consumption, 4, 12–13privatisation, 26, 47–51
banks, 128energy sector, 161–62
processed foods, 176–78see also agriculture and agribusiness
productivity, of agricultural sector, 171–72propane and butaneproperty sector, 42, 46, 54prudential supervision, 129–31public sector, see government
*quarrying, see mining and energy
�Ramli, Dr Rizai, 3, 30recapitalisation bonds, 129recapitalised loans transferred to IBRA, 142regional decentralisation/devolution, 28–29, 191
foreign direct investment and, 51mining and, 154, 156
regulation, 118–20, 145–46prudential, 129–31see also governance
relationships, personal, 112–13remuneration of employees, 114resources sector, see mining and energyrestructuring, 16–17, 129, 136–46retail outlets, 39retail sales, 10rice, 168, 170–71, 175
productivity, 172–73tariffs, 64, 69, 174
Rio Tinto, 103risk management, 99road vehicles, see automotive industryroads, 52royalties, on minerals, 157–58rubber, 168, 170–71, 173–74
exports, 92rupiah, 13–14rural credit schemes, 178rural industries, see agriculture and agribusiness
�safety equipment, 97salaries, 114scholarships, 189–90sectors, see industry sectorssecuritisation, 129security equipment, 97Semen Gresik, 51Semen Tonosa, 52semi-trailers and trailers, 95services, 6, 169
exports to Australia, 93–94foreign investment by Australia, 102
gross domestic product (GDP) share, 4, 12, 169imports from Australia, 83–84, 89–90, 98–101
shares, 44–45state enterprises sales strategy, 48–49
shipping, 54short term prospects, 11–13shrimp, 54, 182silver, 152, 162Singapore, 46, 90, 96small firms, SMEs, 11, 137social impact of crisis, 18Soeharto’s New Order, 22–23sorghum, 174South-East Sulawesi, 27, 94South Kalimantan, 27, 94South Sulawesi, 11, 94soy beans, 97, 170, 173–75spices, 64, 174staff, 44, 114–15state banks, 125–27, 130
liabilities and assets, 137non-performing loans transferred to IBRA, 142rural credit, 178
state enterprises, 26, 47–51liabilities and assets, 137mining and energy sector, 160see also state banks
steel, see iron and steelsteel milling equipment, 62stock markets, 132, 146student exchanges, 188–89subcontracting smaller loans, 144sugar, 64, 69, 170, 176
IBRA assets, 54imports, 74: from Australia, 87, 174processing machinery, 175
Sukarno regime, 22Sulawesi, 11, 27, 94, 166, 178Sumatra, 27, 168, 178supervision, see regulationSurabaya Stock Exchange, 132Surpac Software International, 100sweet potatoes, 170, 173
�Tambang Batubara Bukit Asam, 160tapioca, 182tariffs, 58–62, 64–69, 75–76, 173–74taxation, 29, 77, 139–40
exemptions, 53, 65mining, 157–58
tea, 171, 174, 182technical and vocational education, 188telecommunications, 39, 47ten point economic recovery plan, 3textiles, 38, 54, 87Thailand, 90, 96timber, see forestry, paper and wood productstin ore, 152, 160

� � � � � � � � � � � � � � � � � �� � � � � � � � �
���� &'&
tobacco, 74, 174toll roads, 52tourism enterprises, 47trade, 4, 6–8, 57–101
see also exports; importstrade barriers, 58–69, 75–78, 173–74trailers and semi-trailers, 95training, 115
requirements in mining, 161transparency, in financial sector, 131–32transport, 87–88
equipment, 73see also automotive industry
transport services, 48, 89–90, 94travel services, 89–90, 93–94turbines, 88
�United States, 157university education services, 52, 100University of New South Wales, 100University of Tasmania, 179Uruguay Round, 64–65utilities, investment in, 102
+value added tax, 77valuing distressed assets, 43–44vegetables, 74, 174vehicles, see automotive industryvocational education and training, 188
,wages, 114Wahid government, 22–32waste management, 99water supply, see electricity, gas and clean waterWest Java, 27, 99West Kalimantan, 27, 94West Nusa Tenggara, 27, 94, 178Western High Pty Ltd, 181wheat, 62, 97, 174–76wood, see forestry, paper and wood productswork, 18, 169workers, 44, 114–15workout terms for rescheduled loans, 143–44World Trade Organization (WTO) commitments, 64–65
-Yogyakarta, 11, 27younger people, 112, 188–89Youth Work Experience Scheme, 188
.zinc, 62
� � � ( � � ) * + � � � �
���� &'�
�$��-�& ���
Indonesia: Facing the Challenge
Published December 2000 (ISBN 0 642 70501 1), 226 pages, A$33
Transforming Thailand: Choices for the New Millennium
Published June 2000 (ISBN 0 642 70469 4), 228 pages, A$33
Asia’s Financial Markets: Capitalising on Reform
Published November 1999 (ISBN 0 642 56561 9), 376 pages, A$35
Korea Rebuilds: From Crisis to Opportunity
Published May 1999 (ISBN 0 642 47624 1), 272 pages, A$30
Asia’s Infrastructure in the Crisis: Harnessing Private Enterprise
Published December 1998 (ISBN 0 642 50149 1), 250 pages, A$30
The Philippines: Beyond the Crisis
Published May 1998 (ISBN 0 642 30521 8), 328 pages, A$25
The New Aseans - Vietnam, Burma, Cambodia and Laos
Published June 1997 (ISBN 0642 27148 8), 380 pages, A$20
A New Japan? Change in Asia’s Megamarket
Published June 1997 (ISBN 0 642 27131 3), 512 pages, A$20
China Embraces the Market: Achievements, Constraints and Opportunities
Published April 1997 (ISBN 0 642 26952 1), 448 pages, A$20
Asia’s Global Powers: China-Japan Relations in the 21st Century
Published April 1996 (ISBN 0 642 24525 8), 158 pages, A$15
Pacific Russia: Risks and Rewards
Published April 1996 (ISBN 0 642 24521 5), 119 pages, A$15
Iron and Steel in China and Australia
Published November 1995 (ISBN 0 642 24404 9), 110 pages, A$15
Growth Triangles of South East Asia
Published November 1995 (ISBN 0 642 23571 6), 136 pages, only available online
Overseas Chinese Business Networks in Asia
Published August 1995 (ISBN 0 642 22960 0), 372 pages, A$20
Subsistence to Supermarket: Food and Agricultural Transformation in South-East Asia
Published August 1994 (ISBN 0 644 35093 8), 390 pages, A$15
� � � � � � � � � � � � � � � � � �� � � � � � � � �
���� &'�
Expanding Horizons: Australia and Indonesia into the 21st Century
Published June 1994 (ISBN 0 644 33514 9), 364 pages, A$15
India’s Economy at the Midnight Hour: Australia’s India Strategy
Published April 1994 (ISBN 0 644 33328 6), 260 pages, A$15
ASEAN Free Trade Area: Trading Bloc or Building Block?
Published April 1994 (ISBN 0 644 33325 1), 180 pages, A$15
Changing Tack: Australian Investment in South-East Asia
Published March 1994 (ISBN 0 644 33075 9), 110 pages, A$10
Australia’s Business Challenge: South-East Asia in the 1990s
Published December 1992 (ISBN 0 644 25852 7), 380 pages, A$15
Southern China in Transition
Published December 1992 (ISBN 0 644 25814 4), 150 pages, A$10
Grain in China
Published December 1992 (ISBN 0 644 25813 6), 150 pages, A$10
Korea to the Year 2000: Implications for Australia
Published November 1992 (ISBN 0 644 27819 5), 150 pages, A$10
Australia and North-East Asia in the 1990s: Accelerating Change
Published February 1992 (ISBN 0 644 24376 7), 318 pages, A$15
Prices cited are current discounted prices inclusive of GST
����!����� �������/0��1�� ���������23
India: Economic Reform and Opportunities, second quarter 2001
Latin America: Trade and Investment Opportunities, second quarter 2001
Corporate Governance in Asia: Progress and Problems, second quarter 2001
Reports and full publications catalogues can be obtained from:
Jane Monico
Market Information and Analysis Unit
Department of Foreign Affairs and Trade
RG Casey Building, John McEwen Crescent
Barton ACT 0221, Australia
Telephone: 62 2 6261 3114 Facsimile: 61 2 6261 3321
Email: [email protected]
www.dfat.gov.au/eaau/
gives access to executive summaries, tables of contents,
many full reports, details of briefing papers and order forms

As Indonesia recovers from its severe financial crisis, new opportunities for
Australian trade and investment are emerging. To attract foreign investors to
government sales of banking and corporate assets the Indonesian Government
has significantly reduced barriers to foreign investment. Dramatically lower trade
barriers in most sectors, but especially in agricultural product and automotive
markets, will assist growth in the traditionally strong commercial relationship
between Australia and Indonesia.
This balanced report helps Australian business face the commercial challenge in
Indonesia. It analyses economic reform progress including bank and corporate
sector restructuring, highlights on-going reform agendas and risks, assesses
recent and projected economic performance, explores the business environment
and identifies key opportunities for Australian investors and exporters.
D E PA R T M E N T O F F O R E I G N A F F A I R S A N D T R A D E
IndonesiaFacing the Challenge IndonesiaIndonesia
Facing the ChallengeFacing the Challenge
13769/eaau cover/new 15/11/00 12:13 PM Page 1