indonesia second national communication
TRANSCRIPT

IndonesIa second natIonal communIcatIon under the unIted natIons Framework conventIon on clImate change (unFccc)
IndonesIa second natIonal communIcatIonUNDER ThE UNiTED NaTioNs FRamEwoRk CoNvENTioN oN ClimaTE ChaNgE
ministry of environment, Republic of Indonesia
Climate Change Protection for Present and Future Generation

IndonesIa second natIonal communIcatIon under the unIted natIons Framework conventIon on clImate change (unFccc)
IndonesIa second natIonal communIcatIon under the unIted natIons Framework conventIon on clImate change (unFccc)
Indonesia Second National Communication Under The United Nations Framework Conventionon Climate Change (UNFCCC)
Jakarta, November 2010

IndonesIa second natIonal communIcatIon under the unIted natIons Framework conventIon on clImate change (unFccc)
AdviserState Minister of Environment
Editor in ChiefMasnellyarti Hilman, Deputy Minister for Nature Conservation Enhancement and Environmental Degradation Control
Coordinating Lead AuthorsRizaldi Boer, Sulistyowati, Irsal Las, Farida Zed, Nur Masripatin, Dana A. Kartakusuma, Dadang Hilman, and Haneda Sri Mulyanto
Lead AuthorsRetno Gumilang Dewi, Rizaldi Boer, Ari Wibowo, Suryahadi, Muhammad Ardiansyah, Agus Buono, Rini Hidayati, Feril Hariati, Prihasto Setyanto, Elza Surmaini, Arien Heryansyah, Kiki Kartikasari, Idat G. Permana, and Akhmad Faqih
Contributing Authors:Sunaryo, Marwansyah Lobo Balia, Wendy Aritenang, Eddy Effendi Tedjakusuma, Subandono Diposaptono, Ida Kusuma, Elly Andriani Sinaga, Gatot Irianto, Hendradjat N., Yana Anggadireja, Sriworo B Harijono, Ano Herwana, Wan Alkadri, Endang Supraptini, Agus Wahyudi, Ghafur Akbar Dharmaputra, Iman Bonila Sombu, Lilih Handayaningrum, Saleh Abdurrahman, Sidik Boedoyo, Soendjoto, Agus Hermawan Atmadilaga, Thomas Djamaluddin, Tania June, Yanuar J. Purwanto, Adi Rakhman, Ucok Siagian, Mala H Nasution, Puji Lestari, Syahrina D Anggraeni, Yuyun Ismawati, Ujang Solihin, Aisyah Syafe’i, Upiek SA Kamil, Sisi Febriyanti, Diva Oktavariani, Fitriyani, Doddy Juli Irawan, Gito Ginting, Jessica and Andrea.
Acknowledgment The State Minister of Environment would thank Ministry of Agriculture, National Development Planning Agency, Ministry of Marine Affairs and Fisheries, Ministry of Transportation, Ministry of Agriculture, Ministry of Health, The Ministry of Industry, Ministry of Foreign Affairs, Ministry of Home Affairs, Ministry of Energy & Mineral Resources, Ministry of Research and Technology, Ministry of Public Work, Centre for Climate Risk and Opportunity Management in Southeast Asia Pacific-Bogor Agriculture University (CCROM SEAP-IPB), Centre for Research on Energy-Bandung Institute of Technology (PPE-ITB), Agency for the Assessment and Application Technology (BPPT), National Agency for Meteorology, Climatology and Geophysics (BMKG), Central Bureau of Statistic (BPS) Indonesia, National Coordinating Agency for Survey and Mapping (Bakosurtanal), National Institute of Aeronautics and Space (LAPAN) and UNDP CO Indonesia for overall support and backstopping in the preparation of the Second National Communication under the United Nations Framework Convention on Climate Change (UNFCCC)

IndonesIa second natIonal communIcatIon under the unIted natIons Framework conventIon on clImate change (unFccc)
It is with great pleasure that I have availed myself of the opportunity to present a foreword for the Second National Communication (SNC) of
the Republic of Indonesia to the United Nations Framework Convention on Climate Change (UNFCCC).
The devastating impact of global warming is already noticeable in Indonesia and will likely worsen due to further unsustainable economic development and human-induced climate change. Increasingly frequent and severe floods, extreme weather events and prolonged droughts in some regions will lead to further environmental destruction and degradation, human injury and illness. The continuation of warmer temperatures will also increase the number of malaria
and dengue fever cases and lead to an increase in other infectious diseases as a result of poor nutrition due to food production disruption.
Indonesia is estimated to have emitted 1.378 Giga tonnes of CO2 equivalent in the year 2000 with a significant proportion of emissions due to deforestation and land-use change at 1.1 million hectares per year, which accounts for 51 % of the country’s annual greenhouse gas emissions. Despite the large emissions from the forestry sector, energy and other sectors contribute only 0.557 Giga tonnes of CO2-equivalent which is still below the global average.
Regulations regarding environmental protection of the Republic of Indonesia mandate the government to promote and adopt policies that maintain its environment for the benefit of present and future populations. Addressing the challenge of climate change is one of the Indonesian Government’s highest priorities, which has committed to a national emission reduction target and is implementing a comprehensive response to climate change in achieving this target, including adaptation to unavoidable climate change. Through its various government agencies and in partnership with the private sector and non-governmental organizations, Indonesia seeks to develop and adopt pre-emptive and corrective actions and activities to address the predicted and actual impacts of climate change.
Indonesia’s Second National Communication, to be submitted to the UNFCCC, documents recent emissions, the impacts of Climate Change, as
Preface
I-iii

IndonesIa second natIonal communIcatIon under the unIted natIons Framework conventIon on clImate change (unFccc)
well as Indonesia’s efforts in dealing with Climate Change, especially through mitigation and adaptation measures.
Addressing the issue of climate change in Indonesia - with a wide range of complications and territories- requires the attention of a diverse group of experts and key government and non-governmental agencies, coordinated by the Directorate of Climate Change Impact Management under the Deputy Minister of the Ministry of Environment.
This formal document submitted to the UNFCCC was only made possible with financial support from Annex I countries of UNFCCC through GEF (Global Environment Facility).
Finally, on behalf of the Government of the Republic of Indonesia, I wish to acknowledge with gratitude to all these organizations, institutions and individuals who participated in the process of the preparation of the Second National Communication. Your active participation in the deliberations was vital to the success of this project.
Thank you very much.
Prof. Dr. Gusti Muhammad Hatta Minister for the Environment
Preface
iv

IndonesIa second natIonal communIcatIon under the unIted natIons Framework conventIon on clImate change (unFccc)
EXECUTIVE SUMMARY ixLIST OF FIGURE xxiiiLIST OF TABLE xxixGLOSSARY OF ABBREVIATION xxxiii
CHAPTER I NATIONAL CIRCUMSTANCES I-11.1 Geography and Climate I-11.2 Extreme Climate Events I-31.3 Economic and Social Development I-41.4 Sectoral Conditions I-7 1.4.1 Energy Sector I-6 1.4.2 Industrial Sector I-8 1.4.3 Forestry Sector I-9 1.4.4 Agriculture Sector I-11 1.4.5 Water Sector I-13 1.4.6 Coastal and Marine Sector I-14
CHAPTER II NATIONAL GHG INVENTORY II-12.1 Introduction II-12.2 Institutional Arrangements II-12.3 Description of the Process of Preparing the Inventory II-22.4 Overview of Source and Sink Category Emission Estimates for year 2000 II-32.5 Sectoral Emissions II-9 2.5.1 Energy II-9 2.5.2 Industry II-13 2.5.3 Agriculture II-14 2.5.3.1 Livestock II-15 2.5.3.2 Rice Cultivation II-18 2.5.3.3 Agricultural Soils II-19 2.5.3.4 Biomass Burning II-21 2.5.4 Land Use Change and Forestry (LUCF) II-22 2.5.5 Waste II-262.6 Emissions Trends II-272.7 Key Category Analysis II-282.8 Uncertainty Analysis II-292.9 Quality Assurance/Quality Control (QA/QC) II-302.10 Plans for Improvement II-31
Table of Contents
v
IndonesIa second natIonal communIcatIon under the unIted natIons Framework conventIon on clImate change (unFccc)
CHAPTER III GENERAL DESCRIPTION OF STEPS TAKEN OR ENVISAGED TO IMPLEMENT THE CONVENTION III-13.1 Introduction III-13.2 Process of Integrating Climate Change into the National Development Plan III-13.3 Financial Institutions III-4
CHAPTER IV MEASURES TO FACILITATE ADEQUATE ADAPTATION TO CLIMATE CHANGE IV-14.1 Introduction IV-14.2 Historical Climate Change IV-14.3 Future Climate Change IV-44.4 Climate Change Impacts and Adaptation Assessment IV-10 4.4.1 Agriculture IV-10 4.4.2 Water Resources IV-19 4.4.3 Forestry IV-24 4.4.4 Coastal and Marine IV-29 4.4.5 Health IV-45
CHAPTER V MEASURES TO MITIGATE CLIMATE CHANGE V-15.1 Energy Sector V-1 5.1.1 Policy Framework V-1 5.1.2 Emissions Projections and Mitigation Measures V-4 5.1.3 Mitigation Costs V-145.2 Industry Sector V-18 5.2.1 Policies Framework V-18 5.2.2 Emissions Projections and Mitigation Measures V-185.3 Forestry Sector V-20 5.3.1 Policy Framework V-20 5.3.2 Emissions Projections and Mitigation Measures V-22 5.3.3 Mitigation Costs V-255.4 Peatland V-26 5.4.1 Policy Framework V-26 5.4.2 Emissions Projections V-275.5 Agriculture Sector V-27 5.5.1 Policy Framework V-27 5.5.2 Emissions Projections and Mitigation Measures V-285.6 Waste V-32
Table of Contents
vi

IndonesIa second natIonal communIcatIon under the unIted natIons Framework conventIon on clImate change (unFccc)
CHAPTER VI OTHER INFORMATION VI-16.1 Transfer of Technology VI-16.2 Research VI-26.3 Systematic Observations VI-36.4 Information on Education, Training, Public Awareness and Capacity Building VI-66.5 Efforts to Promote Information Sharing VI-7
CHAPTER VII OBSTACLES, SHORTAGES AND NEEDS RELATED TO FUNDING, TECHNOLOGY AND CAPACITY VII-17.1 Climate Change Funding VII-27.2 Technology VII-37.3 Awareness, Education, Empowerment and Capacity Building VII-5
REFERENCES
Table of Contents
vii

IndonesIa second natIonal communIcatIon under the unIted natIons Framework conventIon on clImate change (unFccc)I-viii

IndonesIa second natIonal communIcatIon under the unIted natIons Framework conventIon on clImate change (unFccc)
Indonesia continues its efforts and actions towards the implementation of the commitments as a Non-Annex I Party to the United Nations Framework Convention on Climate Change (UNFCCC). Indonesia presented its First National Communication to the UNFCCC in 1999. One of the most important parts of the content was the first National Greenhouse Gases Emissions Inventory (NGHGEI) for the year 1990 and also the results of the first studies on the country’s vulnerability to climate change. The Second National Communication (SNC) presents National Greenhouse Gases Emissions Inventory (NGHGEI) for the years 2000 to 2005.
This Communication was supported by the Global Environmental Fund (GEF) through the United Nations Development Programme (UNDP), along with further funding from Government of Indonesia. The funds received allowed the improvement of the emissions inventory, and supported the development of studies on climate change mitigation and adaptation in Indonesia. On this occasion, the process of planning the National Communication content included consultations with academics and representatives from government institutions, private sector and non-governmental organizations, in order to capture their opinion and points of view about what elements of the previous communication should be improved in this second assessment. A public consultation was also held for the same purpose.
As requested, Indonesia’s Second National Communication was prepared in accordance with the UNFCCC Reporting guidelines on National Communications.
National Circumstances
Indonesia is located between 6o08’ North and 11o15’ South latitude, and from 94o45’ to 141o05’ East longitude. The country covers 1,910,931 Km2. It has five large islands (Sumatra, Java, Kalimantan, Sulawesi and Irian Jaya) and about 13,667 small islands, of which over half (56%) of which are nameless, and only 7% permanently inhabited (Figure 1-1). Extensive coastal plains and mountain areas of 1,000 metres above sea level are characteristics of Sumatra, Kalimantan and Irian Jaya. Of the 200 million ha of land territory, about 50 million ha is devoted to various agricultural activities. There is nearly 20 million ha of arable land, of which about 40% is wetland (rice fields), 40% is dry land, and 15% is shifting cultivation. Since 2005, the Republic of Indonesia has been divided administratively into 33 provinces (BPS, 2008)
The country’s population is the fourth most populous nation in the world, following China, India and the United States. The population grew from 119 million in 1971 to 219 million in
Executive Summary
ix
IndonesIa second natIonal communIcatIon under the unIted natIons Framework conventIon on clImate change (unFccc)
2005. While the growth rate is slowing down from 1.49% (1990–2000) to become 1.34% (2001–2005), it is projected that Indonesia’s population will reach 300 million in 2030.
Poverty remains a challenge, while unemployment and underemployment are still relatively high. In the Mid-Term National Development Plan (RPJMN) 2004–2009, it was targeted that poverty and unemployment would be about 5.1% and 8.2% respectively. Recent report from BPS stated that the number of unemployment by February 2008 reached 8.46% or about 9.43 million people. However, based on the projection of the Institute for Development Economics and Finance (Indef ), due to current economic crisis the number of poor and unemployed in 2008 may increase to 9.5% and 16.3% respectively (Depsos, 2009).
Indonesia’s GDP is approximately US$ 175 billion, in which trade (16.7%), manufacturing (28%), agriculture (15.4%), and services (10.17%) are the main contributors. Earnings from exports were about US$ 69 billion (primarily oil and gas, textiles, appliances, coal, copper), while imports accounted for about US$ 44.8 billions (primarily food, chemicals, capitals and consumer goods). GDP growth has increased steadily since 1998, reaching 6.3% in 2007 thus bringing per capita GDP to around US$ 2000.
The role of sectors other than oil and gas has become much more significant in the Indonesian economy since Asian Financial Crisis (AFC), with the oil and gas sectors experiencing negative growth rates each year since with the exception of 2000. Among the non-oil and gas sectors, agriculture has continued to play an important role. It is a sector that was significantly less affected by the AFC, and indeed helped the recovery of Indonesian economy after the crisis through a substantial increase in exports and its absorption of unemployed workers in its role as an “employer of last resort” for many jobseekers (Siregar, 2008).
National GHG inventory
The National Greenhouse Gases Inventory (NGHGI) was estimated using Tier 1 and Tier 2 of the 2006 IPCC Reporting Guidelines and the IPCC GPG for LULUCF. In 2000, total GHG emissions for the three main greenhouse gases (CO2, CH4, N2O, PFC) without LULUCF (LUCF and peat fires) reached 556,728.78 Gg CO2e. With the inclusion of LULUCF, total net GHG emissions from Indonesia increase significantly to about 1,377,982.95 Gg CO2e (Table 1a and 1b). The GHG emissions (in CO2 equivalent) were distributed unevenly between the three gases recorded, i.e. net CO2 totalled 1,112,878.82 Gg, representing 80.8% of the National GHG emissions; methane (CH4) totalled 236,617.97 Gg (CO2e) or 17.2%; and nitrous oxide (N2O) totalled 28,341.02 Gg (CO2e) or 2.0%. The main contributing sectors were Land Use Change and Forestry, followed by energy, peat fire related emissions, waste, agricultural and industry.
Executive Summary
x

IndonesIa second natIonal communIcatIon under the unIted natIons Framework conventIon on clImate change (unFccc)
The emission estimates in the SNC are lower than those reported by a 2007 PEACE, World Bank and DFID study, which suggested Indonesia to be the 3rd largest emitter country. The study estimated that the total emission from Indonesia was about 3,014,000 Gg CO2 where LUCF contributed about 85% or about 2,563,000 Gg CO2 (twice the SNC estimate above). Indeed, a further study from the World Bank (2008) suggested that the mean annual CO2 emissions from LUCF reached up to 2,398,000 Gg, assuming 53% from peat fire, 20% from peat drainage (peat oxidation), 22% from deforestation and 5% from palm oil and timber plantation establishment. Between the SNC and World Bank estimates, a recent study from DNPI (2009) suggested that the total GHG emissions from LUCF in 2005 reached 1,880,000 Gg CO2e where about 55% was from peat emissions. These large differences in Indonesian emissions estimates thus appear to be mainly due to differences in estimates of LUCF emissions, particularly from peat.
Inter-annual variation of emissions from peat fires is also very high. High emissions normally occurred in El Nino years (1997, 2002, and 2006). The highest estimate was from Hooijer et al (2006), which estimated the emission based on a Borneo hot-spot count and a carbon calculation method used by Page et al. (2002), who estimated emissions from peat fires in 1997 El-Nino. This approach may be give an overestimate as hotspot counts in peat lands are not fully proportional to CO2 emissions, which are governed by further factors such as the depth and area of burning. Therefore, this relationship may not also be generally applicable for the
CO2 CH4 N2O PFC Total
Energy 247,522.25 30,174.69 3,240.64 NO 280,937.58Industrial Process 40,342.41 2,422.73 133.22 145.15 43,043.52Agriculture 2,178.30 50,800.18 22,441.25 NO 75,419.73LUCF1 821,173.35 56.35 24.47 NO 821,254.17Waste 1,662.49 153,164.02 2,501.45 NO 157,327.96Total 1,112,878.82 236,617.97 28,341.02 145.15 1,377,982.95
Table 1b. Summary of GHG emissions from 2000-2005 from all sectors (in Gg CO2e)
Table 1a. Summary of 2000 GHG emission and removal (in Gg CO2e)
1Note: Emission from peat fire was included
1Note: Emission from peat fire was taken from van der Werf et al (2008). 2Estimated based from MoF (2009) and Bappenas (2009a), 3Emission 2001 was not included in determining the trend
Source 2000 2001 2002 2003 2004 2005
Energy 280,937.58 306,774.25 327,910.62 333,950.21 372,123.28 369,799.88 Industrial Process 43,043.52 49,810.15 43,716.26 47,901.63 47,985.20 48,733.38 Agriculture 75,419.73 77,500.80 77,029.94 79,828.80 77,862.54 80,179.31 LUCF 649,254.17 560,546.00 1,287,494.79 345,489.33 617,423.23 674,828.00 Peat Fire 172,000.00 194,000.00 678,000.00 246,000.00 440,000.00 451,000.00 Waste 157,327.96 160,817.76 162,800.37 164,073.89 165,798.82 166,831.32 Total With LUCF & peat fire 1,377,982.95 1,349,448.96 2,576,951.98 1,217,243.86 1,721,193.07 1,791,371.89
Total Without LUCF & peat fire 556,728.78 594,902.96 611,457.19 625,754.53 663,769.84 665,543.89
Executive Summary
xi

IndonesIa second natIonal communIcatIon under the unIted natIons Framework conventIon on clImate change (unFccc)
whole of Indonesia, and so the extrapolation of emission estimates over Indonesia based on limited ground checks in Kalimantan may lead to overestimation.
Van der Werf et al. (2007) attempted to improve emission estimates from peat fires using several sources of satellite data with biogeochemical and atmospheric modeling to better understand and constrain peat fire emissions from Indonesia. This resulted in far lower estimates. The NGHGI adopted the study of the Van der Werf et al. (2007). In 2000, their estimated emissions from peat fires were calculated at about 172.000 Gg CO2e, while the average emission of peat fire (2000-2006) was about 466,000 Gg CO2e.
Indonesia plans to improve emission estimates, particularly from LULUCF and peat lands in the next National GHG Inventory. At present, activities undertaken by the Ministry of Forestry and Ministry of Agriculture to improve emission estimates from peat lands are the following:
a. The Ministry of Agriculture (through the National Research Consortium for Climate Variabi- lity and Climate Change) is conducting studies to develop emissions factors from peat lands under different usage scenarios in Central Kalimantan. The Ministry of Agriculture will also expand this study to other provinces and request support from international agencies. Additional surveys to improve data on peat depth (particularly in Papua) are also being planned. It is expected that the funding allocated for the 3rd National Communica- tion can provide additional support for the studies.b. The Ministry of Forestry is improving the emission sink factors from forests and emission factors from fire (both in mineral soils and peat land). The programme is being undertaken through the INCAS (Indonesian National Carbon Accounting System) and other relevant research programmes under the MoF and partners. c. The state Ministry of Environment is conducting a pilot study on Peatland Management, including calculation of GHG emissions from peat lands in West Kalimantan and Riau Province.d. A detailed analysis commissioned by Indonesia’s National Development Planning Agency (BAPPENAS) is also commissioning a detail analysis on peat land emission and projection as well as mitigation strategies. The analysis is undertaken by a multi-disciplinary team of Indonesian scientists, economists and legal specialists.
Steps planned to implement the Convention
To effectively implement the UNFCCC, the Goverment of Indonesia has made a number of significant steps in mainstreaming climate change issues with other national development priorities. The first of these was the issuance of the National Action Plan on Climate Change (MoE, 2007a), which describes appropriate actions to reduce GHG emissions and adaptation activities in Indonesia. This was then followed by a further document, “National Development Planning: Indonesia responses to climate change”, called as Yellow Book. The National De-velopment Planning Agency (Bappenas) subsequently developed a Climate Change Sectoral
Executive Summary
xii

IndonesIa second natIonal communIcatIon under the unIted natIons Framework conventIon on clImate change (unFccc)
Roadmap (ICCSR), meant to bridge the National Action Plan on Climate Change into the 5 year Mid-Term Development Plan (RPJM) 2010-2014, and to provide inputs for the subsequent RPJMN until 2030. The process of developing the Climate Change Roadmap is shown in Figure 1.
To support and accelerate the implementation of climate change programs, the Government of Indonesia established a number of innovative ways to link international financial resources with national investment strategies. One new source of funds to support the implementation of climate change programs in Indonesia is the Indonesian Climate Change Trust Fund (ICCTF), described briefly in the following section. This Indonesian Climate Change Trust Fund (ICCTF; Bappenas, 2009b) aims to be a showcase of alternative financing for climate change mitigation and adaptation programs. At this stage, the ICCTF has five specific objectives namely (i) to facilitate and accelerate investment in renewable energy and efficiency and simultaneously reduce GHG emissions from the energy sector, (ii) to reduce emission from deforestation and forest degradation and stabilizing carbon stock through sustainable forest and peat land management, (iii) to reduce vulnerability in coastal zones, agriculture and water sectors, (iv) to bridge the financial gaps necessary to address climate change mitigation and adaptation and (v) to increase the effectiveness and impact of external finance for climate change programs.
Following commitment of the GOI to actively participate in reducing its emissions through National Appropriate Mitigation Action (NAMA), in 2009, the President of the Republic of Indonesia at the G-20 meeting inPittsburgh and at COP15 in Copenhagen committed to an ambitious, world-leading target of 26% reduction in carbon emissions from Business As Usual (BAU) by 2020. Further emissions reductions of 41% are expected with international support. With this commitment, Indonesia will follow a low carbon development path. As such, BAPPENAS is coordinating the sectors to develop the National Action Plan for Reducing Greenhouse Gas Emissions (RAN-GRK). The GOI lists three principles in the RAN-GRK, stating that
Figure 1. Process of Development of Climate Change Sectoral Roadmap (ICCSR)
CLIMATE CHANGE ROADMAP
Policy instrument and
regulation Program ProjectFundingscheme
CapacityBuilding
Priority Sectors1. Agriculture2. Coastal, ocean and fishery3. Energy4. Forestry
Secondary Sectors1. Health2. Transportation3. Infrastructure4. Water5. Industry
Cross Cutting Issues1. Research and Technology2. Natioanal security3. Biodiversity4. Poverty
Current Status
Objectives Detailed
Policy guidance for climate
change planning and programming
Executive Summary
xiii

IndonesIa second natIonal communIcatIon under the unIted natIons Framework conventIon on clImate change (unFccc)
the mitigation actions (i) should not hinder economic growth, and should prioritize people’s welfare, especially in with regard to energy resilience and food security, (ii) support protection of poor and vulnerable communities, including environment conservation in the framework of sustainable development and (iii) consist of core activities to reduce emissions and supporting activities to strengthen the policy framework. Figure 2 shows the interconnection between policies, guidelines, roadmaps and investment funds towards low carbon development.
Measures to Facilitate Adequate Adaptation to Climate Change
Due to its geographical location, topography and socioeconomic aspects, Indonesia is vulnerable to the impacts of climate variability and climate change. The El Niño and La Niña phenomena (ENSO), as well as extreme meteorological conditions, have historically resulted in serious damage that affects a wide range of different socioeconomic sectors. A number of studies suggested that El Niño events have become more frequent as the global temperature anomalies associated with each El Niño continue to increase (Hansen et al., 2006; Timmerman et al. 1999). This suggests that the increasingly high temperatures are exacerbating the extreme regional weather and climate anomalies associated with El Niño.
By assessing historical natural hazard data from 1907-2007 (OFDA/CRED International Disaster Database 2007), it is clear that the first climate-natural hazard categorized as global hazard occurred for the first time in early 1950s; by the 1980s they were occurring more frequently. Over this entire record, the most frequent hazard has been flooding, followed by landslides and water or vector borne diseases, wind storms, forest fires, drought, and high tide/storm surge.
Figure 2. Process of mainstreaming climate change into national agenda: Policies, guidelines, roadmaps & investment funds (BAPPENAS, 2009b). Note: M is mitigation and A is adaptation.
BALI ROAD MAP
PRES STATEMENT:
G20 2009
ROADMAP
M
A
Indonesia:Low carbon
develop-ment
Gol’s ownbudget
Bi-/Multilateral cooperation
ICCTF
YellowBook
Bridges National Action Plan on CC (2007) into 5 yr mid-term development plan (RPJM) 2010-2014& imputs till 2030
ICCTF- International financ-ing mechanism channeling investment funds into national CC initiatives
Executive Summary
xiv

IndonesIa second natIonal communIcatIon under the unIted natIons Framework conventIon on clImate change (unFccc)
Furthermore, the top 20 natural hazards, causing huge economic loss and adverse human impacts, mostly occurred after the 1980s, suggesting increasing trend in hazards’ intensity (Boer and Perdinan, 2008).
With the increasing trend of climate hazards frequency and intensity, the most affected group will be the poorest sections of society, which are most exposed and least resilient. The capacity of this group to adapt to the extreme climate events and future climate change is limited due by their limited resource availability and access to climate information and technologies. It is likely, therefore, that their reliance on national and local public assistance from government will increase in the future. During the 2006/07 El-Nino, many farmers in the Timor district of East Nusa Tenggara Province—one of the most vulnerable districts to drought--experienced crop failure due to drought. As a consequence, the major source of income for the poorest came from government aid (‘bantuan pemerintah’). In addition to aid, many of farmers often have to sell their domestic livestock (ternak) or engage in informal laboring to generate additional income. At Indramayu, the drought occurrence associated with the 2002/03 El-Nino caused huge rice production loss. In 2003, the number of household that could not meet their food basic needs increased by 14% compare to the normal years (Boer et al., 2006).
It is clear, therefore, that improving access to a diversified set of incomes and resources is a key method for improving climate resilience. This is closely linked with rapid poverty reduction, which is essential to help poor and vulnerable communities improve their resilience both to natural climate variability and to the greater stresses of human-induced climate change in the future.
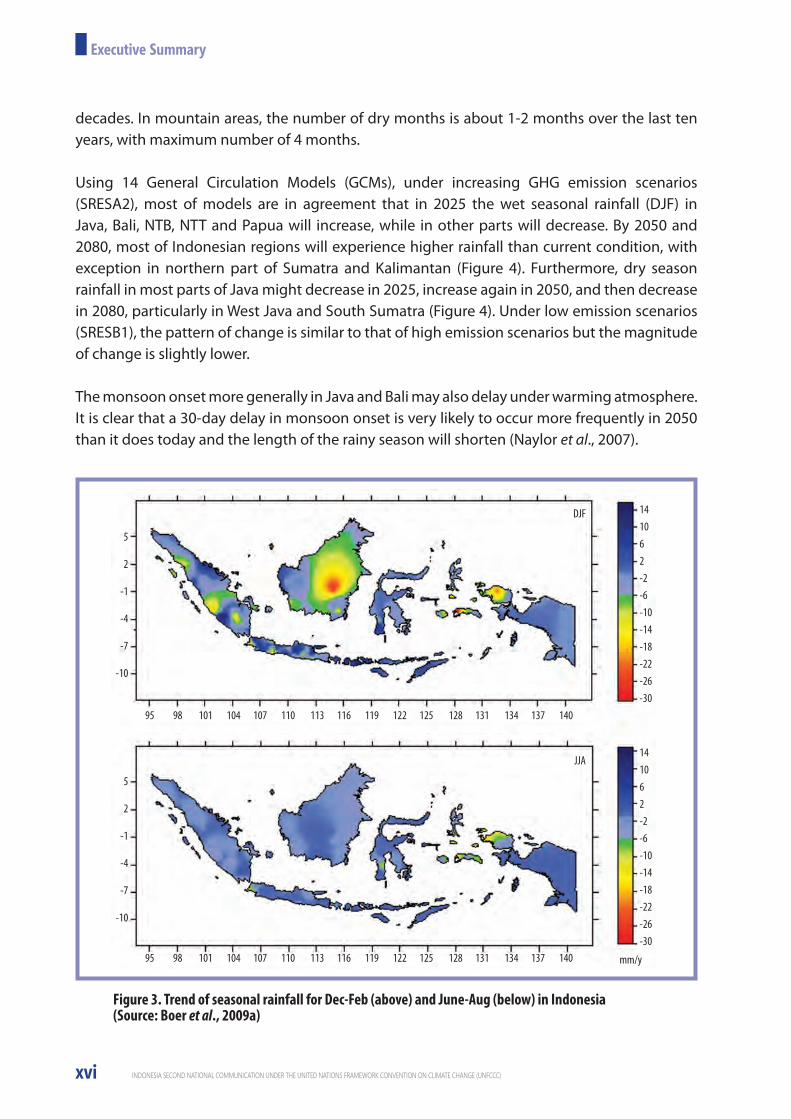
Observed Climatic Changes and Predictions. Analysis of long historical climate data suggests that maximum and minimum temperature have increased consistently (MoE, 2007). Significant decreases and/or increases in rainfall have also detected in many part of Indonesian region, with different significant trends in different areas. Based on data over 300 stations, with length of records between 20 and 50 years, a significantly decreasing trend in Dec-Jan rainfall was observed in small part of Java and Papua, and Sumatra and large part of Kalimantan islands, whereas significant increasing trend were observed in most of Java and Eastern Indonesia such as Bali, NTB and NTT (Figure 3). For Jun-Aug rainfall, significantly decreasing trends were observed in most of Indonesian region with exception in Pandeglang (West Java), Makasar (South Sulawesi), Monokwari, Sorong (Irian Jaya) and Maluku (Figure 3).
Monsoon onset has also changed in many part of Indonesia. Based on analysis of data from 92 stations spread over Indonesia, monsoon onset has increasingly been delayed in some part of Indonesia, particularly in Java; similarly, the length of the wet season has tended to shorten, particularly in South Sumatra, Java and Kalimantan. Other studies conducted in East Java also suggest that the number of extreme dry months in the Brantas Catchment area has increased in the last five decades, particularly in areas near to the coast (Aldrian and Djamil 2006). In such coastal areas, the number of extreme dry months increased to 4 months in the last ten years and in 2002 it reached 8 months, a level considered as the longest dry season for the whole five
Executive Summary
xv
IndonesIa second natIonal communIcatIon under the unIted natIons Framework conventIon on clImate change (unFccc)
decades. In mountain areas, the number of dry months is about 1-2 months over the last ten years, with maximum number of 4 months.
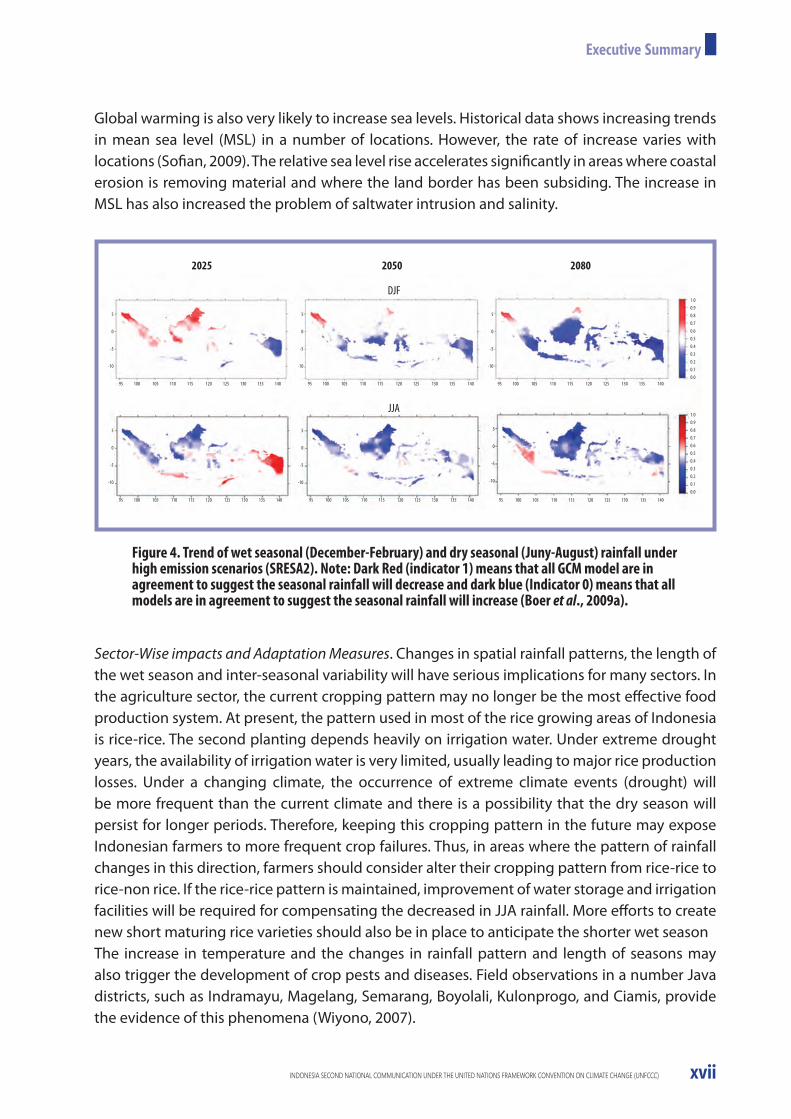
Using 14 General Circulation Models (GCMs), under increasing GHG emission scenarios (SRESA2), most of models are in agreement that in 2025 the wet seasonal rainfall (DJF) in Java, Bali, NTB, NTT and Papua will increase, while in other parts will decrease. By 2050 and 2080, most of Indonesian regions will experience higher rainfall than current condition, with exception in northern part of Sumatra and Kalimantan (Figure 4). Furthermore, dry season rainfall in most parts of Java might decrease in 2025, increase again in 2050, and then decrease in 2080, particularly in West Java and South Sumatra (Figure 4). Under low emission scenarios (SRESB1), the pattern of change is similar to that of high emission scenarios but the magnitude of change is slightly lower.
The monsoon onset more generally in Java and Bali may also delay under warming atmosphere. It is clear that a 30-day delay in monsoon onset is very likely to occur more frequently in 2050 than it does today and the length of the rainy season will shorten (Naylor et al., 2007).
Figure 3. Trend of seasonal rainfall for Dec-Feb (above) and June-Aug (below) in Indonesia (Source: Boer et al., 2009a)
5
2
-1
-4
-7
-10
141062-2-6-10-14-18-22-26-30
141062-2-6-10-14-18-22-26-30
mm/y
DJF
JJA
5
2
-1
-4
-7
-10
95 98 101 104 107 110 113 116 119 122 125 128 131 134 137 140
95 98 101 104 107 110 113 116 119 122 125 128 131 134 137 140
Executive Summary
xvi
IndonesIa second natIonal communIcatIon under the unIted natIons Framework conventIon on clImate change (unFccc)
Global warming is also very likely to increase sea levels. Historical data shows increasing trends in mean sea level (MSL) in a number of locations. However, the rate of increase varies with locations (Sofian, 2009). The relative sea level rise accelerates significantly in areas where coastal erosion is removing material and where the land border has been subsiding. The increase in MSL has also increased the problem of saltwater intrusion and salinity.
Sector-Wise impacts and Adaptation Measures. Changes in spatial rainfall patterns, the length of the wet season and inter-seasonal variability will have serious implications for many sectors. In the agriculture sector, the current cropping pattern may no longer be the most effective food production system. At present, the pattern used in most of the rice growing areas of Indonesia is rice-rice. The second planting depends heavily on irrigation water. Under extreme drought years, the availability of irrigation water is very limited, usually leading to major rice production losses. Under a changing climate, the occurrence of extreme climate events (drought) will be more frequent than the current climate and there is a possibility that the dry season will persist for longer periods. Therefore, keeping this cropping pattern in the future may expose Indonesian farmers to more frequent crop failures. Thus, in areas where the pattern of rainfall changes in this direction, farmers should consider alter their cropping pattern from rice-rice to rice-non rice. If the rice-rice pattern is maintained, improvement of water storage and irrigation facilities will be required for compensating the decreased in JJA rainfall. More efforts to create new short maturing rice varieties should also be in place to anticipate the shorter wet seasonThe increase in temperature and the changes in rainfall pattern and length of seasons may also trigger the development of crop pests and diseases. Field observations in a number Java districts, such as Indramayu, Magelang, Semarang, Boyolali, Kulonprogo, and Ciamis, provide the evidence of this phenomena (Wiyono, 2007).
Figure 4. Trend of wet seasonal (December-February) and dry seasonal (Juny-August) rainfall under high emission scenarios (SRESA2). Note: Dark Red (indicator 1) means that all GCM model are in agreement to suggest the seasonal rainfall will decrease and dark blue (Indicator 0) means that all models are in agreement to suggest the seasonal rainfall will increase (Boer et al., 2009a).
2025 2050 2080
DJF
JJA
95 100 105 110 115 120 125 130 135 140
95 100 105 110 115 120 125 130 135 140
95 100 105 110 115 120 125 130 135 140
95 100 105 110 115 120 125 130 135 140
95 100 105 110 115 120 125 130 135 140
95 100 105 110 115 120 125 130 135 140
5
0
-5
-10
5
0
-5
-10
5
0
-5
-10
5
0
-5
-10
5
0
-5
-10
5
0
-5
-10
1.00.90.80.70.60.50.40.30.20.10.0
1.00.90.80.70.60.50.40.30.20.10.0
Executive Summary
xvii

IndonesIa second natIonal communIcatIon under the unIted natIons Framework conventIon on clImate change (unFccc)
Furthermore, analysis of climate change impacts in rice production in Java suggested that production between 2025 and 2050 is likely to decrease by about 1.8 and 3.6 million ton from the current production level respectively (Boer et al., 2009b). By including the impact of rice field conversion to non-agriculture lands in Java, i.e. taking 0.77% of land out of production per annum, the production loss in 2025 and 2050 will increase to 5.2 and 13.0 million ton respectively. Thus, the impact of rice field conversion will be much higher than the impact of climate change. To compensate this loss, new rice areas of around1.5 and 3.5 million ha will be needed in 2025 and 2050 respectively outside Java. Alternatively, the loss can be compensated by increasing rice productivity by about 20% and 50% from the current levels. To achieve this, breeding technology would have to be able to increase rice productivity by about 1 t/ha and 2.5 t/ha from the current productivity (~5 t/ha).
A rapid assessment conducted by Parry et al. (1992) in a number of locations in Indonesia suggested that sea level rise due to global warming will also reduce local rice supply in Krawang and Subang districts by about 300,000 tonnes. Similarly, maize output would likely be reduced by 10,000 tons--about half of this due to inundation. Sea-level rise would also be likely to affect fish and prawn production. The loss is estimated at over 7000 tonnes and 4000 tons respectively (valued at over US$0.5m). In the lower Citarum Basin sea-level rise could result in the inundation of about 26,000 ha of ponds and 10,000 ha of crop land. This could result in the loss of 15 000 tons of fish, shrimp and prawns and about 940 000 ton of rice. Parry et al. stated that the socio-economic implications of this transition in Subang District alone could be the loss of employment for about 43 000 farm laborers. In addition more than 81 000 farmers would have to look for other sources of income due to the inundation of their rice fields or prawn and fish farms due to sea-level rise.
For water resources, the present condition of the water balance suggests that in most of Java and the eastern islands of Indonesia is already in deficit for most of year. With such conditions, increasing planting in these islands is not possible, further restricting options for increasing rice production outlined above. Under changing a climate, more districts will have water scarcity problems (Heriensyah et al., 2009). A key need is the development of new initiatives to anticipate the scarcity of water due to climate change and increases on water demand, especially in urban areas where populations are increasing and industrial activities are taking place. Inter-basin transfer of water may be one of the potential options to anticipate the scarcity of water in the future. In Indonesia many basins have surplus water resources, even in the ultimate stage of development, while others face serious shortages, especially during extreme drought years. Creation of storages and inter-basin transfer of water from surplus to deficit regions (such as in West Nusa Tenggara) could therefore be an option for achieving more equitable distribution of resources and their optimal utilization.
For coastal and Outer Islands, the increase in sea level by about 25 to 50 cm in 2050 and 2100 as projected by many models will inundated many parts of the coastal cities of Indonesia. Land subsidence will exacerbate this, increasing the total area that will be inundated permanently. Between 25% and 50% of area in a number of sub-districts in coastal cities such as Semarang,
Executive Summary
xviii

IndonesIa second natIonal communIcatIon under the unIted natIons Framework conventIon on clImate change (unFccc)
Surabaya, Jakarta and Medan will be under water permanently. The increase of sea level rise may also inundate the outer islands of the country, and this will affect the area of Indonesian territory. The analysis suggests that an increase of sea level of up to 50 cm will not inundate the outer islands of Indonesia permanently. However, in combination with tidal patterns in the region, about five outer islands will temporarily inundate. These islands include Alor (next to Timor Leste), Pelampong (next to Singapura), Senua (next to Malaysia), Simuk and Sinyaunyau (next to India).
The increase in sea temperature will also caused serious problems for the coral ecosystems. Wetland International (Burke et al., 2002) reported that the 1997 El-Niño damaged about 18% of the coral ecosystems in South East Asia. In Indonesia, coral bleaching was observed in many places such as in the eastern part of Sumatra, Java, Bali, and Lombok. In ‘thousands islands’ (north of the Jakarta coast), about 90-95% of the corals located 25 m below sea surface have been bleached.
For forests sector, the decreasing dry season rainfall and shortening length of wet season will increase the risk of forest fire. Two islands which are very prone to fire are Sumatra and Kali-mantan. Based on hotspot density patterns, two provinces that have very high hot spot density are Riau Province and Central Kalimantan. Hotspot densities in these two islands increased rapidly when dry season rainfall decreases or length of dry season extends, particularly during El Nino years. It was revealed that the hot spot density increase rapidly as the monthly rainfall in dry season by more than 50 mm below normal (Ardiansyah and Boer, 2010).
For health, extreme weather related to ENSO also contributes to the outbreak of human diseases such as malaria, dengue, diarrhea, cholera and other vector borne diseases. Dengue cases were found to increase significantly in La-Niña years when seasonal rainfall levels increased above average. A significant upward trend in the number of dengue cases was also observed in Java, especially in large cities. In the future, under changing climate it is likely that the risk of transmission of dengue and malaria may well increase (Hidayati et al., 2009).
All sectors have developed a number of measures to increase the capacity to address and to increase resilience to current and future climate risks respectively. The programs are described in the Yellow Book and the sectoral roadmap to address climate change (Bappenas, 2009a and 2009 b).
Measures to Mitigate Climate Change
The impact of implementation of mitigation options on the level of GHG emission is evaluated by comparing the emission level under Business as Usual (BAU) with emission level under two mitigation scenarios. Based on the emissions projection analysis, net emissions under BAU in 2020 are expected to be approximately 2.95 Gt CO2 – more than double the emissions in year 2000. It was found that by 2020, the rate of net emissions under mitigation scenario 1 reached
Executive Summary
xix

IndonesIa second natIonal communIcatIon under the unIted natIons Framework conventIon on clImate change (unFccc)
about 31% of that of the BAU and under mitigation scenario 2, it could reduce up to about 48% (Figure 5).
In energy sector, reducing of the emission from the BAU will be done through additional efforts related to energy conservation and new and renewable energy development (i.e. enhance geothermal program, micro-hydro, biofuel, biomass waste to energy, solar PV, wind energy and coal bed methane [CBM]). In industry sector, emission reduction will be done by increasing the efficiency in production processes, introduction of new technologies, or by changing the raw materials (i.e., using waste as an alternative material in the cement industry). The efforts can be achieved through the clean development mechanism (CDM) scheme and private sector participation. Public funding is still needed for the dissemination of programs related to CO2
emissions reductions in industrial processes.
In Agriculture sector, the key mitigation program will be through (i) implementing no-burning technology for land clearing, specifically in the horticulture and agriculture plantation sub-sectors, (ii) developing a Fire Early Warning System particularly in peat areas, (iii) introducing low methane emitting rice varieties, (iv) increasing the use of agriculture waste for bio-energy and composting, (v) introducing biogas technology, (vi) improving feeding quality and supplementation for livestock and (vi) developing new agriculture areas which will be directed to unproductive land such as grassland and abandoned land through revitalization of agriculture spatial plan program. In forestry sector, the mitigation measures will be done through (i) combating illegal logging and its associated trade, (ii) revitalizing forestry
Figure 5. Projection of emissions of all sectors under BAU and mitigation scenarios (MoE, 2009). Note: Contribution of transportation sector to the total energy emission is approximately 20% (based on emissions data from 2000-2006).
Peat Fire
Peat Emission
Waste
Forestry Emission
Forestry Removal
Agriculture
Industry
Energy
5.0
4.0
3.0
2.0
1.0
0.0
-1.0
-2.0
Emiss
ion/
Rem
oval
(GtC
O2)
2000
BAU
Miti
-1
Miti
-2
BAU
Miti
-1
Miti
-2
BAU
Miti
-1
Miti
-2
BAU
Miti
-1
Miti
-2
BAU
Miti
-1
Miti
-2
BAU
Miti
-1
Miti
-2
2005 2010 2015 2020 2025
Executive Summary
xx
IndonesIa second natIonal communIcatIon under the unIted natIons Framework conventIon on clImate change (unFccc)
industries, (iii) conserving and rehabilitating forest resources, (iv) empowering the economy of the community within and surrounding the forest area, and (v) stabilizing forest area for promoting and strengthening sustainable forest management. In waste sector, the emission reduction from solid waste will be done through converting the open dumping practices to a more managed solid waste handling system (i.e., a sanitary landfill equipped with gas flaring or utilization systems), and handling liquid domestic waste using sewerage systems.
Following commitment of the GOI to actively participate in reducing its emissions through National Appropriate Mitigation Action (NAMA), in 2009, the President of the Republic of Indonesia at the G-20 meeting in Pittsburgh and at COP15 in Copenhagen committed to an ambitious, world-leading target of 26% voluntary reduction in carbon emissions from Business As Usual (BAU) by 2020. Further emissions reductions of 41% are expected with international support. With this commitment, Indonesia will follow a low carbon development path. As such, BAPPENAS is coordinating the sectors to develop the National Action Plan for Reducing Greenhouse Gas Emissions (RAN-GRK). The GOI lists three principles in the RAN-GRK, stating that the mitigation actions (i) should not hinder economic growth, and should prioritize people’s welfare, especially in with regard to energy resilience and food security, (ii) support protection of poor and vulnerable communities, including environment conservation in the framework of sustainable development and (iii) consist of core activities to reduce emissions and supporting activities to strengthen the policy framework
Other Information
Other information considered relevant to the achievement of the objectives of the Convention includes (i) technology transfer, (ii) Research, (iii) systematic observations, (iv) information on education, training, public awareness and capacity-building and (v) efforts to promote information sharing. The role of NGOs in the implementation of adapatation and mitigation activities with local communities is quite significant. In general, NGOs play their roles as implementer and facilitator of CDM projects as well as voluntary carbon projects.
To accelerate the development of mitigation and adaptation technologies, the Government of Indonesia under the coordination of the Ministry of Agriculture has established the Research Consortium on Climate Variability and Climate Change. To monitor climate and sea level, the Government of Indonesia has installed rainfall stations in all Indonesia regions, a number of automatic weather stations (AWS) and radar in a number of places particularly in areas prone to weather/climate hazards, one Global Atmospheric Watch (GAW) in Bukittinggi, West Sumatra as part of the global atmospheric observation under World Weather Watch.
In forestry sector, development of systematic forest and land use monitoring systems is also crucial to support the implementation of programs for reducing emission from deforestation and forest degradation. The Government of Indonesia is in the process of establishing Indonesia’s National Carbon Accounting System (INCAS), based on Australia’s system but tailored to
Executive Summary
xxi
IndonesIa second natIonal communIcatIon under the unIted natIons Framework conventIon on clImate change (unFccc)
Indonesia’s (INCAS) unique circumstances. In addition, Indonesia is developing Indonesia’s Forest Resource Information System (FRIS), a comprehensive and transparent information management system to support effective planning and forest management decision making for forest lands in Indonesia.
Capacity building activities related to climate change were also quite significant but many of the activities were conducted at national level. To promote information sharing related to climate, many agencies have established a Web-based climate information system.
Barriers, and Related Financial, Technical and Capacity Needs
As developing country, Indonesia has several limitations in funding in the frame of climate change anticipation as well as developing and disseminating environmentally friendly technology. Therefore, the problems of technology transfer and funding are two issues that should receive support from international community. Additional important activities, which will ensure success of mitigation and adaptation program, are awareness, education, empowerment and capacity building.
To meet financial need for addressing climate change problem, the GOI Indonesia has created various funding schemes, from domestic sources as well as from bilateral and multilateral sources. One of important funding sources is Indonesian Climate Change Trust Fund (ICCTF). At the initial phase, the ICCTF will be created as an “Innovative Fund,” which involves grant funding from development partners that will help overcome barriers for early program deployment. At the later stages, the ICCTF may advance by establishing a “Transformation Fund” mechanism, which would involve all available funding (i.e., public-private partnerships, loan and world capital market sources)
The immediate need to mitigation technology for Indonesia is the energy efficient technology particularly for sectors that consume energy such as power plants, industry, transportation, as well as household and commercial sectors. Real time monitoring and the use of sophisticated fire fighting technology and peat management is also required to control emission from forest/peat fire and peat decomposition. To increase the resilience to current and future climate risk, the development and implementation of a comprehensive communications strategy to increase the capacity in using climate information is also needed as well as institutionalizing the use of climate information. The development and promotion of tools for adaptation planning tailored to user’s requirements that include (i) decision-support tools such as methods for assessing the costs and benefits of adaptation strategies, and guides for risk management, (ii) methods for understanding social impacts, and (iii) a national ‘one stop shop’ website where decision-makers and their advisers can access information about climate projections, likely climate change impacts, tools, guides and approaches to adaptation planning will also be required.
Executive Summary
xxii

IndonesIa second natIonal communIcatIon under the unIted natIons Framework conventIon on clImate change (unFccc)
List of Figure
Figure 1.1 Map and overview of Indonesia, 2007 I-1Figure 1.2 Percent decrease in seasonal rainfall from normal during two strong El Niño years, 1997 and 1982 (Irawan, 2002) I-3Figure 1.3 Number of climate hazards by type (left) and by year (right). Source: Based on data from OFDA/CRED International Disaster Database (2007) I-4Figure 1.4 Final energy consumption in Indonesia, 2000 – 2007 [MEMR, 2008] I-7Figure 1.5 Fraction of forest loss in forest area and non-forest area I-10Figure 1.6 Rate of deforestation in Indonesia (MoF, 2007) I-11Figure 1.7 Development of the main agricultural systems from 1986 to 2006 (Data taken from Central Bureau of Statistics) I-12Figure 1.8 Development of the main plantation areas from 1986 to 2006 (Data taken from Central Bureau of Statistics) I-13Figure 2.1 Structure of the institutional arrangements for developing NGHGI 2000-2005 II-2Figure 2.2 National emissions contributions by sector II-7Figure 2.3 Estimate of emissions from peat fires from various studies. Note: Emissions estimates from years beyond the publication date of the reports were made by Aldrian (2008) and Wibowo and Boer (2009) II-8Figure 2.4 CO2 emissions by sectors in 2000 II-8Figure 2.5 Methane and nitrous oxide emissions in 2000 by sector II-9Figure 2.6 Source of GHG emissions from fuel combustion activities II-10Figure 2.7 Source categories of fugitive emissions from fuels II-11Figure 2.8 CO2 emissions estimates from the energy sector using reference and sectoral approaches II-11Figure 2.9 CO2 emissions from the energy sector by source category II-12Figure 2.10 Annual Growth rate of CO2 emission and GDP of main emitter countries (World Bank) II-13Figure 2.11 GHG emissions estimates from production process activities in the industrial sector II-14Figure 2.12 GHG emissions from the agriculture sector from 2000-2005 by source category II-15Figure 2.13 Distribution of methane emissions from enteric fermentation (Gg CH4) by species type II-16Figure 2.14 Methane emissions from livestock in Indonesia from 2000-2006 II-17Figure 2.15 Methane emissions from manure management (Gg CH4) II-17Figure 2.16 Methane emissions from rice from 2000-2005. II-18
xxiii

IndonesIa second natIonal communIcatIon under the unIted natIons Framework conventIon on clImate change (unFccc)
Figure 2.17 CO2 emissions from liming in agriculture. II-19Figure 2.18 CO2 emissions from urea fertilization from 2000-2005 II-19Figure 2.19 Direct N2O emissions from N synthetic fertilizer and manure management applied to managed soil and flooded rice II-20Figure 2.20 Indirect N2O emissions and projections from N synthetic fertilizer and animal manure applied to managed soils II-21Figure 2.21 GHG emissions from LUCF sector from 2000-2005 by source category II-24Figure 2.22 Categories of GHG emissions sources within thewaste sector II-26Figure 2.23 GHG emissions from the waste sector from 2000-2005 by source category II-27Figure 2.24 Emissions trends by sector II-28Figure 3.1 Linkages between climate change-related documents, development planning and the budgeting process III-2Figure 3.2 Development of the climate change roadmap III-3Figure 3.3 Process of mainstreaming climate change into national agenda: Policies, guidelines, roadmaps & investment funds (BAPPENAS, 2009b). Note: M is mitigation and A is adaptation. III-4Figure 3.4 ICCTF development (BAPPENAS, 2009b) III-5Figure 3.5 Coordination mechanism of ICCTF (BAPPENAS, 2009b) III-6Figure 4.1 (a) Anomaly of mean global temperature of sea-land and (b) 2001-2005 mean surface temperature relative to 1951–1980 measured at meteorological stations and ship and satellite SST measurements (Hansen et al., 2006) IV-2Figure 4.2 Sea level rise trends based on altimeter data from January 1993 to December 2008 (Sofian, 2010) IV-3Figure 4.3 Seasonal rainfall trends (mm/year) for Indonesia (Boer et al., 2009) IV-5Figure 4.4a Distribution of maximum monthly rainfall during the wet and dry seasons in Sibolga-North Sumatra, Maulaboh-West Sumatra and Jatiwangi-West Java (Boer et al., 2010) IV-6Figure 4.4b Distribution of maximum monthly rainfall (mm) during the wet and dry seasons in MuaraTewe-Central Kalimantan and Sorong-Papua (Boer et al., 2009) IV-7Figure 4.5 Level of probability for seasonal rainfall to change in the future (Note: rainfall in areas colored dark red will decrease in the future, and rainfall in areas colored dark blue will increase in the future with relatively high level of confidence (Boer et al., 2009 IV-8Figure 4.6 (a) Summed precipitation for AMJ and JAS for the present climate (dashed line) and for the future predicted climate, using the A2 scenario, and (b) Likelihood of exceeding the 30-day monsoon threshold in 2050. The thick rectangle shows the middle tercile, and the horizontal lines on either side show the lower and upper terciles. The arrows indicate the mean future probability for all GCMs. The vertical
List of Figure
xxiv

IndonesIa second natIonal communIcatIon under the unIted natIons Framework conventIon on clImate change (unFccc)
lines show the observed probability for 1983–2004 (Naylor et al., 2007). Note: The analysis was done using 15 different GCMs and 3EDMs IV-9Figure 4.7 Change in cumulative cropping area in the wet season (MH) and dry season (MK) during ENSO years (El Niño and La Niña) compared to normal years (Boer, 2009) IV-10Figure 4.8 Mean area of dry season rice affected by drought from 1989-2006 (above), during El Niño years (middle) and La Niña years (bottom). Source: Boer (2009) IV-11Figure 4.9 The relationship between comfort index and length of pregnancy period (left) and comfort index and interval between two births (right). Source: Rohman and Boer, 2001 IV-13Figure 4.10 Changes in rice production in Java by 2025 and 2050 compared to current rice production due to increasing in temperatures and CO2 concentrations for SRESB1 and SRESA2 using various cultivated area values and planting indices (Boer et al., 2008) IV-15Figure 4.11 Increasing percentage of irrigated rice fields from a dam water source by increasing IP to 2.5 for West Java, 2.3 for Central Java and 2.2 for East Java (Boer et al., 2008) IV-16Figure 4.12 Expanding irrigated area needed to compensate for loss of rice production in Java due to climate change and land conversation where no change in IP is feasible (Scenario 2). Source: Boer et al. (2008) IV-18Figure 4.13 Relationship between fraction of unutilized rainfall (f ) and forest cover (Heriensyah et al., 2009) IV-20Figure 4.14 Relationship between HDI and industrial areas in Indonesia (Heriensyah et al., 2009) IV-21Figure 4.15 Status of water balance under current and future climate (Heriensyah et al., 2009) IV-22Figure 4.16 Number of districts without surplus water by length under current and future climate scenarios (Heriensyah et al., 2009). Note: Both the bar graph (top) and table (below) show the same data. IV-23Figure 4.17 Classification of regions at risk to fire based hotspot density patterns – Sumatra (left) and Kalimantan (right) (Ardiansyah and Boer, 2009 IV-25Figure 4.18 The relationship between hotspot density and rainfall anomaly in Kalimantan and Sumatra for (a) Pattern 1, (b) Pattern 3, (c) Pattern 4, (d) Pattern 5 and (e) Pattern 6 IV-26Figure 4.19 Median value of hot spot density for pattern 5 and pattern 6 regions under current and future climate (Ardiansyah and Boer, 2009) IV-27Figure 4.20 Keetch and Byram Drought Index for baseline period of 1960-1990 (top), for A2 projection period of 2070-2100 (middle) and for B2 projection period of 2070-2100 (bottom) foreast Kalimantan, Indonesia. The fire danger index rating classes are: low (0-999); moderate (1000-1449); high (1500-1749); extreme (1750 -2000). Source: CIFOR (2008) IV-27
List of Figure
xxv
IndonesIa second natIonal communIcatIon under the unIted natIons Framework conventIon on clImate change (unFccc)
Figure 4.21 The number of surviving and dead trees per hectare after forest firesin 1982/83 and 1997/98 (Ngakan, 2002) IV-28Figure 4.22 Composition of species per hectare in plots which were lightly, moderately and severely damaged by fires in Kutai National Park, East Kalimantan IV-28Figure 4.23 Distribution of floods based on the scenario of sea level rise + high tide: 0.25+2.69 m (A) and 1.0+2.69 m (B). Source: Hariati et al.,2009 IV-31Figure 4.24 Distribution breadth and depth of inundation due to sea level rise and high tide of Medan and surrounding areas (Hariati et al., 2009) IV-32Figure 4.25 Distribution of low elevation (< 0 meterdpal)areas in DKI Jakarta IV-33Figure 4.26 Distribution of floods based on sea level rise of 0.25 m (A), 1.0 m (B), sea level rise + high tide of 2.28 m (C) and sea level rise + high tide of 3.03 m (D). Source: Hariati et al., 2009 IV-34Figure 4.27 Area of flooding and depth of flood due to sea level rise and high tide in the Jakarta region. Source: Hariati et al., 2009 IV-35Figure 4.28 Number of residents affected by flooding due to sea level rise and high tide in Jakarta. Source: Hariati et al., 2009 IV-35Figure 4.29 (A) Growth of cone impairment (cone depression) in the groundwater aquifer from 1984 until 2000, and (B) land subsidence rates in Semarang City. Source: Georisk Project, 2008 IV-37Figure 4.30 Distribution of floods based a sea level rise of 0.25 m (A), 1.0 m (B), and sea level rise + high tide equal to 2.28 m (C) and 3.03 m (D) in Semarang. Source: Hariati et al., 2009 IV-38Figure 4.31 Flood area and flood depth due to sea level rise and high tide in Semarang. Source: Hariati et al., 2009 IV-39Figure 4.32 Distribution of floods based on land subsidence and sea level rise of 0.25 m (A), 0.50 m (B), 0.75 m (C) and 1.0 m (D). Source: Hariarti et al., 2009 IV-39Figure 4.33 Flood area and flood depth due to sea level rise and land subsidence in Semarang area. Source: Hariarti et al., 2009 IV-40Figure 4.34 The number of residents affected by flooding due to sea level rise and high tide.Source: Hariarti et al., 2009 IV-41Figure 4.35 Distribution of floods based sea level rise of 0.25 m (A), 1.0 m (B), and sea level rise + high tide equal to 3.16 m (C) and 3.91 m (D) in Surabaya. Source: Hariati et al., 2009 IV-42Figure 4.36 Flood area and flood depth due to sea level rise and high tide in Surabaya. Source: Hariati et al., 2009 IV-43Figure 4.37 The number of residents affected by flooding due to sea level rise and high tide in Surabaya. Source: Hariati et al., 2009 IV-43Figure 4.38 Construction of a dike to reduce flooding from high tides and extreme waves in East Harbour of Muara Bary, Jakarta. Source: Media Indonesia, 2007 IV-44
List of Figure
xxvi
IndonesIa second natIonal communIcatIon under the unIted natIons Framework conventIon on clImate change (unFccc)
Figure 4.39 Incidence rate of dengue fever and the number of affected cities and districts in Note: 1973, 1988 and 1998 were La Niña years. Source: Ministry of Health. IV-46Figure 4.40 Annual trend of dengue incidence rates in districts in Java in period between 1992-2005 (cases per 100,000 people per year). Source: MoE, 2007b. IV-47Figure 4.41 Transmission potential of dengue fever under current and future climate (Hidayati et al., 2009). Note: Red represents the highest risk and blue represents the lowest risk IV-49Figure 4.42 Transmission potential of malaria under current and future climate (Hidayati et al., 2009). Note: Red represents the highest risk and blue represents the lowest risk IV-50Figure 5.1 Energy projections by type of energy under the BAU scenario, 2010-2030 V-5Figure 5.2 Power plant projections by fuel type under the BAU scenario, 2010-2030 V-6Figure 5.3 Projection of GHG emissions generation by fuel type under the BAU scenario, 2010-2030 V-7Figure 5.4 Projection of GHG emissions generation by sector under the BAU scenario, 2010-2030 V-7Figure 5.5 GHG emissions projections by fuel type under BAU, CLIMATE and PERPRES scenarios V-11Figure 5.6 Total GHG emissions projections under BAU, CLIMATE and PERPRES scenarios V-11Figure 5.7 GHG emissions reduction potential under BAU, CLIMATE 1, CLIMATE 2, and PERPRES scenarios V-12Figure 5.8 Total projected demand of biofuel in the transportation and industrial sectors and estimated investment cost of the biofuel production system V-14Figure 5.9 Rate of carbon sequestration and emissions under the BAU scenario and the two mitigation scenarios (Ministry of Forestry) V-23Figure 5.10 The projection of methane emissions from rice paddies under the baseline and mitigation scenarios (Setyanto et al., 2009) V-28Figure 5.11 Projected methane emissions from livestock (Suryahadi et al., 2009) V-31Figure 5.12 Projection of emissions of all sectors under BAU and mitigation scenarios (MoE, 2009). Note: Contribution of transportation sector to the total energy emission is approximately 20% (based on emissions data from 2000-2006). V-33Figure 6.1 Number of NGOs working in climate change mitigation activities on energy and waste sectors (Boer et al., 2008) VI-1Figure 6.2 Existing operational Sea Level Monitoring Stations in Indonesia (MoE, 2008) VI-4Figure 6.3 Number of agroclimatic stations by province (Surmaini et al., 2010) VI-5
List of Figure
xxvii

IndonesIa second natIonal communIcatIon under the unIted natIons Framework conventIon on clImate change (unFccc)
Figure 6.4 Donor countries/agencies who contribute to the implementation of capacity building activities on climate change (Based on data collected from the Ministry of Environment) VI-7Figure 6.5 Types of capacity building activities on climate change by year (Based on data collected from the Ministry of Environment) VI-8Figure 6.6 Development of web-based climate information system at four regional offices (Provided by the BMKG) VI-8Figure 7.1 Climate Change Financing Scheme (BAPPENAS, 2009) VII-2
List of Figure
xxviii
IndonesIa second natIonal communIcatIon under the unIted natIons Framework conventIon on clImate change (unFccc)
Table 1.1 Per capita GDP and growth rates of the economy, 1997-2007 I-5Table 1.2 Labor force and open unemployment in Indonesia, 2000-2008 I-6Table 1.3 Type of final energy consumption by sector, 2007 MMBOE I-7Table 1.4 Growth and production of industrial products (000 ton) in the period 2000-2005 I-9Table 1.5 Forested and non-forested land in forest and non-forest area in 2007 (thousand ha) I-10Table 2.1 Summary of national GHG emissions in 2000 (in Gg CO2e) II-4Table 2.2 Energy sector emissions from 2000 to 2005 by gas (Gg CO2e) II-12Table 2.3 CO2 emissions from fossil consumption and fugitive emission from 2000-2005 (Gg CO2e) II-12Table 2.4 GHG emissions from the industrial sector from 2000 to 2005 by gas (in Gg CO2e) II-13Table 2.5 GHG emissions from the industrial sector from 2000 to 2005 by source category (in Gg CO2e) II-14Table 2.6 GHG emissions from the agriculture sector from 2000 to 2005 by gas (in Gg CO2e) II-15Table 2.7 Livestock population in Indonesia from 2000-2006 II-16Table 2.8 Direct and indirect N2O emissions from manure management II-18Table 2.9 Distribution of GHG emissions from grassland burning from 2000-2005 (Gg CO2e) II-21Table 2.10 Distribution of GHG emissions from cropland burning from 2000-2005 (Gg CO2e) II-22Table 2.11 Adjustment of Indonesia’s land category by Ministry of Forestry into 2006 IPCC GL categories II-22Table 2.12 GHG emissions and removal from LUCF (in Gg CO2e) II-23Table 2.13 Emissions from peat fires according to relevant studies II-25Table 2.14 Impact of selecting different emissions estimates from peat fire on national figures and the relative position of Indonesia as an emitter country II-25Table 2.15 GHG emissions and removal from waste (in Gg CO2e) II-27Table 2.16 Key Category Analysis II-28Table 2.17 Estimates of uncertainty level for activity data and emissions factors II-30Table 2.18 Level of current uncertainty of Indonesian National GHG Inventory for 2000 and 2004 and trend and potential reduced uncertainty with the incorporation of necessary improvement for the first three key source categories II-30
List of Table
xxix

IndonesIa second natIonal communIcatIon under the unIted natIons Framework conventIon on clImate change (unFccc)
Table 4.1 Decrease in rice production in Java compared to current production as increasing temperature and CO2 concentration in Scenario1 (Boer et al., 2009) IV-14Table 4.2 Total rice field area (ha) in three provinces in Java for 2025 and 2050 using a rice field conversion rate of 0.77% per year (Scenario 2) IV-15Table 4.3 Cropping index scenario for rice in three provinces in Java for 2025 and 2050 (Boer et al., 2008) IV-16Table 4.4 Increased productivity levels needed to maintain current production levels in 2025 in 2050 under Scenario 5 (IP increased and land conversi- onoccurred; Boer et al., 2008) IV-17Table 4.5 Increased productivity levels needed maintain current production in 2025 and 2050 under Scenario 6 (IP constant and land conversion occurred) IV-17Table 4.6 Number of districts that have no months without water surplus (Heriensyah et al., 2009) IV-23Table 4.7 Area affected by forest fire in 1997/1998 (expressed in ha) IV-24Table 4.8 Total national economic loss due to fires during the 1997 El Niño year (expressed in million USD) IV-25Table 4.9 Economic loss per ha of affected land use type IV-31Table 4.10 Impact of sea level rise and high tide on population and land use in Medan (Hariati et al., 2009) IV-32Table 4.11 Percent distribution area of low elevation (<0 meters below sea level in DKI Jakarta IV-33Table 4.12 Impact of sea level rise and high tide on the population and land use in Jakarta Source: Hariati et al., 2009 IV-36Table 4.13 Shoreline retreat due to sea level rise and land subsidence (Hariarti et al., 2009) IV-40Table 4.14 Impact of sea level rise, high tide and land subsidence on the population and land use in Semarang. Source: Hariarti et al., 2009 IV-41Table 4.15 Impact of sea level rise and high tide on population and land uses in Surabaya Source: Hariati et al., 2009 IV-43Table 4.16 The ten main of health problems recorded by hospitals in Indonesia in 2006 (Source: Ditjen Pelayanan Medik - Ministry of Health, 2006) IV-45Table 4.17 Percent change in transmission potential for malaria and dengue fever (Hidayati et al., 2009) IV-48Table 4.18 General adaptation options to reduce the potential health impacts of climate change IV-51Table 5.1 Projection of energy supply mix under BAU, CLIMATE and PERPRES scenarios (million BOE) V-9Table 5.2 Projection of sectoral energy demand under BAU, CLIMATE and PERPRES scenarios (million BOE) V-10Table 5.3 Projection of installed capacity demand of power generation under BAU, CLIMATE 1 and CLIMATE 2 scenarios (in MW) V-10
List of Table
xxx

IndonesIa second natIonal communIcatIon under the unIted natIons Framework conventIon on clImate change (unFccc)
Table 5.4 Selected mitigation options V-13Table 5.5 Additional demand of biofuel and GHG emissions reduction potential and cost V-15Table 5.6 New investments for advanced (more efficient) coal power plants under the BAU, CLIMATE1 and CLIMATE 2 scenarios V-15Table 5.7 The installed capacity, additional investment and GHG emissions of natural gas power plants from 2010-2030 V-16Table 5.8 The installed capacity and the required investment for renewable power plants under the BAU, CLIMATE 1 and CLIMATE 2 scenarios V-17Table 5.9 Energy efficiency improvements by sector, 2020-2030 V-18Table 5.10 Projected emissions from the industrial sector under BAU and mitigation scenarios (Ggram CO2e) V-19Table 5.11 Rate of planting in the Strategic Plan of the Ministry of Forestry (MoF, 2009) V-23Table 5. 12 Program support from international agencies for forestry mitigation projects in Indonesia V-24Table 5.13 Mitigation potential and cost for forestry sector V-26Table 5.14 Mitigation scenarios for reducing methane emissions from rice paddies V-29Table 5.15 Projected mitigation technology options adopted for livestock V-31Table 5.16 Projection of GHG emissions from waste sector under BAU and alternative scenarios (Dewi et al., 2009) V-33Table 6.1 Rain gauges density in Indonesia VI-4
List of Table
xxxi

IndonesIa second natIonal communIcatIon under the unIted natIons Framework conventIon on clImate change (unFccc)xxxii

IndonesIa second natIonal communIcatIon under the unIted natIons Framework conventIon on clImate change (unFccc)
Glossary of Abbreviations
EDM = Empirical Downscaling ModelAD = Activity DataADB = Asian Development Bank ADPC = Asian Disaster Preparedness Centre ADRC = Asian Disaster Reduction Center AFC = Asian Financial Crisis Al = Aluminum AMJ = April, May, JuneAPL = Area Penggunaan Lain (Other land uses)APPI = Association of Fertilizer ProducersAR = Afforestation and Reforestation AS = Ammonium Sulfate AWS = Automatic Weather Stations BALITKILIMAT = Research Agency on Agro-climatology and Hydrology BAPLAN = Directorate General of Planology BAPPENAS = National Agency for Planning and DevelopmentBAU = Business as Usual BBSLDA = Center for Agiculture Land Resources and Development BI = Births BMKG = Meteorology, Climatology, and Geophysical Agency BOD = Biological Oxygen Demand bpd = barrels per day BPPT = Agency for Technology Assessment and Application BPS = Badan Pusat Statitistik (Indonesian Bureau of Statistics)BPSDA = Balai Pengelolaan Sumberdaya AirC = ConfidentialCBM = Coal Bed Methane CCROM-IPB = Centre for Climate Risk and Opportunity Management-Bogor Agriculture University CCS = Carbon Capture and Storage CDM = Clean Development Mechanism CFBC = Coal Fluidized Bed Combustion CH4 = Methane CI = Cropping IndexCIFOR = for International Forestry Research CL = Crops LandCO2 = Carbon Dioxide CO2e = Carbon Dioxide Equivalent COP = Conference of Parties COP13 = 13th Conference of Parties COP15 = 15th Conference of PartiesCOREMAP = Coral Reef Rehabilitation and Management Program CRED = Center for Research on the Epidemiology of Disaster
CWPB = Centre-Worked Prebake Depsos = Ministry of SocialDFID = United Kingdom Department for International Development DJF = December, January, FebruaryDNM = Directorate for Nature and Management DNPI = National Committee on Climate Change DNS = Debt for Nature Swaps DOC = Degradable Organic Content EE = Energy Efficiency EF/RF = Emissions Factor/Removal FactorEFBs = Empty Fruit Bunches ENSO = El Niño Southern Oscillationf = Fraction of rainfall that cannot be utilized FBS = Feed Supplement Blocks FCCP = Forestry-Climate Change Project FCPF = Forest Carbon Partnership Facility FMU = Forest Management Unit FMUs = Forest Management Units GAW = Global Atmospheric Watch GCMs = General Circulation Models GDP = Gross Domestic Product GEF = Global Environment Facility GEF = Global Environmental Fund GFC = Global Financial Crisis GFF = Global Forest Fund GHGs = Greenhouse Gases GL = Guidelines GL = Grass LandGOI = Government of Indonesia GPG = Good Practice Guidance NFI = National Forest Inventory H2S = Hydrogen Sulfide ha = HectareHDI = Human Development Index HK = Conservation Forest HL = Protection Forest HoB = Heart of Borneo HP = Production Forest HPK = Convertible Production Forest IAARD = Indonesian Agency for Agriculture Research and DevelopmentICCTF = Indonesian Climate Change Trust Fund IDR = Indonesia RupiahIE = Including Elsewhere IFCA = Indonesian Forest Climate Alliance IGCC = Integrated Gasification Combined CycleINCAS = Indonesian National Carbon Accounting SystemINDEF = Institute for Development Economics and Finance IndTEWS = Indonesia Tsunami Early Warning System
xxxiii

IndonesIa second natIonal communIcatIon under the unIted natIons Framework conventIon on clImate change (unFccc)
Inpres = Presidential Instruction IP0 = Current Planting Index IPB = Bogor Agriculture University / Institut Pertanian BogorIPCC = Intergovernmental Panel on Climate Change IRI = International Research Institute for Climate and Society ITB = Bandung Institute of Technology ITCZ = Inter-tropical Convergence Zone JAS = July, August, SeptemberJJA = June, July, AugustKAfarm = Water demand for agriculture KAindustry = Water demand for industrial sectors KApopulation = Water demand for domestic use kc = Crop Coefficient NTB = West Nusa TenggaraKEN = National Energy PolicyKep. MENLH = Decree of the State Minister of EnvironmentKepmen Ekuin = Ministerial Decree Km = KilometerLAPAN = National Agency for Aviation and SpaceLFG = Landfill Gas LIPI = The Center for Oceanography Research of the Indonesian Institute of Science LPG = Liquified Petroleum GasLPMH = Harvested Area During the Wet Season LPMK = Harvested Area During the Dry Season LPTP = Lembaga Pengembangan Teknologi PedesaanLUCF = Land Use Change and Forestry LULUCF = Land Use, Land Use Change and Forestry MAM = March, April, MayMDGs = UN Millennium Development GoalsMEMR = Ministry of Energy and Mineral ResourcesMEWS = Meteorological Early Warning System MH = Wet Season MK = Dry Season MMBOE = Million Barrel Oil EquivalentMoA = Ministry of Agriculture MoF = Ministry of Forestry MRT = Mass Rapid Transport MRV = Reporting and Verification MSE = Ministry of State of Environment MSW = Municipal Solid Waste MW = Megawatts N = Nitrogen N2O = Nitrous Oxide NA = Not ApplicableNAD = Nanggroe Aceh Darusalam NAMA = National Appropriate Mitigation Action NAO = North Atlantic OscillationNE = Note EstimatedNGHGI = The Indonesian National Greenhouse Gas Inventory NGOs = Environmental non-Governmental Organizations NO = Not Occurring NPK = Nitrogen, Phosphorus And Potassium NTFP = Non Timber Forest Product
NTT = East Nusa TenggaraODA = Official Development Assistance ODA = Overseas Development Assistance OFDA = Office of U.S. Foreign Disaster AssistanceOM = Organic Matter P = Population Density PDO = Pacific Decadal Oscillation PEACE = Pelangi Energi Abdi Citra Enviro Permenhut = Ministry of Forestry Regulation PERPRES = Presidential DecreePFCs = Perfluorocarbons PLN = National Electricity EnterprisePP = Pregnancy Period PP = Polypropylene PP = Government Regulation PU = Ministry of Public WorksQA/QC = Quality Assurance/Quality Control RAN-GRK = National Action Plan for Reducing Greenhouse Gas Emissions REDD = Reducing Emissions from Deforestation and Forest Degradation REL = Reference Emission Level RKP = Rencana Kerja PemerintahRmonthly = Monthly Rainfall RPJMN = The Mid-Term National Development Plan RUKN = General Plan of National ElectricityRUPTL = Business Plan of Electricity SupplySCCF = Special Climate Change Fund SGP-GEF UNDP = Small Grant Program-Global Environmental Facility UNDPSIGN = Sistem Inventarisasi Gas Rumah Kaca NasionalSLR = Sea Level Rise SNC = Second National Communication SNI = National Standard SON = September, October, NovemberSSTs = Sea Surface Temperatures SWDS = Solid Waste Disposal Site SWS = Satuan Wilayah SungaiTC = Technical Cooperation TERANGI = Indonesian Coral Reef Foundation TOW = Total Organic WasteTP = Potential Transmissions UNDP = United Nations Development Programme UNEP = United Nations Environment Programme UNFCCC = United Nations Framework Convention on Climate Change UN-OCHA = United Nations Office for Coordination of Humanitarian Affairs USD = United State DollarUSDA = United State Department of AgricultureWHO = World Health Organization WRI = World Resources Institute WWF = World Wildlife Fund WWT = Wastewater Treatment
Glossary of Abbrevations
xxxiv

IndonesIa second natIonal communIcatIon under the unIted natIons Framework conventIon on clImate change (unFccc)
1.1 Geography and Climate
Indonesia is located between 6o08’ North and 11o15’ South latitude, and from 94o45’ to 141o05’ East longitude. The country covers 790 million hectares (ha), with a total coastline of 81,000 km and land territory of about 200 million ha. It has five large islands (Sumatra, Java, Kalimantan, Sulawesi and Irian Jaya) and approximately 13,667 small islands, of which more than half (56%) are nameless and only 7% are permanently inhabited (Figure 1.1). Extensive coastal plains and mountain areas of 1,000 metres (m) above sea level are characteristics of Sumatra, Kalimantan and Irian Jaya. Of the 200 million ha of land territory, about 50 million ha are devoted to various agricultural activities. There is nearly 20 million ha of arable land, of which about 40% is wetland (e.g., rice fields), 40% is dry land, and 15% is shifting cultivation. Since 2005, the Republic of Indonesia has been divided administratively into 33 provinces.
Indonesia’s climate is dominated by monsoons, which give a degree of homogeneity across the region. Indonesia lies across the range of the Inter-tropical Convergence Zone (ITCZ) where the northeast and southeast trade winds penetrate the doldrums. Strong ascending motion, overcast skies, strong squalls, heavy rainfall and severe local thunderstorms with variable intensities are characteristics of this zone.
Figure 1.1 Map and overview of Indonesia, 2007
CHAPTER I
National Circumstances
Island: 13,667(56% nameless, 7% permanent inhabited)
Land: 1.92 sq.kmMaritime are: 7.9 sq.km
People: 224 millions (5996 in Java)
Papua
Maluku
Nusa TenggaraBaliJava
Sumatera
Kalimantan
Sulawesi
I-1
IndonesIa second natIonal communIcatIon under the unIted natIons Framework conventIon on clImate change (unFccc)
The rainfall pattern in Indonesia consists of three types (Boerema, 1938). The first type is a monsoon rainfall with a monthly rainfall peak in December. The second is a more localised rainfall pattern in the eastern equatorial part of the country with a monthly rainfall peak in July-August. The third rainfall type is an equatorial rainfall characterized by two monthly rainfall peaks, in March and in October.
The monsoon rainfall can be further categorized into two groups that are prevalent in southern Indonesia. While both groups indicate a clear distinction between a dry and a wet season throughout the year, the first shows a longer dry period (i.e., in the eastern Nusa Tenggara islands) and is drier overall compared to the second group (i.e., the western islands of Java, South Sumatra and South Sulawesi). The regions in the first group experience severe drought more frequently. Also, in general, rainfall variation is larger during the dry season (April to September) compared to the wet season (October to March).
The more localised rainfall pattern located mainly in the eastern equatorial part of Indonesia (e.g., Maluku and Sorong) results in wet seasons between April and September and dry seasons between October and March. The dry periods of this type of rainfall are not as severe as those of monsoonal types; as a result, the total rainfall in a given year is relatively high.
The third type of rainfall, equatorial, can be divided into two groups. The first group covers the west coast of North Sumatra with no pronounced dry season and with slightly increased rainfall around March and October. The second group covers the west coast of South Sumatra with uniform distribution of rainfall throughout the year.
Overall, these three types of rainfall result in a wet season that varies in length from as long as 280 to 300 days or as short as 10 to 110 days, with the rainfall during that season varying from 4,115 mm to as low as 640 mm. Rainfall variability in Indonesia is strongly affected by phenomena associated with ENSO (El Niño Southern Oscillation). The impact of ENSO on rainfall is more pronounced during the dry season than the wet season (USDA, 1984; Las et al., 1999). Various studies on ENSO influences on inter-annual rainfall variability in Indonesia reveal the following seasonal patterns (USDA, 1984; ADPC, 2000; Yoshino et al., 2000; and Kirono and Partridge, 2002): (i) the end of the dry season occurs later than normal during El Niño and earlier during La Niña years, (ii) the onset of the wet season is delayed during El Niño and advanced during La Niña years, (iii) a significant reduction of dry season rainfall could be expected during El Niño and a significant increase during La Niña years, (iv) long dry spells occur during the monsoon period, particularly in Eastern Indonesia. Moreover, as well as causing rainfall variation, the effect of ENSO itself is varied. ENSO effects are particularly strong in regions that are strongly influenced by monsoon systems, weaker in regions that are dominated by equatorial systems, and not traceable in regions driven by local weather systems (Tjasyono, 1997).
CHAPTER INational Circumstances
I-2

IndonesIa second natIonal communIcatIon under the unIted natIons Framework conventIon on clImate change (unFccc)
1.2 Extreme Climate Events
Extreme climate events in Indonesia are normally associated with ENSO. El Niño events are associated with drought and La Niña event are associated with heavy rainfall and flooding. Because the ENSO signal is very strong in the regions dominated by monsoonal rainfall (i.e., Java, Bali and Nusa Tenggara), extreme events are most pronounced in these areas. In these islands, for example, the decrease in dry season rainfall could be twice that of the other islands (Figure 1.2). Over recent years, El Niño events have become more frequent as the global temperature anomalies continue to increase (Hansen et al., 2006). This indicates that the extreme regional weather and climate anomalies associated with El Niño are being exacerbated by increasingly higher temperatures. These warmer conditions have been linked to higher concentrations of atmospheric greenhouse gases (GHGs) (Timmermann et al. 1999; Collins 2000, b; Cubasch et al. 2001; Chen et al. 2005; Guilyardi 2005).
With the increasing frequency and intensity of extreme climate events, the most affected group will be the poor, as their adaptive capacity is most limited. If more vulnerable groups are exposed to repeated climate hazards, resilience will be more quickly compromised, making it increasingly more difficult to recover. In many cases, this is leading to high levels of unsecured and informal household debt. The Government of Indonesia also spends significant amounts of public funding in an effort to reduce vulnerability and improve resilience of poor populations.Based on data collected by the Office of U.S. Foreign Disaster Assistance/Center for Research on the Epidemiology of Disaster (OFDA/CRED) International Disaster Database (2007) from 1907 to 2007, it is clear that climate-related hazards are becoming increasingly more dominanct in
Figure 1.2 Percent decrease in seasonal rainfall from normal during two strong El Niño years, 1997 and 1982 (Irawan, 2002)
Sumatera
Java
Bali/Nusa Tenggara
Kalimantan
Sulawesi
Maluku/Ambon
0
-10
-20
-30
-40
-50
-60
-70
-80
-90
1997
Wet Season Wet SeasonDry Season Dry Season
1982
Rain
fall
Anom
aly (
%)
CHAPTER INational Circumstances
I-3
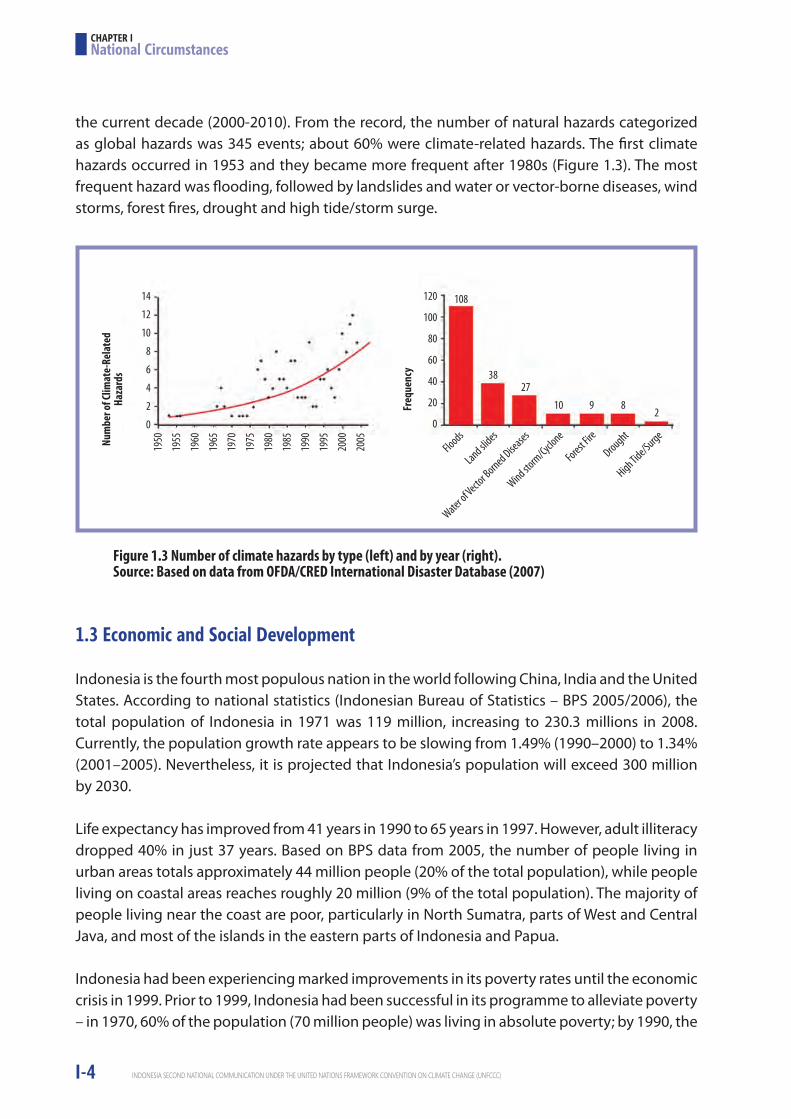
IndonesIa second natIonal communIcatIon under the unIted natIons Framework conventIon on clImate change (unFccc)
the current decade (2000-2010). From the record, the number of natural hazards categorized as global hazards was 345 events; about 60% were climate-related hazards. The first climate hazards occurred in 1953 and they became more frequent after 1980s (Figure 1.3). The most frequent hazard was flooding, followed by landslides and water or vector-borne diseases, wind storms, forest fires, drought and high tide/storm surge.
1.3 Economic and Social Development
Indonesia is the fourth most populous nation in the world following China, India and the United States. According to national statistics (Indonesian Bureau of Statistics – BPS 2005/2006), the total population of Indonesia in 1971 was 119 million, increasing to 230.3 millions in 2008. Currently, the population growth rate appears to be slowing from 1.49% (1990–2000) to 1.34% (2001–2005). Nevertheless, it is projected that Indonesia’s population will exceed 300 million by 2030.
Life expectancy has improved from 41 years in 1990 to 65 years in 1997. However, adult illiteracy dropped 40% in just 37 years. Based on BPS data from 2005, the number of people living in urban areas totals approximately 44 million people (20% of the total population), while people living on coastal areas reaches roughly 20 million (9% of the total population). The majority of people living near the coast are poor, particularly in North Sumatra, parts of West and Central Java, and most of the islands in the eastern parts of Indonesia and Papua.
Indonesia had been experiencing marked improvements in its poverty rates until the economic crisis in 1999. Prior to 1999, Indonesia had been successful in its programme to alleviate poverty – in 1970, 60% of the population (70 million people) was living in absolute poverty; by 1990, the
Figure 1.3 Number of climate hazards by type (left) and by year (right). Source: Based on data from OFDA/CRED International Disaster Database (2007)
Num
ber o
f Clim
ate-
Rela
ted
Haza
rds
Freq
uenc
y
14
12
10
8
6
4
2
0
120
100
80
60
40
20
0
Wind storm
/Cyclone
Forest Fire
Drought
High Tide/Surge
1950
1955
1960
1965
1970
1975
1980
1985
1990
1995
2000
2005
Floods
Land slides
Water of Vector Borned Diseases
108
3827
10 9 82
CHAPTER INational Circumstances
I-4

IndonesIa second natIonal communIcatIon under the unIted natIons Framework conventIon on clImate change (unFccc)
number had dropped to 27 million or 15% of the population and continued to improve to 1997, when the figure decreased to 20 million. However, in 1999, for the first time in years, Indonesia experienced a severe 18-month drop in the country’s social condition, resulting in over 100 million people living below the poverty line.
As such, poverty remains a challenge. Unemployment and underemployment are also still relatively high. The Mid-Term National Development Plan (RPJMN) 2004–2009, it target for poverty and unemployment was 5.1% and 8.2%, respectively. A recent report from BPS stated that unemployment by February 2008 reached 8.46% or about 9.43 million people. However, based on the projection of the Institute for Development Economics and Finance (INDEF), due to current economic crisis, the number of poor and unemployed may have increased to 9.5% and 16.3%, respectively, in 2008 (Depsos, 2009).
Indonesia’s gross domestic product (GDP) is approximately US$175 billion, with trade (16.7%), manufacturing (28%), agriculture (15.4%) and services (10.17%) as the main contributors. Earnings from exports (oil and gas, textiles, appliances, coal, copper) were approximately US$69 billion, while imports (food, chemicals, capitals and consumer goods) generated about US$44.8 billion. The GDP growth has increased steadily since 1998 and reached 6.3% in 2007 (Table 1.1). This has brought per capita GDP to around US$2000, which is considerably higher than the pre-crisis level (around US$1,000; Siregar, 2008). The role of non-oil and gas sectors has become more significant since the Asian Financial Crisis (AFC); the oil and gas sectors’ contribution to the economy decreased, as indicated by the negative growth rates for the whole period, except in the year 2000. Among the non-oil and gas sectors, agriculture has played an important role. It is the sector least affected by the AFC and in fact helped the recovery of Indonesian economy after the crisis. This was due to its role as “the employer of last resort” and its substantial increases in exports (Siregar, 2008).
Table 1.1 Per capita GDP and growth rates of the economy, 1997-2007
Source: (Based on BPS data; Siregar, 2008)
CHAPTER INational Circumstances
I-5
Economic parameters 1997 1998 1999 2000 2001 2002 2003 2004 2005 2006 2007
Per capita GDP (USD) 1093 478 689 804 772 922 1098 1186 1318 1663 1946
GDP Growth 4.7 -13.1 0.8 4.9 3.6 4.5 4.8 5 5.7 5.5 6.3
Non-Oil & Gas GDP Growth (% per annum) 5.2 -14.2 1 5.3 4.9 5.2 5.7 6 6.6 6.1 6.9
Oil-Gas GDP Growth (% per annum) -1 -0.5 -1.3 1 -5.3 -1.3 -2.9 -3.5 -3.1 -1.3 -0.8
Manufacturing GDP Growth (% per annum) 5.3 -11.4 3.9 6 3.3 5.3 5.3 6.4 4.6 4.6 4.7
Agriculture GDP Growth (% per annum) 1 -1.3 2.2 1.9 3.3 3.4 3.8 2.8 2.7 3.4 3.5

IndonesIa second natIonal communIcatIon under the unIted natIons Framework conventIon on clImate change (unFccc)
Success in pursuing macroeconomic stability over the past few years has been the primary factor in reducing poverty in Indonesia. However, economic growth alone is not sufficient for improving the well-being of the poor; additional efforts are still needed to address their needs. Indeed, the global financial crisis triggered by the U.S. sub-prime mortgage crisis caused some doubt about the continuation of post-AFC Indonesian economic growth. Gradual increases in commodity prices, especially in the agriculture sector, followed by abrupt decreases in 2009 have exacerbated uncertainties (Siregar, 2008). This may negatively affect efforts to further develop the commodities and related industries.
The current global financial crisis (GFC) is distinct from the AFC in 1997/98. In the case of the AFC, the significant rupiah depreciation was followed by increases in Indonesian exports, especially of agriculture, shortening the recession period. The current depreciation of rupiah following the GFC seems unlikely to be followed by similar increases in exports because the main export destinations around the world have also been adversely affected; the recession may thus last considerably longer (Siregar, 2008).
Despite positive macroeconomic achievements, the country still faces major challenges in a number of key areas, such as employment creation, improvement of the investment climate and ensuring that Indonesia fully benefits from its integration into the international trading system (European Community, 2005). Between the onset of the AFC in 1997 until 2006, unemployment had continuously increased in absolute as well as in percentage terms, reaching 11.1 million (10.4 percent) (Table 1.2). Although this has been reduced over the course of the last two years, the figures are still reasonably high, with 9.4 million people (8.5%) unemployed in February 2008. Due to the current GFC, the number of unemployed may continue to increase if the main sources of recovery and growth are capital-intensive sectors (Siregar, 2008).
Table 1.2 Labor force and open unemployment in Indonesia, 2000-2008
Year Labor Force(Million people)
Open Unemployment(Million People)
Open Unemployment(% of total)
2000 95.65 5.81 6.08
2001 98.81 8.01 8.10
2002 100.78 9.13 9.06
2003 102.63 9.82 9.57
Aug-04 104.00 10.3 9.90
Feb-05 105.80 10.9 10.30
Feb-06 106.30 11.1 10.44
Feb-07 108.13 10.55 9.76
Feb-08 111.48 9.43 8.46
Source: (Based on BPS data; Siregar, 2008)
CHAPTER INational Circumstances
I-6

IndonesIa second natIonal communIcatIon under the unIted natIons Framework conventIon on clImate change (unFccc)
1.4 Sectoral Conditions
1.4.1 Energy SectorIndonesian final energy consumption has been growing in line with the country’s economic and population growth. According to the latest official published data from Data and Information Center (PUSDATIN) – MEMR (2009a): Indonesia Energy-Economic Handbook 2009, the domestic consumption of final energy (excluding biomass) in Indonesia grew from 495.45 MMBOE (million barrel oil equivalent) in 2000 to 564.94 MMBOE in 2005 (at average growth rate of 3.1 % per year). The majority of this consumption is accounted by industry sector, followed by transportation, residential, commercial, and ACM (agriculture, construction, and mining) sectors (see Figure 1.4). In 2008, the final consumption is about 658.36 MMBOE. The share of total energy consumption by sector in 2008 is industrial sector 48%, transportation 31%, household 13%, commercial 4%, and ACM 5 % (Table 1.3).
Figure 1.4 Final energy consumption in Indonesia, 2000 – 2007 [MEMR, 2009]
Table 1.3 Type of final energy consumption by sector, 2008 MMBOE [MEMR, 2009]
ACM
Transportation
Commercial
Residential
Industry
700
600
500
400
300
200
100
MMBOE
2000 2001 2002 2003 2004 2005 2006 2007 2008ACM 29.21 30.59 30.00 28.45 31.69 29.10 25.94 24.91 24.84Transportation 139.1 148.2 151.5 156.2 178.3 178.4 170.1 179.1 191.2Commercial 19.22 20.01 20.32 20.97 23.99 24.82 24.79 26.49 27.62Residential 87.96 89.02 86.57 88.67 90.69 89.07 84.53 87.72 84.56Industry 219.8 219.7 218.6 249.9 241.0 243.5 257.3 283.4 330.0
Sector OilProducts LPG Natural
Gas Coal Electricity Total %
Industri 49 1 89 160 29 328 48 Transportation 191 - 0 - 0 191 31 Household 40 14 0 - 31 85 13 Commercial 7 1 0 - 19 28 4 Others 25 - - - - 25 5 Total 312 16 90 160 79 657 100
Source: Indonesian Energy Outlook 2009, Data and Information Center, MEMR
CHAPTER INational Circumstances
I-7

IndonesIa second natIonal communIcatIon under the unIted natIons Framework conventIon on clImate change (unFccc)
Indonesia is endowed with varous type of energy reources, fossil energy resources as well as new and renewable energy resources. As an overview, among of the fossil resources, coal has the longest reserves to production ratio, i.e. 82 years, while new and renewable resources are also potential. The utlization level of the new and renewable resources, however, is still low. This indicate that these resources could be futher developed to supply future energy demand. The distrubution of location of each resource and the coresponding infrastucture of the reources (mostly outside Java) are miss matched with energy demand center (mostly Java). Therefore, the development of energy resources in Indonesia considers this situation.
To supply the domestic energy demand, Indonesia uses different types primary energy sources, i.e. oil, natural gas, coal, hydro, geothermal, and biomass. Among these primary energy sources, the dominant energy source is fossil fuels. As an overview, the primary energy supply mix (excluding biomass) in 2005: oil (48.5%), natural gas (27.1%), coal (18.7%), hydro (3.4%) and geothermal (2.3%). In terms of annual average growth during 2000 - 2005, coal outpaced other fuels: coal 14.3%, oil 2.6%, and gas 0.6%. According to the Indonesian National Energy Policy (Presidential Regulation No.5/2006), it is projected that coal, natural gas, and renewable energy will replace oil in the future so that in 2025 the primary energy supply mix will become: coal 33%, natural gas 30%, oil 20%, and renewable and other new energy 17%. It should be noted that the primary consideration in targeting the energy supply mix is energy security concerns.
Concerning the biomass energy, it is primarily consumed in rural residential and agro industries. During 2000 – 2005, the biomass consumption is relatively constant, in the order of 270 MMBOE per annum. A relatively small fraction (± 15%) of the biomass is used in industrial captive power and heat generations, i.e. in pulp paper industry, wood processing, and palm oil mills. With regard to power sector, the primary energy supply is dominated by coal, followed by natural gas and oil. As an overview, energy mix in the power sector in 2005: coal (40.4%), oil (26.2%), hydro (13.3%), natural gas (11.2%), geothermal (8.9%).
Elasticity of energy in Indonesia is relatively high compared to other countries (1.84 compared to around 1.0). This implies that more energy is needed by Indonesia to increase per unit of GDP. One of national energy policy objectives is to reduce elasticity to less than 1 by 2025. The objective can largely be achieved through energy efficiency and the national policy of energy efficiency (EE) is already established. This policy is also supported by EE programmes and measures.
1.4.2 Industrial SectorThe growth of Industrial sector, particularly for mineral, chemical and metal products in the period of 2000-2005 was quite slow and even negative for some industries (Table 1.4). Since 1998, after the global economic crisis, investment on these types of industries has been very limited. It is estimated that until 2025 these types of industries may not grow.
CHAPTER INational Circumstances
I-8

IndonesIa second natIonal communIcatIon under the unIted natIons Framework conventIon on clImate change (unFccc)
1.4.3 Forestry SectorIn Indonesia, the state land is divided into two areas: forest area and non-forest area. Forest area is not always covered by forest. Similarly, non-forest area does not necessarily mean it has no forest. Non-forest area is commonly referred to as “area for other uses” (i.e., non-forest activities such as for agriculture plantation, settlement, road etc.; abbreviated as APL). Total forest area is approximately 133.6 million ha and non-forest area is 54.3 million ha (Baplan, 2008). Based on its function, about 15% of forest area is categorized as conservation forest (HK), 22% as protection forest (HL), 46% as production forest (HP) and 17% as convertible production forest (HPK). This convertible production forest can be released as APL in the future. Based on 2007 satellite assessments, forest area covered by forest was about 85.9 million ha (64%), 39.1 million ha were without forest and 8.5 million ha were unidentified due to cloud cover (BAPLAN, 2008).
Table 1.4. Growth and production of industrial products (000 ton) in the period 2000-2005
Year 2000 2001 2002 2003 2004 2005 Growth(%/yr)
Mineral ProductsCement production 27,800.00 31,100.00 31,360.00 30,600.00 33,000.00 33,920.00 3.26Clinker Export 3,552.00 3,707.00 3,791.00 4,270.00 4,680.00 3,407.24 -0.62Lime production 4,917.53 9,382.15 2,770.10 2,744.89 2,820.01 2,827.93 -8.21Glass production 1,700.00 1,301.71 1,435.26 1,342.25 1,460.50 1,499.85 -2.29Ceramic Production 13.32 2.16 2.16 4.43 1.31 0.50 -53.68
Chemical productsAmmonia production 4,785.00 4,406.80 4,771.42 4,860.41 4,546.26 5,125.31 1.19HNO3 production 23.04 13.77 14.99 14.99 14.99 14.99 -8.32Silicon Carbide 27.40 18.13 19.73 19.73 19.73 19.73 -6.16Calcium Carbide 22.45 70.17 76.40 76.40 20.23 20.23 -0.78CaC2 in Asetilena Production 19.02 19.02 12.10 11.64 12.89 12.83 -7.07Methanol 794.47 931.36 785.03 792.33 787.91 845.54 1.03Ethylene 499.32 397.58 428.27 476.28 465.05 487.22 -0.44Ethylene Dichloride 760.95 787.89 782.03 798.91 799.99 727.99 -0.71Carbon Black 94.52 98.18 90.83 95.65 110.00 123.00 4.65
Metal ProductsBasic Oxygen Furnance 27.40 18.13 19.73 19.73 19.73 19.73 -6.16Pig Iron 0.29 0.23 2.40 3.21 2.63 33.03 78.36Sinter 1,355.69 1,917.86 859.42 2,211.91 2,425.27 2,269.83 8.28Al production 240.00 240.00 240.00 240.00 240.00 240.00 0.00PFC 0.07 0.07 0.07 0.07 0.07 0.07 0.00Lead Production 27.40 18.13 19.73 19.73 19.73 19.73 -6.16Zinc Production 71.87 98.74 55.28 56.62 40.97 61.82 -2.61
Source: BPS (2007)
CHAPTER INational Circumstances
I-9

IndonesIa second natIonal communIcatIon under the unIted natIons Framework conventIon on clImate change (unFccc)
In non-forest area (APL), the forested land was estimated to be about 7.96 million ha (15%; Table 1.5).
From satellite interpretation, rate of forest loss between 2000 and 2005 reached about 1.1 million ha per year (BAPLAN, 2008). Most of deforestation mainly occurred in HP and the followed by APL, HPK, HK and HL (Figure 1.5; MoF 2008). The rate of deforestation is expected to increase in the future, particularly in open access forest areas. Open access area is defined as forest areas that have not been granted to concessionaires and have no on-site agencies responsible for managing the areas. At present only conservation forests have on-site management agency (called as National Park Agencies). In one of its priority policies, the Ministry of Forestry will establish a Forest Management Unit (FMU) in all forest areas. Thus, all forest areas in the country will have on-site management unit. It is estimated that the number of FMU needed for all over Indonesia is about 700 units. With the current budget, the Government of Indonesia is only able to establish about 210 FMUs in the next 15 years. The establishment of FMU will therefore be prioritized in regions with high deforestation risk.
Table 1.5 Forested and non-forested land in forest and non-forest area in 2007 (thousand ha)
Figure 1.5 Fraction of forest loss in forest area and non-forest area
Forest Area (x 000 ha)APL
HK HL HP HPK
Forested land 14,365 22,102 38,805 10,693 7,960
Non-forested land 4,009 5,622 18,404 11,057 44,163
Unidentified 1,502 2,328 3,706 981 2,216
Total 19,876 30,052 60,915 22,732 54,339
Source: Baplan (2008)
HK
HPK
APL
HP
HL
1 %
53 %
19 %
24 %
3 %
CHAPTER INational Circumstances
I-10
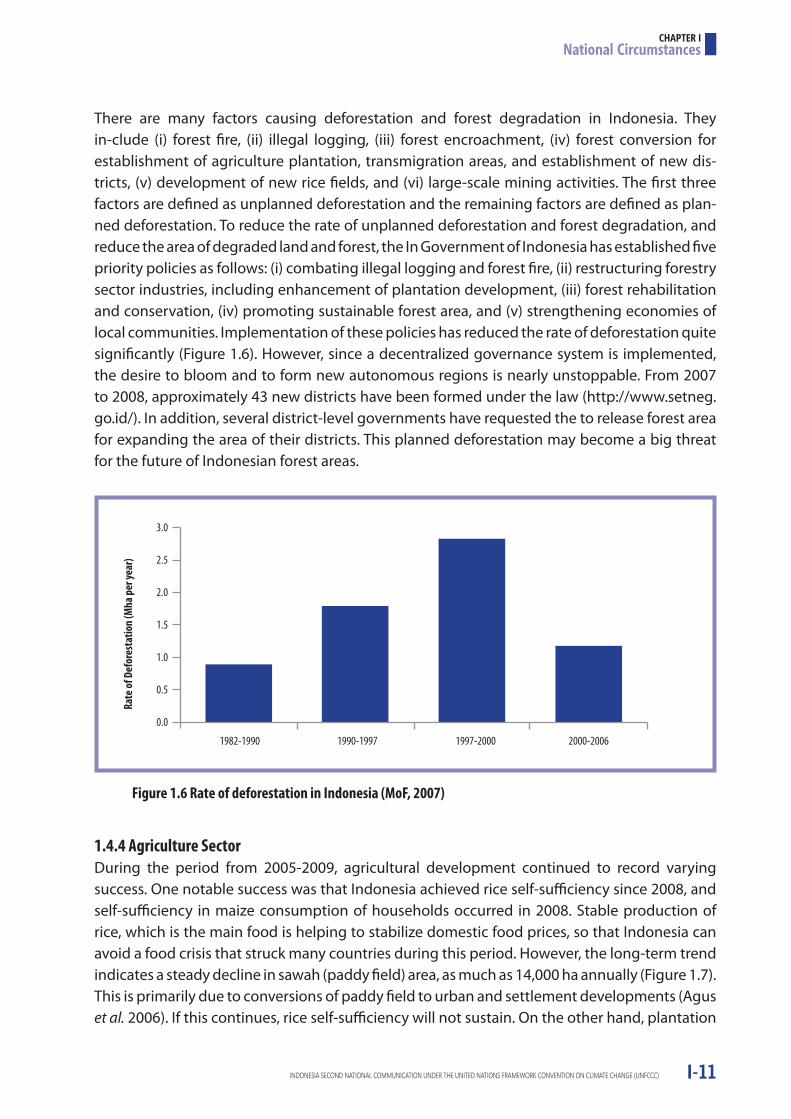
IndonesIa second natIonal communIcatIon under the unIted natIons Framework conventIon on clImate change (unFccc)
There are many factors causing deforestation and forest degradation in Indonesia. They in-clude (i) forest fire, (ii) illegal logging, (iii) forest encroachment, (iv) forest conversion for establishment of agriculture plantation, transmigration areas, and establishment of new dis-tricts, (v) development of new rice fields, and (vi) large-scale mining activities. The first three factors are defined as unplanned deforestation and the remaining factors are defined as plan-ned deforestation. To reduce the rate of unplanned deforestation and forest degradation, and reduce the area of degraded land and forest, the In Government of Indonesia has established five priority policies as follows: (i) combating illegal logging and forest fire, (ii) restructuring forestry sector industries, including enhancement of plantation development, (iii) forest rehabilitation and conservation, (iv) promoting sustainable forest area, and (v) strengthening economies of local communities. Implementation of these policies has reduced the rate of deforestation quite significantly (Figure 1.6). However, since a decentralized governance system is implemented, the desire to bloom and to form new autonomous regions is nearly unstoppable. From 2007 to 2008, approximately 43 new districts have been formed under the law (http://www.setneg.go.id/). In addition, several district-level governments have requested the to release forest area for expanding the area of their districts. This planned deforestation may become a big threat for the future of Indonesian forest areas.
1.4.4 Agriculture SectorDuring the period from 2005-2009, agricultural development continued to record varying success. One notable success was that Indonesia achieved rice self-sufficiency since 2008, and self-sufficiency in maize consumption of households occurred in 2008. Stable production of rice, which is the main food is helping to stabilize domestic food prices, so that Indonesia can avoid a food crisis that struck many countries during this period. However, the long-term trend indicates a steady decline in sawah (paddy field) area, as much as 14,000 ha annually (Figure 1.7). This is primarily due to conversions of paddy field to urban and settlement developments (Agus et al. 2006). If this continues, rice self-sufficiency will not sustain. On the other hand, plantation
Figure 1.6 Rate of deforestation in Indonesia (MoF, 2007)
Rate
of D
efor
esta
tion
(Mha
per
year
)
3.0
2.5
2.0
1.5
1.0
0.5
0.0
1982-1990 1990-1997 1997-2000 2000-2006
CHAPTER INational Circumstances
I-11

IndonesIa second natIonal communIcatIon under the unIted natIons Framework conventIon on clImate change (unFccc)
area has drastically increased at a rate of 571,000 ha annually. The areas of annual upland and idle lands (including Imperata grass and bush lands) fluctuate, but there is an increasing trend for these two land use systems over the last six years. The increase in plantation, upland farming and idle lands postulates a decreasing forest area.
Rapid increase in the area of agriculture plantation is mainly due to the high growth of palm oil plantation. The area of palm oil increased exponentially over the last two decades (Figure 1.10). Between 1994 and 2008, the average increase was 12.3% annually from about 0.6 to 6.6 million ha. The rapid increase in the palm oil plantations is driven by the demand increase in the domestic and international markets, including the demand for bio-diesel. Areas of cacao and coffee plantation have also increased, but not as drastically as that for palm oil.
To increase the production of main agriculture commodities, particularly rice and palm oil, Indonesia has targeted to expand the palm oil plantation as much as 1.375 million ha between 2010 and 2015 (DG of Estate Crop, 2008). The target provinces for the establishment of palm oil plantations are East, West and Central Kalimantan, Jambi and South Sumatra. These five provinces account for 78% of the total area. To secure rice production in the future, Indonesia also plans to have 15 million ha of land permanently allocated for cropland. At present, the total area of paddy field (sawah) is approximately 7.8 million ha; thus, an additional 7.2 million ha is needed to meet this target. Based on Ministry of Agriculture estimate (IAARD, 2007), total suitable area for sawah is 8.3 million ha in which 3 million ha is swamp land (including mineral wetland and peatland) and the other 5.3 million ha is convertible upland. However, the area of potential suitable land changes rapidly because of competition in land uses for housing and urban developments. Thus, the currently available lands for sawah may be less (Agus et al. 2006).
Figure 1.7 Development of the main agricultural systems from 1986 to 2006 (Data taken from Central Bureau of Statistics)
Area
(tho
usan
d ha
)
25000
20000
15000
10000
5000
0
19861988
19901992
19941996
19982000
20022004
2006
SawahAnnual uplandPlantationIdle land
CHAPTER INational Circumstances
I-12
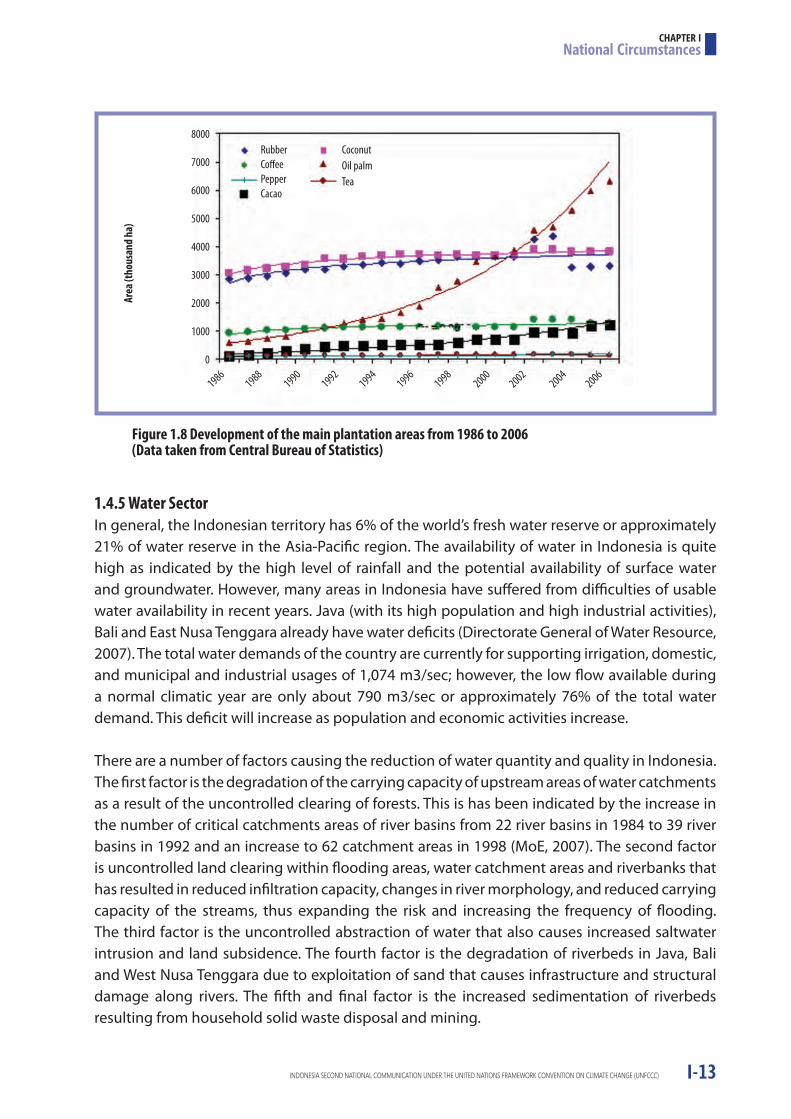
IndonesIa second natIonal communIcatIon under the unIted natIons Framework conventIon on clImate change (unFccc)
1.4.5 Water SectorIn general, the Indonesian territory has 6% of the world’s fresh water reserve or approximately 21% of water reserve in the Asia-Pacific region. The availability of water in Indonesia is quite high as indicated by the high level of rainfall and the potential availability of surface water and groundwater. However, many areas in Indonesia have suffered from difficulties of usable water availability in recent years. Java (with its high population and high industrial activities), Bali and East Nusa Tenggara already have water deficits (Directorate General of Water Resource, 2007). The total water demands of the country are currently for supporting irrigation, domestic, and municipal and industrial usages of 1,074 m3/sec; however, the low flow available during a normal climatic year are only about 790 m3/sec or approximately 76% of the total water demand. This deficit will increase as population and economic activities increase.
There are a number of factors causing the reduction of water quantity and quality in Indonesia. The first factor is the degradation of the carrying capacity of upstream areas of water catchments as a result of the uncontrolled clearing of forests. This is has been indicated by the increase in the number of critical catchments areas of river basins from 22 river basins in 1984 to 39 river basins in 1992 and an increase to 62 catchment areas in 1998 (MoE, 2007). The second factor is uncontrolled land clearing within flooding areas, water catchment areas and riverbanks that has resulted in reduced infiltration capacity, changes in river morphology, and reduced carrying capacity of the streams, thus expanding the risk and increasing the frequency of flooding. The third factor is the uncontrolled abstraction of water that also causes increased saltwater intrusion and land subsidence. The fourth factor is the degradation of riverbeds in Java, Bali and West Nusa Tenggara due to exploitation of sand that causes infrastructure and structural damage along rivers. The fifth and final factor is the increased sedimentation of riverbeds resulting from household solid waste disposal and mining.
Figure 1.8 Development of the main plantation areas from 1986 to 2006 (Data taken from Central Bureau of Statistics)
Area
(tho
usan
d ha
)8000
7000
6000
5000
4000
3000
2000
1000
0
RubberCoffeePepperCacao
CoconutOil palmTea
19861988
19901992
19941996
19982000
20022004
2006
CHAPTER INational Circumstances
I-13

IndonesIa second natIonal communIcatIon under the unIted natIons Framework conventIon on clImate change (unFccc)
Efforts for managing water resources have been carried out by the Government through instrumentation of regulation and programs executed by related sectors. In general, the efforts focused into two activities: the conservation of water and control of water pollution.
1.4.6 Coastal and Marine SectorIndonesia is an archipelago state that has approximately 5.8 million km2 of ocean area and 81,000 km coastline (the longest coastline in the world), with more than 17,500 islands. Coastal areas, small islands, marine life and fisheries play an important role in supplying food energy, supporting natural cycles, and regulating the global climate. From an economic standpoint, Indonesia’s fishery resources equate to 6.65 million ton per annum that consist of 4.35 million ton in territorial and 2.3 ton in the Executive Economic Zone (MoE, 2007). About 140 million people or 60% of the total population lives within 50 km of the shoreline, spread across 42 cities and 182 districts.
Indonesia is also regarded as one of the world’s mega centers of biodiversity for its extraordinarily high levels of diversity; each coral reef area containing at least 2,500 species of fish, although, at present, but only 30% of these reefs are in good or excellent condition. Due to the richness of these reef areas, the coastal zone policy and management decisions made by the country will have a major impact on the global heritage of coral reef diversity (Bryant et al., 1998).
However, in several areas the oceans have been damaged due to non-environmentally friendly practices. The coral reef damage level in Indonesia reached 40% - 24% of all reefs are considered to be in damaged and medium damaged condition with only 6% remaining in very good condition. It has been estimated that 90% of Indonesia’s coral reefs have been damaged by a combination of non-environmentally friendly fish-catching practices, over-fishing, se-dimentation and land-based pollution, and coral mining (MoE, 2007).
Similar conditions are also observed in Indonesia’s mangrove ecosystems. In 1993, Indonesia’s mangrove forest was noted to have an area of 3.7 million ha, dispersed throughout the Indo-nesian coast, starting from the Island of Sumatra, Kalimantan, Java, Sulawesi, West Nusa Tenggara, East Nusa Tenggara, all of Maluku Islands, and in Papua. However, in 2005, the remaining mangrove forest was only 1.5 million ha. The mangrove forest has significantly decreased between 2% (the lowest) in East Java and 100% (the highest) in East Nusa Tenggara. The causes of disappearance of mangrove forests are the illegal cutting of mangrove wood, area clearing for shrimp breeding and also wet and dry farms (MoE, 2007).
Sea grasses are common throughout the tropical and temperate coastal waters of the Asia and Pacific Region. The Center for Oceanography Research of the Indonesian Institute of Science (LIPI) reported that 12 species of seagrass lived in Indonesia’s waters in 2006 (MoE, 2007). However, 20-25% of seagrass areas in Indonesia have been damaged by a combination of coastal development, elevated sedimentation levels, destructive fishing methods and land-based pollution, thermal discharge, petroleum product spills, and dredge and fill operations.
CHAPTER INational Circumstances
I-14

IndonesIa second natIonal communIcatIon under the unIted natIons Framework conventIon on clImate change (unFccc)
Many initiatives are already carried by the Government and environmental non-governmental organizations (NGOs) related to coastal and marine management such as the Coral Reef Rehabilitation and Management Program (COREMAP) program, including mapping priority areas for rehabilitation and utilization in marine and coastal areas, and mangrove rehabilitation management as well as the Coral Triangle Initiative. This initiative conserves a marine region that spans those parts of Indonesia, Malaysia, New Gunea, the Philippines, the Solomon Islands, and Timor Leste with at least 500 species of reef-building corals; provides incomes and food security more than 120 million people living in this area.
CHAPTER INational Circumstances
I-15

IndonesIa second natIonal communIcatIon under the unIted natIons Framework conventIon on clImate change (unFccc)I-16

IndonesIa second natIonal communIcatIon under the unIted natIons Framework conventIon on clImate change (unFccc)
CHAPTER II
National GHG Inventory
2.1 Introduction
The Indonesian National Greenhouse Gas Inventory (NGHGI) includes estimates of emissions by source and sink for the period 2000-2005. It was drawn up in line with Articles 4 and 12 of the United Nations Framework Convention on Climate Change (UNFCCC) and the Guidelines for National Communications of non-Annex I Parties of the UNFCCC, adopted in decision 17/ CP.8, which state that non-Annex I Parties should include information in a national inventory of anthropogenic emissions by source and absorption by sinks of all greenhouse gases (GHGs) not controlled by the Montreal Protocol, within the limits of their possibilities, using the methodologies promoted and approved by the Conference of Parties (COP).
The calculations of GHG emissions reported in the Second National Communication (SNC) were made for the six emissions categories defined by the Intergovernmental Panel on Climate Change (IPCC): Energy, Industrial Processes, Solvents, Agriculture, Land Use Change and Forestry and Waste. The NGHGI 2000-2005 reports on the three main GHGs included in Appendix A of the Kyoto Protocol: carbon dioxide (CO2), methane (CH4), and nitrous oxide (N2O). Some information is also included on three other minor gases (CO, NOX and perfluorocarbons [PFC]). The emissions estimates for each emissions category were created thanks to the dedicated work of specialists from the Ministry of Energy and Mineral Resources, the Ministry of Transportation, the Ministry of Forestry, the Ministry of Agriculture, the Ministry of Environment, Bandung Institute of Technology and Bogor Agriculture University.
2.2 Institutional Arrangements
The development of the NGHGI was conducted by the Working Group on Inventory assisted by experts and a technical team from two universities (Bandung Institute of Technology and Bogor Agriculture University), as well as two research agencies (Forest Research and Development Agency and the Indonesian Agency for Agriculture Research and Development). The members of the working group came from various government institutions concerned with energy and mining, industry, transportation, waste, agriculture and forestry. The working group was officially recognized through the Environment Minister Decree and worked under the coordination of the Deputy of Nature Conservation Enhancement & Environmental Destruction Control of the Ministry of Environment (Figure 2.1).
II-1
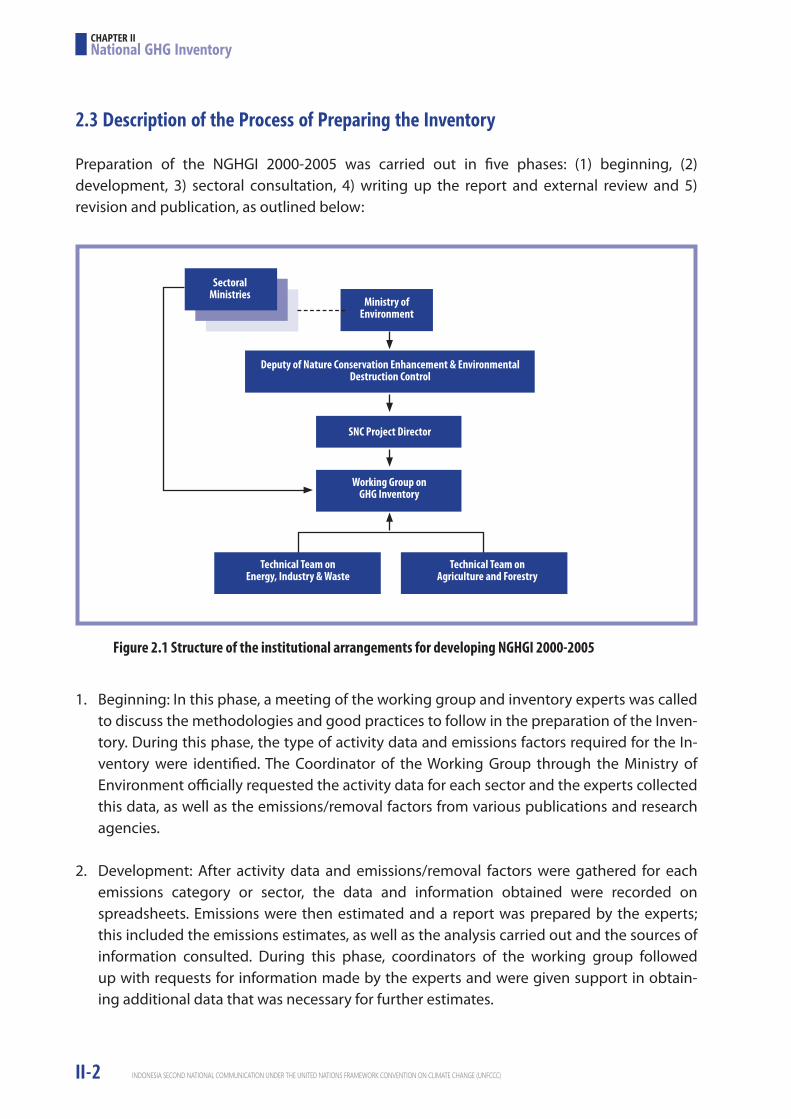
IndonesIa second natIonal communIcatIon under the unIted natIons Framework conventIon on clImate change (unFccc)
2.3 Description of the Process of Preparing the Inventory
Preparation of the NGHGI 2000-2005 was carried out in five phases: (1) beginning, (2) development, 3) sectoral consultation, 4) writing up the report and external review and 5) revision and publication, as outlined below:
1. Beginning: In this phase, a meeting of the working group and inventory experts was called to discuss the methodologies and good practices to follow in the preparation of the Inven- tory. During this phase, the type of activity data and emissions factors required for the In- ventory were identified. The Coordinator of the Working Group through the Ministry of Environment officially requested the activity data for each sector and the experts collected this data, as well as the emissions/removal factors from various publications and research agencies.
2. Development: After activity data and emissions/removal factors were gathered for each emissions category or sector, the data and information obtained were recorded on spreadsheets. Emissions were then estimated and a report was prepared by the experts; this included the emissions estimates, as well as the analysis carried out and the sources of information consulted. During this phase, coordinators of the working group followed up with requests for information made by the experts and were given support in obtain- ing additional data that was necessary for further estimates.
Figure 2.1 Structure of the institutional arrangements for developing NGHGI 2000-2005
SectoralMinistries
Ministry ofEnvironment
Deputy of Nature Conservation Enhancement & Environmental Destruction Control
SNC Project Director
Working Group on GHG Inventory
Technical Team on Energy, Industry & Waste
Technical Team on Agriculture and Forestry
CHAPTER IINational GHG Inventory
II-2
IndonesIa second natIonal communIcatIon under the unIted natIons Framework conventIon on clImate change (unFccc)
3. Sectoral Consultation. After the experts completed the Inventory, the results were discuss- ed with the members of the working group to check the estimates, activity data consisten- cy and emissions/removal factors. Through discussion with external experts from different sectors, the levels of uncertainty inactivity data and emission factors were determined. Emissions trends were estimated by emissions category and by gas, and both general and category uncertainties were estimated.
4. Writing up the Report and External Review. After the consultation with sectors, the final inventory report was made up according to the format by the inventory experts. Interna- tional experts through the United Nations Development Programme (UNDP) Country Offi- ce reviewed the reports, along with all spreadsheets of the inventory for all sectors. Inputs and comments from the external reviewers were used for the improvement of the inventory.
5. Revision and Publication. After the completion, the Ministry of Environment submitted the report to relevant ministries for final approval. The final adjustments and corrections were made to the document if errors were found.
2.4 Overview of Source and Sink Category Emission Estimates for year 2000
Methodology. From the Beginning Phase, the working group and the experts decided to adopt the 2006 IPCC Guidelines (GL) using Tier 1 and Tier 2 even though the adoption of this methodology was not in line with the Guidelines for National Communications of non-Annex I Parties of the UNFCCC, adopted in decision 17/ CP.8. The UNFCCC Guidelines stated that the non-Annex 1 countries used the revised 1996 IPCC GL for developing their inventory. The adoption of the 2006 IPCC GL was considered for some sectors as it covers some sources which are not included in the revised 1996 IPCC GL. Most sectors used Tier 1, and to some extent sectors adopted Tier 2 where local emissions/removal factors were used.
National Emissions. In 2000, total GHG emissions for the three main greenhouse gases (CO2, CH4 and N2O) without land use, land use change and forestry (LULUCF) and peat fires reached 556,499 Gg CO2e. With the inclusion of LULUCF, total GHG emissions from Indonesia increase significantly to about 1,205,753 Gg CO2e (Table 2.1). The GHG emissions (in CO2 equivalent) were distributed unevenly between the three gases recorded: CO2 totalled 940,879 Gg, representing 78% of the total; methane (CH4) totalled 236,388 Gg (CO2e), or 20% of the total; and nitrous oxide (N2O) totalled 28,341 Gg (CO2e), or 2% of the total. The main contributing sectors were Land Use Change and Forestry, followed by energy, peat fire-related emissions, waste, agriculture and industry (Figure 2.2).
The emissions estimates in the SNC are lower than those reported by a 2007 study by Pelangi Energi Abdi Citra Enviro (PEACE), World Bank and the United Kingdom Department for International Development (DFID), which suggested Indonesia to be the third largest
CHAPTER IINational GHG Inventory
II-3

IndonesIa second natIonal communIcatIon under the unIted natIons Framework conventIon on clImate change (unFccc)
emitting country globally. The study estimated that the total emissions from Indonesia were approximately 3,014,000 Gg CO2, where LUCF contributed about 85% or 2,563,000 Gg CO2
(twice the SNC estimate above). Indeed, a later study from the World Bank in 2008 suggested that the mean annual CO2 emissions from LUCF reached up to 2,398,000 Gg, assuming 53% from peat fire, 20% from peat drainage (peat oxidation), 22% from deforestation and 5% from palm oil and timber plantation establishment. Between the SNC and World Bank estimates, a recent study from the National Committee on Climate Change in 2009 suggested that the total GHG emissions from LUCF in 2005 reached 1,880,000 Gg CO2e, where approximately 55% was from peat emissions (DNPI, 2009). These large differences in Indonesian emissions estimates thus appear to be mainly due to differences in estimates of LUCF emissions, particularly from peat.
Table 2.1a Summary of national GHG emissions in 2000
CHAPTER IINational GHG Inventory
II-4
No Source and sink CategoriesCO2
removal(Gg)
CO2emission
(Gg)CH4(Gg)
N20(Gg)
CO(Gg)
NOx(Gg)
NMVOC(Gg)
SOx(Gg)
Total National Emission and Removals -296,794.38 1,352,471.68 11,256.59 91.42 2,335.71 85.66 NE NE1. Energy (without Biomass) 247,522.25 1,436.89 10.45 NE NE NE NE A Fuel Combustion Activity 240,876.89 455.51 10.40 NE NE NE NE
1 Energy production (electricity, heat, oil & gas refining) 84,011.42 1.89 0.64 NE NE NE NE
2 Manufacturing Industries and Construction 63,032.48 7.39 1.10 NE NE NE NE 3 Transportation 55,689.23 14.32 2.68 NE NE NE NE 4 Commercial/Intstitutional 3,320.84 2.14 0.03 NE NE NE NE 5 Residential 23,878.82 428.26 5.86 NE NE NE NE 6 Non Specified 10,944.09 1.50 0.09 NE NE NE NE
B. Fugitive Emissions 6,645.36 981.38 0.05 NE NE NE NE 1 Solid Fuels 17.22 NE NE NE NE 2 Oil and Natural Gas 6,645.36 964.17 0.05 NE NE NE NE
2. Industrial Processes and Product Use 40,342.41 104.44 0.43 NE NE NE NE A. Mineral 28,923.82 NE NE NE NE
1 Cement Production 25,006.12 NE NE NE NE 2 Lime Production 3,688.15 NE NE NE NE 3 Glass Production 170.00 NE NE NE NE 4 Other Process Uses of Carbonates 59.55 NE NE NE NE
B. Chemical 9,938.97 9.54 0.43 NE NE NE NE 1 Ammonia Production 8,092.32 NE NE NE NE NE NE 2 Nitric Acid Production NE NE 0.21 NE NE NE NE 3 Caprolactam, Glyoxal and Glyoxylic Acid NE NE 0.22 NE NE NE NE 4 Carbide Production 21.02 0.32 NE NE NE NE 5 Petrochemical and Carbon Black Production
- Methanol 305.87 1.83 NE NE NE NE NE - Ethylene 1,122.97 1.50 NE NE NE NE NE - Ethylene Dichloride 149.15 0.23 NE NE NE NE NE - Carbon Black 247.64 5.67 NE NE NE NE NE
C. Metal 1,152.98 94.90 NE NE NE NE NE 1 Iron and Steel Production 623.91 94.90 NE NE NE NE NE 2 Ferroalloys Production 2.39 NE NE NE NE NE NE 3 Alumunium Production 384.00 NE NE NE NE NE NE 4 Lead Production 19.05 NE NE NE NE NE NE 5 Zinc Production 123.62 NE NE NE NE NE NE
D. Others 326.65 NE NE NE NE NE NE 1 Lubricant Use 307.07 NE NE NE NE NE NE 2 Paraffin Wax Use 19.57 NE NE NE NE NE NE
3. Solvent and Other Product Use NE NE NE 4. Agriculture 2,178.30 2,419.06 72.39 2,294.68 84.67
A Enteric Fermentation 607.89 B Manure Management 79.69

IndonesIa second natIonal communIcatIon under the unIted natIons Framework conventIon on clImate change (unFccc)
No Source and sink CategoriesCO2
removal(Gg)
CO2emission
(Gg)CH4(Gg)
N20(Gg)
CO(Gg)
NOx(Gg)
NMVOC(Gg)
SOx(Gg)
C Rice Cultivation 1,660.03 NE D Agriculture Soils NE
1 Direct N2O Soils NE 50.11 2 Indirect N2O Soils NE 18.34 3 Direct N2O from manure NE 0.40 4 Indirect N2O from manure NE 0.11
E Prescribed Burning of Savanna/grassland 24.05 2.20 679.78 40.79 F Prescribed Burning of Agriculture Residues 47.39 1.23 1,614.90 43.88 G Others
1 Liming 218.02 NO NE NO NO NO NO 2 Urea Fertilization 1,960.28 NO IE NO NO NO NO
5. Land Use Change and Foresty -296,794.38 1,232,766.22 2.68 0.08 41.04 0.99
A Changes in forest and other woody biomass stocks -215,154.48
B Forest and grassland conversion 729,655.23 NE NE NE NE
C Abandonment of croplands, pastures, plantation forests, or other managed lands -81,639.89
D C02 emissions and removals from soils NE 216,312.51 E Others:
- Forest Burning 2.68 0.08 41.04 0.99 - Peat Fire* 172,000.00 NE NE NE NE
6. Waste 1,662.49 7,293.52 8.07 NE NE A1 Unmanaged Waste Disposal Sites NE 612.83 NE NE NE NE A2 Unmanaged Dumpsite NE 249.72 NE NE NE NE B Biological Treatment of Solid Waste NE 4.42 0.33 NE NE NE NE C Open Burning Waste 1,662.49 62.34 1.44 NE NE NE NE
D1 Domestic Wastewater Treatment and Discharge 459.59 6.30 NE NE NE
D2 Industrial Wastewater Treatment and Discharge 5,904.63 NE NE NE NE
7. Others 176,765.69 NE NE NE NE NE NE Inernational bunkers NE NE NE NE NE NE NE Aviation NE NE NE NE NE NE NE Marine NE NE NE NE NE NE NE Biomass 176,765.69
Note: * Emissions from peat fire are from van der Warf et al. (2007). Shaded cells do not require entries. NO: Not Occurring; NE: Not estimated; NA: Not Applicable; IE: Including Elsewhere; C: Confidential
Table 2.1b. Summary of national GHG emissions in 2000 (in Gg)
HFCs PFCsSF6
HFC-32 HFC-125 HFC 124 HFC 143 Others CF4 Others1 Energy A Fuel Combustion Activity
1 A 1 Energy production (electricity, heat, oil & gas refining) NE
1 A 2 Manufacturing Industries and Construction
1 A 3 Transportation1 A 4 a Commercial/Institutional1 A 4 b Residential1 A 5 Non SpecifiedB. Fugitive Emissions1 B 1 Solid Fuels1 B 2 Oil and Natural Gas2 Industrial Processes and Product UseA. Mineral2 A 1 Cement Production2 A 2 Lime Production2 A 3 Glass Production2 A 4 Other Process Uses of Carbonates
CHAPTER IINational GHG Inventory
II-5

IndonesIa second natIonal communIcatIon under the unIted natIons Framework conventIon on clImate change (unFccc)
HFCs PFCsSF6
HFC-32 HFC-125 HFC 124 HFC 143 Others CF4 OthersB. Chemical2 B 1 Ammonia Production2 B 2 Nitric Acid Production2 B 4 Caprolactam, Glyoxal dan Glyoxylic Acid2 B 5 Carbide Production2 B 8 Petrochemical and Carbon Black Production
- Methanol- Ethylene - Ethylene Dichloride- Carbon Black
C. Metal NE 0.0202 C 1 Iron and Steel Production NE NE2 C 2 Ferroalloys Production NE NE2 C 3 Aluminium Production IE 0.020 2 C 5 Lead Production NE NE2 C 6 Zinc Production NE NED. Others 2 D 1 Lubricant Use2 D 2 Paraffin Wax Use3 Solvent and Other Product Use4 Agriculture4 A 1 Enteric Fermentation4 A 2 Manure Management4 C 1 b Biomass Burning CL4 C 1 c Biomass Burning GL4 C 2 Liming4 C 3 Urea Fertilization4 C 4 Direct N2O Soils4 C 5 Indirect N2O Soils4 C 6 a Direct N2O from manure4 C 6 b Indirect N2O from manure4 C 7 Rice Cultivation5 Land Use Change and Forestry
A Changes in forest and other woody biomass stocks
B Forest and grassland conversionC Abandonment of managed landsD CO2 emissions and removals from soilsE Others:
- Forest Burning- Peat Fire*
6 Waste6 A 2 a Unmanaged Waste Disposal Sites6 A 2 b Unmanaged Dumpsite6 B Biological Treatment of Solid Waste6 C 2 Open Burning Waste6 D 1 Domestic WWT and Discharge6 D 2 Industrial WWT and Discharge7 Others (please specify)
Memo ItemsInternational BunkersAviationMarineCO2 emissions from biomass
Note: Shaded cells do not require entries. CL: Crops Land. GL: Grass Land. WWT: Wastewater Treatment; NO: Not Occurring; NE: Not Estimated; NA: Not Applicable; IE: Including Elsewhere; C: Confidential
CHAPTER IINational GHG Inventory
II-6
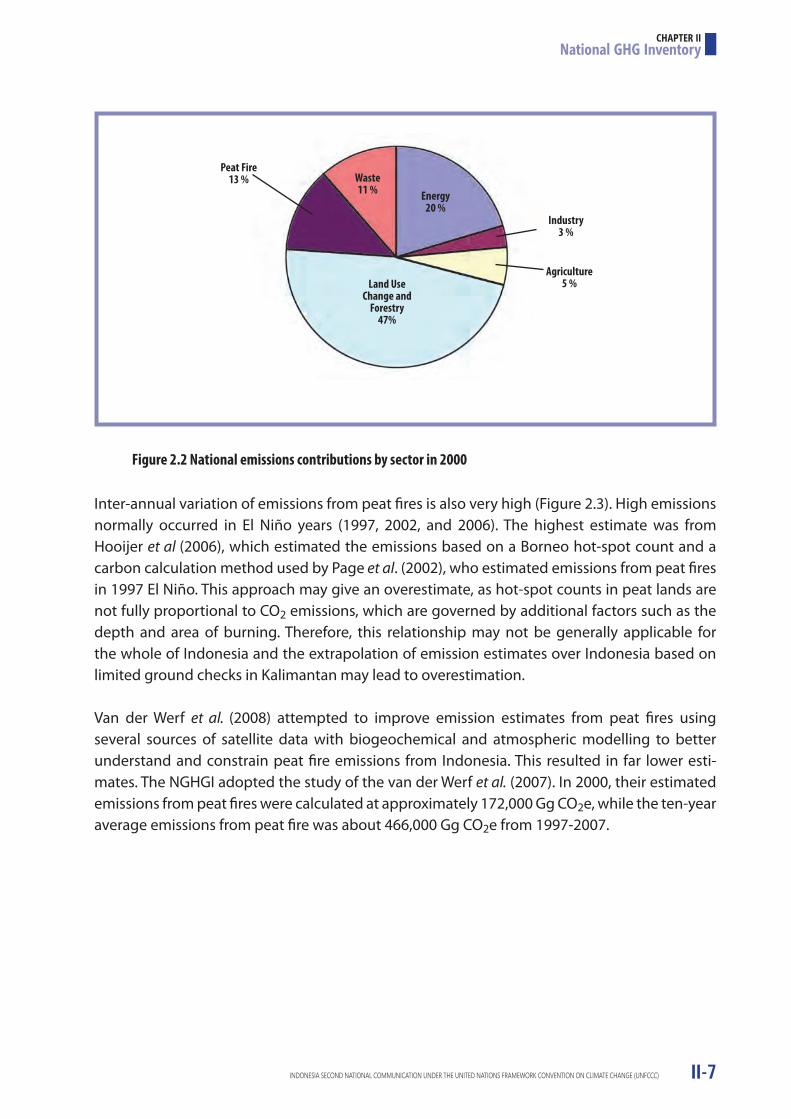
IndonesIa second natIonal communIcatIon under the unIted natIons Framework conventIon on clImate change (unFccc)
Inter-annual variation of emissions from peat fires is also very high (Figure 2.3). High emissions normally occurred in El Niño years (1997, 2002, and 2006). The highest estimate was from Hooijer et al (2006), which estimated the emissions based on a Borneo hot-spot count and a carbon calculation method used by Page et al. (2002), who estimated emissions from peat fires in 1997 El Niño. This approach may give an overestimate, as hot-spot counts in peat lands are not fully proportional to CO2 emissions, which are governed by additional factors such as the depth and area of burning. Therefore, this relationship may not be generally applicable for the whole of Indonesia and the extrapolation of emission estimates over Indonesia based on limited ground checks in Kalimantan may lead to overestimation.
Van der Werf et al. (2008) attempted to improve emission estimates from peat fires using several sources of satellite data with biogeochemical and atmospheric modelling to better understand and constrain peat fire emissions from Indonesia. This resulted in far lower esti-mates. The NGHGI adopted the study of the van der Werf et al. (2007). In 2000, their estimated emissions from peat fires were calculated at approximately 172,000 Gg CO2e, while the ten-year average emissions from peat fire was about 466,000 Gg CO2e from 1997-2007.
Figure 2.2 National emissions contributions by sector in 2000
Peat Fire 13 %
Industry3 %
Agriculture5 %Land Use
Change and Forestry
47%
Waste11 % Energy
20 %
CHAPTER IINational GHG Inventory
II-7

IndonesIa second natIonal communIcatIon under the unIted natIons Framework conventIon on clImate change (unFccc)
Emissions by Gas. Without LULUCF, the major source of CO2 emissions is from fuel combustion, followed by industrial processes, agriculture and waste (Figure 2.4). Total emissions from these four sources was 556,500 Gg (Figure 2.4). With LULUCF and peat fire, the total CO2 emissions increased to 1,112,879 Gg. As such, LULUCF and peat fire contributed to about 74% of the total CO2 emissions (Figure 2.4).
Figure 2.3 Estimate of emissions from peat fires from various studies. Note: Emissions estimates from years beyond the publication date of the reports were made by Aldrian (2008) and Wibowo and Boer (2009)
Figure 2.4 CO2 emissions by sectors in 2000
Emiss
ion
(CO 2
Tg)
10000
9000
8000
7000
6000
5000
4000
3000
2000
1000
0
Heil et al. 2007
Levine 1999
Hooijeretal 2006 Minimum
Hooijeretal 2006 Maximum
Duncan 2003
van der Werf et al 2007
1997
1998
1999
2000
2001
2002
2003
2004
2005
2006
2007
Waste28.3 %
Peat Fire15.5 %
Energy22.2 %
Industry3.6 %
Land Use Change and
Forestry 58.3%
Agriculture0.2 %
Energy50.5 %
Industry7.7 %
Agriculture13.6 %
CO2
Waste0.1 %
CHAPTER IINational GHG Inventory
II-8

IndonesIa second natIonal communIcatIon under the unIted natIons Framework conventIon on clImate change (unFccc)
The main source of methane emissions was the waste sector (65%), followed by the agriculture (22%) and energy (13%) sectors. The total methane emissions from all sectors was 236,388 Gg CO2e. For nitrous oxide, the main source of emissions was the agriculture sector (79%), followed by the waste (9%) and energy (11%) sectors (Figure 2.5). Total N2O emissions was 28,341 Gg CO2e.
2.5 Sectoral Emissions
2.5.1 EnergyIn the 2006 IPCC Guidelines, emissions sources from energy systems are classified in three main categories, namely (i) fuel combustion emissions, (ii) fugitive emission generated from energy production systems (coal mining, oil and gas production, refinery, fuel transportation, etc), and (iii) emissions from transport, injection, and storage of CO2 (related to carbon capture and storage [CCS]). Only the first two sources were included in the SNC. The source categories being analyzed in the SNC are presented in Figures 2.6 and 2.7.
The calculation of CO2 emissions applied both sectoral and reference approaches. The two approaches often have different results because the reference approach is a top-down approach using a country’s energy supply data and has no detailed information on how the individual fuels are used in each sector. In the case of Indonesia, CO2 emissions from fuel consumption estimated using the reference approach were slightly higher than those using the sectoral approach in 2004. They differed between 4.3% and 4.7% (Figure 2.8). This can be at least partially attributed to the fact that the energy consumption figure used in the sectoral approach turns out to be less than the consumption figure used in the reference approach.
Figure 2.5 Methane and nitrous oxide emissions in 2000 by sector
CH4 N2O
Waste64.8 %
Energy12.8 %
Waste8.8 %
Energy11.4 %
Industry0.5 %
Agriculture79.2 %
Industry0.9 %
Agriculture21.5 %
CHAPTER IINational GHG Inventory
II-9

IndonesIa second natIonal communIcatIon under the unIted natIons Framework conventIon on clImate change (unFccc)
Figure 2.6 Source of GHG emissions from fuel combustion activities
1A Fuel Combustion Activities
1A1 Energy Industries
1A1a Main ActivityElectricity and Heat Production
1A1ai Electricity Generation1A1aii Combined Heat and Power Generation (CHP)1A1aiii Heat Plants
1A1ci Manufacture of Solid Fuels1A1cii Other Energy Industries
1A1b Petroleum Refining1A1c Manufacture of Solid Fuels and Other Energy Industries
1A2 Manufacturing Industries and Construction
1A2a Iron and Steel1A2b Non-Ferrous Metals1A2c Chemicals1A2d Pulp, Paper and Print1A2e Food Processing, Beverages and Tobacco1A2f Non-Metallic Minerals1A2g Transport Equipment1A2h Machinary1A2i Mining (excluding fuels) and Quarrying1A2j Wood and wood products1A2k Construction1A2l Textille and Leather1A2m Non-specified Industry
1A3ai International Aviation (International Bunkers)1A3aii Domestic Aviation
1A3b Road Transportation
1A3bi Cars1A3bi1 Passenger cars with 3-way catalysts1A3bi2 Passenger cars without 3-way catalysts
1A3bii1 Light-duty trucks with 3-way catalysts1A3bii2 Light-duty trucks without 3-way catalysts
1A3biii Heavy-duty trucks and buses1A3biv Motorcycles1A3bv Evaporative emissions from vehicles1A3bvi Urea-based catalysts
1A3bii Heavy-duty trucks
1A3c Railways
1A3d Water-borne Navigation
1A3e Other Transportation
1A3 Transport
1A4 Other Sectors
1A4a Commercial/Institutional1A4b Residential
1A4c Agriculture/Forestry/Fishing/Fish Farms
1A4ci Stationary1A4cii Off-road Vehicles and Other Machinery1A4ciii Fishing (mobile combustion)
1A3eii Off-road1A3ei Piprlinr Transport
1A3di International water-borne navigation (International bunkers)1A3dii Domestic Water-borne Navigation
1A5a Stationary
1A5bi Mobiles (aviation component)1A5bii Mobile (water-borne component)1A5biii Mobile (other)
1A5b Mobile
1A5c Multilateral Operations
1A5 Non-Specified
1A3a Civil Aviation
CHAPTER IINational GHG Inventory
II-10

IndonesIa second natIonal communIcatIon under the unIted natIons Framework conventIon on clImate change (unFccc)
Figure 2.7 Source categories of fugitive emissions from fuels
Figure 2.8 CO2 emissions estimates from the energy sector using reference and sectoral approaches
1B Fugitive emissions from fuels
1B1 Solid Fuels
1B1a Coal mining and handling
1B1ai Undergroundmines
1B1ai1 Mining1B1ai2 Post-mining seam gas emissions1B1ai3 Abandoned underground mines1B1ai4 Flaring of drained methane or conversion of methane to CO2
1B1aii1 Mining1B1aii2 Post-mining seam gas emissions
1B1aii Surface mines
1B1b Spontaneous combustion and burning coal dumps
1B2a Oil1B2ai Venting1B2aii Flaring
1B2aiii All Other
1B2aiii2 Production and Upgrading
1B2aiii3 Transport1B2aiii4 Refining1B2aiii5 Distribution of oil products1B2aiii6 Other1B2aiii7 Exploration
1B2bi Venting
1B2biii All Other
1B2biii1 Exploration1B2biii2 Production1B2biii3 Processing1B2biii4 Transmission and Storage1B2biii5 Distribution1B2biii6 Other
1B2bii Flaring
1B2b Natural Gas
1B2 Oil and Natural Gas
1B3 Other emissions from Energy Production
Emiss
ion
(GgC
O 2)
380.000
360.000
340.000
320.000
300.000
280.000
260.000
240.000
220.000
200.000
Reference
Sectoral
2000 2001 2002 2003 2004 2005
CHAPTER IINational GHG Inventory
II-11

IndonesIa second natIonal communIcatIon under the unIted natIons Framework conventIon on clImate change (unFccc)
Based on the sectoral approach, CO2 was the main GHG emitted from the energy sector. It contributes approximately 89% of the total emissions from this category. Methane only contributed approximately 10% and N2O contributed less than 1% (Table 2.2).
Emissions of CO2 from the energy sector were mainly from fuel combustion, while the contribution of fugitive emissions was almost negligible (Table 2.3). Within the fuel combustion category, the main sources were electricity, petroleum and gas refining (35%), followed by transportation (23%), residential (9%) and manufacturing industries and construction (27%). In the period 2000-2005, CO2 emissions from fuel combustion showed an increase from 240,877 Gg in 2000 to 333,438 Gg in 2005 (Figure 2.9), which represents a 38% increase, or 6.4% per year.
Table 2.2 Energy sector emissions from 2000 to 2005 by gas (Gg CO2e)
Table 2.3 CO2 emissions from fossil consumption and fugitive emission from 2000-2005 (Gg CO2e)
Figure 2.9 CO2 emissions from the energy sector by source category
Type of Gases 2000 2001 2002 2003 2004 2005
CO2 247,522 274,145 296,080 303,086 341,536 339,426
CH4 30,175 29,263 28,366 27,315 26,662 26,711
N2O 3,241 3,367 3,464 3,549 3,924 3,663
Total (GgCO2e) 280,938 306,774 327,911 333,950 372,123 369,800
Activity 2000 2001 2002 2003 2004 2005
Energy (Gg CO2) 247,522 274,145 296,080 303,086 341,536 339,426
Fossil fuel consumption (fuel combustion, (Gg CO2) 240,877 267,782 289,615 296,688 335,546 333,438
Fugitive emissions from fuel (Gg CO2) 6,645 6,363 6,466 6,398 5,991 5,988
Emiss
ion
(Gg
CO2)
350.000
300.000
250.000
200.000
150.000
100.000
50.000
0
2000 2001 20020 2003 2004 2005
Fugitive
Non Specified
Industries & Construction
Commercial
Transportation
Electricity & Petrolium
CHAPTER IINational GHG Inventory
II-12
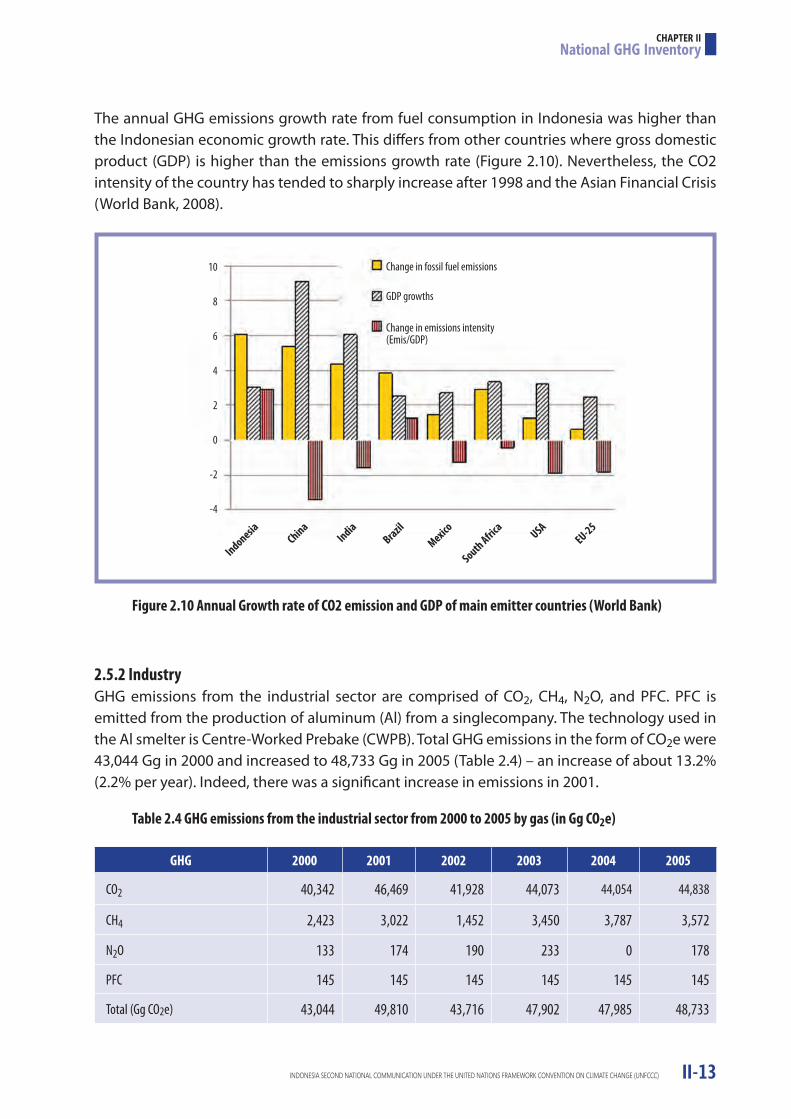
IndonesIa second natIonal communIcatIon under the unIted natIons Framework conventIon on clImate change (unFccc)
The annual GHG emissions growth rate from fuel consumption in Indonesia was higher than the Indonesian economic growth rate. This differs from other countries where gross domestic product (GDP) is higher than the emissions growth rate (Figure 2.10). Nevertheless, the CO2 intensity of the country has tended to sharply increase after 1998 and the Asian Financial Crisis (World Bank, 2008).
2.5.2 IndustryGHG emissions from the industrial sector are comprised of CO2, CH4, N2O, and PFC. PFC is emitted from the production of aluminum (Al) from a singlecompany. The technology used in the Al smelter is Centre-Worked Prebake (CWPB). Total GHG emissions in the form of CO2e were 43,044 Gg in 2000 and increased to 48,733 Gg in 2005 (Table 2.4) – an increase of about 13.2% (2.2% per year). Indeed, there was a significant increase in emissions in 2001.
Figure 2.10 Annual Growth rate of CO2 emission and GDP of main emitter countries (World Bank)
Table 2.4 GHG emissions from the industrial sector from 2000 to 2005 by gas (in Gg CO2e)
10
8
6
4
2
0
-2
-4
Change in fossil fuel emissions
GDP growths
Change in emissions intensity(Emis/GDP)
IndonesiaChina
IndiaBrazil
Mexico
South Africa
USAEU-25
GHG 2000 2001 2002 2003 2004 2005
CO2 40,342 46,469 41,928 44,073 44,054 44,838
CH4 2,423 3,022 1,452 3,450 3,787 3,572
N2O 133 174 190 233 0 178
PFC 145 145 145 145 145 145
Total (Gg CO2e) 43,044 49,810 43,716 47,902 47,985 48,733
CHAPTER IINational GHG Inventory
II-13
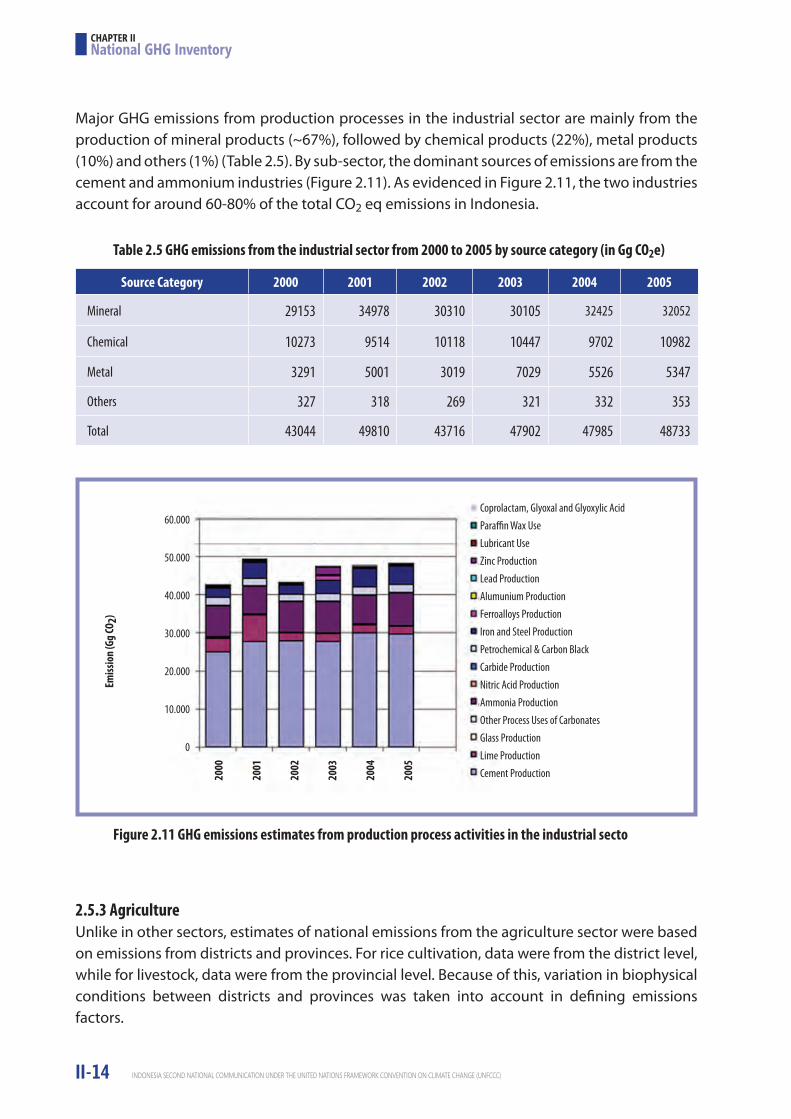
IndonesIa second natIonal communIcatIon under the unIted natIons Framework conventIon on clImate change (unFccc)
Major GHG emissions from production processes in the industrial sector are mainly from the production of mineral products (~67%), followed by chemical products (22%), metal products (10%) and others (1%) (Table 2.5). By sub-sector, the dominant sources of emissions are from the cement and ammonium industries (Figure 2.11). As evidenced in Figure 2.11, the two industries account for around 60-80% of the total CO2 eq emissions in Indonesia.
2.5.3 AgricultureUnlike in other sectors, estimates of national emissions from the agriculture sector were based on emissions from districts and provinces. For rice cultivation, data were from the district level, while for livestock, data were from the provincial level. Because of this, variation in biophysical conditions between districts and provinces was taken into account in defining emissions factors.
Table 2.5 GHG emissions from the industrial sector from 2000 to 2005 by source category (in Gg CO2e)
Figure 2.11 GHG emissions estimates from production process activities in the industrial secto
Source Category 2000 2001 2002 2003 2004 2005
Mineral 29153 34978 30310 30105 32425 32052
Chemical 10273 9514 10118 10447 9702 10982
Metal 3291 5001 3019 7029 5526 5347
Others 327 318 269 321 332 353
Total 43044 49810 43716 47902 47985 48733
Emiss
ion
(Gg
CO2)
60.000
50.000
40.000
30.000
20.000
10.000
0
2000
2001
2002
2003
2004
2005
Coprolactam, Glyoxal and Glyoxylic AcidParaffin Wax UseLubricant UseZinc ProductionLead ProductionAlumunium ProductionFerroalloys ProductionIron and Steel ProductionPetrochemical & Carbon BlackCarbide ProductionNitric Acid ProductionAmmonia ProductionOther Process Uses of CarbonatesGlass ProductionLime ProductionCement Production
CHAPTER IINational GHG Inventory
II-14

IndonesIa second natIonal communIcatIon under the unIted natIons Framework conventIon on clImate change (unFccc)
From the analysis it was found that in 2000, total emissions of the three main GHGs (CO2, CH4 and N2O) from this sector reached 75,420 Gg; by 2005, they had increased by 6.3% to 80,179 Gg CO2e (Table 2.6). Methane contributed to approximately 65% of the total emissions, while N2O contributed 31% and CO2contributed 4%.
By source category, the major emissions were from rice cultivation, direct N2O emissions and enteric fermentation from ruminants. These three sources accounted for approximately 83% of the total GHG emissions from this sector (Figure 2.12).
2.5.3.1 LivestockEnteric Fermentation. Livestock populations in Indonesia are mostly concentrated in Java, Sumatra and Sulawesi. The highest number of ruminant animals is located in the East Java Province, followed by Nanggroe Aceh Darusalam (NAD; Table 2.7). Enteric fermentation is the most important source of methane emissions from livestock; these emissions are largely from beef cattle (62.8%), buffalo (16.0%) and goat herds (10.4%; Figure 2.13).
Table 2.6 GHG emissions from the agriculture sector from 2000 to 2005 by gas (in Gg CO2e)
Figure 2.12 GHG emissions from the agriculture sector from 2000-2005 by source category
Emiss
ion
(Gg
CO2)
90.000
80.000
70.000
60.000
50.000
40.000
30.000
20.000
10.000
0
2000
2001
2002
2003
2004
2005
Gas 2000 2001 2002 2003 2004 2005
CO2 2,178 3,232 3,215 3,457 3,692 3,837
CH4 50,800 50,677 50,833 52,547 49,342 50,670
N2O 22,441 23,592 22,982 23,825 24,828 25,672
Total (in Gg CO2e) 75,420 77,501 77,030 79,829 77,863 80,179
Rice Cultivation
Indirect N2
Direct N2O
Urea Fertilization
Liming
Biomass Burning
Manure Management
Enteric Fermentation
CHAPTER IINational GHG Inventory
II-15

IndonesIa second natIonal communIcatIon under the unIted natIons Framework conventIon on clImate change (unFccc)
Methane Emissions from Manure Management. Methane emissions from manure management in 2000 were 79.69 Gg. Methane emissions from manure management were dominated by pig farms, which contributed 46.1%, followed by dairy cattle (10.3%) and beef cattle, which contributed the third largest emissions (10.2%) (Figure 2.14). East Java Province was the largest contributor, producing 9.72 Gg (12.2%), followed by Central Java at 8 Gg (12.2%) and North Sumatra at 7.7 Gg (1.9%). Methane emissions from manure management were small compared to enteric fermentation, comprising only13% of the total emissions from livestock (Figure 2.15).
Table 2.7 Livestock population in Indonesia from 2000-2006
Figure 2.13 Distribution of methane emissions from enteric fermentation by species type
No. Species Type 2000 2001 2002 2003 2004 2005 2006
1 Beef Cattle (AU) 8,121,691 8,069,525 8,183,187 7,546,157 7,547,990 7,561,691 7,799,932
2 Dairy Cattle (AU) 265,744 260,249 268,873 280,388 273,098 542,078 276,803
3 Buffalo (AU) 1,766,248 1,710,212 1,754,202 1,796,835 1,751,355 1,550,100 1,575,649
4 Sheep (head) 7,414,965 7,367,776 7,603,892 7,774,294 8,037,667 8,290,477 8,947,878
5 Goat (head) 12,613,108 12,198,587 12,292,318 12,465,046 12,592,730 13,203,098 13,567,972
6 Swine (head) 5,247,200 4,871,896 5,237,758 5,429,766 5,548,999 6,043,706 5,378,041
7 Horse (head) 412,919 404,162 396,697 388,599 376,378 365,478 373,981
8 Local Chicken (000 head) 261,132 268,786 276,023 278,068 278,966 281,431 292,122
9 Broiler (000 head) 534,811 624,690 849,644 855,669 785,547 820,501 808,510
10 Layer (000 head) 69,703 70,127 78,024 79,168 93,497 84,688 100,236
11 Duck (000 head) 29,674 32,591 46,624 34,547 33,255 33,102 33,195
Beef Cattle
Dairy Cattle
Buffalo
Sheep
Goat
Pig
Horse
1.2 %0.9 %10.3 %
6.1 %
62.6 %15.9 %
3.0 %
CHAPTER IINational GHG Inventory
II-16

IndonesIa second natIonal communIcatIon under the unIted natIons Framework conventIon on clImate change (unFccc)
N2O Emissions from Manure Management. Direct and indirect N2O emissions from manure management are presented in Table 2.8. The annual direct N2O emissions were 0.399 Gg, while the annual indirect N2O emissions were 0.134 Gg. The total N2O emissions from manure management was therefore 0.5130 Gg.
Figure 2.14 Distribution of methane emissions from manure management by species type
Figure 2.15 Methane emissions from livestock in Indonesia from 2000-2006
6.6 %
1.7 %
0.7 %
10.3 %
4.4 %
1.9 %
3.5 %
13.4 % 10.2 %
46.1 %
1.1 %
Beef CattleDairy CattleBuffaloSheepGoatPigHorseLocak ChickenBroilerLayerDuck
Ente
ric Fe
rmen
tatio
n (G
g CH
4)
Man
ure M
anag
emen
t (Gg
CH4)
675
600
525
450
375
300
225
150
75
0
Enteric Fermentation
Manure Management
2000 2001 2002 2003 2004 2005 2006
675
600
525
450
375
300
225
150
75
0
CHAPTER IINational GHG Inventory
II-17

IndonesIa second natIonal communIcatIon under the unIted natIons Framework conventIon on clImate change (unFccc)
2.5.3.2 Rice CultivationActivity data used to calculate the emissions from rice fields were based on data on the area of rice fields and planting intensity from BPS 2005. Scaling factors for different soil types and correction factors for rice farms based on different water regimes were compiled from various pieces of research in Indonesia. Total CH4 emissions from Indonesian rice fields in 2000 and 2005 were 1,660 and 1,649 Gg, respectively (Figure 2.16). Methane emissions were calculated based on the proportion of rice field area in each of the years 2000, 2001, 2002, 2003, 2004 and 2005. Anincrease of 3.6% in 2003 from emissions in year 2000 can be attributed to the growth of rice harvested area, especially in the outer islands. Reduction of total CH4 emissions by as much as 3.1% in 2004 was due to an El Niño event in the same year, which influenced almost all harvested rice areas in Indonesia.
Table 2.8 Direct and indirect N2O emissions from manure management
* The emissions from pasture is calculated in the section called “N2O emissions from managed soil”** Beef cattle in pasture management system is 30% of population*** Beef cattle in dry lot management system is 70% of population
Figure 2.16 Methane emissions from rice cultivation from 2000-2005.
Manure Management System
Species Type Number of Animal
Annual direct N2O emissions
(Gg/Year)
Annual indirect N2O emissions
(Gg/Year)Pasture* Beef Cattle** 2,436,507 - -Daily Spread Dairy Cattle 265,744 0 0.000914
Dry Lot
Beef Cattle*** 5,685,184 0.155217 0.023283Buffalo 1,766,248 0.042792 0.008558Sheep 7,414,965 0.055731 0.011146Goats 12,613,108 0.118935 0.023787Swine 2,623,600 0.008427 0.001896Horses 412,919 0.010372 0.002334
Poulty With LitterBroiler 534,810,990 0.004555 0.022776Layer 69,702,890 0.000885 0.004426
Poultry Without LitterNative Chicken 261,132,020 0.002211 0.012159Duck 29,674,120 0.000424 0.002331
Total 0.399549 0.113610
Gg CH
4
1.800
1.750
1.700
1.650
1.600
1.550
1.500
CH4 emmision from Rice
year2000 2001 2002 2003 2004 2005
CHAPTER IINational GHG Inventory
II-18

IndonesIa second natIonal communIcatIon under the unIted natIons Framework conventIon on clImate change (unFccc)
2.5.3.3 Agricultural SoilsLiming. Lime consumption data was not available during the data collection period for the SNC. Therefore, the CO2 emissions from liming were determined from the recommended dose of lime for palm oil plantations in acid sulfate and peat soil (Note: liming on food crops is rarely applied by farmers). Using this method, the CO2 emissions from liming from 2000 to 2005 are shown in Figure 2.17. Lime consumption in Indonesia increased, which is consistent withthe expansion of peatlands for palm oil plantation after the year 2000.
Urea Fertilization. Adding urea to soils during fertilization leads to a loss of CO2 that was previously fixed in fertilizer during the industrial production process that manufactured it. Urea (CO(NH2 )2 ) is converted into ammonium (NH2+), an hydroxyl ion (OH-) and bicarbonate (HCO2 -), in the presence of water and urease enzymes. Similar to the soil reaction following the addition of lime, the bicarbonate that is formed evolves into CO2 and water.
Data on urea consumption for years 2000-2005 were derived from the Indonesia’s Association of Fertilizer Producers (APPI). CO2 emissions from urea application in the agricultural sector are shown in Figure 2.18. These emissions are currently increasing, as consumption of urea is increasing at an average rate of 4.5% per year since 2001.
Figure 2.17 CO2 emissions from liming in agriculture.
Figure 2.18 CO2 emissions from urea fertilization from 2000-2005
Gg CO
2
300
280
260
240
220
200
CO2 emmision from Liming
year2000 2001 2002 2003 2004 2005
Gg CO
2
4.0003.5003.0002.5002.0001.5001.000
5000
CO2 emmision from Urea Fertilization
year1 2 3 4 5 6
CHAPTER IINational GHG Inventory
II-19

IndonesIa second natIonal communIcatIon under the unIted natIons Framework conventIon on clImate change (unFccc)
N2O Emissions from Managed Soils – Direct N2O Emissions. Urea, ammonium sulphate (AS) and nitrogen, phosphorus and potassium (NPK) are the general types of inorganic nitrogen (N) fertilizers most commonly used in the agricultural sector of Indonesia. Urea and AS are the most common nitrogen-based inorganic fertilizers used in large plantations (APPI, 2008). This type of fertilizer is normally applied for fruits, vegetables and other perennial crops that have high economic value. The concentration of N in urea and AS is 46% and 21%, respectively (Petrokimia Gresik, 2008). However, data on NPK fertilizer consumption is not available. Instead, direct N2O emissions on managed soil and flooded rice were calculated from the levels of application of N fertilizer and animal manure. The N fertilizer consumption data are only provided for urea and ammonium sulphate. N2O emissions from flooded rice paddies were calculated based on harvested area of rice and from managed soil (i.e., maize, soybean and palm oil). Direct N2O emissions from 2000-2005 from managed soil are shown in Figure 2.19. Fluctuation of N2O direct emissions from managed soil, as shown in Figure 2.19, can be attributed to the consumption of urea and AS for agriculture in Indonesia. Urea is the main N source used in agriculture, mostly for food crops; however, AS is normally applied in plantation crops such as sugarcane. Some AS is used in rice fields to improve the number of tillers of rice plant.
N2O Emissions from Managed Soils – Indirect N2O Emissions. Indirect N2O emissions from soil were also calculated based on the consumption of N fertilizer (urea, AS and animal manure) in agriculture. The indirect N2O emissions from N fertilizer for perennial and estate crops were based on the N fertilizer consumption data from 2000 and the use of animal manure used in agricultural cropping. The resulting N2O emissions calculated was approximately 18.34 Gg of N2O/year (Figure 2.20).
Figure 2.19 Direct N2O emissions from N synthetic fertilizer and manure management applied to soils
Direct N2O emmision from managed soils
Gg N
2O
65
60
55
50
45
40
year2000 2001 2002 2003 2004 2005
CHAPTER IINational GHG Inventory
II-20

IndonesIa second natIonal communIcatIon under the unIted natIons Framework conventIon on clImate change (unFccc)
2.5.3.4 Biomass BurningPrescribed Savannah Burning (Grassland Burning). Emissions from grassland burning were calculated based on the 2000-2005 harvested area of upland rice data derived from BPS. Assumptions from expert judgment suggested that 80% of upland rice outside the island of Java was burned and that these areas conducted shifting cultivation; within Java, however, judgment suggested that burning of grassland is not common practice. The emissions of CH4, CO, N2O and NOx from cropland burning are shown in Table 2.9. Results showed that there were not significant differences in emissions from grassland burning between years.
Field Burning of Agriculture Residue (Cropland burning). Emissions from cropland burning were calculated based on the 2000-2005 rice production data derived from BPS. Assumptions from expert judgment mentioned that the proportion (harvest index) for yield and biomass is
Figure 2.20 Indirect N2O emissions from N synthetic fertilizer and animal manure applied to soils
Table 2.9 Distribution of GHG emissions from grassland burning from 2000-2005 (Gg CO2e)
Indirect N2O emmision from managed soilsGg
N2O
20
19
18
17
16
15
year
2000 2001 2002 2003 2004 2005
GHG’s emission 2000 2001 2002 2003 2004 2005
CO2 - - - - - -
CH4 24.05 21.29 21.31 21.86 22.70 22.51
N20 2.20 1.94 1.95 2.00 2.07 2.06
CO 679.78 601.61 602.23 617.90 641.44 636.17
NOx 40.79 36.10 36.13 37.07 38.49 38.37
CO2e 1,187.05 1,048.49 1,052.01 1,079.06 1,118.40 1,111.31
CHAPTER IINational GHG Inventory
II-21

IndonesIa second natIonal communIcatIon under the unIted natIons Framework conventIon on clImate change (unFccc)
1:1, and the fraction of biomass that is burned differs between regions. The emissions of CH4, CO, N2O and NOx from cropland burning are shown in Table 2.10.
2.5.4 Land Use Change and Forestry (LUCF)Application of the 2006 IPCC GL for LUCF requires consistent land categories to estimate emissions and removal of GHGs for all land categories, relevant carbon pools, and non-CO2 gases (based on key source/sink category analysis). This has implications for the activity data required and emissions factors for all land categories, carbon pools and related non-CO2 gases. Since land categories in the 2006 IPCC GL are different from current forest classes applied by Directorate Forestry of Forestry Planning (Ministry of Forestry), the forest categories by Ministry of Forestry were grouped following the 2006 IPCC GL in developing the GHG inventory for this sector, as shown in Table 2.11.
Table 2.10 Distribution of GHG emissions from cropland burning from 2000-2005 (Gg)
Table 2.11 Adjustment of Indonesia’s land category by Ministry of Forestry into 2006 IPCC GL categories
GHG’s emission 2000 2001 2002 2003 2004 2005
CO2 - - - - - -
CH4 47.39 43.86 45.45 45.79 47.63 47.44
N20 1.23 1.14 1.18 1.19 1.23 1.23
CO 1,614.90 1,494.66 1,548.68 1,560.22 1,623.03 1,616.36
NOx 43.88 40.62 42.08 42.40 44.10 43.92
CO2e 1,376.17 1,274.46 1,319.74 1,330.47 1,381.53 1,377.48
No. Forest Category (MoF, 2008) 2006 IPCC Land Category
1. Primary Dry land Forest Forest Land2. Primary Swamp Forest Forest Land3. Primary Mangrove Forest Forest Land4. Secondary Dry land Forest Forest Land5. Secondary Swamp Forest Forest Land6. Secondary Mangrove Forest Forest Land7. Plantation Forest Forest Land
Other land use (APL)8. Shrubs Grassland9. Swamp shrubs Wetland
10. Open lands Other Land11. Swamp Wetland12. Agriculture Cropland
CHAPTER IINational GHG Inventory
II-22
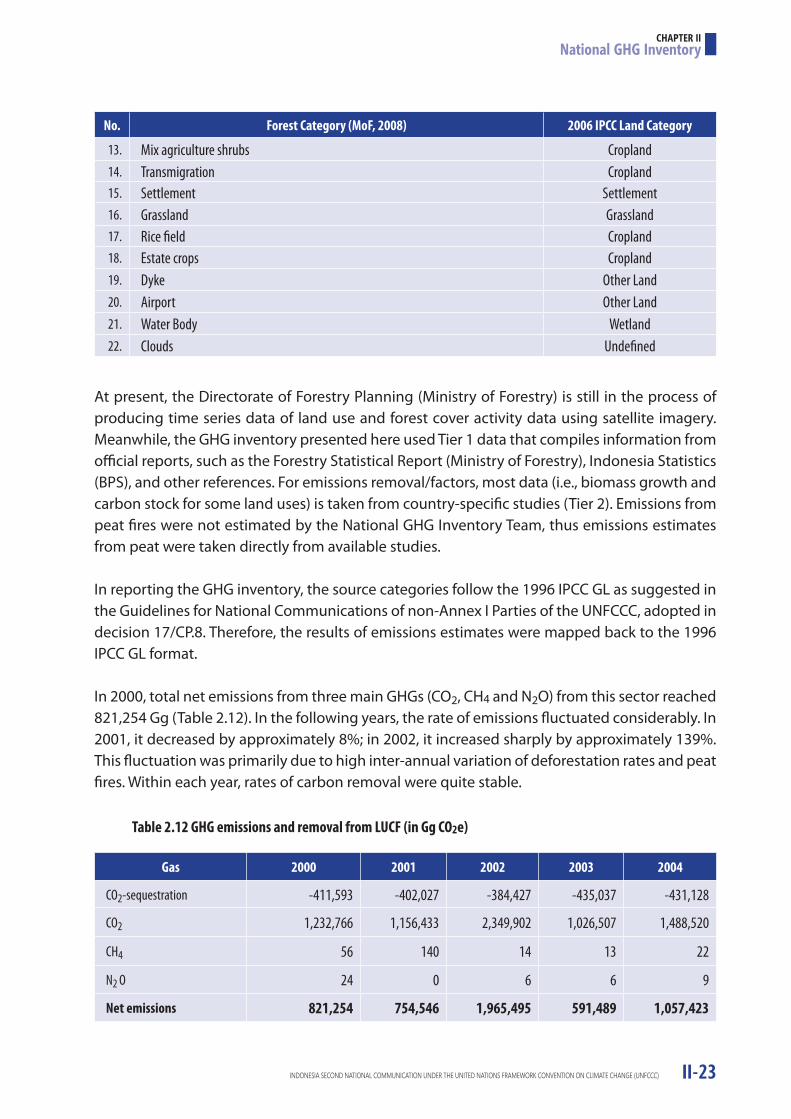
IndonesIa second natIonal communIcatIon under the unIted natIons Framework conventIon on clImate change (unFccc)
At present, the Directorate of Forestry Planning (Ministry of Forestry) is still in the process of producing time series data of land use and forest cover activity data using satellite imagery. Meanwhile, the GHG inventory presented here used Tier 1 data that compiles information from official reports, such as the Forestry Statistical Report (Ministry of Forestry), Indonesia Statistics (BPS), and other references. For emissions removal/factors, most data (i.e., biomass growth and carbon stock for some land uses) is taken from country-specific studies (Tier 2). Emissions from peat fires were not estimated by the National GHG Inventory Team, thus emissions estimates from peat were taken directly from available studies.
In reporting the GHG inventory, the source categories follow the 1996 IPCC GL as suggested in the Guidelines for National Communications of non-Annex I Parties of the UNFCCC, adopted in decision 17/CP.8. Therefore, the results of emissions estimates were mapped back to the 1996 IPCC GL format.
In 2000, total net emissions from three main GHGs (CO2, CH4 and N2O) from this sector reached 821,254 Gg (Table 2.12). In the following years, the rate of emissions fluctuated considerably. In 2001, it decreased by approximately 8%; in 2002, it increased sharply by approximately 139%. This fluctuation was primarily due to high inter-annual variation of deforestation rates and peat fires. Within each year, rates of carbon removal were quite stable.
Table 2.12 GHG emissions and removal from LUCF (in Gg CO2e)
No. Forest Category (MoF, 2008) 2006 IPCC Land Category
13. Mix agriculture shrubs Cropland14. Transmigration Cropland15. Settlement Settlement16. Grassland Grassland17. Rice field Cropland18. Estate crops Cropland19. Dyke Other Land20. Airport Other Land21. Water Body Wetland22. Clouds Undefined
Gas 2000 2001 2002 2003 2004
CO2-sequestration -411,593 -402,027 -384,427 -435,037 -431,128
CO2 1,232,766 1,156,433 2,349,902 1,026,507 1,488,520
CH4 56 140 14 13 22
N2 O 24 0 6 6 9
Net emissions 821,254 754,546 1,965,495 591,489 1,057,423
CHAPTER IINational GHG Inventory
II-23

IndonesIa second natIonal communIcatIon under the unIted natIons Framework conventIon on clImate change (unFccc)
By source category, forest and grassland conversion are the main sources of emissions, followed by peat fires and peat oxidation (i.e., emissions from organic soils) (Figure 2.21). However, from 2000-2004, the contribution of forest and grassland conversion to the total emissions from this sector varied between 48% and 65%, peat fire between 15% and 32% and peat oxidation between 10% and 25%. The 2008 World Bank study, however, gave different estimates. It reported that the average emissions from LUCF were approximately 2,398,000 Gg, in which 53% were from peat fire, 20% were from peat drainage (peat oxidation), 22% were from deforestation and 5% were from palm oil and timber plantation establishment.
The contribution of peat fires to the total national emissions could actually be higher since the estimate of emissions from available studies varies considerably (Table 2.13). The lowest estimates were from Indonesian Forest Climate Alliance (IFCA) study (MoF, 2008) while the highest was from Hooijer et al, (2006). Hooijer et al (2006) estimated the emissions based on a Borneo hot-spot count and a carbon calculation method used by Page et al. (2002), who estimated emissions from peat fires during the 1997 El Niño. This approach may lead to an overestimate as hot-spot counts in peat lands are not fully proportional to CO2 emissions, which are governed by additional factors such as the depth and area of burning. Therefore, this relationship may not also be generally applicable for the whole of Indonesia, and so the extrapolation of emission estimates over Indonesia based on limited ground checks in Kalimantan may lead to overestimation. Van der Werf et al. (2008) attempted to improve emissions estimates from peat fires using several sources of satellite data with biogeochemical and atmospheric modelling to better understand and constrain peat fire emissions in Indonesia. This resulted in far lower estimates. The NGHGI adopted the study of the van der Werf et al. (2007). In 2000, the authors’ estimated emissions from peat fires were calculated at about 172,000 Gg CO2e, while the ten-year average emissions from peat fires (1997-2007) were approximately 466,000 Gg CO2e .
Figure 2.21 GHG emissions from LUCF sector from 2000-2004 by source category
1 The use of average emissions figures from 1997-2007 could reduce the inter-annual variation
Emiss
ion/
Rem
oval
(CO 2e
)
2.500.000
2.000.000
1.500.000
1.000.000
500.000
0
-500.000
-1.000.000
C-sequestration
F&G Conversion
Peat Oxidation
Peat Fire
Forest burning
2000
2001
2002
2003
2004
CHAPTER IINational GHG Inventory
II-24
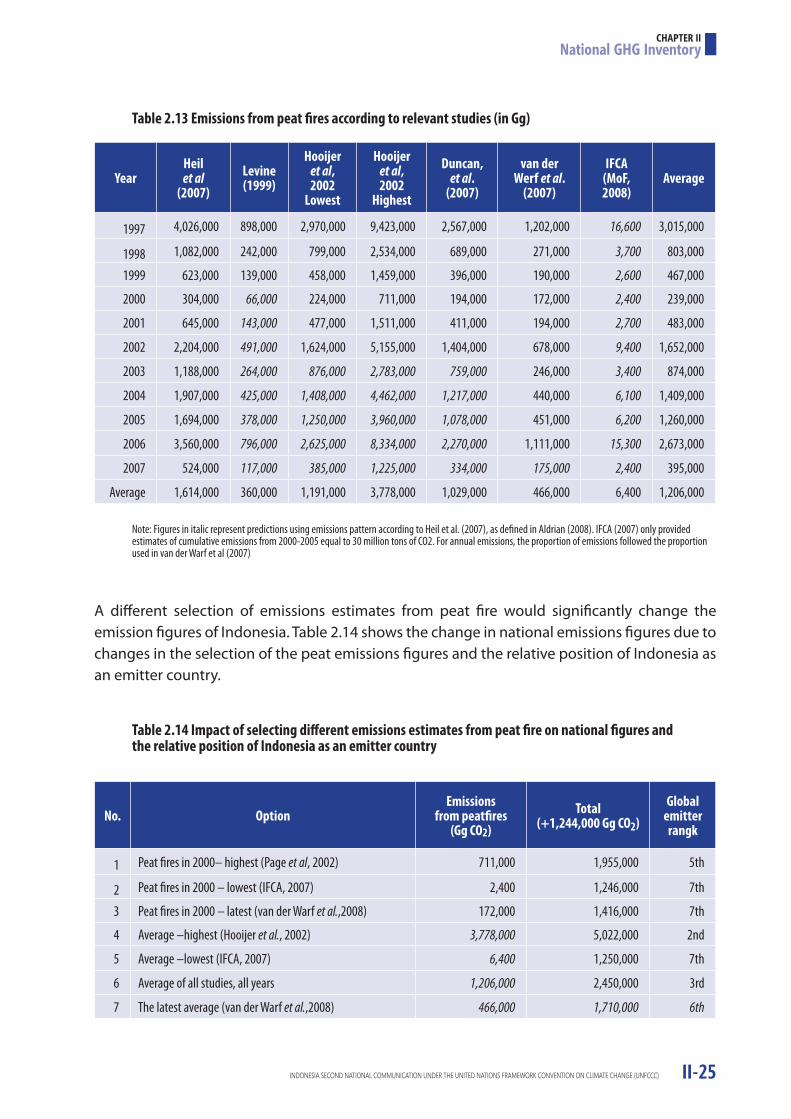
IndonesIa second natIonal communIcatIon under the unIted natIons Framework conventIon on clImate change (unFccc)
A different selection of emissions estimates from peat fire would significantly change the emission figures of Indonesia. Table 2.14 shows the change in national emissions figures due to changes in the selection of the peat emissions figures and the relative position of Indonesia as an emitter country.
Table 2.13 Emissions from peat fires according to relevant studies (in Gg)
Table 2.14 Impact of selecting different emissions estimates from peat fire on national figures and the relative position of Indonesia as an emitter country
YearHeil et al
(2007)Levine(1999)
Hooijeret al,2002
Lowest
Hooijeret al,2002
Highest
Duncan, et al.
(2007)
van der Werf et al.
(2007)
IFCA (MoF, 2008)
Average
1997 4,026,000 898,000 2,970,000 9,423,000 2,567,000 1,202,000 16,600 3,015,000
1998 1,082,000 242,000 799,000 2,534,000 689,000 271,000 3,700 803,000
1999 623,000 139,000 458,000 1,459,000 396,000 190,000 2,600 467,000
2000 304,000 66,000 224,000 711,000 194,000 172,000 2,400 239,000
2001 645,000 143,000 477,000 1,511,000 411,000 194,000 2,700 483,000
2002 2,204,000 491,000 1,624,000 5,155,000 1,404,000 678,000 9,400 1,652,000
2003 1,188,000 264,000 876,000 2,783,000 759,000 246,000 3,400 874,000
2004 1,907,000 425,000 1,408,000 4,462,000 1,217,000 440,000 6,100 1,409,000
2005 1,694,000 378,000 1,250,000 3,960,000 1,078,000 451,000 6,200 1,260,000
2006 3,560,000 796,000 2,625,000 8,334,000 2,270,000 1,111,000 15,300 2,673,000
2007 524,000 117,000 385,000 1,225,000 334,000 175,000 2,400 395,000
Average 1,614,000 360,000 1,191,000 3,778,000 1,029,000 466,000 6,400 1,206,000
Note: Figures in italic represent predictions using emissions pattern according to Heil et al. (2007), as defined in Aldrian (2008). IFCA (2007) only provided estimates of cumulative emissions from 2000-2005 equal to 30 million tons of CO2. For annual emissions, the proportion of emissions followed the proportion used in van der Warf et al (2007)
No. OptionEmissions
from peatfires(Gg CO2)
Total (+1,244,000 Gg CO2)
Globalemitterrangk
1 Peat fires in 2000– highest (Page et al, 2002) 711,000 1,955,000 5th
2 Peat fires in 2000 – lowest (IFCA, 2007) 2,400 1,246,000 7th
3 Peat fires in 2000 – latest (van der Warf et al.,2008) 172,000 1,416,000 7th
4 Average –highest (Hooijer et al., 2002) 3,778,000 5,022,000 2nd
5 Average –lowest (IFCA, 2007) 6,400 1,250,000 7th
6 Average of all studies, all years 1,206,000 2,450,000 3rd
7 The latest average (van der Warf et al.,2008) 466,000 1,710,000 6th
CHAPTER IINational GHG Inventory
II-25

IndonesIa second natIonal communIcatIon under the unIted natIons Framework conventIon on clImate change (unFccc)
2.5.5 WasteAccording to the 2006 IPCC GL, sources of emissionsfrom the waste sector are found in four main categories: solid waste, biological treatment of solid waste, incineration and open burning of waste and wastewater treatment and discharge, as shown in Figure 2.22.
− Concerning solid waste disposal: In urban areas, almost 60% of waste is taken to solid was- te disposal site (SWDS), while in rural areas or small cities, this figure is only 30% (Indone- sian Statistical Data on Environment; BPS, 2007). The major components of solid waste brought to SWDS areorganic compounds as the other types of waste (plastics, metal, etc.) are generally recycled for re-utilization. The dominant organic compound in solid waste will affect the degradable organic content (DOC) value and the corresponding correction of the CH4 emissions factor in inventories. The SWDSs in most big cities in Indonesia are considered to beunmanaged SWDS because they are simply open dumping systems; within the context of GHG emissions, they are catagorized as unmanageddeep (>5 m) waste.
Currently, incinerators for municipal solid waste are generally not used in Indonesia. Al- though several statistical data indicate that inceration is already used for eliminating municipal solid waste, in reality, the so-called ‘incinerator’ is actually an ‘open burning’ system. Therefore, the calculation of CO2 emissions from municipal solid waste is based on open burning.
Figure 2.22 Categories of GHG emissions sources within thewaste sector
1. ENERGY
2. INDUSTRIAL PROCESSES AND PRODUCT USE
3. AGRICULTURE, FORESTRY, AND OTHER LAND USE
4A Solid Waste Disposal4A1 Managed Waste Disposal Sites
4C1 Waste Incineration4C2 Open Burning of Waste
4D1 Domestic Wastewater Treatment and Discharge
4D2 Industrial Wastewater Treatment and Discharge
4A1 Unmanaged Waste Disposal Sites4A3 Uncategorised Waste Disposal Sites
4B Biological Treatment of Solid Waste4C Incineration and Openg Burning of Waste
4D Wastewater Treatment and Discharge
4E Other
4. WASTE
5. OTHER
NationalGreenhouse
GasInventory
CHAPTER IINational GHG Inventory
II-26

IndonesIa second natIonal communIcatIon under the unIted natIons Framework conventIon on clImate change (unFccc)
− Concerning domestic wastewater: In general, the discharge pathways of domestic waste- water in urban areas in Indonesia are decentralized using individual septic tanks. In rural areas, there is almost no wastewater treatment.
− Concerning industrial wastewater: In general,industrial wastewater is treated by the indus- try prior to discharge to the environment. The calculation of GHG emissions level varies according to the type of industry and the corresponding treatment technology.
From this analysis, it was found that the 2000 total net emissions from the three main GHGs (CO2, CH4 and N2O) of the waste sector reached 157,328 Gg (Table 2.15). Methane contributed to approximately 97% of the total emissions. The rate of emission in the period from 2000-2005 was relatively stable. By source category, the major sources are from wastewater treatment and discharge (Figure 2.23).
2.6 Emissions Trends
Of the five sectors considered here, there are only three sectors where the rates of emissions have increased. These sectors are energy, agriculture and industry, while emissions from the waste sector were relatively constant and those from the LUCF sector fluctuated considerably
Table 2.15 GHG emissions and removal from waste (in Gg CO2e)
Figure 2.23 GHG emissions from the waste sector from 2000-2005 by source category
Gas 2000 2001 2002 2003 2004 2005
CO2 1,662 2,266 2,302 2,338 2,366 2,377
CH4 153,164 155,853 157,516 158,670 160,361 161,346
N2O 2,501 2,699 2,982 3,066 3,072 3,108
Total 157,328 160,818 162,800 164,074 165,799 166,831
Emiss
ion
(Gg
CO2e
)
180.000
160.000
140.000
120.000
100.000
80.000
60.000
40.000
20.000
0
Unmanaged Dumpsite
Industrial WWT and Discharge
Domestic WWT and Discharge
Open Burning Solid Waste
Biological Treatment of Solid Waste
Unmanaged Waste Disposal Sites
20002001
20022003
20042005
CHAPTER IINational GHG Inventory
II-27

IndonesIa second natIonal communIcatIon under the unIted natIons Framework conventIon on clImate change (unFccc)
between years (Figure 2.24). The net emissions from the LUCF sector were the lowest in 2003. In 2003, the rate of reforestation was relatively high while rate of deforestation was low.
2.7 Key Category Analysis
The key category analysis (Tier 1) without and with LUCF indicated that there are 20 and 5 key categories respectively. Without LUCF, the first three main categories that contributed to more than 50% of the total emissions were (i) energy production (electricity, heat, oil & gas refining), (ii) industrial wastewater treatment and discharge and (iii) manufacturing industries and construction (Table 2.16). With LUCF, the first three main categories are all from the LUCF sector. These include (i) forest and grassland conversion, (ii) peat fire and (iii) CO2 emissions and removals from soils. This analysis suggests that improvement of activity data and emission factors for these key categories were very important to improve the Indonesian National GHG Inventory. It appears that activity data on land use and forest change area and the forested area are the most important. Local emission factors for these source categories need to be developed.
Figure 2.24 Emissions trends by sector
Table 2.16 Key Category Analysis
Emiss
ion
(Gg
CO2)
3.000.000
2.500.000
2.000.000
1.500.000
1.000.000
500.000
0
Land Use Change and Forestry(excl. peat fire)Peat Fire
Waste
Agriculture
Industry
Energy
2000 2001 2002 2003 2004
Sector Source Categories to be Assessed in Key SourceCategory Analysis Gases
CumulativeContribution
(%)Without L U C F 2,266 2,302
Energy Energy production (electricity, heat, oil & gas refining) CO2 19.8Waste Industrial Wastewater Treatment and Discharge CH4 38.5Energy Manufacturing Industries and Construction CH4 50.9Energy Transportation CO2 61.8
CHAPTER IINational GHG Inventory
II-28

IndonesIa second natIonal communIcatIon under the unIted natIons Framework conventIon on clImate change (unFccc)
2.8 Uncertainty Analysis
An uncertainty analysis was conducted (Tier 1) following the Good Practice Guidance (GPG) IPCC 2000. The levels of uncertainty for activity data and emission factors were assessed based on expert judgment and consultation with the Centre for Data and Information in the related sectors (Table 2.17). Overall uncertainty of the Indonesian National GHG inventory for 2000 and 2004 without LUCF was approximately 16.3% and 13.9%, respectively, while the trend uncertainty was 16.9%. With the inclusion of LUCF, the level of uncertainty of the National GHG Inventory increased between 15% and 20% (Table 2.18).
Improving activity data and emissions factors for the LUCF sector (the first three key categories) could increase the certainty of the inventory (cf. Table 2.17 and 2.18). This improvement is possible with the use of satellite data. Emissions/removal factors can also be improved with the use of data from National Forest Inventory (NFI). At the time of this inventory, the NFI data is still being processed and not available for use. With the availability of this data, the overall certainty of the Indonesian National GHG Inventory can be improved significantly.
Sector Source Categories to be Assessed in Key SourceCategory Analysis Gases
CumulativeContribution
(%)Agriculture Rice Cultivation CO2 66.9Industrial Process Cement Production CH4 71.4Energy Residential CO2 75.6Agriculture Direct N2O Soils CO2 78.2Energy Oil and Natural Gas N2O 80.6Waste Unmanaged Waste Disposal Sites CH4 82.6Energy Non Specified CH4 84.6Agriculture Enteric Fermentation CO2 86.5Waste Domestic Wastewater Treatment and Discharge CH4 88.0Waste Unmanaged Dumpsite CH4 89.5Energy Residential CH4 91.0Energy Commercial/Institutional CH4 92.3Industrial Process Ammonia Production CH4 93.5Agriculture Indirect N2O Soils CO2 94.4Energy Oil and Natural Gas CO2 95.3
With L U C FLUCF Forest and grassland conversion CO2 39.6LUCF Peat Fire CO2 65.2LUCF CO2 emissions and removals from soils CO2 79.3Energy Energy production (electricity, heat, oil & gas refining) CO2 86.9Waste Industrial Wastewater Treatment and Discharge CH4 94.1Energy Manufacturing Industries and Construction CO2 98.9
CHAPTER IINational GHG Inventory
II-29

IndonesIa second natIonal communIcatIon under the unIted natIons Framework conventIon on clImate change (unFccc)
2.9 Quality Assurance/Quality Control (QA/QC)
At present there is no system in place for QA/QC for the GHG emissions. However, the Bureau of Statistics and several other agencies that are responsible for collecting data from local governments and private companies have set up procedures for data quality checking. In the future, sectors that are responsible for developing the National GHG Inventory will develop QA/QC systems. The Ministry of Environment has proposed SIGN (Sistem Inventarisasi Gas Rumah Kaca Nasional) or a National GHG Inventory System to BAPPENAS (National Agency for Planning and Development) to be one of Indonesia’s priority climate change programmes. The overall objective of SIGN is to strengthen the capacity of sectors and local governments
Table 2.17 Estimates of uncertainty level for activity data and emissions factors
Note: 1The level of uncertainty for sub-categories of industrial process varied from 5 to 15 while for other sectors were assumed to be the same. AD = activity data; EF/RF = emissions factor/removal factor
Table 2.18 Level of current uncertainty of Indonesian National GHG Inventory for 2000 and 2004 and trend and potential reduced uncertainty with the incorporation of necessary improvement for the first three key source categories
No. Source/Sink CategoriesCurrent Uncertainty Improved
AD EF/RF AD EF/RF1 Energy and transportation 10 5 Same Same
2 Industry1 10 10 Same Same
3 Agriculture 15 30 Same Same
4a Change in forest and other woody biomass 25 50 15 25
4b Forest and grassland conversion 30 75 15 25
4c Abandonment of managed land 25 50 Same Same
4d Soil emissions 50 75 Same Same
4e Peat burning (van der Werf et al. 2008) 25 50 15 25
5 Waste 50 50 Same Same
Sectors YearUncertainty
Current Improved
Without LUCF
2000 16.3 NA
2004 13.9 NA
Trend 16.9 NA
With LUCF
2000 47.0 23.0
2004 38.5 20.0
Trend 32.2 20.3
CHAPTER IINational GHG Inventory
II-30

IndonesIa second natIonal communIcatIon under the unIted natIons Framework conventIon on clImate change (unFccc)
in order to improve the quality of the GHG inventory for the development of a sustainable inventory management system. There are three priority focus areas under SIGN:
1. Improvement of methodologies, activity data and emission factors;
2. Strengthening institutional arrangements, their functions, and operations of archiving, updating and managing of greenhouse gas inventories; and
3. Increasing awareness of local governments on the importance of the National GHG Inven- tory for developing mitigation strategies. Increasing the capacity of designated personnel of the GHG Inventory within each sector for developing and managing the GHG inventory.
2.10 Plans for Improvement
Indonesia plans to improve emissions estimates through the improvement of activity data and emissions/removal factors. Priority will be given to LUCF and the agriculture sector.
For the LUCF sector, priority will be given to the improvement of emissions/removal factors from peat and forestland. The initiatives being undertaken include:
a. Development of emissions factors from peat lands under different uses. Research is being conducted in Central Kalimantan by National Research Consortium for Climate Variability and Climate Change for Agriculture Sector under the coordination of the Ministry of Agriculture. The research is planned to expand to other provinces with support from Global Environment Facility (GEF) using funding allocated for the 3rd National Communi- cation.
b. Development of emissions/removal factors from forestlands and emissions factors from fire (both in mineral soils and peat land), including the improvement of activity data using satellite, aerial photography and radar by the Ministry of Forestry and partner agencies. The program is operating under INCAS (Indonesian National Carbon Accounting System), a collaboration between Government of Indonesia and Government of Australia.
c. Implementation of a pilot study to improve GHG emissions estimates from peat lands in the West Kalimantan and Riau Provinces under the coordination of the State Ministry of Environment.
d. Estimates of CO2 emissions from peat land using best available activity data (AD) from the sectors and emissions factor/removal factor (EF/RF) from recent studies under the coordination of BAPPENAS in collaboration with Centre for Climate Risk and Opportunity Management-Bogor Agriculture University (CCROM-IPB), Directorate General of Planolo- gy – Ministry of Forestry (BAPLAN-MoF), and Center for Agiculture Land Resources and
CHAPTER IINational GHG Inventory
II-31
IndonesIa second natIonal communIcatIon under the unIted natIons Framework conventIon on clImate change (unFccc)
Development – Ministry of Agriculture (BBSLDA-MoA). This study attempts to use recent findings from the studies conducted by the Ministry of Agriculture under the National Research Consortium for Climate Variability and Climate Change and Indonesia’s National Carbon Accounting System (INCAS) project.
For the agriculture sector, the National Research Consortium is undertaking the improvement of emissions and removal factors for climate variability and climate change. The activities include:
a. Development of a correction factor for GHG emission from livestock. According to Suryahadi et al. (2001), feeds influenced the rate of energy converted to methane. Because feed management systems of livestock production in Indonesia varies, the correction of emissions factors must be based on the feed condition, particularly organic matter (OM) and energy consumption level. The emissions factors from the livestock sub-sector can also be corrected by considering animal population structure.
b. Development of a correction factor for methane emissions from various rice cultivars and emissions factor for fertilizer application (N2O emission factors) and emissions from application of different nitrogen resources and organic fertilizer.
c. Improvement of activity data on the fraction of biomass burning, to complete information on the proportion of crop residue burned, for animal consumption and industry. Data used to calculate emissions from biomass burning are only based on the proportion of rice being harvested in Indonesian rice fields. It was assumed that the proportion is 1:1; how- ever, this proportion may only represent irrigated rice and not rain-fed and upland rice.
d. Improvement of activity data on biomass residues from non-rice crops, such as dry land and industrial crops (i.e., corn, peanuts, soybean, palm oil, cacao, sugar cane, etc). Those crops have a high carbon/nitrogen ratio as compared to rice and probably have higher CO2emissionscompared to rice.
e. Development of sequestration capacity of different agriculture system particularly peren- nial crops that increase sharply in last decades.
f. Establishment of national database on carbon balance (GHG emission and sequestration) on agriculture through regular monitoring.
CHAPTER IINational GHG Inventory
II-32

IndonesIa second natIonal communIcatIon under the unIted natIons Framework conventIon on clImate change (unFccc)
CHAPTER III
General Description of Steps Taken or Envisaged to Implement The Convention
3.1 Introduction
Following Indonesia’s ratification of the United Nations Framework Convention on Climate Change (UNFCCC) in 2004 and the Kyoto Protocol in 1997, the Goverment of Indonesia (GOI) stated its strong commitment to support global efforts to combat climate change. As stated in its Article 3.4, the Convention urges member parties of the UNFCCC to incorporate climate change into national development planning. Article 4.1 of UNFCCC also underlines the needs of all countries to develop their specific national development priorities and objectives in accordance to principles of common but differentiated responsibilities. Then, in the 13th Conference of Parties (COP13) in2007, the UNFCCC delivered the Bali Action Plan, addressing long-term cooperative action on climate change and reiterating references to the need for developing countries to integrate adaptation actions into sectoral and national planning, specific projects and programmes. Moreover, the developing countries also need to enhance mitigation actions in the context of the global sustainable development agenda.
In an effort to maintain the spirit of COP13, the GOI made a number of significant efforts to effectively implement the UNFCCC post-conference. These include (i) the development of a number of policy documents outlining the GOI’s efforts in integrating climate change mitigation and adaptation activities into the National Medium-Term Development Plan (Rencana Pembangunan Jangka Menengah Nasional, or RPJMN) and (ii) the preparation and the issuance of regulations that assist sectors and local governments in the implementation of climate change programs.
3.2 Process of Integrating Climate Change into the National Development Plan
The GOI has started several initiatives to integrate mitigation and adaptation climate change principles into national development planning agenda. The climate issue has been mentioned clearly in the Long-Term National Development Planning 2005-2035 (RPJMP 2005-2035). The plan highlights the various disasters caused by extreme climatic events in Indonesia, including the recent floods and droughts that have brought about heavy losses to the national economy. The National Mid-Term Development Plan (RPJMN 2004-2009) has also set the stage for integrating climate change into national development planning. Climate change is described in Chapter 19 on Agriculture, Fishery and Forestry Revitalization, Chapter 28 on Improvement of People’s Access to Quality Health Services, Chapter 32 on Improvement of Natural Resources and Environmental Management, and Chapter 33 on Acceleration of Infrastructure Development. The main focus of the Plan is to integrate climate change into cross-sectoral development
III-1

IndonesIa second natIonal communIcatIon under the unIted natIons Framework conventIon on clImate change (unFccc)
priorities. In the Annual Government Work Plan (Rencana Kerja Pemerintah, RKP) 2008 (RKP 2008), climate change was addressed through the Disaster Risk Reduction Program (which includes meteorological disasters), one of the RKP’s eight priority programs. As a consequence, the budget allocation for the Meteorological Early Warning System (MEWS) program in BMKG (Meteorology, Climatology, and Geophysical Agency) has been augmented to improve the national early warning system for climate variability in Indonesia.
In order to fine-tune the current and the subsequent development plan, particularly in formulating the mid-term national plan (RPJMN 2010-2014) and the annual work plan (RKP 2009 and RKP 2010) to be more responsive and address sectoral and cross sectoral issues sensitive to climate change impacts, BAPPENAS, through collaboration with various government institutions, developed “The National Development Planning: Response to Climate Change” documentas also known as “The Yellow Book.”The Yellow Book shall also serve as reference for the international community to support climate change-related policies, programs and activities prioritized by the GOI. To develop the Yellow Book, BAPPENAS used recent studies related to climate change in Indonesia such as the Technological Needs Assessment, National Communications, Climate Change National Action Plan, etc. Linkages between climate change related documents, development planning and the budgeting process are shown in Figure 3.1.
Figure 3.1 Linkages between climate change-related documents, development planning and the budgeting process
CLIMATECHANGE
Current Initiativesand relevantdocuments:- Technology need Assessments- National Communications- Climate Change National Action Plan- Other climate change studies
Long-TermDev. Plan
2004-2025
Mid-TermDev. Plan
2004-2009 ; 2010-2014
YearlyGov. Budget
GRANT/ LOAN
PROJECTDIGEST
Gov. Work Plan
RKP - 2010
Mid-TermDev. Plan
2010-2014
Annual Gov. Work PlanRKP - 2010
CHAPTER IIIGeneral Description of Steps Taken or Envisaged to Implement The Convention
III-2

IndonesIa second natIonal communIcatIon under the unIted natIons Framework conventIon on clImate change (unFccc)
To provide guidance for synergizing programs and actions on climate change adaptations and mitigations within sub-sectors, each sector under the coordination of BAPPENAS developed a sectoral roadmap. The roadmap provides sectoral policy direction, strategies and programs to address climate change, and sectoral long-term commitment to emissions reductions and adaptation measures as well as ongoing, innovative and future climate mitigation and adaptation programs. Thus, the roadmap provides detailed policy guidance for climate change planning, programming and actions. Figure 3.2 presents the process of developing the climate change sectoral roadmap.
Following commitment of the GOI to actively participate in reducing its emissions through National Appropriate Mitigation Action (NAMA), in 2009, the President of the Republic of Indonesia at the G-20 meeting inPittsburgh and at COP15 in Copenhagen committed to an ambitious, world-leading target of 26% reduction in carbon emissions from Business As Usual (BAU) by 2020. Further emissions reductions of 41% are expected with international support. With this commitment, Indonesia will follow a low carbon development path. As such, BAPPENAS is coordinating the sectors to develop the National Action Plan for Reducing Greenhouse Gas Emissions (RAN-GRK). The GOI lists three principles in the RAN-GRK, stating that the mitigation actions (i) should not hinder economic growth, and should prioritize people’s welfare, especially in with regard to energy resilience and food security, (ii) support protection of poor and vulnerable communities, including environment conservation in the framework of sustainable development and (iii) consist of core activities to reduce emissions and supporting
Figure 3.2 Development of the climate change roadmap
CLIMATE CHANGE ROADMAP
Policy instrument and
regulation Program ProjectFundingscheme
CapacityBuilding
Priority Sectors1. Agriculture2. Coastal, ocean and fishery3. Energy4. Forestry
Secondary Sectors1. Health2. Transportation3. Infrastructure4. Water5. Industry
Cross Cutting Issues1. Research and Technology2. Natioanal security3. Biodiversity4. Poverty
Current Status
Objectives Detailed
Policy guidance for climate
change planning and programming
CHAPTER IIIGeneral Description of Steps Taken or Envisaged to Implement The Convention
III-3
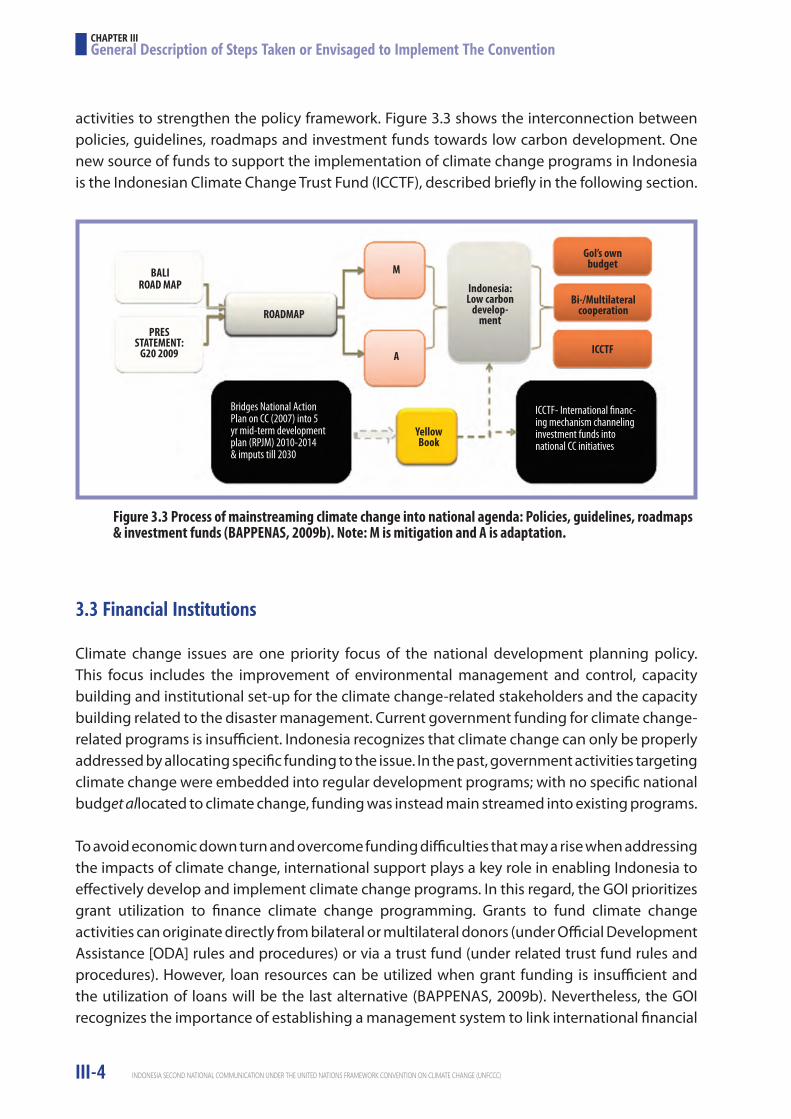
IndonesIa second natIonal communIcatIon under the unIted natIons Framework conventIon on clImate change (unFccc)
activities to strengthen the policy framework. Figure 3.3 shows the interconnection between policies, guidelines, roadmaps and investment funds towards low carbon development. One new source of funds to support the implementation of climate change programs in Indonesia is the Indonesian Climate Change Trust Fund (ICCTF), described briefly in the following section.
3.3 Financial Institutions
Climate change issues are one priority focus of the national development planning policy. This focus includes the improvement of environmental management and control, capacity building and institutional set-up for the climate change-related stakeholders and the capacity building related to the disaster management. Current government funding for climate change-related programs is insufficient. Indonesia recognizes that climate change can only be properly addressed by allocating specific funding to the issue. In the past, government activities targeting climate change were embedded into regular development programs; with no specific national budget allocated to climate change, funding was instead main streamed into existing programs.
To avoid economic down turn and overcome funding difficulties that may a rise when addressing the impacts of climate change, international support plays a key role in enabling Indonesia to effectively develop and implement climate change programs. In this regard, the GOI prioritizes grant utilization to finance climate change programming. Grants to fund climate change activities can originate directly from bilateral or multilateral donors (under Official Development Assistance [ODA] rules and procedures) or via a trust fund (under related trust fund rules and procedures). However, loan resources can be utilized when grant funding is insufficient and the utilization of loans will be the last alternative (BAPPENAS, 2009b). Nevertheless, the GOI recognizes the importance of establishing a management system to link international financial
Figure 3.3 Process of mainstreaming climate change into national agenda: Policies, guidelines, roadmaps & investment funds (BAPPENAS, 2009b). Note: M is mitigation and A is adaptation.
BALI ROAD MAP
PRES STATEMENT:
G20 2009
ROADMAP
M
A
Indonesia:Low carbon
develop-ment
Gol’s ownbudget
Bi-/Multilateral cooperation
ICCTF
YellowBook
Bridges National Action Plan on CC (2007) into 5 yr mid-term development plan (RPJM) 2010-2014& imputs till 2030
ICCTF- International financ-ing mechanism channeling investment funds into national CC initiatives
CHAPTER IIIGeneral Description of Steps Taken or Envisaged to Implement The Convention
III-4
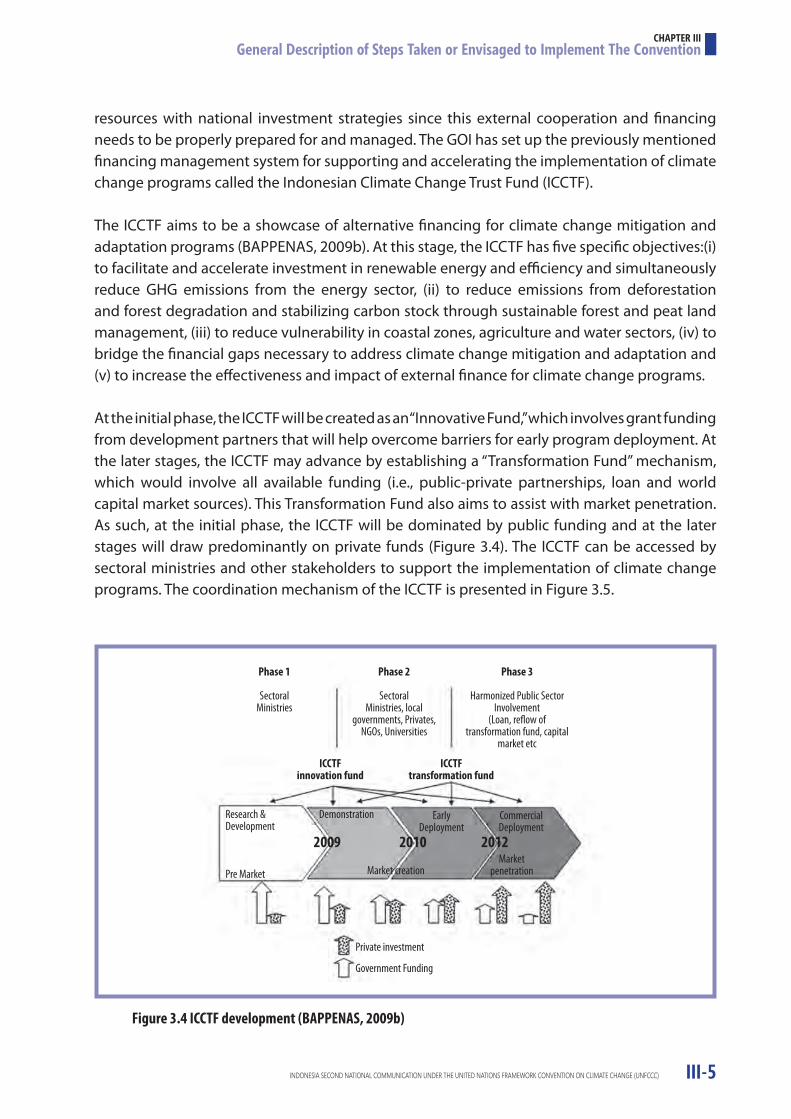
IndonesIa second natIonal communIcatIon under the unIted natIons Framework conventIon on clImate change (unFccc)
resources with national investment strategies since this external cooperation and financing needs to be properly prepared for and managed. The GOI has set up the previously mentioned financing management system for supporting and accelerating the implementation of climate change programs called the Indonesian Climate Change Trust Fund (ICCTF).
The ICCTF aims to be a showcase of alternative financing for climate change mitigation and adaptation programs (BAPPENAS, 2009b). At this stage, the ICCTF has five specific objectives:(i) to facilitate and accelerate investment in renewable energy and efficiency and simultaneously reduce GHG emissions from the energy sector, (ii) to reduce emissions from deforestation and forest degradation and stabilizing carbon stock through sustainable forest and peat land management, (iii) to reduce vulnerability in coastal zones, agriculture and water sectors, (iv) to bridge the financial gaps necessary to address climate change mitigation and adaptation and (v) to increase the effectiveness and impact of external finance for climate change programs.
At the initial phase, the ICCTF will be created as an “Innovative Fund,” which involves grant funding from development partners that will help overcome barriers for early program deployment. At the later stages, the ICCTF may advance by establishing a “Transformation Fund” mechanism, which would involve all available funding (i.e., public-private partnerships, loan and world capital market sources). This Transformation Fund also aims to assist with market penetration. As such, at the initial phase, the ICCTF will be dominated by public funding and at the later stages will draw predominantly on private funds (Figure 3.4). The ICCTF can be accessed by sectoral ministries and other stakeholders to support the implementation of climate change programs. The coordination mechanism of the ICCTF is presented in Figure 3.5.
Figure 3.4 ICCTF development (BAPPENAS, 2009b)
Phase 1
SectoralMinistries
Research &Development
Pre Market
Demonstration
Private investment
Government Funding
Market creationMarket
penetration
Early Deployment
Commercial Deployment
2009 2010 2012
Phase 2
SectoralMinistries, local
governments, Privates, NGOs, Universities
ICCTFinnovation fund
ICCTFtransformation fund
Phase 3
Harmonized Public Sector Involvement
(Loan, reflow of transformation fund, capital
market etc
CHAPTER IIIGeneral Description of Steps Taken or Envisaged to Implement The Convention
III-5

IndonesIa second natIonal communIcatIon under the unIted natIons Framework conventIon on clImate change (unFccc)
Figure 3.5 Coordination mechanism of ICCTF (BAPPENAS, 2009b)
Advisory Committee on Coordination of ICCTF Donors
Recipients
Bilateral
Multilateral
Others(CSR etc)
Sectoral Ministries
NGOs,Universities,
Communities etc
SteeringCommittee
TechnicalCommittee
Secretariat Financial ServiceProviders (Trustee)
Technical ServiceProviders (permanent
and on call expert)
Flow of CoordinationFlow of SupportFlow of Funds
Policy GuidanceReporting
Man
agem
ent T
eam
CHAPTER IIIGeneral Description of Steps Taken or Envisaged to Implement The Convention
III-6

IndonesIa second natIonal communIcatIon under the unIted natIons Framework conventIon on clImate change (unFccc)
CHAPTER IV
Measures to Facilitate Adequate Adaptation to Climate Change
4.1 Introduction
In the past four decades, climate-related hazards such as floods, droughts, storms, landslides and wildfires have caused major loss of human lives and livelihoods, the destruction of economic and social infrastructure, as well as environmental damage. In many parts of the world, the frequencies and intensities of these hazards have increased (Sivakumar, 2005; Asian Disaster Reduction Center [ADRC], 2005). Floods and windstorms accounted for 70% of all disasters during this period; droughts, landslides, forest fires, heat waves and others account for the remaining 30%. Between 2003-2005 alone, there were approximately 1,429 disaster incidences in Indonesia. About 53.3% of the disasters during that time period were hydro-meteorological disasters (BAPPENAS and Bakornas PB, 2006). Floods occurred most often (34% of the time), followed by landslides (16%). It is likely that global warming will lead to greater extremes of drying and heavy rainfall which will, in turn, lead to higher risk of climate hazards (Trenberth and Houghton, 1996; Intergovernmental Panel on Climate Change [IPCC], 2007). A 2006 report from UN Office for Coordination of Humanitarian Affairs (UN-OCHA) indicates that Indonesia is one of the countries vulnerable to climate-related hazards.
In the future, a changing climate brought about by global warming is expected to create new patterns of risk, and higher risks in general. Sea level rise due to melting glaciers and polar ice as well as thermal expansion will contribute to the increased risk of coastal flooding. Increasing intensity of tropical cyclones observed in recent decades may be tied to increasing sea surface temperatures (SSTs). By impacting the hydrologic cycle, global warming is expected to alter climatic ranges, shift regional climatic averages and climate zones, and lead to a higher frequency and amplitude of weather events. Climate variability and change occurring against a backdrop of increasing global population and globalization of economic processes may lead to increased competition over resources and new vulnerabilities (International Research Institute for Climate and Society [IRI] and Asian Disaster Preparedness Centre [ADPC], 2008). With the increased risk of climate-related hazards and disasters, many countries, particularly least developed and developing countries, may have difficulties achieving the UN Millennium Development Goals (MDGs) related to poverty, hunger and human health.
4.2 Historical Climate Change
The rapid increase in the concentration of greenhouse gases (GHGs) in the atmosphere has been determined to be the main factor causing global warming and climate change. IPCC (2007) reported that the global atmospheric concentration of carbon dioxide (CO2) has
IV-1
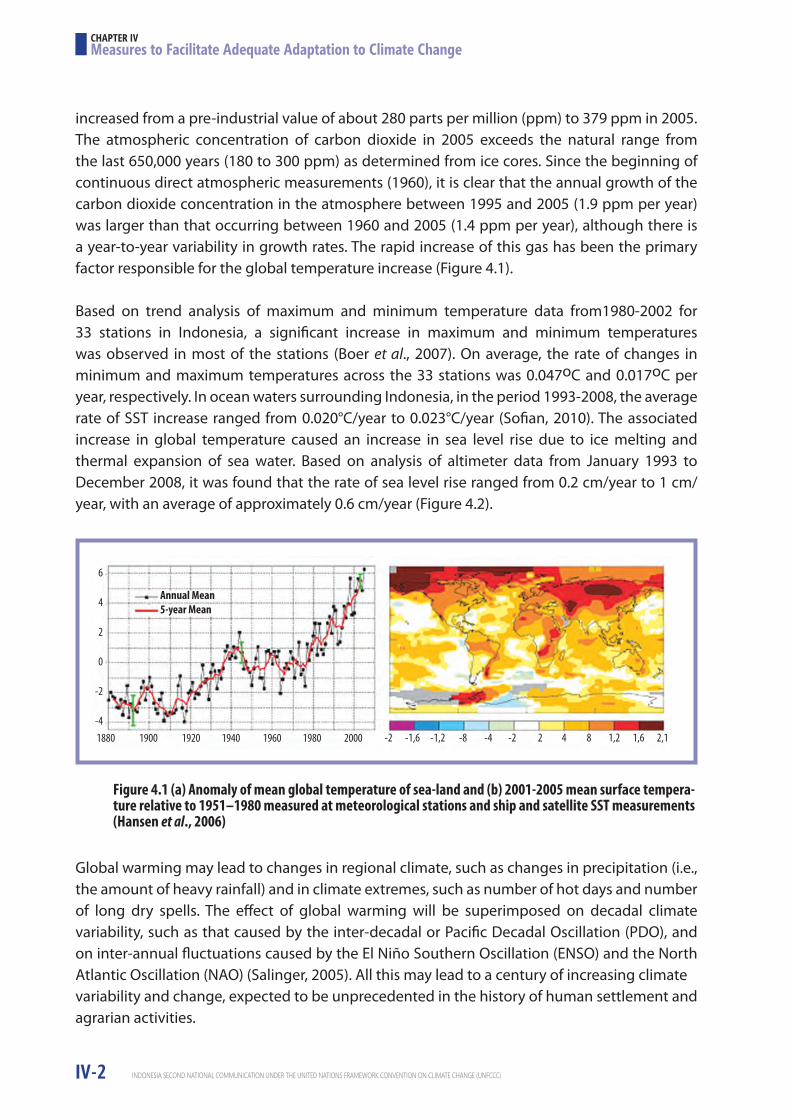
IndonesIa second natIonal communIcatIon under the unIted natIons Framework conventIon on clImate change (unFccc)
increased from a pre-industrial value of about 280 parts per million (ppm) to 379 ppm in 2005. The atmospheric concentration of carbon dioxide in 2005 exceeds the natural range from the last 650,000 years (180 to 300 ppm) as determined from ice cores. Since the beginning of continuous direct atmospheric measurements (1960), it is clear that the annual growth of the carbon dioxide concentration in the atmosphere between 1995 and 2005 (1.9 ppm per year) was larger than that occurring between 1960 and 2005 (1.4 ppm per year), although there is a year-to-year variability in growth rates. The rapid increase of this gas has been the primary factor responsible for the global temperature increase (Figure 4.1).
Based on trend analysis of maximum and minimum temperature data from1980-2002 for 33 stations in Indonesia, a significant increase in maximum and minimum temperatures was observed in most of the stations (Boer et al., 2007). On average, the rate of changes in minimum and maximum temperatures across the 33 stations was 0.047oC and 0.017oC per year, respectively. In ocean waters surrounding Indonesia, in the period 1993-2008, the average rate of SST increase ranged from 0.020°C/year to 0.023°C/year (Sofian, 2010). The associated increase in global temperature caused an increase in sea level rise due to ice melting and thermal expansion of sea water. Based on analysis of altimeter data from January 1993 to December 2008, it was found that the rate of sea level rise ranged from 0.2 cm/year to 1 cm/year, with an average of approximately 0.6 cm/year (Figure 4.2).
Global warming may lead to changes in regional climate, such as changes in precipitation (i.e., the amount of heavy rainfall) and in climate extremes, such as number of hot days and number of long dry spells. The effect of global warming will be superimposed on decadal climate variability, such as that caused by the inter-decadal or Pacific Decadal Oscillation (PDO), and on inter-annual fluctuations caused by the El Niño Southern Oscillation (ENSO) and the North Atlantic Oscillation (NAO) (Salinger, 2005). All this may lead to a century of increasing climate variability and change, expected to be unprecedented in the history of human settlement and agrarian activities.
Figure 4.1 (a) Anomaly of mean global temperature of sea-land and (b) 2001-2005 mean surface tempera-ture relative to 1951–1980 measured at meteorological stations and ship and satellite SST measurements (Hansen et al., 2006)
6
4
2
0
-2
-41880 1900 1920 1940 1960 1980 2000 -2 -1,6 -1,2 -8 -4 -2 2 4 8 1,2 1,6 2,1
Annual Mean5-year Mean
CHAPTER IVMeasures to Facilitate Adequate Adaptation to Climate Change
IV-2
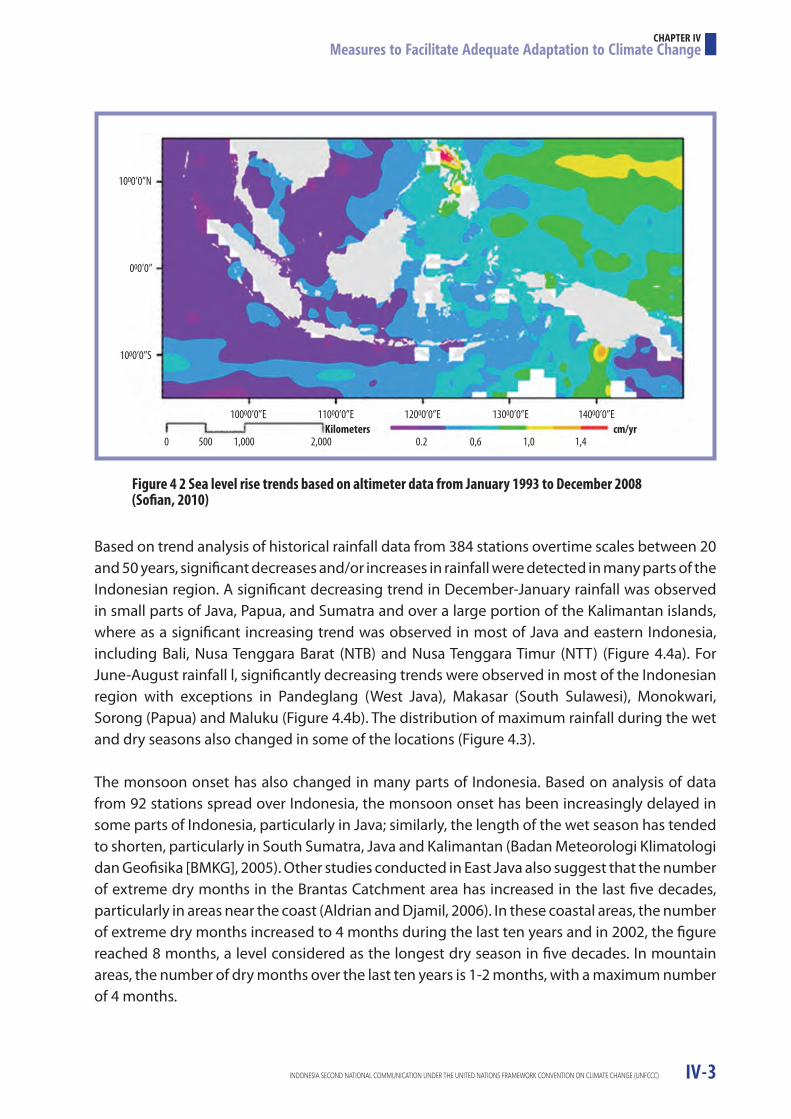
IndonesIa second natIonal communIcatIon under the unIted natIons Framework conventIon on clImate change (unFccc)
Based on trend analysis of historical rainfall data from 384 stations overtime scales between 20 and 50 years, significant decreases and/or increases in rainfall were detected in many parts of the Indonesian region. A significant decreasing trend in December-January rainfall was observed in small parts of Java, Papua, and Sumatra and over a large portion of the Kalimantan islands, where as a significant increasing trend was observed in most of Java and eastern Indonesia, including Bali, Nusa Tenggara Barat (NTB) and Nusa Tenggara Timur (NTT) (Figure 4.4a). For June-August rainfall l, significantly decreasing trends were observed in most of the Indonesian region with exceptions in Pandeglang (West Java), Makasar (South Sulawesi), Monokwari, Sorong (Papua) and Maluku (Figure 4.4b). The distribution of maximum rainfall during the wet and dry seasons also changed in some of the locations (Figure 4.3).
The monsoon onset has also changed in many parts of Indonesia. Based on analysis of data from 92 stations spread over Indonesia, the monsoon onset has been increasingly delayed in some parts of Indonesia, particularly in Java; similarly, the length of the wet season has tended to shorten, particularly in South Sumatra, Java and Kalimantan (Badan Meteorologi Klimatologi dan Geofisika [BMKG], 2005). Other studies conducted in East Java also suggest that the number of extreme dry months in the Brantas Catchment area has increased in the last five decades, particularly in areas near the coast (Aldrian and Djamil, 2006). In these coastal areas, the number of extreme dry months increased to 4 months during the last ten years and in 2002, the figure reached 8 months, a level considered as the longest dry season in five decades. In mountain areas, the number of dry months over the last ten years is 1-2 months, with a maximum number of 4 months.
Figure 4 2 Sea level rise trends based on altimeter data from January 1993 to December 2008 (Sofian, 2010)
1000’0’’N
000’0’’
1000’0’’S
10000’0’’E
0 500 1,000 2,000 0.2 0,6 1,0 1,4Kilometers cm/yr
11000’0’’E 12000’0’’E 13000’0’’E 14000’0’’E
CHAPTER IVMeasures to Facilitate Adequate Adaptation to Climate Change
IV-3

IndonesIa second natIonal communIcatIon under the unIted natIons Framework conventIon on clImate change (unFccc)
4.3 Future Climate Change
Projecting climate into the future has great uncertainty, as the magnitude of change depends on many factors such as GHG concentration in the atmosphere and land use/cover changes. Changes in these factors depend on global socio-economic development and other human behaviors. The IPCC has projected different emissions scenarios and GHG concentrations in order to estimate the changes in the planet’s climate. For Indonesia, two IPCC scenarios, SRESA2 and SRESB1, were selected as they reflect current understanding and knowledge about underlying uncertainties in the emissions. SRESA2 describes a very heterogeneous world. The underlying theme is self-reliance and preservation of local identities. Fertility patterns across regions converge very slowly, which results in a continuously increasing global population. Economic development is primarily regionally oriented and per capita economic growth and technological change are more fragmented and slow. SRESB1 describes a convergent world with the same global population that peaks in mid-century and declines thereafter, rapid change in economic structures toward a service and information economy, with reduction in material intensity and the introduction of clean and resource-efficient technology (IPCC, 2000). With these characteristics, the SRESA2 will lead to higher future GHG emissions while SRESB1 leads to lower future GHG emissions.
The impact of different levels of GHG emissions was assessed based on simulations from 14 General Circulation Models (GCMs). This analysis was used to evaluate the direction of rainfall change (either increasing or decreasing) suggested by the 14 GCMs. The level of confidence to a particular direction of change is considered to increased if most or all of the models are in agreement. From the analysis, a set of maps showing a change in seasonal rainfall under the two emissions scenarios (SRESA2 and SRESB1) are shown in Figures 4.5-4.8. Areas highlighted with dark red (value equal to 1) mean that all 14 GCMs suggest a decrease in future rainfall, while dark blue areas (values equal to 0) indicate that all the GCMs suggest an increase in future rainfall.
Figure 4.5 suggests that under increasing GHG emissions scenarios (i.e., SRESA2), most of the models are in agreement that in 2025 the wet seasonal rainfall (DJF ) in Java, Bali, NTB, NTT and Papua will increase, while in other parts of Indonesia will decrease. By 2050 and 2080, most of the Indonesian region will experience higher rainfall than under the current condition, with exceptions in the northern parts of Sumatra and Kalimantan. Furthermore, dry season rainfall (JJA ) in most parts of Java might decrease by 2025, increase again by 2050, and then decrease by 2080, particularly in West Java and South Sumatra. Under low emission scenarios (i.e., SRESB1), the pattern of change is similar to that of high emission scenarios, but the magnitude of change is slightly lower.
2 DJF = December, January, February 3 JJA = June, July, August
CHAPTER IVMeasures to Facilitate Adequate Adaptation to Climate Change
IV-4

IndonesIa second natIonal communIcatIon under the unIted natIons Framework conventIon on clImate change (unFccc)
Figu
re 4.
3 Sea
sona
l rai
nfal
l tre
nds (
mm
/yea
r) fo
r Ind
ones
ia (B
oer e
t al.,
2009
)
5 2 -1 -4 -7 -10
5 2 -1 -4 -7 -10
22 18 14 10 6 2 -2 -6 -10
-14
-18
-22
-26
-30
22 18 14 10 6 2 -2 -6 -10
-14
-18
-22
-26
-30
22 18 14 10 6 2 -2 -6 -10
-14
-18
-22
-26
-30
22 18 14 10 6 2 -2 -6 -10
-14
-18
-22
-26
-30
95
98
101
104
107
110
113
116
119
122
125
128
131
134
137
140
95
98
101
104
107
110
113
116
119
122
125
128
131
134
137
140
5 2 -1 -4 -7 -10
5 2 -1 -4 -7 -10
D JF
MAM
JJASO
N
CHAPTER IVMeasures to Facilitate Adequate Adaptation to Climate Change
IV-5
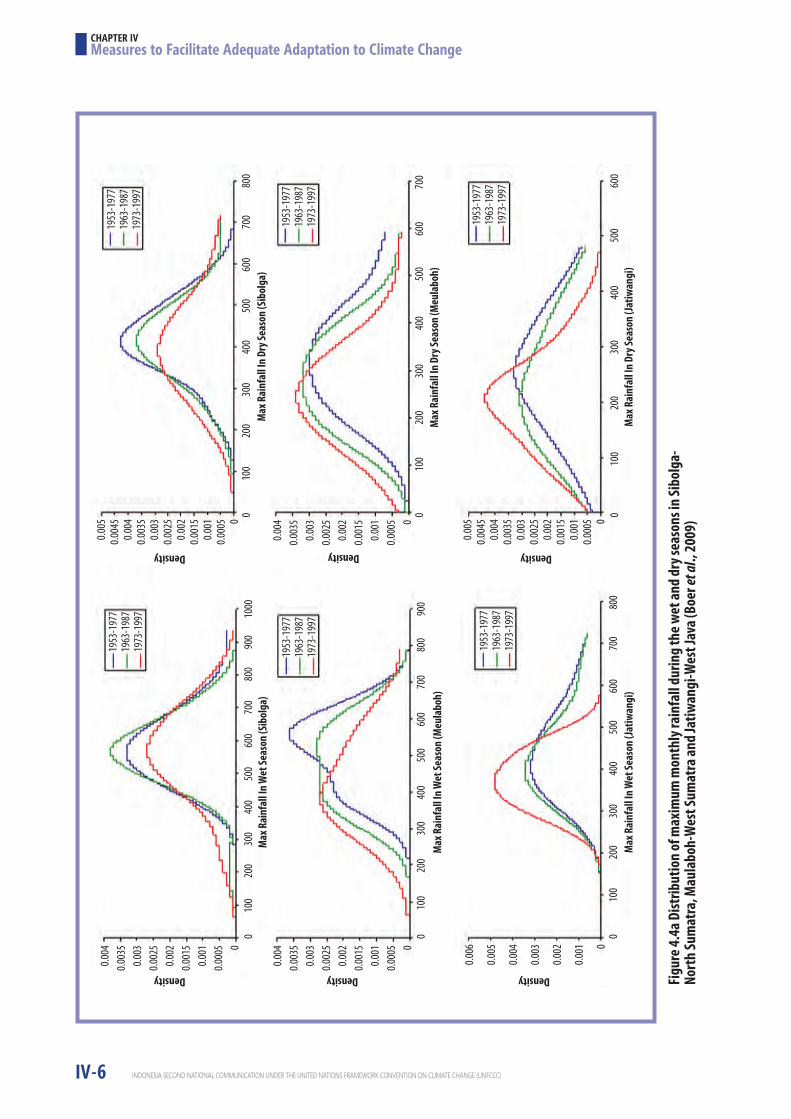
IndonesIa second natIonal communIcatIon under the unIted natIons Framework conventIon on clImate change (unFccc)
Figu
re 4.
4a D
istrib
utio
n of
max
imum
mon
thly
rain
fall
durin
g th
e wet
and
dry s
easo
ns in
Sibo
lga-
Nort
h Su
mat
ra, M
aula
boh-
Wes
t Sum
atra
and
Jatiw
angi
-Wes
t Jav
a (Bo
er et
al.,
2009
)
0.004
0.003
50.0
030.0
025
0.002
0.001
50.0
010.0
005 0
0.004
0.003
50.0
030.0
025
0.002
0.001
50.0
010.0
005 0
0.005
0.004
50.0
040.0
035
0.003
0.002
50.0
020.0
015
0.001
0.000
5 0
0.005
0.004
50.0
040.0
035
0.003
0.002
50.0
020.0
015
0.001
0.000
5 0
0.004
0.003
50.0
030.0
025
0.002
0.001
50.0
010.0
005 0
0.006
0.005
0.004
0.003
0.002
0.001 0
0 10
0 20
0 30
0 40
0 50
0 60
0 70
0 80
0 90
0 10
00
0 10
0 20
0 30
0 40
0 50
0 60
0 70
0 80
0 90
0
0 10
0 20
0 30
0 40
0 50
0 60
0 70
0 80
0
1953
-197
719
63-1
987
1973
-199
7
1953
-197
719
63-1
987
1973
-199
7
1953
-197
719
63-1
987
1973
-199
7
1953
-197
719
63-1
987
1973
-199
7
1953
-197
719
63-1
987
1973
-199
7
1953
-197
719
63-1
987
1973
-199
7
Density
Density DensityDensity
Max
Rai
nfal
l In
Wet
Seas
on (S
ibol
ga)
Max
Rai
nfal
l In
Dry S
easo
n (S
ibol
ga)
Max
Rai
nfal
l In
Wet
Seas
on (M
eula
boh)
Max
Rai
nfal
l In
Dry S
easo
n (M
eula
boh)
Max
Rai
nfal
l In
Wet
Seas
on (J
atiw
angi
)M
ax R
ainf
all I
n Dr
y Sea
son
(Jatiw
angi
)
Density Density
0 10
0 20
0 30
0 40
0 50
0 60
0 70
0 80
0
0 10
0 20
0 30
0 40
0 50
0 60
0 70
0
0 10
0 20
0 30
0 40
0 50
0 60
0
CHAPTER IVMeasures to Facilitate Adequate Adaptation to Climate Change
IV-6

IndonesIa second natIonal communIcatIon under the unIted natIons Framework conventIon on clImate change (unFccc)
Figu
re 4.
4b D
istrib
utio
n of
max
imum
mon
thly
rain
fall
(mm
) dur
ing
the w
et an
d dr
y sea
-so
ns in
Mua
raTe
we-C
entr
al K
alim
anta
n an
d So
rong
-Pap
ua (B
oer e
t al.,
2009
)
0.004
0.003
50.0
030.0
025
0.002
0.001
50.0
010.0
005 0
0.006
0.005
0.004
0.003
0.002
0.001 0
0.003
5
0.003
0.002
5
0.002
0.001
5
0.001
0.000
5 0
0.003
5
0.003
0.002
5
0.002
0.001
5
0.001
0.000
5 0
Density Density
Density Density
0 20
0 40
0 60
0 80
0 10
00
1200
M
ax R
ainf
all I
n W
et Se
ason
(Mua
rate
we)
Max
Rai
nfal
l In
Wet
Seas
on (S
oron
g)
Max
Rai
nfal
l In
Dry S
easo
n (M
uara
tewe
)
Max
Rai
nfal
l In
Dry S
easo
n (S
oron
g)
1953
-197
719
63-1
987
1973
-199
7
1953
-197
719
63-1
987
1973
-199
7
1953
-197
719
63-1
987
1973
-199
7
1953
-197
719
63-1
987
1973
-199
7
0 10
0 20
0 30
0 40
0 50
0 60
0 70
0 80
0 90
0
0 10
0 20
0 30
0 40
0 50
0 60
0 70
0 80
0 90
0 0
100
200
300
400
500
600
700
800
900
1000
CHAPTER IVMeasures to Facilitate Adequate Adaptation to Climate Change
IV-7
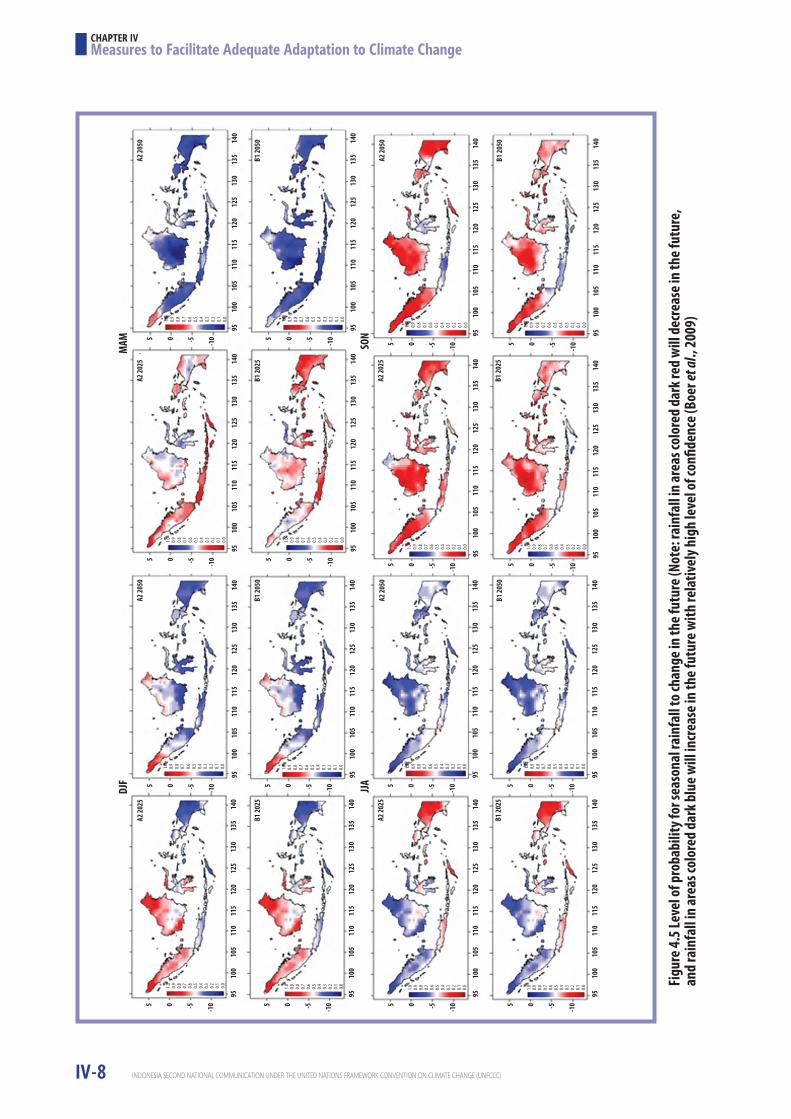
IndonesIa second natIonal communIcatIon under the unIted natIons Framework conventIon on clImate change (unFccc)
Figu
re 4.
5 Lev
el of
pro
babi
lity f
or se
ason
al ra
infa
ll to
chan
ge in
the f
utur
e (No
te: r
ainf
all i
n ar
eas c
olor
ed d
ark r
ed w
ill d
ecre
ase i
n th
e fut
ure,
an
d ra
infa
ll in
area
s col
ored
dar
k blu
e will
incr
ease
in th
e fut
ure w
ith re
lativ
ely h
igh
leve
l of c
onfid
ence
(Boe
r et a
l., 20
09)
DJF
A2 20
255 0 -5 -10 5 0 -5 -10 5 0 -5 -10 5 0 -5 -10
5 0 -5 -105 0 -5 -105 0 -5 -105 0 -5 -10
5 0 -5 -10
5 0 -5 -10 5 0 -5 -10
5 0 -5 -10 5 0 -5 -10
5 0 -5 -10
5 0 -5 -10 5 0 -5 -10
95
100
105
110
115
120
125
130
135
140
95
100
105
110
115
120
125
130
135
140
95
100
105
110
115
120
125
130
135
140
95
100
105
110
115
120
125
130
135
140
95
100
105
110
115
120
125
130
135
140
95
100
105
110
115
120
125
130
135
140
95
100
105
110
115
120
125
130
135
140
95
100
105
110
115
120
125
130
135
140
95
100
105
110
115
120
125
130
135
140
95
100
105
110
115
120
125
130
135
140
95
100
105
110
115
120
125
130
135
140
95
100
105
110
115
120
125
130
135
140
95
100
105
110
115
120
125
130
135
140
95
100
105
110
115
120
125
130
135
140
95
100
105
110
115
120
125
130
135
140
95
100
105
110
115
120
125
130
135
140
A2 20
25
A2 20
25A2
2025
B1 20
25B1
2025
B1 20
25B1
2025
A2 20
50A2
2050
A2 20
50A2
2050
B1 20
50B1
2050
B1 20
50B1
2050
MAM
JJASO
N
1.0 0.9 0.8 0.7 0.6 0.5 0.4 0.3 0.2 0.1 0.0 1.0 0.9 0.8 0.7 0.6 0.5 0.4 0.3 0.2 0.1 0.0 1.0 0.9 0.8 0.7 0.6 0.5 0.4 0.3 0.2 0.1 0.0 1.0 0.9 0.8 0.7 0.6 0.5 0.4 0.3 0.2 0.1 0.0
1.0 0.9 0.8 0.7 0.6 0.5 0.4 0.3 0.2 0.1 0.0 1.0 0.9 0.8 0.7 0.6 0.5 0.4 0.3 0.2 0.1 0.0 1.0 0.9 0.8 0.7 0.6 0.5 0.4 0.3 0.2 0.1 0.0 1.0 0.9 0.8 0.7 0.6 0.5 0.4 0.3 0.2 0.1 0.0
1.0 0.9 0.8 0.7 0.6 0.5 0.4 0.3 0.2 0.1 0.0 1.0 0.9 0.8 0.7 0.6 0.5 0.4 0.3 0.2 0.1 0.0
1.0 0.9 0.8 0.7 0.6 0.5 0.4 0.3 0.2 0.1 0.0 1.0 0.9 0.8 0.7 0.6 0.5 0.4 0.3 0.2 0.1 0.0
1.0 0.9 0.8 0.7 0.6 0.5 0.4 0.3 0.2 0.1 0.0 1.0 0.9 0.8 0.7 0.6 0.5 0.4 0.3 0.2 0.1 0.0
1.0 0.9 0.8 0.7 0.6 0.5 0.4 0.3 0.2 0.1 0.0 1.0 0.9 0.8 0.7 0.6 0.5 0.4 0.3 0.2 0.1 0.0
CHAPTER IVMeasures to Facilitate Adequate Adaptation to Climate Change
IV-8

IndonesIa second natIonal communIcatIon under the unIted natIons Framework conventIon on clImate change (unFccc)
The impact of global warming on the monsoon onset in Java and Bali using more GCMs and empirical downscaling models was conducted by Naylor et al. (2007). It was found that under the SRESA2 scenario, total AMJ rainfall in Java and Bali is expected to increase relative to the current pattern by approximately 10% on average, but to decrease in JAS by about 10-25%. The decline in JAS rainfall could be up to 50% in West/Central Java and 75% in East Java/Bali at the tail end of the distributions. In East Java/Bali, some models projected that total rainfall would drop close to zero during JAS (Figure 4.6). Under SRESB1, the projection of changes is similar to those of SRESA2 until 2050. The shifted balances between the AMJ and JAS rainfall seasons will lead to the shifted onset of the wet and dry seasons. The onset of the rainy season in Java and Bali will be delayed under a changing climate (Figure 4.6). However, the uncertainty is quite high, as illustrated by the wide range of results among GCMs for a given empirical downscaling model (EDM) (Figure 4.6). Nevertheless, it is clear that a 30-day delay in monsoon onset is very likely to occur more frequently in 2050 than it does today.
Many studies indicate that extreme climate events are often associated with the El Niño Southern Oscillation (ENSO). ENSO is one of the natural phenomena that has resulted in devastating consequences on rainfall and caused disasters in Indonesia. El Niño is often related to drought and La Niña to floods. Based on 43 drought events that occurred between 1844-1998, only six drought events were not associated with El Niño (Boer and Subbiah, 2005; Asian Development Bank [ADB] and BAPPENAS, 1999; Quinn et al., 1978). Moreover, ENSO is considered as one of the overriding control factors in major forest/land fires and haze occurrence and frequency.
Figure 4.6 (a) Summed precipitation for AMJ and JAS for the present climate (dashed line) and for the future predicted climate, using the A2 scenario, and (b) Likelihood of exceeding the 30-day monsoon threshold in 2050. The thick rectangle shows the middle tercile, and the horizontal lines on either side show the lower and upper terciles. The arrows indicate the mean future probability for all GCMs. The verti-cal lines show the observed probability for 1983–2004 (Naylor et al., 2007). Note: The analysis was done using 15 different GCMs and 3EDMs
4 AMJ = April, May, June 5 JAS = July, August, September
West/Central Java15
10
5
0
15
10
5
050 55 60 65
0 5 10 1510 20 30
30 35 40 5 10 15 20 25 30
5 10 15 20 25 30 35 40 5 10 15 20 25 30 35 40
5 10 15 20 25 3015
10
5
0
15
10
5
0
Seasonal Rainfall (cm) Seasonal Rainfall (cm)
JAS
West Java/Central Java-A2 Scenario
East Java/Bali-A2 Scenario East Java/Bali-B1 Scenario
West Java/Central Java-B1 ScenarioEast Java/Bali
EDM1 EDM1
EDM1 EDM1
EDM2 EDM2
EDM2 EDM2
EDM3 EDM3
EDM3 EDM3
AMJ
CHAPTER IVMeasures to Facilitate Adequate Adaptation to Climate Change
IV-9

IndonesIa second natIonal communIcatIon under the unIted natIons Framework conventIon on clImate change (unFccc)
Climate-related hazards in Indonesia are also caused by the location and movement of the tropical cyclones in the south eastern Indian Ocean (from January to April) and the eastern Pacific Ocean (from May to December). Essential for cyclone genesis are SSTs above 26.5oC, latitude beyond 5 degrees and small vertical wind shear. Since tropical cyclones have sustained surface winds of 32ms-1 or more, their impacts to the Indonesian region are commonly local strong winds and heavy rainfall on the order of hours to days. Strong winds also often occur during the transition from the northeast to southwest monsoon and vice versa. Many studies have also suggested that increasing SSTs will strengthen the tropical cyclones (Emanuel, 2005).
4.4 Climate Change Impacts and Adaptation Assessment
4.4.1 AgricultureHistorical data has indicated that the change in the onset of the wet season and in its length will influence rice production levels and cropping patterns in Indonesia. Rice is the major staple food in Indonesia. The delay of the wet season onset due to El Niño phenomena causes decreasing cumulative cropping area during wet season (MH). Naylor et al. (2007) found that a one month delay in wet season onset due to El Niño phenomena would decrease wet season rice production by approximately 65% for West Java and Central Java and 11% for East Java and Bali. This decreasing cropping area during the wet season will usually be compensated by increasing the cropping area during the dry season (MK) which generally has a high risk of experiencing drought (Figure 4.7), except when El Niño phenomena turns into La Niña conditions (Figure 4.8). Significant decreases in rainfall during the dry seasons in El Niño years also affects the production of other national food crops. However, the effect is not as significant compared to the effects on rice crops.
Figure 4.7 Change in cumulative cropping area in the wet season (MH) and dry season (MK) during ENSO years (El Niño and La Niña) compared to normal years (Boer, 2009)
West Java
El Nino El NinoLa Nina La Nina
MH(Wet Season) MH(Wet Season)
MK(Dry Season) MK(Dry Season)
Central Java
160
120
80
40
0
-40
-80
120
80
40
0
-40
-80
-120
Chan
ge in
Crop
ping
Are
a Com
pare
To
Nor
mal
Year
(000
)ha)
Chan
ge in
Crop
ping
Are
a Com
pare
To
Nor
mal
Year
(000
)ha)
CHAPTER IVMeasures to Facilitate Adequate Adaptation to Climate Change
IV-10

IndonesIa second natIonal communIcatIon under the unIted natIons Framework conventIon on clImate change (unFccc)
Long dry seasons during El Niño years significantly affect not only annual crops, but also perennial crops. Based on field observations, a long dry season generally destroys young plants. During the 1994 El Niño for example, the percentage of young plants (age of less than 2 years) die back due to the long dry season could go up to 30%. Based on observations in a number of locations, the average young plant dieback for tea crops was approximately 22%, between 4% and 9% for rubber, about 4% for cacao, between 1.5% and 11% for cashew nuts, about 4% for coffee and between 5% and 30%for coconut. For mature plantation crops such as coconut and palm oil, the impact of severe drought appears after 4-9 months (Hasan et al., 1998).
Figure 4.8 Mean area of dry season rice affected by drought from 1989-2006 (above), during El Niño years (middle) and La Niña years (bottom). Source: Boer (2009)
95 100 105 110 115 120 125 130 135 140
95 100 105 110 115 120 125 130 135 140
95 100 105 110 115 120 125 130 135 140
95 100 105 110 115 120 125 130 135 140
5
0
-5
-10
5
0
-5
-10
5
0
-5
-10
5
0
-5
-10
5
0
-5
-10
5
0
-5
-10
Kekeringan
Legend (Ha)
Legend (Ha)
Legend (Ha)
<5050 - 7575 - 150150 - 250250 - 500500 - 10001000 - 2000>2000
<5050 - 7575 - 150150 - 250250 - 500500 - 10001000 - 2000>2000
<5050 - 7575 - 150150 - 250250 - 500500 - 10001000 - 2000>2000
CHAPTER IVMeasures to Facilitate Adequate Adaptation to Climate Change
IV-11
IndonesIa second natIonal communIcatIon under the unIted natIons Framework conventIon on clImate change (unFccc)
The dynamic interactions of crop pests and diseases on crops also appear to be related with ENSO. Rice growing area destroyed by brown plant hopper (‘wereng coklat’) tended to increase significantly during LaNiña years. For example, in West Java, the total area destroyed by this pest during 1998 LaNiña could increase up to 80 times the size of the area lost during normal years. In addition, there is an indication that types of major crop pests and diseases have shifted recently. Historically, pink rice stem borer (Sesamia inferens), for example, was only a minor problem in Java (e.g.,Indramayu, Magelang, Semarang, Boyolali, Kulonprogo, and Ciamis) compared to yellow rice stem borer (Scirpophaga incertulas) and white rice stem borer (Scirpophaga innnotata). Today, this disease has become dominant (Nastari Bogor and Klinik Tanaman Institut Pertanian Bogor [IPB], 2007). According to Kalshoven (1981), regions with distinct dry seasons are favorable for pink rice stem borer. Bacterial leaf blight (Xanthomonas oryzae pv. Oryza) in the last three years has also become one of the dominant rice crop diseases when historically, this disease was not important. Saddler (2000) stated that the optimal temperature for growth of this disease is around 300C.
Similar phenomena has also been observed in non-rice crops. Prior to 1997, twisting disease caused by Fusarium oxysporumwas not an important disease for red onion crops, but now this is a very important disease not only in lowland areas, but also in the highlands. In the last two years, this disease has seriously attacked red onion crops in a number of onion production centers such as Brebes (Wiyono, 2007). From laboratory research, when being exposed to high temperatures, this crop becomes less resistant to this disease (Tondok, 2003). The phenomenal example is the appearance of Gemini disease in chili in the last five years in all main chili and potato production centre of Java (Bogor, Cianjur, Brebes, Wonosobo, Magelang, Klaten, Boyolali, Kulonprogo, Blitar, and Tulungagung; Nastari Bogor dan Klinik Tanaman IPB, 2007). This disease caused by virus which is transmitted to the crops by kutu kebul (Bemisia tabaci). It is not clear whether these phenomena are related to global warming. However, many researchers found that the main triggering factor for the crop disease to proliferate is temperature increase. For example, a significant increase in Bemisiatabaci populations on tomato occurred when the temperature increased from 17 to 30°C (Bonaro et al., 2007). The explosion of this virus under elevated temperature has been predicted by Boland et al., (2004) in Canada.
Changes in rainfall and increases in temperature will both directly and indirectly affect dairy cattle production and reproduction performance. The direct impacts are the effects on production and their reproduction systems, while the indirect impacts aredue to impacts on the quality and quantity of grass or forage needed for livestock feed. Feed shortages limit the dry matter and nutrient intake of the animal resulting in low productivity, reduced reproductive performance, increased mortality rates, increased culling rates and changes in the population of the animal in some regions. High temperatures may have negative impactson dry matter intake, milk yield, growth rate, resistancy of the animal to diseases and reproductive performance of dairy cattle. A decrease in dry matter intake in dairy cattle during highambient temperatures is main factor reducing productivity of dry cattle.
CHAPTER IVMeasures to Facilitate Adequate Adaptation to Climate Change
IV-12

IndonesIa second natIonal communIcatIon under the unIted natIons Framework conventIon on clImate change (unFccc)
Based on a study conducted in Java, rainfall and temperature (defined in the form of a “comfort index”) affect length of the pregnancy period (PP) and interval of birth of sheep (Rohman and Boer, 2001). Sheep raised in regions with lower annual rainfall and higher temperatures tended to have a longer pregnancy period. The interval between two births (BI) was also found to be longer (Figure 4.9). The comfort indices for PP and BI are expressed by the following equations:
CIPP = -0.00044 R + 0.54889 Tand CIBI = -0.00145 R + 1.08133 T, where R and T are annual rainfall and mean annual temperature, respectively.
The increase in temperatures due to elevated CO2 levels also affects crop yields. Based on a simulation study conducted in Java (Boer et al., 2009), it was found that the negative effect of increasing temperatures on rice yield will reduce if increases in CO2 concentration considered. The increase of CO2 from 370 to480 ppm (SRESB1) or 520 ppm (SRESA2) can eliminate the negative effects of increased temperatures. In some districts, rice production in 2025 and 2050 would actually be higher from the current production rate. However, in general, total rice production in Java will experience a decrease from increasing temperatures with or without considering the positive effects of CO2. When the effect of CO2 was not considered without any technology intervention, the decrease in rice production in Java by2025 and 2050 could reach 1.8 and 3.6 million tons, respectively; when the effect of CO2 was considered, the decrease in rice production is 33,964 tons and 59,584 tons in 2025 and 2050, respectively, for SRESA2 and 39,3048 tons and 88,8230 tons in 2025 and 2050, respectively, for SRESB1 (Table 4.1)
Figure 4.9 The relationship between comfort index and length of pregnancy period (left) and comfort index and interval between two births (right).Source: Rohman and Boer, 2001
8
7
6
5
4
20
15
10
5
0
8 10 12 14 16 15 20 25 30
y = 0.035x2 - 0.567x + 7.48R2 = 0.9654
y = 0.079x2 - 2.761x + 32.4R2 = 0.8441
PP (m
onth
)
BI (m
onth
)
Comfort Index Comfort Index
CHAPTER IVMeasures to Facilitate Adequate Adaptation to Climate Change
IV-13

IndonesIa second natIonal communIcatIon under the unIted natIons Framework conventIon on clImate change (unFccc)
The decrease in crop production is due not only to climatic factors, but also non-climatic factors. By taking into account the impact of non-climatic factors in the analysis, it will provide better understanding of future crop production under changing climate. Boer et al. (2009) introduced three non-climatic factors in assessing impact of climate change in Java – paddy field conversion to non-agriculture land area, cropping index, and technology intervention. Based on these factors, the following six scenarios were evaluated:
1. Scenario 1: In the future, there is no rice field conversion in Java, and no change in crop- ping index. Therefore, in this case, the change in the rice production is only affected by climate change and changes in CO2 concentration. 2. Scenario 2: The rate of rice field conversion was assumed 0.77% per year, while cropping index is constant or unchanged.3. Scenario 3: No rice field conversion occurs in the future, however, the cropping index is increased from the current condition. In this study, the cropping index (CI) of rice in West Java increased to 2.30 and 2.10 in Central Java and East Java by 2025. By2050, the IP incre- ases significantly to 2.50 in West Java, 2.30 in Central Java and 2.20 in East Java. The current cropping index (CI0) was estimated using the data of harvested area during the wet sea- son (LPMH) and dry season (LPMK) because the standard data of cultivated area and rice field area was not available. The equation for estimating IP is as follows:
4. Scenario 4: The rate of rice field conversion is equal to Scenario 2 and the cropping index increases to that of Scenario 3.5. Scenario 5: Like scenario 3,but crop productivity is assumed to increase in intervals of 5%, 10%, 15%, 20%, 25% and 30% with the invention and implementation of agronomy technology.6. Scenario 6: Like scenario 4, but crop productivity is assumed to increase in intervals of 5%, 10%, 15%, 20%, 25% and 30% as existence of intervention of agronomy technology.
Table 4.1 Decrease in rice production in Java compared to current production as increasing temperature and CO2 concentration in Scenario1 (Boer et al., 2009)
Note: The calculations were based on existing planting area (see Table 4.2) and cropping index (see Table 4.3). Values are expressed in tons.
ProvinceIncreasing CO2 not
consideredIncreasing CO2 considered
SRESA 2 SRESB1
2025 2050 2025 2050 2025 2050
West Java -620,389 -1,207,728 -22,311 -33,034 -142,034 -309,315
Central Java -609,644 -1,180,292 -27,132 -36,170 -143,739 -305,261
East Java -597,734 -1,194,802 15,479 9,620 -107,274 -273,653
Total -1,827,767 -3,582,822 -33,964 -59,584 -393,048 -888,230
CHAPTER IVMeasures to Facilitate Adequate Adaptation to Climate Change
IV-14
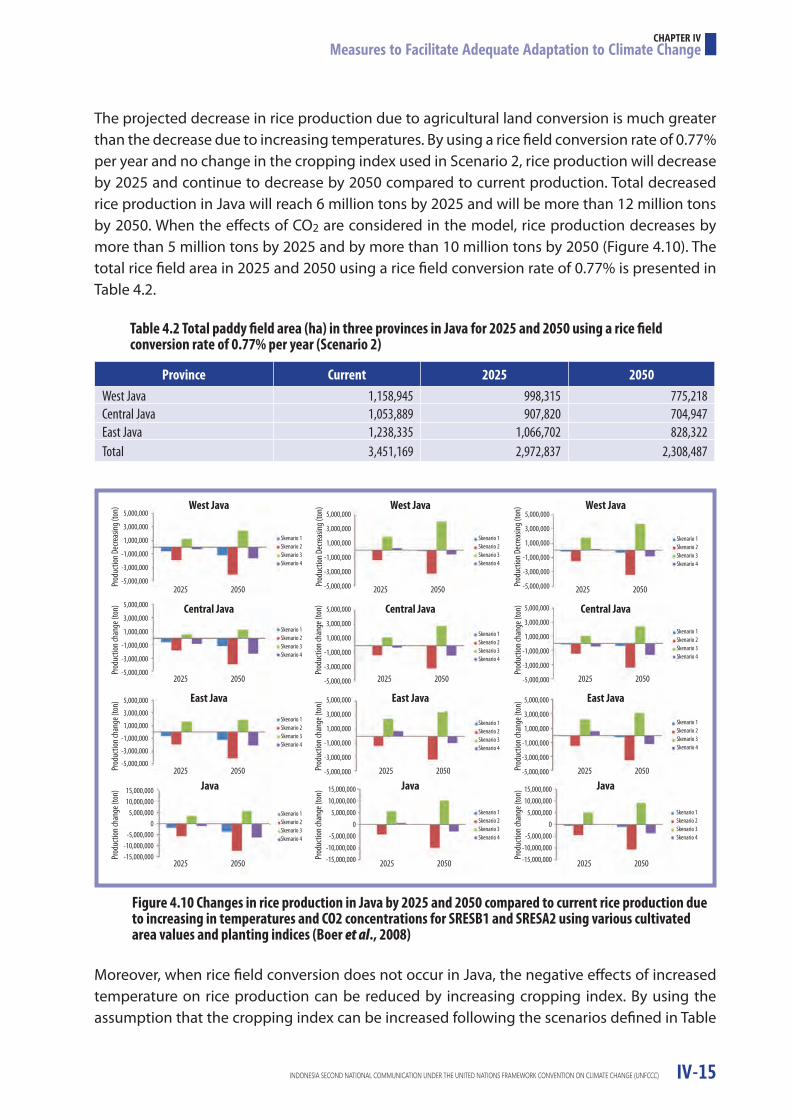
IndonesIa second natIonal communIcatIon under the unIted natIons Framework conventIon on clImate change (unFccc)
The projected decrease in rice production due to agricultural land conversion is much greater than the decrease due to increasing temperatures. By using a rice field conversion rate of 0.77% per year and no change in the cropping index used in Scenario 2, rice production will decrease by 2025 and continue to decrease by 2050 compared to current production. Total decreased rice production in Java will reach 6 million tons by 2025 and will be more than 12 million tons by 2050. When the effects of CO2 are considered in the model, rice production decreases by more than 5 million tons by 2025 and by more than 10 million tons by 2050 (Figure 4.10). The total rice field area in 2025 and 2050 using a rice field conversion rate of 0.77% is presented in Table 4.2.
Moreover, when rice field conversion does not occur in Java, the negative effects of increased temperature on rice production can be reduced by increasing cropping index. By using the assumption that the cropping index can be increased following the scenarios defined in Table
Table 4.2 Total paddy field area (ha) in three provinces in Java for 2025 and 2050 using a rice field conversion rate of 0.77% per year (Scenario 2)
Figure 4.10 Changes in rice production in Java by 2025 and 2050 compared to current rice production due to increasing in temperatures and CO2 concentrations for SRESB1 and SRESA2 using various cultivated area values and planting indices (Boer et al., 2008)
Province Current 2025 2050West Java 1,158,945 998,315 775,218Central Java 1,053,889 907,820 704,947East Java 1,238,335 1,066,702 828,322Total 3,451,169 2,972,837 2,308,487
West Java
2025 2025 2025
2025 2025 2025
2025 2025 2025
2025 2025 2025
2050 2050 2050
2050
Skenario 1Skenario 2Skenario 3Skenario 4
Skenario 1Skenario 2Skenario 3Skenario 4
Skenario 1Skenario 2Skenario 3Skenario 4
Skenario 1Skenario 2Skenario 3Skenario 4
Skenario 1Skenario 2Skenario 3Skenario 4
Skenario 1Skenario 2Skenario 3Skenario 4
Skenario 1Skenario 2Skenario 3Skenario 4
Skenario 1Skenario 2Skenario 3Skenario 4
Skenario 1Skenario 2Skenario 3Skenario 4
Skenario 1Skenario 2Skenario 3Skenario 4
Skenario 1Skenario 2Skenario 3Skenario 4
Skenario 1Skenario 2Skenario 3Skenario 4
2050 2050
2050 2050 2050
2050 2050 2050
East Java
Java
Central Java
West Java
East Java
Java
Central Java
West Java
East Java
Java
Central Java
Prod
uctio
n Dec
reas
ing (t
on)
Prod
uctio
n cha
nge (
ton)
Prod
uctio
n cha
nge (
ton)
Prod
uctio
n cha
nge (
ton)
Prod
uctio
n cha
nge (
ton)
Prod
uctio
n cha
nge (
ton)
Prod
uctio
n cha
nge (
ton)
Prod
uctio
n cha
nge (
ton)
Prod
uctio
n cha
nge (
ton)
Prod
uctio
n cha
nge (
ton)
Prod
uctio
n Dec
reas
ing (t
on)
Prod
uctio
n Dec
reas
ing (t
on)
5,000,000
3,000,000
1,000,000
-1,000,000
-3,000,000
-5,000,000
5,000,000
3,000,000
1,000,000
-1,000,000
-3,000,000
-5,000,000
5,000,000
3,000,000
1,000,000
-1,000,000
-3,000,000
-5,000,000
5,000,000
3,000,000
1,000,000
-1,000,000
-3,000,000
-5,000,000
5,000,000
3,000,000
1,000,000
-1,000,000
-3,000,000
-5,000,000
5,000,000
3,000,000
1,000,000
-1,000,000
-3,000,000
-5,000,000
5,000,000
3,000,000
1,000,000
-1,000,000
-3,000,000
-5,000,000
5,000,000
3,000,000
1,000,000
-1,000,000
-3,000,000
-5,000,000
5,000,000
3,000,000
1,000,000
-1,000,000
-3,000,000
-5,000,000
15,000,00010,000,000
5,000,0000
-5,000,000-10,000,000-15,000,000
15,000,00010,000,000
5,000,0000
-5,000,000-10,000,000-15,000,000
15,000,00010,000,000
5,000,0000
-5,000,000-10,000,000-15,000,000
CHAPTER IVMeasures to Facilitate Adequate Adaptation to Climate Change
IV-15

IndonesIa second natIonal communIcatIon under the unIted natIons Framework conventIon on clImate change (unFccc)
4.3, the rice production rate in most districts in Java by 2025 and 2050 are remain stable or even increase compared to the current production rate, with exceptions in the Tulungagung, Kediri, Purworedjo, Wonosobo, Magelang, Sleman, Klaten and Sukohardjo districts. However, when the effects of CO2 are considered in the simulation model, the negative effects of increasing temperature on the decrease in rice production in these districts is not projected to occur in 2050.
As shown in Figure 4.10, the decrease in rice production of Java by 2025 and 2050 is mainly due to land conversion and by climate change. Efforts to increase CI to maximum levels cannot maintain the current production in 2025 and 2050. This study suggests that loss of rice production due to increasing temperatures and land conversion in Java in 2025 and 2050 cannot be compensated by increasing CI only. On the other hand, the effort to increase CI following the scenario presented in Table 4.3 is hardly possible when the source of irrigated water is not from reservoirs.
The water source for irrigated rice is mostly not from reservoir. If CI for irrigated rice in which the water source comes from reservoir must be increased to 2.75 and not from reservoir also must be raised to 2.0 in West Java, and 1.8 in both Central Java and East Java require the development of new reservoir . Otherwise, CI can only increase to 2.2 for West Java, 2.0 for Central Java and optimal (e.g., 1.8) for East Java. If the scenario in Table 4.4 is reached, the number of reservoirs in Java should increase, so that the percentage of irrigated rice from reservoirs becomes 65% in West Java, 50% in Central Java and 40% in East Java (Figure 4.11).
Table 4.3 Cropping index scenario for rice in three provinces in Java for 2025 and 2050 (Boer et al., 2008)
Figure 4.11 Percentage of irrigated rice fields from reservoir by increasing CI to 2.5 for West Java, 2.3 for Central Java and 2.2 for East Java (Boer et al., 2008)
Province Current 2025 2050West Java 1.70 2.10 2.50Central Java 1.79 2.00 2.30East Java 1.62 2.00 2.20
West Java
80
70
60
50
40
30
20
10
0Central Java East Java
Current
2050
Perc
enta
ge ir
rigat
ed ri
ce fi
eld
with
dam
’s wat
er re
sour
ces
CHAPTER IVMeasures to Facilitate Adequate Adaptation to Climate Change
IV-16
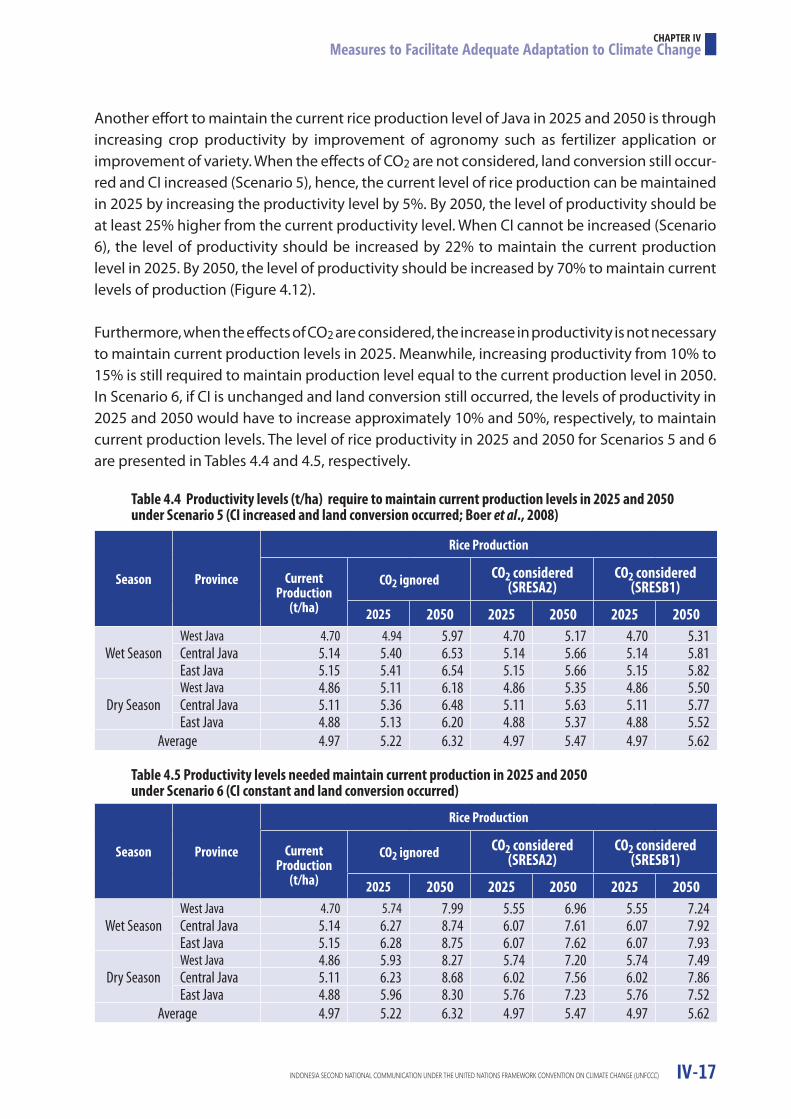
IndonesIa second natIonal communIcatIon under the unIted natIons Framework conventIon on clImate change (unFccc)
Another effort to maintain the current rice production level of Java in 2025 and 2050 is through increasing crop productivity by improvement of agronomy such as fertilizer application or improvement of variety. When the effects of CO2 are not considered, land conversion still occur-red and CI increased (Scenario 5), hence, the current level of rice production can be maintained in 2025 by increasing the productivity level by 5%. By 2050, the level of productivity should be at least 25% higher from the current productivity level. When CI cannot be increased (Scenario 6), the level of productivity should be increased by 22% to maintain the current production level in 2025. By 2050, the level of productivity should be increased by 70% to maintain current levels of production (Figure 4.12).
Furthermore, when the effects of CO2 are considered, the increase in productivity is not necessary to maintain current production levels in 2025. Meanwhile, increasing productivity from 10% to 15% is still required to maintain production level equal to the current production level in 2050. In Scenario 6, if CI is unchanged and land conversion still occurred, the levels of productivity in 2025 and 2050 would have to increase approximately 10% and 50%, respectively, to maintain current production levels. The level of rice productivity in 2025 and 2050 for Scenarios 5 and 6 are presented in Tables 4.4 and 4.5, respectively.
Table 4.4 Productivity levels (t/ha) require to maintain current production levels in 2025 and 2050 under Scenario 5 (CI increased and land conversion occurred; Boer et al., 2008)
Table 4.5 Productivity levels needed maintain current production in 2025 and 2050 under Scenario 6 (CI constant and land conversion occurred)
Season Province
Rice Production
CurrentProduction
(t/ha)
CO2 ignored CO2 considered(SRESA2)
CO2 considered(SRESB1)
2025 2050 2025 2050 2025 2050
Wet SeasonWest Java 4.70 4.94 5.97 4.70 5.17 4.70 5.31Central Java 5.14 5.40 6.53 5.14 5.66 5.14 5.81East Java 5.15 5.41 6.54 5.15 5.66 5.15 5.82
Dry SeasonWest Java 4.86 5.11 6.18 4.86 5.35 4.86 5.50Central Java 5.11 5.36 6.48 5.11 5.63 5.11 5.77East Java 4.88 5.13 6.20 4.88 5.37 4.88 5.52
Average 4.97 5.22 6.32 4.97 5.47 4.97 5.62
Season Province
Rice Production
CurrentProduction
(t/ha)
CO2 ignored CO2 considered(SRESA2)
CO2 considered(SRESB1)
2025 2050 2025 2050 2025 2050
Wet SeasonWest Java 4.70 5.74 7.99 5.55 6.96 5.55 7.24Central Java 5.14 6.27 8.74 6.07 7.61 6.07 7.92East Java 5.15 6.28 8.75 6.07 7.62 6.07 7.93
Dry SeasonWest Java 4.86 5.93 8.27 5.74 7.20 5.74 7.49Central Java 5.11 6.23 8.68 6.02 7.56 6.02 7.86East Java 4.88 5.96 8.30 5.76 7.23 5.76 7.52
Average 4.97 5.22 6.32 4.97 5.47 4.97 5.62
CHAPTER IVMeasures to Facilitate Adequate Adaptation to Climate Change
IV-17

IndonesIa second natIonal communIcatIon under the unIted natIons Framework conventIon on clImate change (unFccc)
As previously discussed, increasing CI following the scenarios in Table 4.3 is difficult to attain. Therefore, rice field conversion rate in Java should be minimized if not prevented. In addition, the development of sustainable food crop land, as stated in Act No. 41/2009 about Protecting Sustainable Food Agricultural Land, is necessary to speed up actions for protecting land conversion.
If land conversion in Java is unavoidable and still occurred at a rate of 0.77% per year, and CI is constant (Scenario2), the development of irrigated rice fields should be developed outside Java to compensate for the loss in production in Java. The expanding irrigated area needed is approximately 1.3-1.8 million ha in 2025 and 3.0-3.8 million ha in 2050 (Figure 4.12).
A rapid assessment conducted by Parry et al. (1992) in a number of locations in Indonesia suggested that sea level rise due to global warming will also reduce local rice supply in the Krawang and Subang districts by approximately 300,000 tons. Similarly, maize output would likely be reduced by 10,000 tons – approximately half of this is attributed to inundation. Sea level rise would also be likely to affect fish and prawn production. The loss is estimated to be over 7,000 tons and 4,000 tons, respectively (valued at over US$ 0.5 million). In the lower Citarum Basin, sea level rise could result in the inundation of 26,000 ha of ponds and 10,000 ha of crop land. This could result in the loss of 15,000 tons of fish, shrimp and prawns and approximately 940,000 tons of rice. Parry et al. stated that the socio-economic implications of this transition in the Subang District alone could be the loss of employment for about 43,000 farm laborers. In addition, more than 81,000 farmers would have to look for other sources of income due to the inundation of their rice fields or prawn and fish farms due to sea level rise.
Figure 4.12 Expansion of irrigated area to compensate the loss of rice production in Java due to climate change and land conversion where increasing CI is not feasible. Source: Boer et al. (2008)
Area
requ
ired
(mill
ion
Ha)
4.0
3.5
3.0
2.5
2.0
1.5
1.0
0.5
0.0
CO2 IgnoredSRESA2
SRESB1
2025
2050
3.80
1.77
1.29
3.07 3.24
1.38
CHAPTER IVMeasures to Facilitate Adequate Adaptation to Climate Change
IV-18
IndonesIa second natIonal communIcatIon under the unIted natIons Framework conventIon on clImate change (unFccc)
Climate change is a long term threat that must be anticipated because of its adverse effects to the sustainability of agriculture. The Ministry of Agriculture has formulated the concept and strategic steps to cope with the threats. General strategy of adaptation for agriculture sector is focussing on food crops sub-sector in order to strengthen and sustain national food security. Some of the policy and strategy include:a. Reforming the regulations and agricultural institutions in form of Ministrial Decreesb. Development of information system, advocation, and communicationc. Development of agricultural insurance system related to climate change impacts (drought, flood, pest and diseases)
Some of the important adaptation program on most vulnerable sub-sectors (food crop and horticulture) to the adverse affects of climate change among others are:a. Improvement of water management, irrigation scheme, soil and fertilization management including organic fertilizer and development of carbon efficient farmingb. Development of early, drought, salinity and inundation tolerant crop varietesc. Development of farming risks insurance against adverse climated. Cropping pattern adjustment by preparation and dissemination of guidance and tools as dynamic cropping calendar and flood and drought naticipation blue print
Others strategic program to cope with climate change among others are development of climate field schools and system of rice intensification in all food crop production centers
4.4.2 Water ResourcesTo evaluate the impact of climate change on water resources, analysis based on River Area Unit (Satuan Wilayah Sungai, or SWS) was conducted in order to assess the change of water deficit duration under current and future climate. The water balance model is defined as follows:
Supply = Demand + Surplus
If the demand is higher than the supply, the surplus becomes negative and vice versa. Water supply is a function of monthly rainfall (Rmonthly) and forest cover. The forest cover will determine the fraction of rainfall that cannot be utilized (f ). The formula for estimating the supply is as follows:
Supply= Rmonthlyx(1-f )
The fraction of rainfall that cannot be utilized (f ) range from 20% to 60% depending on percent forest cover (Figure 4.13). With the increase of forest cover, the fraction of unutilized rainfall will decrease. The f value was determined using the Tank model tested in a number of watersheds in Java.
CHAPTER IVMeasures to Facilitate Adequate Adaptation to Climate Change
IV-19

IndonesIa second natIonal communIcatIon under the unIted natIons Framework conventIon on clImate change (unFccc)
Water demand comes from three sectors: domestic use (urban and rural), industry and agriculture, expressed as follows:
Demand=KAFarm + KAPopulation + KAIndustry
Water demand for domestic use (KApopulation) was estimated by multiplying population by water consumption per capita (i.e., 120-150 liters/capita/day). For industrial sectors (KAindustry), water demand is estimated based on the size of each industrial area (i.e., 500m3/ha/day). Water demand for industry was estimated based on human development index (HDI), based on assumption that the higher the HDI, the higher the industrial area. The relationship between HDI and industrial areas of a number of districts is shown in Figure 4.14. Water demand for agriculture (KAfarm) was calculated by multiplying agriculture land area bycrop coefficient (kc) and potential evapotranspiration. Because all lands will also evaporate soil water, the rate of soil evaporation or evapotranspiration from all land use cover types was also estimated using a similar formula used for agriculture land.
The projection of future population follows the projection from the Bureau of Statistics (BPS), while agricultural and industrial areas were generated using the following assumptions:
1. Forest cover decreases at rate of 1% per year. Deforestation occurs in all districts. The deforested area in each district is assumed to be equal to the proportion of the forest in the district to the total area of the district.
Figure 4.13 Relationship between fraction of unutilized rainfall (f) and forest cover (Heriensyah et al., 2009)
Frac
tion
of U
ntili
zed
Rain
fall
(f)
0.70
0.60
0.50
0.40
0.30
0.20
0.10
0.00
0.00 0.20 0.40 0.60 0.80 1.00
Forest Fraction
y = -0.433x2 + 0.081x + 0.517R2 = 0.543
CHAPTER IVMeasures to Facilitate Adequate Adaptation to Climate Change
IV-20

IndonesIa second natIonal communIcatIon under the unIted natIons Framework conventIon on clImate change (unFccc)
2. The amount of rice field area in Java was assumed to decrease at a rate of 50,000 ha per year, while outside Java it increases at a rate of 150,000 ha per year.3. The HDIis assumed to increase in the future. After 2025, districts with HDI equal to less than 65 will increase to 65, those with HDI equal to 65 will increase to 75 and those with HDI equal to more than 75 will increase to 85.
From the analysis, it was found that the number of months with surplus of water in most of districts in northern parts of Java, Bali, east and west Nusa Tenggara, parts of north Sulawesi, Gorontalo and south Sulawesi, Lampung and south Sumatra are almost zero (Figure 4.15). Some of districts in these provinces are exposed to long periods of water deficit. In some districts, the length of deficits could last up to 12 months, particularly areas in the eastern parts of Indonesia such as east Nusa Tenggara and west Nusa Tenggara. In east Nusa Tenggara, planting even just one crop a year without irrigation is not possible during El Niño years. During El Niño years, the length of the rainy season could be less than 3 months.
Under the future projected climate, the number of districts with no month of water surplus will increase significantly (Figure 4.16). Under the present climate, approximately 14% of the 453 districts across Indonesia have no months with surplus water. Under SRESB1, this is expected to increase to 19% by 2025 and to 31% by 2050, while under SRESA2, it will increase to 21% and 31% by 2025 and 2050, respectively. Table 4.6 shows that most of districts in Bali (more than 70%) do not have any surplus months, followed by NTB, Java (particularly northern parts of Java), Sulawesi (particularly Gorontalo and south Sulawesi) and Sumatra (mostly in southern
Figure 4.14 Relationship between HDI and industrial areas in Indonesia (Heriensyah et al., 2009)
Indu
stria
l Are
a (ha
)
350
300
250
200
150
100
50
0
55 60 65 70 75 80
Human Development Index (HDI)
y = 0.203e0.086x
R2 = 0.642
CHAPTER IVMeasures to Facilitate Adequate Adaptation to Climate Change
IV-21

IndonesIa second natIonal communIcatIon under the unIted natIons Framework conventIon on clImate change (unFccc)
and eastern parts of Sumatra). With such conditions, increasing cropping index in these islands is not possible, further restricting options for increasing rice production.
The above analysis implies that under changing a climate, more districts will have water scarcity problems (Heriensyah et al., 2009). The development of new initiatives to anticipate the scarcity of water due to climate change and increases on water demand are needed, especially in urban areas where populations are increasing and industrial activities are taking place. Inter-basin transfer of water may be one of the potential options to anticipate the scarcity of water in the future. In Indonesia, many individual basins have surplus water resources even in areas that have reach the ultimate stage of development while others face serious shortages, especially during extreme drought years. Improved storage capacity and inter-basin transfer of water from surplus to deficit regions could therefore be an option for achieving more equitable distribution of water resources and optimal utilization of these resources. The inter-basin technology has been practiced in West Nusa Tenggara.
Figure 4.15 Status of water balance under current and future climate (Heriensyah et al., 2009)
Baseline
SRESB1-2025
SRESB1-2050
Surplus (months)
SRESA2-2025
SRESA2-2050
0 1 2 3 4 5 6 7 8 9 10 11 12
CHAPTER IVMeasures to Facilitate Adequate Adaptation to Climate Change
IV-22

IndonesIa second natIonal communIcatIon under the unIted natIons Framework conventIon on clImate change (unFccc)
Figure 4.16 Number of districts without surplus water by length under current and future climate scenari-os (Heriensyah et al., 2009). Note: Both the bar graph (top) and table (below) show the same data.
Table 4.6 Number of districts that have no months without water surplus (Heriensyah et al., 2009)
Baseline 65 29 25 29 34 25 36 43 22 16 13 17 99
B1-25 84 46 30 23 48 27 30 25 18 18 14 17 73
A2-25 96 45 24 21 34 32 37 29 17 16 16 21 65
B1-50 119 39 30 28 24 37 45 17 14 24 11 21 44
A2-50 139 39 37 45 23 25 38 16 18 17 7 17 32
Num
ber o
f Dist
rics
160
140
120
100
80
60
40
20
00 1 2 3 4 5 6 7 8 9 10 11 12
Number of Months with surplus water (months)
Province Baseline B1-2025 B1-2050 A2-2025 A2-2050 Total Number of Distric in the island
Bali 7 8 8 8 9 9Java 22 26 23 26 23 120Kalimantan 7 11 12 11 15 54Maluku 1 1 2 1 2 16NTB 3 6 8 6 9 10NTT 1 2 4 2 6 16Papua 0 0 3 0 3 29Sulawesi 10 15 30 22 40 63Sumatera 14 15 29 20 32 135
CHAPTER IVMeasures to Facilitate Adequate Adaptation to Climate Change
IV-23

IndonesIa second natIonal communIcatIon under the unIted natIons Framework conventIon on clImate change (unFccc)
4.4.3 ForestryThe impact of climate change on tropical forest occurs as a result of changes in soil water availability due to the combined effects of changes in temperature and rainfall. A study in India suggested that projected depletion of soil moisture due to climate change would likely affect teak productivity by reducing the productivity of deciduous forest by approximately 16% (Achanta and Kanetkar, 1996). In Indonesia, however, one important potential threat of climate change on is the increased risk of forest fire due to decreasing dry season rainfall and shortening of the length of the wet season in some part of the region.
During El Niño years 1991/92, 1994/95 and 1997/98,the dry season was extended and carbon emissions from fires measured in 97 monitoring stations across Southeast Asian countries increased significantly (Schimel and Baker 2002). For Indonesia in particular, the strongest El Niño (1997) caused land and forest fire on approximately 11.698 million ha (BAPPENAS-ADB, 1999). Areas most affected by the fire were Kalimantan and Sumatra while the impacts in other provinces were not as severe (Table 4.7). The economic loss caused by the fire was tremendous. OFDA/CRED (2007) stated that these fires were one of the top 10 natural hazards occurred during 1997 and 2007 and the value of all damages and economic losses directly or indirectly related to the 1997/98 fires might reach 17,000 million USD (Table 4.8).
Ardiansyah and Boer (2009) have classified the Indonesian region based on its level of risk to fire. The fire risk was defined based on the monthly pattern of the number of hotspots. Although the hotspot data are not for fire alone, hot spots are closely related to forest and land fire occurrence and smoke fog (e.g., Hooijer et al., 2006). The result of this classification suggested that Indonesia can be classified into 6 cluster patterns (Figure 4.17). Kalimantan and Sumatra were found to be islands that are already exposed to high risk of fire. Based on hotspot density patterns, two provinces shown to have very high hot spot density are Riau Province in Sumatra and Central Kalimantan (Figure 4.17). Hotspot densities in these two islands increases rapidly when dry season rainfall decrease or length of dry season extends, particularly during El Niño years. The hotspot density increased rapidly as the monthly rainfall during the dry season decreased more than 50 mm below normal or when anomaly rainfall was -50 mm (Figure 4.18)
Table 4.7 Area affected by forest fire in 1997/1998 (expressed in ha)
Vegetation Sumatra Java Kalimantan Sulawesi Wesst Papua Total by vegetation type
Montane forest -- -- 213,194 -- 100,000 313,194Lowland forest 383,000 25,000 2,690,880 200,000 300,000 3,598,880
Peat and swamp forest 624,000 -- 1,100,000 -- 400,000 2,124,000
Dry scrub and grass 263,000 25,000 375,000 -- 100,000 763,000Timber plantation 72,000 -- 883,988 -- -- 955,988Estate crops 60,000 -- 382,509 1000 3000 446,509Agriculture 669,000 50,000 2,481,808 199,000 97,000 3,496,808Total by province 2,071,000 100,000 8,127,379 400,000 1,000,000 11,698,379
CHAPTER IVMeasures to Facilitate Adequate Adaptation to Climate Change
IV-24

IndonesIa second natIonal communIcatIon under the unIted natIons Framework conventIon on clImate change (unFccc)
Under both emission scenarios, the seasonal rainfall during SON may decrease over most of the Indonesian region (refer back to Figure 4.10). Most of the 14 GCMs agree that the seasonal rainfall will decrease, particularly in Sumatra and Kalimantan. The decrease in rainfall during this season may result in the delay of the onset of the rainy season, thereby increasing fire risk. Figure 4.19 shows that the risk of fire will increase in the future in certain months and decrease in other months. In general, for Pattern 5 region see (Figure 4.17), the fire risk in October will increase for both scenarios except for SRESB1 in 2050. Similar pattern also found in Pattern 6, the fire risk January will increase for both scenarios except for SRESB1 in 2050.
The Centre for International Forestry Research (CIFOR) also found that future risk of fires in parts of Kalimantan, Sumatra and west Java would be greater than in the past due to an increase in average drought indices and the number of days with ‘extreme’ danger rating (Figure 4.20).
Table 4.8 Total national economic loss due to fires during the 1997 El Niño year (expressed in million USD)
Sector MoE and UNDP (1998) WWF & EEPSEA (1998)
Agriculture 88.6 130.7Forestry 508.2 640.6
Health 43.8 256.7
Transmigration 0.2 0.0Transportation 13.6 4.9Tourism 4.9 19.6Fire control 3.2 3.3Total 662.4 1055.6
Figure 4.17 Classification of regions at risk to fire based hotspot density patterns – Sumatra (left) and Kalimantan (right) (Ardiansyah and Boer, 2009
Hot S
pot D
ensit
y
Hot S
pot D
ensit
y
Hot S
pot D
ensit
y
120
100
80
60
40
20
0
120
100
80
60
40
20
0
120
100
80
60
40
20
0
Pattern 1Pattern 2Pattern 3Pattern 4Pattern 5Pattern 6
Pattern 4
Jan
Feb
Mar Ap
rM
ei Jun Jul
Agt
Sept Ok
t No
v De
s
Jan
Feb
Mar Ap
rM
ei Jun Jul
Agt
Sept Ok
t No
v De
s
Jan
Feb
Mar Ap
rM
ei Jun Jul
Agt
Sept Ok
t No
v De
s
Jan
Feb
Mar Ap
rM
ei Jun Jul
Agt
Sept Ok
t No
v De
s
Pattern 5
Pattern 1
Pattern 3
Pattern 2 (very low Hot Spot)
2
3
6
45 1
Hot S
pot D
ensit
y
120
100
80
60
40
20
0
Hot S
pot D
ensit
y
120
100
80
60
40
20
0
Jan
Feb
Mar Ap
rM
ei Jun Jul
Agt
Sept Ok
t No
v De
s
Pattern 6
CHAPTER IVMeasures to Facilitate Adequate Adaptation to Climate Change
IV-25

IndonesIa second natIonal communIcatIon under the unIted natIons Framework conventIon on clImate change (unFccc)
Figure 4.18 The relationship between hotspot density and rainfall anomaly in Kalimantan and Sumatra for (a) Pattern 1, (b) Pattern 3, (c) Pattern 4, (d) Pattern 5 and (e) Pattern 6
250200150100
500
-50-100-150-200-250
250200150100
500
-50-100-150
250200150100
500
-50-100-150-200
0.80.70.60.50.40.30.20.10
0.80.70.60.50.40.30.20.10
0.80.70.60.50.40.30.20.10
0.80.70.60.50.40.30.20.10
0.80.70.60.50.40.30.20.10
0.180.160.140.120.100.080.060.040.020.00
0.080.070.060.050.040.030.020.010.00
0.03
0.03
0.02
0.02
0.01
0.01
0.00
Rain
fall
anom
aly (
mm
)Ra
infa
ll an
omal
y (m
m)
Rain
fall
anom
aly (
mm
)Ra
infa
ll an
omal
y (m
m)
Rain
fall
anom
aly (
mm
)Rainfall anomalyHotspot density
Rainfall anomalyHotspot density
Rainfall anomalyHotspot density
Rainfall anomalyHotspot density
Rainfall anomalyHotspot density
(a)
(b)
(c)
(d)
(e)
Hotspot densityHotspot density
Hotspot densityHotspot density
Hotspot densityHo
tspo
t den
sity
Hots
pot d
ensit
yHo
tspo
t den
sity
Hots
pot d
ensit
yHo
tspo
t den
sity
2003 2004 2005 2006 2007 2008
-250 -150- 50 50 150 250
-150 -100- 50 0 50 100 150 200
-200 -150 -100 -50 0 50 100 150
-250 -200 -150 -100 -50 0 50 100 150
-250 -200 -100 0 100 200 300
2003 2004 2005 2006 2007 2008
2003 2004 2005 2006 2007 2008
2003 2004 2005 2006 2007 2008
2003 2004 2005 2006 2007 2008
Rainfall anomaly (mm)
Rainfall anomaly (mm)
Rainfall anomaly (mm)
Rainfall anomaly (mm)
Rainfall anomaly (mm)
250200150100
500
-50-100-150-200-250
250200150100
500
-50-100-150-200-250
0.500.450.400.350.300.250.200.150.100.050.00
0.800.750.600.500.400.300.200.100.100.00
CHAPTER IVMeasures to Facilitate Adequate Adaptation to Climate Change
IV-26
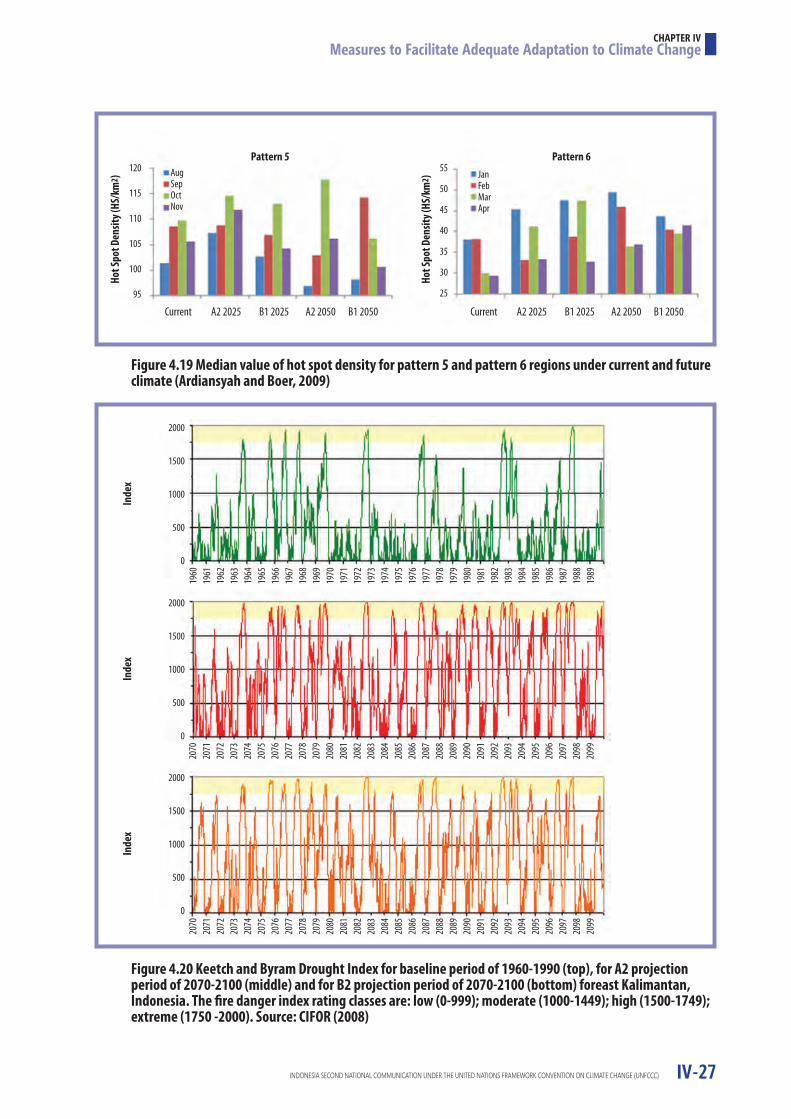
IndonesIa second natIonal communIcatIon under the unIted natIons Framework conventIon on clImate change (unFccc)
Figure 4.19 Median value of hot spot density for pattern 5 and pattern 6 regions under current and future climate (Ardiansyah and Boer, 2009)
Figure 4.20 Keetch and Byram Drought Index for baseline period of 1960-1990 (top), for A2 projection period of 2070-2100 (middle) and for B2 projection period of 2070-2100 (bottom) foreast Kalimantan, Indonesia. The fire danger index rating classes are: low (0-999); moderate (1000-1449); high (1500-1749); extreme (1750 -2000). Source: CIFOR (2008)
Hot S
pot D
ensit
y (HS
/km
2 )In
dex
Inde
xIn
dex
Hot S
pot D
ensit
y (HS
/km
2 )
Pattern 5 Pattern 6
Current A2 2025 B1 2025 A2 2050 B1 2050 Current A2 2025 B1 2025 A2 2050 B1 2050
120
115
110
105
100
95
55
50
45
40
35
30
25
AugSepOctNov
JanFebMarApr
2000
1500
1000
500
0
2000
1500
1000
500
0
2000
1500
1000
500
0
1960
1961
1962
1963
1964
1965
1966
1967
1968
1969
1970
1971
1972
1973
1974
1975
1976
1977
1978
1979
1980
1981
1982
1983
1984
1985
1986
1987
1988
1989
2070
2071
2072
2073
2074
2075
2076
2077
2078
2079
2080
2081
2082
2083
2084
2085
2086
2087
2088
2089
2090
2091
2092
2093
2094
2095
2096
2097
2098
2099
2070
2071
2072
2073
2074
2075
2076
2077
2078
2079
2080
2081
2082
2083
2084
2085
2086
2087
2088
2089
2090
2091
2092
2093
2094
2095
2096
2097
2098
2099
CHAPTER IVMeasures to Facilitate Adequate Adaptation to Climate Change
IV-27

IndonesIa second natIonal communIcatIon under the unIted natIons Framework conventIon on clImate change (unFccc)
Based on the above finding, the risk of repeated fires may increase under a changing climate. Under such conditions, the threat to biodiversity loss will increase. A study in East Kalimantan showed that the number of trees that survived in plots that experienced fire in 1982/83 and again in 1997/98 decrease significantly (Figure 4.21; Ngakan, 2002). Furthermore, even eleven years after fires, the number of species in plots that were lightly, moderately and severely damaged was not significantly different. However, the species composition was still noticeably different. The trees in lightly-damaged plots were dominated by primary (climax) species (Figure 4.22) such as Aglaia cinere, Madhuca malacensis, Mallotus mpritsianus, Eusideroxylon zwageri, etc.
Figure 4.21 The number of surviving and dead trees per hectare after forest firesin 1982/83 and 1997/98 (Ngakan, 2002)
Figure 4.22 Composition of species per hectare in plots which were lightly, moderately and severely damaged by fires in Kutai National Park, East Kalimantan
Num
ber o
f tre
ss p
er h
aNu
mbe
r of S
pecie
s
Level of Damaged
Diameter classes (cm)
1982/83 1997/98
200
180
160
140
120
100
80
60
40
20
0
DeadSurvive
10-2
0
20-3
0
30-4
0
40-5
0
50-6
0
60-7
0
>70
10-2
0
20-3
0
30-4
0
40-5
0
50-6
0
60-7
0
>70
Primary Species
Light Moderate Severe
Secondary Species
35
30
25
20
15
10
5
0
CHAPTER IVMeasures to Facilitate Adequate Adaptation to Climate Change
IV-28

IndonesIa second natIonal communIcatIon under the unIted natIons Framework conventIon on clImate change (unFccc)
Other impacts of climate change on forest ecosystems may also include the disappearance or reduction of density of certain species due shifts in ideal temperature and rainfall range, increasing forest disease and pest infestation, the increase or the decrease of forest productivity, etc.
As defined in Chapter 5, the Government of Indonesia has issued a number of policies and regulations to reduce risk of land/forest fire. There are at least 7 legal instruments designed to control fire. These legal instruments are in the form of Acts, Government Regulations, Minister Decrees from the Ministry of Forestry, Ministry of Environment and Ministry of Agriculture, Director General Decrees, etc. A number of programs have been implemented for fire management through the establishment of community-based fire management systems, early warning systems, etc.
4.4.4 Coastal and MarineThe impacts of climate change on coastal areas can be divided into two categories: biophysical and socio-economic impacts. Biophysical impacts include (IPCC, 2005): (i) increased coastal erosion, (ii) inhibition of primary production processes, (iii) increased flood frequency, (iv) increased intensity of flood events caused by storm-surge, (v) saltwater intrusion into estuaries and aquifers, (vi) changes in the quality of surface water and groundwater characteristics, (vii) changes in the distribution of pathogenic micro organisms and (viii) increasing sea surface temperatures. Economic and social impacts include (i) increasing number of homes lost and coastal habitats, (ii) increased risk of flooding and the number of lives potentially lost, (iii) damage to buildings and other infrastructure, and coastal protection, (iv) increased risk of disease outbreaks, (v) loss of resources that can be replaced (vi) loss of tourism, recreation and transportation, (vii) loss of cultural assets and historical values and (viii) impacts on inland fisheries and agriculture due to declining quality of soil and water as a result of saltwater intrusion.
In Indonesia, the potential impact of climate change on coastal areas and fisheries is significant. From historical data, it is clear that the increase in sea temperatures during El Niño years has caused serious coral bleaching. Coral bleaching occurred in Indonesian waters in 1983, including the Sunda Strait, and the Thousand Islands, and Karimun Java Sea. This resulted in high numbers of dead coral. In 1998, widespread coral bleaching occurred again, but indifferent locations, this time in East Sumatra, Java, Bali and Lombok. In the Thousand Islands, 90-95% of coral at depths up to 25 m suffered bleaching and death (World Resources Institute [WRI], 2002). Meanwhile, Bali experienced 75-100% coral bleaching. According to the World Wildlife Fund (WWF), the 1998coral bleaching event was triggered by El Niño. The 1982/83 and 1997/1998 El Niño events have been defined as the two strongest El Niño events during the last century. The Indonesian Coral Reef Foundation (TERANGI) (2007) also reported coral bleaching in the Thousand Islands in February 2006 and February 2007, even though the El Niño during this period was not as strong as those that occurred in 1982/83 and 1997/98.
CHAPTER IVMeasures to Facilitate Adequate Adaptation to Climate Change
IV-29

IndonesIa second natIonal communIcatIon under the unIted natIons Framework conventIon on clImate change (unFccc)
Coral bleaching has significant impacts on fish populations as it is the habitat of thousands of species of reef fish. In addition, the reef also functions as a high energy and wave absorber that reduces the risk of coastal erosion. Therefore, damage to reefs increases the risk of coastal erosion. The increasing frequency of storms resulting in high waves can also cause clusters of coral damage. Due to its world renowned biodiversity and aesthetic beauty, beaches in Indonesia have become a popular tourist destination and is a significant source of revenue for Indonesia. In general, the number of tourists who visit Indonesia tends to increase and provide major revenue for the government (Ministry of Culture and Tourism, 2010). However, if not managed appropriately, tourism activities can also cause damage to coastal areas, including coral reefs, and beaches.
Rising ocean temperatures will also inhibit the growth of phytoplankton, which many important species of fish depend on. Fish area resource that can move from one place to another, across borders between countries. For example, the migration of Pacific salmon from USA to Canada is suspected to be attributed to a rise in Pacific Ocean temperatures. This situation pushed the two countries to establish a single agreement on salmon fishing (Miller, 2000). The increase in ocean temperatures will also change the pattern of currents, wind and rain patterns. Warmer ocean water can prevent the proliferation of plankton thereby reducing the availability of fish food. Some fish species such as pelagic will likely migrate to other regions that offer suitable temperature conditions and food availability. This will adversely affect the attainment of development objectives in the fisheries sector.
Coastal erosion has also been observed in many parts of Indonesian coastal areas due primarily to sea level rise (SLR) and strong wave action. Based on data released by the Ministry of Public Works, about 40% of the 81,000 km coastline has been eroded. Along the northern coast of Java, the coastal erosion impacts on 5,500 hectares of land are spread over 10 districts. For example, in Tegal Regency, erosion of 40 km of shoreline has resulted in moving the coast line inland as far as 50 to 100 meters. Approximately 3 km out of the 10.5 km of shoreline erosion has also resulted in a loss of 25 ha of ponds.
The increase in wind speed, sea level, and wave and tidal action due to climate change will have significant impacts on coastal and marine resources. As an island country, Indonesia will suffer significantly from climate change-induced sea level rise. The following sections describe briefly the impact of sea level rise on four coastal cities of Indonesia, Jakarta, Medan, Semarang and Surabaya using three scenarios. The first scenario assesses the impact of sea level rise that may cause the permanent inundation of some of the coastal areas. The second scenario assesses the impact of sea level rise combined with high tides. The third scenario assesses the impact of sea level rise combined with land subsidence. The economic losses due sea level rise were assessed based on the area and type of land use affected by the sea level rise. The four main land use types affected by sea level rise in the coastal cities include settlement, rice fields, ponds and harbors/airports. The value of economic losses due to the inundation of the respective land use types were collected based on literature studies (Table 4.9).
CHAPTER IVMeasures to Facilitate Adequate Adaptation to Climate Change
IV-30

IndonesIa second natIonal communIcatIon under the unIted natIons Framework conventIon on clImate change (unFccc)
MEDAN CITY
This case study covers the area of Medan and part of the Deli Serdang Regency. Medan topography is undulating with an altitude between 2.5 and 37.5 meters above sea level (a.s.l.); Deli Serdang area topography is similar to the Medan municipality. Due to the topography, this region is not vulnerable to flooding due to sea level rise equal to one meter or less. The probability of coastal areas affected by flooding due to sea level rise alone (Scenario 1) is low even with sea level rise up to 1 m. However, when combined with high tide (2.69 m), a significant area will be inundated. The time scale of this flood is not permanent and only temporary. Based on this scenario, the most extensive areas affected are Harapan Perak in Deli Serdang District and Medan Labuhan in Medan Municipality (Figure 4.23).The extent of water flooding inland due to sea level rise and high tide is varied depending on the topographic of the area. The maximum height of flooding and the total area temporarily inundated is shown in Figure 4.24. Because of the nature of the floods in this region are only temporary, the damage to infrastructure is small, but if the flood affected the functions of wetlands and ponds, damage will be high and lead to large economic losses.
Table 4.9 Economic loss per ha of affected land use type
Land Use/Land CoverDamages in rupiahs (IDR)
SourceLow Medium High
Harbors/airports - 37,500,000,000 - 1
Ponds (prawn/fish) 2,150,000 2,200,000 2,250,000 3
Settlements 1,640,000 2,695,000 3,750,000 2
Wet rice fields 1,750,000 3,000,000 5,500,000 4
Source: 1Batam Pos, 2BPSDA (2003), 3 Kartikasari and Boer et al (2007) and4 Sasmita (2006)
Figure 4.23 Distribution of floods based on the scenario of sea level rise + high tide: 0.25+2.69 m (A) and 1.0+2.69 m (B). Source: Hariati et al.,2009
A B
CHAPTER IVMeasures to Facilitate Adequate Adaptation to Climate Change
IV-31
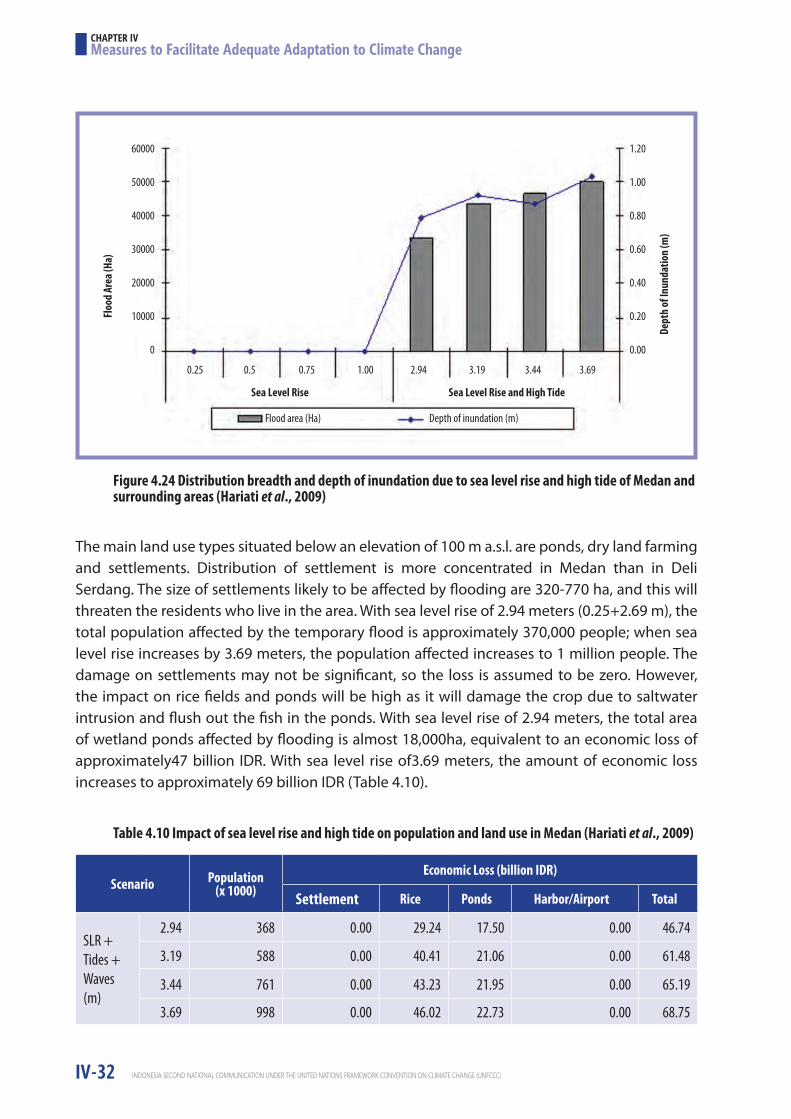
IndonesIa second natIonal communIcatIon under the unIted natIons Framework conventIon on clImate change (unFccc)
The main land use types situated below an elevation of 100 m a.s.l. are ponds, dry land farming and settlements. Distribution of settlement is more concentrated in Medan than in Deli Serdang. The size of settlements likely to be affected by flooding are 320-770 ha, and this will threaten the residents who live in the area. With sea level rise of 2.94 meters (0.25+2.69 m), the total population affected by the temporary flood is approximately 370,000 people; when sea level rise increases by 3.69 meters, the population affected increases to 1 million people. The damage on settlements may not be significant, so the loss is assumed to be zero. However, the impact on rice fields and ponds will be high as it will damage the crop due to saltwater intrusion and flush out the fish in the ponds. With sea level rise of 2.94 meters, the total area of wetland ponds affected by flooding is almost 18,000ha, equivalent to an economic loss of approximately47 billion IDR. With sea level rise of3.69 meters, the amount of economic loss increases to approximately 69 billion IDR (Table 4.10).
Figure 4.24 Distribution breadth and depth of inundation due to sea level rise and high tide of Medan and surrounding areas (Hariati et al., 2009)
Table 4.10 Impact of sea level rise and high tide on population and land use in Medan (Hariati et al., 2009)
Floo
d Ar
ea (H
a)
Dept
h of
Inun
datio
n (m
)
60000
50000
40000
30000
20000
10000
0
0.25 0.5 0.75 1.00 2.94 3.19 3.44 3.69
Sea Level Rise
Flood area (Ha) Depth of inundation (m)
Sea Level Rise and High Tide
1.20
1.00
0.80
0.60
0.40
0.20
0.00
Scenario Population(x 1000)
Economic Loss (billion IDR)
Settlement Rice Ponds Harbor/Airport Total
SLR + Tides + Waves (m)
2.94 368 0.00 29.24 17.50 0.00 46.74
3.19 588 0.00 40.41 21.06 0.00 61.48
3.44 761 0.00 43.23 21.95 0.00 65.19
3.69 998 0.00 46.02 22.73 0.00 68.75
CHAPTER IVMeasures to Facilitate Adequate Adaptation to Climate Change
IV-32

IndonesIa second natIonal communIcatIon under the unIted natIons Framework conventIon on clImate change (unFccc)
JAKARTA CITY
Some areas of Jakarta are located at low elevation or even below sea level (Satkorlak PBP Jakarta 2006). Based on SRTM data analysis, the low elevation areas are distributed across four municipalities (Table 4.11). The size of the areas with an elevation below sea level rise ranges from 90 to 2020 ha. The largest area is situated in North Jakarta and the smallest area is in Central Jakarta. In North Jakarta, low elevation areas are distributed among the six sub-districts of Cilincing, Kelapa Gading, Koja, Pademangan, Penjaringan and Tanjung Priok, while the specific villages with the lowest elevation are Sunter Agung, Papango, and Tanjung Priok (Figure 4.25).
Table 4.11 Percent distribution area of low elevation (<0 meters below sea level in DKI Jakarta
Figure 4.25 Distribution of low elevation (< 0 meterdpal) areas in DKI Jakarta
Source: Analysis of SRTM data
No. MunicipalityAre
(ha) (%)1. West Jakarta 244.5 9.92. Central Jakarta 91.4 3.73. East Jakarta 105.1 4.34. North Jakarta 2020.7 82.1
Total 2461.7 100.0
CHAPTER IVMeasures to Facilitate Adequate Adaptation to Climate Change
IV-33

IndonesIa second natIonal communIcatIon under the unIted natIons Framework conventIon on clImate change (unFccc)
Under Scenario 1, some of the Jakarta area will be permanently inundated due to a sea level rise of 0.25 m. The most affected areais located in the Sunter Agung and Papango of Tanjung Priok sub-districts. The flood depth may reach 11 cm and in some locations can increase up to 20 cm. The coastline will move inland by approximately 1.5 km from its current location. If sea level rises up to 1 m, the area that will be permanently inundated will increase significantly and more sub-districtswill be affected, including Tanjung Priok and Koja (North Jakarta) and Penjaringan and Kalideres (West Jakarta) with a mean flood depth of approximately 30 cm. The coastline will move inland by approximately 2.0 km from its current location (Figure 4.26). Combined with high tide (Scenario 2), the total area that will be inundated will be much larger. The depth of flood and total flooded area under Scenarios 1 and 2 are shown in Figure 4.27.
Based on the overlay of population density maps and flood area, the size of the population affected by a sea level rise of 0.25 and 1.0 m will be approximately 74,000 and 130,000, respectively (Figure 4.28). If the level of sea level rise is combined with high tide, the total number of people affected will increase to 236,000and 381,000 people, for 2.28 m and 3.03 m, respectively (Figure 4.28).
Figure 4.26 Distribution of floods based on sea level rise of 0.25 m (A), 1.0 m (B), sea level rise + high tide of 2.28 m (C) and sea level rise + high tide of 3.03 m (D). Source: Hariati et al., 2009
A
C
B
D
CHAPTER IVMeasures to Facilitate Adequate Adaptation to Climate Change
IV-34

IndonesIa second natIonal communIcatIon under the unIted natIons Framework conventIon on clImate change (unFccc)
The impact of sea level rise on the city of Jakarta was assessed based on four land use types: residential, wetland, ponds and ports. With sea level rise of less than 0.25 m, the economic loss will reach approximately 6,500 billion IDR; if sea level rise increased to 1.0 m, the loss will increase to more than 8,600 billion IDR (Scenario 1). If the impact of sea level rise is combined with high tide (Scenario 2), the loss will not be much different from that of Scenario 1 (Table 4.12). This is due to the nature of floods in the second scenario, which are only temporary. It is assumed that the damage caused by the temporary flood in settlements and airport is not
Figure 4.27 Area of flooding and depth of flood due to sea level rise and high tide in the Jakarta region. Source: Hariati et al., 2009
Figure 4.28 Number of residents affected by flooding due to sea level rise and high tide in Jakarta. Source: Hariati et al., 2009
Dept
h of
Inun
datio
n (m
)
Floo
d Ar
ea (H
a)Po
pula
tion
expo
sed
(thou
sand
s)
1.2
1
0.8
0.6
0.4
0.2
0
7000
6000
5000
4000
3000
2000
1000
0
400
350
300
250
200
150
100
50
0
0.25 0.5 0.75 1.00 2.28 2.53 2.78 3.03
0.25 0.5 0.75 1 2.28 2.53 2.78 3.03
SLR (cm) SLR and Tide Wave
Sea Level Rise
Flood area (Ha) Depth of inundation (m)
Sea Level Rise and High Tide
CHAPTER IVMeasures to Facilitate Adequate Adaptation to Climate Change
IV-35

IndonesIa second natIonal communIcatIon under the unIted natIons Framework conventIon on clImate change (unFccc)
significant. The impact of temporary flooding is only significant on rice field and ponds. In this analysis, the economic impact of temporary floods through their effect on flight landing and take-off at airports is not taken into account.
It should be noted that land subsidence problems already exist in Jakarta. However, due to unavailability of spatial data on land subsidence, analysis for Scenario 3 was not conducted. Based on a number of reports (Abidin et al., 2009; Djaya et al., 2004), subsidence in several places in the metropolitan area of Jakarta ranging from 20 to 200 cm occurred over the period from 1982-1997. In general, land subsidence exhibits spatial and temporal variations, with the rates of about 1-15 cm/year, but in a few locations, the subsidence rates reached 20-25 cm/year (Abidin et al., 2009). The four main factors causing land subsidence in Jakarta are ground water extraction, load of constructions (i.e., settlement on high compressibility soil), natural consolidation of alluvial soil and tectonic subsidence (Abidin et al., 2009). Overall, land subsidence may have more serious impacts than that of the global warming on land inundation on the City of Jakarta.
Table 4.12 Impact of sea level rise and high tide on the population and land use in Jakarta.Source: Hariati et al., 2009
ScenarioNumber of
people affect ed (in thousands)
Economic Loss (billion IDR)
Settlements Rice Ponds Harbor/Airport Total
SLR (m)
0.25 74 1.00 0.06 0.12 6,489.56 6490.74
0.50 93 1.27 0.07 0.23 7,202.44 7204.01
0.75 109 1.63 0.08 0.62 7,881.83 7884.16
1.00 130 2.15 0.28 0.71 8,622.76 8625.90
SLR + tides and
wave action (m)
2.28 236 1.00 8.49 1.48 6,489.56 6500.53
2.53 280 1.27 9.50 1.55 7,202.44 7214.76
2.78 325 1.63 10.15 1.63 7,881.83 7895.24
3.03 381 2.15 11.05 1.71 8,622.76 8637.67
CHAPTER IVMeasures to Facilitate Adequate Adaptation to Climate Change
IV-36

IndonesIa second natIonal communIcatIon under the unIted natIons Framework conventIon on clImate change (unFccc)
SEMARANG CITY
The impact of sea level rise on Semarang City will be severe, as the city already experiences problems with land subsidence (Georisk Project, 2008). In Semarang, the primary factor that triggers land subsidence is the increased consumption of ground water. As a result, hydraulic pressure in the soil layer declines (referred to as cone depression of groundwater), followed by the decrease of the soil surface. This condition will be more severe when the area above ground incurs additional burden, such as settlement building. Based on the Georisk Project report (2008), the cone depression in the area of Semarang widened east wards from 1984 to 2000. Based on these observations, it is assumed that the direction of growing land subsidence is toward the east (Figure 4.29A).The rate of land subsidence ranged from 0-1 cm/year up to 8-9 cm/year (Figure 4.29B). The highest rate of land subsidence (8-9 cm/year) occurred in most of North Semarang and Genuk; the lowest rate of land subsidence (0-1 cm/tahun) occurred in Tugu, Central of Western Semarang, and southernpart of Central Semarang, East Semarang, Gayamsariand Padurungan.This data wasused as the basis for projecting land subsidence up to 2100.
Under Scenario 1, it was found that total area in Semarang City that will be permanently inundated by sea level rise of 0.25 m is less than 600 ha with a flood depth of approximately less than 20 cm. The sub-district with the greatest area affected by flood is Genuk, while the sub-district with the smallest area affected is Tugu. With sea level rise up to 0.50 and 1.0 m, the coastline is projected to move inland between approximately 700-1000 m, and 1000-1300 m, respectively. In the three most affected sub-districts of Semarang (Tugu, Semarang Utara and Genuk), the coastline will move inland by approximately 680, 860 and 1000 m respectively, with a sea level rise of 0.5 m, (Figure 4.30A); with sea level rise of 1.0 m, the coastline will move inland by 1300, 1000 and 300 m, respectively (Figure 4.30B). Under Scenario 2, combining sea level
Figure 4.29 (A) Growth of cone impairment (cone depression) in the groundwater aquifer from 1984 until 2000, and (B) land subsidence rates in Semarang City. Source: Georisk Project, 2008
CHAPTER IVMeasures to Facilitate Adequate Adaptation to Climate Change
IV-37
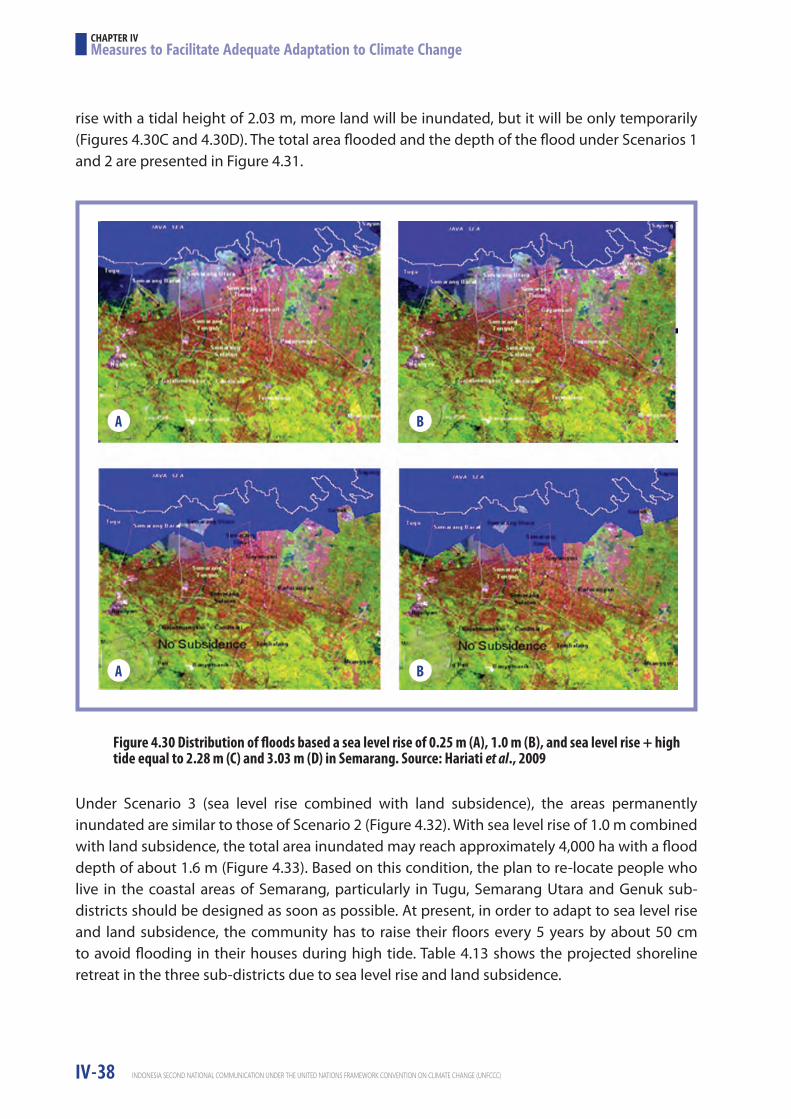
IndonesIa second natIonal communIcatIon under the unIted natIons Framework conventIon on clImate change (unFccc)
rise with a tidal height of 2.03 m, more land will be inundated, but it will be only temporarily (Figures 4.30C and 4.30D). The total area flooded and the depth of the flood under Scenarios 1 and 2 are presented in Figure 4.31.
Under Scenario 3 (sea level rise combined with land subsidence), the areas permanently inundated are similar to those of Scenario 2 (Figure 4.32). With sea level rise of 1.0 m combined with land subsidence, the total area inundated may reach approximately 4,000 ha with a flood depth of about 1.6 m (Figure 4.33). Based on this condition, the plan to re-locate people who live in the coastal areas of Semarang, particularly in Tugu, Semarang Utara and Genuk sub-districts should be designed as soon as possible. At present, in order to adapt to sea level rise and land subsidence, the community has to raise their floors every 5 years by about 50 cm to avoid flooding in their houses during high tide. Table 4.13 shows the projected shoreline retreat in the three sub-districts due to sea level rise and land subsidence.
Figure 4.30 Distribution of floods based a sea level rise of 0.25 m (A), 1.0 m (B), and sea level rise + high tide equal to 2.28 m (C) and 3.03 m (D) in Semarang. Source: Hariati et al., 2009
A
A
B
B
CHAPTER IVMeasures to Facilitate Adequate Adaptation to Climate Change
IV-38

IndonesIa second natIonal communIcatIon under the unIted natIons Framework conventIon on clImate change (unFccc)
Figure 4.31 Flood area and flood depth due to sea level rise and high tide in Semarang. Source: Hariati et al., 2009
Figure 4.32 Distribution of floods based on land subsidence and sea level rise of 0.25 m (A), 0.50 m (B), 0.75 m (C) and 1.0 m (D). Source: Hariarti et al., 2009
Floo
d Ar
ea (H
a)
Dept
h of
Inun
datio
n (m
)
4500
4000
3500
3000
2500
2000
1500
1000
500
0
2.00
1.80
1.60
1.40
1.20
1.00
0.80
0.60
0.40
0.20
0.00 0.25 0.5 0.75 1.00 2.28 2.53 2.78 3.03
Sea Level Rise
Flood area (Ha)
Sea Level Rise and High Tide
Depth of inundation (m)
A
C
B
D
CHAPTER IVMeasures to Facilitate Adequate Adaptation to Climate Change
IV-39

IndonesIa second natIonal communIcatIon under the unIted natIons Framework conventIon on clImate change (unFccc)
Sea level rise of 0.25 and 1.0 will threaten approximately 31,000 and 114,000 people, respecti-vely. If sea level rise occurs simultaneously with high tide, the number of people threatened by floods increases. With a total increase in sea level of 2.28 and 3.03 m as a result of high tide and sea level rise, the number of people threatened increases to approximately between 177,000 and 443,000, respectively (Figure 4.34).
The economic loss due to sea level rise ranges considerably depending on whether the area is inundated temporarily or permanently (Table 4.14). Under Scenario 1, sea level rise of 0.25 m will result in an economic loss of approximately 1.5 billion USD, while if the sea level rises1 m and is combined with land subsidence, the total economic loss may reach 378 billion USD (Table 4.14).
Figure 4.33 Flood area and flood depth due to sea level rise and land subsidence in Semarang area. Source: Hariarti et al., 2009
Table 4.13 Shoreline retreat due to sea level rise and land subsidence (Hariarti et al., 2009)
Floo
d Ar
ea (H
a)
Dept
h of
Inun
datio
n (m
)
4500
4000
3500
3000
2500
2000
1500
1000
500
0
2.00
1.80
1.60
1.40
1.20
1.00
0.80
0.60
0.40
0.20
0.00 0.25 0.5 0.75 1.00 0.25 0.5 0.75 1.00
Sea Level Rise
Flood area (Ha)
Sea Level Rise and Land Subsidence
Depth of inundation (m)
No. Sub-District
Coast line movement in land due
to sea level rise(m)
Coast line movement in land due land
subsidence (m)
0.5 m 1.0 m 0.5 m + land subsidence 1.0 m + land subsidence
1 Tugu 700 1300 930 1800
2 North Semarang 800 1030 2300 2800
3 Genuk 950 1200 2970 4300
CHAPTER IVMeasures to Facilitate Adequate Adaptation to Climate Change
IV-40

IndonesIa second natIonal communIcatIon under the unIted natIons Framework conventIon on clImate change (unFccc)
Table 4.14 Impact of sea level rise, high tide and land subsidence on the population and land use in Semarang. Source: Hariarti et al., 2009
Figure 4.34 The number of residents affected by flooding due to sea level rise and high tide.Source: Hariarti et al., 2009
Popu
latio
n ex
pose
d (th
ousa
nds)
SLR SLR and Tide Wave SLR and Land-subsidence
600
500
400
300
200
100
0
0.25 0.5 0.75 1 2.28 2.53 2.78 3.03 0.25 0.5 0.75 1
ScenarioNumber
of people affected(x 1000)
Economic Loss (billion IDR)
Settlement Rice Ponds Harbor/Airport Total
SLR (m)
0.25 31 1.12 0.00 0.37 0.00 1.49
0.50 51 1.49 0.00 0.65 0.00 2.14
0.75 77 1.76 0.00 0.94 0.00 2.69
1.00 114 2.08 0.00 1.24 8.76 12.08
SLR +high tide(m)
2.28 177 1.12 0.00 2.12 0.00 3.25
2.53 244 1.49 0.01 2.13 0.00 3.63
2.78 330 1.76 0.01 2.14 0.00 3.91
3.03 443 2.08 0.01 2.15 8.76 13.00
SLR +landsubsidence(m)
0.25 69 2.54 0.00 0.83 0.00 3.37
0.50 235 6.15 0.00 1.30 0.00 7.45
0.75 360 7.61 0.01 1.67 59.91 69.19
1.00 495 8.77 0.01 1.92 367.53 378.22
CHAPTER IVMeasures to Facilitate Adequate Adaptation to Climate Change
IV-41
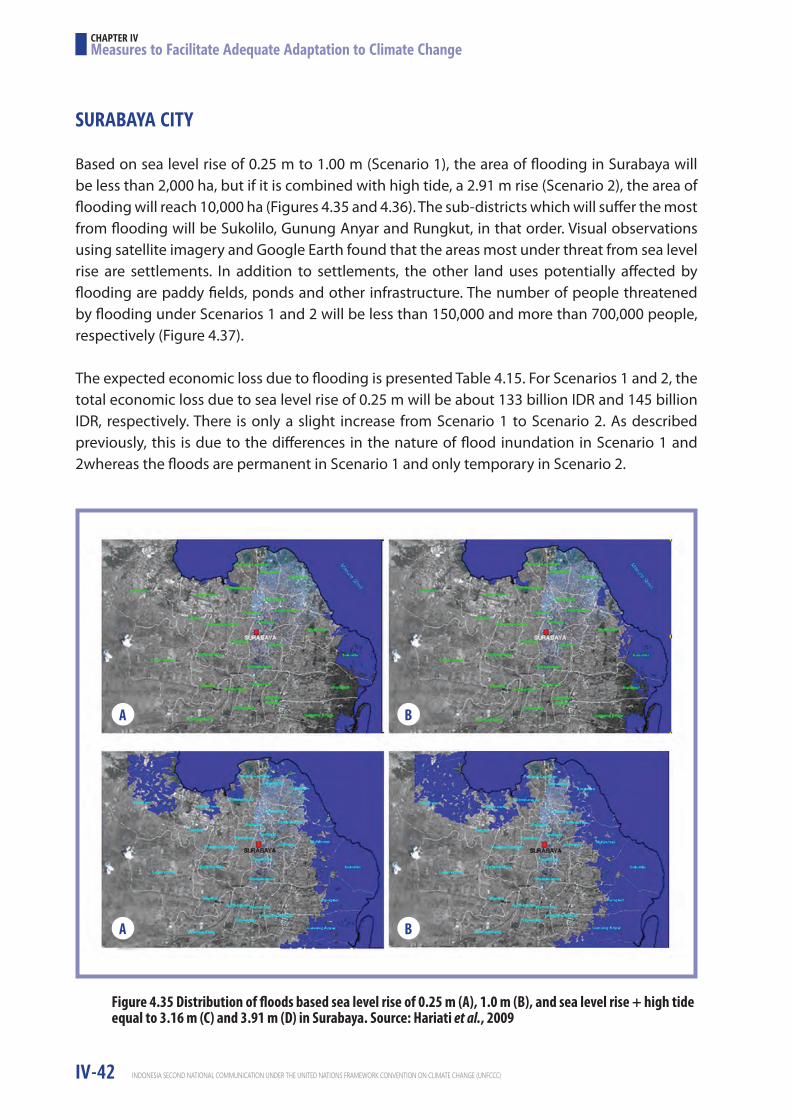
IndonesIa second natIonal communIcatIon under the unIted natIons Framework conventIon on clImate change (unFccc)
SURABAYA CITY
Based on sea level rise of 0.25 m to 1.00 m (Scenario 1), the area of flooding in Surabaya will be less than 2,000 ha, but if it is combined with high tide, a 2.91 m rise (Scenario 2), the area of flooding will reach 10,000 ha (Figures 4.35 and 4.36). The sub-districts which will suffer the most from flooding will be Sukolilo, Gunung Anyar and Rungkut, in that order. Visual observations using satellite imagery and Google Earth found that the areas most under threat from sea level rise are settlements. In addition to settlements, the other land uses potentially affected by flooding are paddy fields, ponds and other infrastructure. The number of people threatened by flooding under Scenarios 1 and 2 will be less than 150,000 and more than 700,000 people, respectively (Figure 4.37).
The expected economic loss due to flooding is presented Table 4.15. For Scenarios 1 and 2, the total economic loss due to sea level rise of 0.25 m will be about 133 billion IDR and 145 billion IDR, respectively. There is only a slight increase from Scenario 1 to Scenario 2. As described previously, this is due to the differences in the nature of flood inundation in Scenario 1 and 2whereas the floods are permanent in Scenario 1 and only temporary in Scenario 2.
Figure 4.35 Distribution of floods based sea level rise of 0.25 m (A), 1.0 m (B), and sea level rise + high tide equal to 3.16 m (C) and 3.91 m (D) in Surabaya. Source: Hariati et al., 2009
A
A
B
B
CHAPTER IVMeasures to Facilitate Adequate Adaptation to Climate Change
IV-42
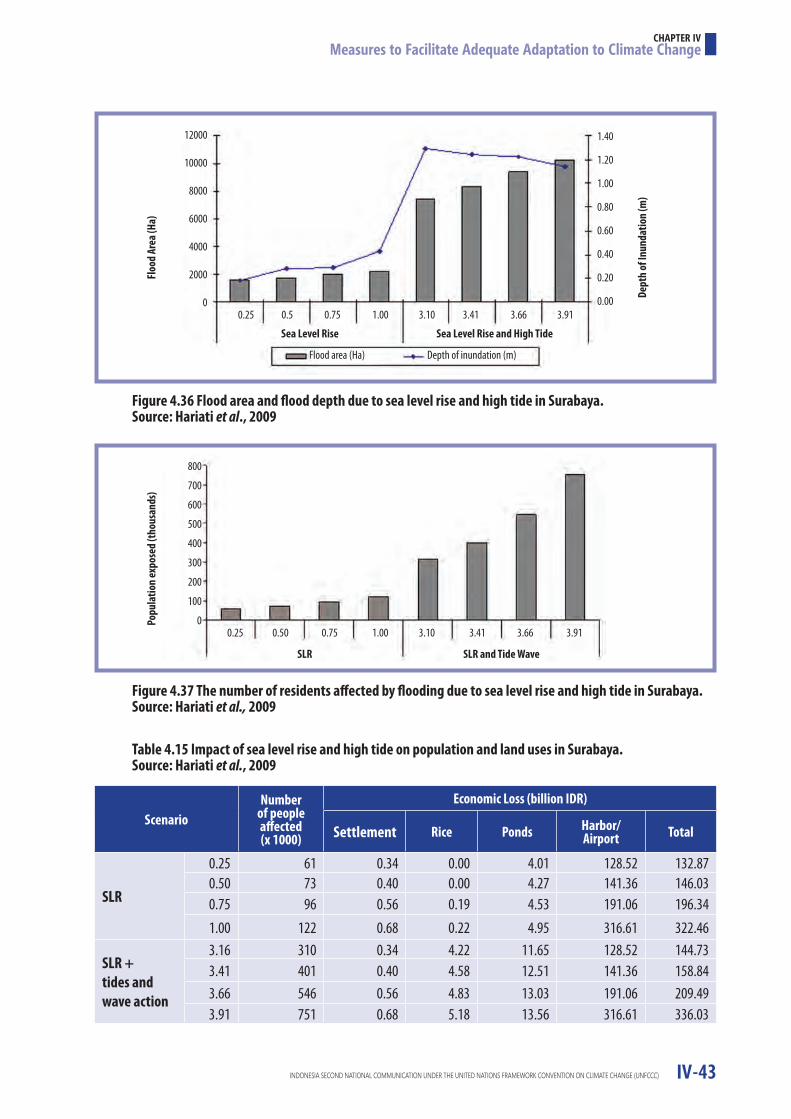
IndonesIa second natIonal communIcatIon under the unIted natIons Framework conventIon on clImate change (unFccc)
Figure 4.36 Flood area and flood depth due to sea level rise and high tide in Surabaya. Source: Hariati et al., 2009
Figure 4.37 The number of residents affected by flooding due to sea level rise and high tide in Surabaya. Source: Hariati et al., 2009
Table 4.15 Impact of sea level rise and high tide on population and land uses in Surabaya.Source: Hariati et al., 2009
Floo
d Ar
ea (H
a)Po
pula
tion
expo
sed
(thou
sand
s)
Dept
h of
Inun
datio
n (m
)
12000
10000
8000
6000
4000
2000
0
800
700
600
500
400
300
200
100
0
0.25 0.5 0.75 1.00 3.10 3.41 3.66 3.91
1.40
1.20
1.00
0.80
0.60
0.40
0.20
0.00
Sea Level Rise
Flood area (Ha) Depth of inundation (m)
Sea Level Rise and High Tide
SLR SLR and Tide Wave
0.25 0.50 0.75 1.00 3.10 3.41 3.66 3.91
ScenarioNumber
of people affected(x 1000)
Economic Loss (billion IDR)
Settlement Rice Ponds Harbor/Airport Total
SLR
0.25 61 0.34 0.00 4.01 128.52 132.870.50 73 0.40 0.00 4.27 141.36 146.030.75 96 0.56 0.19 4.53 191.06 196.341.00 122 0.68 0.22 4.95 316.61 322.46
SLR +tides and wave action
3.16 310 0.34 4.22 11.65 128.52 144.733.41 401 0.40 4.58 12.51 141.36 158.843.66 546 0.56 4.83 13.03 191.06 209.493.91 751 0.68 5.18 13.56 316.61 336.03
CHAPTER IVMeasures to Facilitate Adequate Adaptation to Climate Change
IV-43

IndonesIa second natIonal communIcatIon under the unIted natIons Framework conventIon on clImate change (unFccc)
The increase in sea level by approximately 25 to 50 cm in 2050 and 2100, respectively, as projected by many models, will inundate many parts of the coastal cities of Indonesia. Land subsidence will exacerbate this, increasing the total area that will be permanently inundated. Between 25% and 50% of the total area in coastal cities such as Medan, Jakarta, Semarang, and Surabaya will be permanently underwater. The increase of sea level rise may also inundate the outer islands of the country, thereby reducing the size of Indonesian territory. The analysis suggests that an increase in sea level of 50 cm will not inundate the outer islands of Indonesia permanently, however, combined with tidal patterns in the region, five outer islands will be temporarily inundated. These islands include Alor (next to Timor Leste), Pelampong (next to Singapura), Senua (next to Malaysia), Simuk and Sinyaunyau (next to India).
Some of adaptation measures done in the cities (among other places) to cope with flooding from sea level rise, tides and extreme waves include:
1. Development of dike sequipped with polder system to protect area behind the dike (see Figure 4.38);2. Mangrove rehabilitation in an effort to increase soil surface and reduce wave energy destruction so that the rate of erosion can be reduced; and3. Practicing fish culture using sylvofishery.
Figure 4.38 Construction of a dike to reduce flooding from high tides and extreme waves in East Harbour of Muara Bary, Jakarta. Source: Media Indonesia, 2007
CHAPTER IVMeasures to Facilitate Adequate Adaptation to Climate Change
IV-44

IndonesIa second natIonal communIcatIon under the unIted natIons Framework conventIon on clImate change (unFccc)
4.4.5 HealthThe impact of climate change can be learned from the influence of climate variability, especially related to extreme climatic conditions. The effects of climate variability and change on human life can be grouped into two (Tromp, 1980): (a) direct climate effects (effects on body physiology and psychology) and (b) indirect climate effects (effects on almost all aspects of life and environment that ultimately affect humans). According to Patz et al. (2003) from the World Health Organization (WHO), climate change and variability can affect:
1. mortality, physical injury, physical and mental health (directly); and2. changes in biological processes and ecological impacts on food security such as food sufficiency status and resilience of human body, the quality of water resources, and transmission of infectious diseases and water-borne diseases(indirectly).
Climate change, combined with environmental and behavioral changes in society, causes pressures on public health conditions in Indonesia that have become increasingly difficult to overcome. Indonesia suffers from some vector borne diseases, which may become more severe, especially during extreme climatic periods, as experienced by other developing countries. Transmission periods and distribution areas change and the types of diseases become more varied. Increasing cases and changing patterns of disease distribution during extreme climate periods are an indication of the influence of climate change on public health. Among the ten highest ranked health cases illustrated by the number of patients who were treated at the State Hospitals in Indonesia in 2006 (Table 4.16), outbreaks of dengue fever, malaria, leptospirosis and diarrhea were found to be significantly correlated with the occurrence of extreme climate events associated with ENSO.
Table 4.16 The ten main of health problems recorded by hospitals in Indonesia in 2006 (Source: Ditjen Pelayanan Medik - Ministry of Health, 2006)
No. Health Problem No. of Cases
% of total Health cases
Magnitude Impact of climate change
1. Diarrhea, Gastroenterities infection 177,517 9.95 > 50 %
2. Dengue fever 81,392 3.64 > 80 %
3. Tiphoid and paratifoid 72,804 3.26
4. Obstetrics and gynecology problems 63,580 2,85
5. Intracranial injury 48,645 2.18
6. Fever by unknown cause 46,175 2.07
7. Multiple injury 46,081 2.06
8. Pneumonia 37,634 1.69 > 80 %
9. Malaria 36,865 1.65 > 90 %
10. Dyspepsia 34,029 1.52
CHAPTER IVMeasures to Facilitate Adequate Adaptation to Climate Change
IV-45

IndonesIa second natIonal communIcatIon under the unIted natIons Framework conventIon on clImate change (unFccc)
Cases of dengue fever were found to increase significantly during La Niña years (Figure 4.39) when seasonal rainfall levels were above normal. A significant upward trend in the number of dengue cases was also observed in Java, especially in large cities (Figure 4.40). In other cities, such as Dhaka (Bangladesh), cholera cases correspond significantly to local maxima in ENSO, and this climate phenomenon accounts for over 70% of disease variance (Rodo et al., 2002). In Africa, malaria disease outbreaks were triggered by the occurrence of above normal rainfall (Moji et al., 2002).
To predict how climate change will affect vector borne-diseases such as malaria and dengue fever, the following formula from Reisen (1989) was used:
c : vectorial capacity, the number of infective bites received daily by a single host m : density of vectors in relation to density of host a : proportion of vectors feeding on a host divided by the length of the gonotrophic cycle in days V : vector competence p : daily survival of vectors n : the length of the sporogonic cycle(extrinsic incubation period)
Figure 4.39 Incidence rate of dengue fever and the number of affected cities and districts in Note: 1973, 1988 and 1998 were La Niña years. Source: Ministry of Health.
Incid
ence
Rat
e per
100.
000
Num
ber o
f affe
cted
40
35
30
25
20
15
10
5
0
350
300
250
200
150
100
50
0 68 69 70 71 72 73 74 75 76 77 78 79 80 81 82 83 84 85 86 87 88 89 90 91 92 93 94 95 96 97 98 99 00 01 02 03
CHAPTER IVMeasures to Facilitate Adequate Adaptation to Climate Change
IV-46

IndonesIa second natIonal communIcatIon under the unIted natIons Framework conventIon on clImate change (unFccc)
Figu
re 4.
40 A
nnua
l tre
nd of
den
gue i
ncid
ence
rate
s in
dist
ricts
in Ja
va in
per
iod
betw
een
1992
-200
5 (ca
ses
per 1
00,0
00 p
eopl
e per
year
). So
urce
: MoE
, 200
7b.
Betw
een -
6 and
-3
Betw
een -
3 and
0
Betw
een 0
and 3
Betw
een 3
and 6
Betw
een 6
and 9
Betw
een 9
and 1
2
Betw
een 1
2 and
15
Betw
een 1
5 and
18
Betw
een 1
8 and
21
Betw
een 2
1 and
24
CHAPTER IVMeasures to Facilitate Adequate Adaptation to Climate Change
IV-47

IndonesIa second natIonal communIcatIon under the unIted natIons Framework conventIon on clImate change (unFccc)
The transmission risk or transmission potential was predicted by multiplying the vectorial capacity with a correction factor. The following correction factor for malaria (CFm) was developed based on temperature and rainfall using the following formula (Hidayati et al., 2009):
Where Tg will be equal to 1 if air temperature is higher than the base temperature of the gonotropic cycle (18oC), otherwise, Tg equal to 0. Ts is equal to 1 if air temperature is higher than the base temperature of the sporogonic cycle (10oC), otherwise, Ts equal to 0. Rs is equal to 1 if rainfall is higher than or equal to 25 mm, and equal to R/25 if rainfall is higher than 25 mm. This correction factor was adopted considering the water required for mosquito to lay eggs. For dengue fever, the correction factor was developed based on population density (CFd). The CFd in a particular region is calculated using the following formula (Hidayati et al., 2009):
Where Wd is the weight of population density for that particular region, Wd is equal to 1 for a region with population density (P) of more than 5000 people/km2, 0.75 for a region where 3000 < P < 5000, 0.5for a region where 1000<P<3000 and 1.4 for a region where P<1000 people/km2. Wd¬_Mataram is the weight of population density of Mataram, a district where a detailed survey on dengue vectors was conducted.
The results of the analysis showed the increasing potential of malaria and dengue fever transmission in 2025 and 2055. The increase in 2055 is not significantly different compared with changes in 2025. Changes in the potential of malaria transmission are predicted to rise much higher than the dengue fever transmission. Under the B1 scenario, changes in the value of transmission potential are predicted to be greater than under the conditions based on the A2 scenario (Table 4.17).
The average potential transmissions (TP) of dengue fever and malaria at present, from 2020-2030 and from 2050-2060 are shown in Figures 4.41 and 4.42. The spatial differences in TP value is much greater than the difference over time, so the difference depicted in the map over time cannot be easily observed.
Table 4.17 Percent change in transmission potential for malaria and dengue fever (Hidayati et al., 2009)
ScenarioMalaria Dengue Fever
2025 2055 2025 2055
SRESA2 19 20 4 4
SRESB1 74 85 13 15
Average 46.5 52.5 8.5 9.5
CHAPTER IVMeasures to Facilitate Adequate Adaptation to Climate Change
IV-48
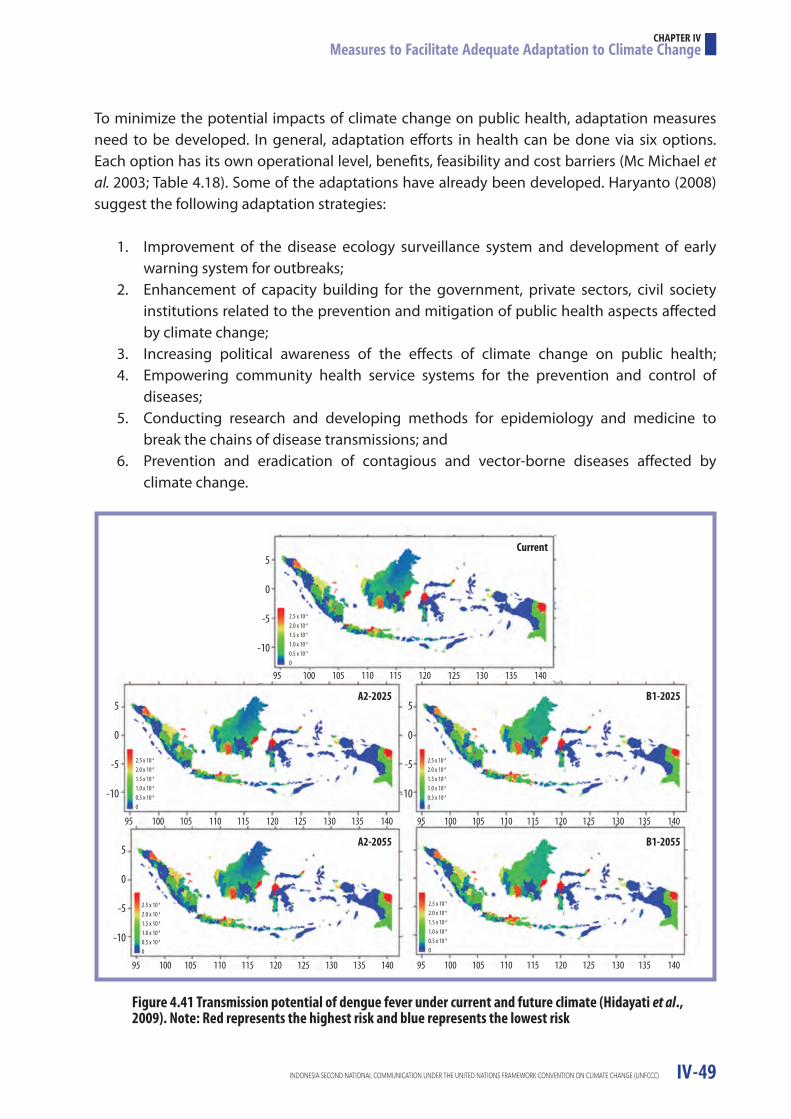
IndonesIa second natIonal communIcatIon under the unIted natIons Framework conventIon on clImate change (unFccc)
To minimize the potential impacts of climate change on public health, adaptation measures need to be developed. In general, adaptation efforts in health can be done via six options. Each option has its own operational level, benefits, feasibility and cost barriers (Mc Michael et al. 2003; Table 4.18). Some of the adaptations have already been developed. Haryanto (2008) suggest the following adaptation strategies: 1. Improvement of the disease ecology surveillance system and development of early warning system for outbreaks; 2. Enhancement of capacity building for the government, private sectors, civil society institutions related to the prevention and mitigation of public health aspects affected by climate change; 3. Increasing political awareness of the effects of climate change on public health; 4. Empowering community health service systems for the prevention and control of diseases; 5. Conducting research and developing methods for epidemiology and medicine to break the chains of disease transmissions; and 6. Prevention and eradication of contagious and vector-borne diseases affected by climate change.
Figure 4.41 Transmission potential of dengue fever under current and future climate (Hidayati et al., 2009). Note: Red represents the highest risk and blue represents the lowest risk
95 100 105 110 115 120 125 130 135 140
95 100 105 110 115 120 125 130 135 140 95 100 105 110 115 120 125 130 135 140
95 100 105 110 115 120 125 130 135 14095 100 105 110 115 120 125 130 135 140
5
0
-5
-10
2.5 x 10⁻⁴
2.0 x 10⁻⁴
1.5 x 10⁻⁴
1.0 x 10⁻⁴
0.5 x 10⁻⁴
0
2.5 x 10⁻⁴
2.0 x 10⁻⁴
1.5 x 10⁻⁴
1.0 x 10⁻⁴
0.5 x 10⁻⁴
0
2.5 x 10⁻⁴
2.0 x 10⁻⁴
1.5 x 10⁻⁴
1.0 x 10⁻⁴
0.5 x 10⁻⁴
0
2.5 x 10⁻⁴
2.0 x 10⁻⁴
1.5 x 10⁻⁴
1.0 x 10⁻⁴
0.5 x 10⁻⁴
0
2.5 x 10⁻⁴
2.0 x 10⁻⁴
1.5 x 10⁻⁴
1.0 x 10⁻⁴
0.5 x 10⁻⁴
0
5
0
-5
-10
5
0
-5
-10
5
0
-5
-10
Current
A2-2025
A2-2055
B1-2025
B1-2055
CHAPTER IVMeasures to Facilitate Adequate Adaptation to Climate Change
IV-49
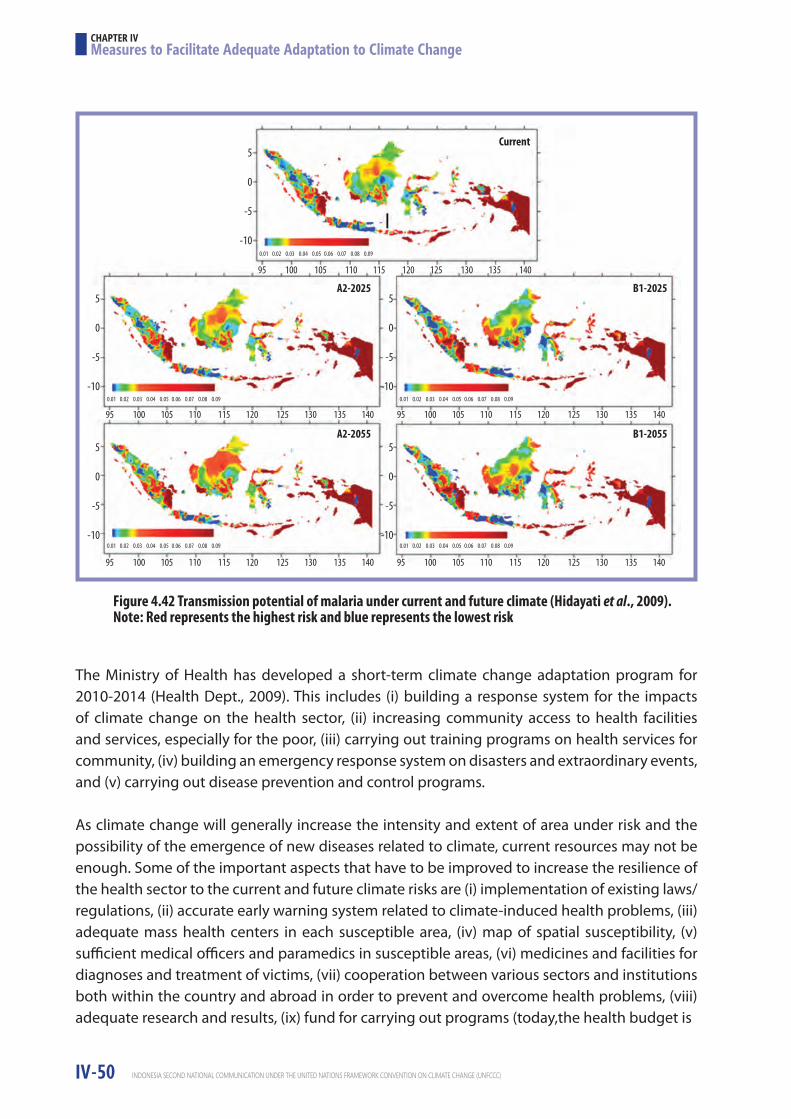
IndonesIa second natIonal communIcatIon under the unIted natIons Framework conventIon on clImate change (unFccc)
The Ministry of Health has developed a short-term climate change adaptation program for 2010-2014 (Health Dept., 2009). This includes (i) building a response system for the impacts of climate change on the health sector, (ii) increasing community access to health facilities and services, especially for the poor, (iii) carrying out training programs on health services for community, (iv) building an emergency response system on disasters and extraordinary events, and (v) carrying out disease prevention and control programs.
As climate change will generally increase the intensity and extent of area under risk and the possibility of the emergence of new diseases related to climate, current resources may not be enough. Some of the important aspects that have to be improved to increase the resilience of the health sector to the current and future climate risks are (i) implementation of existing laws/regulations, (ii) accurate early warning system related to climate-induced health problems, (iii) adequate mass health centers in each susceptible area, (iv) map of spatial susceptibility, (v) sufficient medical officers and paramedics in susceptible areas, (vi) medicines and facilities for diagnoses and treatment of victims, (vii) cooperation between various sectors and institutions both within the country and abroad in order to prevent and overcome health problems, (viii) adequate research and results, (ix) fund for carrying out programs (today,the health budget is
Figure 4.42 Transmission potential of malaria under current and future climate (Hidayati et al., 2009). Note: Red represents the highest risk and blue represents the lowest risk
95 100 105 110 115 120 125 130 135 140
0.01 0.02 0.03 0.04 0.05 0.06 0.07 0.08 0.09
0.01 0.02 0.03 0.04 0.05 0.06 0.07 0.08 0.09
0.01 0.02 0.03 0.04 0.05 0.06 0.07 0.08 0.09
0.01 0.02 0.03 0.04 0.05 0.06 0.07 0.08 0.09
0.01 0.02 0.03 0.04 0.05 0.06 0.07 0.08 0.09
95 100 105 110 115 120 125 130 135 140
95 100 105 110 115 120 125 130 135 140
95 100 105 110 115 120 125 130 135 140
95 100 105 110 115 120 125 130 135 140
5
0
-5
-10
5
0
-5
-10
5
0
-5
-10
5
0
-5
-10
5
0
-5
-10
Current
A2-2025
A2-2055
B1-2025
B1-2055
CHAPTER IVMeasures to Facilitate Adequate Adaptation to Climate Change
IV-50

IndonesIa second natIonal communIcatIon under the unIted natIons Framework conventIon on clImate change (unFccc)
less than 5% of the gross domestic bruto, (x) surveillance systems, (xi) knowledge, awareness and active and fullparticipation of the community and (xi) the capacity to successfully use climate information in managing current and future risks to public health.
Table 4.18 General adaptation options to reduce the potential health impacts of climate change
Adaptation Options Level No. of people that benefit Feasibility Barriers Cost
Interagency co-operation G R N +++ ++ ++ +
Improvements to public health infrastructure NL +++ + + ++
Early warning and epidemic forecasting NL ++ ++ + +
Support for infectious disease control NL ++ +++ + +
Monitoring and surveillance L ++ +++ + +
Integrated environmental management L + ++ + ++
Urban design (including transport systems) L + + ++ ++
Housing, sanitation, water quality L + + + +
Specific technologies (e.g., air conditioning) L + +++ + +
Public education L +++ +++ + +
Notes: G = Global, R = Regional, N = National, L = Local, + + + = large effect, + + = medium effect, + = small effect (Source: McMichael et al. 2003)
CHAPTER IVMeasures to Facilitate Adequate Adaptation to Climate Change
IV-51

IndonesIa second natIonal communIcatIon under the unIted natIons Framework conventIon on clImate change (unFccc)IV-52
IndonesIa second natIonal communIcatIon under the unIted natIons Framework conventIon on clImate change (unFccc)
CHAPTER V
Measures to Mitigate Climate Change
To meet the objectives of the Convention, Indonesia has set up various programs to reduce its emissions. The rate of future greenhouse gas (GHG) emissions under the absence of climate change policy – normally referred to as the base case scenario or business as usual (BAU) – has to be developed. This BAU emissions level will be used to determine how much emissions reduction has been achieved by the country through the implementation of climate change mitigation programs. Baseline emissions should be a key consideration in setting GHG emissions targets as a mitigation strategy to respond to global climate change. At a minimum, the emissions target must be less than the baseline level to induce behavior change and new investment. However, there is substantial uncertainty regarding baseline GHG emissions projection. The use of different assumptions and methodologies may result in different projections. In addition, projecting emissions by sector could not be done independently to some extent. Assumptions used in one sector for developing emissions projections should consider the assumptions used by other sectors. For example, the projected increasing demand for agriculture land (i.e., for rice cultivation) in the future should be captured consistently by the forestry sector in projecting its future deforestation rate. However, in the Second National Communication (SNC), the sectors have not been able to develop integrated emissions projections. The following sections describe briefly the sectoral policy on climate change mitigations and sectoral emissions projections.
5.1 Energy Sector
5.1.1 Policy FrameworkRenewable energy development in Indonesia is supported through National Energy Policy and Energy Law as well as through Green Energy Policy (2004). The Green Energy Policy is basically an effort to develop a “green” energy system characterized by maximum use of renewable energy, efficient use of energy and clean energy technology such as clean coal technology, fuel cell and nuclear energy.
The Government of Indonesia (GOI) has issued a number of policies and regulations that will directly affect the GHG emissions level of the relevant sector. In Energy Law No. 30/2007, there are several provisions, the implementation of which will affect GHG emissions mitigation – for example, provisions that support energy conservation and the development of new and renewable energy through incentive mechanisms. Implementation of the provisions concerning energy conservation and renewable energy development are to be regulated by a government regulation. The operational provision of this government regulation is under preparation (status June 2009).
V-1

IndonesIa second natIonal communIcatIon under the unIted natIons Framework conventIon on clImate change (unFccc)
a. In 2006, the GOI has launched National Energy Policy under Presidential Decree No. 5/2006 (called PERPRES). One major issue of the policy is the energy supply mix target that was to be achieved in 2006. The energy supply mix target developed was based on domestic resource availability and national energy security objectives. The national energy security objectives are to move away from oil due to declining domestic reserves and maximize the utilization of abundantly available domestic energy resour- ces. More specifically, the energy supply mix target for year 2025 is as follows: To re- duce the share of oil from 54.78% (in 2005) to less than 20% b. To increase the share of natural gas from 22.2% (in 2005) to 30% c. To increase the share of coal from 16.77% (in 2005) to more than 33% d. To increase the share of geothermal energy from 2.48% (in 2005) to more than 5% e. To increase the share of other new and renewable energy, particularly biomass, nuclear, hydropower, solar and wind to more than 5% f. To develop biofuel to achieve a share of at least 5% g. To develop liquefied coal to achieve at least 2% (which will start 50,000 barrels per day (bpd) production or 18 million barrels of oil equivalent [MMBOE] in 2020).
It should be noted that although the Government is to increase the share of renewable energy in the national energy supply mix, the share of coal is also to be increased to fulfill the high domestic demand for energy. Therefore, overall, it cannot be guaranteed that total GHG emissions from the supply side will decrease in the future.
In addition to support through the National Energy Policy and Energy Law, renewable energy development in Indonesia is also promoted through the aforementioned Green Energy Policy (2004). The objective of this policy is to develop a “green” energy system that maximizes the use of renewable energy as well as the efficient use of energy and clean energy technology such as clean coal technology, fuel cell and nuclear energy.
In recent developments regarding coal utilization, the Government launched the first crash program for large additional power generation (10,000 MW coal PP), beginning in 2003. The GOI also launched the second crash program for another large additional power generation with 10,000 megawatts (MW) (68% is coal polypropylene [PP], 22% is renewable, and the remaining is 10% is natural gas), beginning in 2007. It can be concluded that in power generation, the contribution from renewable sources will remain low (11% out of the additional 20,000 MW).
The latest policy that supports the development of biofuel in Indonesia is the Biofuel Price Subsidy (2010), where GOI has launched subsidy for biofuel and the obligation of Pertamina (the national oil company) to buy domestic bofuel production. Before the subsidy policy was launched, the Ministry of Energy and Mineral Resources (MEMR) released MEMR Decree No. 32/2008 to regulate (i) supply, utilization and trade of biofuel and (ii) obligation of biofuel utilization in the transport, industry and power sectors. The obligation will be implemented in stages. For example, the biofuel obligation in the transportation sector was 1% in 2009, increasing up to 15% in 2025. This target will be increased every year so that in 2025, the total
CHAPTER VMeasures to Mitigate Climate Change
V-2

IndonesIa second natIonal communIcatIon under the unIted natIons Framework conventIon on clImate change (unFccc)
contribution of biofuel in the energy supply mix will reach 5% of the total energy supply in Indonesia (i.e., ± 22 billion liters), as written in the National Energy Policy.
The subsequent regulations and policies supporting biofuel development include:
• President Instruction No. 1/2006 concerning biofuel supply and utilization and President Instruction No. 10/2006 concerning the establishment of a national team for biofuels development for poverty alleviation and unemployment reduction; the main objectives of these policies are to reduce dependency on fossil fuels and to strengthen national ener- gy security;
• National Standard (SNI) No. 04-7182-2006 for biodiesel, SNI No. DT27-0001-2006 for bioethanol and Director General for Oil and Gas Decree no. 13483K/24/DJM/2006 concer- ning Biodiesel Specification for Domestic Market;
• Income tax facility and accelerated amortization for investment in specified business sectors or other areas (Government Regulation No. 1/2007) where renewable energy is included in this category;
• Credit facility for bio-energy development and revitalization of plantations (Minister of Finance Decree No.117/PMK.06/2006) for investment and working capital for activities that support efforts to achieve food and energy security, including biofuel develop- ment (Minister of Finance Decree No.79/PMK.05/2007).
To boost the utilization of renewable energy for power generation, the GOI has launched several regulations with provisions related to renewable energy. Specific regulations that govern the sale of electricity generated using renewable energy and/or excess power by an entity to PT PLN (the national electricity enterprise) are:
• MEMR Decree No. 1122/2002 concerning small-scale distributed renewable power genera- tion that regulates small-scale power generation (< 1 MW) using renewable energy, in which, if an entity (i.e., small enterprises) wants to sell electricity generated using rene- wable energy to PLN (the country’s public electric utility), then PLN is obliged to pur- chase the electricity.
• MEMR Decree No. 02/2006 concerning medium-scale renewable power that regulates medium-scale power generation (1-10 MW) using renewable energy or excess power from captive power plants. If an entity (enterprise) wants to sell electricity generated using renewable energy to PLN (the country’s public electric utility), then PLN is obliged to purchase the electricity.
• Government Regulation No. 26/2006 concerning supply and utilization of electricity (revi- sion of Government Regulation No. 10/1989) with new provisions, such as open access
CHAPTER VMeasures to Mitigate Climate Change
V-3

IndonesIa second natIonal communIcatIon under the unIted natIons Framework conventIon on clImate change (unFccc)
for transmission, direct purchase/without bidding for renewable and excess power or under emergency situations. Procedures for power purchase and transmission rental are covered in the Ministerial Decree No. 001/2006. One of the articles in the decree regulates procedures for the purchase of electricity from renewable sources. PLN is allowed to do direct appointment (without bidding procedures) for the purchase of electricity that is generated using renewable energy. For non-renewable electricity, PLN’s power purchase is based on competition (bidding process).
There are also a number of policies/laws related to energy efficiency (EE). However, the current policy (National Policy 2006) does not explicitly state or mention the target of EE achievement, affected market players of EE or main features of EE. There are no incentives or penalties mentioned in the current policies/laws that are related to EE. The latest national energy policy (Presidential Regulation No. 5/2006) mentions the need to pursue energy conservation in all sectors. The policy aims to reach energy elasticity equal to less than 1 by 2025. The Government is also implementing an energy pricing policy whereby energy prices are to be adjusted gradually to reflect the economic value of energy. Staging and adjustment of energy prices are to be designed in such a way that it would promote and optimize energy diversification. With regard to incentives, the Government is to provide incentives for efforts leading to the implementation of energy conservation and for the development of alternative energy.
5.1.2 Emissions Projections and Mitigation MeasuresIn the SNC, energy supply demand projections are used as sources of activity data in the estimation of GHG emissions. The energy supply demand projection model used in the SNC is the same model used in the Indonesian Energy Outlook 2010-2030 (e.g., Dynamic Model developed by Institut Teknologi Bandung, 2009). The model is used to develop energy supply-demand projections under the BAU scenario and mitigation (CLIMATE) scenario. The model is principally similar to other energy projection models (i.e., the Econometric Model, MARKAL-MAED, LEAP, etc.), where the drivers of energy development are gross domestic product (GDP) and population. The GDP and population growth scenario will determine energy demand growth, which in turn will determine energy supply and GHG emissions level. The relationship between energy supply and demand is determined by energy type and conversion technology.
GDP growth is one of the socioeconomic indicators projected by the Government of Indonesia through BAPPENAS (National Summit, 2009). BAPPENAS has released the target of future Indonesian Economic Development for 2015. The GDP of Indonesia is assumed to grow at an annual rate of 5.5% (2005–2010), 6.6% (2010-2014) and reaching 7.2% in 2015. After 2015, it is rather difficult to determine the GDP growth. Several studies assume the average growth in the GDP will be approximately 7.2% between 2015-2030. This figure is slightly higher than those commonly used by other studies (i.e. about 7%). The estimate of the population growth in the SNC used the estimate from the National Bureau of Statistic (BPS, 2009). The population of Indonesia is estimated to reach 273 million in 2025 (growing at 1.05 %/year, on average, by
CHAPTER VMeasures to Mitigate Climate Change
V-4

IndonesIa second natIonal communIcatIon under the unIted natIons Framework conventIon on clImate change (unFccc)
2025). Assuming that in the future the population will keep growing at the same rate at 0.94%/year, on average, from 2020-2025, it is projected that the population will reach 286 million by 2030.
Based on the above assumptions, the MEMR developed energy supply/demand projections for Indonesia in the Indonesian Energy Outlook 2010-2030 (Pusdatin-MEMR, 2009b). Three energy projection scenarios from the Indonesian Energy Outlook 2010-2030 were used in the SNC for estimating GHG projections for the energy sector – BAU, mitigation-1 (CLIMATE 1), and mitigation-2 (CLIMATE 2).
The assumptions used in the development of the BAU scenario from the Indonesian Energy Outlook 2010-2030 were developed using existing policies and plans that have been committed by the GOI, namely Crash Programs I and II for Energy Development that have been covered under RUPTL (Business Plan of Electricity Supply) PT PLN 2009-2018 (PT. PLN, 2009), RUKN (General Plan of National Electricity) 2008-2027 (MEMR, 2008), and road map of biofuel development and utilization (although the biofuel development and utilization is assumed still not maximal). Under this BAU scenario, the projected energy supply is shown in Figure 5.1, while the capacity of power plants that need to be developed is presented in Figure 5.2.
Figure 5.1 Energy projections by type of energy under the BAU scenario, 2010-2030
5,000
4,000
3,000
2,000
1,000
-
Wind
Solar
Biofuel
Biomass
Geothermal
Hydro
CBM
Natural Gas
Oil
Coal Liquefaction
Coal (Industry + Power)
Million BOE
2010
2012
2014
2016
2018
2020
2022
2024
2026
2028
2030
CHAPTER VMeasures to Mitigate Climate Change
V-5

IndonesIa second natIonal communIcatIon under the unIted natIons Framework conventIon on clImate change (unFccc)
In the GHG emissions projections under BAU, it was assumed that development will continue according to the historical trend. The BAU scenario shows how GHG emissions will grow over time in the absence of mitigation policy interventions. Natural energy efficiency and existing national (government and private) plans are considered as components of BAU scenario. The resulting emissions from this scenario in 2025 would reach approximately 1.5 carbon dioxide equivalents (CO2e), respectively. The rate of annual projected emissions by fuel types and sectors are presented in Figures 5.3 and 5.4, respectively.
The assumptions used for the GHG emissions projections under mitigation scenarios (CLIMATE 1 and 2) are similar to the BAU case with additional assumptions that there will be additional efforts related to energy conservation and new and renewable energy development (i.e., enhance geothermal program, micro-hydro, biofuel, biomass waste to energy, solar PV, wind energy and coal bed methane [CBM]).
Another mitigation scenario used is Presidential Regulation No. 5/2006 - Blue Print PEN 2010, or the PERPRES scenario. The energy supply projection under the PERPRES scenario was developed with an objective to meet energy security. The target of renewable energy in the supply mix is more than 17.93% of the total energy supply. The shift of new and renewable energy from 4.3% in 2005 to 17.93% in 2025 is positive for climate change mitigation, however, the increase in coal share from 19.4% in 2005 to 34% coal and 3.56% liquefied coal by 2025 will negatively
Figure 5.2 Power plant projections by fuel type under the BAU scenario, 2010-2030
250
200
150
100
50
-
Wind
Solar
Landfil Gas
MSW
Agro-Waste
Geothermal
Hydro Power
Biofuel
Diesel
Natural Gas
Steam Coal
Giga Watt20
10
2012
2014
2016
2018
2020
2022
2024
2026
2028
2030
CHAPTER VMeasures to Mitigate Climate Change
V-6

IndonesIa second natIonal communIcatIon under the unIted natIons Framework conventIon on clImate change (unFccc)
Figure 5.3 Projection of GHG emissions generation by fuel type under the BAU scenario, 2010-2030
Figure 5.4 Projection of GHG emissions generation by sector under the BAU scenario, 2010-2030
Natural Gas
Oil
Coal
AMC
Households
Commercial
Transportation
Industry
Power
Giga Ton
Giga Ton
2.5
2.0
1.5
1.0
0.5
0.0
2.5
2.0
1.5
1.0
0.5
0.0
2010
2012
2014
2016
2018
2020
2022
2024
2026
2028
2030
2010
2012
2014
2016
2018
2020
2022
2024
2026
2028
2030
CHAPTER VMeasures to Mitigate Climate Change
V-7

IndonesIa second natIonal communIcatIon under the unIted natIons Framework conventIon on clImate change (unFccc)
affect climate change mitigations so that there is little net decrease in GHG emissions. The energy supply mix under the PERPRES scenario is formulated based on least cost and resource availablity.
Both the CLIMATE 1 and CLIMATE 2 mitigation scenarios and PERPRES scenario have excluded advanced clean coal technologies (i.e., integrated gasification combined cycle [IGCC]) and carbon capture and sequestration [CCS] because these technologies are considered to be very expensive. The clean coal technologies considered under both scenarios are fluidized bed, sub-critical and super-critical coal power plants.
The primary energy supply mix, sectoral energy demand, and power plant development projections along with the carbon dioxide (CO2) emissions under the BAU, the two mitigation scenarios (CLIMATE 1 and CLIMATE 2), and PERPRES scenario (for comparison) are presented in Table 5.1, Table 5.2, Table 5.3, Figure 5.5, and Figure 5.6. Table 5.1 presents the projection of primary energy supply mix (by fuel type), Table 5.2 presents the projection of final energy demand by sector and Table 5.3 presents demand projection of installed capacity of power generation. These projections are developed using dynamic models with several assumptions, as was discussed previously.
Figures 5.5 and 5.6 show that there are potential reduction in the CO2 emissions projections under the CLIMATE 1, CLIMATE 2 and PERPRES scenarios compared to the BAU scenario. The potential of CO2 emissions reductions for each scenario is presented in Figure 5.7. The potential CO2 emissions reduction by 2020 under the CLIMATE 1 scenario is approximately 0.18 Gton CO2e, or approximately 18% of the BAU emissions; under the CLIMATE 2 scenario, the potential emissions reduction is approximately 0.28 Gton CO2e, or approximately 28% of the BAU emissions. Under the PERPRES scenario, the CO2 emissions reductions by 2020 will reach 0.1 Gton CO2e, or 10% of BAU emissions. By 2025, the CLIMATE 1, CLIMATE 2, and PERPRES scenarios will result in a 20% reduction (0.3 GTon CO2e), 31% reduction (0.47 Gton CO2e) and 21% (0.31 Gton CO2e), respectively.
CHAPTER VMeasures to Mitigate Climate Change
V-8

IndonesIa second natIonal communIcatIon under the unIted natIons Framework conventIon on clImate change (unFccc)
Tabl
e 5.1
Pro
ject
ion
of en
ergy
supp
ly m
ix u
nder
BAU
, CLI
MAT
E and
PER
PRES
scen
ario
s (m
illio
n BO
E)
Type
En
ergy
2010
2015
2020
2025
2030
Coal
353
353
353
330
600
462
375
482
858
669
495
725
1,412
1,078
751
1,007
2,201
1,677
1,079
-
Coal Li
quefa
ction
--
--
--
--
3636
-30
110
110
-91
218
218
--
Oil
422
422
422
495
538
515
514
555
699
635
651
627
840
743
786
589
997
841
909
-
Natu
ral G
as20
720
720
726
930
227
531
434
949
441
546
041
768
752
767
861
684
166
497
1-
CBM
--
--
77
711
1818
1843
6479
7996
9810
510
5-
Hydr
o45
4545
1565
6878
2399
100
117
3210
211
012
939
110
121
140
-
Geot
herm
al10
1010
3636
4145
9057
6669
116
6174
7918
466
8290
-
Biom
assa
4141
41-
4039
47-
3835
53-
3741
58-
3452
67-
MSW
-2
--
-22
--
-65
-1
-11
1-
1-
167
--
Biof
uel
2-
234
60
2375
150
6617
047
011
329
883
016
9-
Solar
--
--
--
--
--
11
-0
11
-0
2-
Wind
--
--
--
--
--
--
--
-1
--
--
Nucle
ar.
..
..
..
..
..
..
..
..
.12
-
Tota
l1.0
801.0
801.0
801.1
791.5
911.4
291.4
021.5
852.3
142.0
381.9
312.1
623.3
382.8
712.6
742.9
234.6
493.9
273.5
43-
Efficie
ncy
--
--
-10
%12
%-
-12
%17
%-
-14
%20
%-
-16
%24
%-
BaU Outlock
CLIMATE 1 Outlock
CLIMATE 2 Outlock
PERPRESS 2009
BaU Outlock
CLIMATE 1 Outlock
CLIMATE 2 Outlock
PERPRESS 2009
BaU Outlock
CLIMATE 1 Outlock
CLIMATE 2 Outlock
PERPRESS 2009
BaU Outlock
CLIMATE 1 Outlock
CLIMATE 2 Outlock
PERPRESS 2009
BaU Outlock
CLIMATE 1 Outlock
CLIMATE 2 Outlock
PERPRESS 2009
CHAPTER VMeasures to Mitigate Climate Change
V-9
Note
s: Pr
imar
y ene
rgy s
upply
mix
unde
r Per
pres
s sce
nario
2010
– 20
25

IndonesIa second natIonal communIcatIon under the unIted natIons Framework conventIon on clImate change (unFccc)
Tabl
e 5.3
Pro
ject
ion
of in
stal
led
capa
city d
eman
d of
pow
er g
ener
atio
n un
der B
AU, C
LIM
ATE 1
and
CLIM
ATE 2
scen
ario
s (in
MW
)
Note
: The
re is
no po
wer g
ener
ation
proje
ction
plan
unde
r the
PERP
RES s
cena
rio fo
r 201
0-20
30
Tabl
e 5.2
Pro
ject
ion
of se
ctor
al en
ergy
dem
and
unde
r BAU
, CLI
MAT
E and
PER
PRES
scen
ario
s (m
illio
n BO
E)
Sect
or
Activ
ity20
1020
1520
2020
2520
30BA
UCL
IMAT
E 1CL
IMAT
E 2BA
UCL
IMAT
E 1CL
IMAT
E 2BA
UCL
IMAT
E 1CL
IMAT
E 2BA
UCL
IMAT
E 1CL
IMAT
E 2BA
UCL
IMAT
E 1CL
IMAT
E 2Tra
nspo
rtatio
n22
522
522
531
731
631
647
246
846
764
565
362
484
081
478
0Ind
ustry
386
386
386
564
512
505
828
691
649
1,124
915
863
1,423
1,138
1,076
Hous
ehold
s27
327
327
331
330
930
937
036
236
241
740
240
244
041
741
7Co
mm
ercia
l47
4747
5451
5068
5957
8776
7312
710
810
4AC
M39
3939
4646
4654
5454
6565
6686
8686
Tota
l97
097
097
01,2
921,2
331,2
261,7
901,6
331,5
892,3
392,0
932,0
282,9
152,5
622,4
63Effi
cienty
Poten
tial
- Tra
nspo
rtatio
n0%
0%1%
1%2%
3%3%
7%- I
ndus
try9%
10%
17%
22%
19%
23%
20%
24%
- Hou
seho
lds1%
1%2%
2%3%
3%5%
5%- C
omm
ercia
l6%
7%11
%15
%13
%16
%15
%18
%- A
CM0%
0%0%
0%0%
0%0%
0%TO
TAL
5%5%
9%11
%10
%13
%12
%16
%
Sect
or
Activ
ity20
1020
1520
2020
2520
30BA
UCL
IMAT
E 1CL
IMAT
E 2BA
UCL
IMAT
E 1CL
IMAT
E 2BA
UCL
IMAT
E 1CL
IMAT
E 2BA
UCL
IMAT
E 1CL
IMAT
E 2BA
UCL
IMAT
E 1CL
IMAT
E 2St
eam
Coal
19,89
019
,890
19,89
037
,032
26,39
918
,997
54,83
542
,404
28,36
310
4,418
82,45
853
,180
178,1
4714
2,260
88,62
7Na
tura
l Gas
12,87
512
,875
12,87
515
,756
14,47
419
,974
25,41
421
,832
30,45
831
,604
26,87
449
,011
37.62
631
,657
76,02
0Di
esel
3,221
3,221
3,221
3,094
2,985
2,998
2,943
2,621
2,798
2,806
2,278
2,295
2,677
2,093
1,894
Biof
uel
3333
3357
184
296
6346
361
487
569
765
9762
981
2Hy
dro
3,746
3,746
3,746
5,382
5,702
6,513
8,211
8,313
9,750
8,479
9,177
10,73
79,1
7110
,091
11,65
1Ge
othe
rmal
1,093
1,093
1,093
3,875
4,359
4,776
6,060
7,053
7,333
6,475
7,866
8,463
7,055
8,706
9,550
Agro
-Was
te10
010
010
095
708
701
172
1,237
1,186
212
1,785
1,718
271
2,304
2,222
MSW
--
-5
55
2020
2040
4040
5050
50La
ndfil
Gas
--
--
--
33
310
1010
2020
20So
lar12
1212
1919
3140
4096
6262
178
7676
288
Wind
11
13
33
77
812
1217
2020
30Nu
clear
4,000
TOTA
L40
,969
40,96
940
,969
65,31
854
,838
54,29
597
,768
83,99
380
,630
154,2
0413
1,130
126,4
1523
5,210
197,9
0619
5,164
CHAPTER VMeasures to Mitigate Climate Change
V-10

IndonesIa second natIonal communIcatIon under the unIted natIons Framework conventIon on clImate change (unFccc)
Figure 5.5 GHG emissions projections by fuel type under BAU, CLIMATE and PERPRES scenarios
Figure 5.6 Total GHG emissions projections under BAU, CLIMATE and PERPRES scenarios
Natural Gas
Oil
Coal
GTonCO2e
GTonCO2e
2010 2015 2020 2025 2030
2.500
2.000
1.500
1.000
0.500
-
2.50
2.00
1.50
1.00
0.50
-
BaU
Clim
ate 1
Clim
ate 2
PEPR
ESS
BaU
Clim
ate 1
Clim
ate 2
PEPR
ESS
BaU
Clim
ate 1
Clim
ate 2
PEPR
ESS
BaU
Clim
ate 1
Clim
ate 2
PEPR
ESS
BaU
Clim
ate 1
Clim
ate 2
PEPR
ESS
2010
2011
2012
2013
2014
2015
2016
2017
2018
2019
2020
2021
2022
2023
2024
2025
2026
2027
2028
2029
2030
PEPRESSCLIMATE 1
BaUCLIMATE 2
CHAPTER VMeasures to Mitigate Climate Change
V-11

IndonesIa second natIonal communIcatIon under the unIted natIons Framework conventIon on clImate change (unFccc)
In selecting mitigation measures, factors considered were as follows: (i) sectors that consumed a significant amount of fossil energy, especially with high GHG emissions, such as coal and other fossil fuels, (ii) magnitude of GHG emissions reduction potential of a technology for a given demand and (iii) maturity of the technology to be used for mitigation. Based on these considerations, several mitigation options have been selected, as shown in Table 5.4. Not all of these options are included in the CLIMATE scenarios. The CLIMATE scenarios are developed by considering the domestic resources potential and technological and financial limitations in acquiring more advanced mitigation approaches, such as CCS and advanced clean coal technology.
In addition to that, the selected options also consider that Indonesia is not an Annex I country, and therefore has no international obligation to reduce GHG emissions. However, the GOI released a statement that Indonesia will reduce up to 26% by 2020 with domestic capacity and will further reduce up to 41% by 2020 with international support; this statement is a non-binding GHG emissions reductions statement. It should be noted that the selected mitigation options could be sufficient to achieve the above mentioned emissions reduction statement (26% by 2020). Emissions reductions, which can be achieved from the selected mitigation options under the CLIMATE scenario, are the differences between the emissions projections under the BAU scenario and the emissions projections under the CLIMATE scenarios. The GHG emissions difference level between the BAU scenario and CLIMATE scenarios is more appropriately referred to as “emissions avoidance.”
Figure 5.7 GHG emissions reduction potential under BAU, CLIMATE 1, CLIMATE 2, and PERPRES scenarios
GTonCO2e % reduction
0.80
0.70
0.60
0.50
0.40
0.30
0.20
0.10
-
40%
35%
30%
25%
20%
15%
10%
5%
0%
2015 2020 2025 2030
CLIMATE 1
CLIMATE 1
CLIMATE 2
CLIMATE 2
PERPRES
PERPRES
CHAPTER VMeasures to Mitigate Climate Change
V-12

IndonesIa second natIonal communIcatIon under the unIted natIons Framework conventIon on clImate change (unFccc)
Tabl
e 5.4
Sele
cted
miti
gatio
n op
tions
Sect
orSu
b-se
ctor
Miti
gatio
n Op
tions
Ener
gy
Supp
lyPo
wer g
ener
ation
a. I
nclud
e the
ener
gy sy
stem
with
fewe
r GHG
emiss
ions t
hat h
as no
t bee
n sele
cted i
n BAU
, suc
h as b
iomas
s-bas
ed po
wer (
electr
icity
gen
erat
ion fr
om m
unici
pal s
olid w
aste
[MSW
] inc
inera
tion,
, lan
dfill g
as (L
FG),
liquid
and s
olid b
iomas
s was
te, e
tc.),
solar
, wind
,
etc.
, alth
ough
the s
hare
of th
ese t
ypes
of en
ergy
is st
ill re
lative
ly ve
ry sm
all;
b. In
creas
e the
shar
e of n
ew an
d ren
ewab
le en
ergy
that
has b
een i
nclud
ed in
BAU,
but i
s stil
l belo
w th
e lev
el of
PERP
RES t
arge
t, su
ch
a
s geo
ther
mal
and n
uclea
r ene
rgy;
c. In
creas
e the
use o
f effi
cient
tech
nolog
y in p
ower
plan
ts, su
ch as
circu
lated
coal
fluidi
zed b
ed co
mbu
stion
(CFB
C), s
ub- o
r sup
er-
critic
al po
wer p
lants,
coal
IGCC
, gas
com
bined
cycle
, com
bined
heat
and p
ower
; d.
Deve
lop te
chno
logy t
hat i
s app
ropr
iate f
or ut
ilizing
fuels
with
low
GHG
emiss
ions (
i.e., n
atur
al ga
s); an
d e.
CCS t
echn
ology
appli
catio
n for
larg
e coa
l pow
er pl
ants.
Oil a
nd ga
s pro
ducti
on
and r
efine
ries
Gas fl
aring
and v
entin
g red
uctio
n
Ener
gy En
d Us
erTra
nspo
rtatio
n
a. I
ncre
ase b
iofue
l dev
elopm
ent e
fforts
for p
erso
nal v
ehicl
es
b. I
ncre
ase t
he us
e of c
ompr
esse
d nat
ural
gas a
nd liq
uified
petro
leum
gas (
LPG)
in tr
ansp
orta
tion
c.
Intro
duce
fuel
cell v
ehicl
es an
d elec
tric c
ars/m
otor
cycle
s d.
Pro
mot
e mas
s rap
id tra
nspo
rt (M
RT)
e.
Traffi
c man
agem
ent,
etc.
(App
endix
3 pr
esen
ted a
polic
y and
air c
ontro
l pro
gram
issu
ed by
the D
irecto
rate
Gen
eral
of
Land
Tran
spor
tatio
n, M
inistr
y of T
rans
porta
tion t
o red
uce a
ir poll
ution
due t
o exh
aust
gas f
rom
vehic
les)
Indu
stry
a. I
ncre
ase t
he us
e of m
ore E
E equ
ipmen
t or t
echn
ology
(i.e.
, mor
e effi
cient
conv
ersio
n pro
cess,
mor
e effi
cient
com
busti
on sy
stem
,
var
iable
spee
d elec
tric m
otor
s, et
c.)
b. I
ncre
ase t
he us
e of m
ore e
fficie
nt m
ater
ial co
nver
sion p
roce
ss c.
In
creas
e the
use o
f rec
ycled
mat
erial
s, et
c. d.
Int
rodu
ce co
-pro
cessi
ng or
co-fi
ring t
echn
ology
Resid
entia
l and
co
mm
ercia
l end
uses
BAU,
CLIM
ATE 1
and C
LIMAT
E 2 sc
enar
ios an
d is t
here
fore
also
cons
idere
d as a
miti
gatio
n opt
ion
CHAPTER VMeasures to Mitigate Climate Change
V-13

IndonesIa second natIonal communIcatIon under the unIted natIons Framework conventIon on clImate change (unFccc)
Under the CLIMATE mitigation scenarios, there are three important options to reduce GHG emissions levels: (i) efficiency energy (demand side as well as power supply side), (ii) promoting biofuel to replace the utilization of fossil fuels (refinery products) and (iii) the utilization of renewable energy in power generation (geothermal, biomass based fuels, hydro, etc.). Detailed mitigation scenarios and investment costs will be discussed in the following sub-sections.
5.1.3 Mitigation CostsThe estimated investment costs needed for implementation of the mitigation options includes (i) development of biofuel production to supply energy demand in the Indonesian transportation sector, (ii) development of advanced coal power plants (more efficient) and less GHG emitting power plants (i.e., natural gas power generation), (iii) develop other renewable energy (e.g., geothermal, hydropower, biomass-based power plants, municipal solid waste [MSW]-based power plants, etc.) and (iv) increasing efficiency on the energy demand side.
Biofuel Production for the Transportation and Industrial Sectors Recently, biofuels have become one of the most important forms of energy in Indonesia, particularly in the transportation and industry sectors. According to the GOI’s plan, the future demand of biofuel in the transportation and industry sectors will be supplied from domestic production. Figure 5.8 presents the demand of biofuel in Indonesia and total investment for the production systems. The total investment cost is estimated based on the investment cost of 30 million USD per 300,000 tons per year. Table 5.5 presents additional investment costs and the potential reduction of GHG emissions.
Figure 5.8 Total projected demand of biofuel in the transportation and industrial sectors and estimated investment cost of the biofuel production system
Transportation Industry Investment Cost
Million Ton Biofuels Million USD
2010 2015 2020 2025 2030
25
20
15
10
5
-
2,500
2,000
1,500
1,000
500
-
BaU
Clim
ate 1
Clim
ate 2 Ba
U
Clim
ate 1
Clim
ate 2 Ba
U
Clim
ate 1
Clim
ate 2 Ba
U
Clim
ate 1
Clim
ate 2 Ba
U
Clim
ate 1
Clim
ate 2
CHAPTER VMeasures to Mitigate Climate Change
V-14

IndonesIa second natIonal communIcatIon under the unIted natIons Framework conventIon on clImate change (unFccc)
Advanced (more efficient) coal power plants Table 5.6 presents new investments for advanced (more efficient) coal power plants under the BAU, CLIMATE1 and CLIMATE 2 scenarios. The size and investments made for new additional power plants under CLIMATE 1 and 2 are both lower than under the BAU scenario. The reduced use of coal plants is the result of two factors: reduced demand for power plant capacity due to conservation efforts and the shift of power plants from coal-based to natural gas power plants (i.e, less GHG emitting power plants) and to renewable power plants (geothermal, hydropower, solar, wind, biofuel, biomass wastes). The table also shows that new coal power plants in Indonesia in the neear future (until 2030) will consist of two types: advanced coal (efficiency of 38%) and conventional coal (efficiency of 32%). As a result of reduced use of coal power plants and the use of advanced coal power plants GHG emissions from coal power plants for the CLIMATE 1 and CLIMATE 2 scenarios are both lower than that of the BAU.
Table 5.5 Additional demand of biofuel and GHG emissions reduction potential and cost
Table 5.6 New investments for advanced (more efficient) coal power plants under the BAU, CLIMATE1 and CLIMATE 2 scenarios
YearBiofuel Add. Demand
(from 2010), BEOReduction Potential,
Ton CO2eAdditional Cost,
Million USD Av. Reduction Cost, USD/ton
BAU CLIMATE 1 CLIMATE 2 CLIMATE 1 CLIMATE 2 CLIMATE 1 CLIMATE 2 CLIMATE 1 CLIMATE 22015 3,095,690 17.579.525 17,541,791 6,314,952 6,298,500 203 202 32.11 32.112020 12,079,552 54.632.308 54.197.991 12,238,050 12,065,140 393 387 32.11 32.112025 43,808,831 98,695,064 98,100,635 5,377,396 5,307,587 173 170 32.11 32.112030 79,658,232 155,583,732 154,842,779 9,173,120 9,109,236 295 292 32.11 32.11
CHAPTER VMeasures to Mitigate Climate Change
V-15
Year
BAU CLIMATE 1 CLIMATE 2
Installed Cap New power plant, M/V
Investment EmissionInstalled
Cap New plant, M/VInvestment Emission
Installed Cap New plant, M/V
Investment EmissionAdvanced Conventional Advanced Conventional MW Advanced Conventional
MW Eff 38% Eff 32% million USD
mill.ton CO2e MW Eff 38% Eff 32% million
USDmill.ton
CO2e Climate 2 Eff 38% Eff 32% million USD
mill.ton CO2e
2010 19,890 133 19,890 133 19,890 133 2011 24,131 - 4,241 5,089 161 19,890 - - 110 19,890 98 2012 28,630 - 4,499 5,399 191 19,890 - - 125 19,890 108 2013 32,249 - 3,619 4,343 215 22,359 - 2,469 2,962 149 19,890 117 2014 35,043 - 2,794 3,353 234 23,897 1,539 - 3,077 155 19,890 118 2015 37,032 - 1,989 2,387 247 26,399 2,502 - 5,004 171 19,890 123 2016 38,896 - 1,864 2,237 260 28,329 695 1,235 2,872 183 19,949 59 - 118 129 2017 40,575 - 1,679 2,015 271 31,024 269 2,425 3,449 201 21,052 1,103 - 2,206 136 2018 42,782 - 2,207 2,648 285 33,801 278 2,499 3,554 219 23,153 2,101 - 4,201 150 2019 48,609 4,079 1,748 10,256 319 38,050 4,250 - 8,499 243 25,648 2,495 - 4,990 163 2020 54,835 623 5,603 7,968 360 42,404 1,089 3,266 6,096 270 28,363 1,494 1,222 4,454 181 2021 64,063 923 8,305 11,812 421 49,724 1,757 5,563 10,188 317 32,683 864 3,455 5,874 208 2022 73,482 5,652 3,768 15,825 475 57,070 6,612 735 14,106 358 37,473 4,311 479 9,197 235 2023 83,145 1,933 7,730 13,142 538 65,110 8,040 - 16,080 397 42,579 5,106 - 10,213 260 2024 92,172 1,805 7,221 12,276 596 72,470 7,360 - 14,721 442 47,345 4,766 - 9,532 289 2025 104,418 2,449 9,797 16,654 676 82,458 7,990 1,997 18,376 503 53,180 4,376 1,459 10,502 324 2026 115,946 2,306 9,222 15,678 750 91,842 3,754 5,631 14,265 560 59,492 2,840 3,472 9,847 363 2027 129,345 2,680 10,720 18,223 837 102,487 5,323 5,323 17,032 625 66,350 3,429 3,429 10,973 405 2028 142,912 2,713 10,854 18,451 925 113,712 5,612 5,612 17,959 694 72,731 3,191 3,191 10,210 428 2029 159,556 3,329 13,315 22,636 1,032 127,034 6,661 6,661 21,315 775 80,553 3,911 3,911 12,515 476 2030 178,147 3,718 14,872 25,283 1,153 142,260 7,613 7,613 24,361 868 88,627 4,037 4,037 12,918 510

IndonesIa second natIonal communIcatIon under the unIted natIons Framework conventIon on clImate change (unFccc)
Less GHG-emitting power plantsTable 5.7 presents the installed capacity, additional investment and GHG emissions of natural gas power plants from 2010-2030. The installed capacity of natural gas power plants in the CLIMATE 1 scenario is less than that in the BAU scenario. This occurs because the demand of electricity in the CLIMATE 1 scenario is lower than that of the BAU and there is not much effort to shift from coal to natural gas plants. However, as a result of greater efforts to use less GHG emitting plants, the installed capacity of natural gas plants under the CLIMATE 2 scenario is much greater than that of the BAU, especially after 2020. Due to the higher installed capacity of natural gas plants, the required investment and the GHG emissions in the CLIMATE 2 scenario are higher than that of the BAU. Although the GHG emissions of gas power plants are higher in CLIMATE 2, the overall emissions from the power sector in CLIMATE 2 are lower than that of the BAU because the increase in emissions from natural gas plants is compensated by the decrease in emissions from coal power plants.
Renewable energy (e.g., geothermal, hydro, biomass-based PP, MSW-based PP, etc.)Table 5.8 presents the installed capacity and the required investment for renewable power plants BAU, CLIMATE 1 and CLIMATE 2 scenarios. The installed capacity of renewable power plants under the CLIMATE 1 and 2 scenarios is higher than that under the BAU scenario. Conventional renewables such as hydropower and geothermal power plants under the two CLIMATE scenarios are not much different from the BAU due to geographical limitation of resource availability with respect to demand center. For example, although the water resources
Table 5.7 The installed capacity, additional investment and GHG emissions of natural gas power plants from 2010-2030
CHAPTER VMeasures to Mitigate Climate Change
V-16
BAU CLIMATE 1 CLIMATE 2
2010 12,875 30 12,875 - 30 12,875 - 30 2011 12,988 90 30 12,875 - 28 13,560 548 31 2012 14,008 816 32 13,070 156 31 15,353 1,434 36 2013 14,008 - 32 13,070 - 30 16,993 1,312 39 2014 14,008 - 32 13,569 399 31 18,534 1,233 43 2015 15,756 1,398 37 14,474 725 34 19,974 1,152 46 2016 18,094 1,870 42 15,522 838 36 21,519 1,236 50 2017 20,183 1,671 47 16,735 970 39 23,518 1,599 54 2018 21,481 1,038 50 18,668 1,546 43 25,771 1,803 60 2019 23,544 1,650 55 20,340 1,337 47 28,034 1,810 65 2020 25,414 1,496 59 21,832 1,194 51 30,458 1,940 71 2021 26,252 670 61 22,480 518 52 33,657 2,559 78 2022 27,864 1,290 65 23,805 1,060 55 37,278 2,897 86 2023 29,313 1,159 68 25,021 973 58 40,979 2,961 95 2024 31,089 1,421 72 26,484 1,171 61 44,683 2,963 104 2025 31,604 412 73 26,874 312 62 49,011 3,463 114 2026 33,539 1,548 78 28,478 1,283 66 53,584 3,658 124 2027 35,756 1,773 83 30,303 1,460 70 58,711 4,102 136 2028 36,700 755 85 30,982 543 72 63,680 3,975 148 2029 37,644 755 87 31,690 567 73 69,801 4,896 162 2030 37,644 - 87 31,690 - 73 76,020 4,976 176
YEAR
Insta
lled C
ap,
MW
Inves
tmen
t of
new
plant
,Mi
ll. US
D
Emiss
ions
mill.T
on CO
2e
Insta
lled C
ap,
MW
Insta
lled C
ap,
MW
Inves
tmen
t of
new
plant
,Mi
ll. US
D
Inves
tmen
t of
new
plant
,Mi
ll. US
D
Emiss
ions,
mill.T
on CO
2e
Emiss
ions,
mill.T
on CO
2e

IndonesIa second natIonal communIcatIon under the unIted natIons Framework conventIon on clImate change (unFccc)
available for power is relatively high (up to 75 GW), many of the resource locations (i.e., 25 GW in Papua) do not match with the location of demand center (i.e., Jawa, Sumatera). Similar situations also occur with regard to geothermal resources (26 GW). The significant difference between the two CLIMATE scenarios and BAU is that other renewables such solar power, wind, biomass based power plants are utilized. However, these plants are still very small compared to the total required power plant capacity and therefore their contribution towards reducing GHG emissions is not significant. Further deployment of these types of power plants are limited because such technologies are much more expensive than conventional power plants. Further development and utilization of wind power is limited because wind resources in Indonesia are not sufficient (i.e., low speed winds).
Increasing efficiency on the energy demand sideImprovements in energy efficiency will be approximately 17% in 2020, 20% in 2025 and 23.8% in 2030. The efficiency potential in power generation is approximately 18%, whereby the efficiency potential on the demand side (i.e., household, commercial and industry) will reach 11% in 2020, 13% in 2025 and 16% in 2030. The detailed energy efficiency of each sector from 2020-2030 is presented in Table 5.9.
Table 5.8 The installed capacity and the required investment for renewable power plants under the BAU, CLIMATE 1 and CLIMATE 2 scenarios
CHAPTER VMeasures to Mitigate Climate Change
V-17
BAU CLIMATE 1 CLIMATE 2Installed Cap, MW Investment, Mill. USD Installed Cap, MW Investment, Mill. USD Installed Cap, MW Investment, Mill. USD
2010 3,745 1,093 145 3,745 1,093 145 3,745 1,093 145 2011 3,983 1,370 154 476 831 24 3,745 1,093 145 4,332 1,695 360 1,173 1,806 428 2012 4,243 2,114 169 520 2,232 30 4,368 2,333 456 1,247 3,719 623 4,877 2,460 458 1,091 2,294 218 2013 4,270 3,009 175 54 2,685 13 4,434 3,127 620 132 2,384 302 5,229 3,221 633 703 2,284 337 2014 5,307 3,819 176 2,074 2,430 7 5,367 4,000 769 1,865 2,617 249 6,077 4,051 794 1,696 2,490 279 2015 5,382 3,875 185 150 168 49 5,702 4,359 919 671 1,077 290 6,513 4,776 1,036 873 2,176 394 2016 6,167 4,087 194 1,570 636 51 6,492 4,722 1,083 1,580 1,088 315 7,619 4,944 1,252 2,211 502 395 2017 7,139 4,783 199 1,944 2,088 39 7,338 5,278 1,227 1,691 1,669 254 8,661 5,753 1,392 2,084 2,428 320 2018 8,067 5,650 217 1,856 2,601 83 8,132 5,940 1,431 1,589 1,986 417 9,303 6,271 1,604 1,283 1,553 455 2019 8,146 5,998 284 159 1,044 164 8,198 6,496 1,586 132 1,670 293 9,543 6,785 1,768 482 1,542 408 2020 8,211 6,060 306 128 187 83 8,313 7,053 1,769 230 1,671 327 9,750 7,333 1,927 413 1,644 344 2021 8,318 6,158 344 216 293 121 8,511 7,354 1,928 396 903 349 10,097 7,529 2,082 694 588 454 2022 8,335 6,192 365 34 103 76 8,647 7,630 2,108 272 826 364 10,247 7,807 2,288 299 835 457 2023 8,338 6,253 381 5 184 59 8,785 7,729 2,155 276 297 113 10,458 8,004 2,355 423 590 206 2024 8,479 6,359 402 282 317 97 9,029 7,705 2,319 487 - 355 10,650 8,219 2,553 383 646 469 2025 8,479 6,475 422 1 348 66 9,177 7,866 2,478 296 483 341 10,737 8,463 2,728 174 733 461 2026 8,553 6,540 442 147 195 97 9,255 7,974 2,549 158 325 149 10,854 8,518 2,792 234 166 228 2027 8,618 6,601 463 131 183 72 9,480 8,159 2,741 448 554 395 10,934 8,687 2,996 159 505 503 2028 8,927 6,745 495 618 431 101 9,546 8,206 2,902 133 142 363 11,152 8,889 3,181 437 607 527 2029 9,087 6,923 510 319 535 51 9,835 8,469 2,926 578 789 61 11,457 9,342 3,228 610 1,358 259 2030 9,171 7,055 534 169 395 69 10,091 8,706 3,119 512 710 411 11,651 9,550 3,438 388 625 620
Year
Hydr
o
Hydr
o
Hydr
o
Hydr
o
Hydr
o
Hydr
o
Geot
herm
al
Geot
herm
al
Geot
herm
al
Geot
herm
al
Geot
herm
al
Geot
herm
al
Othe
r ren
ew
Othe
r ren
ew
Othe
r ren
ew
Othe
r ren
ew
Othe
r ren
ew
Othe
r ren
ew

IndonesIa second natIonal communIcatIon under the unIted natIons Framework conventIon on clImate change (unFccc)
5.2 Industry Sector
5.2.1 Policies FrameworkThe major GHG emissions generated from industrial processes are CO2, methane (CH4), nitrous oxide (N2O) and perfluorocarbons (PFCs) in the form of CF4 and C2F6; CO2 emissions account for the vast majority, representing 93% of the total GHG emissions from industrial processes. However, current Indonesian regulations and policies do not directly control CO2 and other GHG emissions from industrial processes.
In terms of legal aspect, these gases are still allowable under Indonesian regulations. Refer to the Decree of the State Minister of Environment/Kep. MENLH No. 129 of 2003 concerning standard quality of emissions for industrial processes; the requirement for stationary emissions sources form the industrial processes are opacity, hydrogen sulfide (H2S) and other hydrocarbon gases, which does not cover the CO2 or other GHG emissions. There is no specific threshold value for these types of emissions from the industrial sector.
5.2.2 Emissions Projections and Mitigation MeasuresThe total number of medium- and large-scale industries of varying types in Indonesia is more than 20,000. However, not all of the GHG emissions from those industries are covered in the SNC. The SNC only includes GHG emissions specifically associated with industrial processes and excludes emissions from energy consumption in industrial activities (which are already covered in the energy sector). The types of industrial processes covered in the SNC are industries that have the potential to generate GHGs, including mineral production processes (e.g., cement, lime, carbonate products), chemical production processes (e.g., ammonia, nitric acid, caprolactam),
Table 5.9 Energy efficiency improvements by sector, 2020-2030
Key Sources of Activity
2010 - 2025
CLIMATE 1 CLIMATE 2
Transportation 50,946,486 1% 16 3,645 116 84,727,097 1% 21 6,062 179
Industry 1,546,393,912 17% 115 110,644 22 1,923,871,786 22% 150 137,653 23
Households (w/o biomass) 100,916,073 6% 10 267 14 100,916,073 6% 10 7,221 26
Commercial 86,618,531 11% 23 230 25 106,718,845 15% 30 7,636 49 ACM - -
Total 1,784,875,002 10% 114,787 177 2,216,233,802 277
Efficie
ncy,
BOE
%
Efficie
ncy
Inves
tmen
t Cos
t, Mi
llion U
SD
Cost
Savin
g, Mi
llion U
SD
Redu
ction
Pote
ntial
, To
n CO 2e
Efficie
ncy,
BOE
% Effi
cienc
y
Inves
tmen
t Cos
t, Mi
llion U
SD
Cost
Savin
g, Mi
llion U
SD
Redu
ction
, Ton
CO2e
CHAPTER VMeasures to Mitigate Climate Change
V-18

IndonesIa second natIonal communIcatIon under the unIted natIons Framework conventIon on clImate change (unFccc)
and metal production processes (e.g., iron/steel production and aluminum smelter), as covered in the 2006 IPCC Guidelines.
The methodology of GHG emissions projections for industrial processes is principally similar to other sectors, as emissions are based on projected activity data. The projections used simple econometric extrapolation techniques taking into consideration the historical trends. Activity data projections are based on projection models, which use GDP growth of the industrial sector as the growth driver. Although the average national GDP growth from 2000-2005 was only 4.7% per year, the GDP growth from the industrial sector was still high at 9.3% per annum. Considering the development that has occurred in the past five years, future GDP from the industrial sector is projected to grow at a slower rate of 6.4% per year. Future GHG emissions generated from the industrial sector are estimated to increase, consistent with the projected GDP growth of the industrial sector at 6.4% per year.
The industrial sector will reduce the rate of emissions from the BAU scenario by increasing the efficiency in production processes, introduction of new technologies, or by changing the raw materials (i.e., using waste as an alternative material in the cement industry). The emissions reductions can also be achieved through the clean development mechanism (CDM) scheme and private sector participation. Public funding is still needed for the dissemination of programs related to CO2 emissions reductions in industrial processes.
In the analysis of future emissions from the industrial sector, two scenarios have been established by assuming that emissions reductions are carried out by the private sector through the CDM scheme and supported by government dissemination programs and other international funds/grants. Table 5.10 presents the projected emissions generated by the industrial sector from 2010-2025 under BAU and the two alternative scenarios.
The potential for GHG emissions reductions are estimated to occur through the following processes (i) process improvement; (ii) operation system improvement; (iii) technology change; (iv) raw material substitution; and (v) dissemination/promotion program.
Table 5.10 Projected emissions from the industrial sector under BAU and mitigation scenarios (Ggram CO2e)
Scenario 2010 2015 2020 2025BAU 52,850 57,296 62,117 67,343Private scenario through CDM 49,438 52,422 56,754 61,493Reduction Potential 3,412 4,875 5,362 5,850% Reduction 6.5% 8.5% 8.6% 8.7%
Private scenario through CDM with support from the government through dissemination program and other international funds 46,152 49,136 53,469 58,207
Reduction Potential 6,698 8,160 8,648 9,135
% Reduction 12.7% 14.2% 13.9% 13.6%
CHAPTER VMeasures to Mitigate Climate Change
V-19

IndonesIa second natIonal communIcatIon under the unIted natIons Framework conventIon on clImate change (unFccc)
5.3 Foresty Sector
5.3.1 Policy FrameworkMitigation of climate change is one of the long-term national forestry plans for the period from 2010-2029 (MoF, 2008). Five key policies that support mitigation of climate change in the forestry sector have been issued, as stated in Forestry Strategic Plan for 2005-2009 through Ministerial Decree No. P.04/Menhut-II/2005 dated on 14 February 2005. These include the following:
1. Combating illegal logging and its associated trade, through (i) securing forest areas and (ii) controlling forest product administration;
2. Revitalization of the forestry sector, particularly the forestry industries, through (i) natural production forest management under non-concessionaire license; (ii) develop- ment of plantation forest; (iii) management (utilization) of primary production forest; and (iv) restructuring of the primary forestry industry;
3. Conservation and rehabilitation of forest resources, through (i) plantation seeds development, (ii) management of watershed areas; (iii) forest and land rehabilitation; (iv) self-management of forest and land rehabilitation; (v) development of national park management; (vi) management of nature preservation/sanctuary reserve/hunting park areas; (vii) controlling forest fires; (viii) management of biological diversity; (ix) manage- ment of protected forest; and (x) utilization of wildlife and plant products and environ- mental services;
4. Empowering the economy of the community within and surrounding the forest area, through (i) development of community forest and community plantation forest; (ii) deve- lopment of non timber forest product (NTFP) utilization; (iii) development of buffer zone area surrounding conservation areas; and (iv) development of social forestry; and
5. Stabilization of forest area for promoting and strengthening sustainable forest management, through (i) inventory and mapping of forest resources; (ii) development of Information Assessment System on Forestry Development; (iii) gazettement of forest area, (iv) preparation and evaluation of the utilization and conversion of forest area; and (v) development of Forest Management Units (FMUs).
In 2009, Ministry of Forestry issued eight policy strategies for forestry sector through Ministrial Decree No.70/Menhut-II/2009 dated 7 December 2009, as the basic for forestry activities in 2009-2014. Mitigation and adaptation of climate change for forestry sector are clearly stated as one of the strategies that include:
1. Area establishment, 2. Forest rehabilitation and improvement the carrying capacity of watershed area, 3. Forest protection and forest fire control
CHAPTER VMeasures to Mitigate Climate Change
V-20

IndonesIa second natIonal communIcatIon under the unIted natIons Framework conventIon on clImate change (unFccc)
4. Conservation of biodiversity5. Revitalization of forest utilization and forestry industries, 6. Empowerment of forest community and forest industries, 7. Mitigation and adaptation of climate change for forestry sector, 8. Strengthening the forestry institutions.
Consistent with the above programs, targets for the long-term national forestry strategic plans include: (1) Confirmation of 60 million hectares of forest area by 2014; (2) Rehabilitation and establishment of new plantations with the following targets for 2012: industrial forest plantations (7.2 million ha), community plantation forest (5.4 million ha), community forest (4 million ha) and social forestry (2 million ha); (3) Forest protection and natural resources conservation (120.3 million ha); (4) Development of economic and social functions; (5) Establishment of institutions; and (6) Research and development.
The legal and policy framework already exists through which Indonesia could undergo a significant reduction in future carbon emissions. Key pieces of legislation include:
• Government Regulation (PP) No. 35/1995 on reforestation fund;• Government Regulation (PP) No. 34/2002 on land use, forest management planning, forest and forest land use;• Government Regulation (PP) No. 45/2004 on forest protection; • Government Regulation (PP) No. 6/2006 on forest management and utilization; • Government Regulation (PP) No. 6/2007 on forest planning management and forest utilization; • Government Regulation (PP) No. 10/2010 on procedure for exchanging forest utilization and forest function • Government Regulation (PP) No. 11/2010 on rules on the optimizing the use of abandoned land• Presidential Instruction (Inpres) No. 4/2005 on combating illegal logging;• Presidential Instruction (Inpres) No. 2/2007 on rehabilitation of the ex-Mega Rice Project in Central Kalimantan;• Minister of Forestry Regulation (Permenhut) No. 14 /2004 on Afforestation and Reforestati- on (AR) CDM• Minister of Forestry Regulation (Permenhut) No. 1/2004 on social forestry.• Minister of Forestry Regulation (Permenhut) No 68/Menhut-II/2008 on the implementa- tion of REDD demonstration activities.• Minister of Forestry Regulation (Permenhut) No. 36/Menhut-II/2009 on procedure for get- ting permit for implementing carbon sequestration, carbon conservation on production forest and protection forest.• Minister of Forestry Regulation (Permenhut) No 30/Menhut-II/2009 on procedure for implementing REDD activities • Economic and Finance Ministerial Decree (Kepmen Ekuin) No. 14/2001 on Integrated Water Resources;
CHAPTER VMeasures to Mitigate Climate Change
V-21

IndonesIa second natIonal communIcatIon under the unIted natIons Framework conventIon on clImate change (unFccc)
• Forest Ministerial Decree (Kepmenhut) No. 159/2004 on restoration of degraded ecosys- tem in productive forest areas;
5.3.2 Emissions Projections and Mitigation MeasuresThe forestry sector developed emissions and carbon sequestration projections based on historical data. Under the BAU scenario, the future deforestation rate is assumed to be constant at a rate of 1.1 million ha per year (see Figure 5.9). Figure 5.9 shows that the rate of deforestation from 2000-2006 has decreased compared to the previous period. In the analysis, this trend was not taken into account because of the potentially increasing threat of the conversion of forest area to non-forest area due to the formation of new districts in the future. Similarly, the future capacity to establish forest depends on rehabilitation programs (reforestation and afforestation), community forestry, community forest plantation, etc. and are assumed to be the same as historical rate. From 2000 and 2006 satellite data, it was suggested that the rate of forest establishment between 1996 and 2006 was about 198 thousand ha per year (MoF, 2009).
Using the above assumption, under the BAU scenario, the emissions from biomass removal due to deforestation was projected to be constant at a rate of about 0.898 Gt CO2 per year. The rate of sequestration is assumed to increase from 0.505 Gt CO2 per year in 2005 to 0.753 Gt CO2 in 2020. Sequestration of carbon occurs as a result of regeneration of secondary forests, land rehabilitation (i.e., afforestation and reforestation), and regrowth of woody vegetation (i.e., perennial crops and shrubs). Based on various studies, the mean annual growth rate of secondary forest is assumed to be approximately 5.32 tCO2/ha, forest plantation is 36.7 t CO2/ha, and other perennial crops/shrubs is 13.5 tCO2/ha.
Under the BAU scenario, this sector will continue as net emitter. The Government of Indonesia, as part of its non-binding emissions reduction target, will increase the rate of planting from 198 thousand hectare per year to 500 thousand ha per year, which is referred to as mitigation scenario “1.” In its Strategic Plan, the forestry sector set up a progressive target with a rate of planting of between 1.6 and 2.2 Mha per year (Table 5.11), which is called as Mitigation Scenario 2. With this rate of planting this sector will become net sinker after 2015. After 2015, the rate of carbon sequestration is projected to be greater than the rate of emissions (Figure 5.9).
CHAPTER VMeasures to Mitigate Climate Change
V-22

IndonesIa second natIonal communIcatIon under the unIted natIons Framework conventIon on clImate change (unFccc)
The progressive target in the Strategic Plan will be hard to meet without international support (see Table 5.12). Government of Indonesia has identified potential funding sources that can be used to achieve such targets, namely the REDD Fund, private investment, grants through bilateral and multilateral channels such as Overseas Development Assistance (ODA), Adaptation
Table 5.11 Rate of planting in the Strategic Plan of the Ministry of Forestry (MoF, 2009)
Figure 5.9 Rate of carbon sequestration and emissions under the BAU scenario and the two mitigation scenarios (Ministry of Forestry)
Year Forest Plantation
Community forest
Forest restoration
Watershed rehabilitation
Partnership forest Total
2010 450 500 300 300 50 16002011 550 500 350 300 50 17502012 500 500 450 300 50 18002013 600 500 650 350 50 21502014 550 500 750 350 50 22002015 450 500 300 300 50 16002016 550 500 350 300 50 17502017 500 500 450 300 50 18002018 600 500 650 350 50 21502019 550 500 750 350 50 22002020 500 500 750 350 50 2150Total 5800 5500 5750 3550 550 21150
Source of Fund Private Government Private and International
Private and International
CSR and Community
CHAPTER VMeasures to Mitigate Climate Change
V-23
Emiss
ion/
Rem
oval
(Gt C
O 2)
2000 2005 2010 2015 2020 2025
1500000
100000
500000
0
-500000
-1000000
-1500000
-2000000
BaU
Miti
-1
Miti
-2
BaU
Miti
-1
Miti
-2
BaU
Miti
-1
Miti
-2
BaU
Miti
-1
Miti
-2
BaU
Miti
-1
Miti
-2
BaU
Miti
-1
Miti
-2
C-Sequestration Biomass loss

IndonesIa second natIonal communIcatIon under the unIted natIons Framework conventIon on clImate change (unFccc)
Fund under the Kyoto Protocol, Global Forest Fund (GFF), and Debt for Nature Swaps (DNS). Indonesia applied for debt reduction under the Tropical Forest Conservation Act of the USA and used the fund for forest conservation activities.
In addition, the previously (albeit briefly) mentioned UN Collaborative Programme on Reducing Emissions from Deforestation and Forest Degradation (REDD) also has high potential for providing additional support to Indonesia and several countries have made already made commitments [to support Indonesia]. Both REDD and the Forest Carbon Partnership Facility (FCPF) have made commitments to support Indonesia in developing an effective and accountable framework for REDD, together with Australia, the United Kingdom, Germany, Japan and Korea. Table 5.12 presents some of the international support for Indonesia related to implementing forestry mitigation projects.
Table 5. 12 Program support from international agencies for forestry mitigation projects in Indonesia
Title Cooperation to Support Forest Governance and Multi-stakeholder Forestry Programme
Duration 2007-2010
Objective 1. Support governance reforms to reduce and eventually eliminate illegal logging and its associated timber trade, with a particular focus on support for negotiation and implementation of the EU-GoI FLEGT VPA and other international arrangements;2. Through a multi-stakeholder approach, help build the capacity of central and local government and civil society, support partnerships between government and civil society, promote policy analysis and development and support poverty reduction through more equitable and sustainable management of natural resources, with a particular focus on the rights and opportunities through community forestry for disadvantaged and women’s groups; 3. Explore the opportunities for governance reforms that are necessary for REDD.
Title Financial Cooperation for Climate Change and REDD Issue; Project title: Forestry-Climate Change Project in Central and East Kalimantan (FCCP)
Duration 7 years, started 2009
Objective To support Indonesia with the reduction of GHG emissions from deforestation and forest degradation.Specific objectives:1. To support policy priorities of the Ministry of Forestry in REDD; and 2. To support the implementation of mechanisms related to avoiding deforestation by development of pilot projects in Indonesia with the involvement of local communities in sustainable forest management.
Title Technical Cooperation (TC)Supporting implementation of the Ministry of Forestry’s Strategic Plan
Duration 3 years, started mid-2008
Objective To implement the Strategic Plan which is integrated and synergized with other sector planning – specifically,, provincial and districts programs
CHAPTER VMeasures to Mitigate Climate Change
V-24
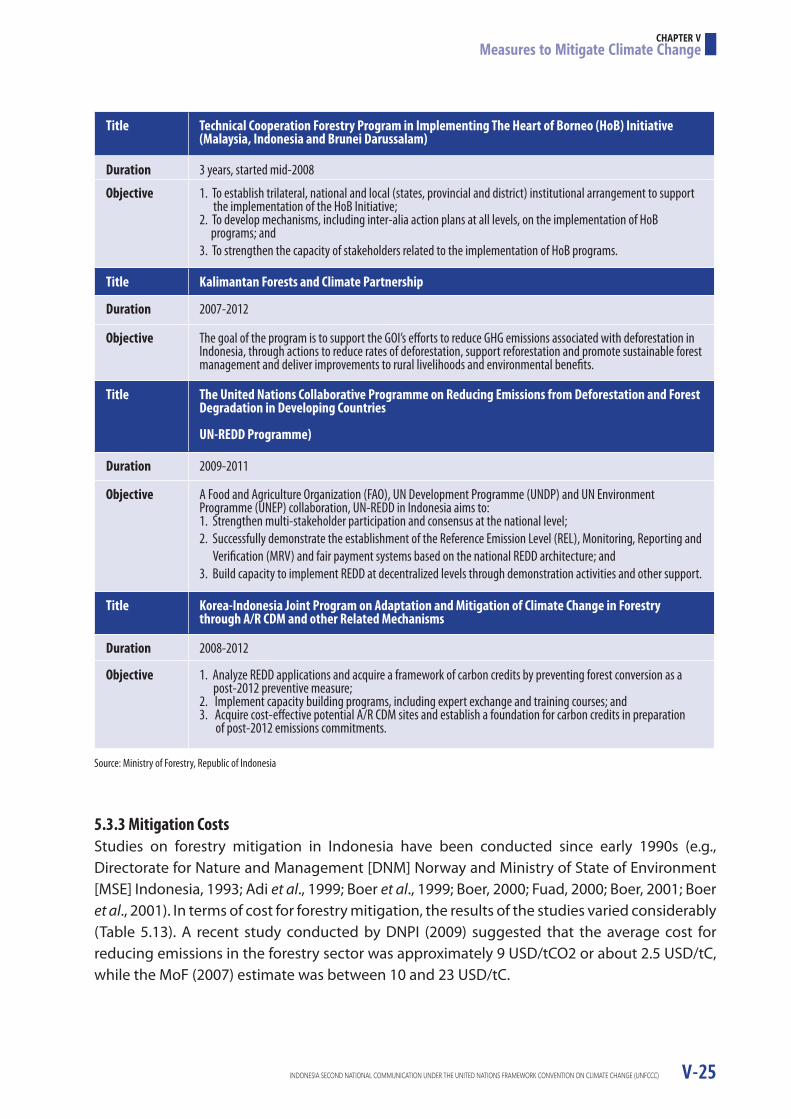
IndonesIa second natIonal communIcatIon under the unIted natIons Framework conventIon on clImate change (unFccc)
5.3.3 Mitigation CostsStudies on forestry mitigation in Indonesia have been conducted since early 1990s (e.g., Directorate for Nature and Management [DNM] Norway and Ministry of State of Environment [MSE] Indonesia, 1993; Adi et al., 1999; Boer et al., 1999; Boer, 2000; Fuad, 2000; Boer, 2001; Boer et al., 2001). In terms of cost for forestry mitigation, the results of the studies varied considerably (Table 5.13). A recent study conducted by DNPI (2009) suggested that the average cost for reducing emissions in the forestry sector was approximately 9 USD/tCO2 or about 2.5 USD/tC, while the MoF (2007) estimate was between 10 and 23 USD/tC.
Source: Ministry of Forestry, Republic of Indonesia
Title Technical Cooperation Forestry Program in Implementing The Heart of Borneo (HoB) Initiative (Malaysia, Indonesia and Brunei Darussalam)
Duration 3 years, started mid-2008
Objective 1. To establish trilateral, national and local (states, provincial and district) institutional arrangement to support the implementation of the HoB Initiative;2. To develop mechanisms, including inter-alia action plans at all levels, on the implementation of HoB programs; and3. To strengthen the capacity of stakeholders related to the implementation of HoB programs.
Title Kalimantan Forests and Climate Partnership
Duration 2007-2012
Objective The goal of the program is to support the GOI’s efforts to reduce GHG emissions associated with deforestation in Indonesia, through actions to reduce rates of deforestation, support reforestation and promote sustainable forest management and deliver improvements to rural livelihoods and environmental benefits.
Title The United Nations Collaborative Programme on Reducing Emissions from Deforestation and Forest Degradation in Developing Countries
UN-REDD Programme)
Duration 2009-2011
Objective A Food and Agriculture Organization (FAO), UN Development Programme (UNDP) and UN Environment Programme (UNEP) collaboration, UN-REDD in Indonesia aims to:1. Strengthen multi-stakeholder participation and consensus at the national level;2. Successfully demonstrate the establishment of the Reference Emission Level (REL), Monitoring, Reporting and Verification (MRV) and fair payment systems based on the national REDD architecture; and3. Build capacity to implement REDD at decentralized levels through demonstration activities and other support.
Title Korea-Indonesia Joint Program on Adaptation and Mitigation of Climate Change in Forestry through A/R CDM and other Related Mechanisms
Duration 2008-2012
Objective 1. Analyze REDD applications and acquire a framework of carbon credits by preventing forest conversion as a post-2012 preventive measure; 2. Implement capacity building programs, including expert exchange and training courses; and3. Acquire cost-effective potential A/R CDM sites and establish a foundation for carbon credits in preparation of post-2012 emissions commitments.
CHAPTER VMeasures to Mitigate Climate Change
V-25
IndonesIa second natIonal communIcatIon under the unIted natIons Framework conventIon on clImate change (unFccc)
5.4 Peatland
5.4.1 Policy FrameworkTo support the implementation of programs related to reduce emissions from land and forest fires, forest conversion and peat land from agriculture plantation, the Government of Indonesia has issued a number legal instruments. Relevant legal instruments designed to control fire include the following:
• Ministry of Agriculture Regulation No. 14/Permentan/PL.110/2/2009 on the Guidance for the Utilization of Peat Land for Palm Oil;• PP No. 4/2001, forbids all forest and land fires; • Ministry of Forestry Decree Kepmen No. 260/Kep-II/1995 on Guidelines for Prevention and Control of Forest Fire, supplemented with the implementation guidelines;• Director General of Forest Protection and Nature Conservation (PHPA) Decree No. 243/ Kpts/DJ.VI/1995 on Technical Guidelines for Forest Fire Prevention and Control in conces- sion areas and other land use; • Director General of Estate Crops Decree No. 38/KB.110/DJ.BUN/05.95 on Technical Guide- lines for Land Clearance without Burning to Develop Plantations;
Table 5.13 Mitigation potential and cost for forestry sector
Mitigation Mitigation potential (tC/ha)
Life cycle cost (USD/tC)
Conservation and forest management
Forest Protection 55-220 1.18
Reduced Impact Logging 49 0.07
Enrichment planting 70 0.25
Sink enhancement
Reforestation without rotation/harvesting
- Fast growing species 40-101 0.85-22.5
- Slow growing species 94-336 0.48-2.34
Reforestation with rotation/harvesting
- Short rotation 56-122 3.87-33.20
- Long rotation 134-334 1.04-5.70
Agroforestry 94 4.44
Fossil fuel substitution
Bioelectricity 50-185 20.81
Source: Based on various sources, including Adi et al., 1999; Boer et al., 1999; Fuad, 2000; Boer, 2001; and MoF, 2007.
CHAPTER VMeasures to Mitigate Climate Change
V-26

IndonesIa second natIonal communIcatIon under the unIted natIons Framework conventIon on clImate change (unFccc)
• While strict legal penalties for persons causing fire are stipulated in UU No. 41/1999, arti- cle 78 clauses 3, 4 and 11, are as follows : o Intentionally setting fire to forest: Prison sentence maximum of 15 years and a maxi- mum fine of 5 billion Indonesian Rupee (IDR) o Negligence leading to forest fire: Prison sentence maximum of 5 years and a maxi- mum fine of 1.5 billion IDR o Dumping of materials which can cause forest fire: Prison sentence maximum of 3 years and a maximum fine of 1 billion IDR
• Government Regulation No. 28/1985 on Forest Protection: o Article 10, point 1: burning the forest on purpose will be fined with a maximum of 10 years in prison or 100 million IDR o Article 18, point 3b: burning of forest as a result of carelessness will be fined a maxi- mum of 1 year in prison or 10 million IDR
5.4.2 Emissions ProjectionsUnder the BAU scenario, it was assumed that all peat land under convertible production forest (HPK) irrespective of depth will be released and used for non-forestry activities (APL). Peat land in HPK will be released for APL within the next 15 years and used for agriculture activities (BAPPENAS, 2010). The emissions from peat fire are assumed to be the same as the average rate of emissions from 2000-2006 estimated by van der Werf et al. (2008). Based on this assumption, the rate of emissions from peat land in 2020 might reach 1.4 GtCO2, about approximately four times the 2000 peat emissions.
5.5 Agriculture Sector
5.5.1 Policy FrameworkThere is no specific policy in the agriculture sector for climate change mitigation. However, a number of mitigation programs are already in place. The key mitigation programs include (MoA, 2007; Las et al., 2008; Bappenas, 2010):
1. Implementation of no-burning technology for land clearing and land preparation, in food crop, horticulture, and plantation sub-sectors; 2. Development of a Fire Early Warning System to reduce the risk of fire during extreme drought years, particularly in peat areas;3. Introduction of low methane emitting rice varieties. Currently, there are four varieties used that have low methane emissions – Ciherang, Cisantana, Tukad Belian and Way Apo Buru.4. Introduction of low methane emitting technologies, such as the use of agriculture waste for bio-energy and composting;5. Development and application of organic fertilizer and bio-pesticides
CHAPTER VMeasures to Mitigate Climate Change
V-27

IndonesIa second natIonal communIcatIon under the unIted natIons Framework conventIon on clImate change (unFccc)
6. Introduction of biogas technology and improved feed to reduce methane emissions from the livestock. A number of related activities that have been implemented are the ‘Batamas’ program, mixed-farming and mini animal feed industries;7. Optimation of existing agricultural lands by increasing productivity and cropping index through technology innovation support as new improved varieties8. Expansion of agriculture areas in unproductive land such as grassland and abandoned land particularly to mineral soils either in upland or wet lands9. Rehabilitation, reclamation and revitalization of abandoned peat lands, and manage- ment of peat land for sustainable agriculture,10. Research and development on low emission technology and MRV in agriculture sector
In the framework of green economy development program, Indonesia is developing carbon efficient farming (ICEF) by organizing farmers in villages or sub-districts. ICEF is an integrated of crop-livestock with low emission, energy efficient and high economic added values. ICEF optimally utilizes all the carbon from crop production and waste or by products from both the crop and livestock.
5.5.2 Emissions Projections and Mitigation MeasuresThe main sources of CH4 emissions from the agriculture sector are rice fields and livestock. Projections of emissions under these two sub-sectors were developed using a number of assumptions to model the impacts of differnet policy options. The assumptions were developed by considering historical conditions and a trend of population growth. For rice, two baseline scenarios were developed:
1. BAU1. This baseline adopted the assumption that all irrigated rice fields are continuously flooded and applied inorganic fertilizers to Cisadane rice variety. The area of the irrigated rice in Java will not change due to the adoption of regulations related to sustainable agriculture land; outside Java, the land area devoted to irrigated rice will increase at a rate of 50 thousand ha per year. The cropping index is assumed to be 2.4 if the source of irriga- tion came from a reservoir and 1.4 if source of irrigation is not from reservoir.
2. BAU2: Similar to BAU1, but the rice paddy area in Java is assumed to be converted to non- rice paddy area at a rate of about 50 thousand ha per year; outside Java, rice paddy area will increase at a rate of about 150 thousand ha per year.
To reduce emissions from the rate under BAU, six mitigation scenarios were proposed, as shown in Table 5.14 (S1-S6). In the mitigation scenarios, the rice variety used was changed from Cisadane to IR64. By 2030, the total rice paddy area that applied mitigation technologies is less than 30% - specifically, 21% for S1, 5% for S2, 15% for S3, 14% for S4, 6% for S5 and 1.6% for S6. Using these assumptions, it was found that total methane emissions in 2030 under BAU1 and BAU2 would be about 38,804 and 42,434 Gg CO2e, respectively. The most effective mitigation scenario would be the adoption of less methane-emitting varieties (Figure 5.10). Adoption of
CHAPTER VMeasures to Mitigate Climate Change
V-28

IndonesIa second natIonal communIcatIon under the unIted natIons Framework conventIon on clImate change (unFccc)
new less methane emitting varieties would reduce the rate of methane emissions from BAU by approximately 20%.
Table 5.14 Mitigation scenarios for reducing methane emissions from paddy rice
Figure 5.10 The projection of methane emissions from rice paddies under the baseline and mitigation scenarios (Setyanto et al., 2009)
Scenario Mitigation TechnologyPotential
applicability (%)
Rate of the technology adoption (Percent of potential applicability area)
2005* 2010 2015 2020 2025 2030
S0 Flooded with inorganic fertilizer (according to Kepmentan) 100 100 100 100 100 100 100
S1 Intermittent irrigation (including SRI, PTT) 70 3 5 10 20 25 30
S2 Fertilizer supplement(ZA and urea brisket) 100 0 0 1 2 3 5
S3 Adoption of less methane emissions-varieties* 30 20 25 30 40 45 50
S4 Intermittent + fertilizer supplement (Combine S1 and S2) 70 3 5 8 10 15 20
S5 Intermittent + fertilizer supplement + varieties (Combine S1, S2 & S3) 30 3 5 8 10 15 20
S6 S5 + iron material/silica 30 0 0 1 2 4 6
Note: Total paddy rice area was assumed to be about 7.8 million ha. Potential applicability area refers to the total area applicable for the mitigation technologies. The remaining areas that do not use the mitigation technologies still use the baseline technologies. Less methane emitting varieties include Ciherang, Cisantana, Tukad Belian and Way Apo Buru (Setyanto et al., 2009)
CHAPTER VMeasures to Mitigate Climate Change
V-29
Emiss
ion
(Gg
CO2e
)
Emiss
ion
(Gg
CO2e
)
44000
42000
40000
38000
36000
34000
32000
30000
44000
42000
40000
38000
36000
34000
32000
30000
BAU-1BAU-1 Skenario 1BAU-1 Skenario 2BAU-1 Skenario 3BAU-1 Skenario 4BAU-1 Skenario 5BAU-1 Skenario 6
BAU-2BAU-2 Skenario 1BAU-2 Skenario 2BAU-2 Skenario 3BAU-2 Skenario 4BAU-2 Skenario 5BAU-2 Skenario 6
2000 2005 2010 2015 2020 2025 2030 2000 2005 2010 2015 2020 2025 2030

IndonesIa second natIonal communIcatIon under the unIted natIons Framework conventIon on clImate change (unFccc)
The projection of emissions for livestock was consistent with the population growth projection. The annual population growth rate of the livestock was assumed to follow the historical population growth rate, whereas beef cattle and dairy cattle increase at an annual rate of 5%, broiler and layer 3%, buffalo, sheep, goat, pig and local chicken 2%, and horse and duck 1%. With these growth rates, the domestic demand for these animals will not be fully met, implying that Indonesia may still need to import meat and milk.
Mitigation technologies that have been identified for this sub-sector are the following:
1. Feeding Quality Improvement. Currently, beef and dairy cattle feeding practices are less efficient (increasing losses of feed energy in the form of methane and reduced amounts of energy stored in animal product). Utilization of low digestible feedstuff, a higher propor- tion of forage and low quality pasture (especially in eastern parts of Indonesia) are the main problems. Increasing conversions of feed energy to animal products will not only decrease methane emissions, but also benefit the farmer. Feed quality improvement programs of beef and dairy cattle will reduce up to 20% of methane emissions. Some possible activities for reducing methane emissions through improved feed quality are: a. Introduction of high quality local feed sources such as legume and high quality grass, as well as utilization of agriculture byproducts; b. Improvement of low quality byproducts using physical, chemical or biological pre- treatment; c. Increasing concentrate to forage ratio; and d. Increasing animal productivity by intensity of production (feeding as required). The equal amount of animal product will be produced by less animal number.
2. Supplementation. Supplementation of minerals in the form of feed supplement blocks (FBS) has been tested on a limited scale by smallholder farmers. One study reported that mineral supplements increased animal productivity, reducing methane formation by up to 15% (Suryahadi et al., 2007). Mineral supplementation programs have a lot of advan- tages due to their simplicity of application and high success rate (less risk of failure).
3. Long-term Breeding Program. Improvement of animal breeding could mitigate up to 10% of methane emissions from livestock. This improvement could be achieved through appropriate long-term breeding programs. The animals will be bred for adaptation to climate, higher productivity and less methanogenic bacteria/methane production. A potential breeding program would need high investment and would yield long-term return rates, thus likely requiring government support.
4. Bio-energy. Utilization of animal sewage as bio-energy is a clear option because of its relevance to national government programs. Currently, the Indonesian government is try- ing to incentivize the deployment of renewable and environmentally-friendly energy resources. Bio-energy from animal sewage could reduce methane emissions up to 80%
CHAPTER VMeasures to Mitigate Climate Change
V-30
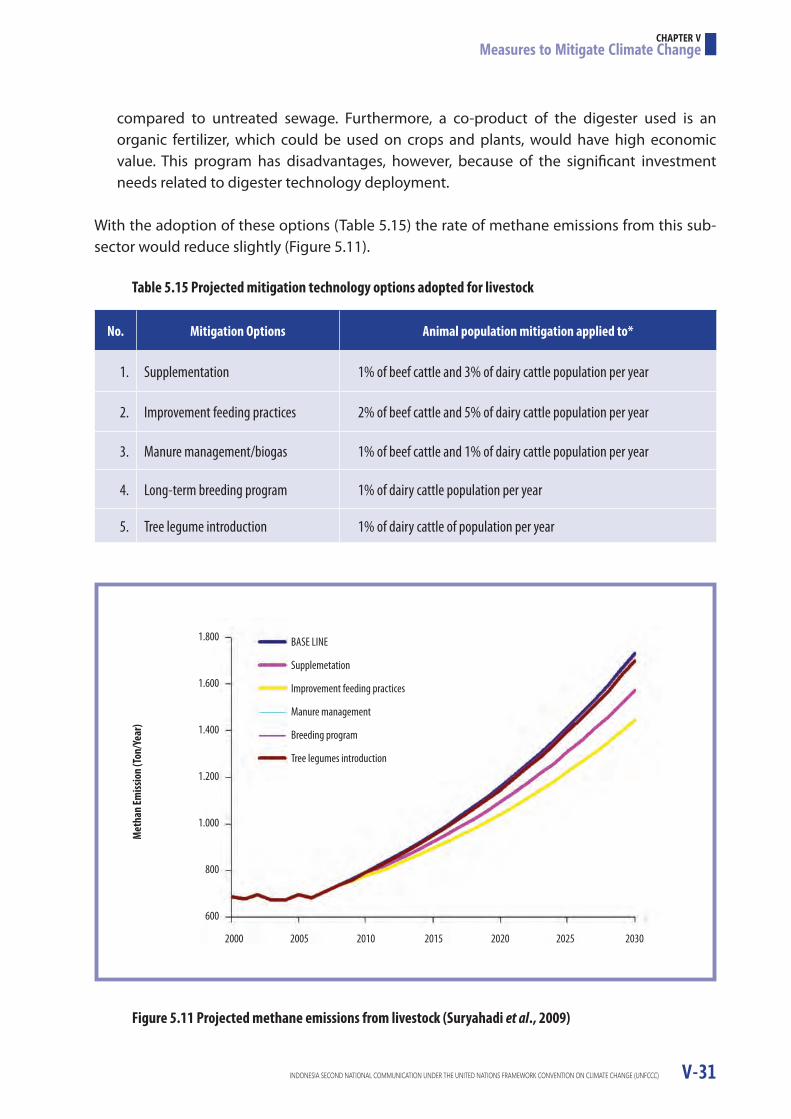
IndonesIa second natIonal communIcatIon under the unIted natIons Framework conventIon on clImate change (unFccc)
compared to untreated sewage. Furthermore, a co-product of the digester used is an organic fertilizer, which could be used on crops and plants, would have high economic value. This program has disadvantages, however, because of the significant investment needs related to digester technology deployment.
With the adoption of these options (Table 5.15) the rate of methane emissions from this sub-sector would reduce slightly (Figure 5.11).
Table 5.15 Projected mitigation technology options adopted for livestock
Figure 5.11 Projected methane emissions from livestock (Suryahadi et al., 2009)
No. Mitigation Options Animal population mitigation applied to*
1. Supplementation 1% of beef cattle and 3% of dairy cattle population per year
2. Improvement feeding practices 2% of beef cattle and 5% of dairy cattle population per year
3. Manure management/biogas 1% of beef cattle and 1% of dairy cattle population per year
4. Long-term breeding program 1% of dairy cattle population per year
5. Tree legume introduction 1% of dairy cattle of population per year
CHAPTER VMeasures to Mitigate Climate Change
V-31
2000 2005 2010 2015 2020 2025 2030
1.800
1.600
1.400
1.200
1.000
800
600
Met
han
Emiss
ion
(Ton
/Yea
r)
BASE LINE
Supplemetation
Improvement feeding practices
Manure management
Breeding program
Tree legumes introduction
IndonesIa second natIonal communIcatIon under the unIted natIons Framework conventIon on clImate change (unFccc)
5.6 Waste
Municipal solid waste (MSW) landfills are the most significant of GHG emission sources within this sector. Other major sources are industrial solid waste, domestic liquid waste and industrial liquid waste. The national generation of MSW was approximately 47.8 million tons in 2000 and increased to 48.7 million tons in 2005 (estimated from population data and waste generation factors given by Profil Nasional Program Bangun Praja from Ministry of Environment, 2004]. In urban areas of big cities, almost 60% of waste is brought to a solid waste disposal site (SWDS), while in small cities and rural areas, only 30% of waste is brought to a SWDS (Indonesian Statistical Data on Environment, BPS, 2000-2007). The major components of the solid waste brought to SWDS are organic compounds because other types of waste (i.e., plastics, metal, etc.) are generally recycled for reutilization. The SWDSs in most big cities of Indonesia are considered to be unmanaged SWDS (an open dumping system). Currently, incinerators for MSW are generally not used in Indonesia. Although several statistical data indicate that inceration is already used for eliminating MSW, the so-called ‘incinerator’ is actually an ‘open burning’ system.
The main source of industrial solid waste is from agro industries, particularly empty fruit bunches (EFBs) generated from palm oil mills. The total amount of waste in 2000 was 6.3 million tons and increased to 12.5 million tons in 2005. The amount of this waste was estimated from waste generation factor (CDM Project Surveys by EcoSecurities, 2007) and palm oil production rates (Central Bureau of Statistic Indonesia, 2007). The current practice for handling EFBs is open dumping (unmanaged) within the vicinity of the palm oil mills.
Domestic wastewater, represented by biological oxygen demand (BOD), was equal to 3 million tons BOD in 2000 and it increased to 3.2 million tons BOD in 2005. Industrial wastewater produced, expressed in terms of TOW was equal to about 23.6 million tons COD in 2000 and 23.7 million tons COD in 2005. The major contributor to industrial wastewater COD is pulp and paper industries. Production of this waste will increase in the future.
To reduce emissions from solid waste, the Government of Indonesia enacted Municipal Solid Management Law No. 18/2008. According to the Law, open dumping practices will be prohibited in the year 2013. It is expected that the Law will encourage the development of a more managed waste handling system (i.e., a sanitary landfill equipped with gas flaring or utilization systems). The GOI expects that after 2020, around 80% of the domestic liquid waste will be handled by sewerage systems.
To estimate future emissions, three scenarios have been established: (a) the BAU scenario assumes that emissions growth will follow historical trends, without any efforts or programs related to climate change mitigation; (b) emissions reductions are to be achieved through implementation of Municipal Solid Management Law No. 18/2008; and (c) further emissions reductions from the waste sector are to be achieved through the implementation of Municipal Solid Management Law No. 18/2008 combined with international funding (CDM scheme or
CHAPTER VMeasures to Mitigate Climate Change
V-32

IndonesIa second natIonal communIcatIon under the unIted natIons Framework conventIon on clImate change (unFccc)
other schemes). The projection of the BAU and the other two alternative scenarios is presented in Table 5.16.
Based on the emissions projection analysis, it was found that by 2020, the rate of net emissions under mitigation scenario 1 reached 31% of the BAU emissions and that under mitigation scenario 2, it could reduce up to 48% (Figure 5.12). Net emissions under BAU in 2020 are expected to be approximately 2.95 Gt CO2 – more than double the emissions in year 2000.
Table 5.16 Projection of GHG emissions from waste sector under BAU and alternative scenarios (Dewi et al., 2009)
Figure 5.12 Projection of emissions of all sectors under BAU and mitigation scenarios (MoE, 2009). Note: Contribution of transportation sector to the total energy emission is approximately 20% (based on emissions data from 2000-2006).
Scenario Mitigation
2010 2020 2025
BAU S1 S2 BAU S1 S2 BAU S1 S2
Total MSW 19,691 19,199 18,706 22,198 19,423 17,204 23,562 20,028 17,672
Unmanaged Dumpsite (CPO) 11,289 10,725 10,443 13,269 10,615 9,288 14,385 10,069 8,631
Domestic WWT and Discharge 13,568 12,890 12,551 15,287 12,230 10,701 16,227 11,359 9,736
Industrial WWT and Discharge 149,818 142,327 138,582 199,477 159,581 134,647 224,411 157,088 123,426
Total Emission 194,367 185,141 180,282 250,231 201,849 171,839 278,585 198,544 159,465
Emiss
ion/
Rem
oval
(GtC
O 2)
5.0
4.0
3.0
2.0
1.0
0.0
-1.0
-2.0
2000 2005 2010 2015 2020 2025
BAU
Miti
-1
Miti
-2
BAU
Miti
-1
Miti
-2
BAU
Miti
-1
Miti
-2
BAU
Miti
-1
Miti
-2
BAU
Miti
-1
Miti
-2
BAU
Miti
-1
Miti
-2
Peat Fire
Peat Emission
Waste
Forestry Emission
Forestry Removal
Agriculture
Industry
Energy
CHAPTER VMeasures to Mitigate Climate Change
V-33

IndonesIa second natIonal communIcatIon under the unIted natIons Framework conventIon on clImate change (unFccc)V-34

IndonesIa second natIonal communIcatIon under the unIted natIons Framework conventIon on clImate change (unFccc)
CHAPTER VI
OTHER INFORMATION
Other information considered relevant to the achievement of the objectives of the Convention includes (i) technology transfer, (ii) Research, (iii) systematic observations, (iv) information on education, training, public awareness and capacity-building and (v) efforts to promote information sharing.
6.1 Transfer of Technology
Transfer of technologies related to climate change occurs through the implementation of CDM projects. At present, Designated National Authorities for CDM, KOMNAS MPB, has approved about 104 CDM projects. Of this, about 24 projects have been registered at the Executive Board (www.dna-cdm.menlh.go.id/id/database). Most of the proponents of the CDM projects are private companies. However, NGOs play important roles in the implementation of adapatation and mitigation activities with local communities. Based on data from the SGP-GEF UNDP program, there are about 18 NGOs working on climate change mitigation projects. This NGO work is predominantly centered in Java (Figure 6.1) and the focus of their activities is mostly on the energy and waste sectors.
Figure 6.1 Number of NGOs working in climate change mitigation activities on energy and waste sectors (Boer et al., 2008)
VI-1
Num
ber o
f NGO
s
Province
10
8
6
4
2
0
Aceh
DKI J
akar
ta, J
ava
Wes
t Jav
a
Cent
ral J
ava
East
Java
East
Kalim
anta
n
Lam
pung
, Sum
ater
a
Sout
h Sula
wesi
Cent
ral S
ulawe
si
Papu
a
Wes
t Kali
man
tan
Sout
h Kali
man
tan
Wes
t Nus
a Ten
ggar
a
North
Sulaw
esi
Riau
Sout
h Sum
ater
a
Cent
ral K
alim
anta
n
Sout
h Eas
t Sula
wesi
Bali
Othe
r Pro
vince

IndonesIa second natIonal communIcatIon under the unIted natIons Framework conventIon on clImate change (unFccc)
Several NGOs,especailly those who have technical competencies, act also as CDM or voluntary carbon project developers. NGOs or some international NGOs who have technical expertise on digester construction, in collaboration Agency for Rural Technology Development (LPTP, Lembaga Pengembangan Teknologi Pedesaan), have provided technical assistance for designing the necessary infrastructure for community. NGOs receive funds as grants from a number of development agencies. Often these funds are distributed through development aid programs and INGOs (International NGOs).
6.2 Research
Research activities related to climate are implemented by many research agencies and universities. Some international organizations based in Indonesia recently have also focused their research activities on climate change. Based on a survey conducted in 2007 of nine organizations working on climate related activities (Boer and Kartikasari, 2007), it was found that research activities conducted by the agencies was quite variable. Research activities on climate applications were mainly conducted by the Research Agency on Agro-climatology and Hydrology (BALITKILIMAT) and Bogor Agriculture University (IPB), climate early warning systems by LAPAN (National Agency for Aviation and Space) and BMKG (National Agency for Meteorology, Climatology and Geophysics), and weather modification by the Agency for Technology Assessment and Application (BPPT). Basic research on weather and climatology modeling were conducted by LAPAN, Bandung Institute of Technology (ITB), BMKG and IPB. Most NGOs have no research activities. However at present, many NGOs also conduct climate research activities and mostly the research were conducted in collaboration with universities and research agencies. At present, research activities on climate change for agriculture sector is coordinated by Indonesian Agency for Agriculture Research and Development through Indonesia Centre for Land Resources Research and Development that have four research agencies namely Agro-climate and Hydrology Research Institute (BALITKILIMAT), Agriculture Environment Research Institute (BALINGTAN), Soil Research Institute (BALITTANAH), and Swampy Land Research Institute (BALITRA).
The number of research scientists in the surveyed research agencies and the universities that hold advanced degree is about 90 people (33 PhD and 57 Master). About 29% have expertise in the area of applied meteorology or applied climatology, 23% meteorology, 16% climatology or climate modeling, 10% atmospheric chemisty of air pollution, 10% hydrology or hydrometeorology, the remaining are atmospheric physics/radars atmosphere, GIS/Remote sensing, microclimatology, geography, astronomy and meteorology instrumentation. The scientists with expertise in applied climatology concentrates in IPB and BALITKLIMAT, while those with expertise in climatology/meteorology concentrate in ITB, BPPT, LAPAN and BMG (Boer and Kartikasari, 2007). However, recently some of the agencies have expanded their research activities to climate application. For example, BMKG has established a new agency called the Research Centre on Climate Change and Air Quality. Some universities have also established new climate research centers.
CHAPTER VIOther Information
VI-2

IndonesIa second natIonal communIcatIon under the unIted natIons Framework conventIon on clImate change (unFccc)
To accelerate the development of mitigation and adaptation technologies, in 2008 the Govern-ment of Indonesia under the coordination of the Ministry of Agriculture has established the Research Consortium on Climate Variability and Climate Change (especially for Agriculture Sector). This consortium plays role in (i) coordinating each sector’s adaptation research resources to more effectively support climate change decision-making, including the brokering of research partnerships and providing a vehicle to commission new integrated research; (ii) Synergizing research programs and activities on climate change and establishing a road map in mitigating and adapting to climate change, (iii) building the capacity of the Indonesia research community to generate information relevant to decision-makers; (iv) establishing an interface between researchers and decision-makers; (v) promoting coordinated programmes of work on impacts and adaptation across Indonesia, working in collaboration with stakeholders and other researchers in national, regional and sectoral contexts, (vi) synthesizing policy and developing sectoral roadmap for addressing climate change for 2010-2050, (vii) delivering the information to support climate change adaptation decision-making at the national, regional and local levels through coordination, integration, synthesis and communication of research.
The consortium conducts research and development activities on inventories, mitigation and adaptation, which include the following: (i) development of GHG emission and removal factors and methods for improving activity data, (ii) identification and development of mitigation technologies potential for carbon trading as well as the development of baseline and monitoring methodologies for the technologies as required by the CDM Executive Board, and (iii) conducting policy research on maintaining food crop self sufficiency under changing demography, socio-economic, land use and climate (e.g. mapping vulnerable areas to climate change, strategies for coping with the climate changes etc). The Ministry of Agriculture for the fiscal year of 2008/2009 and 2009/2010 have allocated research funds from the National Budget for the consortium by about 0.4 Million USD. The Ministry of Research and Technology through BPPT for the fiscal year of 2008/09 has also allocated about 1.5 Million USD to implement research activities on climate change. There are many climate change research activities implemented by other research agencies using national budget. However the data and information on this is not well documented.
6.3 Systematic Observations
Systematic observation of the climate in Indonesia is coordinated by the National Agency for Meteorology, Climatology and Geophysics (BMKG). Rainfall Observation Networks exist since Dutch Colonial Era. After independence, more rainfall stations were installed, however, the efforts are still far from enough to have a representative number of stations across the country. The total number of rainfall observation network (rain gauges) is about 5,000 gauges. Most of the gauges are located in Java and then followed in Sumatra, Sulawesi, Maluku, Kalimantan and Papua (Table 6.1). The ideal number of rain gauges to meet the WMO standard for Indonesia is about 20,000 gauges (Sribimawati, 1999). In addition to the rain gauges stations, BMKG also installed a number of automatic weather stations (AWS) and Radar in a number of places
CHAPTER VIOther Information
VI-3

IndonesIa second natIonal communIcatIon under the unIted natIons Framework conventIon on clImate change (unFccc)
particularly in areas prone to weather/climate hazards. In collaboration with WMO, BMKG has also established one Global Atmospheric Watch (GAW) in Bukittinggi, West Sumatra. With the presence of the GAW, Indonesia becomes part of the global atmospheric observation under World Weather Watch.
Indonesia has installed a number of instruments to monitor sea level (Figure 6.2). The existing Indonesia Sea Level Monitoring Network consists of 65 operational stations. More stations will be installed through an ongoing program called the establishment of Indonesia Tsunami Early Warning System (IndTEWS). The network will consist of 120 stations of which 80 stations will use real time data transmission and at least two quality sea level recordings. Solar cell power supplies for each station have been installed to ensure an availability of backup power for continuous measurement.
Table 6.1 Rain gauges density in Indonesia
Figure 6.2 Existing operational Sea Level Monitoring Stations in Indonesia (MoE, 2008)
No. Island Rain gauge density per 100 km2
1 Java 11.62 Sumatra 0.873 Sulawesi 0.674 Maluku 0.465 Kalimantan 0.186 Papua 0.057 Other island 0.67-1.14
Source: Sribimawati et al. (1999)
CHAPTER VIOther Information
VI-4
95
95
5 5
0 0
-5 -5
-10
-10
100
100
105
105
110
110
115
115
120
120
125
125
130
130
135
135
140
140
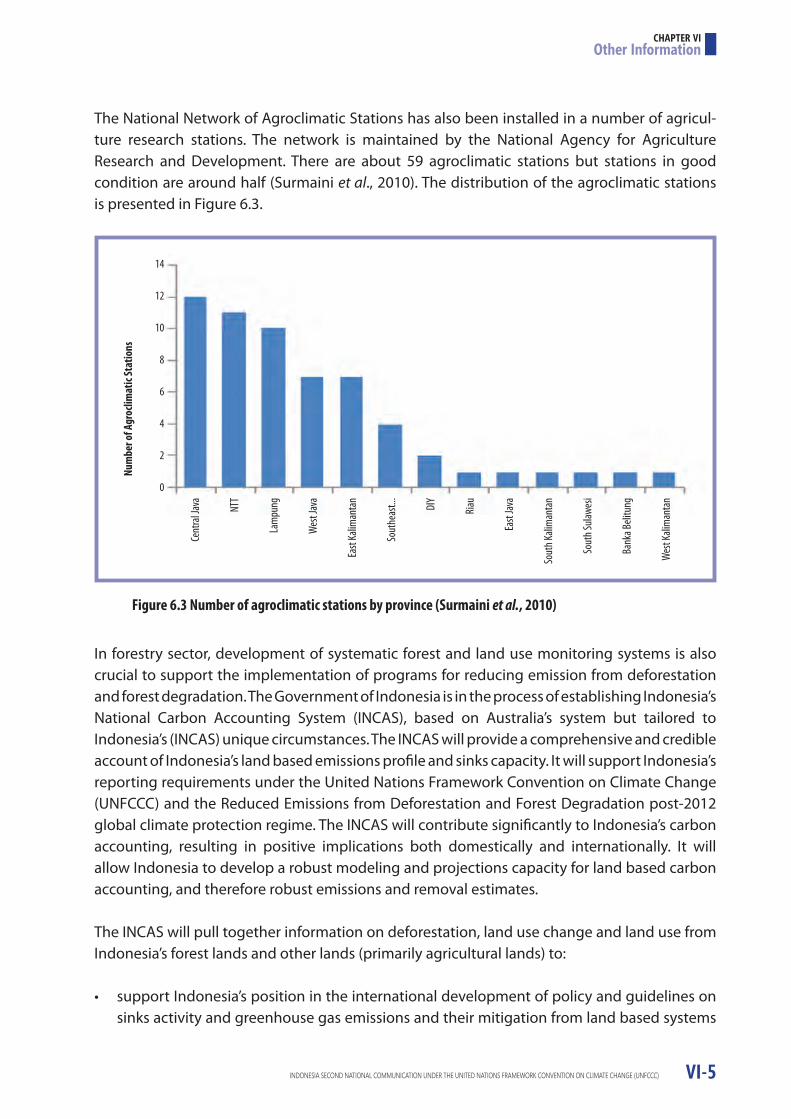
IndonesIa second natIonal communIcatIon under the unIted natIons Framework conventIon on clImate change (unFccc)
The National Network of Agroclimatic Stations has also been installed in a number of agricul-ture research stations. The network is maintained by the National Agency for Agriculture Research and Development. There are about 59 agroclimatic stations but stations in good condition are around half (Surmaini et al., 2010). The distribution of the agroclimatic stations is presented in Figure 6.3.
In forestry sector, development of systematic forest and land use monitoring systems is also crucial to support the implementation of programs for reducing emission from deforestation and forest degradation. The Government of Indonesia is in the process of establishing Indonesia’s National Carbon Accounting System (INCAS), based on Australia’s system but tailored to Indonesia’s (INCAS) unique circumstances. The INCAS will provide a comprehensive and credible account of Indonesia’s land based emissions profile and sinks capacity. It will support Indonesia’s reporting requirements under the United Nations Framework Convention on Climate Change (UNFCCC) and the Reduced Emissions from Deforestation and Forest Degradation post-2012 global climate protection regime. The INCAS will contribute significantly to Indonesia’s carbon accounting, resulting in positive implications both domestically and internationally. It will allow Indonesia to develop a robust modeling and projections capacity for land based carbon accounting, and therefore robust emissions and removal estimates.
The INCAS will pull together information on deforestation, land use change and land use from Indonesia’s forest lands and other lands (primarily agricultural lands) to:
• support Indonesia’s position in the international development of policy and guidelines on sinks activity and greenhouse gas emissions and their mitigation from land based systems
Figure 6.3 Number of agroclimatic stations by province (Surmaini et al., 2010)
CHAPTER VIOther Information
VI-5
Num
ber o
f Agr
oclim
atic
Stat
ions
Cent
ral J
ava
NTT
Lam
pung
Wes
t Jav
a
East
Kalim
anta
n
Sout
heas
t...
DIY
Riau
East
Java
Sout
h Kali
man
tan
Sout
h Sula
wesi
Bank
a Beli
tung
Wes
t Kali
man
tan
14
12
10
8
6
4
2
0

IndonesIa second natIonal communIcatIon under the unIted natIons Framework conventIon on clImate change (unFccc)
• Reduce the scientific uncertainties (particularly about peat) that surround estimates of emissions and removals of both CO2 and non-CO2 greenhouse gases from land use change. • Provide monitoring capabilities for existing emissions and sinks, and scenario develop- ment and modeling capabilities that support greenhouse gas mitigation and the sinks development agenda through to 2010 and beyond.• Provide the scientific and technical basis to international negotiations and promote Indonesia’s national interests in international fora.• Develop a comprehensive GIS that includes digital map-based information such as soil maps, remotely sensed images covering the whole of Indonesia and climate and vegeta- tion data.• Support Indonesia’s negotiations on REDD and provide the necessary inputs required for establishing a credible Reference Emission Level.
In relation to forestry sector, Indonesia is developing Indonesia’s Forest Resource Information System (FRIS). FRIS will be a comprehensive and transparent information management system to support effective planning and forest management decision making for forest lands in Indonesia. The FRIS will allow the Ministry of Forestry to monitor forest productivity, yield and growth, harvesting rates, age class, species and forest area among other things. It will also compile critical information on deforestation, land use and land use change within Indonesia’s forest lands to support a post-Kyoto climate protection regime that seeks to reduce emissions from deforestation and forest degradation (REDD). Combining this data within a single system will provide a good basis for planning and decisions on sustainable forest management.
A lack of reliable information on forest resources has been identified as a major impediment to sustainable forest management in Indonesia. Such information gaps are hampering efforts to monitor deforestation and forest degradation, sustainably manage forest resources, combat illegal logging, protect biodiversity and reduce carbon emissions from land use change. Improving forest information is crucial in the context of the emerging need for the Government of Indonesia to document carbon stocks in forests and greenhouse gas emissions related to land use change and to participate in carbon markets for avoided deforestation and degradation.
6.4 Information on Education, Training, Public Awareness and Capacity Building
Between 2000 and 2008, there were about 91 training, public awareness and capacity building activities related to climate change conducted in Indonesia. This record may be much lower than the actual activities since many of climate change capacity building activities have not been recorded by related agencies. There is no system in place at present to record and monitor the outcome of the activities. However, this data may reflect the level of Annex 1 participation in supporting capacity building programs in Indonesia. The data suggests that most capacity building activities were supported by Japan, Germany, ADB and the World Bank (Figure 6.4). Again, the number of activities does not necessarily reflect the amount of funding being
CHAPTER VIOther Information
VI-6
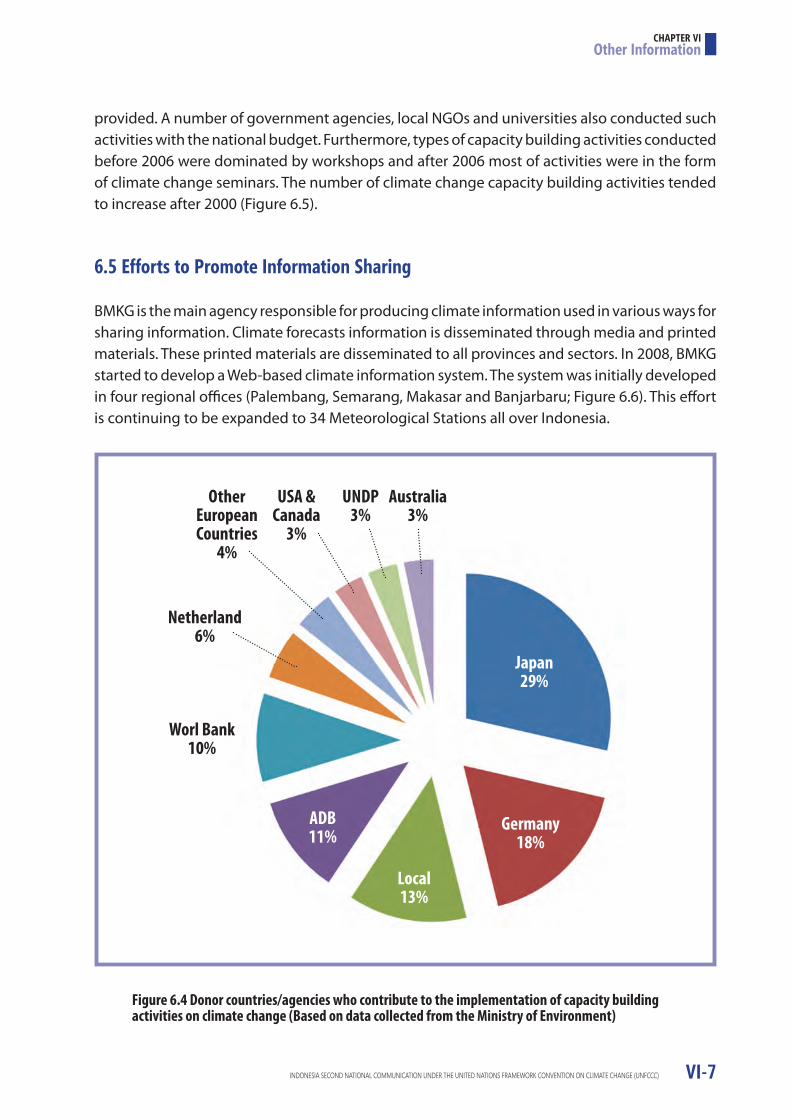
IndonesIa second natIonal communIcatIon under the unIted natIons Framework conventIon on clImate change (unFccc)
provided. A number of government agencies, local NGOs and universities also conducted such activities with the national budget. Furthermore, types of capacity building activities conducted before 2006 were dominated by workshops and after 2006 most of activities were in the form of climate change seminars. The number of climate change capacity building activities tended to increase after 2000 (Figure 6.5).
6.5 Efforts to Promote Information Sharing
BMKG is the main agency responsible for producing climate information used in various ways for sharing information. Climate forecasts information is disseminated through media and printed materials. These printed materials are disseminated to all provinces and sectors. In 2008, BMKG started to develop a Web-based climate information system. The system was initially developed in four regional offices (Palembang, Semarang, Makasar and Banjarbaru; Figure 6.6). This effort is continuing to be expanded to 34 Meteorological Stations all over Indonesia.
Figure 6.4 Donor countries/agencies who contribute to the implementation of capacity building activities on climate change (Based on data collected from the Ministry of Environment)
CHAPTER VIOther Information
VI-7
Australia3%
UNDP3%
USA &Canada
3%
OtherEuropeanCountries
4%
Netherland6%
Worl Bank10%
ADB11%
Local13%
Germany18%
Japan29%

IndonesIa second natIonal communIcatIon under the unIted natIons Framework conventIon on clImate change (unFccc)
Figure 6.6 Development of web-based climate information system at four regional offices (Provided by the BMKG)
Figure 6.5 Types of capacity building activities on climate change by year (Based on data collected from the Ministry of Environment)
WEB-BASE DISSEMINATION SYSTEM OF CLIMATOLOGY DATA
Staklim Pulau Baai, Bengkulu
Staklim Semarang, Jawa Tengah
Staklim Banjarbaru, Kalimantan Selatan
Staklim Maros, Sulawesi Selatan
NCC_CMSS
CCU
CCU backupASCII Printer
Network Printer HPBackup regional
KMY01
Komputer
Komputer Komputer
KomputerModem
Modem Modem
ModemVSAT IP
VSAT IP VSAT IP
VSAT IP
VSAT IPVSAT Link
WEBKLIM ServerSistem Database Klimatologi(CLISYS)
Router KMY1Cisco 2611
CHAPTER VIOther Information
VI-8
Num
ber o
f Act
iviti
es
18
16
14
12
10
8
6
4
2
0 2000 2001 2002 2003 2004 2005 2006 2007 2008
Debate Forum
Roundtable Discussion
Training
Seminar
Workshop

IndonesIa second natIonal communIcatIon under the unIted natIons Framework conventIon on clImate change (unFccc)
CHAPTER VII
OBSTACLES, SHORTAGES AND NEEDS RELATED TO FUNDING, TECHNOLOGY AND CAPACITY
As a country with high vulnerability to the impacts of climate change, Indonesia must have a response to address climate change both in mitigation and adaptation activities. However, in its position as developing country, Indonesia has several limitations in funding in the frame of climate change anticipation as well as developing and disseminating environmentally friendly technology. Therefore, the problems of technology transfer and funding are two issues that should receive support from international community. Additional important activities, which will ensure success of mitigation and adaptation program, are awareness, education, empowerment and capacity building.
Different from climate change mitigation, climate change adaptation has received limited attention from key-stakeholders in Indonesia and donors. Consultations reveal that various activities are ongoing, but that there is an urgent need to start systematically addressing climate change adaptation in a coordinated manner. Coordination within and between the governments and the donor communities is challenging. Activities related to climate change adaptation are still limited but likely to increase rapidly. Both government and development partners have expressed the need to ensure that addressing climate change adaptation will be effectively coordinated. This is of great importance considering the expected scale of required interventions. It has become clear that the national capacity needs to be substantially strengthened, especially in terms of policy advice, technical assistance, and capacity development.
From national consultation, it was revealed that strengthening national capacity to adapt to increasing future climate will need (UNDP CO, Jakarta, 2007):
1. Strong political consensus and multi-sectoral policy coordination among key-stakeholders to address climate change adaptation in the framework of national development planning needs. Climate change, a cross-sectoral issue, will require long term commitment. Key- ministries, institutions and development partners should have a common platform on the necessity to address climate change adaptation. Full support for the process of developing a national strategy and a longer-term programme is essential. Related to the future implementation of the strategy and programme, donor coordination and dissemination of information should be strengthened.
2. A broadly supported National Strategy for Climate Change Adaptation developed in a transparent and consultative manner.
VII-1

IndonesIa second natIonal communIcatIon under the unIted natIons Framework conventIon on clImate change (unFccc)
3. Availability of a longer-term climate change adaptation programme. Considering the com- plexities, scale and cross-sectoral nature of climate change impacts, the programme should provide an umbrella framework to systematically address climate change adapta- tion at the national, regional, and local levels. Expertise and experience from all these levels and abroad will be brought in the preparation to ensure a comprehensive and high quality programme. Active involvement of the key-stakeholders, particularly of the rele- vant ministries, institutions and development partners is needed to ensure the program- me is fully supported in its development and implementation.
7.1 Climate Change Funding
Due to limitated funding capacity through the national budget, the GOI Indonesia will try to create various funding schemes, from domestic sources as well as from bilateral and multilateral sources to support the national planning effort on climate change mitigation and adaptation. The GOI recognizes several funding mechanisms as important vehicles for climate change related activities (see Figure 7.1), as follows:
Figure 7.1 Climate Change Financing Scheme (BAPPENAS, 2009)
CHAPTER VIIObstacles, Shortages and Needs Related to Funding, Technology and Capacity
VII-2
Sources:
Global Financing Mechanism
1. ODA*) Rules and Regulations:
GOI Mechanisms**)
CC (Local) Trust Fund
Debt for Nature Swap
Grant
Loan:1. UNFCCC Financing Mechanism:
GEF (Convention):Special Climate Change Fund (SCCF)
1. Sector/Project Loan
2. Program LoanAdaptation Fund (Protocol)
OTHERS: GEF (Non-Convention):Strategic Priority on Adaptation (SPA)Resource Allocation Framework (RAF)
Bilateral
Multilateral
Bilateral:Japan (JBIC & JICA)Englang (DFID)Australia (AusAID)Denmark (DANIDA)NetherlandsGerman (Kfw & Gtz)NorwayCanada (CIDA)Sweden (SIDA)
Multilateral:World BankADBUNDPEC
CDM:Bilateral, Multilateral & Unilateral Notes:
*): expected come from additional existing ODA comittment from Monterey Concensus (ODA+)**): comply with Government Regulation No.2/2006, Climate Change Program Loan
IndonesIa second natIonal communIcatIon under the unIted natIons Framework conventIon on clImate change (unFccc)
1. United Nation Convention for Climate Change (UNFCC) mechanism: Global Environmental Fund (GEF), Special Climate Change Fund (SCCF), Adaptation fund (Protocol)2. Official Development Assistance (ODA) mechanism: a. Current scheme: • Bilateral grant and multilateral institution (ODA and ODA+) • Loan (ODA dan ODA+): • Sectoral/project loan – funds activities in a specific sector or project • Program loan – support policy reform on climate change and fiscal deficit b. Alternative scheme: • Trust Fund International (Climate Investment Fund/CIF - ODA) • Indonesian Climate Change Trust Fund Indonesia (Managed by GOI and Donors) – (ODA)3. Carbon investment: Bilateral, Multilateral, and Unilateral
The GOI will apply the rule and procedures under UNFCC and ODA financing mechanism for climate change financing schemes. The GOI prioritizes grant utilization to finance climate change sectoral priorities implementation. Loan resources can only be utilized when grant funding is insufficient. However, utilization of loans should be the last alternative for climate change financing. Climate change grant financing must comply with the following guidance:
1. Grant financing focus on sector priorities as mentioned in National Development Planning Response to Climate Change called the Yellow Book2. Grant financing that originates from UNFCC, ODA, or other financing mechanism must comply with GOI laws and regulation3. Grant financing must be recorded into the state budget and must follow the Decree of Director General on State Treasury No. PER-67/PB/2006 on Procedures on Registration and Legalization of Foreign Grant
To efficiently and effectively utilize the foreign financing that has been allocated to address climate change related problem, then strengthening the project planning system, improving the monitoring and evaluation system, and synchronizing the financial and procurement systems between government and donors should continuously be made. Taking these steps will ensure that foreign grants and loans match national development priorities and leads to an enhanced level of accountability.
7.2 Technology
Research and technology are needed to adapt and mitigate climate change. Low carbon emission and energy efficient technology is needed immediately to reduce GHG emission in the sectors that consume energy such as power plants, industry, transportation, as well as household and commercial sectors. Real time monitoring and the use of sophisticated fire fighting technology and peat management is required to control emission from forest/peat fire
CHAPTER VIIObstacles, Shortages and Needs Related to Funding, Technology and Capacity
VII-3

IndonesIa second natIonal communIcatIon under the unIted natIons Framework conventIon on clImate change (unFccc)
and peat decomposition. Peat lands store large amounts of carbon stocks that, if released, can greatly contribute to global climate change. Although there are many uncertainties regarding Indonesia’s GHG emissions, it is generally agreed that peatland degradation is the main source, together with deforestation. Proper management of peatlands is therefore critical to Indonesia’s efforts in combating climate change.
Furthermore, for adaptation need in agriculture sector, technology to develop plant varieties that are resilient to climate change impact is required. Agricultural technology that saves water also should be implemented to anticipate water scarcity during longer dry seasons. To increase the preparedness of various parties in addressing the conditions of extreme climate, Indonesia needs weather prediction technology that can produce more accurate results. With this technology, fisherman and farmers can plan more proactively for their activities, thus reducing the losses that they may suffer because of the extreme climate and weather events (drought, storm etc.). In addition, early warning technology should also be implemented to reduce the general public’s exposure to the negative impacts related with extreme climate. International cooperation and transfer of technology should be strengthened to share the benefit of technological knowledge worldwide. Indonesia needs to prioritize the development of low-cost technologies with substantial local content.
Indonesia assigns priority to climate change adaptation programs in the four following areas: (i) coastal areas, (ii) food insecure areas in eastern Indonesia, (iii) small islands, and (iv) Java’s northern coast, the nation’s key rice production areas (BAPPENAS, 2009). Coastal areas are among the areas most affected by sea-level rise and land subsidence-induced environmental degradation. Both have exposed coastal areas to regular flooding and have significant economic and social impacts. As these communities are at the forefront of adapting to climate change, focused regional approach is warranted. Investing in coastal areas to adapt to sea-level rise is a key to meet the MDGs.
In food insecure areas in eastern Indonesia such as Sulawesi, NTT and NTB, the ENSO signal is very strong (Gianinie et al., 2007; Moron et al., 2009). Strong El-Niño events normally cause the problem of false rains, in which isolated rainfall events around the expected onset date do not signal the sustained onset of the monsoon thus shortening the length of rainy season. This condition leads to farmers experiencing repeated crop failures and rendering it possible only to plant crops once in that year. Crop failure due to drought during the 2006/07 El-Niño for example, increased the reliance of NTT farmers to government aid. In normal years, contribution of government aid to farmers’ total income was only 5% but in 2006 El-Niño year, it increased to 60% (Kieft and Soekarjo, 2007). This, combined with already low general human development, has triggered a decline in child health nutrition, a key MDG indicator. Current development approaches employed have proven ineffective, thus calling for efforts to enhance local capacity to adapt to the changing climate.
Java’s northern coast is also strongly affected by ENSO. Local action will place an emphasis on the provinces of West and East Java. Increased pressure on these lands due to continued
CHAPTER VIIObstacles, Shortages and Needs Related to Funding, Technology and Capacity
VII-4

IndonesIa second natIonal communIcatIon under the unIted natIons Framework conventIon on clImate change (unFccc)
urban growth and relative limited expansion of agricultural lands outside Java has deepened the strategic importance of the Java “rice basket” to ensure national food security. Increased frequency of ENSO events is leading to increased crop losses in these areas. An integrated approach that is smallholder-driven and that includes technology development and spatial planning is a key.
Sea level rise and changing rainfall patterns in combination with extreme wave and high tide are threatening small islands. These undermine the local economy and ecology and may also lead to the loss of the small islands. Programs in these areas should focus on enhancing general human development while strengthening ecological sustainability. More effort will be put on developing adaptation and mitigation measures for small islands.
To increase the resilience of the sectors and community to current and future climate risk, the development and implementation of a comprehensive communications strategy to increase the capacity in using climate information is needed as well as institutionalizing the use of climate information. The development and promotion of tools for adaptation planning tailored to user’s requirements that include (i) decision-support tools such as methods for assessing the costs and benefits of adaptation strategies, and guides for risk management, (ii) methods for understanding social impacts, and (iii) a national ‘one stop shop’ website where decision-makers and their advisers can access information about climate projections, likely climate change impacts, tools, guides and approaches to adaptation planning will be required.
7.3 Awareness, Education, Empowerment and Capacity Building
Raising the awareness of every citizen on the importance of climate change and integrating climate change issues into national education is essential to ensuring public buy-in and the success of mitigation and adaptation programs. Changing human behaviour in order to respect natural environment, and thereby minimizing human impacts on the environment, must occur at all level of society. Climate change is an effective entry point to raise public awareness about the need to develop in a more responsible and suitable manner.
Human resources will need to be strengthened to ensure the efficient and effective implementation of climate change initiatives. Capacity building and empowerment of all related stakeholders will take place, with emphasis on local government and civil society as they will be the key implementers of change at the regional and local level. Capacity building will include immediate steps as well as longer-term efforts and it will consider the complexity of the many sectors involved in climate change.
Our knowledge on the uncertain future climate and its impact is still limited. In spite of this uncertainty, the ability to generate access and interpret information on climate change and its likely impacts is crucial. Further, it is equally important to develop suitable methods for identifying and assessing potential adaptation strategies. Knowledge and methods will need
CHAPTER VIIObstacles, Shortages and Needs Related to Funding, Technology and Capacity
VII-5

IndonesIa second natIonal communIcatIon under the unIted natIons Framework conventIon on clImate change (unFccc)
to span across disciplines, including climate science, biophysical sciences, engineering, social sciences, economics, and planning. Implementation of pilot projects on addressing climate change is very important to generate best practices on how we can improve our resilience to future climate risk.
CHAPTER VIIObstacles, Shortages and Needs Related to Funding, Technology and Capacity
VII-6
IndonesIa second natIonal communIcatIon under the unIted natIons Framework conventIon on clImate change (unFccc)
REFERENCES
Achanta, A.N., and R. Kanetkar. 1996. Impact of Climate Change on Forest Productivity: A Case Study of Kerala, India. Paper presented at the Asia and Pacific Workshop on Climate Change Vulnerability and Adaptation Assessment, January 15-19, Manila, the Philippines.
ADB and BAPPENAS. 1999. Planning for the Fire Prevention and Drought Management. Final Report. Asian Development Bank and National Planning Agency, Jakarta.
Adi, A.C., Boer, R., Gunardi, Boedoyo, S., and Bey. A.: 1999. ‘Integrated Analysis of GHG Emissions and Sequestration’. Paper presented at International Symposium on Land Use and Forest Management to Mitigate Climate Change.
ADPC, 2000. ENSO impact and potential forecast applications in Indonesia. Extreme Climate Events Program. Asian Disaster Preparedness Center, Bangkok, Thailand. 90p.
ADRC. 2005. Total Disaster Risk Management: Good Practices. Asian Disaster preparedness Centre. Kobe, Japan.
Agus, F., I. Irawan, H. Suganda, W. Wahyunto, A. Setyanto, and M. Kundarto. 2006. Environmental multifunctionality of Indonesian agriculture. Journal Paddy Water Environment 4:181-188.
Aldrian, E and Djamil, S.D. 2006. Long term rainfall trend of the brantas catchment area, East Java. Indonesian Journal of Geography 38:26-40.
Aldrian, E. 2008. PEAT Carbon, fire and climate Interactions. Jurnal Hidrosfir Indonesia 3: 23-32.
Ardiansyah, M. and R. Boer. 2009. Forestry Sector. In MoE. Technical Report on Vulnerability and Adaptation Assessment to Climate Change for Indonesia’s Second National Communication. Ministry of Environment and United Nations Development Programme, Jakarta.
Balitbangtan. 2007. Prospek dan Arah Pengembangan Komoditas Pertanian: Tinjauan Aspek Sumber daya Lahan. Badan Litbang Pertanian. Jakarta.
Bappenas and Bakornas PB. 2006. National action plan for disaster reduction 2006-2009. Office of The State Minister for National Development Planning/ National Development Planning Agency and National Coordinating Agency for Disaster Management. Jakarta.
IndonesIa second natIonal communIcatIon under the unIted natIons Framework conventIon on clImate change (unFccc)
Bappenas, 2008. National Development Planning: Indonesia Response to Climate Change. National Agency for Planning and Development (Bappenas), Republic of Indonesia
Bappenas, 2009. National Development Plan: Indonesian Response to climate change (Yellow Book). National Agency for Planning and Development, Jakarta.
Bappenas, 2009a. Reducing carbon emissions from Indonesia’s peat land. Interim Report of a Multi-Disciplinary Study. National Planning and Development Agency, Jakarta
Bappenas, 2010. Sectoral Roadmap
Bappenas. 2009b. Blueprint for Indonesia Climate Change Trust Fund (ICCTF). National Agency for Planning and Development (Bappenas), Republic of Indonesia.
BAPPENAS/ADB. 1999. Causes, Extent, Impact and Costs of 1997/98 Fires and Drought Final Report, Annex 1 and 2, Planning for Fire Prevention and Drought Management Project (Asian Development Bank TA 2999-INO Fortech, Pusat Pengembangan Agribisnis, Margueles Pöyry, Jakarta, Indonesia.
Boer, R. 2001. Economic Assessment of Mitigation Options for Enhancing and Maintaining Carbon Sink Capacity in Indonesia. Mitigation and Adaptation Strategies for Global Change 6:257-290
Boer, R. A. Buono., A. Rakhman, and A. Turyanti. 2009a. Historical and Future Change of Indonesian Climate. In MoE. Technical Report on Vulnerability and Adaptation Assessment to Climate Change for Indonesia’s Second National Communication. Minisry of Environment and United Nations Development Programme, Jakarta.
Boer, R. and K. Kartikasari, 2007. Assessment of Capacity and Needs to Address Vulnerabilities, Adaptations and Resilience to Climate Risks in Indonesia. Paper submitted to USER - Unit for Social and Environmental Research Faculty of Social Sciences at Chiang Mai University, Bangkok.
Boer, R. and Perdinan. 2008. Adaptation to climate variability and climate change: its socio-economic aspect. Paper presented in the the EEPSEA Conference On Climate Change: Impacts, Adaptation, And Policy In South East Asia With A Focus On Economics, Socio-Economics And Institutional Aspects, 13-15 February 2008, Bali (http://www.eepsea.cc-sea.org)
Boer, R. and Subbiah, A.R. 2005. Agriculture drought in Indonesia. In V.K. Boken, A.P. Cracknell and R.L. Heathcote (eds). Monitoring and predicting agriculture drought: A global study, pp: 330-344. Oxford University Press, New York.
References

IndonesIa second natIonal communIcatIon under the unIted natIons Framework conventIon on clImate change (unFccc)
Boer, R., A. Buono, Sumaryanto, E. Surmaini, A. Rakhman, W. Estiningtyas, K. Kartikasari, and Fitriyani. 2009b. Agriculture Sector. Technical Report on Vulnerability and Adaptation Assessment to Climate Change for Indonesia’s Second National Communication. Ministry of Environment and United Nations Development Programme, Jakarta.
Boer, R., A.R. Subbiah, K. Tamkani, H. Hardjanto., and S. Alimoeso. 2006. Institutionalizing Climate Information Applications: Indonesian Case. In Edited by R. Motha, M.V.K. Sivakumar, and M. Bernardi. Strengthening Operational Agrometeorological Services at the National Level. Proceedings of a Inter-Regional Workshop held 22-26 March 2004 in Manila, Philippines. AGM-9, WMO/TD-No. 1277. Available on line at http://www.wmo.ch/web/wcp/agm/Publications/html/AGM9.htm
Boer, R., and K. Kartikasari. 2007. Assessment of Capacity and Needs to Address Vulnerabilities, Adaptations and Resilience to Climate Risks in Indonesia. Technical Report submitted to USER - Unit for Social and Environmental Research Faculty of Social Sciences at Chiang Mai University. http://www.sea-user.org/download_pubdoc.php?doc=3421
Boer, R., et al., 2007. Deteksi perubahan iklim dan dampak sosio-ekonominya. Laporan Proyek Kerjasama BMG dan IPB, Bogor.
Boer, R., Gintings, A.N. and Bey, A. 1999. Greenhouse Gases Inventory and abatement strategy for forestry and land use change sector. Journal of Agrometeorology 13:26-26
Boer, R., R.G. Dewi, Y. Ismawati, S.D. Anggraini., Y. Ardiansyah, E. Admawaty, Irmaida, and A. Suharto. 2008. Study on local actions in Asia contributing to climate change mitigation and alternative financial mechanism. Project Report Submitted to Institute for Global Environmental Studies. Carbon Environmental Research, Bogor
Boerema, J. 1938. Rainfall Types in Nederlands Indie. Verhandelingen No. 18.
Boland, G.J. M.S. Melzer, A. Hopkin, V. Higgins, and A. Nassuth. 2004. Climate change and plant diseases in Ontario. Can. J. Plant Pathol. 26: 335–350
Bonaro, O., A Lurette,, C Vidal, J Fargues. 2007. Modelling temperature-dependent bionomics of Bemisia tabaci (Q-biotype) Physiological Entomology,32: 50-55
BPS, 2005, “Indonesian Input – Output Data”, Jakarta, Indonesia
BPS, 2007a, “Statistic of Indonesia”, Jakarta, Indonesia
BPS, 2007b, “Stastistik Industri Besar dan Sedang Indonesia (Statistics of Indonesian Large and Medium Industries)”, Jakarta, Indonesia
References

IndonesIa second natIonal communIcatIon under the unIted natIons Framework conventIon on clImate change (unFccc)
BPS, 2009, “Proyeksi Kependudukan Indonesia (The Projection of Indonesian Population) 2000 - 2025”, Jakarta, Indonesia
Bryant, D., L. Burke, J. McManus and M. Spalding. 1998. Reefs at Risk: A Map-Based Indicator of Threats to the World’s Coral Reefs. Washington, D.C.: World Resources Institute.
Chen X, Kimoto M, Takahashi M (2005) Changes in ENSO in response to greenhouse warming as simulated by the CCSR/NIES/FRCGC coupled GCM. SOLA 1:149–152
Collins M (2000a) Understanding uncertainties in the response of ENSO to greenhouse warming. Geophysical Research Letter 27:3509–3513
Collins M (2000b) The El Nin˜ o Southern Oscillation in the second Hadley centre coupled model and its response to greenhouse warming. Journal of Climate 13:1299–1312
Cubasch U, Meehl GA, Boer GJ, Stouffer RJ, Dix M, Noda A, Senior CA, Raper S, Yap KS (2001) Projections of future climate change. In: Houghton JT., Ding Y, Griggs DJ, Noguer M, van der Linden P,Dai X,MaskellK, Johnson CI (eds)Climate change 2001: the scientific basis. Contribution of working group I to the 3rd assessment report of the intergovernmental panel on climate change, Cambridge University Press, Cambridge, pp 525–582
Depsos, 2009. Tahun 2009 angka pengangguran membengkak. Departement Sosial Republik Indonesia. http://www.depsos.go.id
Dewi, R.G., M.H. Nasution, S.D. Anggraeni, Y. Ismawati, U. Solihin, A. Syafe’i, and U.SA Kamil. 2009. GHG mitigation analysis for waste sector. In MoE. Projection of GHG Emission and Mitigation Analysis for Indonesia’s Second National Communication. Ministry of Environment and United Nations Development Programme, Jakarta.
Dewi, R.G., U. Siagian, M. H. Nasution, P. Lestari, Farida Z., M. Saleh, A. Wahyudi and Prasetyo. 2009. GHG mitigation analysis for energy, industry and transportation sector. In MoE. Projection of GHG Emission and Mitigation Analysis for Indonesia’s Second National Communication. Ministry of Environment and United Nations Development Programme, Jakarta.
Ditjenbun (Direktorat Jenderal Perkebunan; Directorate General of Plantation). 2007. Road Map Kelapa Sawit. Ditjenbun, Jakarta, Indonesia.
DNM Norway and MSE Indonesia. 1993. Climate change and forestry Indonesia: Eco-strategies for terrestrial CO2-fixation. Directorate for Nature and Management-Norway and Ministry of State for Environment-Indonesia. 117p.
References

IndonesIa second natIonal communIcatIon under the unIted natIons Framework conventIon on clImate change (unFccc)
DNPI, 2009. Indonesian GHG Abatement Cost Curve with McKinsey. National Council for Climate Change, Jakarta.
Duncan, B.N., I. Bey, M. Chin, L. J. Mickley, T. D. Fairlie, R. V. Martin, and H. Matsueda. 2003. Indonesian wildfires of 1997: Impact on tropospheric chemistry. Journal of Geophysical Research 108(D15):4458
Emanuel, K. 2005. Increasing destructiveness of tropical cyclones over the past 30 years. Nature 36: 686-688
Fuad, E.D: 2000. ‘Analisis potensi dan efektivitas biaya opsi mitigasi gas rumah kaca pada sektor kehutanan Indonesia dengan menggunakan model COMAP’, Program Pasca sarjana, Institut Pertanian Bogor (Unpublished).
Giannini, A., A.W. Robertson and J.H. Qian, (2007) A role for tropical tropospheric temperature adjustment to ENSO in the seasonality of monsoonal Indonesia precipitation predictability, J. Geophys. Res. (Atmosphere), 112,
Guilyardi E (2005) El Nin˜ o-mean state-seasonal cycle interactions in a multi-model ensemble. Clim Dyn DOI 10.1007/s00382-005- 0084-6
Hansen, J., Sato, M., Ruedy, R., Lo,K., Lea, D.W., and Medina-Elizade, M. 2006. Global temperature change. Proceeding of National Academy of Science 103: 14288-14293.
Hariati, F. B.D. Dasanto, R. Boer, A. Heriensyah, Fitriyani and D. Octavariani. Marine and Coastal. In MoE. Technical Report on Vulnerability and Adaptation Assessment to Climate Change for Indonesia’s Second National Communication. Ministry of Environment and United Nations Development Programme, Jakarta.
Hasan, H., Pawitan, H., Boer, B dan Yahya, S. 1998. Model simulasi produksi kelapa sawit berdasarkan karakteristik kekeringan (A simulation model of oil palm production based on drought characteristics). Jurnal Agromet 13:41-54.
Heil, A. B. Langmann and E. Aldrian. 2006. Indonesian peat and vegetation fire emissions: Study on factors influencing large-scale smoke haze pollution using a regional atmospheric chemistry model. Mitig Adapt Strat Glob Change 12:113–133
Heriensyah, A. R. Boer, Yanuar, and B.D. Dasanto. 2009. Water Resources. In MoE. Technical Report on Vulnerability and Adaptation Assessment to Climate Change for Indonesia’s Second National Communication. Ministry of Environment and United Nations Development Programme, Jakarta.
References
IndonesIa second natIonal communIcatIon under the unIted natIons Framework conventIon on clImate change (unFccc)
Hidayati, R., A. Buono, A. Rakhman, Fitriyani, R. Boer. 2009. Health Sector. Technical Report on Vulnerability and Adaptation Assessment to Climate Change for Indonesia’s Second National Communication. Ministry of Environment and United Nations Development Programme, Jakarta.
Hooijer, A., Silvius, M., Wösten, H., Page, S (2006): PEAT-CO2, Assessment of CO2 emissions from drained peatlands in SE Asia. Delft Hydraulics report Q3943.
IPCC. 2006. IPCC Guidelines for National Greenhouse Gas Inventories. Prepared by The National Greenhouse Gas Inventories Programme, Eggleston H.S., Buendia, L., Miwa, K., Ngara, T. and Tanabe, K. (eds.). Published by IGES Japan.
IPCC. 2007. Climate Change 2007: The Physical Science Basis. Summary for Policy makers. Intergovernmental Panel on Climate Change, Geneva.
IPCC. 1997. Revised 1996 IPCC Guidelines for National Greenhouse Gas Inventories – Workbook (Volume 2). http://www.ipcc.ch
IPCC. 2000. Emission scenarios. A Special Rerport of Working Group III of the IPCC. Intergovernmental Panel on Climate Change. Cambridge University Press.
Kalshoven, LGE. 1981. Pests of Crops in Indonesia. PT Ichtiar Baru-van Hoeve. Jakarta.
Kieft, J. & Soekarjo, D. 2007. Food and nutritional security assessment March 2007: Initial impact analysis of the 2006/2007 crop season in comparison to 1997/1998 and 2002/2003 El Nino events for the Eastern NTT region. Jakarta, CARE International Indonesia
Kirono, D. and I. J. Partridge. 2002. The climate and the SOI. p. 17-24. In I.J. Partridge and M. Ma’shum (ed) Will It Rain?: The effect of the Southern Oscillation and El Niño in Indonesia. Queensland Government, Department of Primary Industry, Australia.
Las, I and Team. 2008. Matrix Program and Strategy Roadmap for addressing climate change in agriculture sector. Agriculture Research and Development Agency Ministry of Agriculture. Report submitted to National Planning Agency (BAPPENAS).
Las, I., Boer, R., Syahbudin, H. et al. 1999. Analisis peluang penyimpangan iklim dan ketersediaan air pada wilayah pengembangan IP Padi 300 (Probability analysis of climate extreme in major rice growing areas). Pusat Penelitian Tanah dan Agroklimat. Laporan Proyek ARMP-II, Badan Penelitian dan Pengembangan Pertanian.
Bogor, 155p
Levine JS. 1999. The 1997 fires in Kalimantan and Sumatra, Indonesia: gaseous and particulate emissions. Geophysical Research Letters 26:815–818.
References
IndonesIa second natIonal communIcatIon under the unIted natIons Framework conventIon on clImate change (unFccc)
Masripatin, N., Ng. Ginting, A. Wibowo, and A. Pribadi. 2009 b. Forestry Sector. In Indonesia’s Technology Needs Assessment on Climate Change Mitigation. Republic of Indonesia.
Masripatin, N., Ng. Gintings and I W.S. Dharmawan. 2009b. Penanganan perubahan iklim sektor kehutanan. Dalam Bappenas. Roadmap Pengarusutamaan Isu Perubahan Iklim dalam Perencanaan Pembangunan Nasional. Badan Perencanaan Pembangunan Nasional (Draft)
MEMR. 2008, RUKN Rencana Umum Ketenagalistrikan Nasional (General National Electricity Plan) 2008 – 2027. Ministry of Energy and Mineral Resources, Jakarta
MEMR. 2009, “Blueprint Pengelolaan Energi National (Blueprint of National Energy Management) 2010 - 2025”, Ministry of Energy and Mineral Resources, Jakarta.
MoA. 2007. Strategy and technology innovation to cope with global climate change. Ministry of Agriculture Republic of Indonesia, Bogor.
MoE, 2009. Technical Report: National Greenhouse Gas Inventory for the Second National Communication. Ministry of Environment and United Nation Development Program, Jakarta.
MoE. 2003. Environmental status report. The State Ministry of Environment
MoE. 2007. State of environment report in Indonesia 2006. The State Ministry of Environment
MoE. 2007a. National Action Plan on Climate Change. Ministry of Environment, Republic of Indonesia
MoE. 2007b. Climate variability and climate changes, and their implication. Ministry of Environment, Republic of Indonesia
MoF, 2009. Rencana Strategis (Strategic Plan) 2010 – 2014. Ministry of Forestry, Jakarta
MoF. 2006. Forestry Long Term Development Plan Year 2006-2025. Ministry of Forestry. Jakarta.
MoF. 2007. Forestry Statistics of Indonesia. Ministry of Forestry. Jakarta
MoF. 2008. National Forestry Plan (RKTN) Year 2010-2029. Ministry of Forestry. Jakarta.
Moji K., Tsuyuoka, R., Makunike, B. and Tanaka, H. 2002. Meteorological factors influencingthe intensity of malaria outbreak in Zimbabwe Japanese Journal of Tropical Medicine and Hygiene 30:283-287Wiyono, S. 2007. Climate change and pests and diseases explosion. Paper presented in One day Seminar on Biodiversity in the middle of global warming. KEHATI Foundation, Jakarta 28 June 2007 (in Indonesian)
References

IndonesIa second natIonal communIcatIon under the unIted natIons Framework conventIon on clImate change (unFccc)
Moron, V., A.W. Robertson and R. Boer. 2009. Spatial coherence and seasonal predictability of monsoon onset over Indonesia. Journal of Climate.
Nastari Bogor dan Klinik Tanaman IPB. 2007. Laporan Safari Gotong Royong Sambung Keperluan untuk Petani Indonesia di 24 Kabupaten-Kota di Pulau Jawa 4 April-2 Mei 2007. Yayasan Nastari Bogor- Klinik Tanaman IPB.
Naylor, R.L., Battisti, D.S. Vimont, D.J., Falcon, W.P. and Burke, M.B. 2007. Assessing risks of climate variability and climate change for Indonesian rice agriculture. Proceeding of the National Academic of Science 114:7752-7757
Page, S.E., F. Siegert, J. O. Rieley, Hans-Dieter V. Boehm3, A. Jaya & S. Limin. 2002. The amount of carbon released from peat and forest fires in Indonesia during 1997. Nature 420: 61-65
Parry, M. L., A. R. Magalhaes, and N. H. Nih. 1992. The potential socio-economic effects of climate change: A summary of three regional assessments. Nairobi, Kenya: United Nations Environment Programme (UNEP).
PEACE, World Bank and DFID, 2007. Indonesia and Climate Charge: Current Status and Policies. The World Bank, Jakarta
PT PLN, 2009. RUPTL Rencana Usaha Penyediaan Tenaga Listrik (Electricity Service Supply Plan) 2009 – 2018, Jakarta, Indonesia
Pusdatin – MEMR (2006). Handbook of Energy and Economic Statistics of Indonesia, 2006. Jakarta, Indonesia
Pusdatin – MEMR (2009a). Handbook of Energy and Economic Statistics of Indonesia, 2009. Jakarta, Indonesia
Pusdatin – MEMR (2009b). Indonesian Energy Outlook 2009. Jakarta, Indonesia
Quinn, W.H., Zopf, D.D., Sort, K.S., and Kuo Yang, T.R.W. 1978. Historical trends and statistics of the southern oscillation-El-Niño and Indonesian drought. Fishery Bulletin 76, p.3.
Rodo, X. Pascual, M., Fuchs.G., Faruque, A.S.G. 2002. ENSO and cholera: A nonstationary link related to climate change?. Proceeding of National Academy of Science 99: 12901–
12906
Rohman, L. and R. Boer, 2001. Penggunaan indeks kenyamanan untuk mengevaluasi kesesuaian wilayah untuk proses reproduksi ternak domba (The use of comfort index to evaluate the suitability of region for reproduction process of sheep. Jurnal Agromet.
References

IndonesIa second natIonal communIcatIon under the unIted natIons Framework conventIon on clImate change (unFccc)
Saddler, GS. 2000. IMI Description of Fungi and Bacteria No. 146 sheet 1457.
Salinger, M.J. 2005. Increasing climate variability and change: reducing the vulnerability. Climate Change 70:1-3.
Schimel, D., and Baker, D. 2002. The wildfire factor. Nature 420:29-30
Setyanto, P., E. Surmaini and R. Boer. 2009. Mitigation of Methane Emission from Rice Field. In MoE. Projection of GHG Emission and Mitigation Analysis for Indonesia’s Second National Communication. Ministry of Environment and United Nation Development Program, Jakarta.
Siregar, H. 2008. Problems facing the indonesian economy and current policy responses for agriculture. In Proceeding on the 33rd Annual Conference of The Federation of ASEAN’s Economic Associations: “ASEAN’s Co-operation and Agricultural and Rural Development in the Globalization Era. Hanoi, Vietnam.
Sivakumar, M.V.K. 2005. Impacts of natural disasters in Agriculture, rangeland and forestry: An overview. In M.V.K. Sivakumar, R.P. Motha and H.P. Das (eds). Natural disasters and extreme events in Agriculture, page:1-22. Springer, Berlin.
Sofian, I. 2010. Scientific Basis: Analysis and Projection of Sea Level Rise and Extreme Weather Event. Indonesia Climate Change Sectoral Roadmap – ICCSR. National Planning and Development Agency (Bappenas), Jakarta.
Surmaini, E., I. Amien, E. Susanti, M.W. Trinugroho, Y. Sarvina. 2010. Pengembangan dan pemanfaatan sistem informasi prediksi curah hujan mk 2010 dan mh 2010/2011 berbasis web. Balai Penelitian Agroklimat Dan Hidrologi, Balai Besar Litbang Sumberdaya Lahan Pertanian, Badan Penelitian dan Pengembangan Pertanian, Departemen Pertanian.
Suryahadi, and I. Permana. 2009. Mitigation of Methane Emission from Livestock. In MoE. Projection of GHG Emission and Mitigation Analysis for Indonesia’s Second National Communication. Ministry of Environment and United Nation Development Program, Jakarta.
Suryahadi, S., Wulandari, S., and Hidayat, R. (2001). Identification of less GHG emission technology on agriculture energy sector (livestock sub-sector). In MoE, The identification of less GHG emission technologies”. State Ministry for Environment of Indonesia, Jakarta.
Timmermann A, Oberhuber J, Bacher A, Esch M, Latif M, Roeckner E (1999) Increased El Nin˜ o frequency in a climate model forced by future greenhouse warming. Nature 398:694–696
References
IndonesIa second natIonal communIcatIon under the unIted natIons Framework conventIon on clImate change (unFccc)
Tjasyono, B. 1997. Mekanisme fisis para, selama, dan pasca El Niño. Paper disajikan pada Workshop Kelompok Peneliti Dinamika Atmosfer, 13-14 Maret 1997.
Tondok, E. 2001. The Causal Agent of Twisting Disease of Shallot. Master Thesis. University of Goettingen, Germany
Trenberth, KE and Houghton, JT, 1996. The 1990-1995 El Nino-Southern Oscillation Event: Longest on Record. Geographical Research Letter 23: 57-60.
UNDP CO. 2007. Strengthening national capacity to address climate change adaptation. United Nations Development Programme Country Office, Jakarta.
USDA. 1984. World indices of agriculture and food production, 1974-1983. Statistical Bulletin 710. Economic Research Service, U.S. Department of Agriculture, Washington DC.
Van der Werf, G. R., Randerson, J. T., Giglio, L., Gobron, N., Dolman, A. J. (2008). Climate controls on the variability of fires in the tropics and subtropics. Global Biogeochemical Cycles, 22, GB3028, 1-13
Wibowo, A. and R. Boer. 2009. Mitigation Analysis for Forestry Sector. In MoE. Projection of GHG Emission and Mitigation Analysis for Indonesia’s Second National Communication. Ministry of Environment and United Nations Development Programme, Jakarta.
Wiyono, S. 2007. Climate change and pests and diseases explosion. Paper presented in One day Seminar on Biodiversity in the middle of global warming. KEHATI Foundation, Jakarta 28 June 2007 (in Indonesian)
World Bank, 2008. Climate Change in Indonesia: Low Carbon Development Options Study. Phase 1 Status Report. Paper presented at the National Consultation on ‘A Regional
Review of the Economic of Climate Change in South East Asia (PRECCS). Jakarta 23-24 May 2008.
Yoshino, M., K. Urushibara-Yoshino, and W. Suratman. 2000. Agriculture production and climate change in Indonesia. Global Environ. Res. 3:187-197.
References