indirect cost allocation: improved procedures and …
TRANSCRIPT

Office of the City Auditor
Report to the City Council City of San José
INDIRECT COST ALLOCATION: IMPROVED PROCEDURES AND BETTER COMMUNICATION NEEDED
Report 13-10 November 2013

HonorablOf the Ci200 East SSan José, Indirect The City and buildidelivery. as departmaintenanthat the Cactivities. The Finanallocates odirect labservices areimburseothers. Fset to be The objecoverhead Finding overhead costs are reimbursecentral sein the plaoverhead included aclassificatiindirect cand unallo
Telephon
e Mayor and ty Council Santa Clara StCA 95113
Cost Alloca
of San José png permitting These suppotment-level ance. Cost allCity can set f
nce Departmoverhead cosor costs assoand potentiaed for centraFor fee-basedcost recover
ctive of this plan for appr
1: Finance plan included associated we the Generaervice costs thn as overhea and others was overhead ion of centraosts that sho
ocated costs.
200 ne: (408) 535-1
Members
treet
ation: Impr
provides a vag. The City a
ort service coadministrationlocation is thfees appropria
ment (Financests to the Citociated with l reimburseml service activ
d programs, cy and are col
audit was toropriateness a
e Should Md $120 millionwith various al Fund from hat were judgad. Howeverwere not. Ithave not beeal service co
ould be includ
E. Santa Clara250 Fax: (40
Novemb
roved Proce
riety of direcalso performssts, also refern and centrae process toately and give
e) prepares tty’s direct serspecific servi
ments from svities that sercentral serviclected for ind
o review andand accuracy
More Clearn of central sdirect servicespecial or enged to not su, it is uncleart also appearen consistentosts, Finance ded in the pla
a Street, San J08) 292-6071
ber 14, 2013
edures and B
ct services tos supporting arred to as oval services lik estimate thee managemen
the annual Crvices, and caces. This ratspecial fundsrve enterpris
ce costs are odividual servic
evaluate the.
ly Define Iervice costs wes and thus a
nterprise fundpport other d
r why some crs that decisiot over time. should updaan. It also sh
José, CA 9511Website: www
OffShar
Better Com
o the public, sactivities to aerhead or indke payroll, ce overhead ant an accurate
City-wide Colculates an ovte is then use. This ensu
se or special fonly recapturces.
e City’s fisca
Indirect Cowhich were dallocated to
ds. There wedepartments,central servicons about w To ensure tate its procehould review
13 w.sanjoseca.gov/a
ffice of theron W. Erick
mmunication
such as policiaid departmendirect costs, icomputer sussociated wite picture of t
ost Allocationverhead rate ed to calculatures that thefunds, such ared to the ex
al year (FY) 2
osts. The Cdeemed to bedepartments
ere an additio, and as such ce costs werehether certaithe appropriaedures to m and revise it
auditor/
e City Audkson, City Au
n Needed
ng, utility sernts in their seinclude such tpport, and fth City servicthe true cost
n Plan. The as a percentate fees for spe General Fuas utility fundxtent that fee
2013-14 City
City’s FY 20e overhead. T to set fees onal $39 milli were not ince considered in costs shouate and consore clearly dts lists of allo
ditor uditor
rvices, ervice things facility ces so of its
e plan age of pecific und is s, and es are
y-wide
013-14 These or to ion of cluded to be uld be sistent define
ocated

ii
Finding 2: Finance Should Review and Update Its Cost Allocation Methodology. To determine the full cost of City services, Finance allocates indirect costs by means of allocation bases that are intended to relate the support activity performed to the services received by other departments. These allocation bases include such things as the size of department budgets, total full-time equivalent (FTE) employees by department, and more specific workload data that approximates the services provided to other departments. To ensure that allocation bases reflect actual workload and take into account organizational changes, Finance should improve its communications with central service departments and revise allocation bases. Finance should also improve how it allocates overhead to capital projects, review the Equipment Usage and Building Occupancy cost pools to ensure costs are consistently and accurately allocated, and reorder the central service department allocation sequence. Finding 3: Finance’s Procedures and Resources Should Be Enhanced. Finance relies heavily on Excel spreadsheets to calculate overhead – preparing at least 150 worksheets that contain many different calculations, analyses, and other information important to the overhead calculations. To improve the consistency and accuracy of these spreadsheets, we recommend Finance establish a process for reviewing critical data entry areas and key calculations. Finance should also document the rate calculation methodologies contained in these worksheets. Finance also uses old overhead software that has limited functionality, does not allow importing data from Excel files (necessitating an extensive manual data entry exercise), and only provides limited reports. We recommend Finance switch to a newer software application. Finally, Finance’s cost allocation process may also improve with additional staffing as only 0.5 FTE is currently assigned to preparing the City’s overhead plans. Finding 4: The Overhead Rate Calculation Can Be More Transparent. The current overhead plan is difficult to comprehend and is not documented in a clearly understandable format. Additionally, cost allocation information is not well communicated to City staff, leading to confusion about how overhead is calculated and how overhead rates should be applied. Other jurisdictions make their plans easier to understand and explain by including descriptive information about cost allocations. Finance should include such information and routinely explain rates to City departments. Explaining overhead to departments is particularly important when there are service delivery changes that might affect the application of overhead. Appendices. Following the conclusion of the report are seven appendices that provide further detail about cost allocation in the City of San José. Appendix A diagrams the two-step methodology used to allocate costs. Appendix B lists the central services included in the overhead plan, along with the total costs for each service and the base used to allocate the service. Appendix C shows the components of overhead and rate calculations for line departments, including utility and capital funds. Appendix D compares the percent of central services allocated to line departments and funds. Appendix E provides examples of how overhead is applied to fees and special funds. Appendix F shows five-year trends of overhead rates by each core service within a department. Appendix G has an example of the five-year trend of overhead components for one sample department (Police). We would like to thank the Finance Department; the Budget Office; the departments of Airport; Environmental Services; Human Resources; Information Technology; Planning, Building & Code Enforcement; Police; Public Works; and the City Attorney’s Office for their time and insight during the audit process.

iii
This repopresent tSupport Cyellow pag
finaltr SE:lg Audit Staf cc: Julia Deb Ed S Rick
ort includes this report atCommittee. ges.
ff: Joseph Alison Minh DRenata
Cooper ra Figone hikada
k Doyle
13 recommet the Novem The Adminis
Rois McInnis
Dan Vuong Khoshroo
Jennifer MaArn AndrewPatrick SawInderdeep
endations tomber 21, 201stration has
Respect
Sharon City Au
aguire Juws Li
wicki MDhillon D
improve Fin13 meeting oreviewed this
tfully submitte
W. Erickson ditor
ulie Chou ida Zhao
Margaret McCDanielle Kenea
nance’s cost of the Public s report and
ed,
Cahan aley
allocation p Safety, Fina
d its response
process. Wence, and Stre is shown o
e will rategic on the

iv
Glossary Allocation base: The criterion used to allocate indirect costs. It serves as an estimate of the indirect services provided to a department. For example, the number of full-time equivalent employees is used to allocate payroll costs. Central service: Services provided centrally by the City to departments and funds. The costs of these services are primarily allocated through the indirect cost allocation plan or directly billed. Departments that primarily provide central services are referred to as central service departments; their costs are allocated through the cost allocation plan. Cost allocation: The process by which costs for services are tied to the departments, funds, or programs that are receiving those services. Indirect cost allocation is specific to the allocation of costs that are linked to multiple City services. Cost allocation is used to estimate the full cost of services provided by the City, but does not necessarily involve the transfer of funds. Cost pool: A set of costs that must be allocated. This can be a division, a department, or an inter-departmental program. In San José’s overhead plan, cost pools are generally either individual departments or costs that do not relate to a specific department, such as City-Wide Expenses. Direct bill: A specific charge to an enterprise or special fund for services provided by General Fund department staff or resources. Indirect cost: Costs that are linked to multiple services. For example, the costs budgeted for the Human Resources Department are indirect costs because they support City employees across all departments instead of just one specific service to the public. Indirect costs are colloquially referred to as “overhead.” Only those costs that are related to services provided to City departments or funds are considered indirect costs. Line department/fund (also called receiving department): A department or fund that provides direct services to the public that is allocated overhead (i.e. receives overhead) through the cost allocation plan from central service departments. Overhead plan (also called plan or cost allocation plan): The documentation that records the indirect central service cost allocations made to departments and funds. In this report, the term overhead plan or plan refers to the FY 2013-14 City-wide Cost Allocation Plan. Overhead rate (also called indirect cost rate): A ratio of indirect costs to direct labor costs (expressed as a percentage). In San José, overhead rates are calculated by adding a core service’s central service cost allocations, departmental strategic support costs, and departmental non-personal costs and dividing the sum by the direct labor costs for the core service. A second set of rates is calculated using the same method but excluding non-personal costs. Unallocated central service costs: Costs of central services that are not allocated to departments through the cost allocation plan. These costs typically fall into one of two categories. First, the costs are for direct services to the public (such as processing business licenses), and thus do not fit the description of an indirect cost as they do not support services provided to other City departments or funds. Second, the costs are recovered in another way (e.g. costs that are charged separately outside of the plan) and thus do not need to be recovered through indirect cost allocation.

Table of Contents
Cover Letter .............................................................................................................i
Glossary ................................................................................................................... iv
Introduction ............................................................................................................ 1
Background ............................................................................................................................. 1
Audit Objective, Scope, and Methodology ................................................................... 11
Finding I
Finance Should More Clearly Define Indirect Costs ........................................ 13
The Purpose of the Overhead Rate Calculation Is to Recapture Indirect,
Central Service Costs ........................................................................................................ 13
Finding 2
Finance Should Review and Update Its Cost Allocation Methodology .......... 19
Allocation Bases Need to Be Periodically Reviewed and Updated ......................... 19
Finance Can Improve How It Allocates Overhead to Capital Projects ................. 22
Equipment Usage and Building Occupancy Cost Pools Should Be Reviewed
to Ensure Costs Are Consistently and Accurately Allocated .................................. 24
Finance Should Reorder the Central Service Department Allocation
Sequence ............................................................................................................................... 26
Finding 3
Finance’s Procedures and Resources Should Be Enhanced ............................. 29
Overhead Calculations Rely Heavily on Multiple Excel Spreadsheets .................... 29
Finance Uses Outdated and Inefficient Software ......................................................... 32
Additional Staffing Can Improve the Cost Allocation Process ................................. 35
Finding 4
The Overhead Rate Calculation Can Be More Transparent ........................... 37
Although Overhead Calculations and Plans Are Complicated, the City Can
Take Steps to Make the Overhead Plan Document More Transparent and
Understandable ................................................................................................................... 37
The Overhead Plan Is Not Well Communicated to City Staff................................. 41
Conclusion ............................................................................................................. 45
Appendix A
Cost Allocation Methodology ............................................................................... A-1
Appendix B Central Service Costs and Allocation Bases in FY 2013-14 Cost
Allocation Plan ....................................................................................................... B-1

Appendix C
Components of Overhead and Rate Calculations, by Line Department ............... C-1
Appendix D
Comparison of Central Service Allocations Among Departments ....................... D-1
Appendix E
Applying Overhead to Fees and Special Funds, Examples ..................................... E-1
Appendix F
Five-Year Trend of Overhead Rates ...................................................................... F-1
Appendix G Five-Year Trend of Overhead Components – Example: Police
Department .......................................................................................................... G-1
Administration’s Response ................................................................. yellow pages

Table of Exhibits
Exhibit 1: Example Full Cost Calculation for a Taxicab Driver Permit ........... 2
Exhibit 2: Example Overhead Rate Calculation for the Police
Department’s Regulatory Services Core Service ............................................... 7
Exhibit 3: Example Breakdown of the Components of a
Taxicab Permit Fee ................................................................................................ 8
Exhibit 4: City Overhead, 5-Year History ($millions) ........................................ 9
Exhibit 5: Overhead Reimbursements to the General Fund, 10-Year
History ................................................................................................................... 10
Exhibit 6: Central Service Costs in the FY 2013-14 City-Wide
Overhead Plan ($millions) ................................................................................... 15
Exhibit 7: NGCS II Data Entry Screen .............................................................. 33
Exhibit 8: Sample Page From the City and County of
San Francisco’s Plan ............................................................................................. 41
1
Introduction
In accordance with the City Auditor’s Fiscal Year (FY) 2013-14 Work Plan, we
have completed an audit of the Finance Department’s calculation of overhead cost
allocations and rates. We conducted this performance audit in accordance with
generally accepted government auditing standards. Those standards require that
we plan and perform the audit to obtain sufficient, appropriate evidence to
provide a reasonable basis for our findings and conclusions based on our audit
objectives. We believe that the evidence obtained provides a reasonable basis for
our findings and conclusions based on our audit objectives. We limited our work
to those areas specified in the “Audit Objective, Scope and Methodology” section
of this report.
The Office of the City Auditor thanks the management and staff from the Finance
Department; the Budget Office; the departments of Airport; Environmental
Services; Human Resources; Information Technology; Planning, Building & Code
Enforcement; Police; Public Works; and the City Attorney’s Office for giving their
time, information, insight, and cooperation during the audit process.
Background
The City provides a variety of services to the public, including police and fire
protection, environmental and utility services, transportation and aviation
services, libraries and community centers, and community and economic
development. These services are provided by the Police and Fire Departments;
the Environmental Services Department; the Airport; and various other
departments which directly serve the public.
To provide these services, the City also performs supporting activities to aid
departments in their service delivery. These activities, the cost of which is
colloquially referred to as overhead, include such things as payroll provided by
the Finance Department (Finance), computer support provided by the
Information Technology Department (IT), and facility maintenance provided by
Public Works.
Direct Versus Indirect Costs
It is important for the City to understand the full cost of the services it provides,
so that it can set fees appropriately and give management an accurate picture of
the true cost of its activities. To calculate the full cost of a public service, both
direct and indirect costs need to be to be counted. Generally, one can distinguish
between direct and indirect costs as follows.

Indirect Cost Allocation
2
Direct costs can be linked to a specific service to the public. For
example, one service the City provides is Police response. The costs
budgeted for Police response would be direct costs.
Indirect costs (or overhead), on the other hand, are linked to multiple
services. For example, the Human Resources Department (HR) supports
City employees across all departments, instead of providing one specific
service to the public. Indirect costs can also be within a department, such
as costs for Police departmental administration that support multiple
services: Police response, investigations, permitting, etc.
To illustrate, the full cost for the City to issue a permit to a taxicab driver
includes the salaries and benefits of Police Department staff whose time is directly
associated with processing the application and issuing the permit as well as the
indirect costs supporting the process. These indirect costs include the costs of
management and support staff in the Police Department, Finance’s costs of payroll
processing for the above employees, building custodial costs, electricity, IT
support, and others. Exhibit 1 describes the full cost equation for this example.
Exhibit 1: Example Full Cost Calculation for a Taxicab Driver Permit
Full Cost = Direct Cost + Indirect Cost
(colloquially “overhead”)
Full cost of issuing a
taxicab driver permit
=
Employees’ time (salary
and benefits) to receive
application, conduct
criminal background
check, review drug test,
administer a test of
traffic laws, issue permit
+
Share of management and support
staff costs in the Police Department;
plus a share of City central service
costs that support these employees’
time issuing this permit (e.g. Finance
payroll processing, building custodial
costs, electricity, IT support)
Source: Auditor analysis
For the example above, the full cost of the permit includes the direct cost of
program staff within the Police Department, indirect costs from supporting
activities from other City departments, and indirect costs related to supporting
activities within the Police Department. This full cost can be used to calculate the
appropriate fee for a taxicab driver permit. Although the full cost of the permit
includes costs of activities outside of the Police Department; the Police
Department’s annual operating budget does not include those costs. They remain
in the annual budgets of those respective departments.
Indirect Cost Allocation
It is usually difficult to measure indirect costs (or overhead) associated with a
specific service because, as noted above, they are linked to multiple services.
Indirect cost allocation is a process to estimate the indirect costs associated with

Introduction
3
each service. Instead of attempting to measure indirect costs exactly, they are
“allocated” to a service based on an estimate.
The San José City Council’s Operating Budget and Capital Improvement Program
Policy1 states: “All overhead costs shall be allocated to the appropriate program
within the limits of local, State and federal laws.” The goals of allocating overhead
costs are twofold:
1. Calculating the full cost of City services for fee setting purposes
2. Reimbursing the General Fund for indirect costs which serve enterprise
or special funds
For some departments or funds, the cost allocation process is solely designed to
determine the full cost of a specific service for fee setting purposes and does not
involve a transfer of funds between departments.2 Only when overhead is
charged to enterprise or special funds to reimburse the General Fund for central
service costs is there an actual transfer of funds.
Finance’s Accounting Division is responsible for preparing the City’s Cost
Allocation Plan, also called the overhead plan (plan). This plan is a document that
shows the results of the allocation of overhead costs to departments and funds.
Finance’s Indirect Cost Allocation Plan Procedure Manual describes the purpose of
the plan as follows:
To identify and account for general fund and other indirect cost
related to central service programs that benefit all city departments.
The rates developed will be used to calculate estimates for inclusion
in the applicable adopted operating and capital budgets and the
annually adopted schedules of fees and charges.
The procedures describe the general process for allocating costs and identify the
following departments and programs as indirect costs:
City buildings’ usage
City equipment and vehicle usage
City-wide Programs
Building leases
City Manager
Emergency Services
Independent Police Auditor
1 Council Policy 1-18.
2 Departments may also seek reimbursements for indirect costs from federal or other grants. The City has a separate
Grant Overhead Plan which allocates costs based on federal rules on allowable reimbursable costs.

Indirect Cost Allocation
4
Mayor & City Council
Finance
Information Technology
City Attorney
City Clerk
City Auditor
Human Resources
General Services3
These departments and programs are referred to as “central services;” their
costs allocated in the FY 2013-14 plan totaled $120 million. These costs are
based on the FY 2012-13 adopted budget.4 For comparison, the General Fund
operating budget for FY 2012-13 was $967 million. See Appendix B for a detailed
description of San José’s indirect costs included in the plan.
In the fall of each year, Finance requests and collects workload data from central
service departments and cost data from the Budget Office. The data is used to
estimate the levels of service provided by central service departments to other
departments and serve as a basis for allocating costs. For example, Finance might
use square feet occupied as an estimator for the costs of building maintenance
and electricity for individual departments. In this example, square footage is
called the “allocation base” for maintenance costs.
Finance then compiles the data in various spreadsheets, making adjustments and
reclassifications as necessary, and enters it into proprietary software that
calculates the actual allocations. The software uses a two-step methodology, as
diagrammed in Appendix A, for allocating the indirect costs.
1. The software first allocates central service department costs to all City
departments, including other central service departments, based on the
levels of service estimates as described above.
2. The software then allocates the costs that central service departments
received in the first step. Central service departments allocate their
3 The Department of General Services was consolidated into Public Works in 2010-11, but Finance continues to treat
General Services separately as a central service.
4 It should be noted that departments providing direct services to the public may be charged for central services in
multiple ways: (a) costs which are allocated to line departments through the overhead plan as described above, (b)
costs paid directly by enterprise or special funds (which are included in the plan as direct bills to offset costs otherwise
allocated to them), (c) costs paid out of special funds are in some cases deemed unallocated costs in the plan (e.g., HR
costs paid out of the benefit funds), and (d) direct charges by Public Works which are not included in the plan in any
way (these relate to work provided by facilities management staff to departments that are paid for out of departmental
non-personal budgets). (e) other separate charges, for example City Hall debt service or the HR/Payroll System
Upgrade were allocated and charged separately.

Introduction
5
costs to other central service departments ranked below them in a set
order and to departments providing direct services (called “line
departments”). Once a central service department has allocated its costs
in this step, it no longer receives allocations from other central service
departments below them in the order. This process ends when the final
central service department has allocated its remaining costs (and thus, all
overhead in the plan has been allocated to line departments providing
direct services or special funds).
This calculation produces a dollar amount of indirect costs for each line
department or special fund. The dollar amount is used to calculate an overhead
rate which is used by departments in setting fees (see next section on the
calculation of the overhead rates) and reimbursements from special funds. See
Appendix C for complete departmental allocation details.
These allocations are documented in the overhead plan, which includes each
central service’s indirect costs, a short description of the allocation bases for each
central service, and overhead amounts allocated to each line department.
It should be noted that in addition to the City-wide overhead plan, which is the
subject of this audit, Finance produces two other plans. One is specific to Airport
costs and the other is guided by federal regulations for reimbursements from
grants. The City-wide overhead plan, referred to in this report simply as the
overhead plan, documents the rates that departments use to calculate fees and
reimbursements around the City.5
Calculation of Overhead Rates
From the overhead amounts for line departments identified in the plan, Finance
calculates overhead rates (expressed as percentages) and issues a table of rates
every January for the following fiscal year.
Overhead rate calculations have three components, the first two of which make
up what is broadly called overhead:
1. The cost of central services allocated to departments or funds through
the overhead plan.
5 The three overhead plans which Finance produces annually are (1) the City-wide Cost Allocation Plan (overhead plan),
(2) the Airport Overhead Plan, and (3) the Grant Overhead Plan. Additionally, the Finance Department uses an outside
vendor to prepare a Public Works plan. Rates produced by different plans are used for different purposes. For
example, departments use rates from the Grant Plan when they seek reimbursements from federal grants. The plans
are generally similar in methodology. The City-wide Plan uses prior-year adopted budget figures and generally two-
years-prior workload measures. The Airport and Grant Plans are to exclude costs that are disallowed under federal
guidelines, use two-years-prior actual expenditures and two-years-prior workload measures. For this audit, we focused
on the City-wide overhead plan, referred to simply as the overhead plan, as noted in the Audit Objective, Scope and
Methodology section.

Indirect Cost Allocation
6
2. The cost of departmental administrative activities, which includes
departmental strategic support staff and non-personal costs.
3. The cost of direct labor for department programs, which is based on staff
salaries.
It is important to note that in addition to the costs allocated to line departments
in the plan, a line department’s own administrative activities (as performed by staff
in the department’s strategic support core service) are included in the overhead
amount and factored into the rate calculation. In some cases, the costs of these
departmental administrative activities are greater than central service costs
allocated through the overhead plan.
Rates are calculated by dividing the overhead amount by the department’s direct
labor costs, as demonstrated in the formula below.
Changes to any of these three components in the above formula will affect a
department’s overhead rate. Because direct labor costs are a critical piece of the
overhead rate calculation, any staffing changes in a department will likely affect the
overhead rate. If the only component that changes is the direct labor costs due
to staffing reductions, then the overhead rate will increase.
When calculating fees or reimbursements, overhead rates usually are multiplied
by the labor costs related to the activity. The resulting overhead amount is then
used to calculate the full cost of a service for fee setting purposes or to
reimburse the General Fund for services benefiting special funds. See Appendix E
for four such examples.
Continuing the example from the taxicab permitting process earlier, Exhibit 2
shows an example of a rate calculation for the Police Department’s Regulatory
Services core service. This service had an overhead rate of 56.19 percent for FY
2013-14, meaning that $0.56 of overhead is associated with one dollar of salary.

Introduction
7
Exhibit 2: Example Overhead Rate Calculation for the
Police Department’s Regulatory Services
Core Service
Cost of City Central Services Allocated
Within the Overhead Plan
To: Regulatory
Services
from City-Wide Programs $210,658
City Attorney $48,260
General Services $35,447
Building Occupancy $32,129
Information Technology $29,564
Human Resources $29,455
City Manager $26,592
Building Leases $24,126
Equipment Usage $18,519
Mayor & City Council $16,727
Finance $16,650
Independent Police Auditor $15,338
City Auditor $4,777
City Clerk $3,773
Emergency Services $854
A Sub-total $512,871
Departmental Indirect Costs
B Non-Personal costs $226,612
C Strategic Support $426,396
Total Overhead Amount
D A+B+C $1,165,879
Departmental Direct Labor Costs
E $2,074,908
Overhead Rate
D/E Divide Overhead by Direct Labor 56.19%
Source: Finance Department’s City-wide FY 2013-14 Cost Allocation Plan,
NGCS II Schedule G, and Finance rate sheet.
See Appendix C for rate calculations for all departments.
Costs of City central services do not add exactly to line A due to rounding
within the NGCS II software.
This method of calculating overhead rates is used across all City departments.
The rate calculation for utility funds and capital projects involves a blending of
several different department overhead allocations. For more detail, see Appendix
C.

Indirect Cost Allocation
8
Once the overhead rate is calculated, line department staff use these rates to set
fees to recover the costs of that service.6 Exhibit 3 shows how overhead is
factored into the fee calculation of a taxicab permit based on the rate calculated
in Exhibit 2 above. See Appendix E for more detail on this permit fee as well as
further examples of the cost components of other fees.
Exhibit 3: Example Breakdown of the Components of a Taxicab Permit Fee
Source: Auditor analysis of Police fee calculation, the City-wide Cost Allocation plan, and Finance-prepared
overhead rate sheet
See Appendix E for other more detail and other examples.
Overhead Rates Over Time
Generally, the City has seen overhead rates fluctuate over the last few years.
Exhibit 4 shows the City’s overall overhead rate over the last five years,
calculated by dividing indirect costs (from both central services and within
departments) by direct labor costs.
6 Some fee-related programs are intended to be 100 percent cost recovery; others are intended to be less than full cost
recovery.

Introduction
9
Exhibit 4: City Overhead, 5-Year History ($millions)
FY 09-10 FY 10-11 FY 11-12 FY 12-13 FY 13-14
5-year
change
Allocated costs from City central
services $100.7 $108.6 $100.4 $99.5 $100.1 -0.54%
Indirect costs within line
departments $95.9 $88.3 $88.0 $82.8 $86.1 -10.25%
Total overhead allocated $196.6 $196.9 $188.4 $182.3 $186.2 -5.28%
Line departments' direct labor $420.9 $426.8 $383.5 $335.8 $344.0 -18.27%
Rate (divide overhead by direct
labor) 46.7% 46.1% 49.1% 54.3% 54.1% 7.4%
Source: Auditor analysis of Finance’s City-wide Cost Allocation Plans and rate tables. FY 2009-10 through FY 2012-13
unaudited
Note: Includes data for almost all line departments and funds; excludes data for the Airport, capital projects, and utility
funds.
Overhead rates for core services within a department fluctuate as well. For
example, Planning, Building, and Code Enforcement’s overhead rate for
development services rose from 26 percent in FY 2009-10 to 39 percent in FY
2011-12. For FY 2013-14, it is 35 percent. The Police Department’s overhead
rate for Response to Calls for Service has fluctuated between 48 and 57 percent
over the last five years. See Appendix F for five-year trends of all overhead rates.
Reimbursements to the General Fund from Enterprise and Special
Funds
Once rates are calculated, they are used in several ways across the City. For
General Fund programs and departments, the rates are used to set fees or
recover costs from grants. For programs that do not calculate fees or use grant
funding, it is possible that their overhead rates are not used.
However, the City does use overhead rates for reimbursements from special
funds to the General Fund for central services provided to non-General Fund
activities, including ratepayer-funded utility services, Airport services, and others.
Over the past ten years, these reimbursements have averaged $34 million
annually, reaching a high of $41 million in FY 2009-10. Overhead reimbursements
have ranged from 3.5 percent to 4.8 percent of the overall General Fund budget.
Exhibit 5 shows the reimbursements the City has received for the cost of
providing services to non-General Fund activities.

Indirect Cost Allocation
10
Exhibit 5: Overhead Reimbursements to the General Fund,
10-Year History
Source: Auditor Analysis of City of San José Adopted Budgets and Annual Reports
Effect of Outsourcing on Overhead
Outsourcing a City program to an external contractor changes the type of central
services provided to that program. As a result, the type of costs tied to the
program will also change. As long as the program continues to use City central
services, it will be tied to certain central service costs. If a program has fewer
City staff, then it will require fewer central services such as payroll. However, it
may still generate overhead for services provided by other City functions (such as
accounts payable, budget, attorney services, or audit work).
For example, since 2004, the management of the City’s Convention and Cultural
Facilities has been outsourced to Team San Jose, Inc., a non-profit corporation.
This outsourcing has affected the type of central service costs allocated to the
City’s Convention and Cultural Affairs Fund (Fund 536).7 Though the number of
City staff has been decreased, Fund 536 (and thus Team San Jose) is still included
in the plan as it still utilizes central services. It no longer is allocated payroll costs;
however, it now is allocated City Auditor costs associated with the City’s annual
performance audit. See Appendix C for Fund 536’s cost allocation details.
Outsourcing may also change the method by which overhead is charged.
Following the example above, when the City funded positions in Fund 536,
overhead was calculated by multiplying the overhead rate by direct labor costs in
the fund. Because Fund 536 no longer pays for City employees, in FY 2013-14,
7 The Convention and Cultural Affairs Fund (Fund 536) accounts for the revenues and expenditures related to the
City’s Convention and Cultural Facilities.
$0
$10
$20
$30
$40
$50
Millio
ns

Introduction
11
the fund was charged the lump sum of $753,416 as calculated by the plan (see
Appendix C). This amount will be reimbursed to the General Fund by Fund 536.
On a smaller scale, these effects will be similar when a program within a
department or division is outsourced. The effect will be seen in the overhead
rate for the core service in which the program had been budgeted. If the
program continues to use City services, the department will be allocated central
service costs. In addition, contract costs for outsourced services in a
department’s non-personal budget will be factored into overhead amounts and
rates.8 See Appendix B for a full listing of the data used to calculate central
service costs in the City.
Audit Objective, Scope, and Methodology
The objective of our audit was to review and evaluate the City of San José’s FY
2013-14 City-wide Cost Allocation Plan for appropriateness and accuracy. We
sought to understand the purpose, development, and components of the City-
wide Cost Allocation Plan through interviews, reviews of documentation, and
reviews of data utilized during the plan’s development. These include:
Interviews with management and staff from Finance; the Budget Office;
the Airport; the Environmental Services Department; Human Resources;
Information Technology; the Department of Planning, Building, and Code
Enforcement; the Police Department; and Public Works.
Review of Council Policy 1-18, Operating Budget and Capital Improvement
Program Policy.
Review of Title 2 of the Code of Federal Regulations, Part 225, Cost
Principles for State, Local and Indian Tribal Governments (Office of
Management and Budget Circular A-87), the California State Controller’s
Handbook of Cost Plan Procedures for California Counties, and a U.S.
Department of Health and Human Services’ Implementation Guide for
Office of Management and Budget Circular A-87.
Review of Finance’s Indirect Cost Allocation Plan Procedure Manual and the
FY 2013-14 City-wide Cost Allocation Plan.
Reconciled a sample of allocated costs to Finance’s supporting
worksheets and departmental source documents such as workload data
provided by central service departments. We also reconciled a sample of
departmental workload data to source documents.
8 A number of central service functions are allocated based on data that is not affected by a full-time equivalent (FTE)
count. Many functions are allocated based on actual workload or the size of a department’s budget, both of which
would capture the services provided to an outsourced function. For example, costs related to the Mayor and City
Council and the City Manager’s services are allocated based on the size of a department’s (or fund’s) budget, which
would include the non-personal cost of a contract.

Indirect Cost Allocation
12
To evaluate the effectiveness and accuracy of the proprietary software
that Finance used in making its calculations, we traced a sample of costs
through Finance’s worksheets and the software. We also spoke with a
vendor’s representative to understand the functionality of the currently
used and alternative software products.
Benchmarked the City’s plan, method, and software use by reviewing
plans and interviewing staff from other jurisdictions who are involved
with their agency’s overhead plans, including Alameda County; Atlanta,
GA; Fresno (City); Long Beach; Los Angeles (City); Palo Alto; Sacramento
(City); Sacramento County, San Diego County, San Francisco, San Mateo
County, and Santa Clara County. We reviewed the plan and method of
allocating costs but did not compare final overhead rates as such rates
may not be comparable across jurisdictions due to differences in
calculation and organizational structure.
Reviewed best practices literature including Cost Analysis and Activity-Based
Costing for Government, R. Gregory Michel, Government Finance Officers
Association (GFOA), 2004 and the GFOA’s Best Practice Documentation
of Accounting Policies and Procedures.
We limited our review to the FY 2013-14 City-wide Cost Allocation Plan.9 We
did not audit the budget data provided by the Budget Office, the sources and
databases for departmental workload data, and the uses of overhead rates.
9 As described in earlier, the Finance Department produces three overhead plans. We did not audit the Airport or
Grant Plans, or the Public Works plan that is prepared by an outside vendor. The Airport Plan is audited annually, and
furthermore, subject to regulation by the Federal Aviation Administration (FAA). The Grant Plan is audited annually as
part of the City’s Single Audit of federal grants. The 2010-11 Grant Plan was approved in June 2013 by the U.S.
Department of Housing and Urban Development (HUD). As noted in HUD’s approval/agreement, the City is required
to submit true-up calculations to account for any under/over recovery of indirect costs based on the rates applied in
fiscal year 2010-11.

13
Finding I Finance Should More Clearly Define
Indirect Costs
Summary
The City’s FY 2013-14 overhead plan included $120 million of central service
costs which were deemed to be overhead. These costs are associated with
various direct services and thus allocated to departments to set fees or to
reimburse the General Fund from special or enterprise funds. There were an
additional $39 million of central service costs that were judged to not support
other departments, and as such were not included in the plan as overhead.
However, it is unclear why some central service costs were considered to be
overhead and others were not. It also appears that decisions about whether
certain costs should be included as overhead have not been consistent over time.
To ensure the appropriate and consistent classification of central service costs,
Finance should update its procedures to more clearly define indirect costs that
should be included in the plan. It should also review and revise its lists of
allocated and unallocated costs.
The Purpose of the Overhead Rate Calculation Is to Recapture Indirect, Central
Service Costs
The City provides a variety of services directly to the public through various line
departments, including the Police and Fire departments, the Department of
Transportation, the Library Department, and others. It also has a number of
central service departments which support those direct services. These support
activities include such things as payroll provided by the Finance Department,
computer support provided by IT, and facility maintenance provided by Public
Works.
As noted in the Background, the purpose of the overhead plan is to identify these
support functions and allocate their costs across the City’s services based on an
estimate of the level of support provided to those services. The goals of the
overhead plan are twofold:
1. Calculating the full cost of City services for fee setting purposes
2. Reimbursing the General Fund for the cost of providing central services
to enterprise or special funds

Indirect Cost Allocation
14
Although some special funds reimburse the General Fund directly or in a lump
sum, many central service costs are only recaptured to the extent that fees are
set to be cost-recovery10 and are collected for individual services. For example,
the amount of overhead costs recaptured through the residential building permit
fee is a function of the fees being set to be fully cost recovery (including
overhead), and the actual level of permitting activity in a given year. Overhead is
not paid directly out of the Planning, Building, and Code Enforcement
Department’s annual budget.
The plan groups central service costs by “cost pool.” Cost pools within the plan
are simply a set of costs which support other services. This can be a division,
department, or some other cost which may not directly relate to an individual
department. Examples of this last type of cost pool are the Building Occupancy
and Equipment Usage cost pools meant to allocate a portion of the cost of
buildings and equipment to departments that use them.
$120 Million of Central Service Costs Is Treated as Overhead
Central service costs are treated in three different ways within the overhead plan.
$120 million in central service costs which support other City programs
are deemed to be overhead and allocated to those programs. These
central service costs include such items as payroll services, utilities in City
buildings, Budget Office services, City Attorney services, and others.
$39 million of central service costs are not allocated to other City
services because they are deemed to be for direct services to the public
(i.e., they are not support functions for other City programs). For
example, the cost of elections (City Clerk’s Office) is not allocated to
other City services within the overhead plan. In addition, other costs are
not allocated because they are charged to departments through other
means (e.g., Human Resources’ costs related to employee benefits are
charged separately).11
$11 million in direct bills, which account for instances where enterprise
or special funds pay for budgeted central service costs. These costs are
entered into the plan to offset allocated costs to ensure that those funds
are not double charged for services. For example, the FY 2012-13 budget
for the Integrated Waste Management Fund (IWM) included $3 million
for IT services. This amount was included in the overhead plan as a
direct bill to offset any IT costs which would be allocated to IWM for
supporting activities.
10 Some fee-related programs are intended to be 100 percent cost recovery; others are intended to be less than cost
recovery.
11 Although these costs are “unallocated,” they are included in the overhead plan so that they absorb an appropriate
relative share of departmental administrative costs or allocated costs from other central service programs.

Finding 1
15
Exhibit 6 shows total central service costs in the FY 2013-14 overhead plan
broken down by the above designations. See Appendix B for more detail on
individual central service department programs and their costs.
Exhibit 6: Central Service Costs in the FY 2013-14 City-Wide Overhead Plan
($millions)
Cost Pool
Included as
Overhead
Unallocated
(not included
as overhead)
Direct
Billed
City-Wide Programs $32.6 - -
Building Occupancy $4.3 $24.2 -
General Services $14.7 - $2.6
Information Technology $12.8 $0.8 $3.6
Finance $6.2 $6.6 $2.2
City Attorney $12.6 - $2.0
City Manager $10.7 $0.1 $0.3
Mayor and City Council $8.0 $3.0 -
Human Resources $4.7 $2.9 $0.6
Equipment Usage $6.9 - -
City Auditor $2.1 - -
City Clerk $1.1 $1.0 -
Building Leases $1.8 - -
Independent Police Auditor $1.1 - -
Emergency Services $0.2 $0.4 -
Total $119.8 $39.0 $11.3
Source: Auditor Analysis of the FY 2013-14 City-Wide Cost Allocation Plan.
As is shown in Exhibit 6, City-Wide Programs was the largest cost pool in the
plan. The majority of the $33 million in these costs were related to workers’
compensation claims and sick leave payments ($17 million and $6 million,
respectively).
Finance Procedures Do Not Provide Clear Guidance on What Costs
Should Be Considered Overhead
As noted above, the plan is designed to allocate central service costs that support
the delivery of City services. Finance has developed procedures to help staff
identify and account for those costs. Unfortunately, the procedures only provide
broad guidance on what central service programs are, simply defining them as
those “activities that indirectly benefit all departments across the organization.”
However, the procedures do not provide specific guidance on how to determine
whether a program indirectly benefits other departments or should be
considered as providing services directly to the public.
The procedures also do not provide clear guidance on how to determine
whether costs within individual cost pools should be deemed overhead or not.
For example, for the City-Wide Programs cost pool, the procedures state only
that staff should “review budgeted programs and classify eligible cost.” There is
not specific guidance on how staff is to classify budgeted City-Wide Expenses,

Indirect Cost Allocation
16
which include such things as the costs for workers’ compensation claims, general
liability insurance, property tax administration, and others.
Similarly, the procedures identify service yards, communication buildings, and
other direct use buildings as those buildings which should be included in the plan’s
Building Occupancy cost pool. However, the procedures do not clearly define
what an “other direct use building” is. As such, there is no specific guidance on
how staff is to classify the costs for such buildings as the City’s libraries,
community centers, and other buildings related to fee-generating programs.
In practice, it is up to Finance staff to make individual decisions regarding whether
central service program costs should be allocated or not allocated within the plan.
In some cases, Finance worked with central service program staff to help
determine what costs should be allocated in the plan and what costs should not.
In other instances, it is not clear whether that communication had occurred.
Also, in many cases the rationale for why certain costs were considered overhead
and others were not was not documented.
Central Service Costs May Not Have Been Treated Consistently
Because of the broad guidance and the lack of documentation, it is unclear why
certain central service program costs are deemed to be associated with service to
other departments and included in the overhead plan, and others are not.
Examples include:
The Building Occupancy cost pool is meant to spread the historical cost
of City facilities over time and across associated departments (defined as
a “usage allowance”). For example, the FY 2013-14 plan allocated
$500,000 to the Library Department in usage allowances for various
library buildings.
As noted earlier, the procedures simply state that the buildings included
in the allocation include service yards, communication buildings, and other
direct use buildings. It is not clear how staff has determined what a
“direct use building” is and it appears that determination has been
inconsistent over time. For example, while $500,000 in library building
costs were included in the plan, $2.9 million in costs related to other
library buildings were not.
Also, despite some library building costs being allocated in the plan, there
were no usage allowances allocated as overhead for community centers
or other Parks, Recreation, and Neighborhood Services’ facilities (totaling
$4.9 million), nor for Animal Shelter facilities (usage allowances totaling
$300,000). Again, there was no explanation for why these costs have
not been allocated in the plan.12
12 The usage allowances for City Hall and the employee parking lot are not allocated as overhead as it is City policy to
charge the annual debt service separately on a fund basis.

Finding 1
17
To be clear, these choices do not affect individual department budgets;
however, they do affect how the City determines the full cost of
individual services for fee calculations.
Most central service departments, including the City Manager, City Clerk,
and Emergency Services, provide multiple services. The Finance
Department splits their costs between those which are for services to
other departments (overhead) and direct services to the public (costs
unallocated in the plan). In these and other instances, the rationale is not
documented for why certain costs are deemed public services and others
are deemed to provide services to other City departments.
The City-Wide Expenses section in the budget includes activities that
relate to more than one department or are not directly associated with
ongoing departmental activities. As described earlier, Finance procedures
only state that staff “review budgeted programs and classify eligible cost.”
According to Finance, they communicate with the Budget Office to help
determine whether costs should be allocated in the plan. However,
budgeted City-Wide Expenses in the City’s Adopted Budget contain a
multitude of program costs, only some of which are allocated as overhead
in the plan. There is little, if any, documentation for why some City-Wide
Expenses are deemed overhead and others are not.
Documenting Decisions Ensures Costs Are Consistently Treated Over
Time
As noted previously, the rationale for decisions about whether costs should be
allocated in the plan as overhead or not was in many cases not documented.
Documenting decisions provides staff with the history and reasoning necessary to
appropriately and consistently treat costs over time. The California State
Controller’s Office, in its Handbook of Cost Plan Procedures for California Counties
stresses this point, stating:
Costs and credits should be treated properly and consistently. Any
decisions or interpretations and the supporting rationale should be
thoroughly documented. A clear, comprehensible, and complete
audit trail must be maintained, linking the cost plan with all of the
information used in its preparation.

Indirect Cost Allocation
18
Documenting decisions is especially important to maintain consistency during
periods when there is staff turnover, which has been the case within Finance (at
least nine different individuals have prepared or supervised the preparation of the
plan since 2007).
Recommendation #1: To ensure that central service costs are treated
appropriately and consistently, the Finance Department should update
its procedures to more clearly define what costs should and should not
be allocated within the Cost Allocation Plan. Specifically, the
procedures should:
Provide guidance on how to determine whether a central
service department, a City-Wide program, or an individual
central service program provides services to the public versus to
another City department
More clearly define what a “direct use building” is in
determining allocated costs within the building occupancy cost
pool
Require that staff document decisions regarding whether costs
should be deemed allocable or unallocable in accordance with
the above
Recommendation #2: To conform to the updated procedures (as
outlined in Recommendation 1) in the FY 2014-15 Cost Allocation
Plan, the Finance Department should review and revise its lists of:
Allocated and unallocated central service costs
City-Wide Expenses
Direct use buildings

19
Finding 2 Finance Should Review and Update Its
Cost Allocation Methodology
Summary
To determine the full cost of City services, Finance allocates indirect costs by
means of allocation bases that are intended to relate the support activity
performed to the services received by other departments. These allocation bases
include such things as the size of department budgets, total full-time equivalent
employees by department, and more specific workload data that approximates
the services provided to other departments. To ensure that allocation bases
reflect actual workload and take into account organizational changes, Finance
should improve its communications with central service departments and revise
allocation bases. Finance should also improve how it allocates overhead to capital
projects, review the Equipment Usage and Building Occupancy cost pools to
ensure costs are consistently and accurately allocated, and reorder the central
service department allocation sequence.
Allocation Bases Need to Be Periodically Reviewed and Updated
The methodology Finance utilizes to allocate indirect costs is by means of
“allocation bases,” or a set of criteria used to allocate indirect services provided
to departments. For example, the allocation base used to allocate the cost of
Finance’s payroll function across all services is the number of full-time equivalent
employees in each department.
To calculate the allocation bases, Finance utilizes data from Budget Office
Automated Budget System (ABS) reports and central service department-
provided workload data. Finance has intended to establish an allocation base for
all central service costs that relates the activity performed to the services
received by other departments. The purpose of this (as described in the
Background section of this report) is to determine the full cost of the City’s
services for fee setting purposes, or to reimburse the General Fund for services
provided to enterprise or special funds.
Finance uses a wide variety of allocation bases. The most prominent bases, by
prevalence and by the amount of allocated overhead, are departmental budget
size, number of full-time equivalent employees, and direct cost (i.e., functions that
are directly associated with specific departments or funds). Other bases may be
specialized and unique to a specific central service program and based on data
that approximates the workload of that program.
See Appendix B for a complete list of central service department functions and
their allocation bases.

Indirect Cost Allocation
20
Some Allocation Bases Do Not Reflect Actual Workload
Each year, Finance requests assistance from central service departments to
calculate the City’s overhead rates. It does this through individual memoranda to
departments, asking for workload data for their services. For example, in the
memo to the Human Resources Department (HR), Finance requests data on the
costs of prior year workers’ compensation claims by department. This
information is then used as the allocation base in the overhead plan to allocate
HR’s costs to administer the workers’ compensation program.
According to central service departments, although they provide data as
requested, they generally do not meet or communicate with Finance further
about how their data is used or the appropriateness of their allocation bases. In
addition, they may not review the overhead plan once it is completed.
Because of the lack of ongoing communication between central service program
staff who are most familiar with their work and Finance staff who prepare the
overhead plan, there are instances where costs in the plan have allocation bases
which do not reflect the actual workload of the program. For example, despite
providing accounting services for both the Sewer Service & Use Charge Fund and
the San José/Santa Clara Treatment Plant Operating Fund, all of Finance’s
associated accounting costs (totaling $462,000) are allocated to the Sewer Service
& Use Charge Fund only. Similarly, the costs of accounting services associated
with the City’s Facility and Maintenance Districts (totaling $168,000) are allocated
to all City departments based on the size of each department’s budget rather than
to the districts themselves.
There are also instances where the allocation base for individual costs within the
City-Wide Programs cost pool may need to be updated. For example, the cost of
auditing the City’s Comprehensive Annual Financial Report (CAFR) is allocated to
departments based on the number of audit hours associated with City Auditor-
prepared performance audits (which are unrelated to the preparation of the
CAFR). According to Finance, they communicate with the Budget Office to
identify City-Wide costs; however, it is unclear how much the Budget Office is
included in the discussion of how to allocate such costs.
Some Allocation Bases Have Not Been Updated to Account for
Organizational Changes
Finance’s procedures also call for central service programs to be reviewed each
year to ensure that any organizational changes are accurately reflected in the
overhead plan. As such, the memoranda Finance sends to central service
departments for updated workload data also ask that departments contact
Finance if they have questions or suggestions for improving service level
measurements. Despite this, there have been instances where organizational
changes have not been accounted for in the overhead plan.

Finding 2
21
For example, prior to the dissolution of the City’s Redevelopment Agency (RDA)
in 2012, a quarter of the Mayor and City Council’s costs were allocated to the
RDA. The methodology did not change upon the RDA’s dissolution, and a
quarter of the Mayor and City Council’s costs were allocated to the Successor
Agency to the Redevelopment Agency (SARA) in the FY 2013-14 overhead plan,
even though the workload has likely been reduced. Similarly, facility management
costs totaling $4.1 million have been allocated based on the workload of former
in-house custodial staff (a service which was outsourced in FY 2010-11) rather
than the current workload of facility management staff.
Better Communication Between Finance and Central Service
Departments Should Alleviate Problems
Regular communication between central service department staff and the Finance
Department about overhead cost allocations could help ensure that allocation
bases accurately reflect the service provided. In San Mateo County, department
financial officers are briefed yearly about the overhead process during a routine
meeting. The briefing includes information about the overhead plan, the
methodology used to allocate costs, the regulations the plan must follow, and the
purpose of cost allocation. Additionally, department staff is informed of the
timeline of the overhead plan preparation and are given specific details about
departmental allocations. This meeting takes place after the request for
department data is made and before the data is due, such that County staff have
the opportunity to ask questions if necessary.
Recommendation #3: Before the Cost Allocation Plan is developed,
the Finance Department should meet annually with central service
departments, and the Budget Office, to review the allocation bases of
their programs to ensure costs are appropriately allocated and identify
any significant changes in departmental workloads. This review should
include the allocation bases for City-Wide Expenses. Any changes
resulting from the above should be documented and Finance
Department’s procedures should be updated accordingly.
Recommendation #4: As part of its review of the FY 2014-15 Cost
Allocation Plan, the Finance Department should review and revise the
allocation bases to better reflect workload. This revision should
include the Mayor and City Council’s allocation to the Successor
Agency, the allocation of Public Works’ facility management costs, the
allocation of Finance costs for utility fund accounting, and any other
bases that are identified.

Indirect Cost Allocation
22
Finance Can Improve How It Allocates Overhead to Capital Projects
Finance calculates a separate capital overhead rate to recoup central service costs
related to personnel who are working on capital projects. Finance identifies
departmental staff charged to capital funds and determines their share of
overhead of their respective department. The actual capital rate is a weighted
average of the overhead rates of individual departments with capital program
staff. See Appendix C for detail on the capital rate calculation.
The capital overhead rate is applied on a bi-weekly basis against labor costs
charged to capital projects. For example, if City staff charges one hour of their
time to a particular capital project, overhead is calculated as a percentage of the
cost of that hour of time and charged to that capital project. This rate is utilized
for capital projects delivered by the Department of Public Works, the
Environmental Services Department, and others.
The capital rate for FY 2013-14 is 46.7 percent, up from 39.9 percent from the
prior year. Based on budgeted labor costs of about $26 million, $12 million in
overhead costs may be charged to capital projects in FY 2013-14.13
The Capital Overhead Rate May Not Fully Capture All Associated
Central Service Program Costs
As noted previously, a prominent allocation base utilized in the overhead plan is
the size of departmental budgets, the rationale being that the larger a department,
the more central services it is likely to utilize.14 Because of concerns that the
capital overhead rate is not fully capturing a proportionate share of central
service costs (in particular those related to oversight from the City Manager’s
Office and the Mayor and City Council), Finance includes both operating and
capital budgets in its calculation of a department (or fund’s) budget for overhead
allocation purposes.
However, including capital budgets in this way has had the effect of increasing
allocations of City Manager and other costs to some special operating funds and
not specifically to capital projects. For example, the capital budget for the City’s
sanitary sewer system was included in the Sewer Service & Use Charge operating
fund’s budget calculation, increasing the cost of overhead to that fund and not to
specific sanitary sewer capital projects. As such, individual capital projects may
not be reflecting the full cost of the services provided to them.
13 Actual overhead reimbursements are calculated based on staff activity charged to capital projects.
14 In total, $21.8 million in costs were allocated based on the size of department budgets in the FY 2013-14 plan. The
most prominent of these costs were a portion of the City Manager’s costs ($7.6 million) and the Mayor and City
Council costs ($5.5 million).

Finding 2
23
Finance Should Explore Alternative Methods to Allocate Overhead to
Capital Projects
For some central service programs, Finance applies a service ratio to estimate
workload and allocate costs. For example, the City Clerk’s costs are split
between allocated overhead and direct public service on a 60/40 ratio based on
an estimate of the City Clerk’s workload. Similarly, the Mayor and City Council’s
costs have been split between overhead to City departments and funds, overhead
to the former RDA, and public service on a 50/25/25 ratio. A similar service ratio
could be utilized to allocate a portion of the costs of the City Manager’s Office
and the Mayor and City Council to the capital program. Such costs would then
be included in the capital overhead rate calculation.
The benefit of charging overhead in this manner (rather than through a
departmental or fund rate) is that overhead will be charged directly to capital
projects and capital projects’ funds, and be based on actual activity during a
specific project’s completion. It would also avoid allocating capital-related
overhead to special operating funds (such as the Sewer Service & Use Charge
operating fund example described above).
Additionally, Finance does not treat rebudgets consistently in its calculation of the
department budget size allocation base. Finance backs out operating rebudgets
from this calculation. However, capital rebudgets are not backed out. Rebudgets
are unspent or unencumbered prioryear funds which are reauthorized for the
same purpose as previously approved (carried over), usually as a result of delayed
program implementation. Finance should back out capital rebudgets similar to
operating rebudgets.
Recommendation #5: To improve how it allocates overhead to capital
projects, the Finance Department should:
Utilize a workload estimate or other appropriate alternative
allocation methodology to account for City Manager, Mayor and
City Council, and other central service costs related to capital
programs
Back out capital rebudgets from the calculation of the
department budget size allocation base

Indirect Cost Allocation
24
Equipment Usage and Building Occupancy Cost Pools Should Be Reviewed to Ensure
Costs Are Consistently and Accurately Allocated
As described in Finding 1, the overhead plan includes Equipment Usage and
Building Occupancy cost pools meant to allocate a portion of the cost of
equipment and buildings to departments that use them. The purpose of this is to
ensure that the calculation of the full cost of a City service includes the cost of
the buildings and equipment necessary to deliver the service.
The costs allocated in the plan equal 6.67 percent of the historical cost of vehicles
and equipment and 2 percent of the historical cost of buildings (based on
expected lives of 15 and 50 years, respectively). The costs allocated in the plan
total $6.9 million in Equipment Usage costs and $4.3 million in Building
Occupancy costs.
The Cost of Grant-Funded Buildings and Equipment Should Be
Treated Consistently
Within the Building Occupancy cost pool, Finance has identified $7 million of
building assets which were funded through grants. The usage allowance of these
assets, totaling $146,000, is not deemed to be overhead and as such is not
allocated to departments to calculate overhead rates.
The City has also purchased equipment through grant funding. For example, in
FY 2011-12 the Fire Department purchased nearly $100,000 in equipment
through an Urban Area Security Initiative grant. In contrast to the grant-funded
buildings, the usage allowance of this equipment was included in the overhead
rate calculation.
We believe that grant-funded assets should be treated consistently across the
Building Occupancy and Equipment Usage cost pools.
Vehicles and Equipment Included in Department Non-Personal
Budgets Should Be Treated Consistently
As described in the Background, overhead rates take into account both allocated
overhead from the overhead plan and individual department strategic support and
non-personal costs. The Equipment Usage cost pool includes many vehicles and
pieces of equipment purchased out of individual departments’ non-personal
budgets. To account for this, Finance backs out vehicle replacement costs from
the non-personal budget portion of the rate calculation so that such costs are not
included twice (once as allocated overhead and a second time in the department’s
non-personal budget).
However, equipment costs do not appear to be backed out of the calculation in
the same manner. For example, computer equipment purchased by one
department totaling about $18,000 appears to be generating a usage allowance

Finding 2
25
but had not been backed out of the department’s non-personal budget in a similar
manner as the vehicle purchases. We believe vehicles and equipment purchases
should be treated in a consistent manner.
Vehicles and Equipment Schedule Used to Calculate Usage Allowance
Does Not Reconcile with Finance’s Fixed Asset Accounting System
To calculate annual equipment usage costs, Finance maintains a spreadsheet with
the historical cost of assets by department. Each year it is updated to include
new vehicles and equipment and exclude assets which were retired or disposed
of during the year. The total historical cost of the assets included ($104 million)
matches the amount reported in the City’s Comprehensive Annual Financial
Report (CAFR).
However, it appears that errors have occurred over time as the individual
departmental asset list used in the overhead plan does not reconcile to the
departmental list included in Finance’s fixed asset accounting system. For
example, the overhead plan’s backup worksheet shows $14 million in vehicles and
equipment for the Police Department (generating $933,000 in usage costs),
whereas the fixed asset accounting system reports $25 million in total vehicles
and equipment for the Police Department. Such discrepancies exist across nearly
all departments.
Because of the discrepancies, Finance should review and standardize its fixed
asset listings. As Public Works’ fleet management division also maintains an asset
inventory, Finance should also work with Public Works to ensure the correct
department is allocated equipment usage costs in the overhead plan.
Usage Allowances May be Allocated for Buildings and Equipment
Whose Costs Have Been Fully Allocated in Past Years
The usage allowance is meant to allocate the historical cost of an asset to
associated departments over time. Thus, no more equipment usage costs should
be allocated once the full cost has been captured through the year-to-year
overhead plans. For buildings, based on a 2 percent usage allowance, this would
mean that any asset over 50 years old should not be generating a usage allowance.
However, about $65,000 in usage allowances were generated for buildings older
than 50 years (in one instance, the building was more than 100 years old).
Based on a 6.67 percent usage allowance, the historical cost of vehicles and
equipment would be recaptured over 15 years. It appears that this cost pool may
also include assets whose historical cost has been fully allocated in prior years as
well.

Indirect Cost Allocation
26
Recommendation #6: To ensure that vehicle and equipment costs in
the Equipment Usage cost pool are consistently and accurately
allocated, the Finance Department should:
Treat grant-funded vehicles and equipment as unallocated costs
(similar to how grant-funded building assets are treated in the
Building Occupancy cost pool)
Treat vehicles and equipment purchased through departmental
non-personal budgets consistently
Review and standardize the vehicle and equipment fixed asset
schedules in the Cost Allocation Plan
Remove any assets which are more than 15 years old and whose
historical cost has been recaptured in past Cost Allocation Plans
Recommendation #7: To ensure that Building Occupancy costs are
accurately and appropriately allocated, the Finance Department should
remove any assets more than 50 years old and whose historical cost
has been recaptured in past Cost Allocation Plans.
Finance Should Reorder the Central Service Department Allocation Sequence
As described in the Background, the overhead plan utilizes a two-step method of
allocating central service costs. The first allocates all central service costs to all
other departments, including other central service departments. The second step
is a series of allocations, whereby the remaining central service costs are
allocated down to other departments (or closed out) in a designated order. The
close-out order of the central service departments is as follows (and correlates
with the order of departmental codes assigned in the City’s Financial Management
System (FMS)).15
1. City Manager
2. Emergency Services
3. Independent Police Auditor
4. Mayor and City Council
5. Finance
6. Information Technology
7. City Attorney
8. City Clerk
15 Unlike central service departments, the Building Occupancy, Equipment Usage, City-Wide Programs, and Building
Leases cost pools are not allocated overhead costs and are completely closed out after the first step.

Finding 2
27
9. City Auditor
10. Human Resources
11. General Services
Once a central service department has allocated its remaining costs in this step, it
no longer receives allocations from central service departments below it in the
designated allocation order (i.e., costs flow downward through the order in the
second step, but do not flow upward). For example, in the second step, City
Manager costs are allocated to Human Resources, but Human Resources’ costs
are not allocated to the City Manager or any of the departments above it in the
close-out process. See Appendix A for a graphical illustration of the allocation
process.
According to City Council Policy 1-18, central service costs are to be allocated
down “in priority order” to the departments and funds receiving their services.
The GFOA has written that the allocation order is important in estimating
indirect costs, and may significantly affect the outcome of cost allocation. The
GFOA further writes that usually central service departments that serve the most
departments are allocated first while (central service) departments that receive
the most services are allocated last.
In response to our question about the effect of the allocation order on overhead
rates, Finance ran a limited test scenario that reordered a few of the central
service departments. For most of the line departments, there was minimal
impact. However, one line department’s overhead rate changed by 1.5
percentage points. That was the case even with such a minimal change to the
allocation order.
To provide for more precise estimates of indirect costs, Finance should reorder
the allocation sequence of central service departments in the overhead plan such
that central service departments that serve the most departments are at the
beginning of the allocation order and those that serve the fewest are at the end.
Recommendation #8: To align the Cost Allocation Plan with City
Council Policy 1-18 and to provide for estimates of indirect costs that
better reflect workload, the Finance Department should reorder the
central service departments in the Cost Allocation Plan such that
central service departments that serve the most central service
departments (in terms of numbers and dollars) are at the beginning of
the allocation order, and those that serve the fewest are at the end.

Indirect Cost Allocation
28
This page was intentionally left blank

29
Finding 3 Finance’s Procedures and Resources
Should Be Enhanced
Summary
Finance relies heavily on Excel spreadsheets to calculate overhead – preparing at
least 150 worksheets that contain many different calculations, analyses, and other
information important to the overhead calculations. To ensure the consistency
and accuracy of these spreadsheets, we recommend Finance establish a process
for reviewing critical data entry areas and key calculations. Finance should also
document the rate calculation methodologies contained in these worksheets.
Finance also uses old overhead software that has limited functionality, does not
allow importing data from Excel files (necessitating an extensive manual data entry
exercise), and only provides limited reports. We recommend Finance switch to a
newer software application. Finally, Finance’s cost allocation process may also
improve with additional staffing as only 0.5 FTE is currently assigned to preparing
the City’s overhead plans.
Overhead Calculations Rely Heavily on Multiple Excel Spreadsheets
Finance makes extensive use of Excel spreadsheets in its cost allocation
calculations, preparing at least 150 different worksheets in the course of
calculating FY 2013-14 overhead rates. These spreadsheets contain a multitude
of data from various sources and contain many different calculations, analyses, and
other information important to the overhead process.
The spreadsheets serve many different purposes, but two critical uses – described
in more detail below – are accounting for direct bill credits (which, if omitted,
lead to departments being double-billed) and calculating overhead rates for utility
funds, capital funds, and paid absence rates. Finance also uses the spreadsheets to
store workload and budget data, make intermediate calculations (such as
distributing costs across a department’s services), compile data for entry into the
overhead software (NGCS II), and for other purposes.
Direct Bills Contained Multiple Data Entry Errors
Finance identifies direct bills16 through data from the Budget Office’s Automated
Budget System (ABS). Finance summarizes these costs ($11 million for FY 2013-
14) in an Excel worksheet and then enters them, as appropriate, in the NGCS II
software as a direct bill credit.
16 On some occasions, an enterprise fund or special fund pays directly (called a “direct bill”) for central services which
are normally funded by the General Fund. For example, the Sewer Service and Use Charge (SSUC) Fund directly paid
for $0.5 million in City Attorney costs in FY 2012-13. When Finance includes the Attorney costs as a central service in
the overhead calculations, it has to offset the allocation from Attorney to the SSUC Fund by $0.5 million – it has to
credit the SSUC Fund for the direct bill. Otherwise, the SSUC Fund would be paying twice for these services.

Indirect Cost Allocation
30
Because of data entry or other errors, it appears not all direct bills were
accounted for correctly in the FY 2013-14 plan. Errors included:
One direct bill totaling $419,000 paid by the Sewer Service and Use
Charge Fund was entered incorrectly to offset costs from the Water
Utility Fund.
$239,000 in direct bills identified by Finance from the ABS reports were
not entered into NGCS II to offset allocated costs. These included
$175,000 in City Attorney costs paid by the Workforce Investment Act
Fund and $64,000 in IT costs paid by the San José/Santa Clara Treatment
Plant Operating Fund.
$106,000 in direct bills related to City Auditor costs paid by various
utility funds were not identified by Finance in their review of the ABS
reports and as such were not entered into NGCS II to offset allocated
costs.
$564,000 in direct bills which Finance deemed related to unallocated
programs and did not enter into the plan. There was no explanation in
the Finance workpapers to explain this reasoning. $498,000 of these
costs related to IT costs paid through the Sewer Service and Use Charge
Fund and $66,000 related to Human Resources costs paid through the
Vehicle Maintenance and Operations Fund.
In some of the cases above, Finance could have identified and remedied the
errors by a more thorough review of the plan or its worksheets. For example, a
review of the plan’s detail pages could have found the $419,000 direct bill entered
on the wrong line because that fund had been allocated zero costs.
Unfortunately, given limited resources, these errors were missed.
Utility and Capital Overhead Rates, and Paid Absence Rates Require
Improved Documentation and Review
Finance also relies on Excel spreadsheets to calculate overhead rates for utility
and capital funds, as well as for determining paid absence rates. These
calculations have a major impact on ratepayers and City operations – utility
ratepayers ultimately paid $16.0 million in overhead in FY 2012-13.
Finance’s Spreadsheet Calculations Contain Inconsistencies
Finance annually calculates overhead rates for the City’s utility services, including
recycling and garbage services, sanitary sewers, storm sewers, wastewater
treatment, and potable water delivery. These overhead rates are eventually
factored into customers’ utility bills. Finance also calculates a capital overhead
rate to capture overhead for City employees working on capital projects and a
paid absence rate to capture the cost of City employee’s vacation, sick, and

Finding 3
31
holiday leaves.17 These rates cannot be calculated with NGCS II alone because
they involve multiple steps and data sources. Appendix C shows the rates and
rate calculations.
These rate calculations contained several inconsistencies, but it was unclear
whether these were data entry errors or intentional adjustments as supporting
documentation to explain the rationale behind them was lacking. For example:
The utility and capital rate worksheets included some cost figures that
were inconsistent with their data sources
The paid absence rate for “all other departments” may have been
mislabeled or miscalculated18
Finance’s procedures manual does not describe the purpose, methodology, or
formula for calculating utility rates and the capital rate. For example, it does not
specify the weighted average method currently used and also does not address
what costs should be included or excluded. Furthermore, it appears Finance staff
simply used the previous year’s spreadsheets as templates to replicate the
calculations with updated data. Thus, any potential inconsistencies and omissions
could persist into the future.
It also appears that line departments affected by these utility and capital rates may
have an unclear understanding of the calculation methodology. If Finance
documented and communicated its methodology, it could improve transparency
and understanding of these calculations in other departments (also see Finding 4).
Additional Review Can Prevent Errors and Eliminate Potential
Inconsistencies
Because of the heavy reliance on the large number of complex spreadsheets to
track direct bills, calculate utility and capital rates, and compile and analyze data,
there is a risk that errors will persist unless there is a more rigorous review
process. For example, if Finance had reviewed the critical worksheets and key
calculations noted above more closely, it likely could have discovered and
remedied many of these issues.
17 The paid absence rate is applied to an hourly staff time calculation; for example, the Police Department estimated
that 3.65 staff hours were needed to process a taxi driver permit. The fee for a taxi driver permit included the staff
salaries of those 3.65 hours, plus paid absence costs of 19 percent of salaries for the cost of vacation, sick, and holiday
leave associated with the direct 3.65 hours. To be exact, paid absence rates capture the costs of vacation, sick,
executive, holiday, personal, administrative, funeral, jury, military, and witness leave.
18 Finance calculated separate rates for the Police Department, the Fire Department, and “All Other Departments.” It
appears that the paid absence rate for all other departments actually included payroll data from all departments,
including Police and Fire. It is unclear if this was intentional or mislabeled. Moreover, Finance’s Excel formulas backed
out compensated time off and disability leave from the denominator, but not the numerator. Finance’s calculations also
did not take into account some pay codes such as paid time off (PTO), premium pays, or overtime. It was unclear if
these inclusions and exclusions were intentional.

Indirect Cost Allocation
32
Finance’s procedures, however, do not specifically address quality control or
supervisorial review. The procedures also do not differentiate roles for
management and staff. Given the vast scope of the calculations and data entry,
Finance should place emphasis on reviewing (1) direct bills because of the risk of
double-billing enterprise and special funds, (2) the utility and capital rate
calculations because of the high dollar impact to rate payers and special funds, and
(3) other areas it deems critical or where it deems there is risk of error. It
should also specify timelines for such a review, for example immediately after data
entry into NGCS II and before finalizing rates.
Recommendation #9: To improve the accuracy of its indirect cost
allocation calculations and ensure the previously identified errors do
not reoccur, Finance should:
Establish a review process of critical data entry areas and key
calculations. These should include direct bills from enterprise
and special funds; utility, capital, and paid absence rate
calculations; and other data entry or calculations which Finance
deems critical or where there is a high risk of material error.
Finance should also update its procedures to specify
management and staff roles and timelines for such reviews.
Document its methodologies and purposes for calculating utility
overhead rates, the capital overhead rate, and paid absence
rates. It should also document reasons for any adjustments
made.
Finance Uses Outdated and Inefficient Software
Finance uses a software application called New Griffith Cost System II (NGCS II) that
calculates the dollar allocations from central service departments to line
departments, using the allocation bases described in Finding 2. Since this involves
repeated, lengthy calculations (see Appendix A), it is not easy to manually
compute in Excel. It appears that NGCS II makes computations that are
arithmetically accurate.19
As it was developed in the early 1990s, NGCS II has limited functionality and is
outdated compared to newer software. It only runs on the DOS operating
system and the software vendor Maximus no longer provides support or updates.
Thus Finance today already is exposed to risk of NGCS II failing or becoming
19 Accurate computations notwithstanding, one part of NGCS II cannot handle numbers exceeding $99,999,999. This
necessitated a side calculation for the Police Department’s “Respond to Calls for Service” core service whose direct
labor costs were $103 million. Another idiosyncrasy is that NGCS II calculates fractions to four decimals, but only
displays three, with the rounding difference being absorbed into the last line-item.

Finding 3
33
incompatible and it will have to phase out its use of NGCS II sooner or later, by
choice or by necessity.20
NGCS II Requires Data Entry by Hand which Creates Potential for
Errors
NGCS II requires large amounts of manual data entry. In a major data entry
exercise, multiple Finance staff typed in by hand about 1,100 data points, which
were mainly the costs for each central service, allocation units for each central
service department, and direct bill credits. Finance staff estimated this data entry
exercise required at least two days to enter all the data for the FY 2013-14
overhead calculations.21 NGCS II does not allow Finance staff to import data
from an Excel spreadsheet. Exhibit 6 shows a screenshot of a data entry screen
in NGCS II.
Exhibit 7: NGCS II Data Entry Screen
Finance staff enters data by hand into the NGCS II application for each cost line item. Altogether, we estimate
1,100 data points require manual entry because NGCS II is not able to import Excel spreadsheets.
Source: Finance Department screenshot of NGCS II
20 Similarly, our 2012 audit of IT General Controls found that many City computer systems are outdated and should be
replaced. We recommended that the City “review the life expectancies of critical computer systems and determine a
replacement schedule and budget for the highest-priority systems and hardware.” This report is available at
http://www.sanjoseca.gov/DocumentCenter/View/3168.
21 This estimate is for the City-wide Plan only. The Airport Plan and Grant Plan require additional data entry of slightly
smaller scope.

Indirect Cost Allocation
34
It appears that Finance staff entered the vast majority of the numbers correctly,
but in our opinion, any large-scale data entry exercise introduces the risk of
errors like mistyping digits, switching/transposing digits, and entering numbers on
the wrong line. Several examples of such errors occurred in a sample of
departments, as already described in this and preceding Findings.
Current Reporting Options Are Limited
NGCS II is also limited in its reporting: it does not export its calculation results
to PDF or Excel format, instead only creating paper print-outs of schedules or the
entire plan. The printed FY 2013-14 plan exceeded 250 pages. These reporting
options make it very difficult for Finance staff to conduct more analysis of cost
origins and trends and to communicate more clearly with departments about the
reasonableness of allocation bases and costs.
Furthermore, the NGCS II reports are not user-friendly to line departments.
While they show the software’s calculation steps – if one follows the numbers
through 250-some pages – they are organized by central service department, and
not by line department. If analysts from the Environmental Services Department
(ESD) wanted to understand where its cost rates are coming from or if all of its
direct bills were accurately accounted for, they would have to look at detail
schedules sprinkled throughout the 250-page plan because there is no summary
page for ESD. See Appendix C for examples of such summary pages.
Because of NGCS II’s heavy data entry requirements, its lengthy calculations, and
its limited reporting options, it is difficult for Finance to calculate alternative
scenarios, carry out sensitivity analyses, or make predictions. Such analyses could
aid Finance and other departments to better understand the cost allocations and
isolate factors of interest (such as a large one-time expense or an outsourced
program). Potentially, Finance could then also analyze alternative scenarios to
quantify the impact of different methodology choices. One other jurisdiction
reported that they routinely analyze different cost allocation scenarios before
finalizing changes to their methodology.
Finance Should Switch to Newer Software
Previous Finance staff purchased a software license for updated overhead
software, Maxcars, in 2005. This software is from the same vendor that offered
the NGCS II software and has improved functionality compared to NGCS II.
Other jurisdictions which currently utilize Maxcars include Alameda County,
Sacramento County, San Diego County, and Santa Clara County.
However, Finance does not currently use the Maxcars software to produce its
overhead plan. Although the City made payments totaling $6,200 to the vendor
in 2009 and 2010 for support, upgrades, and training, because of staff turnover,
current staff was unaware of the Maxcars license. This is despite the fact that
Finance’s procedures manual throughout refers to Maxcars as the software to be

Finding 3
35
used. Current Finance staff believes that the reason the City did not switch to
the new software was because of the need to hire a consultant to transfer
archived cost plan data into the new system.
Benefits of Maxcars include importing and exporting data via Excel, as well as
adding notes and narratives, which Finding 4 also addresses and other agencies
have found helpful. A Maxcars vendor further described the following
functionalities of the software:
Reports can be printed, exported as PDF, or exported to Excel
Users can export a table to Excel, edit it in Excel, and re-import the
revised table
Users can create reports for year-to-year comparisons and error-
checking
Improved error-checking compared to NGCS II.
The Maxcars vendor has indicated that updates and support would cost $2,500
annually, plus a one-time fee ranging from $1,200 to $4,000 for the City to renew
its license and receive training; this does not appear cost-prohibitive.
Recommendation #10: To reduce its manual data entry and to
improve its reporting, Finance should discontinue its use of NGCS II
for producing the Cost Allocation Plan. Instead it should use Maxcars
or another suitable software program.
Additional Staffing Can Improve the Cost Allocation Process
Only 0.5 FTE is assigned to work on cost allocation calculations, according to the
Finance Department. While other Finance employees helped with specific data
entry, the majority of the work was handled by one employee. This employee’s
other responsibilities were aiding the preparations of the Comprehensive Annual
Financial Report (CAFR). Finance explained that the cost allocation calculations
were constrained in time until after the completion of the CAFR each fall, but had
to be completed in January before the annual budget process.
Other jurisdictions appear to assign more staffing to their cost allocation
preparations. Generally they had one or two employees working on their cost
allocation plans.22 Those agencies also prepared fewer plans (a federally compliant
Grant Plan and perhaps a “full” plan), whereas San José prepares three different
plans (the “full” City-wide Plan, a Grant Plan, and an Airport Plan).
22 Some agencies also contracted out their overhead calculations, but staff from these agencies explained that agency
staff still is significantly involved in reviewing data and communicating with departments, whereas the contractor only
prepares the cost allocation plan.

Indirect Cost Allocation
36
Moreover, the City staff who prepared the cost allocation calculations has
frequently turned over. Since 2007, at least nine different individuals have
prepared or supervised the preparations of the cost allocation plan. These
frequent staff transitions eroded much of the institutional memory, as current
Finance staff was unaware of the 2005 software purchase and relied on prior-year
spreadsheets to compute cost allocations.
Adequate staffing and retention remains critical to the Finance Department’s
ability to complete cost allocation calculations timely and accurately.
Recommendation #11: To reduce the reoccurrence of errors
identified, document methodologies, establish and clarify procedures,
improve future Cost Allocation Plans, and to enhance analysis and
communications with other departments to further transparency, the
Administration should determine whether to assign additional staff
resources to its preparations of the Cost Allocation Plans.

37
Finding 4 The Overhead Rate Calculation Can
Be More Transparent
Summary
The current overhead plan is difficult to comprehend and is not documented in a
clearly understandable format. Additionally, cost allocation information is not
well communicated to City staff, leading to confusion about how overhead is
calculated and how overhead rates should be applied. Other jurisdictions make
their plans easier to understand and explain by including descriptive information
about cost allocations. Finance should include such information and routinely
explain rates to City departments. Explaining overhead to departments is
particularly important when there are service delivery changes that might affect
the application of overhead.
Although Overhead Calculations and Plans Are Complicated, the City Can Take
Steps to Make the Overhead Plan Document More Transparent and Understandable
Overhead calculations and plans are generally complicated. With 15 central
service cost pools being allocated to 25 line departments and funds in the City’s
plan, there is a significant amount of data entry, analysis, and calculation to
produce a department’s overhead rates. The complex methodology makes costs
hard to trace (see Appendix A for a diagram of the methodology).
The Current Plan Is Difficult to Understand
The overhead plan for FY 2013-14 (which is the product of cost allocation
software) contains more than 250 pages of detailed cost schedules. It shows the
costs allocated from central service departments to line departments and the
distribution of costs from larger line departments to their own core services.
The current plan provides limited explanations to help a reader understand the
cost allocation process. It does not have an introduction or a statement of
purpose that outlines the reason for allocating costs or the method by which
costs are allocated. Accompanying each department’s allocation is a very brief
statement of what type of data was used to allocate the costs (such as
department budget size, square feet of building occupied, or number of hours
worked by staff). However, the data that is used and the services being allocated
are not well explained. Several central service departments have broad function
names with no description of what specific services these include. Simple
descriptions could help line departments understand what services are included in
their overhead rates. For example, the HR “Department Services” costs include
Employment Services (including hiring and recruiting), Health and Safety
(excluding Workers’ Compensation), and a portion of Employee Benefits.

Indirect Cost Allocation
38
Explaining this in the plan would make it clearer which of HR’s costs are
allocated.
As noted in the Background, there are a variety of ways in which departments can
be directly billed for services including: 1) direct bills that appear as offsets in the
plan, 2) direct charges that are unallocated and reimbursed outside the plan, and
3) costs that are allocated fully to one department in the plan. The plan does not
describe what these direct bills are or what they cover. Without explanation, it is
difficult for departments to ensure that direct bills and allocations are correctly
calculated.
The overhead plan also includes some costs that remain unallocated, as discussed
in Finding 1. These costs are marked in the overview of a central service
department’s allocation, but no rationales or explanations are included in the plan
for why these costs are deemed unallocable. For example, a portion of HR costs
is labeled only as “unallocated;” there is nothing in the plan to explain that these
costs specifically relate to Deferred Compensation and are unallocated because
the costs are separately charged. During our review, we found that there were
several reasons for why a cost would not be allocated. Outlining these reasons in
the plan would allow department staff to assess the appropriateness of their
allocations.
Tracing cost allocations is not straightforward and the lack of explanation makes
it even more difficult to comprehend. Without a plan that clearly explains cost
allocation, it is difficult for line departments to review allocations and understand
the calculation of their overhead rates.
There Are Ways to Make the Plan Easier to Understand
There are ways in which Finance could make the overhead plan more
understandable for City staff. Including in the plan an introduction and
descriptions of central service allocations, including direct bills, would facilitate
understanding of the City’s cost allocation.
The State Controller’s Office has prepared a procedure manual for counties to
follow when preparing their plans.23 As part of the procedures, the Controller’s
Office requires counties to include narratives to describe the cost allocation and
review the narratives annually. The Controller’s Office Handbook of Cost Plan
Procedures for California Counties states:
The importance of accurate and complete narratives in the cost plan
cannot be over-emphasized.
The narrative for each central support service must include:
23 The state of California requires that all counties submit their overhead plans annually to be reviewed and approved
by the State Controller’s Office.

Finding 4
39
1. A description of the cost centers or functions within the
service department and a concise summary of the extent
to which each of these cost pools and/or functions provide
services to other county departments;
2. A description of the types of costs that are considered to
be allowable, an explanation of why these costs are
allowable, and a discussion of the method or methods
used to separate allowable costs from those costs
considered to be unallowable;
3. A description of the allocation methods used to distribute
costs in each cost pool and the source of the data used to
distribute each cost pool’s assigned expenditures; and
4. A description of the methodology used to identify any
amounts billed to the user departments. The narrative for
each schedule must include a specific identification of each
revenue, interfund, and intrafund transfer received by the
central support department whose expenditures are being
allocated. If any of these resource inflows has not been
used to reduce expenditure allocations, a complete
explanation must be provided.
Including Narratives in the Plan Document Would Help Departments
Review Allocations
As the State Controller’s Office identifies, narratives that describe the cost
allocation “facilitate in-depth reviews of plans.” If line departments could review
the plan more thoroughly, including the allowable costs, the method of allocation,
and the direct bills, it could help to ensure the accuracy of the plan data. A well-
annotated plan could help the Finance Department communicate cost allocation
information to City staff, further decreasing the risk of inaccuracy and incorrect
use of overhead rates.
According to Finance and the Budget Office, it is critical that the plan does not
result in double charging to departments and funds. The shared goal of avoiding
double charges would be better achieved if the plan were clear enough that City
staff could review their allocations and check to ensure that they are only being
charged once for the services that they received.
Other Jurisdictions Include Explanatory Information in Their Overhead
Plan Documents
In other jurisdictions, the inclusion of introductions and narratives in the
overhead plan made the cost allocation easier to understand.
Introduction: Both the County of San Mateo and the City of Long Beach
include in their plans introductions that outline the purpose and process
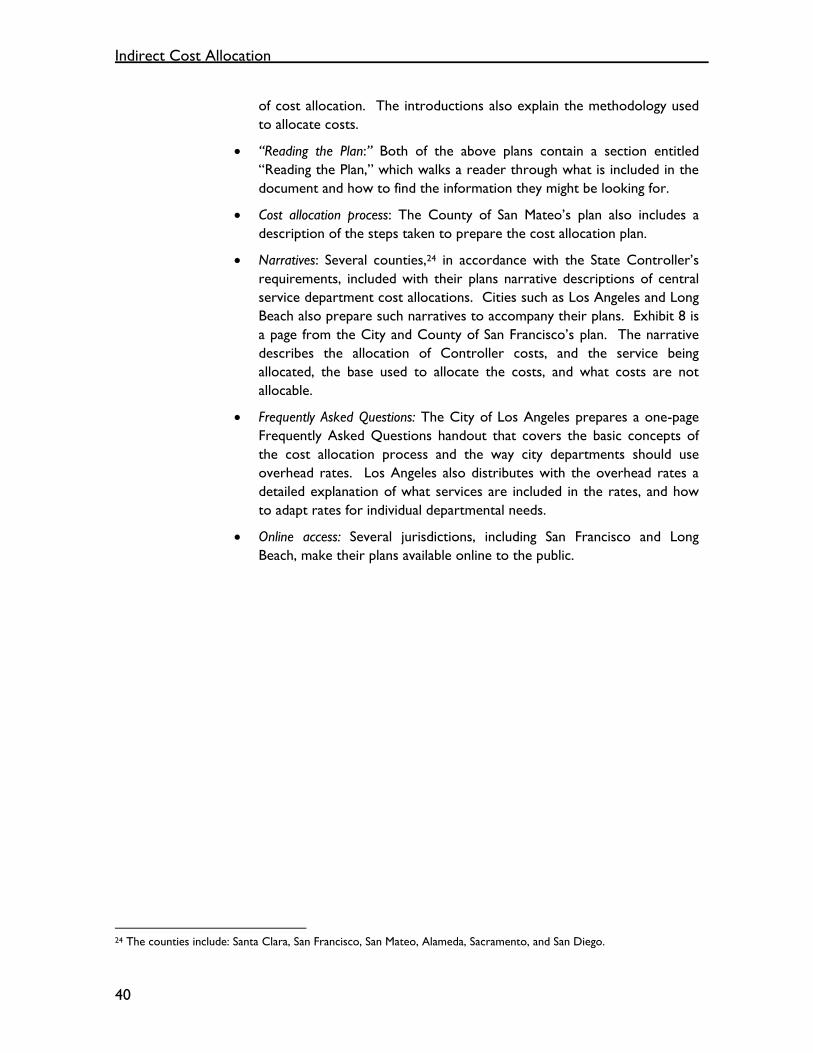
Indirect Cost Allocation
40
of cost allocation. The introductions also explain the methodology used
to allocate costs.
“Reading the Plan:” Both of the above plans contain a section entitled
“Reading the Plan,” which walks a reader through what is included in the
document and how to find the information they might be looking for.
Cost allocation process: The County of San Mateo’s plan also includes a
description of the steps taken to prepare the cost allocation plan.
Narratives: Several counties,24 in accordance with the State Controller’s
requirements, included with their plans narrative descriptions of central
service department cost allocations. Cities such as Los Angeles and Long
Beach also prepare such narratives to accompany their plans. Exhibit 8 is
a page from the City and County of San Francisco’s plan. The narrative
describes the allocation of Controller costs, and the service being
allocated, the base used to allocate the costs, and what costs are not
allocable.
Frequently Asked Questions: The City of Los Angeles prepares a one-page
Frequently Asked Questions handout that covers the basic concepts of
the cost allocation process and the way city departments should use
overhead rates. Los Angeles also distributes with the overhead rates a
detailed explanation of what services are included in the rates, and how
to adapt rates for individual departmental needs.
Online access: Several jurisdictions, including San Francisco and Long
Beach, make their plans available online to the public.
24 The counties include: Santa Clara, San Francisco, San Mateo, Alameda, Sacramento, and San Diego.

Finding 4
41
Exhibit 8: Sample Page From the City and County of San Francisco’s Plan
Source: 2012-13 City and County of San Francisco A-87 indirect cost allocation plan
Recommendation #12: To enhance transparency, Finance should
include in the Cost Allocation Plan document descriptions of the
services being allocated, the methodology used to allocate costs, and
the decisions made regarding allocable and unallocable costs.
Preceding the cost allocation schedules should be an introduction that
describes the purpose of the plan and the process of cost allocation.
The Overhead Plan Is Not Well Communicated to City Staff
To facilitate distribution of overhead rates across the City, the Finance
Department produces a two-page rate spreadsheet. This spreadsheet includes
the components used to calculate the overhead rate (central service allocation,
departmental strategic support costs, departmental non-personal costs, and the
direct labor costs) for each core service. It has rates both with and without non-
personal costs for the current year and the prior year. This spreadsheet is an
easy reference for using an overhead rate, but does not provide detail on what
costs are included in the central service allocations. To see this level of detail, a
department would have to refer to the full overhead plan. However, the plan is
not widely distributed or available to department staff.
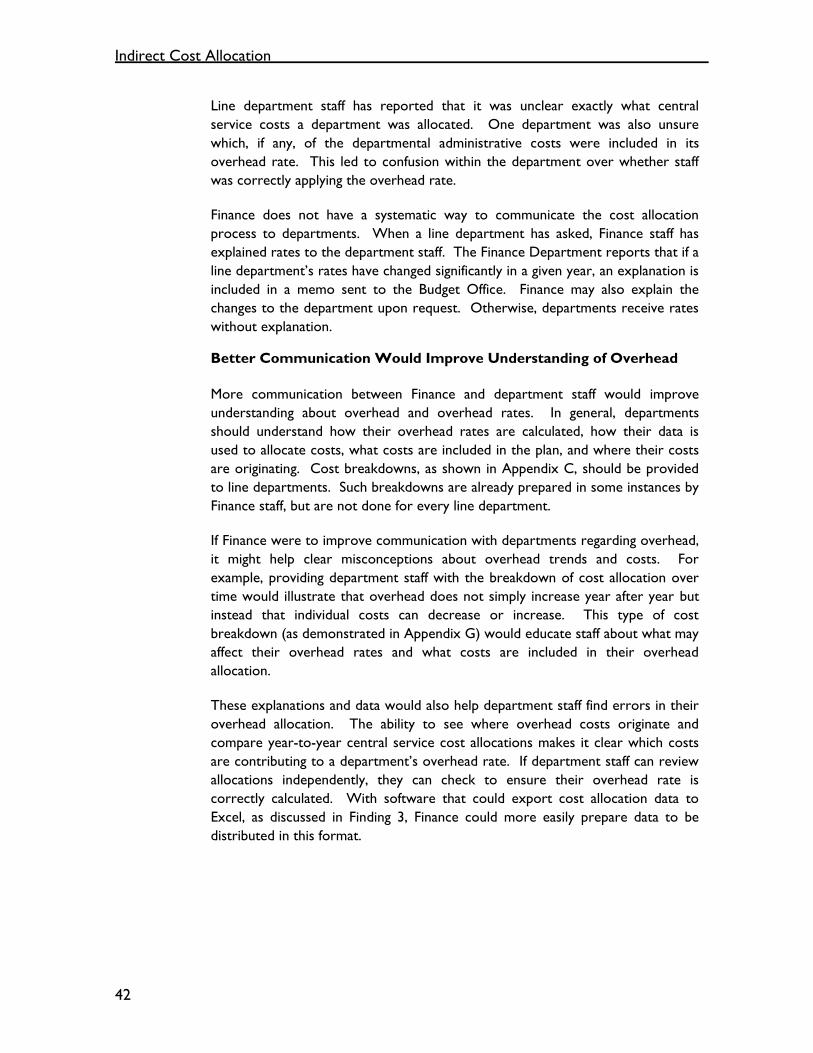
Indirect Cost Allocation
42
Line department staff has reported that it was unclear exactly what central
service costs a department was allocated. One department was also unsure
which, if any, of the departmental administrative costs were included in its
overhead rate. This led to confusion within the department over whether staff
was correctly applying the overhead rate.
Finance does not have a systematic way to communicate the cost allocation
process to departments. When a line department has asked, Finance staff has
explained rates to the department staff. The Finance Department reports that if a
line department’s rates have changed significantly in a given year, an explanation is
included in a memo sent to the Budget Office. Finance may also explain the
changes to the department upon request. Otherwise, departments receive rates
without explanation.
Better Communication Would Improve Understanding of Overhead
More communication between Finance and department staff would improve
understanding about overhead and overhead rates. In general, departments
should understand how their overhead rates are calculated, how their data is
used to allocate costs, what costs are included in the plan, and where their costs
are originating. Cost breakdowns, as shown in Appendix C, should be provided
to line departments. Such breakdowns are already prepared in some instances by
Finance staff, but are not done for every line department.
If Finance were to improve communication with departments regarding overhead,
it might help clear misconceptions about overhead trends and costs. For
example, providing department staff with the breakdown of cost allocation over
time would illustrate that overhead does not simply increase year after year but
instead that individual costs can decrease or increase. This type of cost
breakdown (as demonstrated in Appendix G) would educate staff about what may
affect their overhead rates and what costs are included in their overhead
allocation.
These explanations and data would also help department staff find errors in their
overhead allocation. The ability to see where overhead costs originate and
compare year-to-year central service cost allocations makes it clear which costs
are contributing to a department’s overhead rate. If department staff can review
allocations independently, they can check to ensure their overhead rate is
correctly calculated. With software that could export cost allocation data to
Excel, as discussed in Finding 3, Finance could more easily prepare data to be
distributed in this format.

Finding 4
43
Overhead Needs to Be Discussed With Departments When There Are
Organizational Changes
Lack of understanding about overhead can be particularly problematic during
times of organizational change. When City functions are moving between
departments, when departments are being combined or created, or when City
functions are being eliminated or outsourced, there is confusion about how
overhead should be affected and how overhead rates should be applied.
For example, when Animal Care and Services (ACS) was transferred from the
Parks, Recreation, and Neighborhood Services Department to the General
Services Department in 2008-09, it began using an incorrect overhead rate.
During the City Auditor’s Audit of Animal Care and Services in 2009,25 it was
determined that ACS was using a rate of 109 percent instead of a more
appropriate rate of 65 percent to calculate cost recovery. Since FY 2010-11,
Finance has created a separate rate for ACS. More communication between
Finance, ACS, and General Services during the transfer of the function might have
ensured that the correct rate had been applied from the beginning.
The Effect of Outsourcing on Overhead Should Be Clearer to Staff
As discussed in the Background section of this report, outsourcing a program will
change the type of central service costs allocated to a department or fund, but
probably will not eliminate the overhead altogether. The changes in budgeted
costs and staff will be reflected in the plan data (e.g., increases in overhead
associated with non-personal contract costs would offset some of the decrease in
overhead associated with staffing costs).
However, there is a concern that as a result of outsourcing a program, the
responsible department will not be allocated its fair amount of central service
costs even though the City is still providing oversight to the outsourced functions.
Similar to internal organizational changes, when programs or functions are being
outsourced it is important that Finance discuss the impacts on overhead. It
should be clear to departments and the Budget Office how outsourcing will affect
the core service overhead rate that the outsourced program was housed in as
well as the other core service rates in the department. Finance should make
clear in what ways overhead will still be applied to the department, and where the
department can expect changes, and, as mentioned in Finding 2, the Finance
Department should ensure that any organizational changes are reflected in the
cost allocation plan.
25 The audit report can be found here: http://www.sanjoseca.gov/DocumentCenter/View/3231

Indirect Cost Allocation
44
Recommendation #13: To improve transparency and understanding,
upon the annual completion of the Cost Allocation Plan Finance should
post the plan document online and establish a process by which:
The plan document is distributed to departments
Overhead and overhead rates are explained to line departments
to ensure they are appropriately applied, particularly in
instances when there have been service delivery changes
Departments can review the data being used, ask questions, and
make suggestions about the allocations

45
Conclusion
The City of San José allocates indirect costs (“overhead”) to determine the full
cost of providing services to the public. The objective of our audit was to review
and evaluate the City’s fiscal year 2013-14 City-wide Cost Allocation Plan
(overhead plan) for appropriateness and accuracy. We found that the indirect
cost allocation process needs improved procedures and the results of cost
allocation should be better communicated to City staff. Finance should clarify,
review, and update its definition of indirect costs and the methodology by which
indirect costs are allocated. Improved procedures and resources would enhance
Finance’s ability to perform and analyze cost allocation. Finally, cost allocation
and the calculation of overhead rates could be more transparent and better
communicated.
RECOMMENDATIONS
Recommendation #1: To ensure that central service costs are treated appropriately and
consistently, the Finance Department should update its procedures to more clearly define what
costs should and should not be allocated within the Cost Allocation Plan. Specifically, the
procedures should:
Provide guidance on how to determine whether a central service department, a City-
Wide program, or an individual central service program provides services to the public
versus to another City department
More clearly define what a “direct use building” is in determining allocated costs within
the building occupancy cost pool
Require that staff document decisions regarding whether costs should be deemed
allocable or unallocable in accordance with the above
Recommendation #2: To conform to the updated procedures (as outlined in Recommendation 1)
in the FY 2014-15 Cost Allocation Plan, the Finance Department should review and revise its lists
of:
Allocated and unallocated central service costs
City-Wide Expenses
Direct use buildings

Indirect Cost Allocation
46
Recommendation #3: Before the Cost Allocation Plan is developed, the Finance Department
should meet annually with central service departments, and the Budget Office, to review the
allocation bases of their programs to ensure costs are appropriately allocated and identify any
significant changes in departmental workloads. This review should include the allocation bases for
City-Wide Expenses. Any changes resulting from the above should be documented and Finance
Department’s procedures should be updated accordingly.
Recommendation #4: As part of its review of the FY 2014-15 Cost Allocation Plan, the Finance
Department should review and revise the allocation bases to better reflect workload. This
revision should include the Mayor and City Council’s allocation to the Successor Agency, the
allocation of Public Works’ facility management costs, the allocation of Finance costs for utility
fund accounting, and any other bases that are identified.
Recommendation #5: To improve how it allocates overhead to capital projects, the Finance
Department should:
Utilize a workload estimate or other appropriate alternative allocation methodology to
account for City Manager, Mayor and City Council, and other central service costs
related to capital programs
Back out capital rebudgets from the calculation of the department budget size allocation
base
Recommendation #6: To ensure that vehicle and equipment costs in the Equipment Usage cost
pool are consistently and accurately allocated, the Finance Department should:
Treat grant-funded vehicles and equipment as unallocated costs (similar to how grant-
funded building assets are treated in the Building Occupancy cost pool)
Treat vehicles and equipment purchased through departmental non-personal budgets
consistently
Review and standardize the vehicle and equipment fixed asset schedules in the Cost
Allocation Plan
Remove any assets which are more than 15 years old and whose historical cost has been
recaptured in past Cost Allocation Plans
Recommendation #7: To ensure that Building Occupancy costs are accurately and appropriately
allocated, the Finance Department should remove any assets more than 50 years old and whose
historical cost has been recaptured in past Cost Allocation Plans.

Conclusion
47
Recommendation #8: To align the Cost Allocation Plan with City Council Policy 1-18 and to
provide for estimates of indirect costs that better reflect workload, the Finance Department
should reorder the central service departments in the Cost Allocation Plan such that central
service departments that serve the most central service departments (in terms of numbers and
dollars) are at the beginning of the allocation order, and those that serve the fewest are at the
end.
Recommendation #9: To improve the accuracy of its indirect cost allocation calculations and
ensure the previously identified errors do not reoccur, Finance should:
Establish a review process of critical data entry areas and key calculations. These should
include direct bills from enterprise and special funds; utility, capital, and paid absence rate
calculations; and other data entry or calculations which Finance deems critical or where
there is a high risk of material error. Finance should also update its procedures to specify
management and staff roles and timelines for such reviews.
Document its methodologies and purposes for calculating utility overhead rates, the
capital overhead rate, and paid absence rates. It should also document reasons for any
adjustments made.
Recommendation #10: To reduce its manual data entry and to improve its reporting, Finance
should discontinue its use of NGCS II for producing the Cost Allocation Plan. Instead it should
use Maxcars or another suitable software program.
Recommendation #11: To reduce the reoccurrence of errors identified, document
methodologies, establish and clarify procedures, improve future Cost Allocation Plans, and to
enhance analysis and communications with other departments to further transparency, the
Administration should determine whether to assign additional staff resources to its preparations
of the Cost Allocation Plans.
Recommendation #12: To enhance transparency, Finance should include descriptions in the Cost
Allocation Plan document of the services being allocated, the methodology used to allocate costs,
and the decisions made regarding allocable and unallocable costs. Preceding the cost allocation
schedules should be an introduction that describes the purpose of the plan and the process of
cost allocation.

Indirect Cost Allocation
48
Recommendation #13: To improve transparency and understanding, upon the annual completion
of the Cost Allocation Plan Finance should post the plan document online and establish a process
by which:
The plan document is distributed to departments
Overhead and overhead rates are explained to line departments to ensure they are
appropriately applied, particularly in instances when there have been service delivery
changes
Departments can review the data being used, ask questions, and make suggestions about
the allocations

A-1
APPENDIX A

A-2
Appendix A Cost Allocation Methodology

A-3

A-4
This page was intentionally left blank

B-1
APPENDIX B

B-2
Appendix B Central Service Costs and Allocation Bases in
FY 2013-14 Cost Allocation Plan This table summarizes the City’s central services which Finance included in its City-Wide Cost Allocation Plan for FY 2013-14 (approximately $170 million).1 Costs are primarily budgeted costs as reported in the FY 2012-13 Adopted Operating Budget. The exceptions are the Building Occupancy and Equipment Usage cost pools which are based on the historical cost of buildings, vehicles, and equipment. Costs include a portion of the administrative costs within central service departments (e.g., Human Resources’ Strategic Support core service). Some of the costs below are offset by direct bills paid for by special funds. In total, $120 million of costs are allocated as overhead within the plan, $39 million remain unallocated, and $11 million are offset by direct bills. The allocation base describes how Finance estimated each department’s usage of the City central service. Description of central services included in the Cost Allocation Plan Total Costs Allocation Base (FY 2013-14) Building Occupancy
Selected buildings include service yards, communication buildings, and other direct use buildings
$4,305,342 Use allowance calculated as 2% of the historical cost of buildings. Allocated based on department’s % of building occupancy
Grant-funded buildings; those whose costs are charged outside of plan (e.g., City Hall); other select buildings
$24,240,141 Unallocated
Equipment Usage Vehicles and Equipment $6,901,275 Use allowance calculated as 6.67% of the historical cost of equipment. Allocated to department utilizing asset.
City-Wide Programs
Personal benefits (e.g., City dues/memberships, management training)
$608,508 # of budgeted FTEs
Support services (e.g., single audit) $1,511,250 Relative size of departmental budget
General liability insurance (and claims costs)
$2,535,000 Ratio of prior year claims’ cost
Workers’ compensation $17,370,000 Ratio of prior year claims’ cost
Revenue collection (e.g., property tax administration) $3,751,441 Relative size of departmental budget
Sick leave payments upon retirement $6,200,000 Ratio of prior year payments
1 Finance also prepares a Grant Plan and an Airport Plan. Those plans are based on two years’ prior actual expenditures and exclude some costs that are unallowable under federal rules (e.g., Mayor & City Council costs are excluded from the Grant Plan).

B-3
Departmental programs $578,345 100% to individual departments
(Note: Not all Budgeted City-Wide Expenses from the FY 2012-13 Adopted Budget are included in the overhead plan.)
Building Leases Building lease costs $1,821,253 Building lease contracts
City Manager City Manager department services $7,620,498 Relative size of departmental budget
Budget Office services – general $2,987,236 Survey of staff time allocation
Budget Office services – capital $413,993 100% to Public Works – Public Facilities
Budget Office services – Sewer Service & Use Charge $25,881 100% to Sewer Service & Use Charge Fund
City-wide programs (non-departmental services) $64,482 Unallocated
Emergency Services
Departmental services – emergency response $281,681 Relative size of departmental budget
Grant-funded programs $312,364 Unallocated
Direct services to the public $49,708 Unallocated
Independent Police Auditor
Departmental services – Police Department $1,065,761 100% to Police Department
Mayor & City Council
Departmental services (50%) $5,511,179 Relative size of departmental budget
Redevelopment/Successor Agency (RDA/SARA) services (25%) $2,755,590 100% to Successor Agency
Direct public service (25%) $2,755,590 Unallocated
Finance General accounting $1,390,929 Relative size of departmental budget
Payroll services $1,002,005 # of budgeted FTEs
Accounts payable $936,582 # and $ amount of invoices processed in prior year
Procurement $1,166,517 # of purchase requisitions processed in prior year
Materials management $321,976 Relative size of departmental budget
Accounts receivable $1,342,578 $ and volume of invoices processed in prior year
Special assessment accounting (for community facility and maintenance districts)
$167,703 Relative size of departmental budget
Debt services $714,529 Survey of staff time allocation
Debt services – Housing $194,804 100% to Housing Fund
Fixed assets accounting $110,670 # of capitalized fixed asset transactions by department in prior year
Fixed assets accounting – Airport $27,666 100% to Airport
Sewer Service & Use Charge accounting $461,860 100% to Sewer Service & Use Charge Fund

B-4
Utility billing accounting services $1,544,933 100% to various utility funds based on allocated staff costs
Special accounting – Public Works $54,033 100% to Public Works
Insurance services $272,364 Contract processing workload distribution and direct to individual departments/funds where appropriate
RDA/SARA accounting $120,345 100% to Successor Agency
Procurement costs paid for by utility funds $600,929 Unallocated
Unallocable revenue management costs (e.g., investment services, business tax certificates)
$4,277,780 Unallocated
Unallocable financial reporting costs (e.g., special fund reporting)
$321,098 Unallocated
Information Technology
Information systems (City-wide system support services) $11,292,561 IT Department level of service reports
Telephone administration (administration of phone services) $174,962 # of phone lines per department
Telephone expenses (processing department work order requests)
$860,619 Work order hours per department
Special fund services $4,200,485 100% direct charges to special funds based on staff budgeted to support systems
Unallocable costs associated with the Customer Contact Center and Development Services activities
$633,714 Unallocated
City Attorney Department counsel $6,143,164 City Attorney survey of department assignments by FTE
Litigation services $5,329,603 Ratio of prior year actual costs
Workers’ compensation $998,280 Ratio of prior year claims’ cost
Sewer Services & Use Charge Fund (litigation services) $518,492 100% to Sewer Service & Use Charge Fund
RDA Counsel (SARA) $1,463,190 100% to Successor Agency
Treatment Plant (WPCP) Operating Fund (litigation services) $117,269 100% to treatment plant operating fund
Air litigation services $76,868 100% to Airport
City Clerk Department services (60%) $1,241,526 Relative size of departmental budget
Direct public service programs (40%) $827,684 Unallocated
City Auditor Audit services $2,117,479 Actual prior year audit hours
Human Resources Department services (recruitment; health & safety) $3,484,169 # of budgeted FTEs
Workers’ compensation administration $2,422,026 Ratio of prior year claims’ cost

B-5
Employee benefits administration $2,278,697 Unallocated (charged separately through the benefit funds)
General Services Facility management (routine facility maintenance, non-work order)
$4,122,178 Square footage and # of FTE
Contract custodial $1,978,889 Square footage and budgeted costs
Facility management (maintenance/repairs requested through a work order)
$4,079,492 Labor hours and material costs of prior year work orders
Utilities and elevator maintenance $2,519,960 Square footage and actual prior year utility and elevator maintenance costs
Facility management – capital funds $3,824,063 100% to Public Works
Radio shop services $827,192 Physical distribution of radio and other communication equipment
Total $170,228,380
Source: Auditor analysis of FY 2013-14 City of San José City-Wide Cost Allocation Plan and Finance’s procedure manual.

B-6
This page was intentionally left blank

C-1
APPENDIX C

C-2
Appendix C Components of Overhead and Rate Calculations,
by Line Department This Appendix shows the components of overhead and the overhead rate calculation for each department and its core services. Also shown are the rate calculations for the utility funds and capital rate. The rates are “full” rates from the FY 2013-14 City-wide Plan (Grant Plan and Airport Plan rates exclude some costs which federal grant or other guidelines disallow). Below is a guide to understand the information presented in the tables that follow. See Appendix D for a comparison of all departments and funds. Library Example
Access to
Information,
Library
Materials and
Digital
Resources
Formal and
Lifelong Self-
Directed
Education Total
Cost of City central services
from General Services $668,131 $41,677 $709,808 7.8%
City-wide Programs $507,756 $31,673 $539,429 5.9%
Building Occupancy $469,409 $29,281 $498,690 5.5%
Equipment Usage $327,061 $20,401 $347,462 3.8%
Information Technology $313,778 $19,573 $333,351 3.7%
City Manager $269,696 $16,823 $286,519 3.2%
Finance $244,281 $15,238 $259,519 2.9%
Human Resources $146,674 $9,149 $155,823 1.7%
Mayor & City Council $136,530 $8,517 $145,047 1.6%
City Attorney $67,487 $4,210 $71,697 0.8%
City Clerk $30,783 $1,921 $32,704 0.4%
City Auditor $22,873 $1,427 $24,300 0.3%
Emergency Services $6,975 $436 $7,411 0.1%
Building Leases $4,486 $280 $4,766 0.1%
Independent Police Auditor $0 $0 $0 0.0%
A Sub-total $3,215,919 $200,606 $3,416,525 37.6%
Departmental Indirect Costs
B Non-Personal costs $2,850,055 $126,411 $2,976,466 32.8%
C Strategic Support $2,535,944 $158,190 $2,694,134 29.6%
Total Overhead Amount
D A+B+C $8,601,918 $485,207 $9,087,125 100.0%
Departmental Direct Labor Costs
E $13,342,865 $832,314 $14,175,179
Overhead Rates
D/E Divide Overhead by 64.47% 58.30%Direct Labor
1: The Finance Department calculated these allocations using central services’ FY 2012-13 Adopted Budget costs and FY 2011-12 (generally) workload measurements (see Appendix B). These allocations are already offset for direct bills, except when the direct bills are shown explicitly. Source: Finance Department’s City-wide FY 2013-14 Cost Allocation Plan, NGCS II Schedule G
3: In FY 2013-14, Library activities are supported by $145,047 of Mayor & City Council costs
4: Each department’s core service received a share of the department’s allocated central service costs generally proportional to the core service’s share of direct labor (line E) within the department. Central service costs may not add up exactly to line A due to rounding within the NGCS II software.
5: Finance obtained departmental non-personal costs from the FY 2012-13 Adopted Budget. It spread Library’s Strategic Support (admin) FY 2012-13 adopted costs across each core service according to its share of Library direct labor (line E). Source: Finance’s rate sheet (unaudited).
6: Finance uses direct labor costs as the base for its overhead rates. Direct labor includes Object Details 4001-4010. Source: Finance’s rate sheet (unaudited)
7: Overhead rates are for use in FY 2013-14. $1 of Library salaries in the Access to Information core service in FY 2013-14 is associated with $0.64 of overhead. Rates shown here include non-personal costs (line B), but the City also uses rates that exclude those non-personal costs.
2: City-wide Programs include Workers’ Compensation, Sick Leave Payouts upon Retirement, Property Tax Admin Fee, etc.

C-3
Economic Development Components of Overhead and FY 2013-14 Rate Calculation
Source: Finance Department’s City-wide FY 2013-14 Cost Allocation Plan, NGCS II Schedule G, and Finance’s rate sheet. Note that the cost of City central services may not add exactly to line A due to rounding within the NGCS II software.
Arts and
Cultural
Development
Regional
Workforce
Development
Business
Development
and Economic
Strategy
Real Estate
Services Total
Cost of City central services
from General Services $684,706 $77,472 $33,171 $14,699 $810,048 21.5%
City Attorney $52,467 $305,283 $65,924 $29,213 $452,887 12.0%
City-Wide Programs $99,645 $136,971 $59,331 $26,291 $322,238 8.5%
Information Technology $61,780 $146,226 $65,998 $29,246 $303,250 8.0%
City Manager $41,475 $149,103 $42,912 $19,016 $252,506 6.7%
Finance $37,852 $59,860 $27,320 $12,106 $137,138 3.6%
Equipment Usage $88,489 $25,107 $11,176 $4,953 $129,725 3.4%
Human Resources $17,947 $39,038 $17,709 $7,847 $82,541 2.2%
Mayor & City Council $15,664 $25,770 $11,538 $5,113 $58,085 1.5%
City Auditor $3,915 $11,083 $3,756 $1,664 $20,418 0.5%
Building Occupancy $3,854 $7,252 $3,358 $1,488 $15,952 0.4%
City Clerk $3,544 $5,845 $2,613 $1,158 $13,160 0.3%
Building Leases $1,473 $1,350 $516 $229 $3,568 0.1%
Emergency Services $799 $1,317 $589 $262 $2,967 0.1%
Independent Police Auditor $0 $0 $0 $0 $0 0.0%
A Sub-total $1,113,605 $991,671 $345,911 $153,283 $2,604,470 69.0%
Departmental Indirect Costs
B Non-Personal costs - - $244,848 $475,000 $719,848 19.1%
C Strategic Support $75,946 $225,192 $104,557 $46,332 $452,027 12.0%
Total Overhead Amount
D A+B+C $1,189,551 $1,216,863 $695,316 $674,615 $3,776,345 100.0%
Departmental Direct Labor Costs
E $987,395 $2,927,792 $1,359,381 $602,377 $5,876,945
Overhead Rates
D/E Divide Overhead by 120.47% 41.56% 51.15% 111.99%Direct Labor

C-4
Fire Components of Overhead and FY 2013-14 Rate Calculation
* City-Wide Programs included $5.7 million for Fire Department workers’ compensation claims. Source: Finance Department’s City-wide FY 2013-14 Cost Allocation Plan, NGCS II Schedule G, and Finance’s rate sheet. Note that the cost of City central services may not add exactly to line A due to rounding within the NGCS II software.
Emergency
Response
Fire
Prevention
Fire Safety
Code
Compliance Total
Cost of City central services
from City-Wide Programs * $8,342,641 $290,111 $215,891 $8,848,643 24.0%
Equipment Usage $1,931,345 $67,162 $49,979 $2,048,486 5.6%
City Attorney $1,586,323 $55,163 $41,051 $1,682,537 4.6%
General Services $1,530,321 $53,216 $39,602 $1,623,139 4.4%
Human Resources $1,247,233 $43,372 $32,276 $1,322,881 3.6%
Building Occupancy $1,219,357 $42,402 $31,555 $1,293,314 3.5%
Information Technology $1,057,211 $36,764 $27,358 $1,121,333 3.0%
City Manager $1,055,775 $36,715 $27,321 $1,119,811 3.0%
Finance $687,382 $23,903 $17,788 $729,073 2.0%
Mayor & City Council $593,008 $20,622 $15,346 $628,976 1.7%
City Auditor $329,281 $11,451 $8,521 $349,253 0.9%
City Clerk $133,803 $4,653 $3,463 $141,919 0.4%
Emergency Services $30,306 $1,055 $784 $32,145 0.1%
Building Leases $19,297 $672 $499 $20,468 0.1%
Independent Police Auditor $0 $0 $0 $0 0.0%
A Sub-total $19,763,289 $687,258 $511,435 $20,961,982 56.8%
Departmental Indirect Costs
B Non-Personal costs $1,196,744 $171,813 $155,773 $1,524,330 4.1%
C Strategic Support $13,592,708 $472,679 $351,752 $14,417,139 39.1%
Total Overhead Amount
D A+B+C $34,552,741 $1,331,750 $1,018,960 $36,903,451 100.0%
Departmental Direct Labor Costs
E $75,159,181 $2,613,619 $1,944,970 $79,717,770
Overhead Rates
D/E Divide Overhead by 45.97% 50.95% 52.39%Direct Labor

C-5
Library Components of Overhead and FY 2013-14 Rate Calculation
* The amount from Human Resources to the Library was offset in the plan by a direct bill credit of $62,586. Source: Finance Department’s City-wide FY 2013-14 Cost Allocation Plan, NGCS II Schedule G, and Finance’s rate sheet. Note that the cost of City central services may not add exactly to line A due to rounding within the NGCS II software.
Access to
Information,
Library
Materials and
Digital
Resources
Formal and
Lifelong Self-
Directed
Education Total
Cost of City central services
from General Services $668,131 $41,677 $709,808 7.8%
City-wide Programs $507,756 $31,673 $539,429 5.9%
Building Occupancy $469,409 $29,281 $498,690 5.5%
Equipment Usage $327,061 $20,401 $347,462 3.8%
Information Technology $313,778 $19,573 $333,351 3.7%
City Manager $269,696 $16,823 $286,519 3.2%
Finance $244,281 $15,238 $259,519 2.9%
Human Resources * $146,674 $9,149 $155,823 1.7%
Mayor & City Council $136,530 $8,517 $145,047 1.6%
City Attorney $67,487 $4,210 $71,697 0.8%
City Clerk $30,783 $1,921 $32,704 0.4%
City Auditor $22,873 $1,427 $24,300 0.3%
Emergency Services $6,975 $436 $7,411 0.1%
Building Leases $4,486 $280 $4,766 0.1%
Independent Police Auditor $0 $0 $0 0.0%
A Sub-total $3,215,919 $200,606 $3,416,525 37.6%
Departmental Indirect Costs
B Non-Personal costs $2,850,055 $126,411 $2,976,466 32.8%
C Strategic Support $2,535,944 $158,190 $2,694,134 29.6%
Total Overhead Amount
D A+B+C $8,601,918 $485,207 $9,087,125 100.0%
Departmental Direct Labor Costs
E $13,342,865 $832,314 $14,175,179
Overhead Rates
D/E Divide Overhead by 64.47% 58.30%Direct Labor

C-6
Parks, Recreation & Neighborhood Services Components of Overhead and FY 2013-14 Rate Calculation
Source: Finance Department’s City-wide FY 2013-14 Cost Allocation Plan, NGCS II Schedule G, and Finance’s rate sheet. Note that the cost of City central services may not add exactly to line A due to rounding within the NGCS II software.
Parks
Maintenance
and Operations
Recreation and
Community
Services Total
Cost of City central services
from General Services $1,557,091 $996,129 $2,553,220 13.3%
City-wide Programs $1,135,887 $726,671 $1,862,558 9.7%
Information Technology $744,311 $476,164 $1,220,475 6.4%
City Manager $528,637 $338,189 $866,826 4.5%
City Attorney $446,596 $285,705 $732,301 3.8%
Equipment Usage $339,491 $217,186 $556,677 2.9%
Finance $329,797 $210,983 $540,780 2.8%
Human Resources $284,658 $182,107 $466,765 2.4%
Mayor & City Council $248,185 $158,773 $406,958 2.1%
City Clerk $56,043 $35,853 $91,896 0.5%
City Auditor $46,718 $29,887 $76,605 0.4%
Building Occupancy $24,081 $15,406 $39,487 0.2%
Emergency Services $12,685 $8,115 $20,800 0.1%
Building Leases $8,478 $5,424 $13,902 0.1%
Independent Police Auditor $0 $0 $0 0.0%
A Sub-total $5,762,661 $3,686,592 $9,449,253 49.2%
Departmental Indirect Costs
B Non-Personal costs $4,748,314 $1,225,410 $5,973,724 31.1%
C Strategic Support $2,313,034 $1,479,735 $3,792,769 19.7%
Total Overhead Amount
D A+B+C $12,824,009 $6,391,737 $19,215,746 100.0%
Departmental Direct Labor Costs
E $12,820,522 $8,201,772 $21,022,294
Overhead Rates
D/E Divide Overhead by 100.03% 77.93%Direct Labor

C-7
Planning, Building & Code Enforcement Components of Overhead and FY 2013-14 Rate Calculation
* Finance credited PBCE $651,374 in February 2013, after the initial rate release, for shared positions’ costs. Source: Finance Department’s City-wide FY 2013-14 Cost Allocation Plan, NGCS II Schedule G, and Finance’s rate sheet. Note that the cost of City central services may not add exactly to line A due to rounding within the NGCS II software.
Development
Plan Review
and Building
Construction
Inspection
Community
Code
Enforcement
Long Range
Land Use
Planning Total
Costs from City central services
from Information Technology $498,056 $211,088 $51,083 $760,227 10.3%
City Attorney $497,725 $209,598 $51,049 $758,372 10.3%
City-Wide Prorgrams $490,336 $212,248 $50,291 $752,875 10.2%
General Services $380,654 $285,548 $39,042 $705,244 9.6%
City Manager $238,201 $101,876 $24,431 $364,508 5.0%
Equipment Usage $151,716 $78,944 $15,561 $246,221 3.3%
Finance $142,583 $63,235 $14,624 $220,442 3.0%
Human Resources $136,854 $58,277 $14,036 $209,167 2.8%
Mayor & City Council $93,807 $40,734 $9,622 $144,163 2.0%
City Auditor $24,330 $10,418 $2,495 $37,243 0.5%
City Clerk $21,275 $9,236 $2,182 $32,693 0.4%
Emergency Services $4,794 $2,083 $491 $7,368 0.1%
Building Occupancy $4,030 $1,959 $414 $6,403 0.1%
Building Leases $3,811 $1,806 $391 $6,008 0.1%
Independent Police Auditor $0 $0 $0 $0 0.0%
Adjustment * ($651,374) * $0 $0 ($651,374) -8.8%
A Sub-total $2,036,790 $1,287,044 $275,713 $3,599,547 48.9%
Departmental Indirect Costs
B Non-Personal costs $1,677,776 $545,159 $1,053,712 $3,276,647 44.5%
C Strategic Support $319,185 $133,888 $32,737 $485,810 6.6%
Total Overhead Amount
D A+B+C $4,033,751 $1,966,091 $1,362,162 $7,362,004 100.0%
Departmental Direct Labor Costs
E $11,682,571 $4,900,463 $1,198,228 $17,781,262
Overhead Rates
D/E Divide Overhead by 34.53% 40.12% 113.68%Direct Labor

C-8
Police Components of Overhead and FY 2013-14 Rate Calculation
a Also see Appendix G for a five-year trend of the Police Department’s allocations received from central services. b City-Wide Programs included $7.8 million for Police Department workers’ compensation claims.
Respond to
Calls for
Service
Investigative
Services
Traffic Safety
Services
Cost of City central services a
from City-Wide Programs b $10,461,373 $2,946,168 $661,110
City Attorney $2,396,586 $674,935 $151,453
General Services $1,760,316 $495,746 $111,244
Building Occupancy $1,595,495 $449,329 $100,828
Information Technology $1,468,197 $413,479 $92,784
Human Resources $1,462,753 $411,946 $92,439
City Manager $1,320,565 $371,902 $83,454
Building Leases $1,198,094 $337,411 $75,714
Equipment Usage $919,695 $259,008 $58,120
Mayor & City Council $830,633 $233,926 $52,492
Finance $826,830 $232,855 $52,251
Independent Police Auditor $761,714 $214,516 $48,137
City Auditor $237,243 $66,814 $14,993
City Clerk $187,413 $52,780 $11,844
Emergency Services $42,448 $11,955 $2,683
A Sub-total $25,469,374 $7,172,772 $1,609,546
Departmental Indirect Costs
B Non-Personal costs $6,833,712 $4,382,617 $397,208
C Strategic Support $21,175,025 $5,963,383 $1,338,164
Total Overhead Amount
D A+B+C $53,478,111 $17,518,772 $3,344,918
Departmental Direct Labor Costs
E $103,040,897 $29,018,729 $6,511,708
Overhead Rates
D/E Divide Overhead by Direct Labor 51.90% 60.37% 51.37%

C-9
Police (continued)
Source: Finance Department’s City-wide FY 2013-14 Cost Allocation Plan, NGCS II Schedule G, and Finance’s rate sheet. Note that the cost of City central services may not add exactly to line A due to rounding within the NGCS II software.
Crime
Prevention
and
Community
Education
Regulatory
Services
Special Events
Services Total
Cost of City central services
$305,022 $210,658 $52,831 $14,637,162 18.9% City-Wide Programs
$69,877 $48,260 $12,102 $3,353,213 4.3% City Attorney
$51,325 $35,447 $8,890 $2,462,968 3.2% General Services
$46,520 $32,129 $8,056 $2,232,357 2.9% Building Occupancy
$42,808 $29,564 $7,414 $2,054,246 2.7% Information Technology
$42,649 $29,455 $7,387 $2,046,629 2.6% Human Resources
$38,504 $26,592 $6,668 $1,847,685 2.4% City Manager
$34,933 $24,126 $6,051 $1,676,329 2.2% Building Leases
$26,816 $18,519 $4,645 $1,286,803 1.7% Equipment Usage
$24,219 $16,727 $4,194 $1,162,191 1.5% Mayor & City Council
$24,108 $16,650 $4,175 $1,156,869 1.5% Finance
$22,209 $15,338 $3,847 $1,065,761 1.4% Independent Police Auditor
$6,917 $4,777 $1,198 $331,942 0.4% City Auditor
$5,465 $3,773 $946 $262,221 0.3% City Clerk
$1,237 $854 $215 $59,392 0.1% Emergency Services
$742,610 $512,871 $128,621 $35,635,794 46.1% Sub-total
$170,167 $226,612 $61,320 $12,071,636 15.6%
$617,400 $426,396 $106,934 $29,627,302 38.3%
$1,530,177 $1,165,879 $296,875 $77,334,732 100.0%
$3,004,363 $2,074,908 $520,358 $144,170,963
50.93% 56.19% 57.05%

C-10
Public Works Components of Overhead and FY 2013-14 Rate Calculation
* The Department of General Services was consolidated into Public Works in 2010-11, but Finance continues to treat General Services separately as a central service. Thus the core services of Facilities Management and Fleet and Equipment Services are not included in the total shown here. Source: Finance Department’s City-wide FY 2013-14 Cost Allocation Plan, NGCS II Schedule G, and Finance’s rate sheet. Note that the cost of City central services may not add exactly to line A due to rounding within the NGCS II software.
Animal Care
and Services Total *
Cost of City central services direct bill credits direct bill credits
from General Services $4,446,661 ($1,891,168) $128,789 ($455,666) $572,043 $2,800,659 25.4%
City Attorney $804,076 $183,930 $45,623 $1,033,629 9.4%
Information Technology $789,454 $171,050 $72,312 $1,032,816 9.4%
Equipment Usage $862,256 $92,686 $72,702 $1,027,644 9.3%
City Manager $868,327 $93,851 $45,787 $1,007,965 9.1%
City-Wide Programs $766,401 $132,089 $92,362 $990,852 9.0%
Finance $481,004 ($53,707) $89,814 ($12,940) $189,821 $693,992 6.3%
Mayor & City Council $184,289 $33,643 $31,778 $249,710 2.3%
Human Resources $199,986 ($114,165) $41,257 ($27,507) $45,891 $145,462 1.3%
City Auditor $64,354 $9,089 $5,014 $78,457 0.7%
City Clerk $41,642 $7,620 $7,151 $56,413 0.5%
Building Occupancy $19,193 $2,604 $1,539 $23,336 0.2%
Building Leases $13,423 $1,301 $1,587 $16,311 0.1%
Emergency Services $9,418 $1,720 $1,621 $12,759 0.1%
Independent Police Auditor $0 $0 $0 $0 0.0%
A Sub-total $1,185,241 $9,170,025 83.0%
Departmental Indirect Costs
B Non-Personal costs $851,961 $874,961 7.9%
C Strategic Support - $997,759 9.0%
Total Overhead Amount
D A+B+C $2,037,202 $11,042,745 100.0%
Departmental Direct Labor Costs
E $3,435,288 $23,199,413
Overhead Rates
D/E Divide Overhead by 59.30%Direct Labor
Regulate/Facilitate Private
Development
Plan, Design, and Construct
Public Facilities and
Infrastructure
$7,491,452
$8,000
$804,032
$8,303,484
$15,926,685
52.14% 18.29%
$3,837,440
$702,059
$193,727
$15,000
$493,332

C-11
This page was intentionally left blank

C-12
Transportation Components of Overhead and FY 2013-14 Rate Calculation
Source: Finance Department’s City-wide FY 2013-14 Cost Allocation Plan, NGCS II Schedule G, and Finance’s rate sheet. Note that the cost of City central services may not add exactly to line A due to rounding within the NGCS II software.
Sanitary
Sewer
Maintenance
Transp.
Operations
Pavement
Maintenance
Storm
Sewer
Management
Traffic
Maintenance
Cost of City central services
from City-Wide Programs $328,518 $184,509 $169,827 $166,152 $148,411
City Manager $206,968 $116,242 $106,992 $104,676 $93,499
General Services $171,901 $96,547 $88,864 $86,941 $77,658
Information Technology $169,300 $95,086 $87,519 $85,626 $76,483
City Attorney $157,040 $88,200 $81,181 $79,425 $70,944
Finance $156,081 $87,661 $80,685 $78,939 $70,511
Equipment Usage $137,130 $77,018 $70,889 $69,355 $61,950
Mayor & City Council $116,757 $65,575 $60,357 $59,051 $52,745
Human Resources $75,665 $42,497 $39,115 $38,268 $34,183
City Clerk $26,317 $14,781 $13,605 $13,310 $11,889
City Auditor $16,097 $9,041 $8,321 $8,141 $7,272
Building Occupancy $7,684 $4,315 $3,972 $3,886 $3,471
Emergency Services $5,966 $3,351 $3,084 $3,018 $2,696
Building Leases $2,069 $1,162 $1,070 $1,046 $934
Independent Police Auditor $0 $0 $0 $0 $0
A Sub-total $1,577,498 $885,986 $815,484 $797,836 $712,649
Departmental Indirect Costs
B Non-Personal costs - $460,310 $43,128 $135,064 $2,360,341
C Strategic Support $266,270 $149,548 $137,648 $134,669 $120,290
Total Overhead Amount
D A+B+C $1,843,768 $1,495,844 $996,260 $1,067,569 $3,193,280
Departmental Direct Labor Costs
E Direct Labor costs $6,022,217 $3,382,318 $3,113,173 $3,045,798 $2,720,591
Overhead Rates
D / E Divide Overhead by 30.62% 44.23% 32.00% 35.05% 117.37%Direct Labor

C-13
Transportation (continued)
a The amount from General Services to the Parking Fund was negative because a direct bill credit of $70,184 exceeded the cost allocation within the plan. b The amount from Information Technology to the Parking Fund was offset in the plan by a direct bill credit of $15,501.
Transp.
Planning and
Project
Delivery
Parking
Services Parking Fund
Street
Landscape
Maintenance
Maintenance
Assessment
Districts Total
Cost of City central services
$134,396 $130,463 $81,284 $70,360 $36,707 $1,450,627 10.9% City-Wide Programs
$84,670 $82,192 $103,253 $44,327 $53,672 $996,491 7.5% City Manager
$70,324 $68,267 ($32,761) a $36,817 $17,241 $681,799 5.1% General Services
$69,261 $67,233 $48,523 b $36,260 $20,887 $756,178 5.7% Information Technology
$64,245 $62,364 $35,375 $33,634 $16,418 $688,826 5.2% City Attorney
$63,853 $61,984 $45,100 $33,429 $20,734 $698,977 5.3% Finance
$56,099 $54,458 $27,891 $29,369 $12,781 $596,940 4.5% Equipment Usage
$47,765 $46,367 $59,876 $25,006 $27,666 $561,165 4.2% Mayor & City Council
$30,955 $30,048 $25,099 $16,205 $10,918 $342,953 2.6% Human Resources
$10,766 $10,451 $13,485 $5,636 $6,232 $126,472 1.0% City Clerk
$6,585 $6,392 $7,417 $3,447 $3,603 $76,316 0.6% City Auditor
$3,143 $3,052 $17,568 $1,646 $736 $49,473 0.4% Building Occupancy
$2,440 $2,370 $3,059 $1,278 $1,414 $28,676 0.2% Emergency Services
$847 $822 $804 $443 $365 $9,562 0.1% Building Leases
$0 $0 $0 $0 $0 $0 0.0% Independent Police Auditor
$645,350 $626,466 $435,966 $337,858 $229,377 $7,064,470 53.2% Sub-total
$94,017 $933,492 - $1,037,120 - $5,063,472 38.1%
$108,930 $105,743 $51,221 $57,028 $23,706 $1,155,053 8.7%
$848,297 $1,665,701 $487,187 $1,432,006 $253,083 $13,282,995 100.0%
$2,463,672 $2,391,580 $1,158,468 $1,289,798 $536,164 $26,123,779
34.43% 69.65% 42.05% 111.03% 47.20%

C-14
Utility Funds Components of Overhead and FY 2013-14 Rate Calculation For each utility fund, Finance calculated an overhead rate that takes into account: Central service costs allocated to that fund (offset for any direct bills); central service costs allocated to an ESD or DOT core service whose direct labor is partially paid by that fund (pro-rated to the direct labor share); administrative and non-personal costs in ESD and DOT (pro-rated to the fund’s direct labor share).
a Source: Finance calculation worksheets “Special Funds Rate Calculation Detail” b Source: Finance worksheet “Special Funds Rate Calculation Detail.” “Other” includes central service allocations to other departments’ core services that are also funded by this Fund. These allocations are relatively small and thus not shown separately here.
ESD
Recycling and
Garbage Svcs
DOT Storm
Sewer Mgmt
ESD
Stormwater
Mgmt (Urban
Runoff)
Major Costs of City central services direct bill credits direct bill credits
from Information Technology $187,123 $3,425,545 ($2,995,716) $85,626 $150,579 $408,268 ($363,765)
City Manager $134,905 $140,389 $104,676 $108,559 $101,311
City-wide Programs $93,154 $115,635 $166,152 $74,962 $39,754
City Attorney $106,726 $120,247 ($36,985) $79,425 $85,883 $9,790
Finance $98,758 $975,861 ($1,015,028) $78,939 $79,472 $17,628 ($38,835)
Mayor & City Council $91,173 $18,864 $59,051 $73,366 $40,733
General Services $82,643 $104,040 $86,941 $66,503 $49,478
City Auditor $35,997 $58,922 $8,141 $28,967 $11,525
Equipment Usage $16,648 $78,556 $69,355 $13,397 $13,136
City Clerk $20,570 $3,835 $13,310 $16,553 $9,132
Human Resources $12,116 $19,836 ($21,340) $38,268 $9,750 $5,938 ($44,009)
Emergency Services $4,660 $965 $3,018 $3,750 $2,082
Building Leases $1,177 $9,144 $1,046 $947 $1,487
Building Occupancy $657 $4,688 $3,886 $529 $596
Independent Police Auditor $0 $0 $0 $0 $0
$5,076,527 ($4,069,069) $710,858 ($446,609)
Sub-total $886,307 $1,007,458 $797,834 $713,217 $264,249
% of direct labor from this Fund a 100% 100% 100% 91.19% 100% 100% 100%
A Allocations (pro-rated) $886,307 $1,007,458 $727,545 $713,217 $264,249
Total Overhead Amount
A Allocations to ESD/DOT
A " DOT Storm Sewer Mgmt $727,545
A " ESD Recycling & Garbage Svcs $886,307 ESD Stormwater Mgmt $713,217
A Allocations to the Fund Integrated Waste Mgmt F423 $1,007,458 Storm Sewer Operating Fund 446 $264,249
B Other Public Works $191,361
C Other Admin; Non-Pers; Other b $277,235 Admin; Non-Pers; Other b $378,953
D A+B+C Total Overhead $2,171,000 $2,275,325
Utility Fund's Direct Labor costs
E $7,111,293 $7,658,071
Overhead Rates
D/E Divide Overhead by Direct Labor 30.53% 29.71%
Storm Sewer Operating
Fund 446
Integrated Waste Mgmt
Fund 423
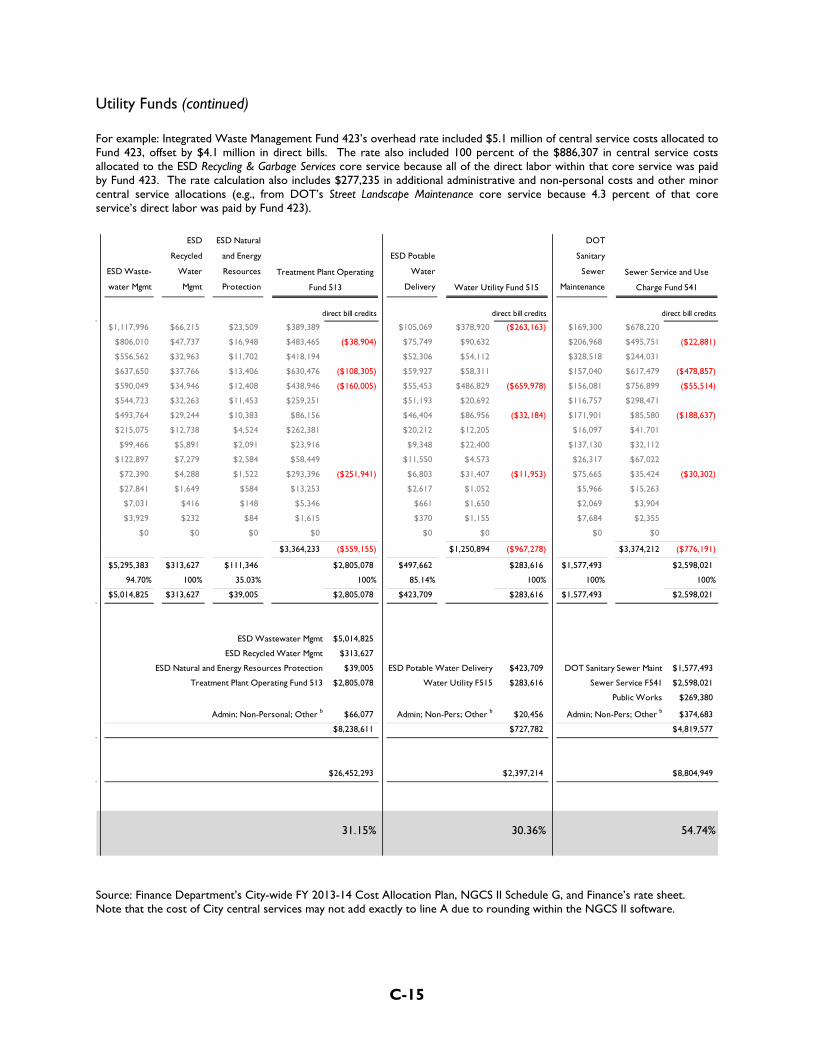
C-15
Utility Funds (continued) For example: Integrated Waste Management Fund 423’s overhead rate included $5.1 million of central service costs allocated to Fund 423, offset by $4.1 million in direct bills. The rate also included 100 percent of the $886,307 in central service costs allocated to the ESD Recycling & Garbage Services core service because all of the direct labor within that core service was paid by Fund 423. The rate calculation also includes $277,235 in additional administrative and non-personal costs and other minor central service allocations (e.g., from DOT’s Street Landscape Maintenance core service because 4.3 percent of that core service’s direct labor was paid by Fund 423).
Source: Finance Department’s City-wide FY 2013-14 Cost Allocation Plan, NGCS II Schedule G, and Finance’s rate sheet. Note that the cost of City central services may not add exactly to line A due to rounding within the NGCS II software.
ESD Waste-
water Mgmt
ESD
Recycled
Water
Mgmt
ESD Natural
and Energy
Resources
Protection
ESD Potable
Water
Delivery
DOT
Sanitary
Sewer
Maintenance
direct bill credits direct bill credits direct bill credits
$1,117,996 $66,215 $23,509 $389,389 $105,069 $378,920 ($263,163) $169,300 $678,220
$806,010 $47,737 $16,948 $483,465 ($38,904) $75,749 $90,632 $206,968 $495,751 ($22,881)
$556,562 $32,963 $11,702 $418,194 $52,306 $54,112 $328,518 $244,031
$637,650 $37,766 $13,406 $630,476 ($108,305) $59,927 $58,311 $157,040 $617,479 ($478,857)
$590,049 $34,946 $12,408 $438,946 ($160,005) $55,453 $486,829 ($659,978) $156,081 $756,899 ($55,514)
$544,723 $32,263 $11,453 $259,251 $51,193 $20,692 $116,757 $298,471
$493,764 $29,244 $10,383 $86,156 $46,404 $86,956 ($32,184) $171,901 $85,580 ($188,637)
$215,075 $12,738 $4,524 $262,381 $20,212 $12,205 $16,097 $41,701
$99,466 $5,891 $2,091 $23,916 $9,348 $22,400 $137,130 $32,112
$122,897 $7,279 $2,584 $58,449 $11,550 $4,573 $26,317 $67,022
$72,390 $4,288 $1,522 $293,396 ($251,941) $6,803 $31,407 ($11,953) $75,665 $35,424 ($30,302)
$27,841 $1,649 $584 $13,253 $2,617 $1,052 $5,966 $15,263
$7,031 $416 $148 $5,346 $661 $1,650 $2,069 $3,904
$3,929 $232 $84 $1,615 $370 $1,155 $7,684 $2,355
$0 $0 $0 $0 $0 $0 $0 $0
$3,364,233 ($559,155) $1,250,894 ($967,278) $3,374,212 ($776,191)
$5,295,383 $313,627 $111,346 $2,805,078 $497,662 $283,616 $1,577,493 $2,598,021
94.70% 100% 35.03% 100% 100% 85.14% 100% 100% 100% 100% 100%
$5,014,825 $313,627 $39,005 $2,805,078 $423,709 $283,616 $1,577,493 $2,598,021
ESD Wastewater Mgmt $5,014,825
ESD Recycled Water Mgmt $313,627
ESD Natural and Energy Resources Protection $39,005 ESD Potable Water Delivery $423,709 DOT Sanitary Sewer Maint $1,577,493
Treatment Plant Operating Fund 513 $2,805,078 Water Utility F515 $283,616 Sewer Service F541 $2,598,021
Public Works $269,380
Admin; Non-Personal; Other b $66,077 Admin; Non-Pers; Other b $20,456 Admin; Non-Pers; Other b $374,683
$8,238,611 $727,782 $4,819,577
$26,452,293 $2,397,214 $8,804,949
31.15% 30.36% 54.74%
Sewer Service and Use
Charge Fund 541Water Utility Fund 515
Treatment Plant Operating
Fund 513
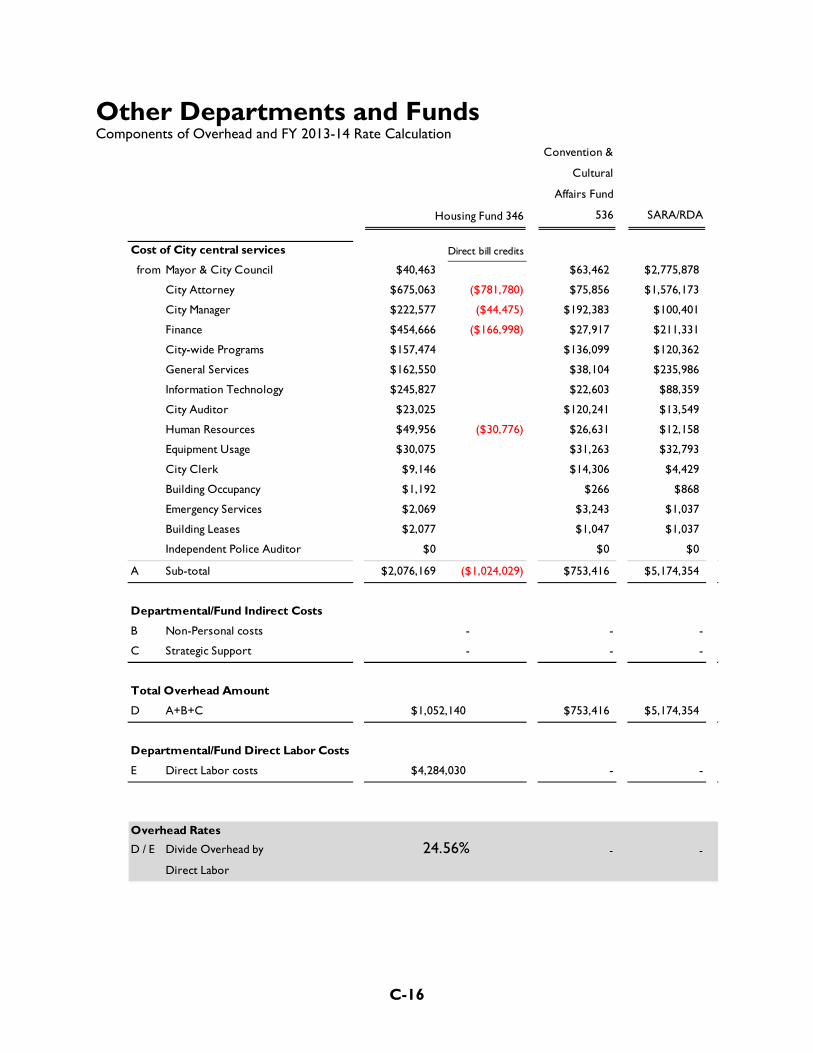
C-16
Other Departments and Funds Components of Overhead and FY 2013-14 Rate Calculation
Housing Fund 346
Convention &
Cultural
Affairs Fund
536 SARA/RDA
Cost of City central services Direct bill credits
from Mayor & City Council $40,463 $63,462 $2,775,878
City Attorney $675,063 ($781,780) $75,856 $1,576,173
City Manager $222,577 ($44,475) $192,383 $100,401
Finance $454,666 ($166,998) $27,917 $211,331
City-wide Programs $157,474 $136,099 $120,362
General Services $162,550 $38,104 $235,986
Information Technology $245,827 $22,603 $88,359
City Auditor $23,025 $120,241 $13,549
Human Resources $49,956 ($30,776) $26,631 $12,158
Equipment Usage $30,075 $31,263 $32,793
City Clerk $9,146 $14,306 $4,429
Building Occupancy $1,192 $266 $868
Emergency Services $2,069 $3,243 $1,037
Building Leases $2,077 $1,047 $1,037
Independent Police Auditor $0 $0 $0
A Sub-total $2,076,169 ($1,024,029) $753,416 $5,174,354
Departmental/Fund Indirect Costs
B Non-Personal costs - -
C Strategic Support - -
Total Overhead Amount
D A+B+C $753,416 $5,174,354
Departmental/Fund Direct Labor Costs
E Direct Labor costs - -
Overhead Rates
D / E Divide Overhead by - -
Direct Labor
-
-
$1,052,140
$4,284,030
24.56%

C-17
Other Departments and Funds (continued)
Source: Finance Department’s City-wide FY 2013-14 Cost Allocation Plan, NGCS II Schedule G, and Finance’s rate sheet. Note that the cost of City central services may not add exactly to line A due to rounding within the NGCS II software.
Retirement Stores Fund
Vehicle Maint.
& Op. Fund
552 Benefit Funds
Cost of City central services
$19,565 $104 $32,911 $62,151 Mayor & City Council
$7,238 $1,164 $17,546 $8,800 City Attorney
$100,927 $22,049 $79,966 $138,047 City Manager
$38,484 $140 $103,169 $20,996 Finance
$17,679 $2,350 $89,966 $23,876 City-wide Programs
$7,248 $585 $80,483 $6,431 General Services
$76,118 $1,058 $56,473 $11,381 Information Technology
$7,107 $1,151 $6,015 $8,172 City Auditor
$23,602 $598 $58,414 $3,037 Human Resources
$5,694 $176 $12,174 $1,844 Equipment Usage
$4,412 $21 $7,409 $13,988 City Clerk
$173 $14,359 $23,565 $178 Building Occupancy
$999 $5 $1,688 $3,177 Emergency Services
$767 $89 $1,044 $573 Building Leases
$0 $0 $0 $0 Independent Police Auditor
$310,008 $43,848 $570,805 $302,653 Sub-total
- - - -
- - - -
$310,008 $43,848 $570,805 $302,653
$3,012,823 - $4,147,323 $529,643
10.29% - 13.76% 57.14%
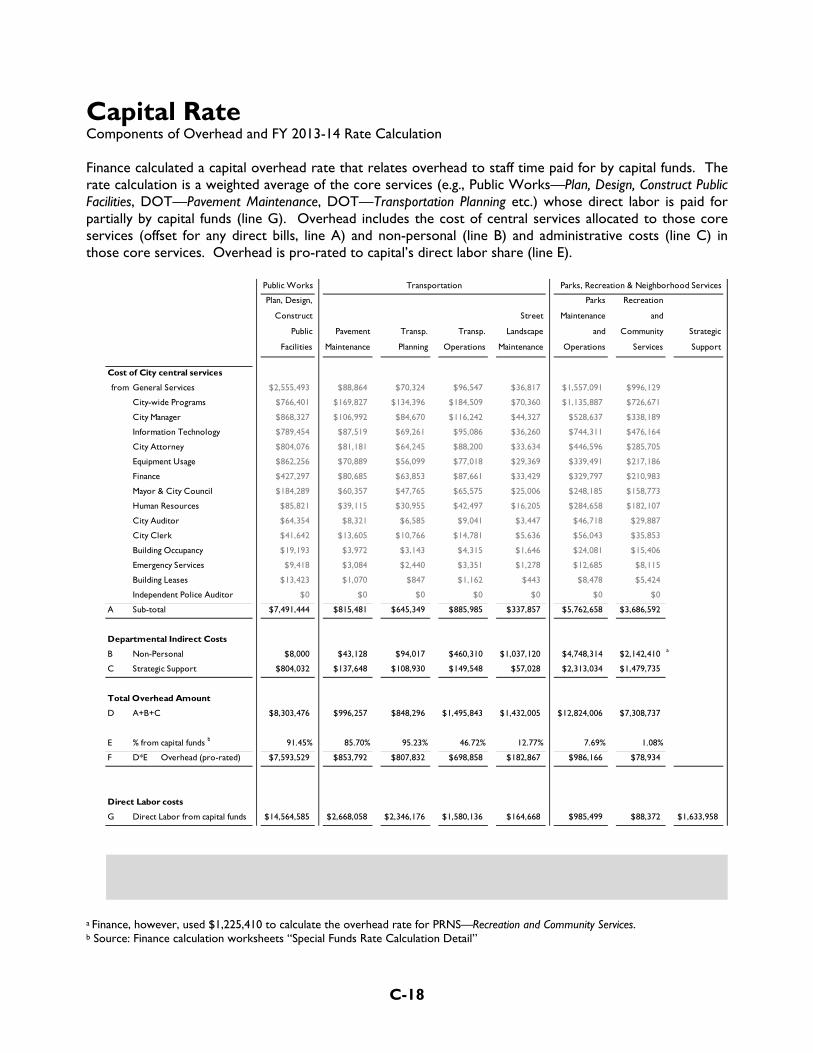
C-18
Capital Rate Components of Overhead and FY 2013-14 Rate Calculation Finance calculated a capital overhead rate that relates overhead to staff time paid for by capital funds. The rate calculation is a weighted average of the core services (e.g., Public Works—Plan, Design, Construct Public Facilities, DOT—Pavement Maintenance, DOT—Transportation Planning etc.) whose direct labor is paid for partially by capital funds (line G). Overhead includes the cost of central services allocated to those core services (offset for any direct bills, line A) and non-personal (line B) and administrative costs (line C) in those core services. Overhead is pro-rated to capital’s direct labor share (line E).
a Finance, however, used $1,225,410 to calculate the overhead rate for PRNS—Recreation and Community Services. b Source: Finance calculation worksheets “Special Funds Rate Calculation Detail”
Public Works Transportation Parks, Recreation & Neighborhood Services
Plan, Design,
Construct
Public
Facilities
Pavement
Maintenance
Transp.
Planning
Transp.
Operations
Street
Landscape
Maintenance
Parks
Maintenance
and
Operations
Recreation
and
Community
Services
Strategic
Support
Cost of City central services
from General Services $2,555,493 $88,864 $70,324 $96,547 $36,817 $1,557,091 $996,129
City-wide Programs $766,401 $169,827 $134,396 $184,509 $70,360 $1,135,887 $726,671
City Manager $868,327 $106,992 $84,670 $116,242 $44,327 $528,637 $338,189
Information Technology $789,454 $87,519 $69,261 $95,086 $36,260 $744,311 $476,164
City Attorney $804,076 $81,181 $64,245 $88,200 $33,634 $446,596 $285,705
Equipment Usage $862,256 $70,889 $56,099 $77,018 $29,369 $339,491 $217,186
Finance $427,297 $80,685 $63,853 $87,661 $33,429 $329,797 $210,983
Mayor & City Council $184,289 $60,357 $47,765 $65,575 $25,006 $248,185 $158,773
Human Resources $85,821 $39,115 $30,955 $42,497 $16,205 $284,658 $182,107
City Auditor $64,354 $8,321 $6,585 $9,041 $3,447 $46,718 $29,887
City Clerk $41,642 $13,605 $10,766 $14,781 $5,636 $56,043 $35,853
Building Occupancy $19,193 $3,972 $3,143 $4,315 $1,646 $24,081 $15,406
Emergency Services $9,418 $3,084 $2,440 $3,351 $1,278 $12,685 $8,115
Building Leases $13,423 $1,070 $847 $1,162 $443 $8,478 $5,424
Independent Police Auditor $0 $0 $0 $0 $0 $0 $0
A Sub-total $7,491,444 $815,481 $645,349 $885,985 $337,857 $5,762,658 $3,686,592
Departmental Indirect Costs
B Non-Personal $8,000 $43,128 $94,017 $460,310 $1,037,120 $4,748,314 $2,142,410 a
C Strategic Support $804,032 $137,648 $108,930 $149,548 $57,028 $2,313,034 $1,479,735
Total Overhead Amount
D A+B+C $8,303,476 $996,257 $848,296 $1,495,843 $1,432,005 $12,824,006 $7,308,737
E % from capital funds b 91.45% 85.70% 95.23% 46.72% 12.77% 7.69% 1.08%
F D*E Overhead (pro-rated) $7,593,529 $853,792 $807,832 $698,858 $182,867 $986,166 $78,934
Direct Labor costs
G Direct Labor from capital funds $14,564,585 $2,668,058 $2,346,176 $1,580,136 $164,668 $985,499 $88,372 $1,633,958
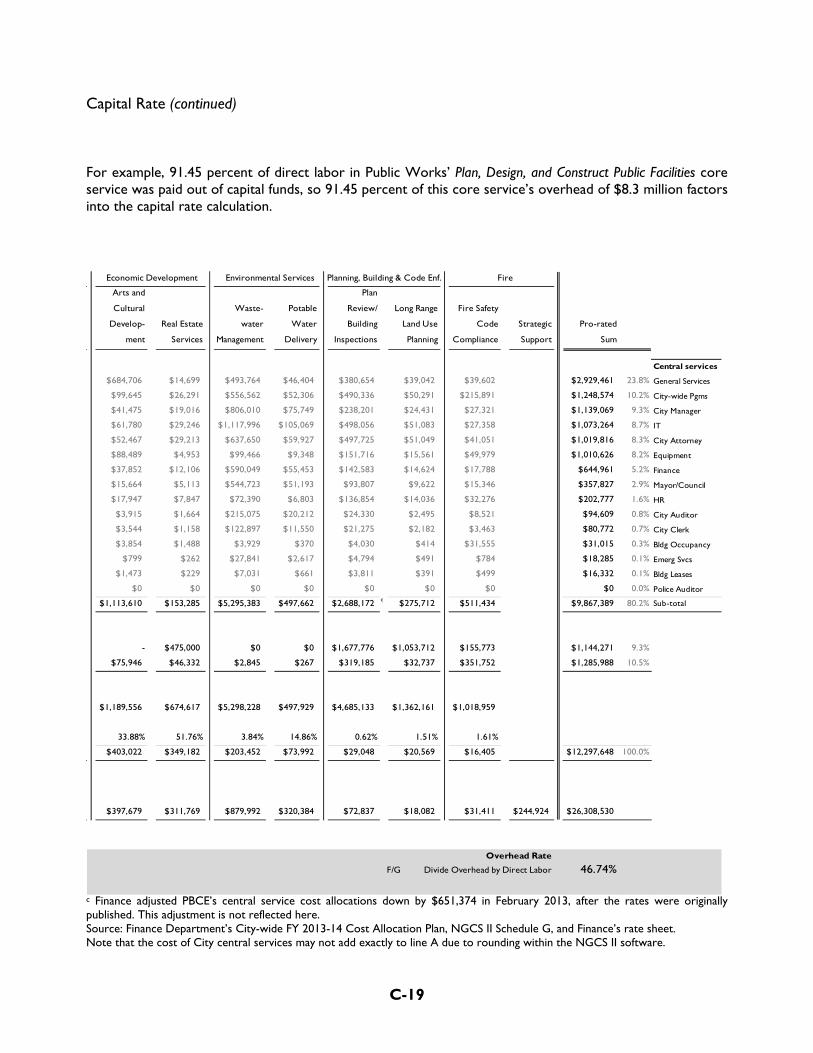
C-19
Capital Rate (continued) For example, 91.45 percent of direct labor in Public Works’ Plan, Design, and Construct Public Facilities core service was paid out of capital funds, so 91.45 percent of this core service’s overhead of $8.3 million factors into the capital rate calculation.
c Finance adjusted PBCE’s central service cost allocations down by $651,374 in February 2013, after the rates were originally published. This adjustment is not reflected here. Source: Finance Department’s City-wide FY 2013-14 Cost Allocation Plan, NGCS II Schedule G, and Finance’s rate sheet. Note that the cost of City central services may not add exactly to line A due to rounding within the NGCS II software.
Economic Development Environmental Services Planning, Building & Code Enf. Fire
Arts and
Cultural
Develop-
ment
Real Estate
Services
Waste-
water
Management
Potable
Water
Delivery
Plan
Review/
Building
Inspections
Long Range
Land Use
Planning
Fire Safety
Code
Compliance
Strategic
Support
Pro-rated
Sum
Central services
$684,706 $14,699 $493,764 $46,404 $380,654 $39,042 $39,602 $2,929,461 23.8% General Services
$99,645 $26,291 $556,562 $52,306 $490,336 $50,291 $215,891 $1,248,574 10.2% City-wide Pgms
$41,475 $19,016 $806,010 $75,749 $238,201 $24,431 $27,321 $1,139,069 9.3% City Manager
$61,780 $29,246 $1,117,996 $105,069 $498,056 $51,083 $27,358 $1,073,264 8.7% IT
$52,467 $29,213 $637,650 $59,927 $497,725 $51,049 $41,051 $1,019,816 8.3% City Attorney
$88,489 $4,953 $99,466 $9,348 $151,716 $15,561 $49,979 $1,010,626 8.2% Equipment
$37,852 $12,106 $590,049 $55,453 $142,583 $14,624 $17,788 $644,961 5.2% Finance
$15,664 $5,113 $544,723 $51,193 $93,807 $9,622 $15,346 $357,827 2.9% Mayor/Council
$17,947 $7,847 $72,390 $6,803 $136,854 $14,036 $32,276 $202,777 1.6% HR
$3,915 $1,664 $215,075 $20,212 $24,330 $2,495 $8,521 $94,609 0.8% City Auditor
$3,544 $1,158 $122,897 $11,550 $21,275 $2,182 $3,463 $80,772 0.7% City Clerk
$3,854 $1,488 $3,929 $370 $4,030 $414 $31,555 $31,015 0.3% Bldg Occupancy
$799 $262 $27,841 $2,617 $4,794 $491 $784 $18,285 0.1% Emerg Svcs
$1,473 $229 $7,031 $661 $3,811 $391 $499 $16,332 0.1% Bldg Leases
$0 $0 $0 $0 $0 $0 $0 $0 0.0% Police Auditor
$1,113,610 $153,285 $5,295,383 $497,662 $2,688,172 c $275,712 $511,434 $9,867,389 80.2% Sub-total
- $475,000 $0 $0 $1,677,776 $1,053,712 $155,773 $1,144,271 9.3%
$75,946 $46,332 $2,845 $267 $319,185 $32,737 $351,752 $1,285,988 10.5%
$1,189,556 $674,617 $5,298,228 $497,929 $4,685,133 $1,362,161 $1,018,959
33.88% 51.76% 3.84% 14.86% 0.62% 1.51% 1.61%
$403,022 $349,182 $203,452 $73,992 $29,048 $20,569 $16,405 $12,297,648 100.0%
$397,679 $311,769 $879,992 $320,384 $72,837 $18,082 $31,411 $244,924 $26,308,530
Overhead Rate
F/G Divide Overhead by Direct Labor 46.74%

C-20
This page was intentionally left blank

D-1
APPENDIX D

D-2
Appendix D Comparison of Central Service Allocations Among Departments
This table compares the results of the central service allocations for FY 2013-14. For example, 17.2 percent of General Services’ allocated costs of $14.3 million were allocated to the Police Department (also see Appendix C). A special fund with a significant amount of direct bills may have a lower-than-expected overhead allocation; however, it is also charged separately for its central service support activities. Percentages on each row do not add to 100% because (1) allocations to the Airport are not shown here, (2) some allocations to DOT are also shown under Utility Funds, and (3) allocations to capital are derived from allocations already shown under Public Works and other departments.
a Public Works, as shown here, excludes the Facilities Management and Fleet and Equipment Services core services which are treated as General Services. b The Department of Transportation, as shown here, includes Parking Fund and Maintenance Assessment Districts. It also includes Sanitary Sewer Maintenance and Storm Sewer Management, which are also shown under Utility Funds.
(Footnotes continued on next page)
% of allocated City central service costs to line departments and funds
Police Fire PRNS
Public
Works a DOT b SARA PBCE c Library OED
Housing
F346
C&C A
F536 d Other eUtility
Funds f Capital g
Allocated City central service costs
from City-wide Programs h $32,312,393 45.3% 27.4% 5.8% 3.1% 4.5% 0.4% 2.3% 1.7% 1.0% 0.5% 0.4% 0.4% 6.6% 3.9%
General Services $14,320,542 17.2% 11.3% 17.8% 19.6% 4.8% 1.6% 4.9% 5.0% 5.7% 1.1% 0.3% 0.7% 7.9% 20.5%
City Attorney $12,291,452 27.3% 13.7% 6.0% 8.4% 5.6% 12.8% 6.2% 0.6% 3.7% -0.9% i 0.6% 0.3% 15.7% 8.3%
Information Technology $11,808,209 17.4% 9.5% 10.3% 8.7% 6.4% 0.7% 6.4% 2.8% 2.6% 2.1% 0.2% 1.2% 29.3% 9.1%
City Manager $10,619,137 17.4% 10.5% 8.2% 9.5% 9.4% 0.9% 3.4% 2.7% 2.4% 1.7% 1.8% 3.2% 25.2% 10.7%
Mayor & City Council $8,211,594 14.2% 7.7% 5.0% 3.0% 6.8% 33.8% 1.8% 1.8% 0.7% 0.5% 0.8% 1.4% 19.1% 4.4%
Finance $7,559,568 15.3% 9.6% 7.2% 9.2% 9.2% 2.8% 2.9% 3.4% 1.8% 3.8% 0.4% 2.2% 23.8% 8.5%
Equipment Usage $6,753,757 19.1% 30.3% 8.2% 15.2% 8.8% 0.5% 3.6% 5.1% 1.9% 0.4% 0.5% 0.3% 7.5% 15.0%
Human Resources $5,258,303 38.9% 25.2% 8.9% 2.8% 6.5% 0.2% 4.0% 3.0% 1.6% 0.4% 0.5% 1.6% 4.5% 3.9%
Building Occupancy $4,281,644 52.1% 30.2% 0.9% 0.5% 1.2% 0.0% 0.1% 11.6% 0.4% 0.0% 0.0% 0.9% 0.6% 0.7%
City Auditor $2,015,073 16.5% 17.3% 3.8% 3.9% 3.8% 0.7% 1.8% 1.2% 1.0% 1.1% 6.0% 1.1% 35.3% 4.7%
Building Leases $1,795,994 93.3% 1.1% 0.8% 0.9% 0.5% 0.1% 0.3% 0.3% 0.2% 0.1% 0.1% 0.1% 1.9% 0.9%
City Clerk $1,229,912 21.3% 11.5% 7.5% 4.6% 10.3% 0.4% 2.7% 2.7% 1.1% 0.7% 1.2% 2.1% 28.7% 6.6%
Independent Police Auditor $1,065,761 100.0% 0.0% 0.0% 0.0% 0.0% 0.0% 0.0% 0.0% 0.0% 0.0% 0.0% 0.0% 0.0% 0.0%
Emergency Services $278,860 21.3% 11.5% 7.5% 4.6% 10.3% 0.4% 2.6% 2.7% 1.1% 0.7% 1.2% 2.1% 28.8% 6.6%
Total (line A) $119,802,199 29.7% 17.5% 7.9% 7.7% 5.9% 4.3% 3.0% 2.9% 2.2% 0.9% 0.6% 1.0% 14.3% 8.2%

D-3
Continued from previous page: c Finance credited Planning, Building & Code Enforcement $651,374 in February 2013, after the initial rates had been calculated. This credit is included in the total line, but not above the total line. d See the Background for more information on overhead to the Convention and Cultural Affairs Fund 536. The City’s Convention and Cultural Facilities are operated by Team San Jose. e “Other” includes: Stores Fund, Vehicle Maintenance and Operations Fund 522, Benefit Funds, and Retirement. f Utility Funds include: Integrated Waste Management Fund 423, Storm Sewer Operating Fund 446, Treatment Plant Operating Fund 513, Water Utility Fund 515, Sewer Service and Use Charge Fund 541, and their associated Environmental Services Department and DOT core services. Utility Funds received additional, small allocations that are not shown here; for details, see Appendix C. g Allocations to the capital overhead rate are derived from allocations already shown under some other department, mainly Public Works. For details, see Appendix C. h City-wide Programs costs are mainly workers’ compensation costs. They also include: Sick Leave Payouts, Property Tax Admin Fee, etc. i The amount from City Attorney to Housing Fund 346 was negative because a direct bill credit exceeded the cost allocation within the plan. This table does not show overhead rates. Source: Auditor analysis of the Finance Department’s City-wide FY 2013-14 Cost Allocation Plan, NGCS II Schedule G, and Finance’s Special Funds Rate spreadsheet.

D-4
This page was intentionally left blank

E-1
APPENDIX E

E-2
Appendix E Applying Overhead to Fees and Special Funds, Examples
The City’s fees and charges include both the direct cost of providing a service as well as indirect costs, such as departmental administrative costs, departmental non-personal costs, central service costs, and others. This Appendix illustrates these components on three example fees, including a breakdown of overhead costs included in the fee. As another example, one utility fund’s overhead costs are broken out among its expenditures.

A TalOp
a
b
S F
Appendix E1 – The Police Deparand retirement ceaves associated Overhead ($93) personal costs (p
a The permit is valid fb City-wide Programs
Source: Auditor ana
Figures may not sum
Police Departm
rtment estimatedcontributions (lig with the 3.65 hoincludes both think: $34+$18).
for two years. s costs are mainly wo
lysis of Police fee cal
exactly due to roun
ment’s Taxicab
d the 3.65 staff hoht orange: $140)ours of direct labe indirect costs
orkers’ compensatio
culation, Finance De
ding.
b Driver’s Perm
ours for processi), as well as paidbor. The 56.19 pfrom central ser
n costs. They also in
partment’s City-wide
E-3
mit Fee
ing one taxi permd absence costs percent overheadrvices (blue: $41)
nclude: Sick Leave Pa
e FY 2013-14 Cost A
mit (orange: $165(light orange: $3
d rate applies to d) as well as the P
ayouts, Property Tax
Allocation Plan (NGC
5). Included in th31) – the costs odirect labor (i.e., Police Departme
x Admin Fee, etc.
CS II Schedule G), Fin
he fee are also friof vacation, sick, salaries, orange:
ent’s administrativ
nance’s rate sheet.
inge benefits and holiday : $165) only. ve and non-

E-4
Appendix E2 – Planning, Building & Code Enforcement’s (PBCE) Residential Occupancy Permit Fee Planning, Building & Code Enforcement’s (PBCE) permit fee for multiple housing (e.g. apartment houses) includes staff time costs from both PBCE and the Fire Department. The fee calculation begins with the staff cost of the entire program (orange: $16.62+$3.88). The fee also includes fringe benefit and retirement costs (light orange: $14.90) and PBCE’s non-personal costs (pink: $1.87). Because PBCE’s non-personal costs are already included in the fee calculation (pink: $1.87), the overhead ($6.54) excludes those non-personal costs.
PBCE Staff Time: 20 FTE, $16.62
Fire Staff Time: 3 FTE, $3.88
Fringe benefits + Retirement, $14.90
PBCE Non-Personal, $1.87
PBCE admin, $0.45
Fire admin, $0.70
City-wide Programs b, $1.15
General Services, $1.05
City Attorney,
$0.79
IT, $0.77 Equip, $0.37
CMO, $0.40
HR, $0.26
FIN, $0.25
Mayor/Council, $0.17Bldg Occ,
$0.07
Overhead, $6.54
Permit Fee: $43.81 a of whichOverhead: $6.54
(using a 29.00% rate without non-personal costs)
Permit Fee: $43.81 a of whichOverhead: $6.54
(using a 29.00% rate without non-personal costs)
a The permit fee is per unit and the fee calculation assumed costs would be split among 86,736 units. b City-wide Programs costs are mainly workers’ compensation costs. They also include: Sick Leave Payouts, Property Tax Admin Fee, etc. Source: Auditor analysis of PBCE fee calculation, Finance Department’s City-wide FY 2013-14 Cost Allocation Plan (NGCS II Schedule G), Finance’s rate sheet. Figures may not sum exactly due to rounding.

A Priii
** S F
Appendix E3 – PBCE’s fee for rereview program ndirect staff timencludes additionancluded separate
* The fee calculation ** City-wide Program
Source: Auditor ana
Figures may not sum
Planning, Build
eviewing developmand divided the te ($34.61), and aal PBCE administely ($11.64).
assumed costs woulms costs are mainly w
lysis of PBCE FY 201
exactly due to roun
ding & Code En
ment plans is chatotal by its billabadministrative cotrative costs (from
d be split among 19,workers’ compensatio
0-11 fee calculation,
ding.
nforcement’s P
arged on an hourble hours. The tosts ($36.93). Thm General Fund
542 billable hours. Fon costs. They also
Finance Department
E-5
Plan Review Fee
ly basis. To achieotal program cos
hose costs alread staff, $2.86). Cit
Fringe benefits and reinclude: Sick Leave P
t’s City-wide FY 201
e
eve full cost recosts included direy include fringe ty Hall debt serv
etirement are includePayouts, Property Tax
3-14 Cost Allocation
overy, PBCE estimect (“billable”) stabenefits and reti
vice is not part of
ed. ax Admin Fee, etc.
n Plan (NGCS II Sche
mated the full coaff time ($102.07rement. Overhef the overhead ra
edule G), Finance’s ra
st of its plan 7), as well as ead ($24.69) ate and thus
ate sheet.

A TaaT
*SS F
Appendix E4 – The Integrated Walso paid directlyand Finance (“dirThis reimbursem
* City-wide ProgramSource: Auditor anaSchedule G), Finance
Figures may not sum
Integrated Wa
Waste Manageme for staff in the E
rect bills”). The ent covers the ov
s costs are mainly woalysis of Fund 423’s A’s rate sheet.
exactly due to roun
aste Manageme
ent Fund 423 maiEnvironmental Sefund paid overheverhead cost of c
orkers’ compensatioAdopted FY 2013-14
ding.
ent Fund 423’s
inly pays for garbervices Departmeead of $2.1 milliocentral services fo
n costs. They also in4 Budget Source and
E-6
Expenditures
bage pick-up and ent (ESD, light oron to the Generaor Fund 423’s dir
nclude: Sick Leave Pad Use Statement, Fin
recycling servicerange) and in othal Fund, using a 3rect labor.
ayouts, Property Taxnance Department’s
es for San José rher departments, 30.53 percent rat
x Admin Fee, etc. City-wide FY 2013-
residents (orange like Information te on direct labor
-14 Cost Allocation
e). The fund Technology r costs only.
Plan (NGCS II

F-1
APPENDIX F

F-2
Appendix F
Five-Year Trend of Overhead Rates Finance calculates two different overhead rates: one with departmental non-personal costs, and one without. Overhead rates for all
departments’ core services have fluctuated for the last five years. Rates may vary as a result of changes to central services and their workload,
changes to the department’s administrative and non-personal costs, and changes to the department’s direct labor costs.
(continued on next page)
Rates with Department's Non-Personal costs Rates without Department's Non-Personal costs
Department
Core Service 09-10 10-11 11-12 12-13 2013-14 5-year change 09-10 10-11 11-12 12-13 2013-14 5-year change
Parks, Recreation & Neighborhood Services
Parks Maintenance and Operations 75.91% 71.10% 69.10% 93.45% 100.03% 24.12% 51.85% 46.77% 48.71% 59.32% 62.99% 11.14%
Recreation and Community Services 87.37% 70.60% 70.85% 72.80% 77.93% -9.44% 51.85% 46.77% 48.71% 59.32% 62.99% 11.14%
Community Strengthening Services 81.13% 81.86% 54.53% 51.85% 46.77% 48.71%
Economic Development
Arts and Cultural Development 91.59% 105.85% 107.11% 115.03% 120.47% 28.88% 75.70% 88.54% 85.39% 102.76% 120.47% 44.77%
Real Estate Services 111.99% 33.14%
Business Development and Econ. Strategy 40.88% 35.70% 35.74% 44.83% 51.15% 10.27% 26.54% 21.25% 19.89% 30.93% 33.14% 6.60%
Regional Workforce Development 33.52% 31.63% 31.63% 42.08% 41.56% 8.04% 33.52% 31.63% 31.63% 42.08% 41.56% 8.04%
Outdoor Special Events 38.89% 33.38% 34.39% 136.08% 26.55% 21.25% 19.89% 30.93%
Library
Access to Information, Library Materials 54.63% 49.10% 61.29% 65.13% 64.47% 9.84% 36.18% 31.60% 38.44% 42.36% 43.11% 6.93%
Formal and Lifelong Self-Directed Educ. 37.07% 40.21% 42.35% 53.86% 58.30% 21.23% 33.43% 31.52% 38.34% 42.36% 43.11% 9.68%
Police
Investigative Services 51.65% 52.61% 56.91% 63.79% 60.37% 8.72% 46.38% 41.82% 45.74% 50.94% 45.27% -1.11%
Special Events Services 53.40% 50.50% 55.71% 62.23% 57.05% 3.65% 46.38% 41.82% 45.74% 50.94% 45.27% -1.11%
Regulatory Services 57.40% 52.51% 57.19% 61.49% 56.19% -1.21% 46.38% 41.82% 45.74% 50.94% 45.27% -1.11%
Respond to Calls for Service 53.42% 47.77% 51.22% 57.33% 51.90% -1.52% 46.38% 41.82% 45.74% 50.94% 45.27% -1.11%
Traffic Safety Services 50.29% 47.26% 51.70% 57.30% 51.37% 1.08% 46.38% 41.82% 45.74% 50.94% 45.27% -1.11%
Crime Prevention and Comm. Education 53.49% 48.60% 52.18% 57.54% 50.93% -2.56% 46.38% 41.82% 45.74% 50.94% 45.27% -1.11%
Transportation
Traffic Maintenance 96.49% 94.91% 95.63% 106.40% 117.37% 20.88% 24.23% 28.18% 26.32% 31.98% 30.62% 6.39%
Street Landscape Maintenance 74.79% 95.88% 98.38% 117.58% 111.03% 36.24% 24.23% 28.18% 26.32% 31.98% 30.62% 6.39%
Parking Services 85.36% 69.23% 63.17% 77.36% 69.65% -15.71% 24.23% 28.18% 26.32% 31.98% 30.62% 6.39%
Transportation Operations 33.96% 37.76% 38.45% 46.02% 44.23% 10.27% 24.23% 28.18% 26.32% 31.98% 30.62% 6.39%
Storm Sewer Management 28.23% 31.94% 29.50% 36.13% 35.05% 6.82% 24.23% 28.18% 26.32% 31.98% 30.62% 6.39%
Transportation Planning and Project Deliv. 26.44% 30.81% 29.91% 36.29% 34.43% 7.99% 24.23% 28.18% 26.32% 31.98% 30.62% 6.39%
Pavement Maintenance 61.29% 64.64% 61.69% 33.14% 32.00% -29.29% 24.23% 28.18% 26.32% 31.98% 30.62% 6.39%
Sanitary Sewer Maintenance 24.23% 28.18% 26.32% 31.98% 30.62% 6.39% 24.23% 28.18% 26.32% 31.98% 30.62% 6.39%
Maintenance Assessment Districts 42.48% 46.95% 45.84% 51.60% 47.20% 4.72% 42.48% 46.95% 45.84% 51.60% 47.20% 4.72%
Parking Fund 36.05% 43.75% 48.13% 48.89% 42.05% 6.00% 36.05% 43.75% 48.13% 48.89% 42.05% 6.00%

F-3
Five-Year Trend of Overhead Rates (continued):
Source: Auditor analysis of Finance Department’s rate sheets. FY 2009-10 through FY 2012-13 are unaudited.
.
Department Rates with Department's Non-Personal costs Rates without Department's Non-Personal costs
Core Service 09-10 10-11 11-12 12-13 2013-14 5-year change 09-10 10-11 11-12 12-13 2013-14 5-year change
Fire
Fire Safety Code Compliance 37.45% 44.27% 45.87% 48.67% 52.39% 14.94% 32.00% 37.20% 40.63% 46.27% 44.38% 12.38%
Fire Prevention 38.60% 45.15% 47.49% 53.65% 50.95% 12.35% 32.00% 37.20% 40.63% 46.27% 44.38% 12.38%
Emergency Response 33.57% 38.75% 42.21% 48.12% 45.97% 12.40% 32.00% 37.20% 40.63% 46.27% 44.38% 12.38%
Public Works
Animal Care and Services 60.54% 60.03% 58.76% 59.30% 33.85% 29.69% 35.39% 34.50%
Plan, Design, Construct Public Facilities 39.20% 35.62% 36.80% 48.50% 52.14% 12.94% 38.39% 35.09% 36.06% 48.45% 52.09% 13.70%
Regulate/Facilitate Private Development 23.56% 18.34% 20.62% 24.78% 18.29% -5.27% 23.52% 18.30% 18.98% 24.21% 17.90% -5.62%
Planning, Building & Code Enforcement
Long Range Land Use Planning 39.36% 54.72% 57.88% 62.25% 113.68% 74.32% 26.16% 27.79% 32.54% 26.14% 25.74% -0.42%
Community Code Enforcement 36.28% 38.84% 43.35% 41.46% 40.12% 3.84% 31.14% 33.31% 37.86% 31.46% 29.00% -2.14%
Dev. Plan Review and Bldg. Constr. Insp. 25.72% 35.89% 38.83% 29.45% 34.53% 8.81% 17.73% 20.95% 23.58% 17.31% 20.17% 2.44%
Housing Fund 346 (replaced Fund 443) 20.04% 14.48% 16.28% 17.45% 24.56% 4.52% 20.04% 14.48% 16.28% 17.45% 24.56% 4.52%
Convention & Cultural Affairs Fund 536 23.68% 19.40% 54.71% 109.63% 23.68% 19.40% 54.71% 109.63%
(facilities are operated by Team San Jose)
Redevelopment Agency 147.26% 190.19% 127.94% 147.26% 190.19% 127.94%
Vehicle Maintenance & Operations Fund 552 15.22% 14.39% 16.75% 8.84% 13.76% -1.46% 15.22% 14.39% 16.75% 8.84% 13.76% -1.46%
Retirement 32.40% 14.96% 18.57% 19.52% 10.29% -22.11% 32.40% 14.96% 18.57% 19.52% 10.29% -22.11%
Benefit Funds 40.36% 39.42% 42.19% 71.28% 57.14% 16.78% 40.36% 39.42% 42.19% 71.28% 57.14% 16.78%
Stores Fund 13.50% 11.68% 14.48% 23.68% 13.50% 11.68% 14.48% 23.68%
Special Funds
Capital 34.33% 34.33% 40.83% 39.86% 46.74% 12.41%
Integrated Waste Management Fund 423 22.25% 21.60% 21.70% 27.71% 30.53% 8.28%
Storm Sewer Operating Fund 446 28.06% 31.50% 29.74% 33.86% 29.71% 1.65%
Treatment Plant Operating Fund 513 23.79% 24.71% 24.35% 25.63% 31.15% 7.36%
Water Utility Fund 515 28.41% 29.97% 35.33% 39.45% 30.36% 1.95%
Sewer Service & Use Charge Fund 541 49.85% 43.63% 41.24% 47.42% 54.74% 4.89%
Paid Absence Rates
Police 17.09% 17.41% 15.67% 19.09% 19.07% 1.98%
Fire 14.49% 13.71% 15.24% 16.72% 16.76% 2.27%
All Other Departments 18.68% 19.34% 19.02% 20.96% 21.37% 2.69%
Central Services
Information Technology 60.47% 70.29% 63.27% 97.49% 22.49% 24.62% 20.60% 38.61%
General Services 109.39% 94.54% 95.52% 65.91% 90.16% -19.23% 64.82% 56.99% 59.54% 47.70% 47.77% -17.05%
City Clerk 84.76% 61.01% 273.69% 50.86% 85.78% 1.02% 73.01% 46.35% 236.92% 37.80% 67.46% -5.55%
Finance 76.82% 47.12% 53.37% 40.57% 73.32% -3.50% 66.38% 36.97% 42.19% 31.27% 62.47% -3.91%
City Manager 42.85% 63.91% 33.03% 48.45%
City Attorney 41.77% 33.47% 36.27% 28.63% 42.25% 0.48% 31.38% 26.81% 28.71% 22.77% 31.48% 0.10%

F-4
This page was intentionally left blank

G-1
APPENDIX G Five-Year Trend of Overhead Components –
Example: Police Department For the last five years, the Police Department’s overhead allocations and rates have fluctuated. The rates may rise or fall due to many different factors: Some central service allocations increased (e.g., Building Occupancy, due to the new South San José substation), some decreased.a The Police Department’s administrative and non-personal costs also varied. Finally, the Police Department’s direct labor costs, the denominator of the overhead rate, decreased.
a The largest central service allocation to Police was from City-wide Programs and mainly included:
• Workers’ compensation costs ($8.1 million for FY 2013-14, an increase of $1.5 million to FY 2009-10) • Sick leave payouts upon retirement ($2.7 million for FY 2013-14, a decrease of $1.6 million to FY 2009-10) • Revenue collection costs ($1.7 million for FY 2013-14, an increase of $0.3 million to FY 2009-10) • General liability claims ($1.0 million for FY 2013-14, a decrease of $1.0 million to FY 2009-10)
b In FY 2009-10 and FY 2010-11, it appears Finance made adjustments to the cost allocations, not shown here. These adjustments, however, did not materially impact the overhead rates. Source: Finance Department’s City-wide Cost Allocation Plans, NGCS II Schedules G, and Finance’s rate sheets. FY 2009-10 through FY 2012-13 are unaudited. Note that the cost of City central services may not add exactly to line A due to rounding within the NGCS II software.
FY 09-10 10-11 11-12 12-13 2013-2014 5-year change
5-year %
changeCost of City central servicesfrom City-Wide Programs a $15,900,187 $17,884,993 $18,564,330 $17,656,085 $14,637,162 ($1,263,025) -7.94%
City Attorney $4,126,809 $4,744,570 $2,078,434 $3,481,552 $3,353,213 ($773,596) -18.75%General Services $3,583,538 $3,538,539 $3,392,689 $2,777,321 $2,462,968 ($1,120,570) -31.27%Building Occupancy $573,766 $543,159 $543,259 $2,233,958 $2,232,357 $1,658,591 289.07%Information Technology $1,696,102 $2,458,791 $2,185,740 $3,154,791 $2,054,246 $358,144 21.12%Human Resources $2,521,597 $2,867,390 $2,395,524 $2,039,968 $2,046,629 ($474,968) -18.84%City Manager $1,720,233 $1,985,646 $1,859,807 $1,732,098 $1,847,685 $127,452 7.41%Building Leases $1,835,353 $1,755,066 $1,755,106 $1,649,645 $1,676,329 ($159,024) -8.66%Equipment Usage $1,499,812 $1,650,655 $1,574,030 $1,493,357 $1,286,803 ($213,009) -14.20%Mayor & City Council $863,330 $1,021,209 $1,070,458 $1,075,038 $1,162,191 $298,861 34.62%Finance $1,251,626 $1,237,126 $1,234,801 $1,297,707 $1,156,869 ($94,757) -7.57%Independent Police Auditor $822,778 $800,785 $825,184 $963,329 $1,065,761 $242,983 29.53%City Auditor $180,184 $700,702 $384,541 $512,329 $331,942 $151,758 84.22%City Clerk $408,592 $377,663 $421,083 $293,824 $262,221 ($146,371) -35.82%Emergency Services $42,155 $27,492 $90,713 $110,990 $59,392 $17,237 40.89%
A Sub-total $37,026,062 b $41,593,786 b $38,375,699 $40,471,992 $35,635,768 ($1,390,294) -3.75%
Police's Indirect CostsB Non-Personal $10,498,664 $12,200,191 $10,714,174 $10,928,377 $12,071,636 $1,572,972 14.98%C Strategic Support $36,624,275 $31,147,203 $33,357,033 $30,441,710 $29,627,302 ($6,996,973) -19.10%
Total Overhead AmountD A+B+C $84,149,001 $84,941,180 $82,446,906 $81,842,079 $77,334,706 ($6,814,295) -8.10%
Police's Direct Labor CostsE $159,516,674 $173,294,925 $156,814,092 $139,197,313 $144,170,963 ($15,345,711) -9.62%
Overhead RatesD/E Weighted Average 52.75% 49.02% 52.58% 58.80% 53.64% 0.89%
Traffic Safety 50.29% 47.26% 51.70% 57.30% 51.37% 1.08%
Crime Prev/Comm. Educ. 53.49% 48.60% 52.18% 57.54% 50.93% -2.56%
Investigative Services 51.65% 52.61% 56.91% 63.79% 60.37% 8.72%
Regulatory Services 57.40% 52.51% 57.19% 61.49% 56.19% -1.21%
Respond to Calls for Service 53.42% 47.77% 51.22% 57.33% 51.90% -1.52%
Special Events Services 53.40% 50.50% 55.71% 62.23% 57.05% 3.65%

CITYOF~SAN]OSECAPITAL OF SILICON VALLEY
TO: Sharon W. EricksonCity Auditor
MemorandumFROM: Julia H. Cooper
SUBJECT: RESPONSE TO THE AUDIT DATE: November 12,2013"INDIRECT COST ALLOCATION:IMPROVED PROCEDURES ANDBETTER COMMUNICATIONSNEEDED"
"9 ----&Approved L 7~ Date
The Administration has reviewed the Audit "Indirect Cost Allocation: Improved Procedures andBetter Communication Needed" and is in general agreement with the recommendationsidentified in the report. The following are the Administration's response to eachrecommendation.
BACKGROUND
The Administration agrees with many of the recommendations contained in the "Indirect CostAllocation: Improved Procedures and Better Communication Needed" Audit (the "CostAllocation Audit"or "Audit") report prepared by the Internal Auditor ("Auditor").
The Cost Allocation Audit along with several other recently released audit reports from theAuditor illustrates how unprepared the organization was for the level of turnover, chronicvacancies, 'and loss of institutional knowledge (often times undocumented knowledge) that hasrecently been experienced. Long-tenured employees previously provided stability to theorganization especially during the significant downsizing of the organization in FY 2010-11. Inaddition to the staffing reductions and staff retention issues, the organization continues tostruggle with providing strategic support services on a centralized or decentralized basis.
The theme in the Administration's response to theCost Allocation Audit, coupled with theAdministration's responses in the "Regional Wastewater Facility Master Agreements: NewProcedure's and Better Contract Management Needed" and the "Consulting Agreements: BetterEnforcement ofProcurement Rules, Monitoring, and Transparency is Needed" is a need toreturn to basics. This return to basics will involve a careful examination of resources dedicatedto contract monitoring/administration along with the upfront and ongoing training provided tostaff to ensure the best contract management. These themes of sufficiently dedicated andeducated workforce are repeated again in other soon to be released audits. The Administrationacknowledges there is always room for improved management and oversight; however without

Sharon W. EricksonNovember 12, 2013Response to the Audit, "Indirect Cost Allocation: Improved Procedures and Better Communication Needed"Page 2
more adequate levels of staffing in key areas, coupled with targeted upfront and ongoingtraining, the ability to change current practices has been and will continue to be challenging.
RECOMMENDATIONS AND ADMINISTRATION'S RESPONSE
Overall Comments
As noted in the Cost Allocation Audit, the cost allocation program is currently staffed with onehalf (0.50) full-time equivalent position. The senior accountant assigned the responsibility ofpreparing the City's cost allocation plans is also assigned to the team that prepares the City'sComprehensive Annual Financial Report. The Finance Department has additionally beenchallenged with staff retention in the senior accountant classification. The Audit notes that since2007 at least nine different individuals have prepared or supervised the preparation of the CostAllocation-Plans ("Plan(s)"). Staffing changes are almost entirely related to staff turnover withinthe Finance Department as illustrated by the tenure of the seven (7) senior accountants in theAccounting Division: two (2) positions are currently vacant, four (4) incumbents have less thanone year of experience with the City, and one (1) incumbent has been in his position forapproximately six years and with the City for twelve years. The Finance Departmentacknowledges that better documentation of the cost allocation calculation process would havemade these transitions easier and calculations more transparent and consistent over time.
Given that-the preparation of the Cost Allocation Plans occurs once each fiscal year and isgenerally completed by mid to late January in order to incorporate the new rates into the budgetdevelopment process, it make take several fiscal years for all of the recommendations to beimplemented and incorporated in to the Cost Allocation Plans.
Recommendation #1: To ensure that central service costs are treated appropriately andconsistently, the Finance Department should update its procedures to more clearly definewhat costs should and should not be allocated within the Cost Allocation Plan. Specifically,the procedures should:
• Provide guidance on how to determine whether a central service department, a CityWide program, or an individual central service program provides services to the publicversus to another City department
• More clearly define what a "direct use building" is in determining allocated costs withinthe building occupancy cost pool
• Require that staff document decisions regarding whether costs should be deemedallocable or unallocable in accordance with the above
Administration Response: The Administration agrees with this recommendation and has beguntaking steps in updating and documenting procedures with the assistance of a temporaryemployee who is providing coverage during a leave of absence. It is the Finance Department'sgoal to retain the temporary staffing resources through the balance of the fiscal year to assist in

Sharon W. EricksonNovember 12,2013Response to the Audit, "Indirect Cost Allocation: Improved Procedures and Better Communication Needed"Page 3
preparing the Plans for FY 2014-2015 and begin the process of implementing many of therecommendations contained in the Cost Allocation Audit, most importantly thoserecommendations revolving around the need for more documentation, transparency andcommunication with departments.
Recommendation #2: To conform to the updated procedures (as outlined inRecommendation 1), in the FY 2014-15 Cost Allocation Plan the Finance Department shouldreview and revise its lists of:
• allocated and unallocated central service costs• City-Wide expenses• direct use buildings.
Administration Response: The Administration agrees with this recommendation and believessome of the items will be implemented with the development of the FY 2014-2015 Plans. TheFinance Department's ability to fully implement this recommendation in the development of theupcoming cost allocation plans may be constrained by the resources, workload and staffinglevels in other departments. We believe the analysis of direct building use will require morecoordination with other City departments and it is unlikely it will be completed for the FY 201415 Plans, however the Finance Department believes the elements of the Cost Allocation Plan forallocated/unallocated central service costs and city-wide expenses will be completed for the FY2014-15 plans.
Recommendation #3: Before the Cost Allocation Plan is developed, the FinanceDepartment should meet annually with central service departments, and the Budget Office, toreview the allocation bases of their programs to ensure costs are appropriately allocated andidentify any significant changes in departmental workloads. This review should include theallocation bases for Citywide Expenses. Any changes resulting from the above should bedocumen~ed and Finance Department's procedures should be updated accordingly.
Administration Response: The Administration agrees with this recommendation and has alreadytaken steps to commence implementation of the recommendation. As the Finance Departmentbegins the preparation work for the FY 2014-2015 Plans, meetings with key departments and theBudget Office have been scheduled. Additionally, the Finance Department has updated itsrequest for information memos to departments to include a description of the purpose and use ofthe information, adding a request for department organizational charts with position codes andrequestinginformation on organization changes during the last fiscal year. Finally, the FinanceDepartment will prepare written notes after meetings with departments to aid in thedocumentation process.

Sharon W. EricksonNovember 12,2013Response to the Audit, "Indirect Cost Allocation: Improved Procedures and Better Communication Needed"Page 4
Recommendation #4: As part of its review of the FY 2014-15 Cost Allocation Plan, theFinance Department should review and revise the allocation bases to better reflect workload.This revision should include the Mayor and City Council's allocation to the SuccessorAgency, the allocation of Public Works' facility management costs, the allocation of Financecosts for utility fund accounting, and any other bases that are identified.
Administration Response: The Administration agrees with this recommendation and the FinanceDepartment has taken steps to commence implementation for the FY 2014-2015 Cost AllocationPlans, however full implementation for FY 2014-2015 plan is will require additional time tocomplete the necessary analysis especially as it relates to utility fund accounting and PublicWorks facility management costs. This additional analysis is expected to be completed for thedevelopment of the FY 2015-16 plans.
Recommendation #5: To improve how it allocates overhead to capital projects, the FinanceDepartment should:
• Utilize a workload estimate or other appropriate alternative allocation methodology toaccount for City Manager, Mayor and City Council, and other central service costsrelated to capital programs
• Back out capital rebudgets from the calculation of the department budget size allocationbase
Administration Response: The Administration agrees with this recommendation howeverimplementation of this recommendation will require more detailed conversations anddocumentation with departments including Public Works, Parks, Recreation & NeighborhoodServices, Planning, Building & Code Enforcement, Environmental Services, and Transportation.The Finance Department expects implementation for the FY 2015-2016 Cost Allocation Plans.
Additionally within the context of the implementation of this recommendation the FinanceDepartment will continue the dialogue with departments on the appropriate allocationmethodology for outsourced services such as custodial services, graffiti abatement, securityservices and landscape maintenance to ensure central support services are appropriately allocatedto these services. During the development ofthe FY 2014-15 plans the Finance Department willsurvey departments who both provide management oversight of outsourced services and centralsupport departments on their work efforts related to outsourced services so staff can begin theanalysis on appropriate allocation methodologies with the goal of implementing a documentedallocation methodology for the FY 2015-16 plans. To the extent the Administration's workeffort in this area requires an independent review; assistance from the City Auditor may berequested.

Sharon W. EricksonNovember 12, 2013Response to the Audit, "Indirect Cost Allocation: Improved Procedures and Better Communication Needed"Page 5
Recommendation #6: To ensure that vehicle and equipment costs in the Equipment Usagecost pool are consistently and accurately allocated, the Finance Department should:
• Treat grant-funded vehicles and equipment as unallocated costs (similar to how grantfunded building assets are treated in the Building Occupancy cost pool)
• Treat vehicles and equipment purchased through departmental non-personal budgetsconsistent!y
• Review and standardize the vehicle and equipment fixed asset schedules in the CostAllocation Plan
• Remove any assets which are more than 15 years old and whose historical cost has beenrecaptured in past Cost Allocation Plans.
Administration Response: The Administration agrees with this recommendation and expectsthat the Finance Department will be able to partially implement for the FY 2014-2015 Plans.This recommendation included four specific elements related to vehicle and equipmentallocations. The Finance Department believes it will be able to complete the necessarycoordination with Public Works/Fleet Maintenance to treat grant funded vehicles and equipmentas unallocated costs and to ensure consistent treatment of vehicles and equipment purchased withnon-personal/equipment funds in the FY 2014-2015 Plans. The analysis of the fixed assetschedule to both standardize and remove vehicles and equipment older than 15 years or wherehistorical cost has been recaptured in past Plans will require more analysis and the expectation isthat this component of the recommendation based on sufficient resource allocation should beimplemented as part of the FY 2015-16 Plans.
Recommendation #7: To ensure that Building Occupancy costs are accurately andappropriately allocated, the Finance Department should remove any assets more than 50 yearsold and whose historical cost has been recaptured in past Cost Allocation Plans.
Administration Response: The Administration agrees with this recommendation and theFinance Department expects to implement with the development of the FY 2014-2015 Plans tothe extent there is sufficient time and resources to coordinate with the Public Works Departmentand other departments as necessary, if not the recommendation will be implemented for the FY2015-16 plans
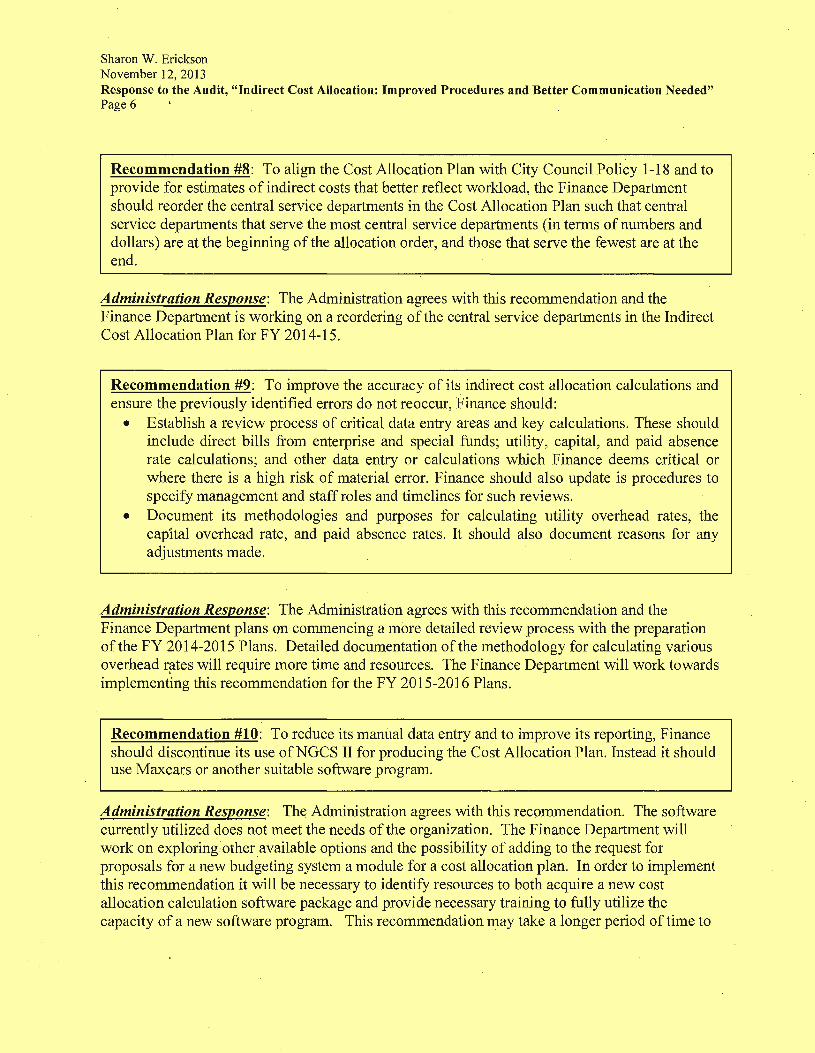
Sharon W. EricksonNovember 12, 2013Response to the Audit, "Indirect Cost Allocation: Improved Procedures and Better Communication Needed"Page 6
Recommendation #8: To align the Cost Allocation Plan with City Council Policy 1-18 and toprovide for estimates of indirect costs that better reflect workload, the Finance Departmentshould reorder the central service departments in the Cost Allocation Plan such that centralservice departments that serve the most central service departments (in terms of numbers anddollars) are at the beginning of the allocation order, and those that serve the fewest are at theend.
Administration Response: The Administration agrees with this recommendation and theFinance Department is working on a reordering of the central service departments in the IndirectCost Allocation Plan for FY 2014-15.
Recommendation #9: To improve the accuracy of its indirect cost allocation calculations andensure the previously identified errors do not reoccur, Finance should:
• Establish a review process of critical data entry areas and key calculations. These shouldinclude direct bills from enterprise and special funds; utility, capital, and paid absencerate calculations; and other data entry or calculations which Finance deems critical orwhere there is a high risk of material error. Finance should also update is procedures tospecify management and staff roles and timelines for such reviews.
• Document its methodologies and purposes for calculating utility overhead rates, thecapital overhead rate, and paid absence rates. It should also document reasons for anyadjustments made.
Administration Response: The Administration agrees with this recommendation and theFinance Department plans on commencing a more detailed review process with the preparationofthe FY 2014-2015 Plans. Detailed documentation of the methodology for calculating variousoverhead rates will require more time and resources. The Finance Department will work towardsimplementing this recommendation for the FY 2015-2016 Plans.
Recommendation #10: To reduce its manual data entry and to improve its reporting, Financeshould discontinue its use ofNGCS II for producing the Cost Allocation Plan. Instead it shoulduse Maxcars or another suitable software program.
Administration Response: The Administration agrees with this recommendation. The softwarecurrently utilized does not meet the needs of the organization. The Finance Department willwork on exploring other available options and the possibility of adding to the request forproposals for a new budgeting system a module for a cost allocation plan. In order to implementthis recommendation it will be necessary to identify resources to both acquire a new costallocation calculation software package and provide necessary training to fully utilize thecapacity of a new software program. This recommendation may take a longer period of time to

Sharon W. EricksonNovember 12, 2013Response to the Audit, "Indirect Cost Allocation: Improved Procedures and Better Communication Needed"Page 7
implement; optimistically it could be implemented for the FY 2015-16 plan calculations, morerealistically it could be several fiscal years before a change in the software can be facilitated.
Recommendation #11: To reduce the reoccurrence of errors identified, documentmethodologies, establish and clarify procedures, improve future Cost Allocation Plans, and toenhance analysis and communications with other departments to further transparency, theAdministration should determine whether to assign additional staff resources to itspreparations of the Cost Allocation Plans.
Administration Response: The Administration agrees with this recommendation and believesthat insufficient resources are currently assigned to the preparation of the Cost Allocation Plans.As part of the FY 2014-2015 budget process the Finance Department will evaluate resourceallocations within the department, and based upon the City's budget situation and other FinanceDepartment priorities, will make recommendations for additional staff and consulting resourcesas appropriate to address this recommendation.
Recommendation #12: To enhance transparency, Finance should include descriptions in theCost Allocation Plan document of the services being allocated, the methodology used toallocate costs, and the decisions made regarding allocable and unallocable costs. Preceding thecost allocation schedules should be an introduction that describes the purpose of the plan andthe proce,ss of cost allocation.
Administration Response: The Administration agrees with this recommendation and will startthe process of creating more transparency in the development, calculation and presentation ofthePlans. The Finance Department believes implementation of this recommendation will need totake place over the next two Plan development years. The detailed written documentation ofallocable and unallocable costs will require the commitment of more resources than are currentlydevoted to the Cost Allocation Plan development. The Finance Department will explore ways todevote sufficient resources toward this work effort, one effort currently underway is theextension of temporary staffing until the end of the fiscal year.
Recommendation #13: To improve transparency and understanding, upon annual completionof the Cost Allocation Plan Finance should post the plan document online and establish aprocess by which:
• The plan document is distributed to departments• Overhead and overhead rates are explained to line departments to ensure they are
appropriately applied, particularly in instances when there have been service deliverychanges
• Departments can review the data being used, ask questions, and make suggestions aboutthe allocations.

Sharon W. EricksonNovember 12, 2013Response to the Audit, "Indirect Cost Allocation: Improved Procedures and Better Communication Needed"Page 8
Administration Response: The Administration agrees with this recommendation and will postthe FY 2014-2015 and future Cost Allocation Plans on the intranet for reference by departments.The Finance Department will also work on a more robust dialogue with departments regardingthe allocation process.
CONCLUSION
The Audit has surfaced issues regarding the development and documentation of the City's CostAllocation Plans. The thirteen recommendations speak to the need for more transparency, morediscussion and dialogue with departments, education of the organization on the purpose of theCost Allocation Plan and most importantly better documentation on allocation of various costs.
Budget reductions in prior years have negatively affected staffing devoted to the preparation ofthe Cost Allocation Plans. The consistency in the development and management of the Plans hasadditionally been impacted by staffing turnover and as the Audit notes since 2007 at least ninedifferent individuals have prepared or supervised the preparation of the Plans. Better writtendocumentation of the calculation and methodologies within the Finance Department would havemade these staff transitions easier. The Audit also accurately identifies that insufficientresources are devoted to preparation of the Plans. The Finance Department will evaluate thisresource allocation in context of the 2014-2015 budget situation and departmental priorities andbring forward budget proposals as appropriate to address the audit recommendations.
The Administration would like to thank the City Auditor's Office for conducting this audit.
lsimLlA H. COOPERDirector of Finance
For more information please contact, Julia H. Cooper, Director of Finance at (408) 535-7011.