session title - sap controlling conference 2017 · pdf fileusing sap templates for activity...
TRANSCRIPT

8/28/2015
1
© 2015 ERP Corp. All rights reserved.
Using SAP Templates For
Activity Allocation In CO
Martin Munzel
Espresso tutorials
R 150
G 140
B 140
R 213
G 209
B 209
R 0
G 176
B 240
R 292
G 0
B 0
R 255
G 192
B 0
R 234
G 40
B 57
R 123
G 167
B 157
R 146
G 208
B 80
R 60
G 61
B 62
R 7
G 43
B 128
Introduction - Martin Munzel
• 2 years at Siemens
• 3 years at Capgemini
• 2 years at Tech Data
• 6 years at Sartorius
• Founded Espresso Tutorials in 2011 (Publishing / Consulting)
3

8/28/2015
2
R 150
G 140
B 140
R 213
G 209
B 209
R 0
G 176
B 240
R 292
G 0
B 0
R 255
G 192
B 0
R 234
G 40
B 57
R 123
G 167
B 157
R 146
G 208
B 80
R 60
G 61
B 62
R 7
G 43
B 128
Topics
• Introduction – Why use templates?
• Using templates
• Formula planning
• Customizing
• Summary
4
Start of first section:
List the main points in your presentation and insert this slide at
the start of each new topic. Move the highlighted box down for
each new section. This divides your presentation into easy to
follow sections.
R 150
G 140
B 140
R 213
G 209
B 209
R 0
G 176
B 240
R 292
G 0
B 0
R 255
G 192
B 0
R 234
G 40
B 57
R 123
G 167
B 157
R 146
G 208
B 80
R 60
G 61
B 62
R 7
G 43
B 128
Automatic Allocation Functions in SAP CO
• Activity Allocation
• Indirect Activity Allocation
• Templates
5
• Cost Allocation
• Periodic Reposting
• Distribution
• Assessment
• Templates can be used to automatically allocate activity
quantities during month end closing
• As senders, cost centers / activity types and business
processes can be used
R 150
G 140
B 140
R 213
G 209
B 209
R 0
G 176
B 240
R 292
G 0
B 0
R 255
G 192
B 0
R 234
G 40
B 57
R 123
G 167
B 157
R 146
G 208
B 80
R 60
G 61
B 62
R 7
G 43
B 128
Activity Allocation in SAP CO
6
• Activities represent cost centers within an organization
performing services
• Activities can be performed by production cost centers, but
also by support cost centers
Pressing
Burning
Packaging
Maintenance
Electricity
Dust
removal
Production
Orders

8/28/2015
3
R 150
G 140
B 140
R 213
G 209
B 209
R 0
G 176
B 240
R 292
G 0
B 0
R 255
G 192
B 0
R 234
G 40
B 57
R 123
G 167
B 157
R 146
G 208
B 80
R 60
G 61
B 62
R 7
G 43
B 128
Defining Activity Types and Activity Prices
Cost center
Maintenance
Cost element Plan costs
100100 430000 Wages 50,000
100100 476120 Depreciation 6,000
100100 476400 Training 4,000
Gesamt 60,000
Kostenstelle Activity type Plan qty
100100 MA00 Maintenance 6,000
Activity price = $ 60,000 / 6,000 h = $ 10 / h
You can define an activity price for every combination of cost
center and activity type
The price can be entered manually or determined by the system
R 150
G 140
B 140
R 213
G 209
B 209
R 0
G 176
B 240
R 292
G 0
B 0
R 255
G 192
B 0
R 234
G 40
B 57
R 123
G 167
B 157
R 146
G 208
B 80
R 60
G 61
B 62
R 7
G 43
B 128
Using Activity Allocation in SAP
8
• Simplest scenario: Employees keep a time sheet and enter their
activities spent for a certain receiver manually (using
transaction KB21N or CAT2)
Cost center Any controlling object
Activity type Quantit
y
Unit
MA00 10 H
Price: $ 10
Allocation cost element
R 150
G 140
B 140
R 213
G 209
B 209
R 0
G 176
B 240
R 292
G 0
B 0
R 255
G 192
B 0
R 234
G 40
B 57
R 123
G 167
B 157
R 146
G 208
B 80
R 60
G 61
B 62
R 7
G 43
B 128
Using Activity Allocation in SAP (cont.)
9
• Common production scenario: Activities are confirmed (based
on time sheets) or backflushed (assuming that no variance
exists between planned and actual activity)
Cost center Production order
Step Work center Qty
1 Pressing 10 h
2 Burning 15 h
3 Packaging 1 h
8/28/2015
4
R 150
G 140
B 140
R 213
G 209
B 209
R 0
G 176
B 240
R 292
G 0
B 0
R 255
G 192
B 0
R 234
G 40
B 57
R 123
G 167
B 157
R 146
G 208
B 80
R 60
G 61
B 62
R 7
G 43
B 128
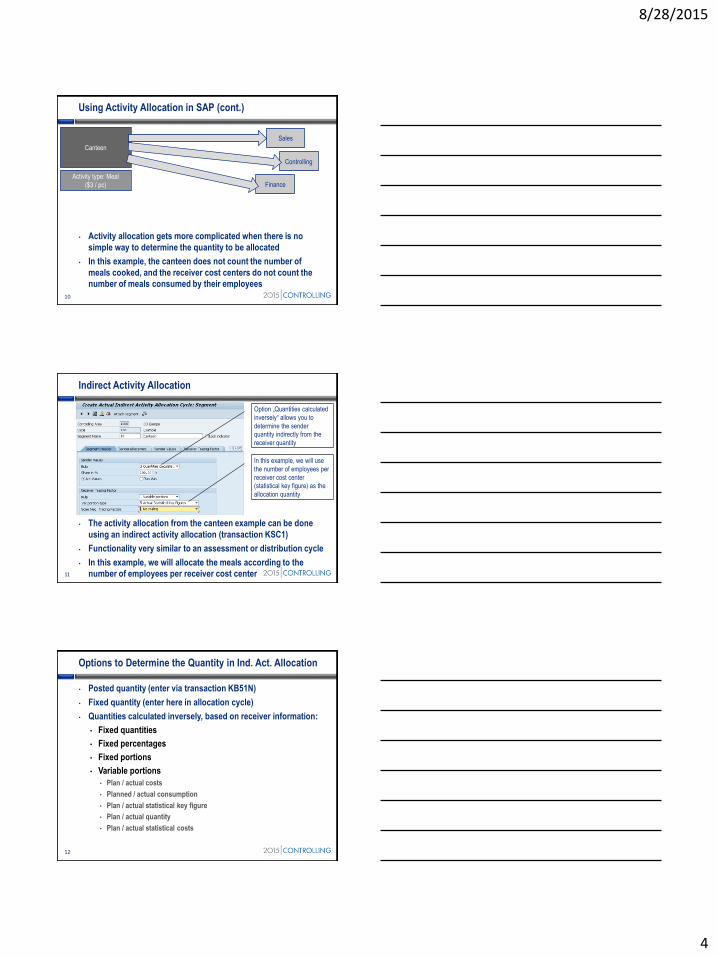
Using Activity Allocation in SAP (cont.)
10
• Activity allocation gets more complicated when there is no
simple way to determine the quantity to be allocated
• In this example, the canteen does not count the number of
meals cooked, and the receiver cost centers do not count the
number of meals consumed by their employees
Canteen
Sales
Controlling
FinanceActivity type: Meal
($3 / pc)
R 150
G 140
B 140
R 213
G 209
B 209
R 0
G 176
B 240
R 292
G 0
B 0
R 255
G 192
B 0
R 234
G 40
B 57
R 123
G 167
B 157
R 146
G 208
B 80
R 60
G 61
B 62
R 7
G 43
B 128
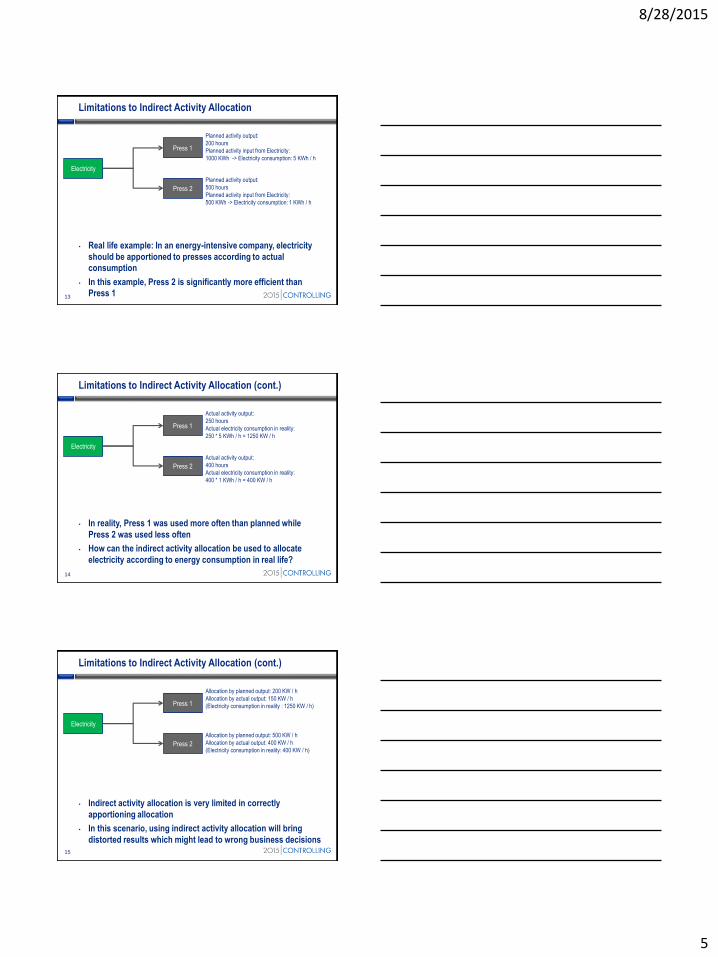
Indirect Activity Allocation
11
• The activity allocation from the canteen example can be done
using an indirect activity allocation (transaction KSC1)
• Functionality very similar to an assessment or distribution cycle
• In this example, we will allocate the meals according to the
number of employees per receiver cost center
Option „Quantities calculated
inversely“ allows you to
determine the sender
quantity indirectly from the
receiver quantity
In this example, we will use
the number of employees per
receiver cost center
(statistical key figure) as the
allocation quantity
R 150
G 140
B 140
R 213
G 209
B 209
R 0
G 176
B 240
R 292
G 0
B 0
R 255
G 192
B 0
R 234
G 40
B 57
R 123
G 167
B 157
R 146
G 208
B 80
R 60
G 61
B 62
R 7
G 43
B 128
Options to Determine the Quantity in Ind. Act. Allocation
12
• Posted quantity (enter via transaction KB51N)
• Fixed quantity (enter here in allocation cycle)
• Quantities calculated inversely, based on receiver information:
• Fixed quantities
• Fixed percentages
• Fixed portions
• Variable portions
• Plan / actual costs
• Planned / actual consumption
• Plan / actual statistical key figure
• Plan / actual quantity
• Plan / actual statistical costs
8/28/2015
5
R 150
G 140
B 140
R 213
G 209
B 209
R 0
G 176
B 240
R 292
G 0
B 0
R 255
G 192
B 0
R 234
G 40
B 57
R 123
G 167
B 157
R 146
G 208
B 80
R 60
G 61
B 62
R 7
G 43
B 128
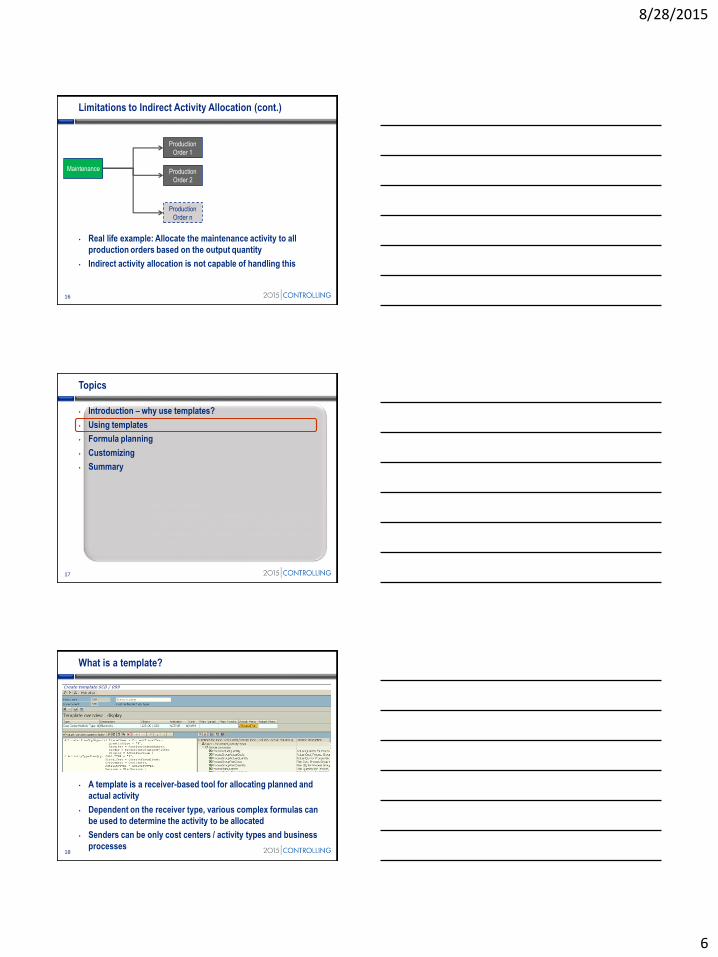
Limitations to Indirect Activity Allocation
13
• Real life example: In an energy-intensive company, electricity
should be apportioned to presses according to actual
consumption
• In this example, Press 2 is significantly more efficient than
Press 1
Press 1
Press 2
Electricity
Planned activity output:
200 hours
Planned activity input from Electricity:
1000 KWh -> Electricity consumption: 5 KWh / h
Planned activity output:
500 hours
Planned activity input from Electricity:
500 KWh -> Electricity consumption: 1 KWh / h
R 150
G 140
B 140
R 213
G 209
B 209
R 0
G 176
B 240
R 292
G 0
B 0
R 255
G 192
B 0
R 234
G 40
B 57
R 123
G 167
B 157
R 146
G 208
B 80
R 60
G 61
B 62
R 7
G 43
B 128
Limitations to Indirect Activity Allocation (cont.)
14
• In reality, Press 1 was used more often than planned while
Press 2 was used less often
• How can the indirect activity allocation be used to allocate
electricity according to energy consumption in real life?
Press 1
Press 2
Electricity
Actual activity output:
250 hours
Actual electricity consumption in reality:
250 * 5 KWh / h = 1250 KW / h
Actual activity output:
400 hours
Actual electricity consumption in reality:
400 * 1 KWh / h = 400 KW / h
R 150
G 140
B 140
R 213
G 209
B 209
R 0
G 176
B 240
R 292
G 0
B 0
R 255
G 192
B 0
R 234
G 40
B 57
R 123
G 167
B 157
R 146
G 208
B 80
R 60
G 61
B 62
R 7
G 43
B 128
Limitations to Indirect Activity Allocation (cont.)
15
• Indirect activity allocation is very limited in correctly
apportioning allocation
• In this scenario, using indirect activity allocation will bring
distorted results which might lead to wrong business decisions
Press 1
Press 2
Electricity
Allocation by planned output: 200 KW / h
Allocation by actual output: 150 KW / h
(Electricity consumption in reality : 1250 KW / h)
Allocation by planned output: 500 KW / h
Allocation by actual output: 400 KW / h
(Electricity consumption in reality: 400 KW / h)
8/28/2015
6
R 150
G 140
B 140
R 213
G 209
B 209
R 0
G 176
B 240
R 292
G 0
B 0
R 255
G 192
B 0
R 234
G 40
B 57
R 123
G 167
B 157
R 146
G 208
B 80
R 60
G 61
B 62
R 7
G 43
B 128
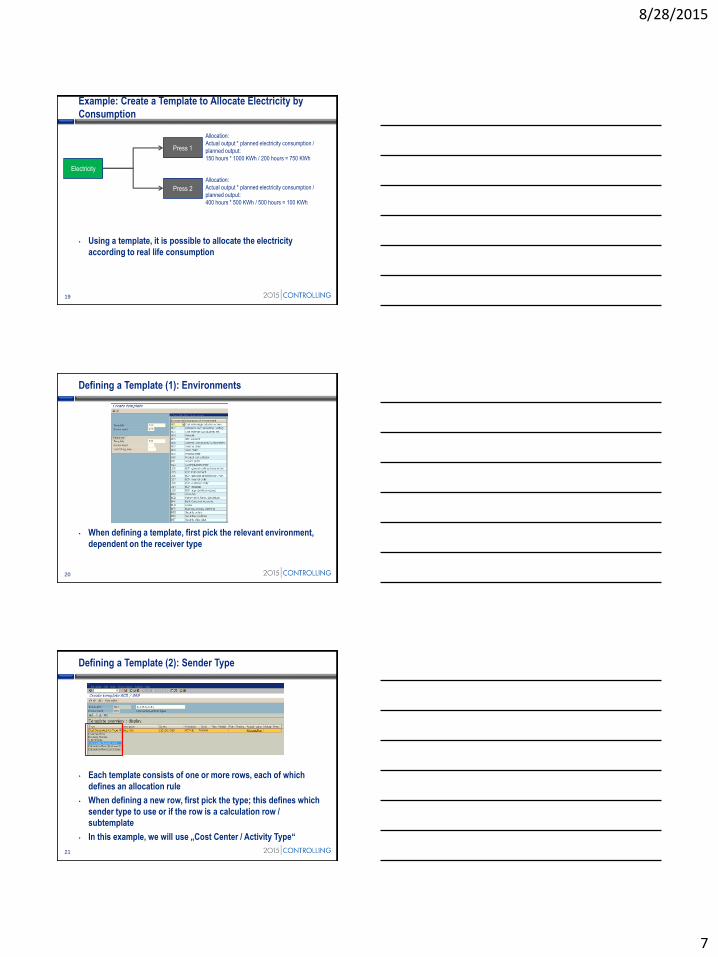
Limitations to Indirect Activity Allocation (cont.)
16
• Real life example: Allocate the maintenance activity to all
production orders based on the output quantity
• Indirect activity allocation is not capable of handling this
Production
Order 1
Production
Order 2
Maintenance
Production
Order n
R 150
G 140
B 140
R 213
G 209
B 209
R 0
G 176
B 240
R 292
G 0
B 0
R 255
G 192
B 0
R 234
G 40
B 57
R 123
G 167
B 157
R 146
G 208
B 80
R 60
G 61
B 62
R 7
G 43
B 128
Topics
• Introduction – why use templates?
• Using templates
• Formula planning
• Customizing
• Summary
17
Start of first section:
List the main points in your presentation and insert this slide at
the start of each new topic. Move the highlighted box down for
each new section. This divides your presentation into easy to
follow sections.
R 150
G 140
B 140
R 213
G 209
B 209
R 0
G 176
B 240
R 292
G 0
B 0
R 255
G 192
B 0
R 234
G 40
B 57
R 123
G 167
B 157
R 146
G 208
B 80
R 60
G 61
B 62
R 7
G 43
B 128
What is a template?
18
• A template is a receiver-based tool for allocating planned and
actual activity
• Dependent on the receiver type, various complex formulas can
be used to determine the activity to be allocated
• Senders can be only cost centers / activity types and business
processes
8/28/2015
7
R 150
G 140
B 140
R 213
G 209
B 209
R 0
G 176
B 240
R 292
G 0
B 0
R 255
G 192
B 0
R 234
G 40
B 57
R 123
G 167
B 157
R 146
G 208
B 80
R 60
G 61
B 62
R 7
G 43
B 128
Example: Create a Template to Allocate Electricity by
Consumption
19
• Using a template, it is possible to allocate the electricity
according to real life consumption
Press 1
Press 2
Electricity
Allocation:
Actual output * planned electricity consumption /
planned output:
150 hours * 1000 KWh / 200 hours = 750 KWh
Allocation:
Actual output * planned electricity consumption /
planned output:
400 hours * 500 KWh / 500 hours = 100 KWh
R 150
G 140
B 140
R 213
G 209
B 209
R 0
G 176
B 240
R 292
G 0
B 0
R 255
G 192
B 0
R 234
G 40
B 57
R 123
G 167
B 157
R 146
G 208
B 80
R 60
G 61
B 62
R 7
G 43
B 128
Defining a Template (1): Environments
20
• When defining a template, first pick the relevant environment,
dependent on the receiver type
R 150
G 140
B 140
R 213
G 209
B 209
R 0
G 176
B 240
R 292
G 0
B 0
R 255
G 192
B 0
R 234
G 40
B 57
R 123
G 167
B 157
R 146
G 208
B 80
R 60
G 61
B 62
R 7
G 43
B 128
Defining a Template (2): Sender Type
21
• Each template consists of one or more rows, each of which
defines an allocation rule
• When defining a new row, first pick the type; this defines which
sender type to use or if the row is a calculation row /
subtemplate
• In this example, we will use „Cost Center / Activity Type“

8/28/2015
8
R 150
G 140
B 140
R 213
G 209
B 209
R 0
G 176
B 240
R 292
G 0
B 0
R 255
G 192
B 0
R 234
G 40
B 57
R 123
G 167
B 157
R 146
G 208
B 80
R 60
G 61
B 62
R 7
G 43
B 128
Defining a Template (3): Description
22
• Description is optional; in this example, „Electricity“
R 150
G 140
B 140
R 213
G 209
B 209
R 0
G 176
B 240
R 292
G 0
B 0
R 255
G 192
B 0
R 234
G 40
B 57
R 123
G 167
B 157
R 146
G 208
B 80
R 60
G 61
B 62
R 7
G 43
B 128
Defining a Template (4): Sender Object
23
• The sender object can be entered directly or be derived using
complex formulas
• In this example, the electricity cost center with corresponding
activity type is used
R 150
G 140
B 140
R 213
G 209
B 209
R 0
G 176
B 240
R 292
G 0
B 0
R 255
G 192
B 0
R 234
G 40
B 57
R 123
G 167
B 157
R 146
G 208
B 80
R 60
G 61
B 62
R 7
G 43
B 128
Defining a Template (5): Activation
24
• You can activate / deactivate rows manually or determine
activation using complex formulas
• In this example, the row is always active

8/28/2015
9
R 150
G 140
B 140
R 213
G 209
B 209
R 0
G 176
B 240
R 292
G 0
B 0
R 255
G 192
B 0
R 234
G 40
B 57
R 123
G 167
B 157
R 146
G 208
B 80
R 60
G 61
B 62
R 7
G 43
B 128
Defining a Template(6): Unit of Measurement
25
• The unit of measurement is derived from the sender activity
type
• In this example, the unit is KWh
R 150
G 140
B 140
R 213
G 209
B 209
R 0
G 176
B 240
R 292
G 0
B 0
R 255
G 192
B 0
R 234
G 40
B 57
R 123
G 167
B 157
R 146
G 208
B 80
R 60
G 61
B 62
R 7
G 43
B 128
Defining a Template (7): Actual allocation (variable)
26
• In the column „Actual: Variable quantity factor“, we enter a
formula to calculate the electricity received by the receiver
object
• To do this, we double-click on the data cell and then choose the
function „AllocatedPlanQtyObjects“; this will determine the
planned electricity consumption for the receiver from the
sending object
R 150
G 140
B 140
R 213
G 209
B 209
R 0
G 176
B 240
R 292
G 0
B 0
R 255
G 192
B 0
R 234
G 40
B 57
R 123
G 167
B 157
R 146
G 208
B 80
R 60
G 61
B 62
R 7
G 43
B 128
Defining a Template (7): Actual allocation (variable)
27
• In the column „Actual: Variable quantity factor“, we enter a
formula to calculate the electricity received by the receiver
object.
• Any formula entered in the column „Actual: Variable quantity
factor“ will be multiplied with the actual activity output of the
receiver cost center, so we have already covered the first part of
the allocation:
• Actual output * planned electricity consumption / planned
output
8/28/2015
10
R 150
G 140
B 140
R 213
G 209
B 209
R 0
G 176
B 240
R 292
G 0
B 0
R 255
G 192
B 0
R 234
G 40
B 57
R 123
G 167
B 157
R 146
G 208
B 80
R 60
G 61
B 62
R 7
G 43
B 128
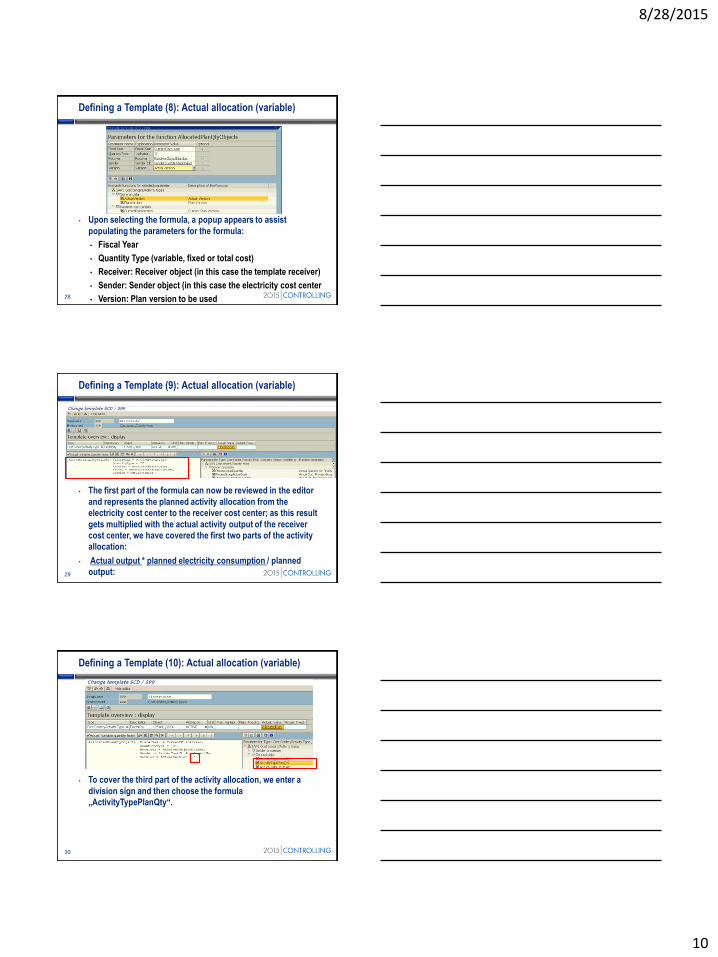
Defining a Template (8): Actual allocation (variable)
28
• Upon selecting the formula, a popup appears to assist
populating the parameters for the formula:
• Fiscal Year
• Quantity Type (variable, fixed or total cost)
• Receiver: Receiver object (in this case the template receiver)
• Sender: Sender object (in this case the electricity cost center
• Version: Plan version to be used
R 150
G 140
B 140
R 213
G 209
B 209
R 0
G 176
B 240
R 292
G 0
B 0
R 255
G 192
B 0
R 234
G 40
B 57
R 123
G 167
B 157
R 146
G 208
B 80
R 60
G 61
B 62
R 7
G 43
B 128
Defining a Template (9): Actual allocation (variable)
29
• The first part of the formula can now be reviewed in the editor
and represents the planned activity allocation from the
electricity cost center to the receiver cost center; as this result
gets multiplied with the actual activity output of the receiver
cost center, we have covered the first two parts of the activity
allocation:
• Actual output * planned electricity consumption / planned
output:
R 150
G 140
B 140
R 213
G 209
B 209
R 0
G 176
B 240
R 292
G 0
B 0
R 255
G 192
B 0
R 234
G 40
B 57
R 123
G 167
B 157
R 146
G 208
B 80
R 60
G 61
B 62
R 7
G 43
B 128
Defining a Template (10): Actual allocation (variable)
30
• To cover the third part of the activity allocation, we enter a
division sign and then choose the formula
„ActivityTypePlanQty“.
8/28/2015
11
R 150
G 140
B 140
R 213
G 209
B 209
R 0
G 176
B 240
R 292
G 0
B 0
R 255
G 192
B 0
R 234
G 40
B 57
R 123
G 167
B 157
R 146
G 208
B 80
R 60
G 61
B 62
R 7
G 43
B 128
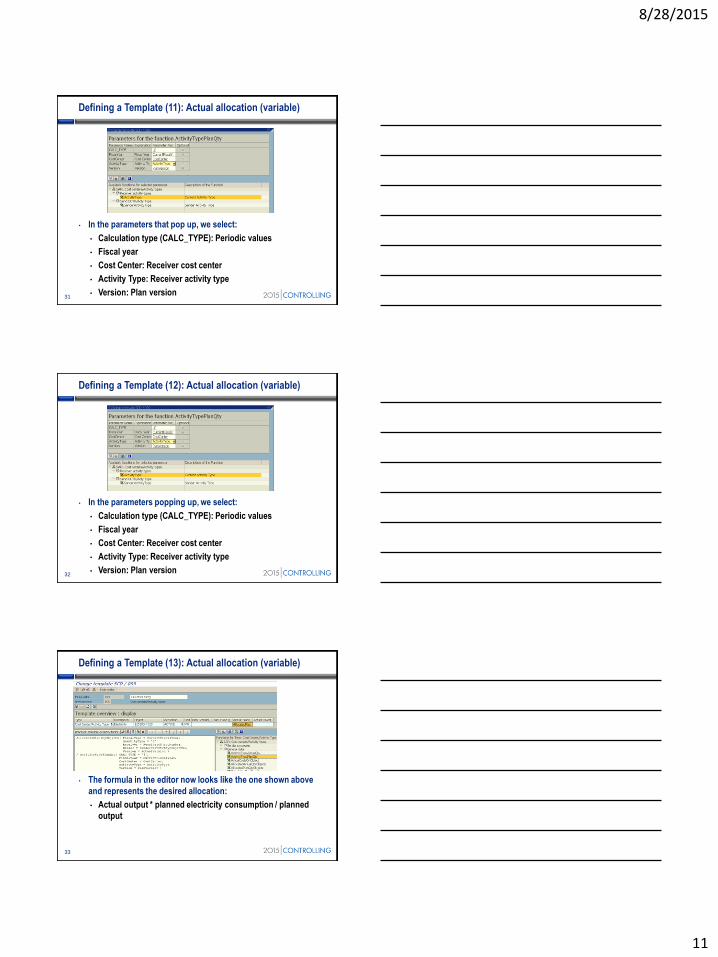
Defining a Template (11): Actual allocation (variable)
31
• In the parameters that pop up, we select:
• Calculation type (CALC_TYPE): Periodic values
• Fiscal year
• Cost Center: Receiver cost center
• Activity Type: Receiver activity type
• Version: Plan version
R 150
G 140
B 140
R 213
G 209
B 209
R 0
G 176
B 240
R 292
G 0
B 0
R 255
G 192
B 0
R 234
G 40
B 57
R 123
G 167
B 157
R 146
G 208
B 80
R 60
G 61
B 62
R 7
G 43
B 128
Defining a Template (12): Actual allocation (variable)
32
• In the parameters popping up, we select:
• Calculation type (CALC_TYPE): Periodic values
• Fiscal year
• Cost Center: Receiver cost center
• Activity Type: Receiver activity type
• Version: Plan version
R 150
G 140
B 140
R 213
G 209
B 209
R 0
G 176
B 240
R 292
G 0
B 0
R 255
G 192
B 0
R 234
G 40
B 57
R 123
G 167
B 157
R 146
G 208
B 80
R 60
G 61
B 62
R 7
G 43
B 128
Defining a Template (13): Actual allocation (variable)
33
• The formula in the editor now looks like the one shown above
and represents the desired allocation:
• Actual output * planned electricity consumption / planned
output

8/28/2015
12
R 150
G 140
B 140
R 213
G 209
B 209
R 0
G 176
B 240
R 292
G 0
B 0
R 255
G 192
B 0
R 234
G 40
B 57
R 123
G 167
B 157
R 146
G 208
B 80
R 60
G 61
B 62
R 7
G 43
B 128
Assigning a Template to a Cost Center
34
• To use the template, we have to assign it to every receiver cost
center – in our example, the two press cost centers
• Remember that templates are receiver-oriented, so you need to
enter it for every cost center receiving activites through a
template
R 150
G 140
B 140
R 213
G 209
B 209
R 0
G 176
B 240
R 292
G 0
B 0
R 255
G 192
B 0
R 234
G 40
B 57
R 123
G 167
B 157
R 146
G 208
B 80
R 60
G 61
B 62
R 7
G 43
B 128
Running a Template
35
• To run a template for cost centers, go to transaction KPAS,
enter the receiver cost center(s) and then execute.
R 150
G 140
B 140
R 213
G 209
B 209
R 0
G 176
B 240
R 292
G 0
B 0
R 255
G 192
B 0
R 234
G 40
B 57
R 123
G 167
B 157
R 146
G 208
B 80
R 60
G 61
B 62
R 7
G 43
B 128
Template Result
36
• As a result, the template will allocate the figures accordingly.

8/28/2015
13
R 150
G 140
B 140
R 213
G 209
B 209
R 0
G 176
B 240
R 292
G 0
B 0
R 255
G 192
B 0
R 234
G 40
B 57
R 123
G 167
B 157
R 146
G 208
B 80
R 60
G 61
B 62
R 7
G 43
B 128
Video: Creating and Running a Template
37
R 150
G 140
B 140
R 213
G 209
B 209
R 0
G 176
B 240
R 292
G 0
B 0
R 255
G 192
B 0
R 234
G 40
B 57
R 123
G 167
B 157
R 146
G 208
B 80
R 60
G 61
B 62
R 7
G 43
B 128
Fixed Quantities
38
• Instead of using variable quantities (multiplied with the actual
receiver output), you can use a fixed quantity which does not
get multiplied
R 150
G 140
B 140
R 213
G 209
B 209
R 0
G 176
B 240
R 292
G 0
B 0
R 255
G 192
B 0
R 234
G 40
B 57
R 123
G 167
B 157
R 146
G 208
B 80
R 60
G 61
B 62
R 7
G 43
B 128
Planning Template
39
• Templates can also be used for activity output planning.
Choose the corresponding columns for variable and fixed
quantities.
8/28/2015
14
R 150
G 140
B 140
R 213
G 209
B 209
R 0
G 176
B 240
R 292
G 0
B 0
R 255
G 192
B 0
R 234
G 40
B 57
R 123
G 167
B 157
R 146
G 208
B 80
R 60
G 61
B 62
R 7
G 43
B 128
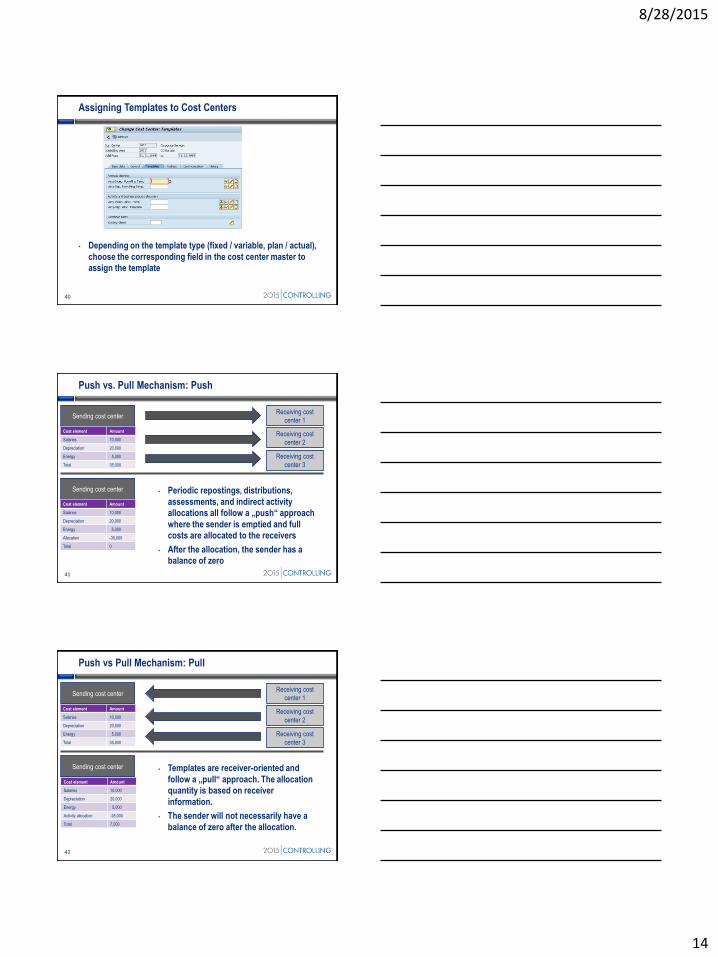
Assigning Templates to Cost Centers
40
• Depending on the template type (fixed / variable, plan / actual),
choose the corresponding field in the cost center master to
assign the template
R 150
G 140
B 140
R 213
G 209
B 209
R 0
G 176
B 240
R 292
G 0
B 0
R 255
G 192
B 0
R 234
G 40
B 57
R 123
G 167
B 157
R 146
G 208
B 80
R 60
G 61
B 62
R 7
G 43
B 128
Push vs. Pull Mechanism: Push
41
• Periodic repostings, distributions,
assessments, and indirect activity
allocations all follow a „push“ approach
where the sender is emptied and full
costs are allocated to the receivers
• After the allocation, the sender has a
balance of zero
Sending cost centerReceiving cost
center 1
Cost element Amount
Salaries 10,000
Depreciation 20,000
Energy 5,000
Total 35,000
Receiving cost
center 3
Receiving cost
center 2
Sending cost center
Cost element Amount
Salaries 10,000
Depreciation 20,000
Energy 5,000
Allocation -35,000
Total 0
R 150
G 140
B 140
R 213
G 209
B 209
R 0
G 176
B 240
R 292
G 0
B 0
R 255
G 192
B 0
R 234
G 40
B 57
R 123
G 167
B 157
R 146
G 208
B 80
R 60
G 61
B 62
R 7
G 43
B 128
Push vs Pull Mechanism: Pull
42
• Templates are receiver-oriented and
follow a „pull“ approach. The allocation
quantity is based on receiver
information.
• The sender will not necessarily have a
balance of zero after the allocation.
Sending cost centerReceiving cost
center 1
Receiving cost
center 3
Receiving cost
center 2
Sending cost center
Cost element Amount
Salaries 10,000
Depreciation 20,000
Energy 5,000
Total 35,000
Cost element Amount
Salaries 10,000
Depreciation 20,000
Energy 5,000
Activity allocation -28,000
Total 7,000

8/28/2015
15
R 150
G 140
B 140
R 213
G 209
B 209
R 0
G 176
B 240
R 292
G 0
B 0
R 255
G 192
B 0
R 234
G 40
B 57
R 123
G 167
B 157
R 146
G 208
B 80
R 60
G 61
B 62
R 7
G 43
B 128
Scenario From Activity Based Costing
43
Cost center 100
Quote verification
Salaries $ 1,000
Depreciation $ 500
Buildings $ 500
-------------------------------------
Plan output 100 h
Plan price $ 20/h
-----------------------------------------
Business process 100
Sales order management
Plan output from cost center 100 $ 2,000
Plan output from cost center 200 $ 3,000
Plan output (sales orders) 200 EA
Plan price $ 25 / EA
------------------------------------------------
Profitability segment
with char. customer 1
60 sales orders
Cost center 100
Back Office
Salaries $ 2,000
Depreciation $ 700
Buildings $ 300
----------------------------------------
Plan output 200 h
Plan price $ 15/h
----------------------------------------
Profitability segment
with char. customer 2
15 sales orders
Profitability segment
with char. customer 3
75 sales orders
Consumption 15 EA
Allocation BP100 $ 1.500
-----------------------------------------
Balance $ 500
Allocation BP100 $ 2.250
-----------------------------------------
Balance $ 750
------------------------------------------------
Output from cost center 100 $ 1,500
Output from cost center 200 $ 2,250
Output to customer 1 $ 1,500
Output to customer 2 $ 375
Output to customer 3 $ 1,875
Allocation from BP 100 $ 1,600
Allocation from BP 100 $ 375
Allocation from BP 100 $ 1,875
R 150
G 140
B 140
R 213
G 209
B 209
R 0
G 176
B 240
R 292
G 0
B 0
R 255
G 192
B 0
R 234
G 40
B 57
R 123
G 167
B 157
R 146
G 208
B 80
R 60
G 61
B 62
R 7
G 43
B 128
Topics
• Introduction – why use templates?
• Using templates
• Formula planning
• Customizing
• Summary
44
Start of first section:
List the main points in your presentation and insert this slide at
the start of each new topic. Move the highlighted box down for
each new section. This divides your presentation into easy to
follow sections.
R 150
G 140
B 140
R 213
G 209
B 209
R 0
G 176
B 240
R 292
G 0
B 0
R 255
G 192
B 0
R 234
G 40
B 57
R 123
G 167
B 157
R 146
G 208
B 80
R 60
G 61
B 62
R 7
G 43
B 128
Formula Planning: Overview
45
• Formula planning can be used to plan primary costs
independently from activities
• Environment to be used: CPI
8/28/2015
16
R 150
G 140
B 140
R 213
G 209
B 209
R 0
G 176
B 240
R 292
G 0
B 0
R 255
G 192
B 0
R 234
G 40
B 57
R 123
G 167
B 157
R 146
G 208
B 80
R 60
G 61
B 62
R 7
G 43
B 128
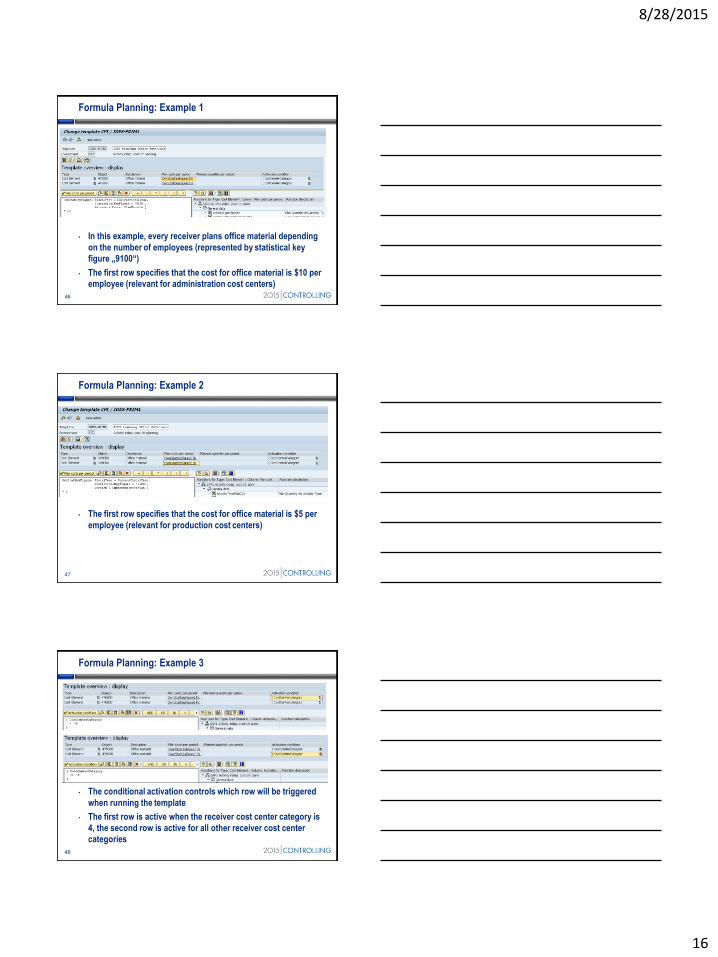
Formula Planning: Example 1
46
• In this example, every receiver plans office material depending
on the number of employees (represented by statistical key
figure „9100“)
• The first row specifies that the cost for office material is $10 per
employee (relevant for administration cost centers)
R 150
G 140
B 140
R 213
G 209
B 209
R 0
G 176
B 240
R 292
G 0
B 0
R 255
G 192
B 0
R 234
G 40
B 57
R 123
G 167
B 157
R 146
G 208
B 80
R 60
G 61
B 62
R 7
G 43
B 128
Formula Planning: Example 2
47
• The first row specifies that the cost for office material is $5 per
employee (relevant for production cost centers)
R 150
G 140
B 140
R 213
G 209
B 209
R 0
G 176
B 240
R 292
G 0
B 0
R 255
G 192
B 0
R 234
G 40
B 57
R 123
G 167
B 157
R 146
G 208
B 80
R 60
G 61
B 62
R 7
G 43
B 128
Formula Planning: Example 3
48
• The conditional activation controls which row will be triggered
when running the template
• The first row is active when the receiver cost center category is
4, the second row is active for all other receiver cost center
categories
8/28/2015
17
R 150
G 140
B 140
R 213
G 209
B 209
R 0
G 176
B 240
R 292
G 0
B 0
R 255
G 192
B 0
R 234
G 40
B 57
R 123
G 167
B 157
R 146
G 208
B 80
R 60
G 61
B 62
R 7
G 43
B 128
Topics
• Introduction – why use templates?
• Using templates
• Formula planning
• Customizing
• Summary
49
Start of first section:
List the main points in your presentation and insert this slide at
the start of each new topic. Move the highlighted box down for
each new section. This divides your presentation into easy to
follow sections.
R 150
G 140
B 140
R 213
G 209
B 209
R 0
G 176
B 240
R 292
G 0
B 0
R 255
G 192
B 0
R 234
G 40
B 57
R 123
G 167
B 157
R 146
G 208
B 80
R 60
G 61
B 62
R 7
G 43
B 128
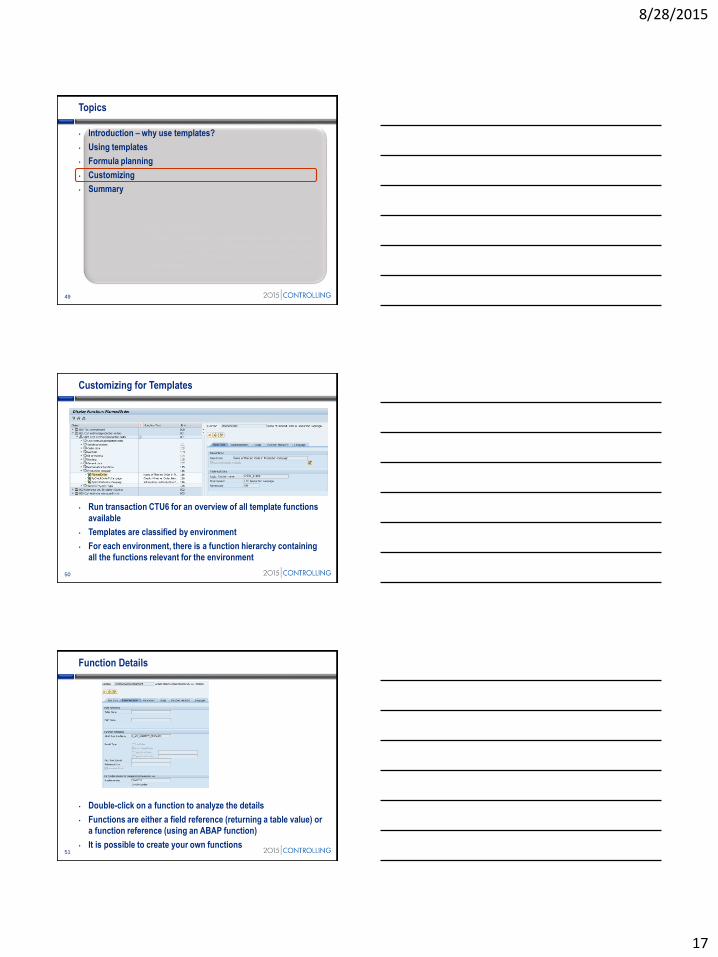
Customizing for Templates
50
• Run transaction CTU6 for an overview of all template functions
available
• Templates are classified by environment
• For each environment, there is a function hierarchy containing
all the functions relevant for the environment
R 150
G 140
B 140
R 213
G 209
B 209
R 0
G 176
B 240
R 292
G 0
B 0
R 255
G 192
B 0
R 234
G 40
B 57
R 123
G 167
B 157
R 146
G 208
B 80
R 60
G 61
B 62
R 7
G 43
B 128
Function Details
51
• Double-click on a function to analyze the details
• Functions are either a field reference (returning a table value) or
a function reference (using an ABAP function)
• It is possible to create your own functions
8/28/2015
18
R 150
G 140
B 140
R 213
G 209
B 209
R 0
G 176
B 240
R 292
G 0
B 0
R 255
G 192
B 0
R 234
G 40
B 57
R 123
G 167
B 157
R 146
G 208
B 80
R 60
G 61
B 62
R 7
G 43
B 128
Topics
• Introduction – why use templates?
• Using templates
• Formula planning
• Customizing
• Summary
52
Start of first section:
List the main points in your presentation and insert this slide at
the start of each new topic. Move the highlighted box down for
each new section. This divides your presentation into easy to
follow sections.
R 150
G 140
B 140
R 213
G 209
B 209
R 0
G 176
B 240
R 292
G 0
B 0
R 255
G 192
B 0
R 234
G 40
B 57
R 123
G 167
B 157
R 146
G 208
B 80
R 60
G 61
B 62
R 7
G 43
B 128
Resources
• Rogerio Faleiros, Configuring Controlling in SAP ERP (SAP
PRESS, 2012).
• ISBN: 978-1-59229-401-5
• https://www.sap-press.com/configuring-controlling-in-sap-
erp_2920/
• SAP Help:
• http://help.sap.com/erp2005_ehp_07/helpdata/en/ba/ed29535
87d2c3ee10000000a423f68/content.htm?frameset=/en/ed/0cd
553088f4308e10000000a174cb4/frameset.htm¤t_toc=/e
n/2e/11d553088f4308e10000000a174cb4/plain.htm&node_id=3
84&show_children=false
53
R 150
G 140
B 140
R 213
G 209
B 209
R 0
G 176
B 240
R 292
G 0
B 0
R 255
G 192
B 0
R 234
G 40
B 57
R 123
G 167
B 157
R 146
G 208
B 80
R 60
G 61
B 62
R 7
G 43
B 128
Five Key Ideas
• Templates are complex at first glance, but are very powerful
• Templates can do things that the other allocation methods
cannot
• Templates follow a pull approach rather than push
• Formula planning is not very widely known, but can be very
useful
• With some ABAP knowledge, you can create your own template
functions
54

8/28/2015
19
R 150
G 140
B 140
R 213
G 209
B 209
R 0
G 176
B 240
R 292
G 0
B 0
R 255
G 192
B 0
R 234
G 40
B 57
R 123
G 167
B 157
R 146
G 208
B 80
R 60
G 61
B 62
R 7
G 43
B 128
Questions
• Now:
• Ask questions now for immediate answers
• Later:
55
Q&A
Disclaimer
SAP®, R/3, mySAP, mySAP.com, xApps, xApp, SAP NetWeaver®, Duet®, PartnerEdge, and other SAP® products and
services mentioned herein as well as their respective logos are trademarks or registered trademarks of SAP AG in
Germany and in several other countries all over the world. All other product and service names mentioned are the
trademarks of their respective companies. ERP Corp is neither owned nor controlled by SAP.