india’s action plan for implementing the convention on ...€™s action plan for implementing the...
TRANSCRIPT

India’s Action Plan for Implementing the Convention on Biological Diversity’s Programme of Work on Protected Areas
Submitted to the Secretariat of the Convention on Biological Diversity
March, 2012

Protected area information:
PoWPA Focal Point:
Dr. Vinod B. Mathur, D.Phil. (Oxon.) Dean, Faculty of Wildlife Sciences, Wildlife Institute of India, Chandrabani, Dehradun (Uttarakhand). INDIA Tel.: +91‐(0)135‐2640304(Off.); Mob.: +9412054648 Fax: +91‐(0)135‐2640117; Email: [email protected]; [email protected]
Lead implementing agency:
Ministry of Environment and Forests, Govt. of India
Multistakeholder committee:
1. National Board for Wildlife under the Chairmanship of Hon’ble Prime Minister of India
2. State Boards for Wildlife under the Chairmanship of respective Chief Minister of States
Description of protected area system
National Targets and Vision for Protected Areas The target 11 of the Aichi Targets indicates that by 2020, at least 17% of terrestrial and inland water areas and 10% of coastal and marine areas especially areas of particular importance for biodiversity and ecosystem services are conserved through protected areas and other effective area‐based conservation measures; are effectively and equitably managed; are ecologically representative; and are well connected systems of PAs integrated into the wider landscapes and seascapes. India’s National Wildlife Action Plan (2006‐2011) envisages 10% of the geographical area of the country under PA coverage. Recommendations are in place to establish additional 67 new National Parks at 203 new Wildlife Sanctuaries to make PA network more geographically representatives. Efforts are also underway to establish new ‘Marine Protected Areas’.
In India, all government owned forests and other important ecosystems (which are outside the legally designated PA network), and occupy ca. 20% of the geographical area of the country are under some kind of conservation planning and managed for biodiversity conservation. There are several examples of community driven conservation initiatives in the country. The government is also taking steps to notify ‘Eco‐sensitive Zones’ around protected areas to regulate developmental activities. The National Environmental Policy 2006 envisages that human activities around PAs should be harmonized so that such activities have minimal adverse impact.
A Task Force has also been set up to identify Transboundary Protected Areas (TBPA). An important scheme for ‘Integrated Development of Wildlife Habitats (IDWH)’ has been formulated and is being implemented to strengthen wildlife conservation outside the legally designated PA Network.
It is evident that if all the above initiatives are taken into account then around one‐fifth of the geographical area of the country is currently under a broad based conservation planning for biodiversity conservation.
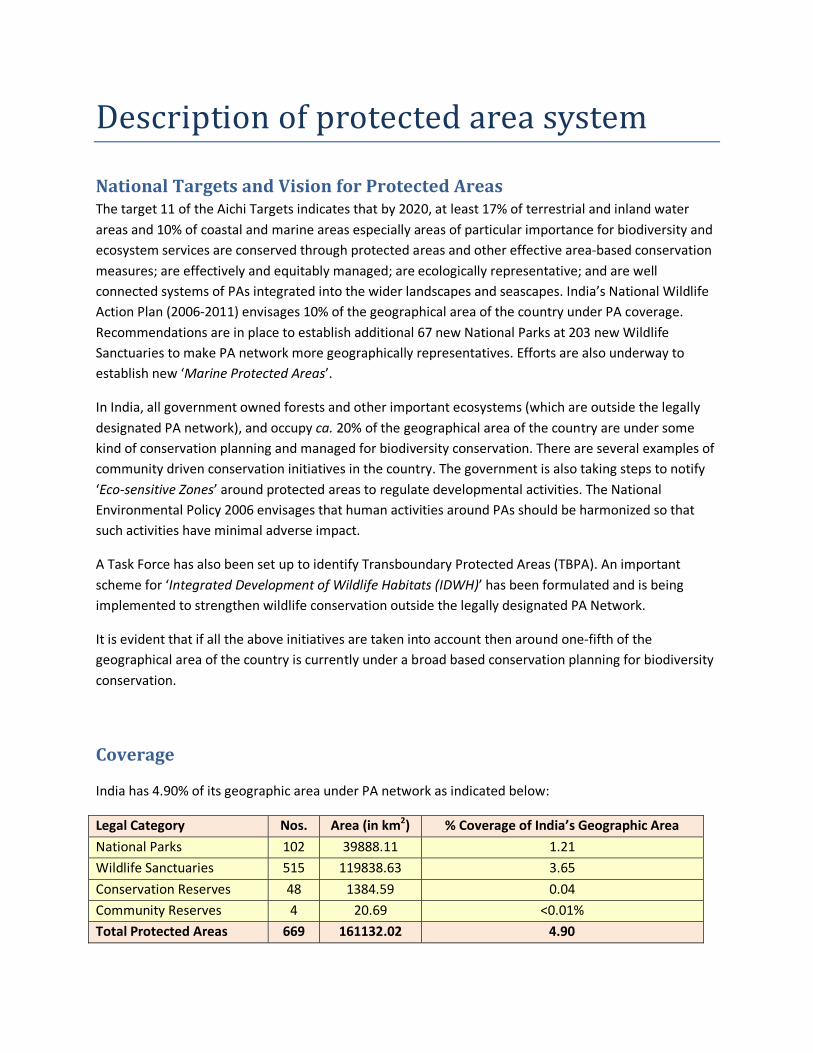
Coverage
India has 4.90% of its geographic area under PA network as indicated below:
Legal Category Nos. Area (in km2) % Coverage of India’s Geographic Area
National Parks 102 39888.11 1.21
Wildlife Sanctuaries 515 119838.63 3.65
Conservation Reserves 48 1384.59 0.04
Community Reserves 4 20.69 <0.01%
Total Protected Areas 669 161132.02 4.90

Description and background
The Biogeographical Classification of India has used four levels of planning unit for establishing a representative network of protected areas. These are:
a) The Biogeographic Zone
Large distinctive units of similar ecology, biome representation, community and species e.g. The
Himalaya, The Western Ghats.
b) The Biotic Province
Secondary units within a zone, giving weight to particular communities separated by dispersal
barriers or gradual change in environmental factors e.g. North West and West Himalaya either
side of the Sutlej River.
c) The Land Region
A tertiary set of units within a province, indicating different land forms, e.g. Aravalli Mountains
and Malwa Plateau in Gujarat‐Rajwara Province.
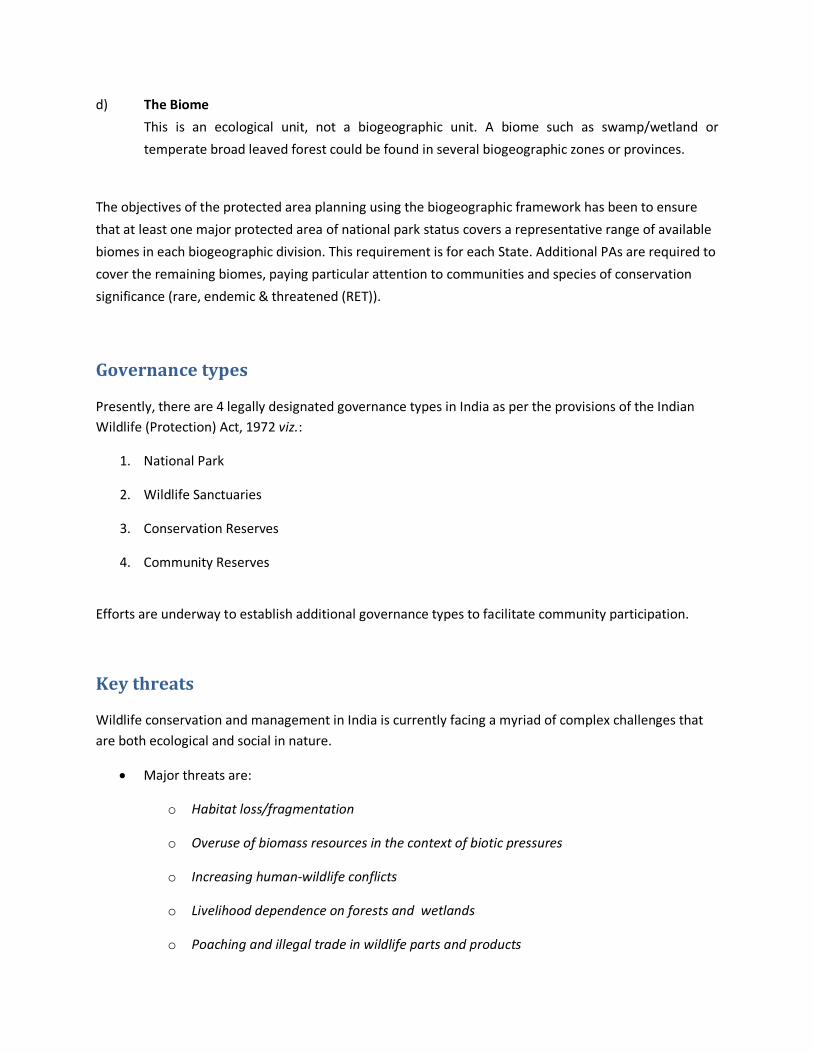
d) The Biome
This is an ecological unit, not a biogeographic unit. A biome such as swamp/wetland or
temperate broad leaved forest could be found in several biogeographic zones or provinces.
The objectives of the protected area planning using the biogeographic framework has been to ensure
that at least one major protected area of national park status covers a representative range of available
biomes in each biogeographic division. This requirement is for each State. Additional PAs are required to
cover the remaining biomes, paying particular attention to communities and species of conservation
significance (rare, endemic & threatened (RET)).
Governance types
Presently, there are 4 legally designated governance types in India as per the provisions of the Indian Wildlife (Protection) Act, 1972 viz.:
1. National Park
2. Wildlife Sanctuaries
3. Conservation Reserves
4. Community Reserves
Efforts are underway to establish additional governance types to facilitate community participation.
Key threats
Wildlife conservation and management in India is currently facing a myriad of complex challenges that are both ecological and social in nature.
• Major threats are:
o Habitat loss/fragmentation
o Overuse of biomass resources in the context of biotic pressures
o Increasing human‐wildlife conflicts
o Livelihood dependence on forests and wetlands
o Poaching and illegal trade in wildlife parts and products

The need for maintenance of a broad base of public support for wildlife conservation exemplifies and characterizes the contemporary wildlife conservation scenario in India. The government and the civil society are taking several measures to address these issues. Improved synergies and better coordination amongst the wide array of stakeholders are needed to meet the challenges of conserving India’s diverse wilderness resources amidst many odds.
Barriers for effective implementation
• Inadequate appreciation of role of PA’s and their services. • Inadequate human and financial resources.

Status, priority and timeline for key actions of the Programme of Work on Protected Areas
Status of key actions of the Programme of Work on Protected Areas Key Assessments and Actions Status Priority Timeline• Has a multi‐stakeholder advisory committee been formed? National Board for Wildlife and State Board for Wildlife exist as
multi‐stakeholder advisory committee under Wildlife Protection Act.
4 ‐ ‐
• What is the progress on assessing gaps in the protected area network? (1.1)
4 H 2013
• What is the progress on filling gaps in the protected area network? (1.1)
1 H 2016
• What is the progress in assessing protected area integration opportunities? (1.2)
3 H 2018
• What is the progress in implementing protected area integration? (1.2)
1 H 2020
• What is the progress in establishing transboundary areas and regional networks? (1.3)
3 H 2016
• What is the progress in developing site‐level management plans? (1.4)
The preparations of site level management plans have been accorded the high priority and efforts are being made to make these plans integrated, science based and participatory.
2 VH 2016
• What is the progress in assessing threats and opportunities for restoration? (1.5)
3 VH 2013
• What is the progress in mitigating threats and implementing restoration measures? (1.5)
2 VH 2020
• What is the progress in assessing and improving equitable benefits sharing? (2.1)
2 H 2015
• What is the progress in assessing and diversifying protected area governance? (2.1)
1 VH 2020
• What is the progress in assessing indigenous and local community participation? (2.2)
3 H 2013
• What is the progress in improving protected area participation? (2.2)
3 H 2013

Key Assessments and Actions Status Priority Timeline• What is the progress in assessing the enabling policy
environment for establishing, managing and financing protected areas? (3.1)
3 VH 2015
• What is the progress in improving the protected area policy environment? (3.1)
3 VH 2018
• What is the progress in assessing the values of protected areas? (3.1) (Economic)
1 H 2020
• What is the progress in assessing protected area capacity? (3.2) 4 VH ‐ • What is the progress in improving protected area capacity? (3.2) 2 H 2020
• What is the progress in assessing appropriate technology needs? (3.3)
3 H 2015
• What is the progress in developing appropriate technology? (3.3) 1 H 2020
• What is the progress in assessing protected area sustainable finance needs? (3.4)
2 H 2014
• What is the progress in improving protected area sustainable finance? (3.4)
1 H 2021
• What is the progress in conducting public awareness campaigns? (3.5)
3 VH 2020
• What is the progress in developing best practices and minimum standards? (4.1)
3 VH 2015
• What is the progress in assessing management effectiveness? (4.2)
3 VH 2015
• What is the progress in improving management effectiveness? (4.2)
2 H 2016
• What is the progress in establishing an effective PA monitoring system? (4.3)
3 VH 2015
• What is the status of assessing research needs for protected areas? (4.4)
3 VH 2015
• What is the status of developing a research program for protected areas? (4.4)
3 VH 2015
• What is the status of addressing opportunities for marine protection?
2 VH 2015
• What is the status of incorporating climate change aspects into protected areas?
1 H 2016
Status: 0 = no work, 1 = just started, 2 = partially complete, 3 = nearly complete, 4 = complete
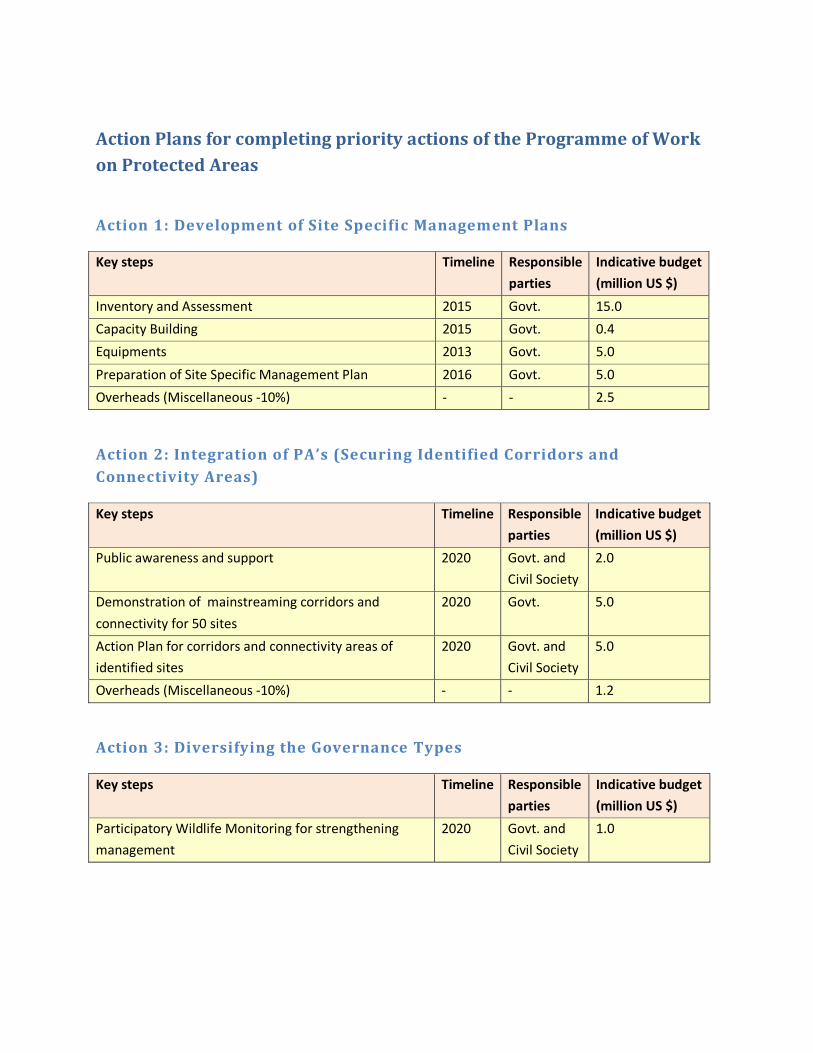
Action Plans for completing priority actions of the Programme of Work on Protected Areas
Action 1: Development of Site Specific Management Plans
Key steps Timeline Responsible
parties
Indicative budget
(million US $)
Inventory and Assessment 2015 Govt. 15.0
Capacity Building 2015 Govt. 0.4
Equipments 2013 Govt. 5.0
Preparation of Site Specific Management Plan 2016 Govt. 5.0
Overheads (Miscellaneous ‐10%) ‐ ‐ 2.5
Action 2: Integration of PA’s (Securing Identified Corridors and Connectivity Areas)
Key steps Timeline Responsible
parties
Indicative budget
(million US $)
Public awareness and support 2020 Govt. and
Civil Society
2.0
Demonstration of mainstreaming corridors and
connectivity for 50 sites
2020 Govt. 5.0
Action Plan for corridors and connectivity areas of
identified sites
2020 Govt. and
Civil Society
5.0
Overheads (Miscellaneous ‐10%) ‐ ‐ 1.2
Action 3: Diversifying the Governance Types
Key steps Timeline Responsible
parties
Indicative budget
(million US $)
Participatory Wildlife Monitoring for strengthening
management
2020 Govt. and
Civil Society
1.0

Action 4: Protected Area Valuation Assessment
Key steps Timeline Responsible parties
Indicative budget (million US $)
Targeted studies on PA valuation assessment in select PAs
2016 Govt. and Scientific Institutions
1.0
Action 5: Climate Change Resilience and Adaptation Assessment
Key steps Timeline Responsible parties
Indicative budget(million US $)
Targeted studies on Climate Change Resilience and Adaptation Assessment in select PAs
2016 Govt. and Scientific Institutions
2.0

Key assessment results Ecological gap assessment
In the early 1980s, the Government of India initiated the process of ecological gap assessment and commissioned the Wildlife Institute of India to develop a ‘Biogeographic Classification of India’ to facilitate rational conservation planning of protected areas in India. The Biogeographic Classification of India includes 10 Zones and 27 Provinces.
Category 1988 2012 % increase Increase in net area (km2)
Nos. Area (km2) % Nos. Area (km2) % Nos. Area
National Parks 54 21,003 0.64 102 39888.11 1.21 89 90 18,885
Wildlife Sanctuaries 372 88,649 2.7 515 119838.63 3.65 38 35 31,190
Community Reserve ‐ ‐ ‐ 4 20.69 <0.01% ‐ ‐ 20.69
Conservation Reserve ‐ ‐ ‐ 48 1384.59 0.04 ‐ ‐ 1,384.59
Protected Areas 426 109652 3.34 669 161132.02 4.90 57 47 51480.28
India has made significant progress in expanding the protected area network. There has been an
increase of 89% in the number of national parks established between 1988 and 2012 and an increase of
38% in the number of wildlife sanctuaries established during the same period. Overall, there has been

an increase of 57% in the protected area network and a net increase of 51480.28 km2 in area. India has
also established two more legal categories of protected areas viz. Community Reserve and Conservation
Reserve by amending the Indian Wildlife Protection Act (1972) in 2002. Efforts are currently underway
to plug the ecological gaps in the protected area coverage by establishing protected areas under the 4
legal categories.
India is in the process of strengthening its Marine Protected Area Network for management of natural marine resources for biodiversity conservation and for the well‐being of resource dependent population. In India, Protected Areas that in whole or in part that fall within a swath of 500 m from the high tide line are included in the Marine Protected Area Network. Based on this definition, there are 18 Marine Protected Areas present in the Peninsular India and more than 100 MPAs in its Islands. Of the 18 MPAs in the peninsula, Gulf of Mannar Marine National Park, Sundarbans National Park, Gulf of Kutchch National Park, Bhitrakanika National Park, Coringa Wildlife Sanctuary, Chilika Wildlife Sanctuary have unique marine biodiversity and provide a range of services to local communities around these MPAs. These 18 MPAs cover an area of about 6158 km2, which is 3.85% of total area covered under the entire Protected Area Network of India or less than 0.2% of total land areas of India. However, a total of 4.97% of coastal zone of peninsular India has already been included in the existing MPAs, which is almost 50% of Aichi Biodiversity Target No.11.
Total area of Andaman and Nicobar Island is 4947 km2, of which 1510 km2 are protected under the provision of India’s Wildlife (Protection) Act, 1972. There are 105 Protected Areas in Andaman and Nicobar Islands, of these about 100 are MPAs. Although, these MPAs cover more than 30% of terrestrial areas of islands but still protect more than 40% of available coastal habitats of islands. The Mahatma Gandhi Marine National Park and Rani Jhansi Marine National Park are important MPAs here. In Lakshadweep group of islands, Pitti Island (0.01 km2) is the only island having the status as MPA.
Sl.No MPA Category Year of
Establishment
Area (km2)
1 Gulf of Mannar National Park 1986 560.00
2 Sundarbans National Park 1984 1330.10
3 Bhitarkanika National Park 1988 145
4 Gulf of Kachchh National Park 1980 162.89
5 Malvan Wildlife Sanctuary 1987 29.12
6 Gulf of Kachchh Wildlife Sanctuary 1980 295.03
7 Khijadiya Wildlife Sanctuary 1981 6.05
8 Sajnekhali Wildlife Sanctuary 1976 362.04
9 Lothian Wildlife Sanctuary 1976 38

Sl.No MPA Category Year of
Establishment
Area (km2)
10 Haliday Wildlife Sanctuary 1976 5.95
11 Bhitarkanika Wildlife Sanctuary 1975 672
12 Gahirmatha Wildlife Sanctuary 1997 1435
13 Chilika Wildlife Sanctuary 1987 15.53
14 Coringa Wildlife Sanctuary 1978 235.70
15 Pulicat Wildlife Sanctuary 1976 500.00
16 Krishna Wildlife Sanctuary 1999 194.81
17 Point Calimere Wildlife Sanctuary 1967 17.26
18 Pulicat Wildlife Sanctuary 1980 153.67
Management effectiveness assessment
India has carried out Management Effectiveness Evaluation (MEE) of its Protected Areas comprising
National Parks, Wildlife Sanctuaries and Tiger Reserves. Till 2010, 58 National Parks and Wildlife
Sanctuaries have been evaluated under the MEE process and 30 National Parks and Wildlife Sanctuaries
are being evaluated in 2011‐2012. The Tiger Reserves have been subjected to MEE process twice – first
in 2005‐2006 and then in 2010‐2011. The outcomes of the MEE process are given below:
Total No. of National Parks and Wildlife Sanctuaries Evaluated (2007‐2010)
Evaluation Category
58 Very Good Good Satisfactory Poor
9 (16%) 22 (38%) 19 (33%) 8 (14%)
Total No. of Tiger Reserves Evaluated (2005‐2006)
Evaluation Category
28 Very Good Good Satisfactory Poor
9 (32%) 10 (36%) 07 (25%) 02 (7%)
Total No. of Tiger Reserves Evaluated (2010‐2011)
Evaluation Category
39 Very Good Good Satisfactory Poor
15 (38%) 12 (31%) 08 (21%) 04 (10%)

In the Tiger Reserve Assessment, the following 30 ‘Headline Indicators’ were used:
1. Context
1.1 Identification of values
1.2 Assessment of threats
1.3 Biotic interference in core area
1.4 Compliance of statutory requirements
2. Planning
2.1 Tiger conservation plan
2.2 Safeguarding of biodiversity values
2.3 Stakeholder participation
2.4 Habitat management
2.5 Effective protection strategy
2.6 Mitigation of human‐wildlife conflicts
2.7 Landscape conservation approach
3. Inputs
3.1 Adequacy of manpower deployment3.2 Adequacy of physical infrastructure3.3 Adequacy of central government funding3.4 Adequacy of state government funding3.5 NGO resource contribution
4. Process
4.1 Adequacy of trained manpower resources4.2 Frontline staff performance evaluation4.3 Effectiveness of public participation4.4 Process of complaint handling4.5 Livelihood support to local communities4.6 Village relocation planning
5. Outputs
5.1 Dissemination of information to public 5.2 Management of visitor facilities5.3 Evaluation of research/monitoring trends5.4 Adequacy of infrastructure maintenance & funds
6. Outcomes
6.1 Population trends of tiger & other species6.2 Threat abatement6.3 Visitor satisfaction6.4 Local community support
Sustainable finance assessment
No formal sustainable finance assessment has been done for the protected area network in India. However, based on the felt need ‘Annual Plan of Operations’ are prepared for all PAs in the country indicating the activities and the funds requirement. There is always a gap between funds ‘required’ and the fund made ‘available’ to a PA due to overall resource constraints. The Resource Group on Wildlife Management constituted by the Ministry of Environment & Forests, Government of India in its report submitted to the Planning Commission, Government of India in September, 2011 has suggested an outlay of Rs. 10488.18 crores or US $ 2098 million for the 12th Five Year Plan (2012‐2017).

Capacity needs assessment
In order to address capacity needs in the field of wildlife and protected area management India has
taken several initiatives. At the federal level, the Wildlife Institute of India (WII), Dehradun has been set
up as autonomous Institute with a mandate to build capacity through training, research and advisory
support. Through a wide array of capacity building programmes the WII has trained over 3000
professionals in the country and also over 160 professionals in 15 countries of the region and beyond.
The States have also established training and research institutions to build capacity in the field of forest
and wildlife management. Since new thematic areas in PA management are emerging in the context of
climate change, infectious diseases, metapopulation management, conservation genetics etc new
capacities have to be build and upscaled.
Policy environment assessment
India has set an enabling policy and legal environment to deal with all matters pertaining to wildlife and
protected area management. The National Wildlife Action Plan (NWAP) 2002‐2016 is the key instrument
that provides vision and actions for effective conservation and management. The Planning Commission
of India conducts assessments for existing schemes and planning for new initiatives during the 5‐year
Plan Period. Recently, an assessment has been completed for the XII Plan Period (2012‐2017).
Protected area integration and mainstreaming assessment
The integration and mainstreaming of protected area management into development planning
continues to remain a daunting challenge in India as also globally. There is a perceptible shift now from
the earlier ‘PA‐Centric’ approach to the new ‘Landscape‐Centric’ approach by engaging a range of
stakeholders, line departments/agencies and active support of civil‐society organizations. In response to
the felt need, the Ministry of Environment & Forests (MoEF) is implementing a scheme on ‘Integrated
Development of Wildlife Habitats’ across the country for strengthening wildlife conservation outside the
legally designated PA network. The MoEF is also implementing a World Bank funded Biodiversity
Conservation and Rural Livelihood Project’ (BCLRIP) to build capacity for mainstreaming biodiversity
conservation.

Protected area valuation assessment
Presently, no protected area valuation assessment has been carried out on a country wide basis mainly because of lack of technical capacity and availability of resources. Few studies on valuation of ecosystem services have been carried out in select PAs (Corbett, Bhitarkanika, Keoladeo and Chilka) of the country. Considering the importance of these valuations there is a need to conduct more such studies in protected areas located in different biogeographic zones of the country. The timeline, responsible parties and indicative budget for valuation assessment in select PAs have been given under Action 4.
Climate change resilience and adaptation assessment
Presently, no climate change resilience and adaptation assessment of the PA network in India has been done, mainly due to lack of technical capacity and availability of resources. Considering the role of PAs in both climate change resilience and adaptation efforts have been initiated, which need to strengthened and upscaled. The timeline, responsible parties and indicative budget for initiating climate change resilience and adaptation assessment studies in select PAs in the country have been given under Action 5.