indiana municipal power agency - in.gov · impa iurc summer 2015 capacity presentation indiana...
TRANSCRIPT

Indiana Municipal Power Agency
Raj Rao, President and CEO
Doug Buresh, Sr. Vice President, Planning and Operations
April 30, 2015

IMPA IURC SUMMER 2015 CAPACITY PRESENTATION
Presentation Topics
• Company Background
• Generation Resources
• EE and Renewable Energy
• EPA Rules
• 2015 Load/Resource Balance
• Summary
• Other Issues
2
IMPA IURC SUMMER 2015 CAPACITY PRESENTATION
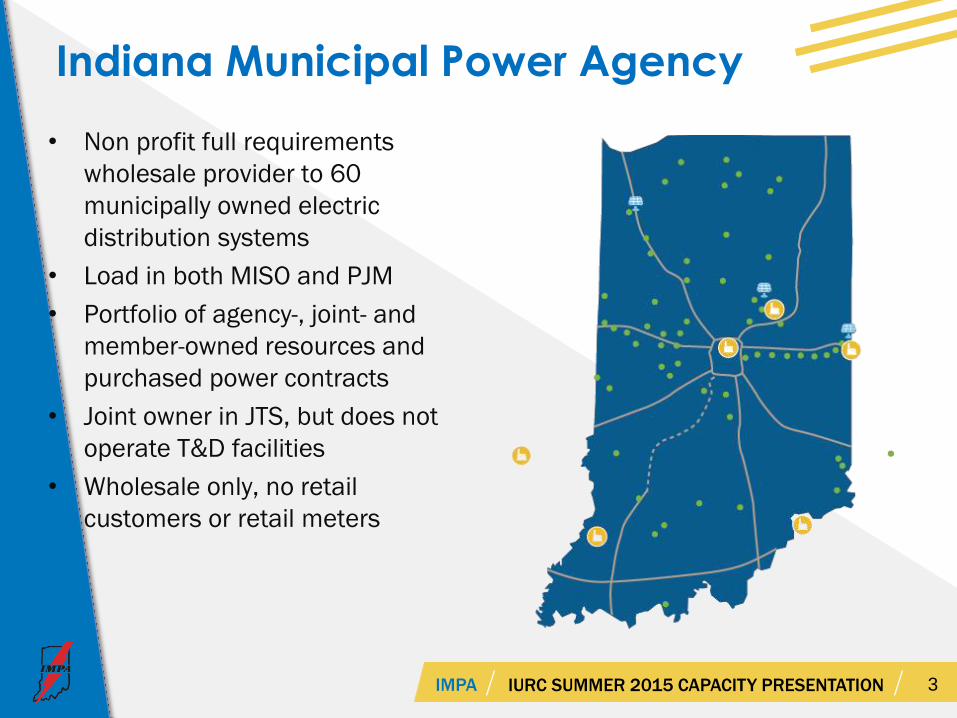
Indiana Municipal Power Agency
• Non profit full requirements
wholesale provider to 60
municipally owned electric
distribution systems
• Load in both MISO and PJM
• Portfolio of agency-, joint- and
member-owned resources and
purchased power contracts
• Joint owner in JTS, but does not
operate T&D facilities
• Wholesale only, no retail
customers or retail meters
3

IMPA IURC SUMMER 2015 CAPACITY PRESENTATION
Indiana Municipal Power Agency
• Governed by member utilities
• Member communities represent a population of approximately 335,000
• Member utilities governed by local councils and boards
4
IMPA IURC SUMMER 2015 CAPACITY PRESENTATION
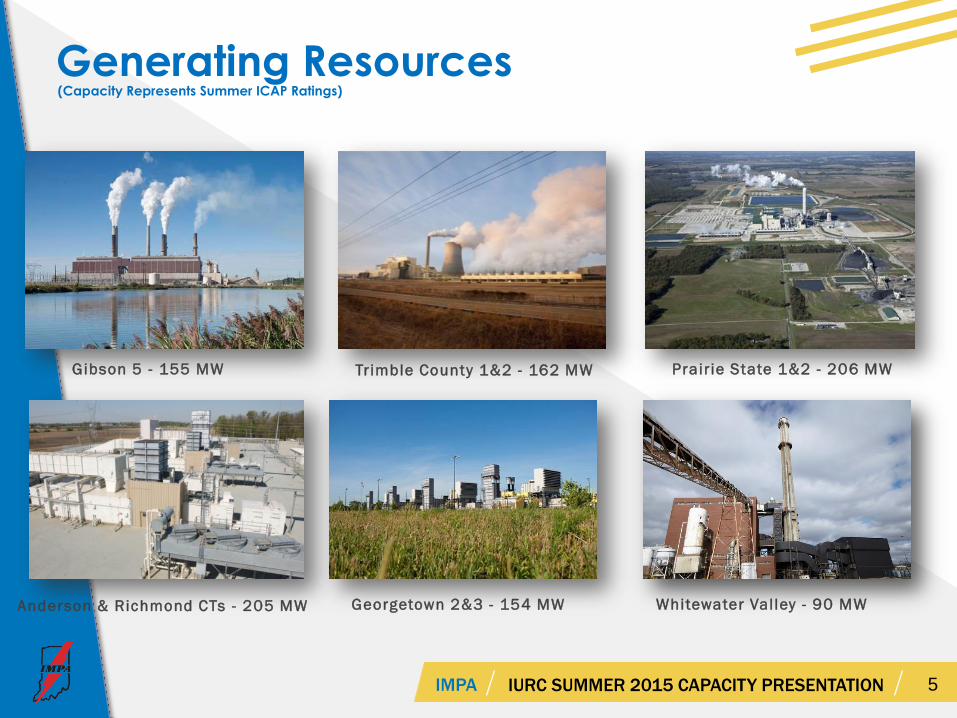
Generating Resources
5
Gibson 5 - 155 MW Trimble County 1&2 - 162 MW Prair ie State 1&2 - 206 MW
Anderson & Richmond CTs - 205 MW Georgetown 2&3 - 154 MW
(Capacity Represents Summer ICAP Ratings)
Whitewater Val ley - 90 MW

IMPA IURC SUMMER 2015 CAPACITY PRESENTATION
Energy Efficiency
• IMPA Energy Efficiency Program
• Residential Home Audit tools
• Residential High Efficiency HVAC, rebates for:
• High Efficiency Air to Air Heat Pumps and A/C (>16 SEER)
• Geothermal Heat Pumps (Closed >17.1 SEER, Open >21.2 SEER)
• Commercial and Industrial, prescriptive rebates for:
• Variable Frequency Drive (VFD) Pumps and Motors
• HVAC (Heat Pumps, AC and Chillers)
• Refrigeration, Food Service and Controls
• Lighting
6

IMPA IURC SUMMER 2015 CAPACITY PRESENTATION
Renewable Energy
• Wind PPA
• 50 MW
• Iowa Wind Farm
• Approximately 2.5% of IMPA energy requirements
• Small Solar facilities
• Solar facilities in service in Richmond, Frankton and Rensselaer, Indiana
• One MW each
• Six parks under development – 10 MW total
• Net Metering Tariff
• Green Power Program
7

IMPA IURC SUMMER 2015 CAPACITY PRESENTATION
EPA Rules - MATs
• In general, IMPA owned generation resources are well-situated
• Most of IMPA’s coal fired resources utilize state of the art systems to control
SO2 and NOx
• Gibson #5 (155 MW) will require the most extensive upgrades to comply
with MATS. The upgrades will consist of a combination of modifications to
the systems to control mercury, particulate, and HCl
• Trimble County #1 (65 MW) will require an upgrade to the particulate matter
control system to comply with MATS
• WWVS is installing DSI and PAC systems to comply with MATS
• Trimble County #2 (97 MW) and Prairie State #1 & #2 (206 MW) will not
require any modifications to comply
• IMPA CTs will not require any modifications to comply
8

IMPA IURC SUMMER 2015 CAPACITY PRESENTATION
2015 Balance of Loads and Resources
9
Load RequirementsIMPA Peak Demand Requirements
Resources – UCAPGibson #5Trimble County 1 & 2Prairie State 1 & 2WWVSPJM CTsMISO CTsMember Owned GenerationPurchased Power ContractsNet Market CapacityTotal Resources – UCAP
Required Reserves per (RTO Constructs)Actual Reserves
UCAP Reserve Margin
UCAP
1,238
149145154
89194147
16271179
1,344
73106
8.6%

IMPA IURC SUMMER 2015 CAPACITY PRESENTATION
Summer Readiness
• IMPA serves wholesale load in
both MISO and PJM
• 24 Hour market operations
center in Carmel, IN
• Back up operations center at
Anderson CT site
• All market operation
coordinators are PJM Certified
10
• In contact with balancing authorities to take appropriate action in case
of system emergencies

IMPA IURC SUMMER 2015 CAPACITY PRESENTATION
Conclusion
• IMPA is in compliance with MISO and PJM resource adequacy constructs
for the summer of 2015
• IMPA has sufficient resources to meet its member needs during the
summer of 2015
11

IMPA IURC SUMMER 2015 CAPACITY PRESENTATION
Other Issues
• IRP
12

IMPA IURC SUMMER 2015 CAPACITY PRESENTATION
IRP – Focus
• IRP is a useful tool that keeps utilities focused on their
future plans and the risks embedded in their portfolios
and/or markets
• 20 year planning horizon, filed every two years
• Given the frequency of filing, the immediate focus of the IRP
is 3-5 years
• The 3 year action plan is more actionable than the resources
the model selects in the outer years which could be 6 to 8
IRP filings away
• Goal is to develop robust plans under a variety of plausible
futures (scenario planning)
13

IMPA IURC SUMMER 2015 CAPACITY PRESENTATION
IRP – Portfolio Risk
• Due to the high correlation between so many variables,
single variable sensitivity analysis often produces misleading
results
• In IMPA’s 2013 IRP, stochastic analysis was performed
using 50 scenarios of correlated input variables
• Stochastic analysis is a useful tool to understand how the
portfolio behaves under different futures
• Using statistical analysis, individual variables can be isolated
to determine their relative impact on the portfolio’s risk –
Tornado Charts
14

IMPA IURC SUMMER 2015 CAPACITY PRESENTATION
IRP – Portfolio Risk
• For the 2015 IRP, IMPA will produce expansion plans under
several, likely 3 to 5, different visions of the future
• Base, Green, Deregulation, etc.
• These expansion plans will then be tested in the stochastic
analysis
• The relative bandwidth around the expected results provides
a good indicator of the risk in that expansion plan
• In theory, the expansion plan that performs “best” in
minimizing cost and risk is the preferred plan
15