indiana municipal power agency · 96,656 1,233,283 62,893 77,309 71,583 20,041 75,219 21,504 23,918...
TRANSCRIPT

Indiana Municipal Power AgencyConsolidated Interim Financial Statements
Six Months Ended June 30, 2017 and 2016 (Unaudited)
Indiana Municipal Power AgencyConsolidated Interim Financial StatementsSix Months Ended June 30, 2017 and 2016 (Unaudited)
Table of Contents
REPORT OF INDEPENDENT AUDITORS
FINANCIAL STATEMENTS: CONSOLIDATED STATEMENTS OF REVENUES, EXPENSES AND CHANGES IN NET POSITION
CONSOLIDATED STATEMENTS OF NET POSITION
CONSOLIDATED STATEMENTS OF CASH FLOWS
CONSOLIDATED INTERIM FINANCIAL STATEMENTS’ NOTES
1 - 2
3 - 6
3
4
5 - 6
7 - 19

REPORT OF INDEPENDENT AUDITORS
To the Board of Commissioners of Indiana Municipal Power Agency We have reviewed the accompanying consolidated interim financial information of Indiana Municipal Power Agency and its subsidiaries (the “Agency”), which comprise the consolidated statement of net position as of June 30, 2017, and the related consolidated statements of revenues, expenses and changes in net position and of cash flows for the six-month periods ended June 30, 2017 and 2016. Management’s Responsibility for the Consolidated Interim Financial Information The Agency’s management is responsible for the preparation and fair presentation of the consolidated interim financial information in accordance with accounting principles generally accepted in the United States of America; this responsibility includes the design, implementation, and maintenance of internal control sufficient to provide a reasonable basis for the preparation and fair presentation of the consolidated interim financial information in accordance with accounting principles generally accepted in the United States of America. Auditors’ Responsibility Our responsibility is to conduct our review in accordance with auditing standards generally accepted in the United States of America applicable to reviews of interim financial information. A review of interim financial information consists principally of applying analytical procedures and making inquiries of persons responsible for financial and accounting matters. It is substantially less in scope than an audit conducted in accordance with auditing standards generally accepted in the United States of America, the objective of which is the expression of an opinion regarding the financial information taken as a whole. Accordingly, we do not express such an opinion. Conclusion Based on our review, we are not aware of any material modifications that should be made to the accompanying consolidated interim financial information for it to be in accordance with accounting principles generally accepted in the United States of America.
1

Other Matter We previously audited, in accordance with auditing standards generally accepted in the United States of America, the consolidated statement of net position of Indiana Municipal Power Agency and its subsidiaries as of December 31, 2016, and the related consolidated statements of revenues, expenses, and changes in net position and of cash flows for the year then ended (not presented herein), and in our report dated March 24, 2017, which included a paragraph with respect to the limited procedures we performed over the required supplemental information and the omission of certain required supplemental information, we expressed an unmodified opinion on those consolidated financial statements. In our opinion, the information set forth in the accompanying consolidated statement of net position as of December 31, 2016, is consistent, in all material respects, with the audited consolidated statement of net position from which it has been derived.
PricewaterhouseCoopers LLP Columbus, Ohio September 15, 2017
2

3
INDIANA MUNICIPAL POWER AGENCYCONSOLIDATED STATEMENTS OF REVENUES, EXPENSES AND CHANGES IN NET POSITION (Unaudited)(in thousands)
Operating Revenues Sales to municipalities Other revenues Total Operating Revenues
Operating Expenses Purchased power Fuel Production Transmission and local facilities Other operating Maintenance Depreciation Future recoverable costs Total Operating Expenses
Operating Income
Non-Operating Expenses (Income) Interest expense on revenue bonds Accretion of premiums received on debt Interest income Other non-operating income Total Non-Operating Expenses (Income)
Increase in Net PositionNet Position at Beginning of YearNet Position at June 30
$
$
$
$
2017 2016For the Six Months Ended June 30,
The accompanying notes are an integral part of the above statements.
216,8062,261
219,067
79,65833,91313,88417,973
6,03411,77722,745(5,189
180,795
38,272
28,565(3,079
(2661,716
26,936
11,336271,553282,889
))
201,7252,567
204,292
68,49630,85913,10420,226
6,60311,48221,837(1,140
171,467
32,825
28,028(3,200
(790(864
23,174
9,651299,859309,510
))
)))

4
INDIANA MUNICIPAL POWER AGENCYCONSOLIDATED STATEMENTS OF NET POSITION (in thousands)
AssetsUtility Plant Utility plant in service Less: accumulated depreciation
Construction work in progress Total Utility Plant, Net
Long-Term Investments
Restricted Cash and Cash Equivalents
Current Assets Unrestricted cash and cash equivalents Short-term investments Municipality accounts receivable Fuel stock and material inventory Other current assets Total Current Assets
Deferred Outflows Regulatory assets Other Total Deferred Outflows Total Assets
Net Position and LiabilitiesNet Position Net investment in capital assets Restricted Unrestricted Total Net Position
Non-Current Liabilities Long-term revenue bonds, net Other non-current liabilities Total Non-Current Liabilities
Current Liabilities Current maturities of revenue bonds Accounts payable Accrued interest on revenue bonds Accrued liabilities Total Current Liabilities
Deferred Inflows of Resources
Total Net Position and Liabilities
$
$
$
$
(Unaudited)June 2017 December 2016
The accompanying notes are an integral part of the above statements.
$
$
$
$
1,598,201(450,781
1,147,42078,667
1,226,087
45,733
106,671
93,00818,01272,69219,84819,429
222,989
87,50849,250
136,7581,738,238
(84,785133,401251,243299,859
1,285,28724,465
1,309,752
25,58539,46928,01826,558
119,630
8,997
1,738,238
)
)
1,608,981(472,354
1,136,62796,656
1,233,283
62,893
77,309
71,58320,04175,21921,50423,918
212,265
88,38960,255
148,6441,734,394
(47,622121,714235,418309,510
1,254,84532,930
1,287,775
26,06026,37927,74146,140
126,320
10,789
1,734,394
)
)
5
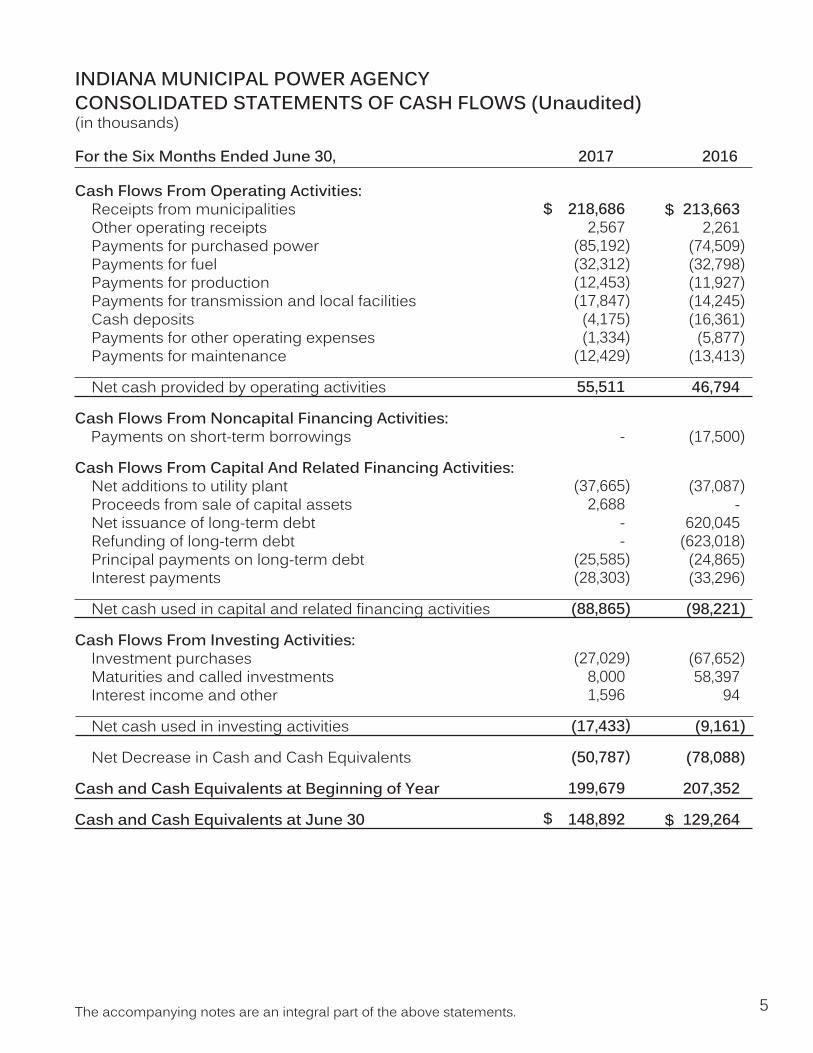
INDIANA MUNICIPAL POWER AGENCYCONSOLIDATED STATEMENTS OF CASH FLOWS (Unaudited)(in thousands)
Cash Flows From Operating Activities: Receipts from municipalities Other operating receipts Payments for purchased power Payments for fuel Payments for production Payments for transmission and local facilities Cash deposits Payments for other operating expenses Payments for maintenance
Net cash provided by operating activities
Cash Flows From Noncapital Financing Activities: Payments on short-term borrowings
Cash Flows From Capital And Related Financing Activities: Net additions to utility plant Proceeds from sale of capital assets Net issuance of long-term debt Refunding of long-term debt Principal payments on long-term debt Interest payments Net cash used in capital and related financing activities
Cash Flows From Investing Activities: Investment purchases Maturities and called investments Interest income and other
Net cash used in investing activities
Net Decrease in Cash and Cash Equivalents
Cash and Cash Equivalents at Beginning of Year
Cash and Cash Equivalents at June 30
$
$
2017 2016For the Six Months Ended June 30,
The accompanying notes are an integral part of the above statements.
$
$
213,6632,261
(74,509(32,798(11,927(14,245(16,361
(5,877(13,413
46,794
(17,500
(37,087-
620,045(623,018
(24,865(33,296
(98,221
(67,65258,397
94
(9,161
(78,088
207,352
129,264
)))))))
)
)
)))
)
)
)
)
218,6862,567
(85,192(32,312(12,453(17,847
(4,175(1,334
(12,429
55,511
-
(37,6652,688
--
(25,585(28,303
(88,865
(27,0298,0001,596
(17,433
(50,787
199,679
148,892
)))))))
)
))
)
)
)
)

6
Reconciliation of Operating Income to Net Cash Providedby Operating Activities: Operating Income Adjustments to reconcile operating income to net cash provided by operating activities: Depreciation Future recoverable costs Changes in current assets and liabilities: Municipality accounts receivable Fuel stock and material inventory Accounts payable Other
Net Cash Provided by Operating Activities
INDIANA MUNICIPAL POWER AGENCYCONSOLIDATED STATEMENTS OF CASH FLOWS (Unaudited)(in thousands)
2017 2016For the Six Months Ended June 30,
$
$
$
$
38,272
22,745(5,189
(13,7431,0525,657
(2,000
46,794
)
)
)
The accompanying notes are an integral part of the above statements.
32,825
21,837(1,140
(2,527(1,656
(11,33017,502
55,511
)
)))

7
INDIANA MUNICIPAL POWER AGENCYCONSOLIDATED INTERIM FINANCIAL STATEMENTS’ NOTES
1. Organization and Significant Accounting PoliciesOrganization and OperationsIndiana Municipal Power Agency (IMPA or the Agency) is a body corporate and politic and a political subdivision of the State of Indiana. IMPA was created in June of 1980 by a group of municipalities for the purpose of jointly financing, developing, owning and operating electric generation and transmission facilities appropriate to the present and projected energy needs of its participating members. IMPA serves 60 Indiana cities and towns and one Ohio village. IMPA sells power to its members under long-term power sales contracts. The members resell the power to retail customers within their respective municipal service territories. IMPA’s owned generating capacity is 962 megawatts (MW) or 80% of IMPA’s 2016 peak demand (IMPA’s maximum year-to-date hourly load). The remainder of IMPA’s power is purchased from other utilities under long-term contracts with varying terms and expiration dates. Power is delivered to members through an integrated transmission system known as the Joint Transmission System (JTS), jointly-owned by IMPA, Duke Energy Indiana, Inc. (DEI), Duke Energy Ohio, Inc. (DEO), and Wabash Valley Power Association (WVPA); and, transmission service arrangements with other utilities and regional transmission organizations.
IMPA Service Corp was created by the Agency as a not-for-profit corporation to provide cost-effective services beyond power supply and transmission to members and other municipal utilities.
Principles of ConsolidationThe consolidated financial statements include the accounts of the Agency and its affiliate, IMPA Service Corp. All significant intercompany account balances and transactions have been eliminated in consolidation.
Basis of PresentationThe Agency substantially follows the Uniform System of Accounts prescribed by the Federal Energy Regulatory Commission (FERC). The accompanying consolidated financial statements are prepared on the accrual basis of accounting in accordance with accounting principles generally accepted in the United States of America (US GAAP). IMPA has chosen the option to implement all Financial Accounting Standards Board (FASB) pronouncements that do not conflict with or contradict Governmental Accounting Standards Board (GASB) pronouncements.
Certain information and disclosures normally included in financial statements and notes have been condensed or omitted. These consolidated interim financial statements should be read in conjunction with the financial statements and notes included in IMPA’s Audited Financial Statements for the year ended December 31, 2016.

8
The accompanying consolidated interim financial statements are unaudited, but reflect all adjustments, consisting of normal recurring adjustements, that, in the opinion of management, are necessary for fair presentation of the financial statements. The preparation of financial statements in conformity with GAAP requires management to make periodic estimates and assumptions that affect the reported amounts of assets, liabilities, revenues and expenses and disclosure of contingent assets and liabilities. Actual results could differ from these estimates. IMPA has evaluated the events and transactions for potential recognition or disclosure through September 15, 2017, the issuance date of the interim financial statements.
Utility PlantAt June 30, 2017 and December 31, 2016, construction work in progress (CWIP) included construction costs for ongoing utility plant capital improvements.
Employee Benefit PlanIMPA maintains a 401(k) plan on behalf of all employees meeting certain eligibility requirements regarding length of employment, age and employee contributions.
Sale of Solar ParkDuring 2017, IMPA entered into an agreement whereby the Agency sold the recently constructed Anderson 1 Solar Park. Under the agreement, IMPA received a cash payment of approximately $2.7 million and a prepaid purchase power agreement for substantially all of the output from the solar park for 25 years. The agreement provides IMPA the option to buy back the solar park at 5 ½ years after commercial operation. The prepaid purchase power agreement is included in Other Deferred Outflows on the Consolidated Statements of Net Position.
Committed Line of CreditAt June 30, 2017 and December 31, 2016, IMPA had a committed line of credit agreement (Credit Agreement) with PNC Bank in the amount $75.0 million. At June 30, 2017 and December 31, 2016, $14.0 million and $9.0 million, respectively, of the Credit Agreement was posted as letters of credit.
Revenue Recognition and RatesRevenues are recognized on an accrual basis when energy is delivered, while the members are billed using budgeted rates. Differences between the accrued rate and the billed rate are collected from or returned to the communities via a tracker in subsequent periods. The amount to be returned to members (a regulatory liability) at June 30, 2017 and December 31, 2016 was $39.6 million and $20.1 million, respectively. These regulatory liabilities are included in accrued liabilities in the consolidated statements of net position.
Regulatory Assets and Deferred Inflows of ResourcesIn accordance with GASB Statement No. 62, “Codification of Accounting and Financial Reporting Guidance” (GASB 62), IMPA’s consolidated financial statements reflect the rate making actions of the Board of Commissioners that result in the recognition of revenues and expenses in different time periods than entities that are not rate regulated.

9
At June 30, 2017 and December 31, 2016, regulatory assets and deferred inflows of resources consist of the following (in thousands):
Regulatory AssetsDebt service net of related depreciation and amortizationNet valuation of financial instrumentsTotal
$
$
$
$
June 2017 December 2016
Deferred Inflows of ResourcesReserve for contingenciesValuation of inventoriesTotal
$
$
$
$
2017 2016
Income TaxesIMPA, as a political subdivision of the State of Indiana, is exempt from federal and state income taxes. ISC, Inc. qualifies for income tax exemption as a public charity and additionally qualifies for income exclusion under Internal Revenue Code Section 115.
Adoption of Accounting PronouncementsDuring 2017, the GASB issued Statement No. 87, “Leases” (GASB 87). GASB 87 is effective for reporting periods beginning after December 15, 2019. GASB 87 establishes a single model for lease accounting whereby leases are financings of the right to use an underlying asset. The Agency has early adopted GASB 87 retroactively for the period ending June 30, 2017. IMPA has certain office equipment that it leases, however, the impact of adopting GASB 87 for the periods ending prior to June 30 is immaterial. No changes were made to the financial statements for the periods ending prior to June 30 as a result of adopting GASB 87.
2. Cash, Cash Equivalents and InvestmentsA Board policy governs IMPA’s investments and deposits. IMPA’s authorized investments include money market funds, federal agencies, investment contracts, US treasuries, commercial paper and repurchase agreements if the instruments meet certain minimum rating requirements.
During the six months ended June 30, 2017 and 2016, IMPA recorded a net increase in the fair value of investments of $0.2 million and a net increase in the fair value of investments of $0.2 million, respectively.
6,4512,5468,997
83,1244,384
87,508
84,4403,949
88,389
8,2632,526
10,789

10
At June 30, 2017 and December 31, 2016, the original cost and the estimated fair values of the Agency’s cash, cash equivalents and investments were as follows (in thousands):
U.S. Government agencies consist solely of mortgage-backed securities which are backed by the full faith and credit guaranty of the United States’ government. All long-term investments mature in less than five years.
INVESTMENT TYPELong-Term Investments:Restricted: U.S. Government AgenciesTotal Long Term Investments
2017 2016
Cash and Cash Equivalents:RestrictedUnrestrictedTotal Cash and Cash Equivalents
$ $
Cost CostEstimatedFair Value
EstimatedFair Value
Short-Term Investments:Restricted: U.S. Government AgenciesTotal Short-Term InvestmentsTotal $ $
$ $
$ $
46,53146,531
45,73345,733
106,67193,008
199,679
106,67193,008
199,679
18,15218,152
264,362
18,01218,012
263,424
63,28463,284
62,89362,893
77,30971,583
148,892
77,30971,583
148,892
20,32920,329
232,505
20,04120,041
231,826

11
At June 30, 2017 and December 31, 2016, the Agency’s cash, cash equivalents and investments were restricted as follows (in thousands):
3. Net PositionAt June 30, 2017 and December 31, 2016, the Agency’s net position included the following components (in thousands):
FUNDUnrestricted:
Restricted by Board: Rate Stabilization Fund Other Board RestrictedRestricted by Bond Resolution: Debt Service Reserve Fund Debt Service Account Construction
Other Restricted:Total
2017 2016
$
$
$
$
Cost CostEstimatedFair Value
EstimatedFair Value
$
$
$
$
Net investment in capital assetsRestricted for debt serviceRestricted for debt service reserveRestricted for bond financed construction projectsRestricted by Board resolutionUnrestrictedTotal
$
$
$
$
2017 2016)
93,008
22,67312,630
78,37354,085
3,417
176264, 362
93,008
22,50212,630
77,60654,085
3,417
176263,424
(84,78526,06877,606
3,41726,310
251,242299,858
71,583
23,64217,547
78,35841,252
-
123232,505
71,583
23,53817,547
77,78341,252
-
123231,826
)(47,62213,51177,783
-30,420
235,418309,510

12
4. Hedging TransactionsDuring the six months ended June 30, 2017, IMPA recorded a net decrease in the fair value of energy market hedging transactions of $3.0 million. The following tables provide information related to IMPA’s outstanding energy market hedging transactions as of June 30, 2017 and December 31, 2016 (in thousands).
Trade DateRange Duration
NotionalAmount(MWhs)
Ending Fair Value
June 30, 2017
Classification AmountJan 2015 thru
Oct 2016Jan 2015 thru
Oct 2016Dec 2014 thru
Mar 2017Feb 2016 thru
Mar 2017
Jul 2017 thruJun 2018
Jul 2017 thruMar 2018
Jul 2018 thruDec 2026
Jul 2018 thruAug 2026
Accrued liabilities
Other current assets
Other non-current liabilities
Deferred outflows
Trade DateRange Duration
NotionalAmount(MWhs)
Ending Fair Value
December 31, 2016
Classification Amount
$
$
675
300
6,000
2,2259,200
$
$
Jan 2015 thruOct 2016
Jan 2015 thruOct 2016
Dec 2014 thruOct 2016
Dec 2014 thruOct 2016
Mar 2017 thruDec 2017
Jan 2016 thruOct 2017
Mar 2018 thruDec 2021
Jan 2018 thru Aug 2019
Accrued liabilities
Other current assets
Other non-current liabilities
Deferred outflows
600
675
2,300
2503,825
(1,011
844
(8,266
432(8,001
)
)
)
(1,334
433
(12,993
2,916(10,978
)
)
)

13
CommitmentsBased on IMPA’s participation in certain energy market commodity futures exchanges, IMPA was required to post collateral of $11.3 million and $13.8 milllion as of June 30, 2017 and December 31, 2016, respectively.
5. Long-Term Revenue BondsIMPA issues Power Supply System Revenue Bonds to finance its acquisition and construction of utility plant. Long-term revenue bonds issued and outstanding at June 30, 2017 and December 31, 2016, consist of the following (in thousands):
Bond Series
OptionalRedemption
DateJanuary 1, 2017 2016Interest Rates
Due DateJanuary 1,
$
$
1998 Series A2007 Series B2009 Series A2009 Series C2010 Series A2010 Series B2011 Series A2012 Series A2013 Series B2014 Series A2015 Series A2016 Series A2016 Series B2016 Series C
Less current maturitiesLong-term revenue bondsUnamortized premium, net
20212022202220232025
March 10, 20172026
2027
Variable5.800%
-7.350%5.594%5.000%5.000%
4.000% - 5.000%3.000% - 5.250%
5.000%Variable
4.000% - 5.000%Variable5.000%
20182019 to 2022
(1)
2019 to 20242031 to 20422020 to 20232017 to 20422017 to 20282017 to 20422019 to 20322017 to 20422033 to 20422029 to 20312018 to 2039
$
$
25,14520,125
1,41016,035
123,64020,23583,20546,790
108,400167,730
40,000366,350
24,225148,285
1,191,575(25,585
1,165,990119,297
1,285,287
(1) Final maturity January 1, 2017
12,82020,125
-16,035
123,64020,23578,34542,200
106,905167,730
39,095366,350
24,225148,285
1,165,990(26,060
1,139,930114,915
1,254,845
) )

14
The 2007 Series B Bonds and 2009 Series C Bonds are non-callable. The 1998 Series A Bonds and the 2016 Series B Bonds are currently callable at a redemption price of 100%. The 2010 Series A Bonds are designated as direct payment Build America Bonds and have make-whole optional redemption and extraordinary optional redemption provisions. All other bonds are callable on or after the optional redemption date at a redemption price of 100%. Debt service requirements based on contractual maturities at June 30, 2017 were as follows (in thousands):
Long-term revenue bond activity for six months ended June 30, 2017 and the 12 months ended December 31, 2016 was as follows (in thousands):
201820192020202120222023 - 20272028 - 20322033 - 20372038 - 2041
$
$
$
$
Principal Interest
June 30, 2017Long-term revenue bondsLess: Current maturities Unamortized premium, net
BeginningBalance
EndingBalance
$
$
$
$
Additions$
$
$
$
Reductions
26,06025,87527,21528,59530,095
169,885216,860281,785359,620
1,165,990
58,38557,25055,90554,52553,020
240,306193,716133,789
56,720903,616
December 31, 2016Long-term revenue bondsLess: Current maturities Unamortized premium, net
$
$
BeginningBalance Additions Reductions
EndingBalance
$
$
$
$
$
$
1,262,615
(24,86550,080
1,287,830
(609,900
(25,585(11,969
(647,454
538,860
24,86581,186
644,911
1,191,575
(25,585119,297
1,285,287
)
)
) ))
)
1,191,575
(25,585119,297
1,285,287
(25,585
(26,060(4,382
(56,027
-
25,585-
25,585
1,165,990
(26,060114,915
1,254,845
)
)
) ))
)

15
Debt Service CoverageThe IMPA Power Supply System Revenue Bond Resolution (Resolution) contains covenants that require IMPA to collect through rates 1.1 times the current year’s accrued aggregate debt service. For the 12 months ended June 30, 2017 and December 31, 2016, debt service coverage was 1.30 and 1.33 times, respectively. Management believes that IMPA is in compliance with all financial debt covenants and restrictions as of June 30, 2017.
1998 Series A Variable Rate BondsThe 1998 Series A Bonds are secured by an irrevocable transferable direct-pay letter of credit (“Letter of Credit”) issued for the benefit of the owners of the 1998 Series A Bonds. The interest rate on the 1998 Series A Bonds is adjusted weekly, and bondholders may require repurchase of the 1998 Series A Bonds at the time of such interest rate adjustments. Through the Letter of Credit, the Agency has right of direct offset with its lender for any repurchases. These bonds have a contractual maturity of January 1, 2018 and the Letter of Credit is scheduled to expire on January 2, 2018. The variable interest rate is adjusted weekly by the remarketing agent to reflect current market rates. The interest rate at June 30, 2017 on the 1998 Series A Bonds was 0.92%.
2015 Series A Multimodal (Variable) BondsThe 2015 Series A Multimodal Bonds (the “2015 Series A Bonds”) are a direct purchase agreement between IMPA and Citibank N.A. (“Citibank”) with an initial put date of March 10, 2020. The 2015 Series A Bonds are not secured by a Letter of Credit. The 2015 Series A Bonds will mature January 1, 2042. In the current mode, the interest rate on the 2015 Series A Bonds is adjusted weekly and Citibank may only require repurchase if certain terms of default occur. The interest rate on the 2015 Series A Bonds was 1.31% at June 30, 2017.

16
2016 Series B Variable Rate BondsThe 2016 Series B Bonds are secured by an irrevocable transferable direct pay letter of credit (“Letter of Credit”) issued for the benefit of the owners of the 2016 Series B Bonds. The interest rates on the 2016 Series B Bonds is adjusted daily, and bondholders may require repurchase of the 2016 Series B bonds at the time of such interest rate adjustments. Through the Letter of Credit, the Agency has the right of direct offset with its lender for any repurchases. These bonds have a contractual maturity of January 1, 2032. The Letter of Credit has a contractual maturity of December 1, 2020. The interest rate at June 30, 2017 on the 2016 Series B Bonds was 0.93%.
6. Fair Value of Financial InstrumentsFair value of financial instruments at June 30, 2017 and December 31, 2016 were as follows (in thousands):
June 30, 2017
Assets: Money market funds Debt securities Purchase power futures
Liabilities: Purchase power futures
Level 1 Total
$
$
$$
$
$
$$
Level 2
$
$
$$
December 31, 2016
Assets: Money market funds Debt securities Purchase power futures
Liabilities: Purchase power futures
Level 1 Total
$
$
$$
$
$
$$
Level 2
$
$
$$
152,877--
152,877
--
-63,745
1,27665,021
9,2779,277
152,87763,745
1,276217,898
9,2779,277
118,472--
118,472
--
-82,934
3,34986,283
14,32714,327
118,47282,934
3,349204,755
14,32714,327

17
Production Gibson Unit 5 Prairie State Units 1 & 2 Trimble County Units 1 & 2Transmission and local facilities
189,420752,921299,565127,854
Utility PlantIn Service
99,13398,93598,26949,451
AccumulatedDepreciation
24.95%12.64%12.88%
4.91%
Ownership Share
$$
20172016
804(8,000
BeginningBalance
LiabilitiesIncurred
Cash FlowRevisions
15,38922,805
--
16,45115,389
EndingBalance
(67(357
325941
LiabilitiesSettled Accretion
$$
$$
))
7. Asset Retirement ObligationsThe following table presents the details of the Agency’s asset retirement obligations for the six months ended June 30, 2017 and the twelve months ended December 31, 2016 (in thousands):
The 2016 asset retirement obligations cash flow revisions are primarily a result of the United States Environmental Protection Agency’s final Disposal of Coal Combustion Residuals (CCR) from Electric Utilities rule published in the Federal Register on April 17, 2015. The revisions reflect changes in planning and timing for Trimble County’s and Gibson’s existing CCR disposal sites.
8. Concentration of RiskApproximately 28% of the Agency’s sales to municipalities were provided to two communities for the six months ended June 30, 2017 and 2016, respectively. Accounts receivable balances for the two communities account for 29% of the total accounts receivable balances as of June 30, 2017 and December 31, 2016, respectively. IMPA has long-term energy purchase contracts with two suppliers that account for approximately 33% and 34% of IMPA’s total energy for the six months ended June 30, 2017 and 2016, respectively. 9. Jointly-Owned PlantIMPA’s investments in jointly-owned plant at June 30, 2017 were as follows (in thousands):
The determination of the above fair value measures takes into consideration various factors required under the fair value measurement standard. These factors include nonperformance risk, including counterparty credit risk and the impact of credit enhancements (such as cash deposits, line of credit and priority interests). The impact of nonperformance risk was immaterial in the fair value measurements.
)

18
10. Commitments and ContingenciesContracts and Capital ExpendituresIMPA has purchased power contracts with several power producers. IMPA has firm commitments under take-or-pay contracts which expire on or before April 1, 2042. The total amount of these future purchase obligations at June 30, 2017 is approximately $2.4 billion through April 1, 2042.
IMPA anticipates its share of future capital expenditures for Gibson Unit 5, Prairie State Units 1 and 2, Trimble County Units 1 and 2, combustion turbines, the JTS and other ongoing system projects to total approximately $313 million for the years 2018 through 2022. The projected capital expenditures include both environmental improvements and expenditures of a normal and recurring nature. IMPA anticipates funding the foregoing projected capital improvements with a combination of internally generated funds and proceeds from future debt offerings.
Environmental Protection Agency Matters The Cross State Air Pollution Rule and the Cross State Air Pollution Update RuleThe Cross State Air Pollution Rule (CSAPR) aims to reduce emissions of SO2 and NOx from electric generating units greater than 25 MW in the eastern half of the United States by controlling 28 upwind states from preventing downwind states from reaching their emission reduction goals for particulate matter (PM2.5) and ozone standards. The proposed Cross State Air Pollution Update Rule (CSAPR Update Rule) would further reduce emissions of NOx from generating units in 23 states, including Indiana, Illinois and Kentucky. IMPA expects that the Agency will have to acquire SO2 and NOx emission allowances in order to comply with CSAPR, but there will be no material impact on IMPA’s generating facilities. The full impacts of the proposed CSAPR Update Rule on IMPA’s generating units are not yet known.
The Mercury and Air Toxics StandardsThe Mercury and Air Toxics Standards (MATS) rule sets emission limits for hazardous air pollutants (HAPS), including mercury, particulate matter (PM), and hydrochloric acid (HCl)for electric generating units greater than 25 MW. All of IMPA’s units comply with MATS. While litigation on the rule continues, IMPA does not expect there to be any material changes to the rule that would cause more capital additions.
The Clean Power PlanThe Clean Power Plan (CPP) rule seeks to reduce CO2 emissions from electric generating units by 32 percent below 2005 levels by 2030. In February 2016, the U.S. Supreme Court issued a stay of the CPP, allowing the D.C. Circuit to review challenges to the rule. In May 2017, the EPA asked the D.C. Circuit to indefinitely suspend litigation over the CPP and the EPA is currently in the rulemaking process of reviewing the rule. The EPA is initiating its review of the CPP pursuant to President Trump’s Executive Order on Energy Independence, signed on March 28, 2017.

19
Contract DisputesIn the normal course of business, IMPA may be involved in various disputes with other parties. While management cannot predict the ultimate outcome of these disputes, total exposure as of the report issuance date is not material to IMPA’s financial position or results of operations.