indian vegetable sector- an overview
TRANSCRIPT

www.theinternationaljournal.org > RJEBS: Volume: 03, Number: 3, January-2014 Page 36
Indian Vegetable Sector- An overview
Prasanna Kumar H. M,
Department of Agriculture, Karnataka, India
Introduction:
India is the World’s second most populous country (1.21bn out of 6.84 billion (World Development
Indicators, 2012). India covers nearly 3.29 million square km (2.4% of the world land area). Totally
we say 15% of the global population and nearly one-third of India’s population is under the age of 15
(Johnson et al. 2008). India has inherent natural advantages; the performance of agriculture and allied
sectors has been slow and volatile, but agriculture still supports nearly 65% of the population in the
state and its share in the state GDP has been declining fast.
India is endowed with a wide variety of agro climatic conditions and enjoys an enviable position in the
horticultural map of the world. Almost all types of horticultural crops can be grown in one region or
the other. With its wide variability of climate and soil, has good potential for growing a wide range of
horticultural crops such as fruits, vegetables, potato, tropical tuber crops and mushrooms, ornamental
crops; medicinal and aromatic plants, spices and plantation crops like coconut, cashew nut, cocoa, etc.
India is the second largest producer
Fig 1: Per cent share of major producing countries in the world
Source: FAO Website; NHB2010
As per FAO Website, Preliminary 2009 Data Available for Selected Countries and Products as on
18.03.2011, therefore, figures are for 2008 (however Figures for India are for 2009-10)
of both fruits and vegetables. Total production of fruits has been estimated at 71516 thousand MT
from 6329 thousand ha. Vegetables occupy an area of 7985 thousand ha with a production of 133738
thousand MT. Our share in world production in fruits and vegetables is 11 and 14 per cent,
respectively (IHD 2010).
Horticulture today, is not merely a means of diversification but forms an integral part of food and
nutritional security, as also an essential ingredient of economic security. Adoption of horticulture, both
by small and marginal farmers, has brought prosperity in many regions of the country, of which,
Maharashtra, Karnataka, Andhra Pradesh and Kerala are prime examples (NAAS, 2001).
The Indian government identified horticulture crops as a means of diversification for making
agriculture more profitable through efficient land use, optimum utilisation of natural resources and
creating skilled employment for rural masses, especially women folk with the past efforts rewarding.
India is the largest producer of cashew, coconut and spices, with a total area of 868.0 thousand ha,
China 47%
India 14%
USA 4%
Turkey 3%
Egypt 2%
Iran 2%
Russian fed 1%
Italy 1%
Spain 1%
Mexico 1%
Rep of Korea 1%
Others 23%

www.theinternationaljournal.org > RJEBS: Volume: 03, Number: 3, January-2014 Page 37
1903.2 thousand ha and 2617.0 thousand ha respectively. Apart, demand for chilly as a spice and its
oleoresins as a natural colouring material is growing in the domestic as well as international market.
Chilli occupy the highest share of 30 per cent and garlic in second position of 20.8 per cent and third is
Turmeric has a share of 19.8 per cent in the total production of spices. Other than tea, coffee and
rubber, rest of the crops which are grown for commercial purpose in the country are covered under
plantation crops which include coconut, areca nut, cashew nut, cocoa, etc.
Source: APEDA March 2011, NHB 2010.
Fig 2: Per cent share of major Horticulture crops (2009-10)
Despite of the advantages, identifies number of constraints in vegetable production. The risk bearing in
the production are massive, because of substantial production losses caused by pests and diseases.
These are estimated to be about 30 per cent of the total vegetable output. The post-harvest losses are
also quite high due to their perishable nature, lack of infrastructure and marketing facilities to
agricultural produce. Local markets system and trading in distant markets is non-remunerative due to
high transportation costs. Also, prices are volatile and often fall drastically with harvesting of normal
production of vegetables (Sant et al., 2004).
This paper typically presents vision of the vegetable sector in India in terms of consumption,
production, and marketing; describe demand and supply of vegetables in India; presents the major
constraints in the growth of vegetable sector, which is followed by discussions relating to vegetable
export. And, finally the main conclusions and policy suggestions are summarized.
Demand and Supply of Vegetables
Demand for Vegetables
The food preparation of India, and much of South Asia, is noted for its use of spices in a range of
dishes, generally called as a curry. India’s long history of vegetarianism is a strong influence. The
horticulture growth is focused by consumer wants and the requirement for farmers to enhance incomes
through high-value crops. In India between 1983 and 1999/00, per capita availability of vegetables has
doubled, but consumption of cereal has declined by 10% (Birthal et al., 2007).
Table 1: per capita monthly consumption of food items in rural and urban India
Food item 2004-05 1993-94
Rural Urban Rural Urban
rice (kg) 6.38 4.71 6.79 5.13
wheat/ atta (kg) 4.19 4.36 4.32 4.44
arhar dal (kg) 0.21 0.3 0.24 0.33
moong dal (kg) 0.09 0.11 0.1 0.13
F & V Seeds 2%
Fresh Onions 30%
Wall nuts 2%
Mango pulp 10% Fresh Magos
3%
Fresh Grapes 7%
Dried and Preserved Vegetables
7%
Other ProcessedF & V
19%
Other Fresh Vegetables
9%
Flouriculture 4%
Other fresh fruits
7%
www.theinternationaljournal.org > RJEBS: Volume: 03, Number: 3, January-2014 Page 38
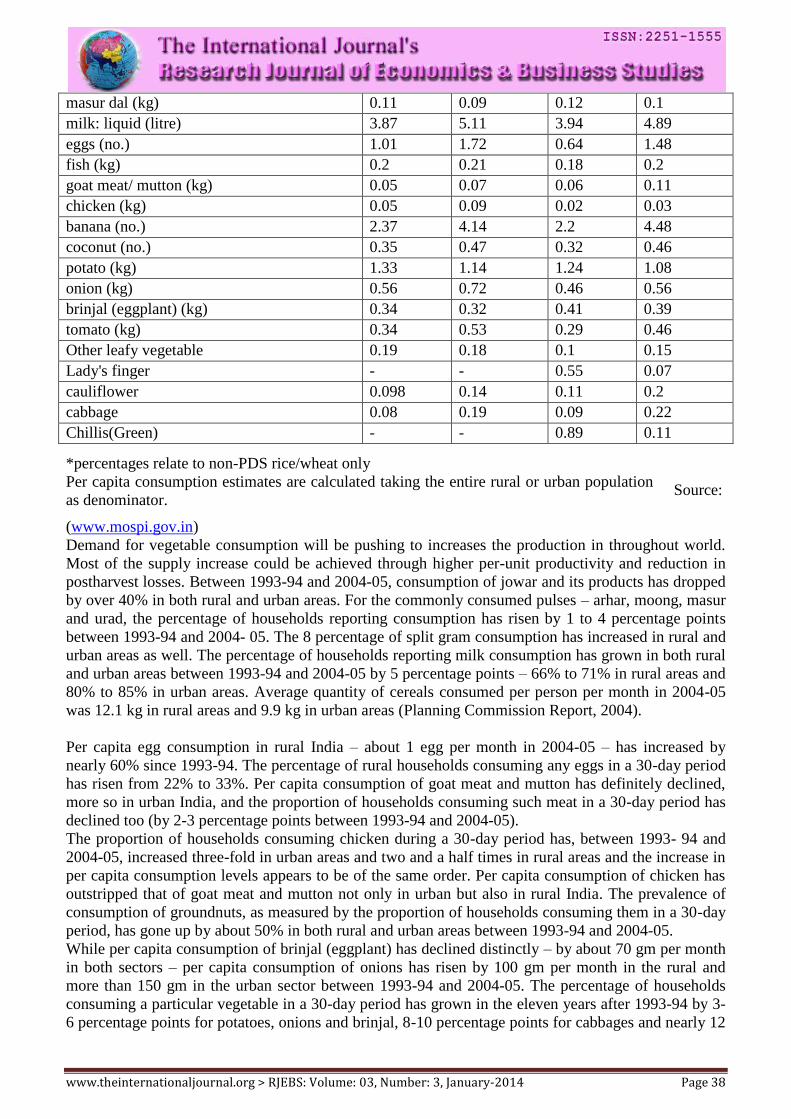
masur dal (kg) 0.11 0.09 0.12 0.1
milk: liquid (litre) 3.87 5.11 3.94 4.89
eggs (no.) 1.01 1.72 0.64 1.48
fish (kg) 0.2 0.21 0.18 0.2
goat meat/ mutton (kg) 0.05 0.07 0.06 0.11
chicken (kg) 0.05 0.09 0.02 0.03
banana (no.) 2.37 4.14 2.2 4.48
coconut (no.) 0.35 0.47 0.32 0.46
potato (kg) 1.33 1.14 1.24 1.08
onion (kg) 0.56 0.72 0.46 0.56
brinjal (eggplant) (kg) 0.34 0.32 0.41 0.39
tomato (kg) 0.34 0.53 0.29 0.46
Other leafy vegetable 0.19 0.18 0.1 0.15
Lady's finger - - 0.55 0.07
cauliflower 0.098 0.14 0.11 0.2
cabbage 0.08 0.19 0.09 0.22
Chillis(Green) - - 0.89 0.11
Source:
(www.mospi.gov.in)
Demand for vegetable consumption will be pushing to increases the production in throughout world.
Most of the supply increase could be achieved through higher per-unit productivity and reduction in
postharvest losses. Between 1993-94 and 2004-05, consumption of jowar and its products has dropped
by over 40% in both rural and urban areas. For the commonly consumed pulses – arhar, moong, masur
and urad, the percentage of households reporting consumption has risen by 1 to 4 percentage points
between 1993-94 and 2004- 05. The 8 percentage of split gram consumption has increased in rural and
urban areas as well. The percentage of households reporting milk consumption has grown in both rural
and urban areas between 1993-94 and 2004-05 by 5 percentage points – 66% to 71% in rural areas and
80% to 85% in urban areas. Average quantity of cereals consumed per person per month in 2004-05
was 12.1 kg in rural areas and 9.9 kg in urban areas (Planning Commission Report, 2004).
Per capita egg consumption in rural India – about 1 egg per month in 2004-05 – has increased by
nearly 60% since 1993-94. The percentage of rural households consuming any eggs in a 30-day period
has risen from 22% to 33%. Per capita consumption of goat meat and mutton has definitely declined,
more so in urban India, and the proportion of households consuming such meat in a 30-day period has
declined too (by 2-3 percentage points between 1993-94 and 2004-05).
The proportion of households consuming chicken during a 30-day period has, between 1993- 94 and
2004-05, increased three-fold in urban areas and two and a half times in rural areas and the increase in
per capita consumption levels appears to be of the same order. Per capita consumption of chicken has
outstripped that of goat meat and mutton not only in urban but also in rural India. The prevalence of
consumption of groundnuts, as measured by the proportion of households consuming them in a 30-day
period, has gone up by about 50% in both rural and urban areas between 1993-94 and 2004-05.
While per capita consumption of brinjal (eggplant) has declined distinctly – by about 70 gm per month
in both sectors – per capita consumption of onions has risen by 100 gm per month in the rural and
more than 150 gm in the urban sector between 1993-94 and 2004-05. The percentage of households
consuming a particular vegetable in a 30-day period has grown in the eleven years after 1993-94 by 3-
6 percentage points for potatoes, onions and brinjal, 8-10 percentage points for cabbages and nearly 12
*percentages relate to non-PDS rice/wheat only
Per capita consumption estimates are calculated taking the entire rural or urban population
as denominator.

www.theinternationaljournal.org > RJEBS: Volume: 03, Number: 3, January-2014 Page 39
percentage points for cauliflowers and tomatoes in urban areas, and 15 percentage points for tomatoes
in rural areas.
Over time, trends in real global agricultural commodity prices depend on how quickly global demand
is shifting outward relative to global supply. Global demand growth depends on growth in per capita
income, the responsiveness of demand to per capita income, and growth in population. This report is
not directed at trends in global population or global agricultural supplies, but it does address the effects
of per capita income growth on agricultural demand.
As economic growth continues in developing and emerging economies, the studies reviewed in this
report indicate that income elasticities of demand for agricultural commodities are likely to decline, at
least for most commodities. These declines in demand elasticities will dampen shocks to demand due
to recessions, financial crises, or economic booms. In the limiting case, where all income elasticities of
demand for agricultural commodities are zero, shocks to income have no impact on agricultural
commodity demands (Table 2).
Table 2: Vegetable demand elasticities in India
Source: (Kumar et al., 2008) and NSSO reports.
The price elasticity varied in the range – 0.21 to – 0.57 for all vegetables, and individually from – 0.05
for lady’s-finger to – 0.99 for cauliflower. The price elasticities were found higher for high income
group and urban consumers. The demand for most of the vegetables was inelastic (i.e. income
elasticity was less than one) with respect to change in income, except for carrot, cauliflower and beans.
Supply of Vegetables
India is finalizing the planning for its 11th 5-year plan (Planning Commission, 2007a, 2007b, 2007c,
2007d, 2007e), and a productivity increase of 5% is proposed for the horticulture sector to contribute
19% of agricultural GDP (Mehta, 2007). The adoption of policies, including a focus on high-value
Reference Place/group Vegetable Price
elasticity
Income
elasticity
Ramamurthy -1974 Orissa Tomato –0.39 0.69
Eggplant –0.60 0.23
Srinivasan -1987 All India, Rural All vegetable –0.21 0.38
All India, Urban All vegetable –0.40 0.96
Mani & Vardarajan-
1989
Tamil Nadu
Coimbatore
Dist.)
Lady’s-finger –0.05
0.49
Tomato –0.72 0.23
Carrot –0.98 1.36
Cauliflower –0.98 1.18
Beans –0.10 1.07
Low income
(<Rs9000)
Amaranths –0.21 0.98
High Income
(>Rs15000)
Amaranths –0.67 –0.47
Banumathy-1991 Karnataka Lady’s-finger –0.13 0.47
Nagarajan-1994 Tamil Nadu All Vegetable –0.56 0.99
Kumar et al.-2002 All India, Urban All Vegetable –0.28 -
All Vegetable –0.30 -
Chatterjee el al. 2007 All India, Urban Fruits and
vegetable
- 0.56
Mittal (2006) All India, Rural fruits & vegetable -0.98 0.72

www.theinternationaljournal.org > RJEBS: Volume: 03, Number: 3, January-2014 Page 40
horticulture such as vegetables coupled with trade and market reform, could contribute substantially to
several of the plan’s socioeconomic targets (Johnson et al., 2008).
Table 3: India’s position in the world major vegetable production during 2009-10
Crops India's Share %
World Yield MT/HA
Area Production World India
Brinjal 30.21 29.88 17.4 17.2
Cabbage 10.59 10.44 22.3 22
Cauliflower 30.95 34.01 17.3 19
Okra 45.33 75.15 6.4 10.6
Onion 20.32 16.84 19.4 16.1
Tomato 13.11 9.123 28.2 19.6
Potato 10.14 11.24 18 19.9
Total veg 14.86 14.33 17.3 16.7
India is the next to China in largest vegetable producer (14%), and ahead of Brazil. From 1991-92 to
2009-10, area of growing of vegetables ranged from 5593 thousand ha to 7885 thousand ha.
Production increased starting from 1991-92 and 2009-10, while area remained relatively stable.
Continue
Production scenario
In the Table 4 observed the trends of area and production of major vegetables from 2001-02 to 2009-
10. Globally India ranks first in production of okra; and second in cabbage, cauliflower, pea, onion,
and tomato; and third for potato. Nevertheless, productivity is not world-ranking, except in the case of
tomato (highest in world ranking of yield), okra, and cauliflower (equivalent to world averages)
(Working Group on Horticulture, Plantation Crops and Organic Farming, 2007).
In the year 2009-10, the vegetable production in India was 6569 thousand MT, grown over an area of
7985 thousand hectare hectares, which is about nearly 3.23 per cent of the gross cropped area of the
country. Between 1991-92 and 2009-10, the total vegetable area increased by 1829 thousand hectare.
In the total production of vegetables, potato accounts a major share (Table 4). Potato is the most
important vegetable crop in India; it contributed 27.3 per cent of vegetable production and covered
20.4 per cent to the total vegetable area in 2009-10. Nevertheless, vegetable production has been
diversifying gradually. The share of potato in total vegetable production has been declined from 2001-
02, while that of other vegetables has been rising steadily like Cabbage, Onion and tomato each
registered considerable increased in the area and production during this period.
Table 4: Trends in the production of major vegetables in India during 2001-02 to 2009-10
Crops name Production("000")
MT
Change in production Share in total production (%)
2001-02 2009-10 Production("000") MT Share (%) 2001-02 2009-10
Brinjal 8347.7 10563 2215.3 4.91 9.41 7.79
Okra 3324.7 4803.3 1478.6 3.20 3.75 3.55
Onion 5252.1 12158.8 6906.7 15.30 5.92 9.07
Peas 2038.2 3029.4 991.2 2.19 2.2 2.25
Tomato 7462.3 12433.2 4970.9 11.00 8.4 9.25
Potato 24456.1 36577.3 12121.2 26.80 27.5 27.3
Cabbage 5678.2 7281.4 1603.2 3.55 6.40 5.44
Cauliflower 4890.5 6569 1678.5 3.70 5.51 4.91

www.theinternationaljournal.org > RJEBS: Volume: 03, Number: 3, January-2014 Page 41
Growth Performance of Major Vegetables
A study of growth trends from 2001-02 to 2009-10 has indicated that, total vegetable production
increased at an annual rate of about 6.50 per cent (Table 5) in area trends of 4.10 per cent. Finally area,
production expansion and yield increase contributed to this growth, although the contribution of yield
during this period is considerable. The growth rate of yield of total vegetables from about 2.21 per cent
from 2001-02 to 2009-10.
Table 5: Annual compound growth rates of major vegetables in India from 2001-02 to 2009-10
(Per cent)
Crop Area Production Yield
Brinjal 2.26 3.52 0.94
Okra 5.89 4.38 1.04
Onion 8.13 15.78 7.04
Peas 2.3 5.78 3.37
Tomato 4.45 6.52 2.37
Potato 5.04 5.51 0.43
Cabbage 4.55 2.94 -0.06
Cauliflower 5.1 4.86 0.58
Sweet Potato -1.3 -0.61 0.58
Tapioca 2.08 6.02 3.86
Total vegetables 4.21 6.5 2.21
Between 2001-02 and 2009-10, annual growth of area of major commodities varied from increases of
2.59%/annum for Brinjal, 4.55 % of Cabbage, 5.11% of Cauliflower, 5.88 % of Okra, 5.01% of Potato,
4% of Tomato and 8.18 % increase of onions. While the growth rates in production for Cabbage,
Cauliflower, Onion Potato and Tomato, except in the case of sweet potato, accounts considerable
growth in vegetable crops during 2001-02 to 2009-10. Growth rate of production concerns onion
showing strongest growth of 15.79 per cent from 2001-02 to 2009-10. Vegetables production
expanded more slowly, or declined (sweet potato) between 2001-02 and 2009-10, with the area under
major vegetables rising sharply to meet export opportunities.
Regional Production Patterns in Vegetables
The state-wise vegetable area as percentage of gross cropped area (Table) revealed that it was highest
in West Bengal (13.46%), followed by Bihar (10.41%), and Jharkhand (9.98%). At all India level,
vegetables occupied 4 per cent of the total cropped area. The state wise distribution of area and
production showed their concentration in the eastern states, viz. West Bengal, Bihar and Orissa. These
together accounted nearly 38 per cent of the area and 35 per cent of the output in the country. The
states mentioned in Table together contributed major area and production of vegetables in the country.
Table 6: Major state-wise vegetable area and production in India
Vegetable area as percent of its gross cropped area
(%)
Per cent share in 2009-
10
States name Area
(%)
Production
(%)
UP 3.85 12.77 16.77
WB 13.46 16.31 16.38
Bihar 10.41 10.46 10.39
Orissa 7.32 8.69 6.70

www.theinternationaljournal.org > RJEBS: Volume: 03, Number: 3, January-2014 Page 42
Tamil Nadu 4.51 3.30 5.70
Gujarat 3.36 5.09 5.42
Karnataka 3.31 5.52 5.29
Maharashtra 2.00 5.65 4.61
Andhra 2.20 4.14 4.05
Assam 8.56 3.19 3.41
Haryana 4.25 3.76 2.98
Chhattisgarh 5.09 3.95 2.6
Punjab 2.18 2.29 2.63
Jharkhand 9.98 2.65 2.59
MP 1.025 3.13 2.32
Total
Vegetables
4.00 100 100
Table 7: Trends in production of vegetables by states in India
Production
(“000")MT
Change in production during1991-92 &
2009-10
Share in Total production
(%)
1991-
92
2009-
10
Quantity
(1000)MT
per cent Share % in 1991-
92
% in 2009-
10
UP 9627.3 22435.
74
12808.44 17.03 16.44 16.77
WB 4680 21906.
53
17226.53 22.90 7.99 16.38
Bihar 8643.1 13906.
8
5263.7 6.99 14.76 10.39
Orissa 7275 8963.6 1688.6 2.24 12.42 6.70
Tamil
Nadu
3796.9 7627.7 3830.8 5.09 6.48 5.70
Gujarat 1667.9 7255.5 5587.6 7.42 2.84 5.42
Karnataka 3673.2 7082.2 3409 4.53 6.27 5.29
Maharasht
ra
4171.3 6172.6 2001.3 2.66 7.12 4.61
Andhra 1452.6 5426.2 3973.6 5.28 2.48 4.05
Assam 2132.3 4569.9 2437.6 3.24 3.64 3.41
Haryana 877 3987 3110 4.13 1.49 2.98
Punjab 1450 3522.5 2072.5 2.75 2.47 2.63
MP 2221 3112.6 891.6 1.18 3.79 2.32
Other
States
6864.4 17768.
79
10904.39 14.49 11.7 13.2
Total 58532 133737
.6
75205.6 100 100 100
Availability of Vegetables
Even though the diversification towards high-energy commodities like milk, eggs, poultry, fish and
meat products has increased considerably in the recent past, a majority of Indians are still dependent
on vegetables for their primary source of vitamins and minerals, besides milk and milk products. The
net availability of vegetables in India is shown in Table 8. The production of fresh vegetables and their
net availability increased at the rate of 4.40 per cent per annum from 1991-92 to 2009-10. The exports
also steadily increased at the rate of 10.55 per cent annually, but the actual quantity of export was not
www.theinternationaljournal.org > RJEBS: Volume: 03, Number: 3, January-2014 Page 43
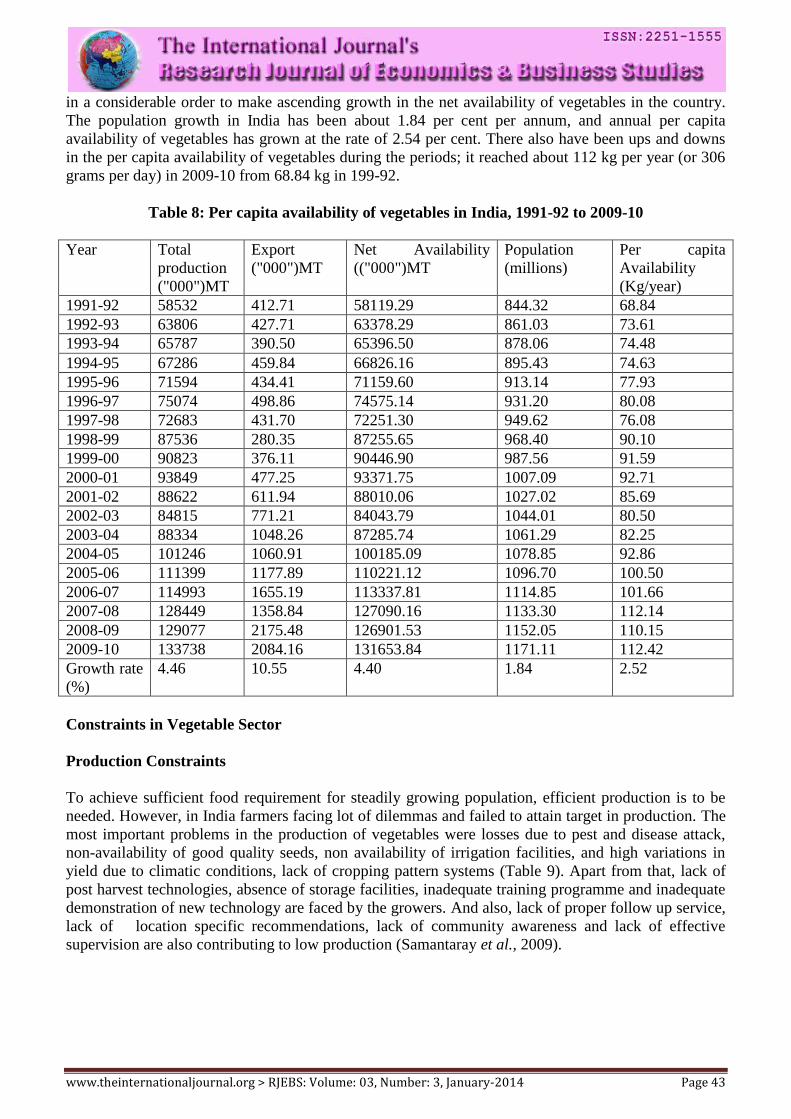
in a considerable order to make ascending growth in the net availability of vegetables in the country.
The population growth in India has been about 1.84 per cent per annum, and annual per capita
availability of vegetables has grown at the rate of 2.54 per cent. There also have been ups and downs
in the per capita availability of vegetables during the periods; it reached about 112 kg per year (or 306
grams per day) in 2009-10 from 68.84 kg in 199-92.
Table 8: Per capita availability of vegetables in India, 1991-92 to 2009-10
Year Total
production
("000")MT
Export
("000")MT
Net Availability
(("000")MT
Population
(millions)
Per capita
Availability
(Kg/year)
1991-92 58532 412.71 58119.29 844.32 68.84
1992-93 63806 427.71 63378.29 861.03 73.61
1993-94 65787 390.50 65396.50 878.06 74.48
1994-95 67286 459.84 66826.16 895.43 74.63
1995-96 71594 434.41 71159.60 913.14 77.93
1996-97 75074 498.86 74575.14 931.20 80.08
1997-98 72683 431.70 72251.30 949.62 76.08
1998-99 87536 280.35 87255.65 968.40 90.10
1999-00 90823 376.11 90446.90 987.56 91.59
2000-01 93849 477.25 93371.75 1007.09 92.71
2001-02 88622 611.94 88010.06 1027.02 85.69
2002-03 84815 771.21 84043.79 1044.01 80.50
2003-04 88334 1048.26 87285.74 1061.29 82.25
2004-05 101246 1060.91 100185.09 1078.85 92.86
2005-06 111399 1177.89 110221.12 1096.70 100.50
2006-07 114993 1655.19 113337.81 1114.85 101.66
2007-08 128449 1358.84 127090.16 1133.30 112.14
2008-09 129077 2175.48 126901.53 1152.05 110.15
2009-10 133738 2084.16 131653.84 1171.11 112.42
Growth rate
(%)
4.46 10.55 4.40 1.84 2.52
Constraints in Vegetable Sector
Production Constraints
To achieve sufficient food requirement for steadily growing population, efficient production is to be
needed. However, in India farmers facing lot of dilemmas and failed to attain target in production. The
most important problems in the production of vegetables were losses due to pest and disease attack,
non-availability of good quality seeds, non availability of irrigation facilities, and high variations in
yield due to climatic conditions, lack of cropping pattern systems (Table 9). Apart from that, lack of
post harvest technologies, absence of storage facilities, inadequate training programme and inadequate
demonstration of new technology are faced by the growers. And also, lack of proper follow up service,
lack of location specific recommendations, lack of community awareness and lack of effective
supervision are also contributing to low production (Samantaray et al., 2009).

www.theinternationaljournal.org > RJEBS: Volume: 03, Number: 3, January-2014 Page 44
Table 9: Production Constraints in vegetable sector
Pro
du
ctio
n c
on
stra
ints
A.
Infrastructur
e
1. Lack of availability of good quality seeds
2. non availability of irrigation facilities
3. Lack of awareness of soil testing
provisions to farmers
4. Improper extension and technical
guidance to farmers
B.
Technologic
al
1. Loss due to insect pest incidence
2. High yield variability
3. Lack of suitable varieties
4. More pre and post-harvest losses
5. Non-availability of location-specific
recommendations
6. Non-availability of effective fungicides
to control rot diseases
7. Inadequate and unbalanced manuring
C.
Economic
1. availability of manpower and labour
2. Diversity of sector
3. Lack of financial supports
4. Low profit with high cost of production
D.
Awareness
1. Less awareness of weather information
and seasonal cropping pattern
2. Lack of technical or mechanization
aspects
Marketing constraints
The infrastructural problems, pertaining to the cold storage facilities and some places have
the problem of underutilisation of the existing cold storages. Scattered productions of vegetables
and sometimes in isolated places transportation facilities and other infrastructure is not sufficient for
the perishables. However, Lack of proper grading and quality control measurements and improper pre
and post harvest handling without any sound packaging leads to heavy loss (Table 10). Even Lack of
unity and organization skill among the farming community is the major constraint of marketing
system. In addition, lack of forward & backward linkages i.e. absolute lack of the much needed quality
input sand extension backup at proper time and after harvest processes.
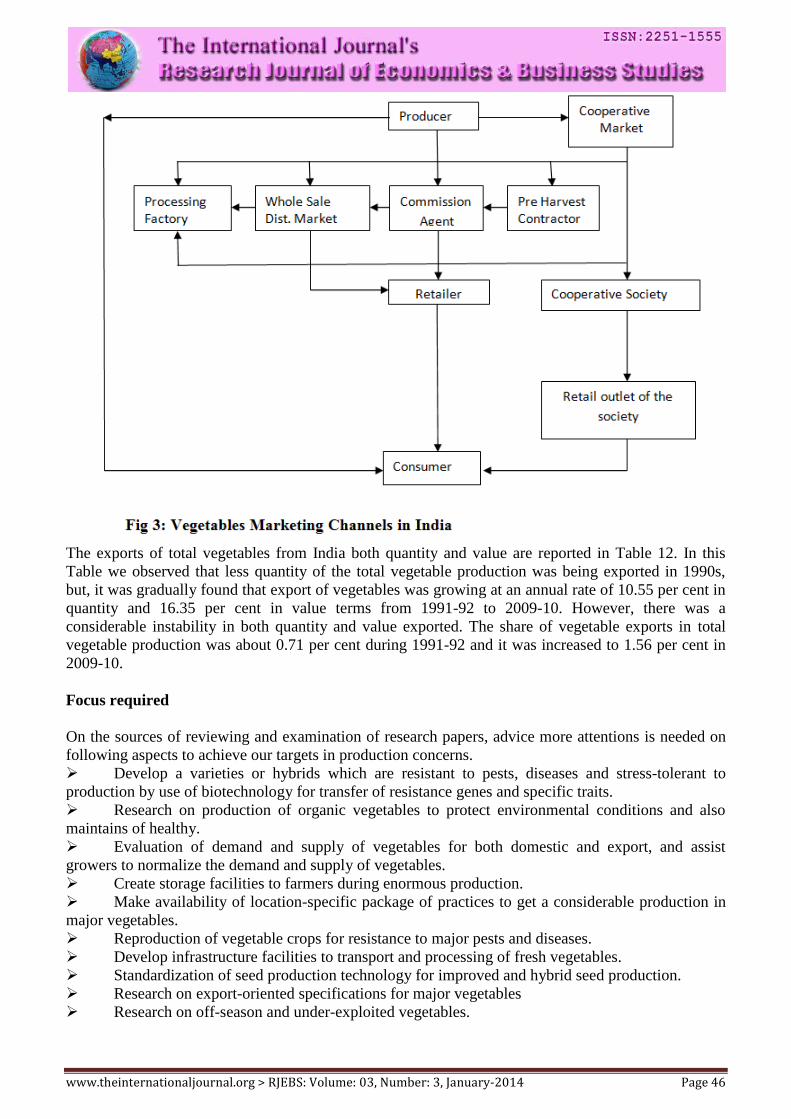
Marketing Channels
Farmers producing agricultural produce are scattered in remote villages while consumers are in semi-
urban and urban areas. This produce has to reach consumers for its final use and consumption. There
are different agencies and functionaries through which this produce passes and reaches the consumer.
Generally marketing channels have been identified by the different research studies for marketing of
vegetables from producers to consumers. In vegetable marketing, direct contact between market
commission agents and farmers was very low (< 50%) and secret bidding and simple transactions

www.theinternationaljournal.org > RJEBS: Volume: 03, Number: 3, January-2014 Page 45
Table 10: Marketing Constraints in vegetable sector
Mark
etin
g c
on
stra
ints
A. Infrastructure
1) Lack of transport facility to markets
2) Lack of cold storage facilities
3) Lack of refrigerated transport facility to perishable
commodities
4) Lack of processing facilities to Food industries
5) Poor market intelligence
B. Technological
1) Poor grading, standerization and packaging
2) Lack of consumer education on nutritional facts of
processed foods
3) Lack of processing technology facilities
C. Economic
1) High transportation cost
2) High cost of packaging material
3) High price risks
D. Administrative
1) Faulty weighing mechanism and price discounting
2) sale and payments problems
3) Lack of market information and regulation
4) Lack of Backward-forward integration from farm to
consumers
dominatedIn Uttar Pradesh, identified the major marketing channels of potato, the net price received
by producer was high in channel III Rs. 122.10 (producer – wholesaler – retailer – consumer) followed
by channel I Rs. 108.00 (Producer - consumer) and channel II Rs. 106.00 (Producer – village traders –
wholesaler – retailer – consumer) ( Awadesh Kumar et al. (1997) . About 92 per cent farmers in
Karnataka and 62 per cent each in Andhra Pradesh and Tamil Nadu sold vegetables through
commission agents. In Andhra Pradesh, 22.6 per cent farmers sold their output to the wholesalers in
markets and 15.4 per cent sold to the retailers at the farm gate. In Tamil Nadu, 21 per cent farmers sold
through pre-harvest contracts (all farmers growing cabbage and carrot), and one-tenth sold to retailers
(all farmers growing cauliflower). Only three per cent of the farmers made pre-harvest contracts,
mostly for cabbage and cauliflower, and 5 per cent (mostly for lady’s-finger) sold their output to
retailers in Karnataka (Kumar et al., 2008).
www.theinternationaljournal.org > RJEBS: Volume: 03, Number: 3, January-2014 Page 46
The exports of total vegetables from India both quantity and value are reported in Table 12. In this
Table we observed that less quantity of the total vegetable production was being exported in 1990s,
but, it was gradually found that export of vegetables was growing at an annual rate of 10.55 per cent in
quantity and 16.35 per cent in value terms from 1991-92 to 2009-10. However, there was a
considerable instability in both quantity and value exported. The share of vegetable exports in total
vegetable production was about 0.71 per cent during 1991-92 and it was increased to 1.56 per cent in
2009-10.
Focus required
On the sources of reviewing and examination of research papers, advice more attentions is needed on
following aspects to achieve our targets in production concerns.
Develop a varieties or hybrids which are resistant to pests, diseases and stress-tolerant to
production by use of biotechnology for transfer of resistance genes and specific traits.
Research on production of organic vegetables to protect environmental conditions and also
maintains of healthy.
Evaluation of demand and supply of vegetables for both domestic and export, and assist
growers to normalize the demand and supply of vegetables.
Create storage facilities to farmers during enormous production.
Make availability of location-specific package of practices to get a considerable production in
major vegetables.
Reproduction of vegetable crops for resistance to major pests and diseases.
Develop infrastructure facilities to transport and processing of fresh vegetables.
Standardization of seed production technology for improved and hybrid seed production.
Research on export-oriented specifications for major vegetables
Research on off-season and under-exploited vegetables.

www.theinternationaljournal.org > RJEBS: Volume: 03, Number: 3, January-2014 Page 47
References:
Johnson, G.I., Weinberger, K., Wu, M.H. 2008. The Vegetable Industry in Tropical Asia: An overview
of production and trade, with a focus on Thailand, Indonesia, the Philippines, Vietnam, and India [CD-
ROM]. Shanhua, Taiwan: AVRDC – The World Vegetable Center. 56 pp. (Explorations series; no. 1)
Sant Kumar, Suresh Pal and P. K. Joshi, 2004, Vegetable Sector in India: An Overview, Impact of
Vegetable Research in India, National Centre for Agricultural Economics and Policy Research, New
Delhi-110 012.
S. K. Samantaray S. Prusty and R. K. Raj, 2009, Constraints in Vegetable Production-Experiences of
Tribal Vegetable Growers. Indian Res. J. Ext. Edu. 9 (3), September.
Awadesh Kumar, P.P. Dubey And Ashok Kumar, 1997, Marketing: A case study of two markets in
Chattisgarh region of Madhya Pradesh. The Bihar Journal of Agricultural Marketing vol. IV. No. 1
March 1996.
S.H. Baba, M.H. Wani, S.A. Wani and Shahid Yousuf, 2010. Marketed Surplus and Price Spread of
Vegetables in Kashmir Valley. Agricultural Economics Research Review Vol. 23 January-June 2010
pp 115-127.
Agricultural Marketing Vol. XLV. No. 1 I.S.S.N.-0002-1555). (Agricultural market Report, 2008)
World Bank, World Development Indicators, 2012.
(NAAS, India 2001, working policy paper 13)
Indian Horticulture database-2010)
Planning Commission Report no. 508: Level and Pattern of Consumer Expenditure, 2004-05).
APEDA March 2011 website: http://www.apeda.gov.in/
Working Group on Horticulture Plantation Crops and Organic Farming, 2007.