indian ocean sst and indian summer rainfall: …webster.eas.gatech.edu/papers/webster2000f.pdf15...
TRANSCRIPT

15 JULY 2000 2503C L A R K E T A L .
q 2000 American Meteorological Society
Indian Ocean SST and Indian Summer Rainfall: Predictive Relationships andTheir Decadal Variability
CHRISTINA OELFKE CLARK
Program in Atmospheric and Oceanic Sciences, University of Colorado, Boulder, Colorado
JULIA E. COLE*
Department of Geological Sciences/INSTAAR/PAOS, University of Colorado, Boulder, Colorado
PETER J. WEBSTER
Program in Atmospheric and Oceanic Sciences, University of Colorado, Boulder, Colorado
(Manuscript received 2 October 1998, in final form 23 August 1999)
ABSTRACT
The authors examine relationships between Indian Ocean sea surface temperature (SST) variability and thevariability of the Indian monsoon, including analysis of potential long-lead predictions of Indian rainfall byregional SST and the influence of ENSO and decadal variability on the stability of the relationships. Usingmonthly gridded (48 3 48) SST data from the Global Sea-Ice and Sea Surface Temperature (GISST) datasetthat spans 1945–94, the correlation fields between the All-India Rainfall Index (AIRI) and SST fields overthe tropical Indian Ocean are calculated. In the boreal fall and winter preceding the summer Indian monsoon,SST throughout the tropical Indian Ocean correlates positively with subsequent monsoon rainfall. Negativecorrelation occurs between SST and the AIRI in the subsequent autumn in the northern Indian Ocean only.A strong correlation (0.53) is found between the summer AIRI and the preceding December–February ArabianSea SST. The correlation between the AIRI and the SST to the northwest of Australia for the same period is0.58. The highest correlation (0.87) for the years following 1977 is found between the AIRI and the centralIndian Ocean SST in the preceding September–November, but this relationship is much weaker in earlieryears. Based upon these correlations, the authors define Arabian Sea (AS1), northwest Australia (NWA1),and central Indian Ocean (CIO1) SST indexes. The relationships of these indexes to the AIRI and ENSO areexamined. The authors find that the high correlation of the AS1 and NWA1 SST indexes with the Indiansummer rainfall is largely unaffected by the removal of the ENSO signal, whereas the correlation of the CIO1index with the AIRI is reduced. The authors examine the interdecadal variability of the relationships betweenSST and the AIRI and show that the Indian Ocean has undergone significant secular variation associated witha climate shift in 1976. The possible mechanisms underlying the correlation patterns and the implications ofthe relationship to the biennial nature of the monsoon and predictability are discussed.
1. Introduction
The Asian monsoon circulation influences most ofthe tropics and subtropics of the Eastern Hemisphereand more than 60% of the earth’s population (Websteret al. 1998). Monsoon variations, particularly if they areunanticipated, impart significant economic and social
* Current affiliation: Department of Geosciences, The Universityof Arizona, Tucson, Arizona.
Corresponding author address: Christina Clark, Program in At-mospheric and Oceanic Sciences, Campus Box 311, University ofColorado, Boulder, CO 80309-0311.E-mail: [email protected]
consequences. Monsoon failure often brings famine toaffected regions, and strong monsoon years can resultin devastating floods. An accurate long-lead predictionof monsoon rainfall can improve planning to mitigatethe adverse impacts of monsoon variability and to takeadvantage of beneficial conditions (Webster et al. 1998).A better understanding of the monsoon cycle is clearlyof scientific and social value. Monsoon prediction stud-ies have utilized indicators of atmospheric circulation,land surface conditions, and Indian and Pacific OceansSSTs (summarized in Webster et al. 1998). The predic-tive relationship between Indian Ocean SST and mon-soon rainfall remains especially poorly characterized,particularly at lead times greater than 1–2 months beforethe boreal summer monsoon season. This study assessesthe relationship between SST variations in the tropical

2504 VOLUME 13J O U R N A L O F C L I M A T E
Indian Ocean and Indian monsoon rainfall, includingthe temporal stability of these linkages over the past 50yr with the goal of improving multivariate monsoonprediction efforts.
a. Monsoon variability
The Asian monsoon is characterized by a seasonalreversal of surface winds and a distinct seasonality ofprecipitation. During the boreal summer, winds flowfrom the Southern Hemisphere, accumulating moistureand depositing copious amounts of precipitation overthe south Asian continent. In the winter, dry winds flowfrom the cold land areas of Asia southwest toward thewarm southern ocean. These winds converge over thewarm Southern Hemisphere ocean, Indonesia, and thenorth Australian continent to produce the precipitationof the Australian monsoon. The fundamental drivingmechanisms of the monsoon cycle are the cross-equa-torial pressure gradients resulting from differential heat-ing of land and ocean, modified by the rotation of theearth and the exchange of moisture between the ocean,atmosphere, and land (e.g., Webster 1987). The Him-alayas and the Tibetan Plateau provide additional strongthermal forcing that produces a distinct asymmetry tothe summer monsoons of the Northern and SouthernHemispheres (Yanai and Li 1994; Webster et al. 1998).In addition to the strong seasonality of wind and rainfallpatterns, the monsoon regions also experience a highdegree of variability on intraseasonal, interannual, andinterdecadal timescales. The timing of the onset date ofthe summer rainfall in a particular location can varyconsiderably from one monsoon season to the next, andthe rainfall over large regions can experience ‘‘breaks’’in activity within a season, during which there is littleor no precipitation (Webster et al. 1998 and referencestherein). Such intraseasonal oscillations occur withtimescales of weeks.
On interannual timescales, the Asian monsoon ex-hibits a fairly distinct bienniality. A spectral analysis ofIndian rainfall shows peaks in the 2–3-yr period range(Mooley and Parthasarathy 1984). Years of heavy rain-fall tend to be followed by years of diminished rainfall.This biennial component is known as the troposphericbiennial oscillation (TBC) and appears in a wide rangeof atmospheric variables including rainfall, surface pres-sure, wind, and SST (Meehl 1987). The origin of theTBO is a subject of debate. Meehl (1997) described anair–sea negative feedback mechanism in which warmspring SSTs in the Indian Ocean enhance atmosphericconvection. The ensuing stronger monsoon leads togreater than average wind strength, increased Ekmantransports and vertical mixing, and higher heat loss byevaporation throughout the summer monsoon season,which causes subsequent cooling of the ocean surface.The low ocean temperatures persist for one year untilthe next pluvial season. The lowered SSTs are associatedwith less convection than the previous spring, producing
weakened winds, reduced heat loss by evaporation, andless mixing, which leads to higher SSTs than the yearbefore. The cycle is thus repeated. The strength of theTBO is modulated by interdecadal variability. For ex-ample, Torrence and Webster (1999) find the biennialoscillation to be weaker in some decades than others.
Another potential explanation for biennial monsoonvariability involves land surface processes, especiallyEurasian snow cover. Extensive snow cover typicallyprecedes a weak monsoon and light snow cover precedesa strong monsoon (Barnett et al. 1989; Yang 1996; Ver-nekar et al. 1995). Large and persistent winter snowcover over Eurasia following a strong monsoon can de-lay and weaken the spring and summer heating of land-mass that is necessary for the establishment of large-scale monsoon flow (Shukla 1987; Barnett et al. 1989;Yasunari et al. 1991). In this manner, snow cover mayact as a negative feedback upon the Asian monsoon,imparting biennial variability. Clearly a better under-standing of the ocean–atmosphere and land–atmospherefeedbacks that may give rise to the TBO can improvepredictions of monsoon strength.
On interannual and longer timescales, the variabilityof the Asian monsoon is linked with the El Nino–South-ern Oscillation (ENSO). The occurrence of El Nino isgenerally associated with a weak monsoon, and La Ninais associated with a strong monsoon (e.g., Webster andYang 1992). During normal periods, the warm pool(SST . 278C) extends from the eastern Indian Oceanto the western Pacific Ocean and is associated with abroad precipitation maximum. During an El Nino event,the locus of maximum SST in the Pacific Ocean shiftseastward, typically bringing more precipitation over thecentral and eastern Pacific Ocean. During these periodsthe eastern Indian Ocean, Indonesia, and south Asia arein the subsiding part of the Walker circulation that hasshifted eastward from its climatological position (Web-ster et al. 1998). Between 1871 and 1994, there were22 deficient Indian rainfall events (rainfall . 1 standarddeviation below mean), 11 of which occurred during anEl Nino episode and 2 of which occurred during LaNina. In this same period, there were 18 events of heavyrainfall, 7 of which occurred during La Nina, but noneoccurred during El Nino (Webster et al. 1998). Clearly,there is a connection between the Asian monsoon andENSO, but it is not possible to predict the strength ofthe monsoon solely from the phase of ENSO, as thesemonsoon–ENSO correlations have variable lag-leadtimes (Webster and Yang 1992). In addition, the con-nection between the Asian monsoon and ENSO appearsto be statistically nonstationary (e.g., Troup 1965). Thecorrelation between Indian rainfall and Pacific OceansSST varies from 0.4 to 0.8 for different decades from1900 through to the present (Torrence and Webster1999). Wavelet analysis shows that from 1920 to 1960,the Southern Oscillation index (SOI) was comparativelyquiescent, yet the variability of Indian rainfall was notsignificantly reduced. With regard to monsoon–ENSO

15 JULY 2000 2505C L A R K E T A L .
relationships, Torrence and Webster (1999) substantiatethe findings of Troup (1965) and note the demise ofENSO-based predictive relationships in the 1920–60 pe-riod. During the last decade, the ENSO–monsoon re-lationship has also weakened. During the 1993/94 and1997/98 El Nino events, the Indian rainfall remainedessentially normal (Webster et al. 1998; Torrence andWebster 1999).
On interdecadal timescales, the tropical climate sys-tem also experiences secular changes. One such climateshift occurred in 1976 and is characterized by significantchanges in the structure and evolution of ENSO (Tren-berth 1990; Graham 1994; Wang 1995). After 1976,there occurred more El Nino and fewer La Nina eventsthan in previous years (Trenberth 1990; Trenberth andHoar 1996). Significant SST increases were found inthe tropics of the central and eastern Pacific and IndianOceans and were linked to enhanced convective activity(Nitta and Yamada 1989). Empirical orthogonal func-tion (EOF) analysis performed on the tropical Pacificand Indian Oceans SST shows a rapid transition froma cold to warm state in the late 1970s (Wang 1995). Acomparison between land and marine datasets in theIndian Ocean reveals a sudden warming of SST after1976 and corroborates the evidence of a climatic changein the Indian Ocean after 1976 (Terray 1994). Our studydemonstrates that this climate shift alters the correlationstructure between Indian Ocean SST fields and subse-quent Indian monsoon rainfall.
b. The role of the Indian Ocean
Gradients of SST within the oceans are important indetermining the location of precipitation over the Trop-ics, including the monsoon regions (Lindzen and Nigam1987). As a first approximation, it might be supposedthat the distribution of SST in the Indian Ocean playsa role in determining monsoon rainfall variability. Theinfluence of the tropical oceans on the Asian monsoonhas been suggested by models and empirical evidence.Atmospheric general circulation models (GCMs) havebeen used to address how the regional climate associatedwith monsoon rainfall and circulation anomalies re-sponds to imposed SST anomalies. The Monsoon Nu-merical Experimentation Group (MONEG) of the WorldClimate Research Programme (WCRP) attempted toreplicate the contrasting monsoon seasons of 1987 and1988 using variable ocean boundary conditions (Sperberand Palmer 1996). Seventeen atmospheric modelinggroups ran 90-day integrations using the observed glob-al SST fields for 1987 and 1988 as boundary forcingand the atmospheric fields as initial conditions (WorldClimate Research Programme 1992). The difference be-tween estimates of monsoon rainfall by the differentmodels was systematic, either universally high or low.This systematic difference suggests that the IndianOcean region is difficult to model, perhaps because ofthe strong seasonal SST gradients and consequently spa-
tially steep heating gradients. There is also a great dif-ference in the manner in which each model simulatesthe mechanical and heating effects of the Tibetan Pla-teau. Given the importance of this mountain complex(e.g., Yanai and Li 1994), it is not surprising that sim-ulations of precipitation close to the Himalayas weredifferent among models. However, multiple runs by theEuropean Centre for Medium-Range Weather Forecasts(ECMWF) models starting with different initial condi-tions also showed a dispersion in the mean seasonalprecipitation (Sperber and Palmer 1996), indicating thatlocal monsoon instabilities may be important (Websteret al. 1998).
Several additional studies demonstrate the signifi-cance of the Indian Ocean SST in influencing the mon-soon. A GCM study in which the solar forcing of theland and ocean are incorporated separately shows thatthe annual cycle of SST in the Indian Ocean is cruciallyimportant in establishing the monsoon circulation andrainfall (Shukla and Fennessy 1994). Model simulationsalso confirm that the Arabian Sea SST influences sub-sequent monsoon rainfall on timescales less than amonth. A cool Arabian Sea SST leads to reduced Indianrainfall and vice versa (Shukla 1975; Kershaw 1988;Yang and Lau 1998).
c. Monsoon prediction
Empirical forecasting of Indian monsoon rainfall hasbeen performed using combinations of climatic param-eters, including atmospheric pressure, wind, snow cover,SST, and the phase of ENSO (e.g., Parthasarathy et al1988; Shukla and Mooley 1987; Hastenrath 1986; Has-tenrath 1987; Wu 1985; Harzallah and Sadourny 1997;Sadhuram 1997). Regression models based on these andother empirical correlations have been able to predict60%–80% of the total seasonal Indian rainfall by theMay preceding the summer monsoon (Hastenrath 1994).
A goal of this research is to describe Indian Ocean–monsoon relationships that will contribute to the pre-diction of rainfall at lead times significantly longer thanthe May preceding the onset of the south Asian summermonsoon. Several studies document empirical links be-tween Indian Ocean SST and monsoon variability. Neg-ative correlations exist between the all-India rainfall in-dex (AIRI) (defined by Parthasarathy et al. 1992) andthe Indonesian SST 16 months earlier (Nicholls 1983).These negative correlations change sign in Novemberand December and reach the 95% significance level (r5 0.51) in the February preceding the Indian monsoon.Several other empirical studies show a strong positivecorrelation of Arabian Sea SST averaged over March,April, and May with Indian summer rainfall (Shuklaand Mooley 1987; Joseph and Pillai 1984; Rao and Gos-wami 1988; Allan et al. 1995). Harzallah and Sadourny(1997) investigate lag-lead relationships of global SSTand the AIRI from 1950–90. They find that positiveSST anomalies exist in the Indian Ocean, especially the

2506 VOLUME 13J O U R N A L O F C L I M A T E
Arabian Sea, in the fall and winter preceding a strongmonsoon. A strong correlation (0.75) exists betweenIndian rainfall and SST in the central Indian Ocean inthe October and November preceding the monsoon forthe years 1967–87 (Sadhuram 1997). Thus, IndianOcean SST variability holds promise for improved pre-dictions of monsoon rainfall.
Our study further explores the relationship betweenIndian Ocean SST and monsoon rainfall, including itsconnection to ENSO. We calculate the monthly corre-lation of summer rainfall over India with SST at alllocations within the tropical Indian Ocean and evaluatethe stability of these relationships over the period of1945–95. Specific regions where winter SST correlateswith the subsequent AIRI include the Arabian Sea, aregion northwest of Australia, and the central IndianOcean; these results confirm previous studies that useddifferent SST datasets (Harzallah and Sadourny 1997;Sadhuram 1997). We expand upon these studies by ex-amining the influence of ENSO on the SST–AIRI cor-relation and by exploring the interdecadal variability ofthese correlations. We define indexes of three-monthaverage SST values extracted from three locations with-in the Indian Ocean where the correlations with the AIRIare the strongest. We show that the central Indian Oceanhas undergone a shift in its relationship with the AIRIin 1976, after which time its correlation with the AIRIis much stronger; other regions show correlations thatremain stable over the period of analysis. AlthoughENSO has a strong signature in the Indian Ocean, re-moval of the ENSO signal from the SST indexes doesnot strongly affect the correlations of the AIRI with SSTfrom the Arabian Sea and the region northwest of Aus-tralia, but it does decrease the correlation of the AIRIwith SST in the central Indian Ocean. This decrease isnot surprising because the maximum correlation be-tween the Indian Ocean SST and Nino-3 SST occurs inthe central Indian Ocean.
2. The data
The basic SST dataset used in this study is the globalsea-ice and sea surface Temperature (GISST, version2.4) dataset compiled from ship records (Parker et al.1995). These data contain a global record of monthlySST from 1880 to the present, although optimum cov-erage has been reached only since 1945. A grid (48 348) of monthly SST from 1945 to 1997 is used with theaverage annual cycle removed, and we restrict our anal-ysis to the tropical Indian Ocean in the range 248S–248N and 408E–1208E. We use the Nino-3 SST indexto represent the strength of ENSO; Nino-3 is the area-average SST over the eastern equatorial Pacific (58S–58N, 908–1508W; Bjerknes 1969). The annual AIRI, therainfall over the Indian subcontinent totalled annuallyfrom June through September (JJAS; Parthasarathy etal. 1992), has been computed for the past century andhas been used as an indicator of the strength of the
Indian monsoon. The AIRI consists of an area-weightedaverage of 306 rain gauges distributed across India.
A linear least squares fit to the GISST dataset at eachgrid point within the tropical Indian Ocean was per-formed (Fig. 1). The Indian Ocean SST is dominatedby a strong positive trend, with the strongest warming,greater than 0.028C yr21 in the equatorial Indian Oceanwest of Indonesia (Fig. 1b). Averaging the GISST da-taset over the tropical Indian Ocean region (definedabove) produces the timeseries shown in Fig. 1a. Alinear fit of this timeseries reveals an average warmingtrend from 1945 to 1997 of one degree per century.Removal of this trend reduces the total variance of thetimeseries by 31%. In agreement with Terray (1994), itis found that most of the warming in the Indian Oceanhas occurred after 1976, with a linear trend of 0.018Cyr21 (Fig. 1a, dotted line), whereas during the periodfrom 1945 to 1976, the warming was only 0.0038C yr21.Although the warming is weak throughout the IndianOcean prior to 1976 (Fig. 1c), the trend is greater than0.038C yr21 in the central Indian Ocean and in Indonesiaafter 1976 (Fig. 1d). We have removed the trend at eachgrid point to simplify the correlation analyses in thisstudy. Removal of the trend is found to strengthen cor-relations of SST with Indian summer rainfall by 0.01to 0.2.
Although the long-term SST trend is not central tothe current study, it is important to recognize its poten-tial significance to the character of the evolution of themonsoon regime. Most of the temperature increaseshave occurred in the last 20 yr corresponding to theepochal changes described by Trenberth (1990), Graham(1994), and Wang (1995). Given the uncertainties of thedatasets and their limited length, it is difficult to knowwhether the increases in the Indian and Pacific SSTs arepart of natural interdecadal oscillations or are caused byanthropogenic effects. The long-term variations couldhelp explain the nonstationary aspect of the monsoon–ENSO connection.
3. Results
a. SST–Indian rainfall relationships, 1945–95
To determine the monthly SST–annual AIRI relation-ship preceding and following the monsoon, we correlatethe SST timeseries for each month at each grid point inthe Indian Ocean with the AIRI beginning with the June,12 months (i.e., four seasons) prior to the AIRI. A similaranalysis was performed by Harzallah and Sadourny(1997) using global MOHSST4 SST data (Bottomley etal. 1990). The correlation of 3-month average SST fieldswith the JJAS AIRI beginning one year prior to the AIRIare shown in Fig. 2. For 50 yr of data, the 95% and 99%significance levels are 0.28 and 0.36, respectively, usinga Student’s t-distribution. The SST throughout the entireIndian Ocean is positively correlated with the AIRIthroughout the fall, winter, and early spring preceding

15 JULY 2000 2507C L A R K E T A L .
FIG. 1. Variability of Indian Ocean SST in the period of 1945–97. (a) Time series of SST averaged over the tropical Indian Ocean northof 248S. The solid line is a linear least squares fit from 1945 to 1997, with a slope of 0.018C yr21. The dashed line is a linear fit from 1945to 1976, with a slope of 0.0038C yr21. The dotted line is a linear fit from 1977 to 1997, with a slope of 0.018C yr21. (b) Linear coefficientof GISST SST (Parker et al. 1995) from 1945 to 1997. (c) Linear coefficient of GISST SST from 1945 to 1976. (d) Linear coefficient ofGISST SST from 1977 to 1997.
the Indian summer monsoon, confirming earlier results(Harzallah and Sadourny 1997, their Fig. 3). This positivecorrelation weakens prior to and during the onset of thesummer rainfall, and negative correlations emerge in thenorthern Indian Ocean in the subsequent fall. This resultagrees with numerical modeling experiments (Shukla1975; Yang and Lau 1998) and other empirical analyses(Shukla 1987; Rao and Goswami 1988): high SST in theArabian Sea precedes strong monsoon rain which, in turn,precedes low SST in the autumn. Interestingly, the high-est positive correlations of SST with the AIRI do notoccur in the boreal spring immediately preceding the on-set of the monsoons (Fig. 2d), but earlier in the precedingDecember–February (DJF; Fig. 2c). During the DJF sea-son, 22% of the SST grid boxes within the Indian Oceancorrelate with the AIRI above the 99% significance level,and 79% correlate higher than the 95% significance level.
When correlations of monthly mean SST are com-puted with the AIRI, the strongest correlation of an
individual month SST with the AIRI occurs in the Ara-bian Sea (0.52) in December at the 48 3 48 grid cellcentered at 208N, 668E. For 19 out of the 24 yr in whichthe December Arabian Sea SST was above the mean,the Indian summer rainfall was also above normal, and16 out of the 26 yr in which the SST was below averagealso had below-average rainfall. In this manner, the De-cember Arabian Sea SST, as defined above, appears tobe a useful early predictor of monsoon strength. Whenthe Arabian Sea SST at this location is averaged overDJF [the Arabian Sea (AS1) index; Table 1], its cor-relation with the AIRI reaches 0.53, and 18 out of the24 yr with above-average AS1 index have above-av-erage mean summer rainfall. On the other hand, 15 outof the 26 yr with below-average AS1 index have below-average rainfall. The AS1 index is plotted in Fig. 3awith the AIRI. Averaging SST over a larger region with-in the Indian Ocean yields slightly lower correlations.
Figure 2c also shows that there is also a high cor-

2508 VOLUME 13J O U R N A L O F C L I M A T E
FIG. 2. Seasonal relationship of Indian Ocean SST with summer AIRI for the of period 1945–95. Correlations areshown between the JJAS AIRI and SST for seasons before and after the summer rainfall [(a)–(f)]. Contours are plottedfor values 20.7, 20.6, 0.5, 20.36, 20.28, 0.0, 0.28, 0.36, 0.45, and 0.5. Significant contours are shaded (negativewithin dashed lines) for significance above 95% (0.28) and 99% (0.36).

15 JULY 2000 2509C L A R K E T A L .
TABLE 1. SST indexes.
Region Lat, longMonths in
index SST index
AS (Arabian Sea)NWA (Northwest of Australia)CIO (Central Indian Ocean)
208N, 668E168S, 1148E
48N, 868E
DJFDJFSON
AS1NWA1CIO1
relation of DJF SST northwest of Australia (centered at168S, 1148E) with the AIRI. The DJF SST at this lo-cation [the northwest Australian (NWA1) index; Table1] correlates to the AIRI at 0.58. This time series isplotted in Fig. 3b with the AIRI. Sixteen out of 21 yearsof above-average NWA SST have above-average Indiarainfall, and 16 out of 29 yr with below-average NWASST have below-average rainfall.
We find the highest correlation of rainfall with theAIRI during the period of 1945–95 when we averagethe SST values for DJF from both the Arabian Sea andnorthwest Australia (AS1 1 NWA1). The DJF SSTtimeseries from the Arabian Sea and northwest Australiaeach correlate with the AIRI at greater than 0.5, butcorrelate with each other at only 0.4, suggesting thatSSTs at these locations reflect phenomena that are some-what independent; thus, they yield the best correlationwith the AIRI when they are combined. This combinedtime series and the AIRI are shown in Fig. 3c. The AS11 NWA1 timeseries correlates with the AIRI at 0.66.In this case, 19 out of the 25 yr with above-averageAS1 1 NWA1 have above-average rainfall, and 15 outof the 25 years with below-average AS1 1 NWA1 havebelow-average rainfall.
b. SST–Indian rainfall relationships, 1977–95
Because the Indian Ocean has undergone a significantwarming after 1976 (Nitta and Yamada 1989; Terray1994; Wang 1995), it is important to explore the affectof this climate shift on the SST–AIRI relationship. Onestudy identifies a region in the central Indian Ocean (08–58N, 808–858E) where SST from 1967 to 1987 correlateswith the AIRI at 0.75 (Sadhuram 1997). Although sig-nificant positive correlations between SST and the AIRIare seen in our analysis in the fall of the 1945–95 period(Fig. 2b), the magnitude of the correlation in this regionis only 0.38. The discrepancy between the correlationsseen by Sadhuram (1997) and our analysis can be ex-plained by analyzing the SST–AIRI connection after1976. We correlate SST with the AIRI as in the previoussection (Fig. 2), but only for the years 1977–95 (Fig.4). A region of much higher correlation (r . 0.75) isseen in the central Indian Ocean in September–Novem-ber (SON) (Fig. 4b), agreeing with Sadhuram (1997).After 1977, the positive AS1 and NWA1 correlationsare nearly the same as for the period of 1945–95 (Fig.4c), but correlations are higher than the 99% signifi-cance level (r 5 0.60) throughout most of the centralIndian Ocean (Fig. 4b; Table 2). During the fall pre-
ceding the monsoon for 1977–95, 43% of the SST val-ues correlate with the AIRI above the 95% significancelevel (r 5 0.48) and 23% of the SST values correlateabove the 99% level. The highest correlation (r 5 0.87)of SON SST with the AIRI occurred at the location 48N,868E (CIO1 index) (Table 1). This time series correlatesstrongly with the AIRI only after 1976 (Fig. 3d). Av-eraging over the region used by Sadhuram (1997) gaveslightly lower correlations than the CIO1 index. Whenthe CIO1, AS1, and NWA1 indexes are combined, theresulting timeseries has a correlation of 0.67 with theAIRI for the period of 1945–95 (Fig. 3e; Table 2) andcorrelates with the AIRI at 0.86 after 1976.
c. Tropospheric biennial oscillation
Figures 2 and 4 show that the correlations of SSTwith rainfall are generally positive preceding the onsetof the monsoon and then subsequently become stronglynegative. This is consistent with a negative feedbacksystem (Meehl 1997) that could generate a biennial os-cillation in monsoon strength. We subtract the Novem-ber SST following the monsoon from the January SSTpreceding the monsoon and correlate this remainderwith the AIRI (Fig. 5a). The feedback mechanism ap-pears to have its strongest signature in the Arabian Sea,where January SST minus the following November SSTcorrelates to the AIRI at 0.79.
Figure 5b shows the annual cycle of correlation be-tween the AIRI and monthly SST from the aforemen-tioned locations in the AS, NWA, and CIO. All threetime series show positive correlations above the 99%significance level in boreal fall and winter preceding themonsoon. These positive correlations weaken in thespring preceding the monsoon and diverge somewhatduring the summer monsoon. The correlations of theAS and the CIO monthly SST time series with rainfallrapidly become strongly negative in the fall followingthe monsoon, while the correlation with the NWA timeseries remains weakly positive. Correlation of the NWASST with the AIRI gradually becomes negative in theboreal fall following the monsoon. Similarly, Nicholls(1983, his Fig. 1) found that correlations of Indonesianand Pacific SST in boreal fall and winter with the AIRIweaken and change sign in the winter and the earlyspring preceding the monsoon.
d. Relation to ENSO
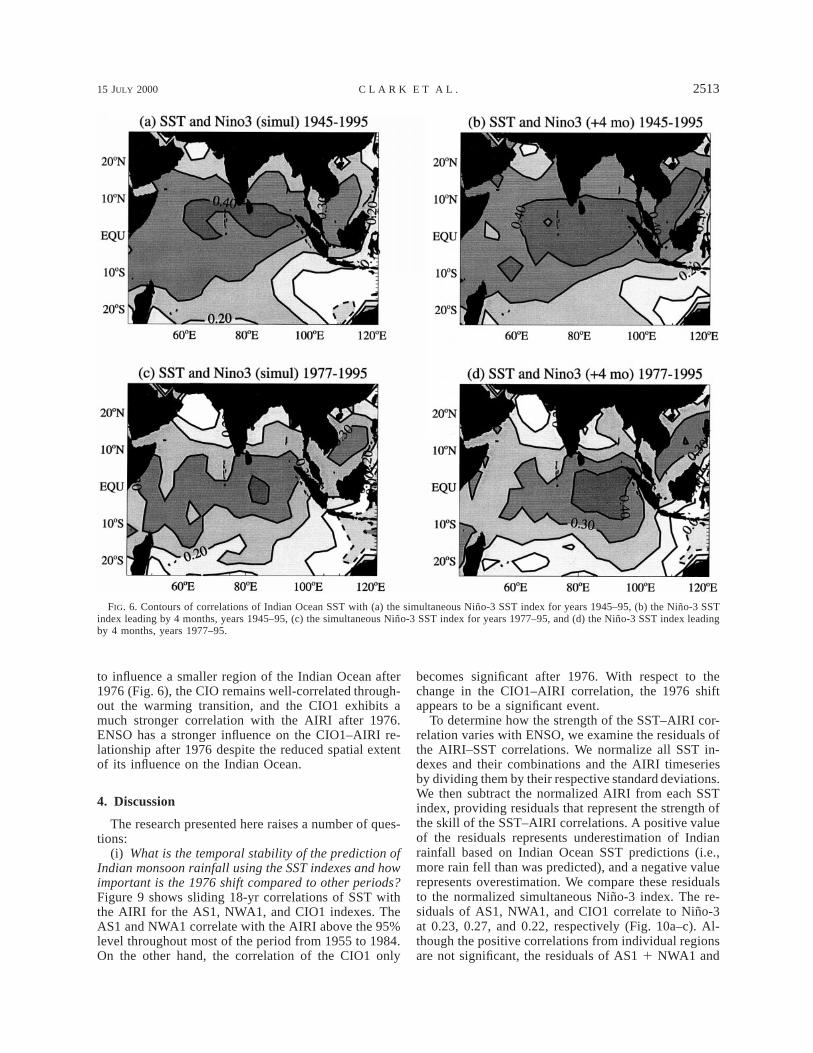
Analyses of the dominant modes of global SST showa global influence of ENSO (e.g., Lanzante 1996; Tourreand White 1995). These studies find that SST anomaliesin the Indian Ocean tend to lag those in the Pacific byabout 3 months. We investigate the influence of ENSOon the Indian Ocean SST by correlating the SST timeseries at each point in the Indian Ocean with the monthlyNino-3 index (Fig. 6). The Indian Ocean SST has itshighest simultaneous correlation (0.45) well above the

2510 VOLUME 13J O U R N A L O F C L I M A T E
FIG. 3. Relationship of Indian Ocean SST indexes and the AIRI. The AIRI (dotted line) isplotted against (a) the AS1 index, (b) the NWA1 index, (c) the combined AS1 1 NWA1 index,(d) the CIO1 index, and (e) the combined AS1 1 NWA1 1 CIO1 index. All indexes are normalized,and their correlations are shown in the panel.
99% significance level in a zonal band located to thesouth of Sri Lanka (Fig. 6a). This correlation is maxi-mized and the significant region is broadened when theSST is lagged by four months (Fig. 6b; r 5 0.51). WhenNino-3 is correlated with SST after 1977, the regioninfluenced by ENSO contracts substantially in both si-
multaneous and lagged correlation fields, although themagnitude of the highest correlations remain about thesame (Figs. 6c,d). In general, therefore, ENSO has aweaker signal in the Indian Ocean after 1976.
The three SST indexes and combinations of each in-dex were correlated to the simultaneous Nino-3 signal

15 JULY 2000 2511C L A R K E T A L .
FIG. 4. Seasonal relationship of Indian Ocean SST with summer AIRI for the period of 1977–95. Correlations areshown between the JJAS AIRI and SST for seasons before and after the summer rainfall [(a)–(f)]. Contours are plottedfor values 20.75, 20.7, 0.6, 20.48, 0.0, 0.48, 0.6, 0.7, and 0.75. Significant contours are shaded (negative withindashed lines) for significance above 95% (0.48) and 99% (0.6).

2512 VOLUME 13J O U R N A L O F C L I M A T E
TABLE 2. Correlations of SST indices with Nino-3 and AIRI. Boldface indicates correlations that are significant at the 99% level, anditalicized correlations are significant at the 95% level.
SST index(a) Nino-31945–95
(b) Nino-31977–95
(c) AIRI1945–95
(d) AIRI1977–95
(e) AIRI1945–95
Nino-3 removed
(f) AIRI 1977–95Nino-3
removed
AS1NWA1CIO1AS1 1 NWA1AS1 1 CIO1NWA1 1 CIO1AS1 1 NWA1 1 CIO1
0.390.420.380.480.460.490.52
0.060.500.320.360.200.460.36
0.530.580.430.660.570.620.67
0.630.530.870.750.820.770.86
0.520.580.320.670.540.620.68
0.630.530.660.760.760.780.84
FIG. 5. (a) Correlation of Jan (year 0) minus the following Nov(year 11) SST with the AIRI for the period of 1945–95. Shadedregions denote significance above the 95% and 99% significance lev-el. (b) Correlations of the AIRI with SST from the AS, NWA andthe CIO are plotted for a 2-yr composite. The horizontal dashed linesrepresent the 95% and the 99% significance levels, and the verticallines represent the beginning and end of the monsoon season.
for the years 1945–95 (Table 2, column a) and 1977–95 (Table 2, column b). For combinations of indexesfor SON and DJF, such as AS1 1 CIO1, Nino-3 wasaveraged over September through February. In agree-
ment with previous studies, ENSO has a strong influenceon Indian Ocean SST characteristics (Tourre and White1995; Lanzante 1996). This influence is clearly season-ally modulated, as the correlation of Nino-3 with sea-sonal indexes tends to be higher than those with allmonthly anomalies (shown in Fig. 6).
To address if and how the Indian Ocean can affectthe Asian monsoon independently from ENSO, we per-formed a regression analysis at each point in the IndianOcean to remove the ENSO signal from the SST. Theregression equation is derived from the definition of thecorrelation coefficient:
s(SST)SST(regressed) 5 SST 2 Nino-3, (1)[ ]s(Nino-3)
where s(SST) is the standard deviation of the SST ateach point and s(Nino-3) is the standard deviation ofthe Nino-3 index. The resulting SST values are uncor-related with Nino-3. We then correlated each month ofthe ‘‘ENSO free’’ SST data from 1945 to 1995 with theAIRI, as in section 3a. The results of the analysis areshown in Fig. 7. High positive correlations in winterand early spring are not reduced by the removal of theNino-3 signal when compared with Fig. 2c (Fig. 7c;Table 2). This result is not surprising considering thatthe strongest effect of ENSO occurs in the CIO ratherthan the AS or NWA. With the removal of the Nino-3signal, the correlation of the CIO index with the AIRIis reduced from 0.38 to 0.32. Thus, ENSO is contrib-uting slightly to the correlation of central Indian OceanSST with Indian rainfall. The negative correlations ofSST with the AIRI in the fall following the monsoonare also reduced by the removal of the Nino-3 signal(Fig. 7f).
When the same correlation analysis in Fig. 7 is cal-culated for the years 1977–95, the results are quite dif-ferent (Table 2, column f ). The results of the analysisfor the reduced data period is shown in Fig. 8. Theremoval of ENSO from the SST data greatly reducesthe magnitude of the correlation of SON SST in the CIO(Fig. 8b) when compared with Fig. 4b. The correlationof the CIO1 was reduced from 0.87 to 0.66, implyingthat the CIO1 predictive relationship is influenced morestrongly by ENSO after 1976. Although ENSO appears
15 JULY 2000 2513C L A R K E T A L .
FIG. 6. Contours of correlations of Indian Ocean SST with (a) the simultaneous Nino-3 SST index for years 1945–95, (b) the Nino-3 SSTindex leading by 4 months, years 1945–95, (c) the simultaneous Nino-3 SST index for years 1977–95, and (d) the Nino-3 SST index leadingby 4 months, years 1977–95.
to influence a smaller region of the Indian Ocean after1976 (Fig. 6), the CIO remains well-correlated through-out the warming transition, and the CIO1 exhibits amuch stronger correlation with the AIRI after 1976.ENSO has a stronger influence on the CIO1–AIRI re-lationship after 1976 despite the reduced spatial extentof its influence on the Indian Ocean.
4. Discussion
The research presented here raises a number of ques-tions:
(i) What is the temporal stability of the prediction ofIndian monsoon rainfall using the SST indexes and howimportant is the 1976 shift compared to other periods?Figure 9 shows sliding 18-yr correlations of SST withthe AIRI for the AS1, NWA1, and CIO1 indexes. TheAS1 and NWA1 correlate with the AIRI above the 95%level throughout most of the period from 1955 to 1984.On the other hand, the correlation of the CIO1 only
becomes significant after 1976. With respect to thechange in the CIO1–AIRI correlation, the 1976 shiftappears to be a significant event.
To determine how the strength of the SST–AIRI cor-relation varies with ENSO, we examine the residuals ofthe AIRI–SST correlations. We normalize all SST in-dexes and their combinations and the AIRI timeseriesby dividing them by their respective standard deviations.We then subtract the normalized AIRI from each SSTindex, providing residuals that represent the strength ofthe skill of the SST–AIRI correlations. A positive valueof the residuals represents underestimation of Indianrainfall based on Indian Ocean SST predictions (i.e.,more rain fell than was predicted), and a negative valuerepresents overestimation. We compare these residualsto the normalized simultaneous Nino-3 index. The re-siduals of AS1, NWA1, and CIO1 correlate to Nino-3at 0.23, 0.27, and 0.22, respectively (Fig. 10a–c). Al-though the positive correlations from individual regionsare not significant, the residuals of AS1 1 NWA1 and

2514 VOLUME 13J O U R N A L O F C L I M A T E
FIG. 7. Seasonal relationship of Indian Ocean SST with summer AIRI for the period of 1945–95 In contrast withFig. 2, the simultaneous Nino-3 SST signal has been removed from the SST data. Correlations are shown between theJJAS AIRI and SST for seasons before and after the summer rainfall [(a)–(f)]. Contours are plotted for values 20.7,20.6, 0.5, 20.36, 20.28, 0.0, 0.28, 0.36, 0.45, and 0.5. Significant contours are shaded (negative within dashed lines)for significance above 95% (0.28) and 99% (0.36).

15 JULY 2000 2515C L A R K E T A L .
FIG. 8. Seasonal relationship of Indian Ocean SST with summer AIRI for the period of 1977–95. In contrast withFig. 4, the simultaneous Nino-3 SST signal has been removed from the SST data. Correlations are shown between theJJAS AIRI and SST for seasons before and after the summer rainfall [(a)–(f)]. Contours are plotted for values 20.75,20.7, 0.6, 20.48, 0.0, 0.48, 0.6, 0.7, and 0.75. Significant contours are shaded (negative within dashed lines) forsignificance above 95% (0.48) and 99% (0.6).

2516 VOLUME 13J O U R N A L O F C L I M A T E
FIG. 9. Sliding correlations of the SST indexes with the AIRI withan 18-yr window. The horizontal dotted lines represent the 95% and99% significance level.
AS1 1 NWA1 1 CIO1 correlate with Nino-3 at 0.38and 0.39, respectively, which is significant at the 99%level (Figs. 10d,e). These results suggest that whenNino-3 is positive (El Nino years), the rainfall is oftenless than one would expect from SST prediction. Con-versely, when Nino-3 is negative (La Nina), the rainfallis greater than that predicted by the combined indices.This result is not surprising, as El Nino is generallyaccompanied by a weak monsoon and La Nina is ac-companied by a strong monsoon (Webster and Yang1992; Webster et al. 1998). The residual of the CIO1index is seen to correlate more strongly with Nino-3after 1973. There is evidence that the structure and evo-lution of ENSO have undergone changes to the back-ground state since 1976 (Wang 1995; Trenberth 1990),and our analysis shows that Indian Ocean warmingstrengthened dramatically at that time (Fig. 1). If the1976 shift in Indian Ocean climate affected the inter-action of ENSO and the Indian monsoon and if thischange represents a stable configuration, then the highcorrelation of the AIRI with the CIO1 index should yieldaccurate predictions of rainfall if the post-1976 climateregime persists. However, future climate shifts may fur-ther influence the interaction among Indian Ocean SST,ENSO, and the monsoon, which could disrupt the pre-dictive relationships we document here. Thus, changesto the background climate state influence predictive re-lationships between Indian Ocean SST and the AIRI.
Table 2 shows that although the AS1 1 NWA1 indexhas the highest correlation of Indian rainfall from 1945to 1995, after 1976, the CIO1 index gives the best pre-diction of rainfall. The residuals in Fig. 10 represent theaccuracy of the linear prediction of monsoon rainfallfrom the SST indexes. To a first order, the AS1 1 NWA1residuals do not show dramatic changes through time,suggesting that a prediction scheme based on these datais relatively stable. To the extent that the residuals cor-
relate with ENSO over part of this record, ENSO is asource of noise in the prediction that varies throughtime.
The higher correlation of the CIO1 residual with theNino-3 index after 1976 occurs following the period ofgreatest warming of the central Indian Ocean (Figs.1a,d). We suggest this change results from the shift inthe base state of the Indian Ocean. Similarly, Salingeret al. (1995) see a change in the relationship betweenAustralian rainfall and ENSO following 1976, whichthey attribute to changes in the state of the Indian Ocean.
(ii) Are the correlations between SST and rainfalldue to the biennial nature of the monsoon? For the oceanto produce a biennial oscillation of monsoon strength,as discussed by Meehl (1997), not only must a negativefeedback on SST follow the monsoon, but the resultingSST anomalies must persist until the next monsoon sea-son. In Fig. 5b, the correlation of the Arabian Sea SSTwith the AIRI is negative at the 99% significance levelin the October and November following the monsoonbut becomes less negative leading into the next monsoonseason. Although this lack of persistence does not ruleout the possibility of the Arabian Sea producing biennialmonsoon variability, it suggests that the resulting bi-ennial signal from the Arabian Sea may not be strong.The autocorrelation of the AIRI lagged by one year isonly 20.137. The 2-yr lagged autocorrelation of theAIRI is near zero (20.06) These results suggest that inboth the AIRI and the Arabian Sea, biennial activity isnot strong enough to generate the SST–AIRI relation-ships we observe. The AS1 index correlates with theprevious year with a coefficient of 0.16. The NWA1index exhibits a 1-yr lagged autocorrelation of 0.05, andthe CIO1 has a 1-yr lagged autocorrelation of 0.15.Thus, bienniality is not measurably contributing to thepredictability of the AIRI by SST indexes from theseregions.
(iii) What mechanism produces the high correlationof the regional SST indexes with summer Indian rain-fall? At this stage we have not proposed a mechanismexplaining why fall and winter SST in the Indian Oceanat these specific locations are good predictors of Indianrainfall, but any possible mechanism must satisfy certainconditions. The positive correlations of SST at the threelocations with the AIRI display the strongest signal inthe fall and winter preceding the monsoon and laterweaken in the spring. If SST was directly influencingthe monsoon through evaporation and moisture supply,one would expect positive correlations to persist andeven strengthen throughout the spring, leading to theonset of rainfall. Therefore, these SST anomalies mustinfluence the monsoon through a delayed coupledocean–atmospheric feedback. Webster et al. (1999)show evidence of a low-frequency coupled ocean–at-mosphere mode that bridges forcing from one year tothe next, independently of ENSO. This mode may beimportant for our results as the predictive capability ofthe AS1 and NWA1 indexes arises independently of any

15 JULY 2000 2517C L A R K E T A L .
FIG. 10. (a) Residual of the normalized AS1 index minus the normalized AIRI index (solid line).The residual correlates with the Nino-3 SST index (dashed line) at 0.23. (b) Residual of thenormalized NWA1 index minus the normalized AIRI index (solid line). The residual correlateswith the Nino-3 SST index (dashed line) at 0.27. (c) Residual of the normalized CIO1 minus thenormalized AIRI index (solid line). The residual correlates with the Nino-3 SST index (dashedline) at 0.22. (d) Residual of the normalized AS1 1 NWA1 index minus the normalized AIRIindex (solid line). The residual correlates with the Nino-3 SST index (dashed line) at 0.38. (e)Residual of the normalized AS1 1 NWA1 1 CIO1 minus the normalized AIRI index (solid line).The residual correlates with the Nino-3 SST index (dashed line) at 0.39. Residuals show the degreeof skill of the AIRI–SST index correlations. A positive residual represents an overestimation ofthe AIRI by the index and vice versa.

2518 VOLUME 13J O U R N A L O F C L I M A T E
ENSO influence. In addition, winter and early springSST anomalies set the strength of the monsoon gyre,and monsoon rain in equatorial regions exists somemonths before rainfall occurs in India. Overall, it is clearthat the identification of processes that produce theselong-lead indexes is essential. Identifying mechanismsthat satisfy these criteria is a focus of further investi-gation.
5. Conclusions
This study explores the annual cycle of SST–Indianmonsoon rainfall relationships. We build upon the foun-dation laid by Shukla and Mooley (1987), Rao and Gos-wami (1988), Harzallah and Sadourny (1997), and Sad-huram (1997) that Indian Ocean SST is significantlycorrelated with the all-India rainfall index severalmonths preceding the onset of the monsoon. We extendthese studies by examining the interdecadal variabilityof this relationship and its connection to ENSO, notingespecially the change of the character of the correlationsafter 1976. We draw the following conclusions.
1) Indexes composed of winter SST, the AS1, NWA1,and combined AS1 1 NWA1 correlate significantlywith subsequent AIRI (r 5 0.53, 0.58, 0.66, respec-tively), and this relationship is stable over the 50-yrperiod of our analysis.
2) A fall SST index from the central Indian Ocean(CIO1) also correlates significantly with the AIRI,but the high correlation appears to develop only after1976 (r 5 0.87), with insignificant correlations inearlier years.
3) Combining SST indexes from all three regions givesan index that correlates with the AIRI at r 5 0.67and is stable throughout the period of analysis (Fig.3e). Because this index can be constructed for a givenyear by the March preceding the summer monsoon,it holds great potential for contributing to a long-lead forecasting scheme for all-India rainfall.
4) The residual from the correlation between the AIRIand the combined SST indexes correlates with thesimultaneous Nino-3 at 0.39, which implies thatENSO indicators can improve upon a predictivescheme that uses only Indian Ocean SSTs.
5) The 1976 climate shift, seen in the datasets of bothIndian and Pacific Oceans, influences these relation-ships as follows:(a) The central Indian Ocean becomes strongly cou-
pled to the AIRI following a period of weakcorrelation.
(b) After 1976, the residual of the CIO1 linear pre-diction of the AIRI correlates more strongly toENSO than previously.
(c) These results are consistent with the idea thatPacific variability, particularly the 1976 shift, in-fluences the relationship between Indian OceanSST and the Indian monsoon.
6) Monsoon prediction strategies need to take into ac-count the decadal changing background climatestate, as background changes may enhance or de-grade predictive relationships. Whether the 1976shift represents a shift to a new state in which re-lationships are stable or a time of continually chang-ing climate in which the relationships we have iden-tified are variable remains to be determined.
7) Physical mechanisms of these relationships need tobe established in order to evaluate the stability ofmonsoon–SST relationships.
Our findings, when used in conjunction with otheraforementioned empirical predictive schemes, may con-tribute to improved early predictions of the Indian mon-soon. Future predictive schemes will use datasets ofmany variables coupled with a better understanding ofthe ocean–atmosphere–land feedback mechanisms thatgive rise to strong early correlations. It is necessary toexplore the SST–AIRI relationship before 1945 to un-derstand further the interdecadal variability of theocean–atmosphere interaction and the warming trend.Our future work will focus on the identification of phys-ical mechanisms using additional datasets such as sealevel pressure, wind, precipitation, and sea level height.Ultimately, we need to understand the physical mech-anisms that drive the observed correlations in order toidentify a predictive scheme that is stable and thereforeuseful in a time of changing background climate.
Acknowledgments. This research was supported bythe National Science Foundation Grants OCE-9614137(to J. E. Cole) and ATM-9525847 (to P. J. Webster).Special thanks to Dr. C. Torrence for assistance in ac-quiring the datasets used in this study and Drs. S. Dixitand A. Moore for discussion. The manuscript was im-proved by the comments of anonymous reviewers.
REFERENCES
Allan, R. J., J. A. Lindesay, and C. J. Reason, 1995: Multidecadalvariability in the climate system over the Indian Ocean regionduring the Austral summer. J. Climate, 8, 1853–1873.
Barnett, T. P., L. Dumenil, U. Schlese, E. Roekler, and M. Latif, 1989:The effect of Eurasian snow cover on regional and global climatevariations. J. Atmos. Sci., 46, 661–685.
Bjerknes, J., 1969: Atmospheric teleconnections from the equatorialPacific. Mon. Wea. Rev., 97, 163–172.
Bottomley, M., C. K. Folland, J. Hsiung, R. E. Newell, and D. E.Parker, 1990: Global Ocean Surface Temperature Atlas ‘GOS-TA’. Joint Meteor. Massachusetts Institute of Technology Atlas,HMSO, 20 pp.
Graham, N. E., 1994: Decadal-scale climate variability in the tropicaland North Pacific during the 1970s and 1980s: Observations andmodel results. Climate Dyn., 10, 135–162.
Harzallah, R., and R. Sadourny, 1997: Observed lead-lag relation-ships between Indian summer monsoon and some meteorologicalvariables. Climate Dyn., 13, 635–648.
Hastenrath, S., 1986: On climate prediction in the tropics. Bull. Amer.Meteor. Soc., 67, 696–702., 1987: On the prediction of India summer rainfall anomalies.J. Climate Appl. Meteor., 26, 847–857.

15 JULY 2000 2519C L A R K E T A L .
, 1994: Climate Dynamics of the Tropics. Kluwer AcademicPublishers, 488 pp.
Joseph, P. V., and P. V. Pillai, 1984: Air–sea interaction on a seasonalscale over north Indian Ocean—Part 1: Inter-annual variationsof sea surface temperature and Indian summer monsoon rainfall.Mausam, 35, 323–330.
Kershaw, R., 1988: Effect of a sea surface temperature anomaly ona prediction of the onset of the southwest monsoon over India.Quart. J. Roy. Meteor. Soc., 114, 325–345.
Lanzante, J. R., 1996: Lag relationships involving tropical sea surfacetemperatures. J. Climate, 9, 2568–2578.
Lindzen, R. S., and S. Nigam, 1987: On the role of sea surfacetemperature gradients in forcing low-level winds and conver-gence in the Tropics. J. Atmos. Sci., 44, 2418–2436.
Meehl, G. A., 1987: The annual cycle and interannual variability inthe tropical Pacific and Indian Ocean region. Mon. Wea. Rev.,115, 27–50., 1997: The south Asian monsoon and the tropospheric biennialoscillation. J. Climate, 10, 1921–1943.
Mooley, D. A., and B. Parthasarathy, 1984: Fluctuations in All-Indiasummer monsoon rainfall during 1871–1978. Climatic Change,6, 287–301.
Nicholls, N., 1983: Predicting Indian monsoon rainfall from sea-surface temperature in the Indonesia-north Australia area. Na-ture, 306, 576–577.
Nitta, T., and S. Yamada, 1989: Recent warming of tropical sea sur-face temperature and its relationship to the Northern Hemispherecirculation. J. Meteor. Soc. Japan, 67, 375–383.
Parker, D. E., M. Jackson, and E. B. Horton, 1995: The GISST2.2sea surface temperature and sea-ice climatology. Tech. Rep.CRTN 63, Hadley Centre for Climate Prediction and Research,Meteorological Office, 35 pp. [Available from Hadley Centrefor Climate Prediction and Research, Meteorological Office,London Rd., Bracknell, Berkshire RG122SY, United Kingdom.]
Parthasarathy, B., H. F. Diaz, and J. K. Eischeid, 1988: Prediction ofall-India summer monsoon rainfall with regional and large-scaleparameters. J. Geophys. Res., 93, 5341–5350., K. Rupa Kumar, and D. R. Kothawale, 1992: Indian summermonsoon rainfall indices: 1871–1990. Meteor. Mag., 121, 174–186.
Rao, K. G., and B. N. Goswami, 1988: Interannual variations of seasurface temperature over the Arabian Sea and the Indian mon-soon: A new perspective. Mon. Wea. Rev., 116, 558–568.
Sadhuram, Y., 1997: Predicting monsoon rainfall and pressure indicesfrom sea surface temperature. Curr. Sci., 72, 166–168.
Salinger, M. J., and Coauthors, 1995: Biennial oscillation associatedwith the East Asian summer monsoon and tropical sea surfacetemperatures. J. Meteor. Soc. Japan, 73, 105–124.
Shukla, J., 1975: Effect of Arabian sea-surface temperature anomalyon Indian summer monsoon: A numerical experiment with theGFDL model. J. Atmos. Sci., 32, 503–511., 1987: Interannual variability of monsoons. Monsoons, J. S. Feinand P. L. Stephens, Eds., John Wiley and Sons, 399–464.
, and D. A. Mooley, 1987: Empirical prediction of the summermonsoon rainfall over India. Mon. Wea. Rev., 115, 695–703., and M. J. Fennessy, 1994: Simulation and predictability ofmonsoons. Proc. Int. Conf. on Monsoon Variability and Pre-diction, Tech. Rep. WCRP-84, Geneva, Switzerland, World Cli-mate Research Programme, 567–575.
Sperber, K. R., and T. N. Palmer, 1996: Interannual tropical rainfallvariability in general circulation model simulations associatedwith the Atmospheric Model Intercomparison Project. J. Cli-mate, 9, 2727–2750.
Terray, P., 1994: An evaluation of climatological data in the IndianOcean area. J. Meteor. Soc. Japan, 72, 359–385.
Torrence, C., and P. J. Webster, 1999: Interdecadal changes in theENSO–monsoon system. J. Climate, 12, 2679–2690.
Tourre, Y., and W. White, 1995: ENSO signals in global upper-oceantemperature. J. Phys. Oceanogr., 25, 1317–1332.
Trenberth, K. E., 1990: Recent observed interdecadal climate changesin the Northern Hemisphere. Bull. Amer. Meteor. Soc., 71, 988–993., and T. J. Hoar, 1996: The 1990–1995 El Nino–Southern Os-cillation event: Longest on record. Geophys. Res. Lett., 23, 57–60.
Troup, A. J., 1965: The Southern Oscillation. Quart. J. Roy. Meteor.Soc., 91, 490–506.
Vernekar, A. D., J. Zhou, and J. Shukla, 1995: The effect of Eurasiansnow cover on the Indian monsoon. J. Climate, 8, 248–266.
Wang, B., 1995: Interdecadal changes in El Nino onset in the lastfour decades. J. Climate, 8, 267–285.
Webster, P. J., 1987: The elementary monsoon. Monsoons, J. S. Feinand P. L. Stephens, Eds., John Wiley and Sons, 399–464., and S. Yang, 1992: Monsoon and ENSO: Selectively interactivesystems. Quart. J. Roy. Meteor. Soc., 118, 877–926., V. O. Magana, T. N. Palmer, J. Shukla, R. A. Tomas, M. Yanai,and T. Yasunari, 1998: Monsoons: Processes, predictability, andthe prospects for prediction. J. Geophys. Res., 103, 14 451–14 510., A. M. Moore, J. P. Loschnigg, and R. R. Leben, 1999: Coupledocean–atmosphere dynamics in the Indian Ocean during 1997–98. Nature, 40, 356–360.
World Climate Research Programme (WCRP), 1992: Simulation ofinterannual and intraseasonal monsoon variability. Tech. Doc-ument WMO/TD 470, 145 pp.
Wu, M.-C., 1985: On the prediction of the Indian summer monsoon.Pap. Meteor. Res., 8, 35–43.
Yanai, M., and C. Li, 1994: Mechanism of heating and the boundarylayer over the Tibetan Plateau. Mon. Wea. Rev, 122, 305–323.
Yang, S., 1996: ENSO-snow-monsoon associations and seasonal-to-interannual predictions. Int. J. Climatol, 16, 125–134., and K. M. Lau, 1998: Influences of sea surface temperatureand ground wetness on the Asian summer monsoon. J. Climate,11, 3230–3246.
Yasunari, T., A. Kitoh, and T. Tokioka, 1991: Local and remote re-sponses to excessive snow mass over Eurasia appearing in thenorthern spring and summer climate—A study with the MRIH-GCM. J. Meteor. Soc. Japan, 69, 473–487.