india:fiscal reforms and public … research paper no. 11jbic research paper no. 11 india:fiscal...
TRANSCRIPT

JBIC Research Paper No. JBIC Research Paper No. JBIC Research Paper No. JBIC Research Paper No. 11111111
INDIA:FISCAL REFORMS ANDINDIA:FISCAL REFORMS ANDINDIA:FISCAL REFORMS ANDINDIA:FISCAL REFORMS ANDPUBLIC EXPENDITUREPUBLIC EXPENDITUREPUBLIC EXPENDITUREPUBLIC EXPENDITURE
MANAGEMENTMANAGEMENTMANAGEMENTMANAGEMENT
September 2001September 2001September 2001September 2001
Research Institute for Development and FinanceResearch Institute for Development and FinanceResearch Institute for Development and FinanceResearch Institute for Development and FinanceJapan Bank for International CooperationJapan Bank for International CooperationJapan Bank for International CooperationJapan Bank for International Cooperation

JBIC Research Paper No. JBIC Research Paper No. JBIC Research Paper No. JBIC Research Paper No. 11111111Japan Bank for International Cooperation (JBIC)Japan Bank for International Cooperation (JBIC)Japan Bank for International Cooperation (JBIC)Japan Bank for International Cooperation (JBIC)Published in March 2001Published in March 2001Published in March 2001Published in March 2001© 2001 Japan Bank for International Cooperation
All rights reserved.
This Research Paper is based on the findings and discussions of the Research Institute for
Development and Finance, JBIC *. The views expressed in this paper are entirely those of the authors
and do not necessarily reflect those of JBIC. Some sources cited in this paper may be informal
documents that are not readily available. No part of this publication may be reprinted by any means
without prior permission from JBIC.
* Japan Bank for International Cooperation (JBIC) was established in October 1999 as anorganization that conducts Japan’s external economic policy and economic cooperation. JBIC ispursuing a more enhanced role by integrating the functions of two merged organizations: The Export-Import bank of Japan (JEXIM) and the Overseas Economic Cooperation Fund, Japan (OECF). Upon the establishment of JBIC, the Research Institute for Development and Finance (JBICInstitute) was created as its research arm. Its research activities are geared toward improving theoverall quality of JBIC’s operations through systematic analysis of various issues and policies relatedto JBIC’s activities. JBIC Institute was established by merging the two former research institutes: theResearch Institute for International Investment and Development (RIIID) of JEXIM and the ResearchInstitute of Development Assistance (RIDA) of OECF.
i
ForewordForewordForewordForeword
Public Expenditure Management (PEM) is a framework of fiscal reform to
enhance effectiveness of public policy. PEM is being applied to fiscal reform in
developed as well as developing countries as a core of measures to maximize
outcome of public policy. In developing countries, PEM is crucially important to
implement various policies for poverty alleviation with scarce resources. In view of
this, JBIC Research Institute for Development and Finance (JBIC Institute) has
commissioned series of studies on “Public Expenditure Management”. The JBIC
Research Paper No.10 studied in depth, with Philippines and Punjub Province of
Pakistan as case studies, various challenges of PEM in developing countries.
This study on India’s financial reform is completed by Dr. K.B.L. Mathur,,,,
Economic Adviser in the Banking Division of the Department of Economic Affairs,
Ministry of Finance, Government of India, and aims primarily to revise the report
“Indian Economic Management” published in 1995 by the same author. In this
revision, PEM point of view has been incorporated to reflect most recent agenda in
public sector reform. It means that this report can also be read as a comprehensive
study on India’s Fiscal Reform as well as PEM case study for India.
The report covers wide range of issues on India’s fiscal reform, which has
made remarkable progress in the last decade of 20th century. We hope this report
will be useful for practioners as well as researchers who are concerned with India’s
economic development and fiscal reform in developing countries in general.
Finally, I would like to express my sincere thanks to Dr. K.B.L. Mathur for his
tremendous effort to complete this study.
August 2001
Koji Fujimoto
Executive Director
Research Institute for Development and Finance
Japan Bank for International Cooperation
ii
Brief Resume of Dr. K. B. L. Mathur
Dr. K. B. L. Mathur (b.1946) is presently working as Economic Adviser in the
Banking Division of the Department of Economic Affairs, Ministry of Finance,Government of India. With nearly three decades of experience as an economist withthe Government of India, he has been working in the Ministry of Finance with
different portfolios now for about a decade and a half. Earlier he held seniorpositions in the Planning Commission, Government of India for over a decade till1984.
Dr. Mathur is an acknowledged expert in the fields of macro economicstabilization policy, fiscal federalism, external finance, and management of Indianeconomic system.
Dr. Mathur is an author of a book on “Management of Indian Economy-Systems and Processes ” which was published (May 1995) by the OECF, New DelhiOffice. His other major publication is this report “India: Fiscal Reforms and Public
Expenditure Management (2001). This work is based on his presentations made byhim at JBIC Institute in September 2000.
As U.N. Expert on Mission, Dr. Mathur had completed an assignment (Aug-
Nov, 1997) for the Government of Nigeria under a UNDP project. In December 2000,Dr. Mathur was a guest faculty member at a workshop organized by HarvardUniversity, Kennedy School, on “Management of Foreign Aid in Africa Region” held
in Nairobi, Kenya.
Besides a Diploma in Advanced Economic Studies from the ManchesterUniversity, UK in 1985, Dr. Mathur has represented Government of India in
various international for a such as ADB Seminar (1991), SIDA Seminar (1992),International Law Institute, Washington (1992), a visiting researcher at theInstitute of Fiscal and Monetary Policy (IFMP), Ministry of Finance, Tokyo (1993),
Harvard Institute for International Development (HIID), Harvard University(Summer, 1995), and JICA Sponsored Seminar on Two Step Financing of Small andMedium Enterprises held in Tokyo (November-December, 1999).
In his official capacity of Director in the Banking Division of the Ministry ofFinance, Dr. Mathur is a Government of India Nominee Director on the Board ofDirectors of a nationalized bank and Tourism Finance Corporation of India. Prior to
joining the Government of India in 1971, Dr. Mathur was lecturer in theDepartment of Economics, University of Rajasthan having obtained his postgraduate and Ph. D. degrees from the same University.
E Mail: [email protected]
Tel. (Off) 91-11-3745128 & Fax. 91-11-3742207Tel. (Res) 91-11-6193099

iii
PrefacePrefacePrefacePreface
At the dawn of the new Millennium, poverty reduction in the developing
world has resurfaced as the most important subject in the literature on economic
development. Most international institutions have joined the global campaign
against poverty considering it as the greatest challenge before the world economy.
There are no two opinions on any government's objective of removal of
poverty. Sustained growth of an economy is considered to be a necessary condition
to reduce poverty. This, however, can hardly be achieved without maintaining
macroeconomic stability. And a continuing high level of fiscal deficit could be the
most serious threat to macroeconomic stability. Fiscal deficit, it is widely agreed,
cannot be corrected without effective and efficient public expenditure
management (PEM). PEM, therefore, has to be a central instrument of state
policy and effective governance.
In this context studies initiated by the JBIC Institute on country specific
assessments of PEM systems for a few developing countries is the most effective
step towards understanding the issues relating to public expenditure
management and poverty reduction in developing countries. This study on 'India :
Fiscal Reforms and Public Expenditure Management' is part of the series of such
studies the first two being on Pakistan and Philippines. A limited purpose of this
study is to assess the public expenditure management system in India with an
objective to identify the major tasks ahead.
A brief introduction to Indian economy with some comparative performance
indicators of select countries forms the initial part of Chapter 1 on Macroeconomic
Trends and Perspectives on Indian Economy. This chapter highlights recent
trends in major macroeconomic indicators of the Indian economy, as a background
to the perspectives indicated in some important studies/reports covering the
Indian economy. Before summarizing the perspectives, an overview of recent
economic reforms has also been given. A limited purpose of the chapter being to
provide a background of trends and perspectives only any analysis of factors
leading to these trends had to be restrained.
An assessment of public expenditure management and fiscal reforms being
the main theme of the study it was considered of use to provide a brief
introduction to some of the important and unique features of the Indian fiscal
system. Chapter 2, therefore, includes some dimensional aspects of the budgetary
parameters, fiscal deficit and financing thereof, the plan-budget link, the fiscal
federal system, the role of the Central Bank, and introduction to the main game
players in the budget formulation process.

iv
Chapter 3 provides an overview of Reforms and Trends in the fiscal sector of
Indian economy. Major initiatives in the fiscal sector during the macroeconomic
reforms process have been highlighted in part 3.1 of this chapter. These include
tax reform measures, public sector restructuring, systemic reforms in
governments' borrowing process, expenditure reforms, fiscal reform initiatives of
the State governments, and finally the main features of the Fiscal Responsibility
and Budget Management Bill 2000 introduced in the Parliament on December 20,
2000. Second part of this chapter (part 3.2) reviews recent trends in government
finances. Trends in aggregate balances, receipts and expenditure both for the
Central government and State governments have been reviewed to bring out the
issues of policy and management.
Chapter 4 on 'Public Expenditure Management (PEM) in India’ first traces
the link between the ultimate objective of economic policy -- that of removal of
poverty and public expenditure management. As governance encompasses PEM,
the essentials of good governance and effective PEM are highlighted. With the
purpose of assessing effectiveness of PEM in India a framework of PEM cycle
developed in studies undertaken by the JBIC Institute for two other developing
countries i.e. Pakistan and Philippines is adopted. Each stage of PEM cycle is
then assessed for its system, strengths and weaknesses to identify the tasks
ahead. An alternate assessment of the budget and financial management
practices earlier made in a World Bank study is also reviewed.
Chapter 5 brings out the major issues and recent developments in
Decentralization in India. In the context of PEM system already assessed, a
limited purpose of this chapter is to identify the main issues relating to fiscal
decentralization with a glimpse of international experience on decentralization
practices.
Highlights of the preliminary draft of the study were discussed with a group
of experts through presentations made by the author at the JBIC Institute in the
second week of September 2000. Based on the expert comments and suggestions, a
draft of the study was submitted to the JBIC Institute in November, 2000 for
comments. This final report incorporates responses to the extensive and expert
comments on the draft, received from the JBIC Institute in December, 2000.
K.B.L. K.B.L. K.B.L. K.B.L. MathurMathurMathurMathur
v
AcknowledgementsAcknowledgementsAcknowledgementsAcknowledgements
The basic idea for this study originated from Mr. Kaoru Hayashi, Deputy
Director General, JBIC Institute, from his deep understanding of the Indian
economy through his earlier assignment in India with OECF office and continuing
academic interest in India's development effort. For seeing through this study in
its present form grateful acknowledgements are due to Mr Hayashi for his
valuable contribution in many ways including finalizing and getting the scope of
the study approved, organising the presentations and discussions with experts at
the JBIC Institute, and sending insightful expert comments on the draft. Mr.
Mitsuhide Noguchi, former Director General, JBIC Institute took personal and
keen interest during the lecture cum presentations at the Institute. The other
experts at the JBIC Institute who extended valuable comments during the
presentation meetings include Mr. Yoshihiko Morita, Mr. Masahito Ikeda, Mr.
Katsumi Nishina, Dr. Naohiro Kitano, Ms. Yasuko Ose, economist and Ms. Nami
Hasegawa extended valuable help during my visit to the Institute and in
organising the presentations. Back home, acknowledgements are due to Mr
Kasuto Tsuji, Chief Representative JBIC, Mr. Naruhiko Takesada, the ex-
representative, Mr. Teruyuki Ito, Representative and Mr. C.K. Gaur, Adviser in
JBIC, New Delhi office.
Without the permission and study leave granted by the Government of India
this work was perhaps not possible. Shri Anoop Mishra, the then Joint Secretary
was generous enough in recommending the study leave which was approved by
Shri M. Damodaran, the then Joint Secretary and finally by Shri Devi Dayal,
Special Secretary, Banking Division, Department of Economic Affairs, Ministry of
Finance. Shri Shekhar Agarwal, Joint Secretary helped me in extending the leave
period to enable me complete the task at hand.
Grateful acknowledgements are due to Dr. Y. Venugopal Reddy, currently
Deputy Governor, Reserve Bank of India, who as a guru encourages, inspires and
guides me. From developing the outline to finalizing the draft of this study also,
the guidance from Dr. Reddy has been most generous, as usual for me, and highly
valuable. Any error, of course, is solely my responsibility.
During the preparation of various drafts I was lucky to get valuable
comments from a large number of my colleagues in the Ministry of Finance. Shri
N.R. Rayalu, Financial Adviser in the Ministry and Shri Arun Sharma now
Financial Adviser in the Ministry of Science and Technology extended their
valuable expert comments particularly on the draft of the chapter on Public
Expenditure Management. Shri Dinesh Kumar Tyagi and Shri Alok Kumar,

vi
Directors in the Banking Division consistently encouraged me by responding to
the ideas, I was developing at the draft stage.
Professor M.C. Purohit, National Institute of Public Finance and Policy
helped through professional interactions on the subject and making available the
relevant literature useful for this study.
Acknowledgements are due to Mr. M.P. Singh, Mr. Jagdish Tomar and Mr. G.
Jegadeesan in extending secretarial as well as logistic support in giving this study
the present shape. Valuable contribution in the form of editorial comments from
Dr. Ram Sangapure helped improving the final version.
Finally, I wish to thank formally also, members of my family, Dr. Sudha
Mathur, my wife and Dr. Piyush, my son for helping me in so many ways while
concentrating on the work. Parul, my daughter provided me the moral support
despite lack of interest in this type of study, her interest currently being only in
theory and econometric studies as a postgraduate student at the Delhi School of
Economics.
K.B.L. K.B.L. K.B.L. K.B.L. MathurMathurMathurMathur

vii
Contents
Foreword・・・・・・・・・・・・・・・・・・・・・・・・・・・・・・・・・・・・・・・・・・・・・・・・・・・・・・・・・・・・・・・・・・・ i
Preface・・・・・・・・・・・・・・・・・・・・・・・・・・・・・・・・・・・・・・・・・・・・・・・・・・・・・・・・・・・・・・・・・・・・ iii
Acknowledgements・・・・・・・・・・・・・・・・・・・・・・・・・・・・・・・・・・・・・・・・・・・・・・・・・・・・・・・・・・v
Contents ・・・・・・・・・・・・・・・・・・・・・・・・・・・・・・・・・・・・・・・・・・・・・・・・・・・・・・・・・・・・・・・・・ vii
List of Appendices ・・・・・・・・・・・・・・・・・・・・・・・・・・・・・・・・・・・・・・・・・・・・・・・・・・・・・・・・・・x
List of Tables ・・・・・・・・・・・・・・・・・・・・・・・・・・・・・・・・・・・・・・・・・・・・・・・・・・・・・・・・・・・・・・・x
List of Boxes・・・・・・・・・・・・・・・・・・・・・・・・・・・・・・・・・・・・・・・・・・・・・・・・・・・・・・・・・・・・・・・ xi
List of Annexes ・・・・・・・・・・・・・・・・・・・・・・・・・・・・・・・・・・・・・・・・・・・・・・・・・・・・・・・・・・・ xii
Acronyms ・・・・・・・・・・・・・・・・・・・・・・・・・・・・・・・・・・・・・・・・・・・・・・・・・・・・・・・・・・・・・・・・xiii
Chapter Ⅰ
Indian Economy : Macroeconomic Trends and Perspectives・・・・・・・・・・・・・・・・・・・・1
1.1 Introduction・・・・・・・・・・・・・・・・・・・・・・・・・・・・・・・・・・・・・・・・・・・・・・・・・・・・・・・・1
1.2 Macroeconomic Trends ・・・・・・・・・・・・・・・・・・・・・・・・・・・・・・・・・・・・・・・・・・・・・・2
1.2.1 Indian Economy : Trends in Growth Rate・・・・・・・・・・・・・・・・・・・・・・・・・・2
1.2.2 Trends in Structural Composition・・・・・・・・・・・・・・・・・・・・・・・・・・・・・・・・・2
1.2.3 Indian Economy : Savings & Investments ・・・・・・・・・・・・・・・・・・・・・・・・・4
1.2.4 Agriculture ・・・・・・・・・・・・・・・・・・・・・・・・・・・・・・・・・・・・・・・・・・・・・・・・・・・・・6
1.2.5 Industry・・・・・・・・・・・・・・・・・・・・・・・・・・・・・・・・・・・・・・・・・・・・・・・・・・・・・・・・7
1.2.6 Money, Credit and Prices ・・・・・・・・・・・・・・・・・・・・・・・・・・・・・・・・・・・・・・・・9
1.2.7 Fiscal Trends ・・・・・・・・・・・・・・・・・・・・・・・・・・・・・・・・・・・・・・・・・・・・・・・・・ 12
1.2.8 Foreign Trade ・・・・・・・・・・・・・・・・・・・・・・・・・・・・・・・・・・・・・・・・・・・・・・・・ 15
1.2.9 Balance of Payments ・・・・・・・・・・・・・・・・・・・・・・・・・・・・・・・・・・・・・・・・・・ 16
1.2.10 Social Indicators ・・・・・・・・・・・・・・・・・・・・・・・・・・・・・・・・・・・・・・・・・・・・・・ 19
1.3 Economic Reforms : An Overview・・・・・・・・・・・・・・・・・・・・・・・・・・・・・・・・・・・ 20
1.4 Indian Economy : Perspectives ・・・・・・・・・・・・・・・・・・・・・・・・・・・・・・・・・・・・・ 27
Chapter Ⅱ
Fiscal System in India : Main Features・・・・・・・・・・・・・・・・・・・・・・・・・・・・・・・・・・・・ 36
2.1 Some Dimensional Features ・・・・・・・・・・・・・・・・・・・・・・・・・・・・・・・・・・・・・・・ 36
2.1.1 Budgetary Parameters・・・・・・・・・・・・・・・・・・・・・・・・・・・・・・・・・・・・・・・・・ 36
2.2 Link between budgetary allocations and the Public Sector Plan ・・・・・・・ 40
2.3 The Fiscal Federal System・・・・・・・・・・・・・・・・・・・・・・・・・・・・・・・・・・・・・・・・・ 42
2.3.1 Forms and channels of central budgetary transfers ・・・・・・・・・・・・・・・ 42
2.3.2 Some recent changes for Statutory Transfers ・・・・・・・・・・・・・・・・・・・・ 43
2.3.3 Transfers to Local Bodies (The third tier of the Government) ・・・・・・ 46
2.4 Role of the Central Bank : The Reserve Bank of India ・・・・・・・・・・・・・・・・ 47
2.4.1 RBI and Central Government ・・・・・・・・・・・・・・・・・・・・・・・・・・・・・・・・・・ 47

viii
2.4.2 RBI and State Governments ・・・・・・・・・・・・・・・・・・・・・・・・・・・・・・・・・・・48
2.4.3 Management of Market Borrowings ・・・・・・・・・・・・・・・・・・・・・・・・・・・・・49
2.5 Game players in Budget formulation ・・・・・・・・・・・・・・・・・・・・・・・・・・・・・・・50
Chapter ⅢFiscal Sector : Reforms and Trends ・・・・・・・・・・・・・・・・・・・・・・・・・・・・・・・・・・・・・・・52
3.1 Fiscal Sector Reforms・・・・・・・・・・・・・・・・・・・・・・・・・・・・・・・・・・・・・・・・・・・・・52
3.1.1 Tax Reforms・・・・・・・・・・・・・・・・・・・・・・・・・・・・・・・・・・・・・・・・・・・・・・・・・・53
3.1.2 Disinvestment / Privatization/Public Sector restructuring ・・・・・・・・・54
3.1.3 Systemic reforms in Government's borrowing process ・・・・・・・・・・・・・54
3.1.4 Expenditure Reforms Commission ・・・・・・・・・・・・・・・・・・・・・・・・・・・・・・55
3.1.5 Fiscal Reforms Program for the States ・・・・・・・・・・・・・・・・・・・・・・・・・・56
3.1.6 Project Management Unit (PMU) for Externally Aided Projects ・・・・57
3.1.7 RBI initiatives on Reforms in State Finances・・・・・・・・・・・・・・・・・・・・・58
3.1.8 Fiscal Responsibility Act・・・・・・・・・・・・・・・・・・・・・・・・・・・・・・・・・・・・・・・59
3.2 Recent Trends in Government Finances・・・・・・・・・・・・・・・・・・・・・・・・・・・・・60
3.2.1 Trends in Aggregate Budgetary Balances ・・・・・・・・・・・・・・・・・・・・・・・・61
3.2.2 Trends in Revenue Account Receipts ・・・・・・・・・・・・・・・・・・・・・・・・・・・・64
3.2.3 Trends in Non Tax Revenue・・・・・・・・・・・・・・・・・・・・・・・・・・・・・・・・・・・・66
3.2.4 Trends in Budget Expenditure ・・・・・・・・・・・・・・・・・・・・・・・・・・・・・・・・・68
3.2.5 Issues of Policy and Management ・・・・・・・・・・・・・・・・・・・・・・・・・・・・・・・72
Chapter Ⅳ
Public Expenditure Management (PEM) in India ・・・・・・・・・・・・・・・・・・・・・・・・・・・82
4.1 Introduction ・・・・・・・・・・・・・・・・・・・・・・・・・・・・・・・・・・・・・・・・・・・・・・・・・・・・・82
4.1.1 Growth and Poverty・・・・・・・・・・・・・・・・・・・・・・・・・・・・・・・・・・・・・・・・・・・・・・・82
4.1.2 Governance and PEM ・・・・・・・・・・・・・・・・・・・・・・・・・・・・・・・・・・・・・・・・・・・・・83
4.2 PEM : Concept, Objectives and Dimensions ・・・・・・・・・・・・・・・・・・・・・・・・・85
4.2.1 PEM : The Concept・・・・・・・・・・・・・・・・・・・・・・・・・・・・・・・・・・・・・・・・・・・・85
4.2.2 Objectives of PEM ・・・・・・・・・・・・・・・・・・・・・・・・・・・・・・・・・・・・・・・・・・・・85
4.2.3 Dimensions of PEM ・・・・・・・・・・・・・・・・・・・・・・・・・・・・・・・・・・・・・・・・・・・86
4.2.4 The PEM Framework ・・・・・・・・・・・・・・・・・・・・・・・・・・・・・・・・・・・・・・・・・87
4.3 PEM in India : An assessment ・・・・・・・・・・・・・・・・・・・・・・・・・・・・・・・・・・・・・87
4.3.1 PEM in India : POLICY ・・・・・・・・・・・・・・・・・・・・・・・・・・・・・・・・・・・・・・・89
4.3.2 PEM in India : PLAN/PROGRAM/ACTIVITY ・・・・・・・・・・・・・・・・・・・・91
4.3.3 PEM in India : MONITORING OF IMPLEMENTATION ・・・・・・・・・・92
4.3.4 PEM in India : Expenditure Control・・・・・・・・・・・・・・・・・・・・・・・・・・・・・93
4.3.5 PEM in India : Audit of Expenditure ・・・・・・・・・・・・・・・・・・・・・・・・・・・・94
4.3.6 PEM in India : Evaluation ・・・・・・・・・・・・・・・・・・・・・・・・・・・・・・・・・・・・・95
4.3.7 PEM in India : FEEDBACK・・・・・・・・・・・・・・・・・・・・・・・・・・・・・・・・・・・・・・96

ix
4.3.8 Substantiating the assessment ・・・・・・・・・・・・・・・・・・・・・・・・・・・・・・・・・97
4.3.9 Some limitations of the assessment ・・・・・・・・・・・・・・・・・・・・・・・・・・・・・99
4.4 PEM in India : An assessment in World Bank Framework ・・・・・・・・・・・103
4.4.1 General Observations ・・・・・・・・・・・・・・・・・・・・・・・・・・・・・・・・・・・・・・・・103
4.4.2 Evaluation through Checklist ・・・・・・・・・・・・・・・・・・・・・・・・・・・・・・・・・103
4.4.3 Output and Outcomes ・・・・・・・・・・・・・・・・・・・・・・・・・・・・・・・・・・・・・・・・105
4.4.4 Suggested Reform Programs ・・・・・・・・・・・・・・・・・・・・・・・・・・・・・・・・・・106
4.5 Summary Conclusions ・・・・・・・・・・・・・・・・・・・・・・・・・・・・・・・・・・・・・・・・・・・107
Chapter ⅤDecentralization in India : Developments and Issues・・・・・・・・・・・・・・・・・・・・・・・113
5.1 Introduction ・・・・・・・・・・・・・・・・・・・・・・・・・・・・・・・・・・・・・・・・・・・・・・・・・・・・113
5.2 Decentralization : Concept and International Experience ・・・・・・・・・・・・113
5.3 Decentralization in India・・・・・・・・・・・・・・・・・・・・・・・・・・・・・・・・・・・・・・・・・115
5.3.1 Background ・・・・・・・・・・・・・・・・・・・・・・・・・・・・・・・・・・・・・・・・・・・・・・・・・115
5.3.2 The Constitutional and legal framework for local bodies ・・・・・・・・・・116
5.3.3 Some Dimensional features of local bodies ・・・・・・・・・・・・・・・・・・・・・・118
5.4 Developments and Issues ・・・・・・・・・・・・・・・・・・・・・・・・・・・・・・・・・・・・・・・・118
Annexes ・・・・・・・・・・・・・・・・・・・・・・・・・・・・・・・・・・・・・・・・・・・・・・・・・・・・・・・・・127
Bibliography ・・・・・・・・・・・・・・・・・・・・・・・・・・・・・・・・・・・・・・・・・・・・・・・・・・・・・207
x
List of AppendicesList of AppendicesList of AppendicesList of Appendices
1.1 (a) Indian Economy : Comparison of Economic Performance Among
Select Countries・・・・・・・・・・・・・・・・・・・・・・・・・・・・・・・・・・・・・・・・・・・・・・・・・・・30
(b) Indian Economy : Ranking of Select Countries based on various
Socio-Economic Indices ・・・・・・・・・・・・・・・・・・・・・・・・・・・・・・・・・・・・・・・・・・・・・32
1.2 Indian Economy : Select Macroeconomic and Financial Indicators ・・・・・・・35
3.1 Major Policy Initiatives by State Governments in 2000-01 ・・・・・・・・・・・・・・74
3.2 (a) Revenue and Expenditure of the Central Government・・・・・・・・・・・・・・・79
(b) Revenue and Expenditure of all States, consolidated ・・・・・・・・・・・・・・・・80
3.3 (a) Composition of Expenditure of Central Government ・・・・・・・・・・・・・・・・81
(b) Profile of Total Expenditure of State Governments・・・・・・・・・・・・・・・・・・81
4.1 Employment Assurance Scheme (EAS) ・・・・・・・・・・・・・・・・・・・・・・・・・・・・・・110
List of TablesList of TablesList of TablesList of Tables
Table.1.1. (a) Indian Economy : Growth Rate ・・・・・・・・・・・・・・・・・・・・・・・・・・・・・・ 3
(b) Growth Rates during Five Year Plans ・・・・・・・・・・・・・・・・・・・・・・・・ 3
(c) Growth Rates : International Comparison・・・・・・・・・・・・・・・・・・・・・ 3
Table.1.2 (a) Indian Economy : Trends in Structural Composition ・・・・・・・・・・・ 4
(b) Structure of output : International Comparison・・・・・・・・・・・・・・・・ 4
Table.1.3 (a) Indian Economy : Saving and Investment ・・・・・・・・・・・・・・・・・・・・・ 6
(b) Saving and Investment : International Comparison ・・・・・・・・・・・・ 6
Table.1.4 (a) Foodgrains Production・・・・・・・・・・・・・・・・・・・・・・・・・・・・・・・・・・・・・・ 7
(b) Annual Compound Growth Rates of Foodgrains Production ・・・・・ 7
Table.1.5 (a) Relative Contribution of Sectors to Industrial Production ・・・・・・・ 8
(b) Industrial Production・・・・・・・・・・・・・・・・・・・・・・・・・・・・・・・・・・・・・・・ 8
(c) Infrastructure Industries ・・・・・・・・・・・・・・・・・・・・・・・・・・・・・・・・・・・ 9
Table.1.6 (a) Major Monetary and Banking Aggregates ・・・・・・・・・・・・・・・・・・・・11
(b) Trends in Prices ・・・・・・・・・・・・・・・・・・・・・・・・・・・・・・・・・・・・・・・・・・12
Table.1.7 (a) Fiscal Trends : Deficit and Debt・・・・・・・・・・・・・・・・・・・・・・・・・・・・・13
(b) Fiscal Trends : Receipt and Expenditure ・・・・・・・・・・・・・・・・・・・・・14
Table.1.8 Foreign Trade ・・・・・・・・・・・・・・・・・・・・・・・・・・・・・・・・・・・・・・・・・・・・・・・・16
Table.1.9 Key Indicators of Balance of Payments ・・・・・・・・・・・・・・・・・・・・・・・・・・19
Table.1.10 Indian Economy : Social Indicators ・・・・・・・・・・・・・・・・・・・・・・・・・・・・・20
Table.2.1 Combined Receipts and Disbursements of the Central and State・・・・37
Governments 1999-2000 (Revised Estimates)
Table.2.2 Receipts and Expenditure : Centre and States 1999-2000 (Revised
Estimates) ・・・・・・・・・・・・・・・・・・・・・・・・・・・・・・・・・・・・・・・・・・・・・・・・・・・38
Table.2.3 Levels of Deficits in Government Budgets・・・・・・・・・・・・・・・・・・・・・・・・39

xi
Table.2.4 Devolution of Revenues as recommended by 10th and 11th Finance
Commissions ・・・・・・・・・・・・・・・・・・・・・・・・・・・・・・・・・・・・・・・・・・・・・・・・・45
Table.3.1 Aggregate Budgetary Balance : Centre and States ・・・・・・・・・・・・・・・・62
Table.3.2 Frequency Distribution of States according to size of Revenue ・・・・・・63
Surplus/Deficit and Fiscal Deficit (as % of GSDP)
Table.3.3 Tax buoyancy : Centre and States・・・・・・・・・・・・・・・・・・・・・・・・・・・・・・・64
Table.3.4 Composition and Tax GDP ratio : Central Taxes ・・・・・・・・・・・・・・・・・・65
Table.3.5 Indicators of Cost Recovery (Ratio of Non-tax Revenue Receipts ・・・・67
to Non-Plan Revenue Expenditure)in States
Table.3.6 Trends in Expenditure : Central Government ・・・・・・・・・・・・・・・・・・・・69
Table.3.7 Trends in Expenditure : All States ・・・・・・・・・・・・・・・・・・・・・・・・・・・・・・71
Table.4.1 Objectives of Public Expenditure Management ・・・・・・・・・・・・・・・・・・・86
Table.4.2 Stages and Elements in PEM cycle (JBIC framework) ・・・・・・・・・・・・・88
Table.4.3 State-wise Fiscal Marksmanship (Major States) ・・・・・・・・・・・・・・・・・102
Table.4.4 Summary Evaluation of Budget and Financial Management
Practices ・・・・・・・・・・・・・・・・・・・・・・・・・・・・・・・・・・・・・・・・・・・・・・・・・・・・104
Table.4.5 Public Financial Management in India : Outputs and Outcomes ・・・105
Table.5.1 Dimensions of the third tier of Government in India ・・・・・・・・・・・・・118
Table.5.2 Finances of Local Bodies ・・・・・・・・・・・・・・・・・・・・・・・・・・・・・・・・・・・・・・122
List of BoxesList of BoxesList of BoxesList of Boxes
Box.1.1 Indian Economy : An Introduction ・・・・・・・・・・・・・・・・・・・・・・・・・・・・・・・・・ 1
Box.1.2 Trends in Monetary Variables : The Links ・・・・・・・・・・・・・・・・・・・・・・・・・・ 9
Box.1.3 Agriculture Sector : Directions for Reforms ・・・・・・・・・・・・・・・・・・・・・・・・24
Box.1.4 Directions for Reforms : A Summary ・・・・・・・・・・・・・・・・・・・・・・・・・・・・・・26
Box.2.1 Low Level of Central Government Expenditure ・・・・・・・・・・・・・・・・・・・・38
Box.2.2 Changes in the System of Estimating Fiscal Deficit in the Central
Government Budget・・・・・・・・・・・・・・・・・・・・・・・・・・・・・・・・・・・・・・・・・・・・・39
Box.2.3 The Plan - Budget Link・・・・・・・・・・・・・・・・・・・・・・・・・・・・・・・・・・・・・・・・・・41
Box.2.4 Forms and channels of Central budgetary transfers to States ・・・・・・・・43
Box.3.1 Recent Policy Initiatives taken by States to stabilize their finances・・・57
Box.3.2 Basics of Structure of Public Finances・・・・・・・・・・・・・・・・・・・・・・・・・・・・・60
Box.3.3 Data and Reviews on Government Finances ・・・・・・・・・・・・・・・・・・・・・・・60
Box.3.4 The Role and Importance of Non-Tax Revenue ・・・・・・・・・・・・・・・・・・・・・67
Box.3.5 The Problem of State Finances ・・・・・・・・・・・・・・・・・・・・・・・・・・・・・・・・・・・72
Box.3.6 The need of Expenditure Management ・・・・・・・・・・・・・・・・・・・・・・・・・・・・73
Box.4.1 Fundamental tasks of a State ・・・・・・・・・・・・・・・・・・・・・・・・・・・・・・・・・・・・83
Box.4.2 Governance and Control of Public Money ・・・・・・・・・・・・・・・・・・・・・・・・・・84
Box.4.3 Good Governance and Growth・・・・・・・・・・・・・・・・・・・・・・・・・・・・・・・・・・・・84

xii
Box.4.4 Rigidities in Budgetary Allocations ・・・・・・・・・・・・・・・・・・・・・・・・・・・・・・・90
Box.4.5 Good Governance and Development Outcomes ・・・・・・・・・・・・・・・・・・・・107
Box.5.1 Rationale of Decentralized Local Government・・・・・・・・・・・・・・・・・・・・・113
Box.5.2 Democratic Decentralization and Planning in India・・・・・・・・・・・・・・・・116
Box.5.3 Extreme examples of success and failure of decentralization process
in India ・・・・・・・・・・・・・・・・・・・・・・・・・・・・・・・・・・・・・・・・・・・・・・・・・・・・・・・・・・・120
Box.5.4 Deficiencies in State Finance Commission Reports ・・・・・・・・・・・・・・・・125
List of AnnexesList of AnnexesList of AnnexesList of Annexes
1.1 Perspectives on Indian Economy : Highlights of Select Reports/Studies ・・・127
1.2 An Overview of Policy Recommendations of the Country Framework Report
for India, under the Auspices of the World Bank Group's Infrastructure
Action Program, with funding from the World Bank and the Japanese
government ・・・・・・・・・・・・・・・・・・・・・・・・・・・・・・・・・・・・・・・・・・・・・・・・・・・・・・・・147
2.1 Main Features of Budgetary Process in India ・・・・・・・・・・・・・・・・・・・・・・・・・・153
3.1 Assessment of Tax Structure and Administration ・・・・・・・・・・・・・・・・・・・・・・156
3.2 (a) Profitability of Central Public Sector Undertakings・・・・・・・・・・・・・・・・・・157
(b) Finances of Central Public Enterprises・・・・・・・・・・・・・・・・・・・・・・・・・・・・・157
3.3 Reform Measures relating to Government Securities Market ・・・・・・・・・・・・158
3.4 The Fiscal Responsibility and Budget Management Bill, 2000 ・・・・・・・・・・・162
3.5 Excerpts from the Report on the Committee on Fiscal Responsibility
Legislation・・・・・・・・・・・・・・・・・・・・・・・・・・・・・・・・・・・・・・・・・・・・・・・・・・・・・・・・・168
4.1 Dimensions of Public Expenditure Management ・・・・・・・・・・・・・・・・・・・・・・・182
5.1 List of Functions for devolution to Panchayats and Municipalities ・・・・・・・184
5.2 Excerpts from the Study on Decentralization - The Kerala Experience・・・・186
xiii
AcronymsAcronymsAcronymsAcronyms
ADB Asian Development Bank
ADC Autonomous Development Council
AFS Annual Financial Statement
AG Accountant General
ATN Action Taken Note
BCR Balance From Current Revenue
BE Budget Estimates
BF Bond Fund
BOP Balance of Payment
CAA&A Controller of Aid Accounts & Audit
CAD Current Account Deficit
CAG Comptroller & Auditor General
CBDT Central Board of Direct Taxes
CBEC Central Board of Excise & Customs
CCA Chief Controller of Accounts
CCA Common Country Assessment
CGA Controller General of Accounts
CID Center for International Development
CP Commercial Paper
CPE Central Public Enterprises
CPI-IW Consumer Price Index for Industrial Worker
CSO Central Statistical Organisation
CSS Centrally Sponsored Schemes
DC Domestic Credit
DEA Department of Economic Affairs
DOE Department of Expenditure
DOR Department of Revenue
DPC District Planning Committee
DVP Delivery Versus Payment
EAP Externally Aided Project
EFC Eleventh Finance Commission
EPW Economic & Political Weekly
FA Financial Advisor
FC Finance Commission
FD Fiscal Deficit
FDI Foreign Direct Investment
FII Foreign Institutional Investor
FIs Financial Institutions
xiv
GDP Gross Domestic Product
GDPFC Gross Domestic Product at Factor Cost
GFD Gross Fiscal Deficit
GNP Gross National Product
GOI Government of India
GPD Gross Primary Deficit
GSPD Gross State Domestic Product
HDI Human Development Index
IAAD Indian Audit & Accounts Department
ICOR Incremental Capital Output Ratio
IDRI International Development Research Institute
IEBR Internal and External Budgetary Resources
IMF International Monetary Fund
INGAF Institute of Government Accounts and Finance
IT Information Technology
JBIC Japan Bank for International Cooperation
M3 Broad Money
MPC Metropolitan Planning Committee
MRTPC Monopoly & Restrictive Trade Practices Commission
NDC National Development Council
NFA Net Foreign Exchange Assets
NGO Non Governmental Organisation
NIPFP National Institute of Public Finance and Policy
NIR Net Internal Resources
NIRD National Institute of Rural Development
NNP Net National Product
NRI Non Resident Indian
NSDL National Securities Depository Ltd.
NSE National Stock Exchange
NSSF National Small Savings Fund (NSSF)
OCB Overseas Corporate Body
OECF Overseas Economic Cooperation Fund
PAC Public Accounts Committee
PAF Poverty Alleviation Forum
PAT Profit After Tax
PC Planning Commission
PD Primary Dealer
PD Primary Deficit
PDO Public Debt Officer
PDS Public Distribution System

xv
PEM Public Expenditure Management
PEO Programme Evaluation Organization
PFM Public Financial Management
PIW Project Implementation Wing
PMU Project Management Unit
PPF Public Provident Fund
PRI Panchayat Raj Institution
PSE Public Sector Enterprises
PSU Public Sector Undertaking
RBI Reserve Bank of India
RD Revenue Deficit
RE Revised Estimates
RIDF Research Institute for Development and Finance
RS Revenue Surplus
SAG State Accountants General
SC/ST Scheduled Castes/Scheduled Tribes
SD Satellite Dealer
SEB State Electricity Board
SFC State Finance Commission
SGL Subsidized General Ledger
SHCIL Stock Holding Corporation of India Ltd.
SRA Self Regulatory Authority
STCI Securities Trading Corporation of India
TB Treasury Bills
TDS Tax Deducted at Source
UNDAF United Nations Development Assistance Framework
UNDP United Nations Development Program
UT Union Territory
VAT Value Added Tax
WDR World Development Report
WMA Ways and Means Advances
WPI Wholesale Price Index

1
Chapter Chapter Chapter Chapter ⅠⅠⅠⅠIndian Economy : Macroeconomic Trends and PerspectivesIndian Economy : Macroeconomic Trends and PerspectivesIndian Economy : Macroeconomic Trends and PerspectivesIndian Economy : Macroeconomic Trends and Perspectives
1.11.11.11.1 IntroductionIntroductionIntroductionIntroduction
Of late now, Indian economy has been in the spotlight. It has been among the
fastest growing economies during the last two decades. Wide ranging economic
reforms have taken place. It has undergone a significant structural
transformation. The economy is more resilient, less vulnerable to external shocks
and has opened up for more potentials. But the attention on the economy is also
because it has crossed one billion mark in population and almost a third of the
population remains below a modestly defined poverty level. The debate on
perspectives for the Indian economy is continuing. A second wave of reforms is
already underway. Key determinants of higher growth path, macroeconomic
stability, poverty alleviation are being redefined.
This chapter highlights recent trends in major macroeconomic indicators of
the Indian economy with an overview of recent economic reforms as a background
to the perspectives indicated in some important studies/reports covering
development of the Indian Economy. The limited purpose being to focus attention
on trends only, any analysis of factors leading to the trends had to be kept out so
as to remain within the scope of this study.
Box : 1.1Box : 1.1Box : 1.1Box : 1.1Indian Economy : An IntroductionIndian Economy : An IntroductionIndian Economy : An IntroductionIndian Economy : An Introduction
A peninsula situated in South Asia, India is the seventh largest country in theworld, with a geographical area of 3.29 lakh square kilometers (2.5% of the world area)- about 8.7 times the area of Japan. After China, India is the second most populouscountry with a billion inhabitants in 1998, accounting for 16.7 per cent of the worldpopulation, and about eight times the population of Japan.
On the basis of estimated GNP at US $2144.1 billion in 1999 measured in termsof purchasing power parity, Indian economy is the fourth largest after USA ($8350billion), China ($4112.2 billion) and Japan ($3042.9 billion). In terms of per capitaincome level at US $2149 (PPP), however, India ranks 153rd in the ranking of 206countries. In terms of Human Development Index at 0.563, India's rank is 128 out ofthe 174 countries. (See Appendix 1.1 to this Chapter for a comparative view of economicperformance of India among select countries.) The vibrant Indian democracy -- thelargest in the world -- has been a unique success story among the developing economies.The Constitutional framework now providing for three layers of elected governments(after 73rd and 74th amendments) has helped strengthen political institutions and asmooth mechanism of fiscal federalism. Cultural and geographical diversities of thecountry -- having one of the oldest civilizations -- is another distinct featurenecessitating the design of a unique economic system for the country.
Historically, prior to gaining independence in 1947, 'India was increasinglyreduced to the status of a mere agrarian appendage and a subordinate trading partnerof Britain (Chandra, 1992). The development of the economy and the economic systemafter 1947, therefore, were conditioned and constrained initially to the colonial legacyand the inherited structure. A planned development process during the past five

2
decades based on the key objectives of growth, modernization coupled with self relianceand social equity helped attaining self-sufficiency in agriculture, establishing a modernindustrial base, setting up extensive infrastructure facilities, and above all reducingsignificantly the percentage of population below the poverty line. The 1990s has been adecade of wide ranging economic reforms. (See part 1.3 of this chapter for an overviewof economic reforms)
1.21.21.21.2 Macroeconomic TrendsMacroeconomic TrendsMacroeconomic TrendsMacroeconomic Trends
1.2.11.2.11.2.11.2.1 Indian Economy : Trends in Growth RateIndian Economy : Trends in Growth RateIndian Economy : Trends in Growth RateIndian Economy : Trends in Growth Rate
India has been among the fastest-growing economies in the World over the
last two decades, and has achieved trend improvements in growth, literacy,
mortality, and poverty rates (IMF, 2000). Trends in growth rate during the post
reform period since 1991-92 show a definitive improvement over pre-reform and
historical trends (Table 1.1). Some highlights of trends in growth rate of Indian
economy are:
• In the year ending March 2000, Indian economy is estimated to have grownby 6.4 per cent.
• The average growth rate during the last three years (1997-98 to 1999-2000)
at 6.0 per cent is lower compared to the average 7.3 per cent achieved earlier
during 1994-95 to 1996-97.
• Excluding 1991-92 (an outlier year) the economy during 'nineties has grownat an average rate of 6.4 per cent compared to the average annual growth
rate of 5.9 per cent during 'eighties.
• The growth trajectory of the economy had shifted during eighties to an
average of 5.9 per cent per annum from about 3.5 per cent per annum during
the previous three decades (1950-80).
• On average, the first five Plans (five yearly) during 1951 to 1979 (after
independence in 1947) achieved 3.5 per cent annual growth rate for the
economy. The subsequent three five year plans have achieved increasing
growth rate, the 8th Five Year Plan having achieved 6.9 per cent per annum.
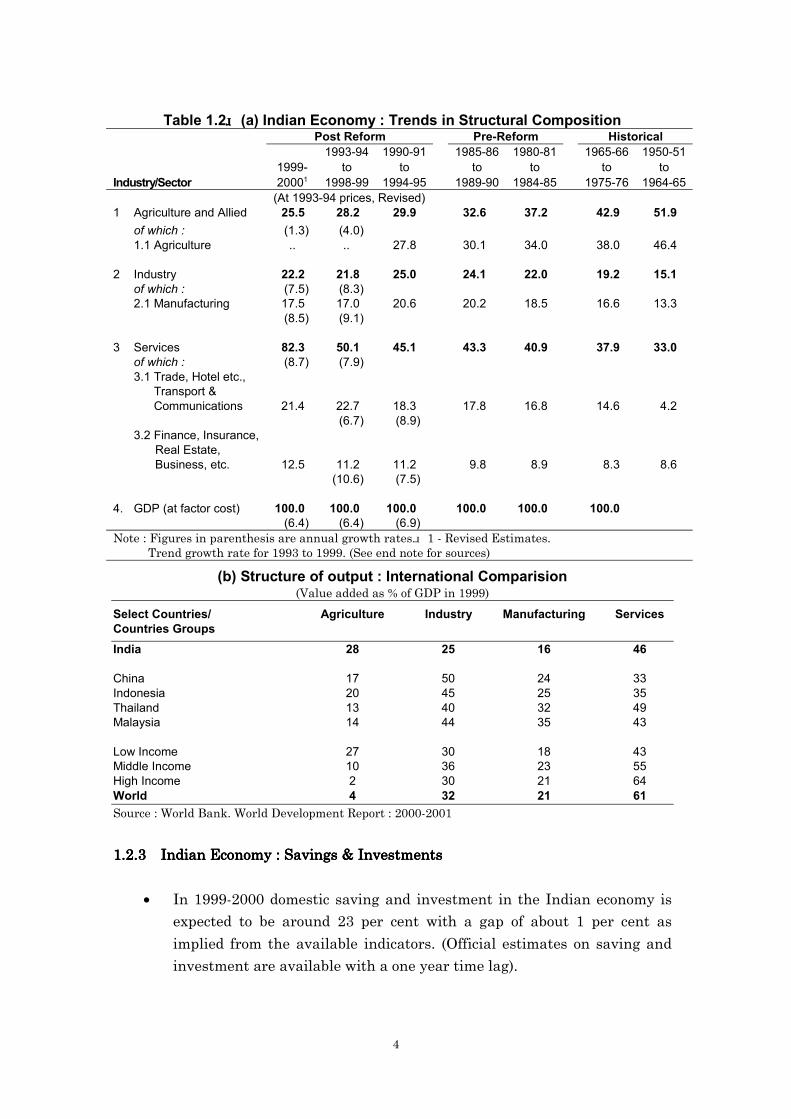
1.2.21.2.21.2.21.2.2 Trends in Structural CompositionTrends in Structural CompositionTrends in Structural CompositionTrends in Structural Composition
'The developmental experience of the Indian economy has been different
from that of the presently developed countries, as the share of services sector in
GDP surpassed that of the agricultural and the industrial sectors in a relatively
short span of time. In other words, the economy leap-frogged from the stage of
lower order of value addition generally associated with agriculture sector to the

3
higher level value addition for by the services sector' (RBI, 1999). Important
structural changes in the Indian economy are:
• Services sector accounted for 52.3 per cent of the GDP in 1999-2000.Agriculture and allied sector was 25.5 per cent and industry 22.2 per cent
of the GDP during the year.
• The structural transformation of the Indian economy is sharp in terms of a
significant increase in the share of services sector crossing 50 per cent
mark in second half of ‘nineties from 40.9 per cent in early ‘eighties.
• Agriculture and allied sector is now down to 25.5 per cent from 37.2 per
cent in early eighties. There is no significant change in the share of
industry sector during the last two decades except for some increase during
early ‘nineties.
• During the initial years of planning immediately after independence in
1947 agriculture and allied sector was 51.9 per cent of GDP.
Table 1.1 (a) Indian Economy : Growth Rate(Growth in GDPfc at constant prices)
Year/Period Per centPost Reform
1999-2000 6.4
1997-98 to1999-2000 (3 yrs. average) 6.01994-95 to 1996-97 (3 yrs. average) 7.3
1992-93 to 1999-2000 (8 yrs. average) 6.4
1991-92 0.8Pre Reform
1990-91 5.41980-81 to 1989-90 (eighties) 5.9
Historical1970-71 to 1979-80 (seventies) 2.91960-61 to 1969-70 (sixties) 4.01951-52 to 1959-60 (fifties) 3.6
Source : CSO, RBI. See end note for sources of tables on macroeconomic trends.
(b) Growth Rates during Five Year PlansPlan I II III IV V VI VII VIII
Period (1951-56) (56-61) (61-66) (69-74) (74-79) (80-85) (85-90) (92-97)Ave.Annual
Growth rate (%) 3.6 4.3 2.8 3.4 4.9 5.7 6.0 6.9
(c) Growth Rates : International Comparision(GDP growth rates in percent)
Select Countries 1980-90 1990-99 County groups 1980-90 1990-99India 5.8 6.1 Low income 4.4 2.4China 10.1 10.7 Middle Income 3.2 3.5Pakistan 6.3 4.0 Low and Middle Income 3.4 3.3Indonesia 6.1 4.7 East Asia & Pacific 8.0 7.4Thiland 7.6 4.7 Europe & Central Asia 2.4 -2.7Malaysia 5.3 6.3 Latin America & Caribbean 1.7 3.4Brazil 2.7 2.9 Middle East & North Africa 2.0 3.0Korea, Rep. 9.4 5.7 South Asia 5.7 5.7Japan 4.0 1.4 Sub-Saharan Africa 1.7 2.4USA 3.0 3.4 High Income 3.1 2.4
World 3.2 2.5Source : World Bank, World Development Report 2000-2001
4
Table 1.2 (a) Indian Economy : Trends in Structural CompositionPost Reform Pre-Reform Historical
1993-94 1990-91 1985-86 1980-81 1965-66 1950-511999- to to to to to to
Industry/Sector 20001 1998-99 1994-95 1989-90 1984-85 1975-76 1964-65(At 1993-94 prices, Revised)
1 Agriculture and Allied 25.5 28.2 29.9 32.6 37.2 42.9 51.9of which : (1.3) (4.0)1.1 Agriculture .. .. 27.8 30.1 34.0 38.0 46.4
2 Industry 22.2 21.8 25.0 24.1 22.0 19.2 15.1of which : (7.5) (8.3)2.1 Manufacturing 17.5 17.0 20.6 20.2 18.5 16.6 13.3
(8.5) (9.1)
3 Services 82.3 50.1 45.1 43.3 40.9 37.9 33.0of which : (8.7) (7.9)3.1 Trade, Hotel etc., Transport & Communications 21.4 22.7 18.3 17.8 16.8 14.6 4.2
(6.7) (8.9)3.2 Finance, Insurance,
Real Estate,Business, etc. 12.5 11.2 11.2 9.8 8.9 8.3 8.6
(10.6) (7.5)
4. GDP (at factor cost) 100.0 100.0 100.0 100.0 100.0 100.0(6.4) (6.4) (6.9)
Note : Figures in parenthesis are annual growth rates. 1 - Revised Estimates.Trend growth rate for 1993 to 1999. (See end note for sources)
(b) Structure of output : International Comparision(Value added as % of GDP in 1999)
Select Countries/ Agriculture Industry Manufacturing ServicesCountries GroupsIndia 28 25 16 46
China 17 50 24 33Indonesia 20 45 25 35Thailand 13 40 32 49Malaysia 14 44 35 43
Low Income 27 30 18 43Middle Income 10 36 23 55High Income 2 30 21 64World 4 32 21 61Source : World Bank. World Development Report : 2000-2001
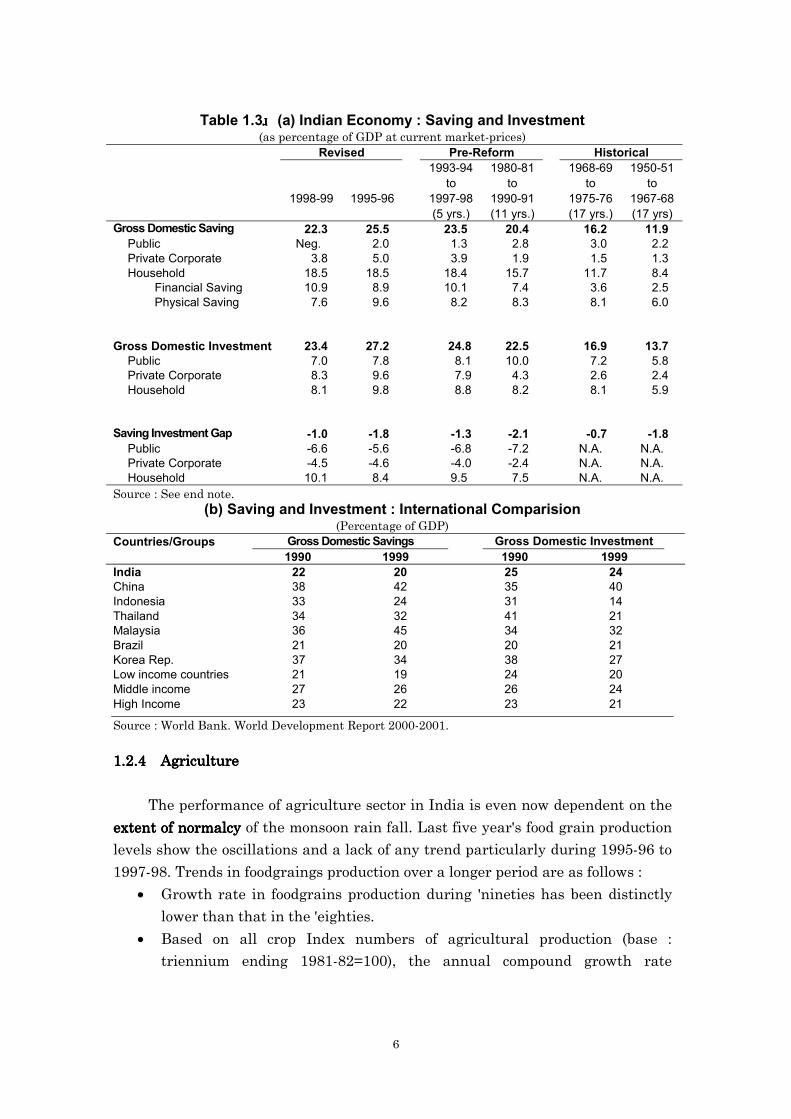
1.2.31.2.31.2.31.2.3 Indian Economy : Savings & InvestmentsIndian Economy : Savings & InvestmentsIndian Economy : Savings & InvestmentsIndian Economy : Savings & Investments
• In 1999-2000 domestic saving and investment in the Indian economy isexpected to be around 23 per cent with a gap of about 1 per cent as
implied from the available indicators. (Official estimates on saving and
investment are available with a one year time lag).

5
• In 1998-99 overall saving and investment rates declined significantly at
around 23 per cent with a gap of 1.0 per cent from a peak of around 26
per cent in 1995-96 as also from the annual average rates during the
period 1993-94 to 1997-98.
• The trends in saving-investment over a longer period show somestructural changes:
(a) Household saving rate has increased to around 18.5 per cent during
1990s (it was 19.8 per cent in 1994-95) compared to 15.7 per cent
during 1980s. During the first three five year plans (1950-51 to
1967-68) it was only 8.4 per cent on average.
(b) Household financial saving rate has outstripped the physical saving
rate during ‘nineties. It had remained lower than the physical
saving rate particularly during first 25 years of the planning era
since 1950-51. This is indicative of increased financial
intermediation, widening and deepening of the financial system as
well as the movement of relative rates of return on assets of the
household sector's portfolio (RBI, 99).
(c) An important structural transformation during nineties over
eighties is the sharp jump (almost double) both in the saving and
investment rates of the private corporate sector:private corporate sector:private corporate sector:private corporate sector: saving rate from
1.9 per cent to 3.9 and investment rate from 4.3 per cent to 7.9 per
cent. Of late, (from 1995-96) the private corporate sector investment
rate has outstripped the public sector investment rate. This
indicates the impact of the reform measures, liberalization, and
unshackling of the private sector in the Indian economy during the
‘nineties.
(d) Investment rate in the public sector public sector public sector public sector is significantly down to 7 per
cent only in 1998-99 from an average of 8.1 per cent during 1993-94
to 1997-98 and 10 per cent during ‘eighties. On the other side, the
saving rate has hit the bottom in 1998-99, being almost negligible.saving rate has hit the bottom in 1998-99, being almost negligible.saving rate has hit the bottom in 1998-99, being almost negligible.saving rate has hit the bottom in 1998-99, being almost negligible.
This is mainly due to the increased dis-saving of Government
administration. Thus there has been no respite for the public sector
borrowing requirements during nineties compared to the previous
decade.
6
Table 1.3 (a) Indian Economy : Saving and Investment(as percentage of GDP at current market-prices)
Revised Pre-Reform Historical1993-94 1980-81 1968-69 1950-51
to to to to1998-99 1995-96 1997-98 1990-91 1975-76 1967-68
(5 yrs.) (11 yrs.) (17 yrs.) (17 yrs)Gross Domestic Saving 22.3 25.5 23.5 20.4 16.2 11.9
Public Neg. 2.0 1.3 2.8 3.0 2.2Private Corporate 3.8 5.0 3.9 1.9 1.5 1.3Household 18.5 18.5 18.4 15.7 11.7 8.4
Financial Saving 10.9 8.9 10.1 7.4 3.6 2.5Physical Saving 7.6 9.6 8.2 8.3 8.1 6.0
Gross Domestic Investment 23.4 27.2 24.8 22.5 16.9 13.7Public 7.0 7.8 8.1 10.0 7.2 5.8Private Corporate 8.3 9.6 7.9 4.3 2.6 2.4Household 8.1 9.8 8.8 8.2 8.1 5.9
Saving Investment Gap -1.0 -1.8 -1.3 -2.1 -0.7 -1.8Public -6.6 -5.6 -6.8 -7.2 N.A. N.A.Private Corporate -4.5 -4.6 -4.0 -2.4 N.A. N.A.Household 10.1 8.4 9.5 7.5 N.A. N.A.
Source : See end note.(b) Saving and Investment : International Comparision
(Percentage of GDP)Countries/Groups Gross Domestic Savings Gross Domestic Investment
1990 1999 1990 1999India 22 20 25 24China 38 42 35 40Indonesia 33 24 31 14Thailand 34 32 41 21Malaysia 36 45 34 32Brazil 21 20 20 21Korea Rep. 37 34 38 27Low income countries 21 19 24 20Middle income 27 26 26 24High Income 23 22 23 21
Source : World Bank. World Development Report 2000-2001.
1.2.41.2.41.2.41.2.4 AgricultureAgricultureAgricultureAgriculture
The performance of agriculture sector in India is even now dependent on the
extent of normalcyextent of normalcyextent of normalcyextent of normalcy of the monsoon rain fall. Last five year's food grain production
levels show the oscillations and a lack of any trend particularly during 1995-96 to
1997-98. Trends in foodgraings production over a longer period are as follows :
• Growth rate in foodgrains production during 'nineties has been distinctly
lower than that in the 'eighties.
• Based on all crop Index numbers of agricultural production (base :triennium ending 1981-82=100), the annual compound growth rate

7
averaged 1.7 per cent during 'nineties (1990-91 to 1997-98) compared to 3.5
per cent during 'eighties.
• Output expansion of Rice has decelerated during 'nineties compared to'eighties. Growth rate in Wheat production has decelerated to 3.7 per cent
during nineties compared to 4.2 per cent during 'eighties.
• Growth rates in output of coarse cereals has continued to decelerate for a
long period.
• Output growth rate for pulses has come down sharply during 'nineties.
Table 1.4 (a) Foodgrains Production(Million Tonnes)
1999-2000 205.91998-1999 203.01997-1998 192.31996-1997 199.41995-1996 180.4
(b) Annual Compound Growth Rates of Foodgrains Production(Base Triennium ending 1981-82 = 100)
(per cent per annum)Foodgrains Rice Wheat Coarse Pulses
cerealsPost-Reform1990-91 to 1997-98 1.66 1.53 3.67 (-)0.49 0.76Pre-Reform1980-81 to 1989-90 3.54 4.29 4.24 0.74 2.78Historical1970-71 to 1979-80 2.08 1.91 4.69 0.74 -0.541960-61 to 1969-70 1.72 -8.05 5.90 1.48 1.351950-51 to 1959-60 3.22 3.28 4.51 2.75 2.72
Source : Economic Survey, 1998-99 and 1999-2000.
1.2.51.2.51.2.51.2.5 IndustryIndustryIndustryIndustry
Industrial production in 1999-2000 increased by 8.2 per cent after growing at
a subdued rate of 5.4 per cent on average during the 3 year period of 1996-97 to
1998-99. In 1995-96 the growth rate achieved was 12.8 per cent [Table 1.5(a)]
Over the past three decades, the industrial sector has not shown any
definitive trend either in its growth rate or in its contribution to GDP (RBI, 1999):
• In ‘‘‘‘ninetiesninetiesninetiesnineties (upto 1998-99), the annual average growth rate has been5.8 per cent with an increased volatility. It ranged between an
absolute fall of 1.9 per cent in 1991-92 to an increase of 12.9 per cent
in 1995-96.
• In ‘‘‘‘eighties,eighties,eighties,eighties, the average annual growth rate was 7.8 per cent. It
ranged between a low of 1.4 per cent in 1980-81 to a high of 11.2 per
cent in 1989-90.
8
• In ‘‘‘‘seventies,seventies,seventies,seventies, the average annual growth rate was 4.4 per cent. It
ranged between (-)2.6 per cent in 1979-80 to 11.6 per cent in 1978-79.
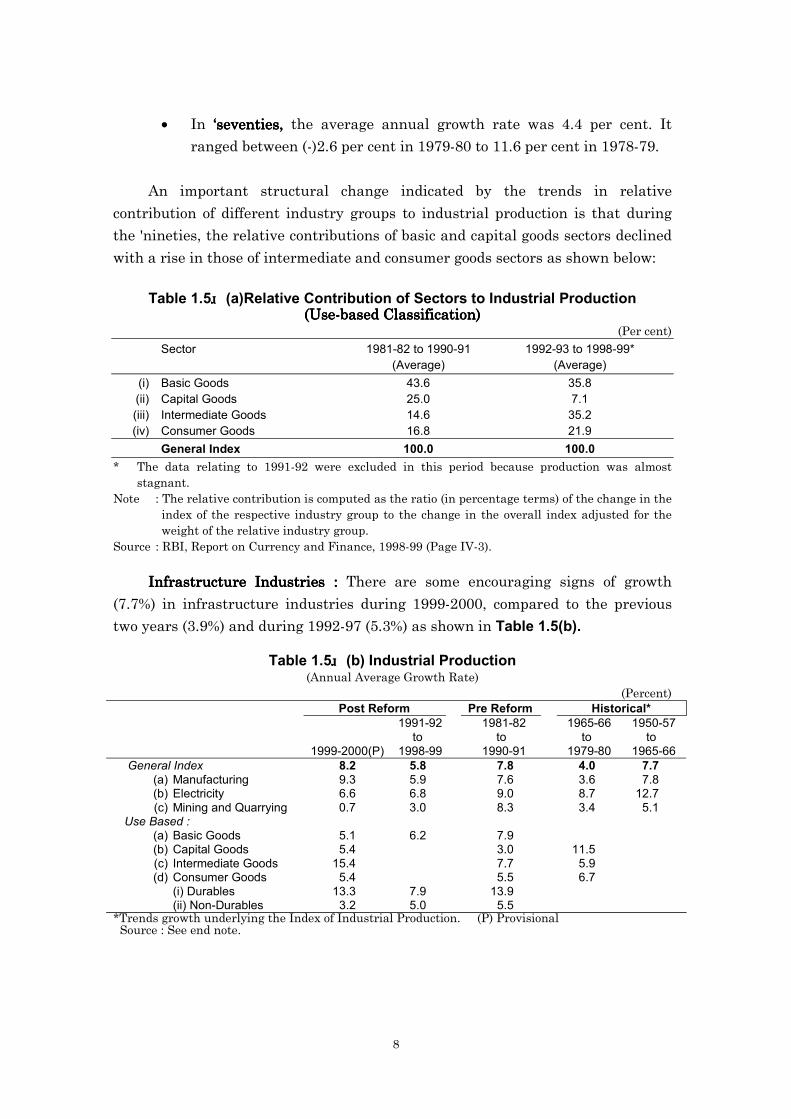
An important structural change indicated by the trends in relative
contribution of different industry groups to industrial production is that during
the 'nineties, the relative contributions of basic and capital goods sectors declined
with a rise in those of intermediate and consumer goods sectors as shown below:
Table 1.5 (a)Relative Contribution of Sectors to Industrial Production(Use-based Classification)(Use-based Classification)(Use-based Classification)(Use-based Classification)
(Per cent)Sector 1981-82 to 1990-91 1992-93 to 1998-99*
(Average) (Average)(i) Basic Goods 43.6 35.8(ii) Capital Goods 25.0 7.1(iii) Intermediate Goods 14.6 35.2(iv) Consumer Goods 16.8 21.9
General Index 100.0 100.0* The data relating to 1991-92 were excluded in this period because production was almost
stagnant.Note : The relative contribution is computed as the ratio (in percentage terms) of the change in the
index of the respective industry group to the change in the overall index adjusted for theweight of the relative industry group.
Source : RBI, Report on Currency and Finance, 1998-99 (Page IV-3).
Infrastructure Industries : Infrastructure Industries : Infrastructure Industries : Infrastructure Industries : There are some encouraging signs of growth
(7.7%) in infrastructure industries during 1999-2000, compared to the previous
two years (3.9%) and during 1992-97 (5.3%) as shown in Table 1.5(b).
Table 1.5 (b) Industrial Production(Annual Average Growth Rate)
(Percent)Post Reform Pre Reform Historical*
1991-92 1981-82 1965-66 1950-57to to to to
1999-2000(P) 1998-99 1990-91 1979-80 1965-66General Index 8.2 5.8 7.8 4.0 7.7
(a) Manufacturing 9.3 5.9 7.6 3.6 7.8(b) Electricity 6.6 6.8 9.0 8.7 12.7(c) Mining and Quarrying 0.7 3.0 8.3 3.4 5.1
Use Based :(a) Basic Goods 5.1 6.2 7.9(b) Capital Goods 5.4 3.0 11.5(c) Intermediate Goods 15.4 7.7 5.9(d) Consumer Goods 5.4 5.5 6.7
(i) Durables 13.3 7.9 13.9(ii) Non-Durables 3.2 5.0 5.5
*Trends growth underlying the Index of Industrial Production. (P) Provisional Source : See end note.

9
Table 1.5 (c) Infrastructure Industries(Annual Average Growth Rate)
(Per cent)Post-Reform Pre-Reform
Industry 1999-00 1998-99 1997-98 1992-97 1985-90Weight(8th Plan) (7th Plan)
Electricity generation 10.2 7.1 6.6 6.6 6.6 9.4a. Thermal (incl. Nuclear) 9.2 5.7 6.2 8.8 12.3b. Hydro -2.6 10.9 8.4 -0.8 3.5
Coal 3.2 3.0 -2.0 3.6 4.5 6.4Steel 5.1 12.5 -2.0 0.6 5.7 5.3Crude oil 4.2 -2.2 -2.8 2.8 1.4 3.3Refinery throughput 2.0 25.3 5.2 3.6 4.0 8.0Cement 2.0 14.0 5.6 9.1 8.0 8.7Fertilizers 2.1 4.8 3.7 17.1 3.0 11.1Total 28.8 7.8 2.4 5.4 5.3 7.6
1.2.61.2.61.2.61.2.6 Money, Credit and PricesMoney, Credit and PricesMoney, Credit and PricesMoney, Credit and Prices
Monetary AggregatesMonetary AggregatesMonetary AggregatesMonetary Aggregates
• Broad Money growth at 16.4 percent in 1999-2000 was lower than the growth
rate of 18.2 per cent in the previous year.
• Over a longer period broad money has grown with a trend rate of slightly
above 17 per cent. It was 17.3 per cent during 'nineties, 17.2 per cent during
'eighties and 17.5 per cent during 'seventies.
Box : 1.2Box : 1.2Box : 1.2Box : 1.2Trends in Monetary Variables : The LinksTrends in Monetary Variables : The LinksTrends in Monetary Variables : The LinksTrends in Monetary Variables : The Links
• Trends in monetary aggregate alone or in isolation do not reveal much unless seenin relation to credit or prices.
• Also, it is the composition and sources of money which matter rather than simplemonetary aggregates.
• It is the variation in the monetary aggregates which matter rather than the stock,if trends are to be analysed.
• Further, it is the average of levels during a period rather than point to pointchange in the level, which is more relevent because the monetary variables changeon day-to-day basis - at times significantly.
• Finally, there are significant conceptual differences in the coverage of monetaryaggregates both inter-temporal as well as inter-country comparisons.
Credit AggregatesCredit AggregatesCredit AggregatesCredit Aggregates
• Trends in net domestic credit and more importantly non-food credit to the
commercial sector, show that the growth rate in net domestic credit has
slowed down and has been lower at about 14 per cent during 'nineties
compared to the trend growth rate of 18.5 per cent (higher than M3 growth
rate) in 'eighties and 17.2 per cent in 'seventies.

10
Structural Shifts• Some structural changes brought about by the financial sector reforms tend
to explain the emerging trends in the lower growth of credit during 'nineties.
• The share of domestic credit (DC) in M3 declined from 116.8 per cent in the
'eighties to 101.7 per cent in the nineties (of which the net bank credit to
government declined from 49.1 per cent in the 'eighties to 45.0 per cent in
the 'nineties), while the percentage share of Net Foreign Exchange Assets
(NFA) increased from 3.7 per cent in the 'eighties to 12.1 per cent in the
nineties. This was because of a substantial capital inflow during the nineties.
• There has been a significant change in the composition of reserve moneyduring 'nineties.
• A sharp deceleration in the net RBI credit to the Centre from an annualaverage of 20 per cent during the, 'eighties to 8.3 per cent during the
'nineties and sharper acceleration in the RBIs net-foreign exchange assets
from an annual average of 6.4 per cent to 47.6 per cent during the same
period.
• In the 'eighties the bank credit growth was mostly driven by trends in thegovt. deficit. Net bank credit to the government expanded at rate of 20.4 per
cent as against 15.0 per cent in the 'seventies. Bank credit to commercial
sector, on the other hand, decelerated to 17.2 per cent from 18.9 per cent
during the same period.
• During the 'nineties, apart from a decline in the growth rate of net bankcredit to the government, the growth rate in non-food credit by the
commercial banks has also declined (from 18 per cent in 'eighties to 15.0 per
cent in 'nineties).
• This reflects two factors: (i) the switch in the asset portfolio of banks to
relatively risk free assets like government securities, in the wake of
introduction of stringent prudential and asset classification norms, and (ii)
availability of alternative instruments/avenues for raising resources by
corporate.
11
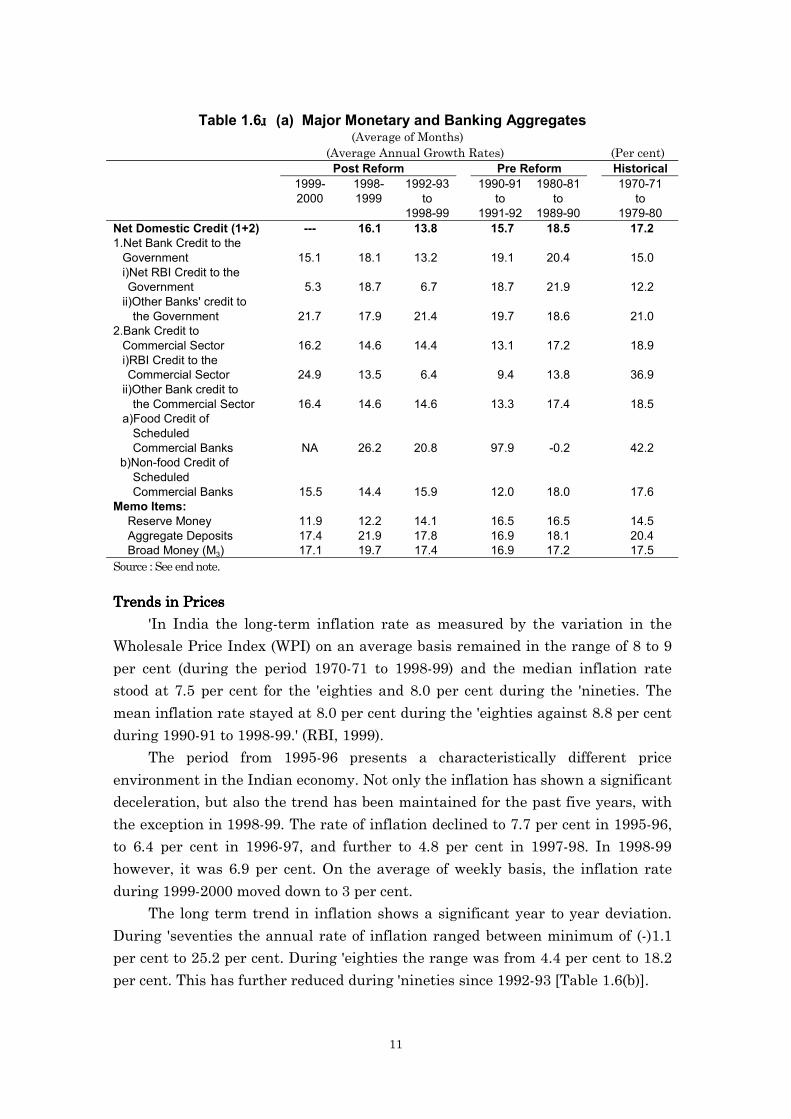
Table 1.6 (a) Major Monetary and Banking Aggregates (Average of Months)(Average Annual Growth Rates) (Per cent)
Post Reform Pre Reform Historical1999- 1998- 1992-93 1990-91 1980-81 1970-712000 1999 to to to to
1998-99 1991-92 1989-90 1979-80Net Domestic Credit (1+2) --- 16.1 13.8 15.7 18.5 17.21.Net Bank Credit to the
Government 15.1 18.1 13.2 19.1 20.4 15.0i)Net RBI Credit to theGovernment 5.3 18.7 6.7 18.7 21.9 12.2
ii)Other Banks' credit tothe Government 21.7 17.9 21.4 19.7 18.6 21.0
2.Bank Credit toCommercial Sector 16.2 14.6 14.4 13.1 17.2 18.9i)RBI Credit to theCommercial Sector 24.9 13.5 6.4 9.4 13.8 36.9
ii)Other Bank credit tothe Commercial Sector 16.4 14.6 14.6 13.3 17.4 18.5
a)Food Credit ofScheduledCommercial Banks NA 26.2 20.8 97.9 -0.2 42.2
b)Non-food Credit ofScheduledCommercial Banks 15.5 14.4 15.9 12.0 18.0 17.6
Memo Items:Reserve Money 11.9 12.2 14.1 16.5 16.5 14.5Aggregate Deposits 17.4 21.9 17.8 16.9 18.1 20.4Broad Money (M3) 17.1 19.7 17.4 16.9 17.2 17.5
Source : See end note.
Trends in PricesTrends in PricesTrends in PricesTrends in Prices
'In India the long-term inflation rate as measured by the variation in the
Wholesale Price Index (WPI) on an average basis remained in the range of 8 to 9
per cent (during the period 1970-71 to 1998-99) and the median inflation rate
stood at 7.5 per cent for the 'eighties and 8.0 per cent during the 'nineties. The
mean inflation rate stayed at 8.0 per cent during the 'eighties against 8.8 per cent
during 1990-91 to 1998-99.' (RBI, 1999).
The period from 1995-96 presents a characteristically different price
environment in the Indian economy. Not only the inflation has shown a significant
deceleration, but also the trend has been maintained for the past five years, with
the exception in 1998-99. The rate of inflation declined to 7.7 per cent in 1995-96,
to 6.4 per cent in 1996-97, and further to 4.8 per cent in 1997-98. In 1998-99
however, it was 6.9 per cent. On the average of weekly basis, the inflation rate
during 1999-2000 moved down to 3 per cent.
The long term trend in inflation shows a significant year to year deviation.
During 'seventies the annual rate of inflation ranged between minimum of (-)1.1
per cent to 25.2 per cent. During 'eighties the range was from 4.4 per cent to 18.2
per cent. This has further reduced during 'nineties since 1992-93 [Table 1.6(b)].

12
Divergence between Divergence between Divergence between Divergence between WPI and CPI :WPI and CPI :WPI and CPI :WPI and CPI : An important aspect of the inflation
trend in the 'nineties has been the increase in the divergence of inflation as
measured by the consumer price index for industrial workers (CPI-IW) from that
measured by the WPI. The CPI inflation increased from 9 per cent during the
eighties to 9.9 per cent during the ‘nineties. The average differential of the
consumer price inflation and the wholesale price inflation has increased from 1.1
percentage point in the 'eighties to 1.7 percentage points in the 'nineties (in fact it
was 6.2 percentage points in 1998-99). Important reasons for the wide differential
between WPI and CPI are the difference in the coverage, weighting diagram and
methodology of computation. The food group, for example has 27.5 per cent weight
in the WPI as against 57 per cent in the CPI-IW.
Table 1.6 (b) Trends in Prices(Per cent)
Post Reform Pre Reform Historical1992-93 1990-91 1980-81 1970-71 1960-61 1951-52
to to to to to toIndices 1999-2000 1998-99 1991-92 1989-90 1979-80 1969-70 1959-60
(8 yrs.) (2 yrs.)WPI (All Commodities) 3.3 7.9 12.0 8.0 9.0 6.3 1.2
(Maximum) (10.9) (18.2) (25.2) (14.0) (13.8) (Minimum) (4.8) (4.4) (-1.1) (-1.0) (-12.7)
CPI Industrial Worker (IW) 4.8 9.5 12.6 9.0 7.7 5.9 2.14 Urban non-manual 5.0 9.1 12.4 7.8 7.2 N.A. N.A. Agricultural Labour 3.4 8.8 13.4 8.1 6.7 N.A. N.A.Source : See end note.
Interest RatesInterest RatesInterest RatesInterest Rates
Prime lending rates (PLR) of banks and financial institutions were around
12.5 per cent during 1999-2000. PLR concept was introduced with effect from 1994.
Since April 1998 banks were given the freedom to determine the interest rates on
loans upto Rs. 0.2 million subject to small borrowers being charged at rates not
exceeding the PLR.
The 'Bank Rate' (anchor rate of Central Bank) was reactivated in 1997 with
deposit rates (upto one year maturity) initially linked to it. Since July 21, 2000 it
is 8 percent. Interest rates on loans above Rs. 0.2 million were freed in October
1994. Earlier the interest rate structure was rationalized reducing it to six
categories in April 1992 and three in April 1993. Also, beginning from 1992-93,
interest rate in government securities market was progressively deregulated, with
the introduction of an auction system. Prior to 1992-93 the administered interest
rate structure was quite complicated.
1.2.71.2.71.2.71.2.7 Fiscal TrendsFiscal TrendsFiscal TrendsFiscal Trends
13
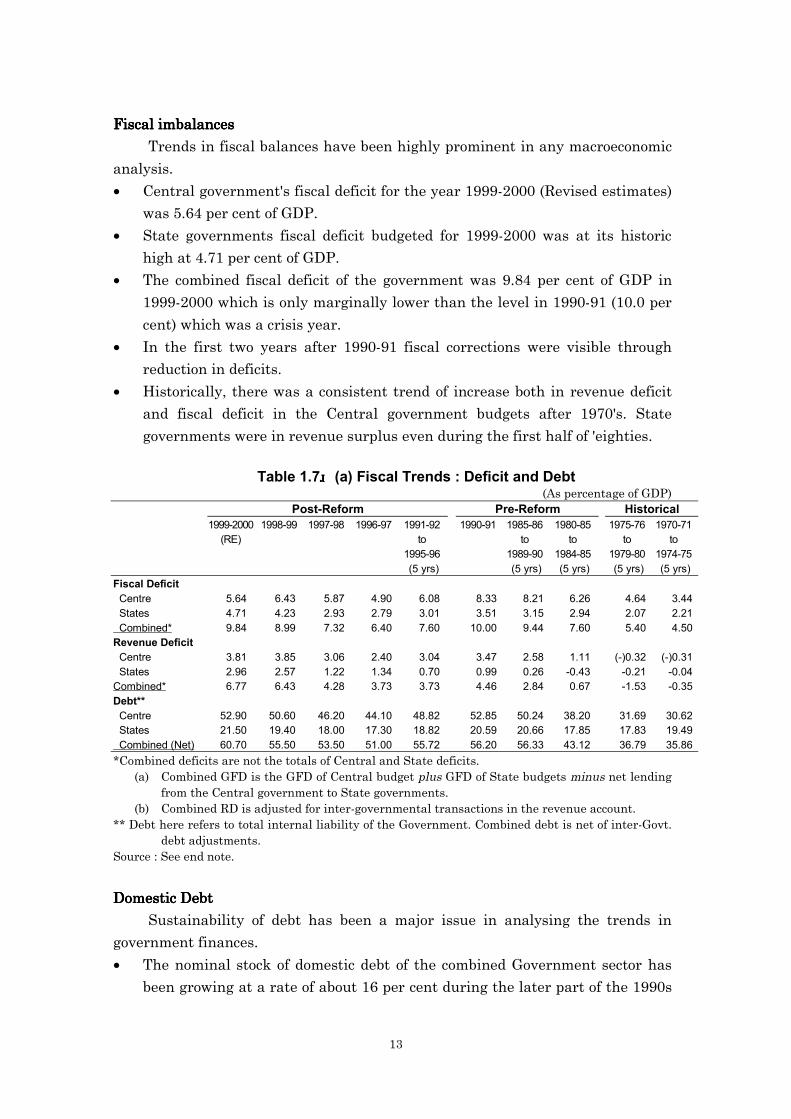
Fiscal imbalancesFiscal imbalancesFiscal imbalancesFiscal imbalances
Trends in fiscal balances have been highly prominent in any macroeconomic
analysis.
• Central government's fiscal deficit for the year 1999-2000 (Revised estimates)
was 5.64 per cent of GDP.
• State governments fiscal deficit budgeted for 1999-2000 was at its historic
high at 4.71 per cent of GDP.
• The combined fiscal deficit of the government was 9.84 per cent of GDP in
1999-2000 which is only marginally lower than the level in 1990-91 (10.0 per
cent) which was a crisis year.
• In the first two years after 1990-91 fiscal corrections were visible through
reduction in deficits.
• Historically, there was a consistent trend of increase both in revenue deficit
and fiscal deficit in the Central government budgets after 1970's. State
governments were in revenue surplus even during the first half of 'eighties.
Table 1.7 (a) Fiscal Trends : Deficit and Debt(As percentage of GDP)
Post-Reform Pre-Reform Historical1999-2000 1998-99 1997-98 1996-97 1991-92 1990-91 1985-86 1980-85 1975-76 1970-71
(RE) to to to to to1995-96 1989-90 1984-85 1979-80 1974-75(5 yrs) (5 yrs) (5 yrs) (5 yrs) (5 yrs)
Fiscal Deficit Centre 5.64 6.43 5.87 4.90 6.08 8.33 8.21 6.26 4.64 3.44 States 4.71 4.23 2.93 2.79 3.01 3.51 3.15 2.94 2.07 2.21 Combined* 9.84 8.99 7.32 6.40 7.60 10.00 9.44 7.60 5.40 4.50Revenue Deficit Centre 3.81 3.85 3.06 2.40 3.04 3.47 2.58 1.11 (-)0.32 (-)0.31 States 2.96 2.57 1.22 1.34 0.70 0.99 0.26 -0.43 -0.21 -0.04Combined* 6.77 6.43 4.28 3.73 3.73 4.46 2.84 0.67 -1.53 -0.35Debt** Centre 52.90 50.60 46.20 44.10 48.82 52.85 50.24 38.20 31.69 30.62 States 21.50 19.40 18.00 17.30 18.82 20.59 20.66 17.85 17.83 19.49 Combined (Net) 60.70 55.50 53.50 51.00 55.72 56.20 56.33 43.12 36.79 35.86*Combined deficits are not the totals of Central and State deficits.
(a) Combined GFD is the GFD of Central budget plus GFD of State budgets minus net lendingfrom the Central government to State governments.
(b) Combined RD is adjusted for inter-governmental transactions in the revenue account.** Debt here refers to total internal liability of the Government. Combined debt is net of inter-Govt.
debt adjustments.Source : See end note.
Domestic DebtDomestic DebtDomestic DebtDomestic Debt
Sustainability of debt has been a major issue in analysing the trends in
government finances.
• The nominal stock of domestic debt of the combined Government sector has
been growing at a rate of about 16 per cent during the later part of the 1990s

14
reaching to 60.7 per cent of GDP at end-March 2000 as against 55.5 per cent
at end March 1999 and 56.12 per cent at end March 1991.
• Central government's debt as per cent of GDP was about 53 per cent at end1999-2000 almost the same level as in 1990-91. State government's Debt GDP
ratio for State governments at 21.50 per cent in 1999-2000 was about a
percentage point higher than the level at end 1990-91.
• Historically, there was a sharp increase in the Central government's debtfrom about (on average) 31 per cent of GDP, in 'seventies to about 50 per cent
during the second half of 'eighties. State governments' debt had not increased
significantly during the similar period.
Receipts and ExpendituresReceipts and ExpendituresReceipts and ExpendituresReceipts and Expenditures
Receipts• Central government's gross tax revenue/GDP ratio has fallen by almost 2
percentage points to 8.80 per cent in 1999-2000 from 10.75 per cent in 1990-
91. State's own tax revenue/GDP ratio however, has not fallen significantly
during the same period.
• Historically tax/GDP ratio both for the Central govt. and for the StateGovernments had shown about 2 percentage point increase from the first half
of seventies to the second half of 'eighties.
• Central government's revenue receipts (net of tax share to States) including
tax+non tax revenue at 9.29 per cent of GDP in 1999-2000(RE) was lower by
about one percentage point compared to 1990-91 (the crisis year).
• States' revenue receipts including share in Central taxes and grants and non-
tax revenue as per cent of GDP in 1999-2000 was lower at 10.86 per cent by
almost two percentage points from the average of first half of nineties (1991-
92 to 1995-96) and even from the average of such ratio in the second half of
'eighties.
Table 1.7 (b) Fiscal Trends : Receipt and Expenditure(As percentage of GDP)
Post-Reform Pre-Reform Historical1999-2000 1998-99 1997-98 1996-97 1991-92 1990-91 1985-86 1980-85 1975-76 1970-71
(RE) to to to to to1995-96 1989-90 1984-85 1979-80 1974-75(5 yrs) (5 yrs) (5 yrs) (5 yrs) (5 yrs)
CentreGross Tax revenue 8.80 8.16 9.19 9.45 9.77 10.75 11.20 9.93 9.84 8.29Net Revenue Receipts 9.29 8.48 8.83 9.27 9.96 10.26 11.11 9.43 10.05 8.37Revenue Expenditure 13.10 12.34 11.90 11.67 13.70 13.73 13.69 10.69 9.73 9.83Capital Expenditure 2.62 3.51 3.41 3.09 6.78 5.93 6.78 6.13 6.78 6.00
StatesTax receipts (own) 5.38 4.87 5.17 5.04 5.54 5.63 5.67 5.18 4.73 3.75Revenue Receipts 10.86 9.80 11.09 10.99 12.89 12.41 12.85 11.90 10.83 8.78Revenue Expenditure 13.82 12.38 12.31 12.33 13.48 13.40 13.16 11.47 9.62 8.75Capital Expenditure 1.95 1.87 2.08 1.89 3.26 3.61 3.21 3.79 4.68 4.18
Source : See end note.
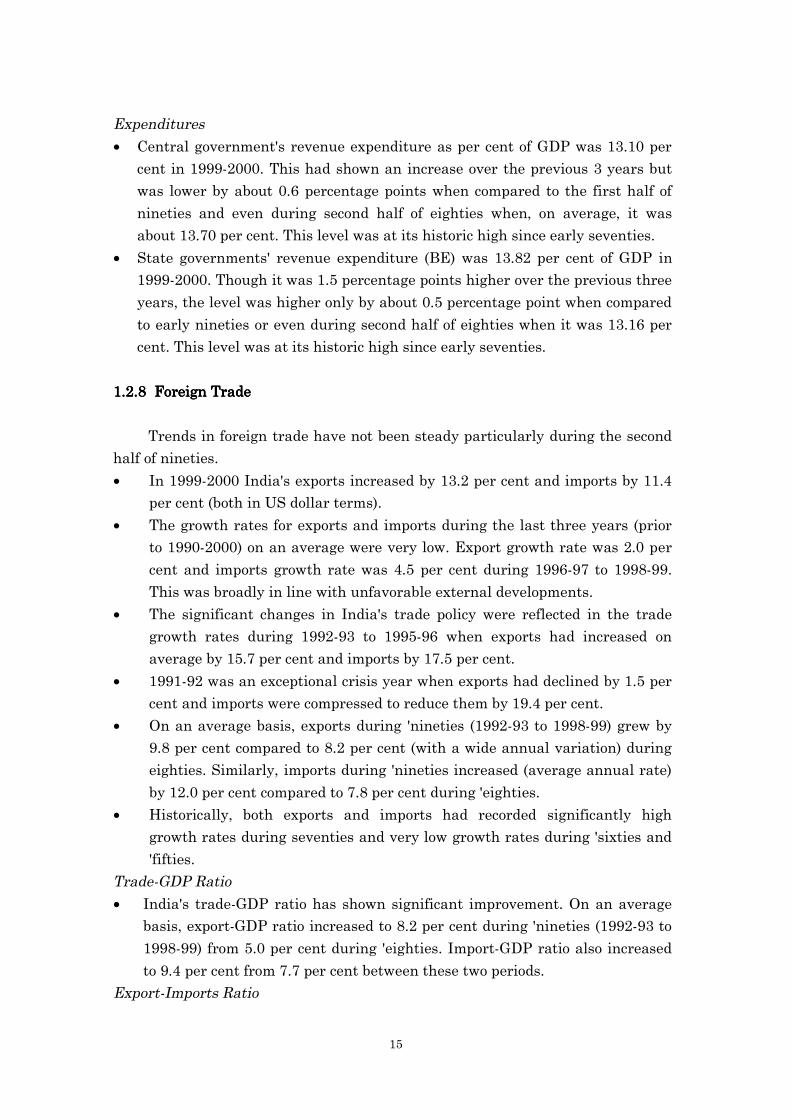
15
Expenditures• Central government's revenue expenditure as per cent of GDP was 13.10 per
cent in 1999-2000. This had shown an increase over the previous 3 years but
was lower by about 0.6 percentage points when compared to the first half of
nineties and even during second half of eighties when, on average, it was
about 13.70 per cent. This level was at its historic high since early seventies.
• State governments' revenue expenditure (BE) was 13.82 per cent of GDP in1999-2000. Though it was 1.5 percentage points higher over the previous three
years, the level was higher only by about 0.5 percentage point when compared
to early nineties or even during second half of eighties when it was 13.16 per
cent. This level was at its historic high since early seventies.
1.2.8 Foreign Trade1.2.8 Foreign Trade1.2.8 Foreign Trade1.2.8 Foreign Trade
Trends in foreign trade have not been steady particularly during the second
half of nineties.
• In 1999-2000 India's exports increased by 13.2 per cent and imports by 11.4per cent (both in US dollar terms).
• The growth rates for exports and imports during the last three years (priorto 1990-2000) on an average were very low. Export growth rate was 2.0 per
cent and imports growth rate was 4.5 per cent during 1996-97 to 1998-99.
This was broadly in line with unfavorable external developments.
• The significant changes in India's trade policy were reflected in the trade
growth rates during 1992-93 to 1995-96 when exports had increased on
average by 15.7 per cent and imports by 17.5 per cent.
• 1991-92 was an exceptional crisis year when exports had declined by 1.5 per
cent and imports were compressed to reduce them by 19.4 per cent.
• On an average basis, exports during 'nineties (1992-93 to 1998-99) grew by
9.8 per cent compared to 8.2 per cent (with a wide annual variation) during
eighties. Similarly, imports during 'nineties increased (average annual rate)
by 12.0 per cent compared to 7.8 per cent during 'eighties.
• Historically, both exports and imports had recorded significantly high
growth rates during seventies and very low growth rates during 'sixties and
'fifties.
Trade-GDP Ratio• India's trade-GDP ratio has shown significant improvement. On an average
basis, export-GDP ratio increased to 8.2 per cent during 'nineties (1992-93 to
1998-99) from 5.0 per cent during 'eighties. Import-GDP ratio also increased
to 9.4 per cent from 7.7 per cent between these two periods.
Export-Imports Ratio

16
• On an average basis the export-import ratio has increased substantially from
65.1 per cent during eighties to 87.0 per cent during nineties.
Table 1.8 Foreign TradeGrowth Rate Export/ Import/ Export-
(% per annum) GDP GDP ImportExport Import Ratio Ratio Ratio
(per cent) (per cent)
1999-2000 13.2 11.4 8.5 12.3 79.6Average :1996-97 to 1998-99 2.0 4.5 8.3 9.9 83.4(Three years)1992-93 to 1995-96 15.7 17.5 8.1 9.0 89.7(Four years)1991-92 -1.5 -19.4 7.1 7.8 92.0
1980-81 to 1990-91 8.2 7.8 5.0 7.7 65.1(Max) (24.1) (40.5) N.A. N.A. N.A.(Min) (-9.9) (-5.9) N.A. N.A. N.A.
Historical1970-71 to 1979-80 15.8 20.1 6.8 6.7 N.A.1960-61 to 1969-70 3.5 0.8 3.6 1.7 N.A.1951-52 to 1959-60 1.2 6.9 0.3 5.4 N.A.
Source : See end notes.
Structural Changes• There have been significant structural changes in India's external trade
during the 'nineties over 'eighties and earlier period in terms of shift away
from traditional items of exports to manufactured items, increase in relative
share of imports of certain capital goods, edible oils, manufactured fertilizers
and a sharp increase in imports of gold and silver during 'nineties compared
to 'eighties.
• Recent trends in imports include sharp and significant variations partly due
to (a) imports of gold and silver which despite a decline in 1999-2000 by 3.2
per cent accounted for 9.3 per cent (US $4.4 billion) of total imports during
the year, and (b) variations in oil prices increase in which resulted to 68.7 per
cent growth in POL imports during 1999-2000 compared to a decline by 11.3
per cent in the previous year. Similarly, trends in exports include sharp
variations due to a significantly high growth rate in India's software exports
($4 billion in 1999-2000) which averaged around 50 per cent per annum since
1995-96.
1.2.91.2.91.2.91.2.9 Balance of PaymentsBalance of PaymentsBalance of PaymentsBalance of Payments
Trends in the key indicators of balance of payments have shown a
comfortable position in the external sector of the Indian economy.

17
Current Account Deficit (CAD)• The CAD/GDP ratio has, on an average,on an average,on an average,on an average, remained comfortable at just above 1
per cent during the 'nineties after having reached at 3.2 per cent in 1990-91.
It was, on average, 2.3 per cent in the second half of ‘eighties and 1.6 per cent
in the first half of ‘eighties.
• The reduced CAD/GDP ratio is mainly because of a significant contribution of
invisibles' surplus during the 'nineties:
Invisibles• Private transfers-the single largest source of invisible earnings were 2.5 per
cent of GDP during 'nineties (1993-94 to 1998-99) compared to average 1.4 per
cent and 1.0 per cent during the first half and the second half of ‘eighties,
respectively.
• The average growth rate in total invisible receipts was significantly high at
18.8 per cent during 1993-94 to 1998-99 compared to only 1.7 per cent during
the second half of eighties. Invisible payments growth could be contained to
an average rate of 14.9 per cent compared to 14.1 per cent during the similar
period.
• Invisibles' (net) contribution to the current account of the balance of
payments has nearly trebled from an average of 0.8 per cent of GDP in the
second half of eighties to 2.2 per cent in 1998-99 and 2.9 per cent in 1999-
2000.
Capital Account : Important trends• Net capital inflows have more than doubled from an average of US $4.0
billion during the 'eighties to an average of US $8.7 billion in the 'nineties
since 1993-94.
• The proportion of non-debt flows in total capital flows has risen from about 5
per cent in the later half of the 'eighties to about 43 per cent during 1990-99.
• Cumulative foreign equity investment since 1990-91 has risen to US $29
billion-an increase of almost 10 folds over the outstanding stock of 1990.
• FDI inflows have averaged about US $2.9 billion in the recent period during
1996-99. Portfolio flows were US $1.7 billion during the same period.
• External assistance has declined from 32 per cent of net capital inflows in the
second half of eighties to a little less than 10 per cent in the recent 3 years
period 1996-99. The share of external commercial borrowings in total capital
flows has increased from 26 per cent to 38 per cent during the similar period.
External Debt• External debt-GDP ratio has been on a declining trend: from a peak of 41.0
per cent in March 1992 to 23.7 per cent in March 1999.
• The Debt service ratio has declined from a peak of 35.5 per cent in 1990-91 to18 per cent in 1998-99.

18
• Short-term debt as a proportion of the country's foreign exchange reserves
was only 13.3 per cent at end March 1999 compared to 189.3 per cent at end
March 1990.
• Concessional debt has declined from 46.7 per cent of total debt at end March
1990 to 37.9 per cent at end March 1999.
Reserves• Foreign currency assets of RBI had declined from US $5.5 billion at end
March 1985 to US $2.2 billion at end March 1991 and to an all time low of USan all time low of USan all time low of USan all time low of US
$975 million$975 million$975 million$975 million on July 12, 1991. At end June 1999At end June 1999At end June 1999At end June 1999 these were US $ 30.6 billion.
• In terms of months of import cover, the foreign currency assets now coverimports for 8.2 months compared to barely a fortnightbarely a fortnightbarely a fortnightbarely a fortnight during July 1991, 1.1
months at end March 1991 and 4.2 months at end March 1985.
Exchange Rate :• The exchange rate of the Indian rupee vis-à-vis the US$ averaged Rs. 43.44
during 1999-2000 indicating a depreciation of about 2.9 per cent over that of
Rs. 42.07 during the previous year. The real effective exchange rate (REER)
however, depreciated by 1.2 per cent only.
• In the past seven years since the introduction of the market based exchange
rate system, the country has had a variety of episode of long periods of
excessive inflows putting upward pressure on exchange rate followed by short
spells of drying up of capital flows and the consequent speculative pressures
necessitating correction in the exchange rate mainly through Central Banks'
intervention.
• The exchange rate regime had transited from a basket linked managed floatto market based system in March 1993 via a transitional phase of duel
exchange rate between March 1992 and February 1993.

19
Table 1.9 Key Indicators of Balance of PaymentsPost Reform Pre Reform
1999- 1998-99 1995-96 1990-91 1984-85 1980-812000 to
1989-90(As per cent of GDP)
Current Account Deficit 0.9 1.0 1.6 3.2 2.3 1.6Invisibles (Net) 2.9 2.2 1.5 -0.1 0.8 2.1Private transfers (Receipts) 2.5 2.4 0.7 1.0Investment income (Payments) 1.3 1.3 1.4 0.8
Capital Account Surplus 2.0 1.3 2.4 2.3Foreign Investment 1.1 0.6 1.3 0.03 0.1 0.0
of which :Direct 0.6 0.6 0.3 0.1Portfolio 0.0 0.7 0.00 0.0
Debt Flows 1.3 0.7 2.0 2.0of which :
Commercial Borrowings 1.1 0.4 0.8 0.6External Assistance 0.2 0.3 0.7 0.7
Overall Balance 1.0 -0.3 -0.8 -0.0
External Debt/GDP Ratio (%) 22.0 23.5 26.3 30.4Debt Service Ratio (%) 16.0 18.0 24.3 35.5Short term Debt (as % of reserves) 10.6 13.5 23.2 146.5Import cover of Res. (No. of Months) 8.2 8.2 6.0 2.5 3.4 4.1Exchange rate Rupees per US $ 43.33 42.07 33.45 17.94 13.82
(Period Average)
Source : See end note.
1.2.1.2.1.2.1.2.10101010 Social IndicatorsSocial IndicatorsSocial IndicatorsSocial Indicators
Trends in different social indicators present a mixed picture.
• Literacy rate is reported to be 62 per cent in 1997-up by 10 percentage pointsfrom 1990-91. It was 34.5 per cent in 1970-71 and just 18.3 per cent in 1950-51.
However, some 69 million children between 6-14 years of age are still out of
school.
• Life expectancy at birth at 62.4 years (1996 estimate)-up from 50.4 in 1980-81.
It was just 32.1 in 1950-51. However, even now close to 2 million children die
annually before their first birthday-and most of these deaths are avoidable.
• There is poverty of 'estimates on poverty' for the period beyond 1993-94. 36 percent people (320 million) were below poverty level in 1993-94. This was a drop
from 56.4% (321 million) in 1973-74. However, there is no poverty of debate on
poverty estimates or poverty alleviation. The current debate on whether
reforms have reduced poverty or not remains inconclusive in the lack of hard
data beyond 1993-94. "Preliminary estimates based on data available for the

20
first six months of the National Sample Survey (NSS) full sample survey from
July 1999 to June 2000 suggest that poverty has declined but the decline is
much less than what was targeted." (Planning Commission, October 2000).
• Human development index has shown some improvement it being 0.563 in
1998 from 0.510 in 1990 and 0.431 in 1980. However, India ranks 153rd in HDI
ranking out of the 174 countries.
Table 1.10 Indian Economy : Social Indicators
Post Reform Pre-Reform HistoricalLatest 1990-91 1980-81 1970-71 1960-61 1950-51Year
Life expectancy at birth(in yrs.) 62.4 (1996) 58.7 50.4 45.6 41.3 32.1(a) Male 58.6 50.9 46.4 41.9 32.5(b) Female 59.0 50.0 44.7 40.6 31.7
Infant mortality 72 (1998) 80 110 129 146 146Literacy rate (%) 62.0 (1997) 52.2 43.7 34.5 28.3 18.3
(a) Male 64.1 56.5 46.0 40.4 27.2(b) Female 39.3 29.9 22.0 15.3 8.9
Registered Medical Practitioners 5.1 (1995) 4.7 3.9 2.8 1.9 1.7(per 10,000 population)
Population (million) 965.6 (1997) 846.3 683.3 548.2 439.2 361.11998 1990 1985 1980 1975
HDI 0.563 0.510 0.470 0.431 0.405GDP per capita (1995 US$) 444 331 270 231 222GNP Per capita PPP (US $) 1700
Poverty (Official Estimates) Year Poverty Ratio No. of poor (million)
Rural Urban Combined Rural Urban Combined1973-74 56.4 49.0 54.9 261.3 60.0 321.31977-78 53.1 45.2 51.3 264.3 64.6 328.91983 45.7 40.8 44.5 252.0 70.9 322.91987-88 39.1 38.2 38.9 231.9 75.2 307.11993-94 37.3 32.4 36.0 244.0 76.3 320.3Source : See end note.
1.31.31.31.3 Economic Reforms : An OverviewEconomic Reforms : An OverviewEconomic Reforms : An OverviewEconomic Reforms : An Overview
It is by now almost a decade since the process of wide ranging economic
reforms was initiated in 1991. Faced with a balance of payments and fiscal crisis,
it was well recognized that the relatively higher growth trend during 1980s was
not sustainable with the over dominance of public sector, widespread protective
system for different sectors of the economy and most complicated regulatory
mechanisms. A process of stabilization and structural adjustment was, therefore,
initiated since July 1991. Wide ranging policy changes and reform measures were
taken up. This has been a continuing process. Now after a decade, a second wave

21
of reforms is sweeping the discussions on the perspectives of the economy in the
new century.
The literature on Indian economy is flooded with reviews of its economic
reforms process particularly during the nineties (see Annex 1.1). While a detailed
review and analysis of the economic reform measures in India is beyond the scope
of this study, it may be of use to note some of the important features of economic
reform measures; listout the major policy areas of economic reforms, take an
overview of the macro economic developments during the post-reform era and
identify the directions for future reforms, before looking forward towards the
perspectives on Indian economy.
(a)(a)(a)(a) Important features of economic reform measures since 1991.Important features of economic reform measures since 1991.Important features of economic reform measures since 1991.Important features of economic reform measures since 1991.
The Goals of Economic Reform : The Goals of Economic Reform : The Goals of Economic Reform : The Goals of Economic Reform : The fundamental objective of economic
reform is to bring about rapid and sustained improvement in the quality of life of
the people of India. Central to this goal is the rapid growth in incomes and
productive employment. Keeping these goals in view 'the objectives of medium
term strategy are to improve the underlying strength of the economy, insure the
economy against future crisis and further the fundamental development objective
of growth with equity and self-reliance' (GOI, 1993).
Stabilisation and Structural Adjustment Stabilisation and Structural Adjustment Stabilisation and Structural Adjustment Stabilisation and Structural Adjustment : : : : The overall economic reform
program was initiated when the Indian economy was amidst an unprecedented
economic crisis of both external and internal financial imbalances. The first stage,
therefore, was to stabilize the economy by reducing the fiscal deficit in the budget
and reducing the current account deficit in the balance of payments. Medium and
long-term changes in the policies to effect structural adjustment were initiated
along with the stabilization measures.
Gradualism and Evolutionary Transition :Gradualism and Evolutionary Transition :Gradualism and Evolutionary Transition :Gradualism and Evolutionary Transition : "An important feature of
India's reform program, when compared with reforms underway in many other
countries, is that it has emphasized gradualism and evolutionary transition
rather than rapid restructuring or 'shock therapy' " (Ahluwalia, Montek S. 1994).
The reform measures were initiated in the backdrop of a crisis but not a 'system
collapse'. Also, the need for economic reforms was being felt even during 1980s
when the imbalances were increasing and there were some attempts to liberalise
the trade and investment control. However, the change effected were marginal,
piecemeal, limited, and inadequate to change the systems in a major way.
Interlinkages and Comprehensiveness :Interlinkages and Comprehensiveness :Interlinkages and Comprehensiveness :Interlinkages and Comprehensiveness : The reform measures initiated
have been comprehensive in terms of the scope and coverage to ensure the
necessary inter-linkages between different parts of the system. Thus, changes in
trade policy, industrial policy, exchange rate policy, etc., were initiated in such a
way so as to ensure full impact on the system.

22
Designing Methodology: Designing Methodology: Designing Methodology: Designing Methodology: Most of the medium and long-term reform
measures were designed on the basis of comprehensive studies and reports
prepared by expert committees. Chelliah committee for tax reforms, Rangarajan
committees on balance of payments, and on public sector enterprises
disinvestment, Narismham committee on financial sector, and Malhotra
committee on insurance sector are some of the prominent committees formed after
initiating the stabilisation measures. The medium-term policy changes were
initiated on the basis of recommendations of these committees. Also, the
government issued 'discussion papers' on different aspects including the one on
'Economic Reforms: Two years after and the task ahead' (GOI, 1993).
(b)(b)(b)(b) Major Policy areas of Economic Reforms.Major Policy areas of Economic Reforms.Major Policy areas of Economic Reforms.Major Policy areas of Economic Reforms.
The reform process has necessarily to express itself as changes in specific
policy areas, affecting the economic system. Highlights of changes in important
policy areas, having bearing on the economic system, are summarized below.
Policy AreaPolicy AreaPolicy AreaPolicy Area Indicative changes in the systemsIndicative changes in the systemsIndicative changes in the systemsIndicative changes in the systems
Fiscal policy Changes in the system of
Streamlining and rationalizing the levels,
structure, and procedures of the tax system.
Changes in the financing pattern of the fiscal
deficits through borrowings at market rates
and reduced dependence on the system of
monetising the deficits.
Changes in expenditure pattern through
reduced transfer payments on services,
subsidies, budget support to public sector
entities, etc.
Monetary policy Changes in the system of
preemption of resources from the banking
sector by the government.
priority sector lending by banks.
provisioning and capital adequacy norms in line
with international standards.
interest rate deregulation.
management practices of banking sector.
Capital market policy Changes in the system of
governing various aspects of the stock market
by strengthening the regulatory institutions.
approvals for foreign institutional investors.
Indian companies borrowing abroad.

23
Trade policy System for licensing of imports, channelisation
of imports and export subsidization dismantled
or reduced to the bare minimum.
The system of foreign exchange allocations
through foreign exchange budgeting for imports,
etc. dismantled completely.
Exchange rate policy Exchange rate determination system now
totally market oriented.
Industrial policy and foreign investment The system of pervasive industrial and
licensing abolished for all except select lists.
The system of control and regulation of
investment and expansion of capacity through
Monopolies and Restrictive Trade Practices
(MRTP) Act eliminated.
System of foreign investment approvals
streamlined, opened, and made easy.
Public sector policy Process of disinvestment of government equity
in public sector companies initiated.
The system of budgetary support to PSEs
changed to phase out the support.
Selective privatization of public sector activities
in the process.
(c)(c)(c)(c) An Overview of Economic Reforms:An Overview of Economic Reforms:An Overview of Economic Reforms:An Overview of Economic Reforms:
Trends in the macroeconomic indicators for the economy as a whole (seeAppendix 1.2) and for different sectors as given in part 1.1 of this chapter provide
a macro view of changes in the Indian economy during the post-reforms era
(1990s) over the pre-reform trends with an indicative backdrop of historical trends.
An attempt is made here to provide an overview of economic reforms.
• The trend growth rategrowth rategrowth rategrowth rate of GDP during the post-reform period is higher
over the pre-reform period. However, this is not being considered
adequate both in terms of the potentials of the economy and the need of
a high growth in terms of a sustained, equitable and job creating
growth path to banish the scourge of poverty within a decade - an
objective set in 2000-2001 Budget speech of the Finance Minister.
• The inter-sectoral composition of composition of composition of composition of GDPGDPGDPGDP has shown a significantstructural change after the initiation of reform process. The economy
has leap-forged from the stage of lower order of value addition
generally associated with the agriculture sector to the higher level of
value addition accounted for by the services sector. This structural shift

24
has major policy implications for future. First, policy initiatives are
required to make the services sector more efficient and competitive.
Second, deregulation and major policy shifts are required for the
agriculture sector to increase productivity and enhance its capacity to
reduce poverty.
• The pace and pattern of technological change in agriculture sectoragriculture sectoragriculture sectoragriculture sector has
reduced during the post reform era mainly because agriculture sector,
perhaps is the one which has experienced much less reform compared
to other sectors. Agriculture sector is still constrained by widespread
regulations over inter-state and even intra-state trade, public
procurement system, controls on agro-processing industry and poor
rural infrastructure.
Box 1.3Box 1.3Box 1.3Box 1.3Agriculture Sector : Directions for ReformsAgriculture Sector : Directions for ReformsAgriculture Sector : Directions for ReformsAgriculture Sector : Directions for Reforms
• Future agricultural growth could be speeded by policy and institutional reform inthe sector, namely (a) changed pattern of spending to building up of capital assetsand a reduction in distortionary subsidies; (b) deregulation of the processing sectorand termination of the use of credit subsidy as a transfer mechanism; and (c)empowerment of the poor by improving their access to land and common resources,increasing their control over services and infrastructure in rural areas, andimproved safety nets.
• The above-mentioned policy reforms would also help reduce poverty. For example,increased public spending on rural roads, agricultural technology improvement, andirrigation would all help reduce poverty. Growth in the rural non-farm sector wouldalso benefit from improved infrastructure (roads, power, communications) andsocial services. More efficient and competitive markets can deliver better prices andgreater market opportunities to farmers, without raising consumer prices, whichwould help farmers offset the impact of cuts in subsidies. Better markets togetherwith futures markets and eased restrictions on commodity movements and privateparticipation in international trade can help reduce price fluctuations.
Source :Source :Source :Source : Planning Commission, GOI (October, 2000)Mid Term Appraisal of Ninth Five Year Plan (1997-2002) (Page 74)
• Industrial policy Industrial policy Industrial policy Industrial policy has witnessed a significant policy shift during thereform era. Over a period widespread changes have been made in the
policy to delicense the sector for investment purposes, deregulate the
location compulsions, promote foreign direct investment, redifine the
role of government and provide incentive for private sector investment
in infrastructure sector and to restructure public enterprises including
through disinvestment. However, the lack of infrastructure facilities,
intermittent slow down in demand, some tax anomalies and general
look of competitiveness continue to constrain the industrial sector to
generate a consistent trend growth rate. To enhance the
competitiveness in the industrial sector policy reforms on exit policy,

25
competition policy, research and development and finally effective and
independent regulatory institutional mechanisms are being strongly
advocated.
• A main thrust of economic reform measures initiated in 1991 was to
open up the economy for attracting more private investment in
infrastructure sectorinfrastructure sectorinfrastructure sectorinfrastructure sector. Extensive policy, legal and institutional changes
were made in all the sub-sectors like power, telecom, roads and posts.
Notwithstanding some significant gains in the telecommunications
where the privately financed services now compete with the public
sector, some additions in power generation capacity through privately
financed independent power projects and prospects of increased private
investment in roads, posts etc., the quality, reliability and reasonably
priced infrastructure facilities are still a major constraint in the overall
economic growth of the economy. What is now required is a deepening
of reforms of the private sector to make a full contribution to meeting
India's infrastructure needs. (See Annex 1.2 for An Overview of Policy
Recommendations of the Country Framework Report for India, under
the Auspices of the World Bank Group's Infrastructure Action Program,
with funding from the World Bank and the Japanese government).
• External sector External sector External sector External sector of the Indian economy has undergone the most
significant structural transformation during the current reforms period.
A clear shift towards outward looking policy since 1991 (a sharp
contrast of inward looking approach during the first three decades of
plan period 1950 to 1980) has been at the core of economic reforms for
globalization and international competitiveness. The reform process in
the external sector included liberalization of trade, market
determination of exchange rate, opening up of foreign investment, and
gradual liberalization of capital account. These changes have made
India's external sector comfortable for the economy as a whole, less
vulnerable to external shocks and more competitive through market
mechanisms. External trade is buoyant, foreign investment flow has
increased, dependence on confessional aid has reduced, external debt
has been consolidated, exchange rate is market determined and foreign
exchange reserves level has continued to provide the much needed
comfort against short-term demand supply mismatches. The continued
need to remain vigilant over the international pressures particularly
the fluctuations in oil prices and capital flows is perhaps the only major
requirement in managing the external sector at least in the short term.
• Fiscal reforms Fiscal reforms Fiscal reforms Fiscal reforms were the integral and perhaps the most critical part ofthe overall economic reforms program. The fiscal stabilization measures
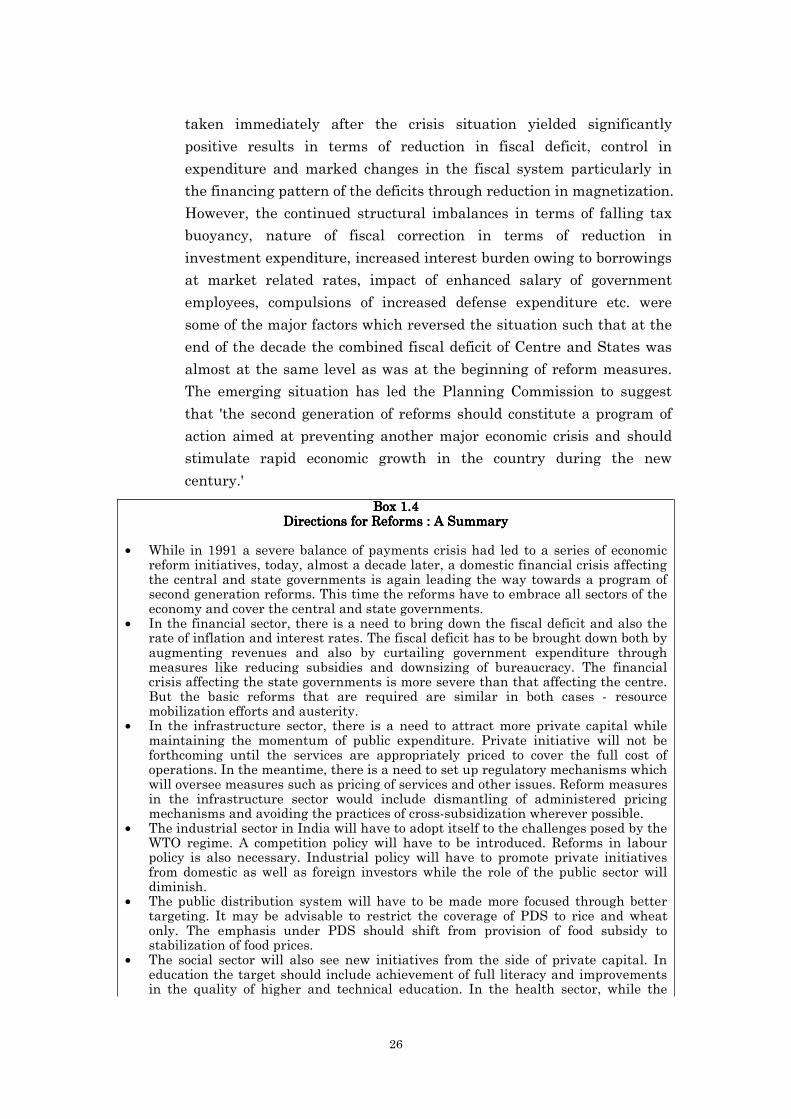
26
taken immediately after the crisis situation yielded significantly
positive results in terms of reduction in fiscal deficit, control in
expenditure and marked changes in the fiscal system particularly in
the financing pattern of the deficits through reduction in magnetization.
However, the continued structural imbalances in terms of falling tax
buoyancy, nature of fiscal correction in terms of reduction in
investment expenditure, increased interest burden owing to borrowings
at market related rates, impact of enhanced salary of government
employees, compulsions of increased defense expenditure etc. were
some of the major factors which reversed the situation such that at the
end of the decade the combined fiscal deficit of Centre and States was
almost at the same level as was at the beginning of reform measures.
The emerging situation has led the Planning Commission to suggest
that 'the second generation of reforms should constitute a program of
action aimed at preventing another major economic crisis and should
stimulate rapid economic growth in the country during the new
century.'
Box 1.4Box 1.4Box 1.4Box 1.4Directions for Reforms : A SummaryDirections for Reforms : A SummaryDirections for Reforms : A SummaryDirections for Reforms : A Summary
• While in 1991 a severe balance of payments crisis had led to a series of economicreform initiatives, today, almost a decade later, a domestic financial crisis affectingthe central and state governments is again leading the way towards a program ofsecond generation reforms. This time the reforms have to embrace all sectors of theeconomy and cover the central and state governments.
• In the financial sector, there is a need to bring down the fiscal deficit and also therate of inflation and interest rates. The fiscal deficit has to be brought down both byaugmenting revenues and also by curtailing government expenditure throughmeasures like reducing subsidies and downsizing of bureaucracy. The financialcrisis affecting the state governments is more severe than that affecting the centre.But the basic reforms that are required are similar in both cases - resourcemobilization efforts and austerity.
• In the infrastructure sector, there is a need to attract more private capital whilemaintaining the momentum of public expenditure. Private initiative will not beforthcoming until the services are appropriately priced to cover the full cost ofoperations. In the meantime, there is a need to set up regulatory mechanisms whichwill oversee measures such as pricing of services and other issues. Reform measuresin the infrastructure sector would include dismantling of administered pricingmechanisms and avoiding the practices of cross-subsidization wherever possible.
• The industrial sector in India will have to adopt itself to the challenges posed by theWTO regime. A competition policy will have to be introduced. Reforms in labourpolicy is also necessary. Industrial policy will have to promote private initiativesfrom domestic as well as foreign investors while the role of the public sector willdiminish.
• The public distribution system will have to be made more focused through bettertargeting. It may be advisable to restrict the coverage of PDS to rice and wheatonly. The emphasis under PDS should shift from provision of food subsidy tostabilization of food prices.
• The social sector will also see new initiatives from the side of private capital. Ineducation the target should include achievement of full literacy and improvementsin the quality of higher and technical education. In the health sector, while the
27
access of the poor to public health facilities need to be improved full costs should berecovered from those who can afford to pay. Environment accounting should becomean integral part of the plan process. In this regard, the focus on the internationaldimension should not be lost.
• Decentralization and globalization are among the processes that will shape the newcentury. Initiatives by the local bodies, NGOs and women need to be encouraged.The process of institution building should be backed up by administrative and legalreforms without which the second generation of reforms will be incomplete.
Source :Source :Source :Source : Planning Commission, GOI (October 2000)Mid Term Appraisal of Ninth Five Year Plan (1997-2002) (Page 510)
1.41.41.41.4 Indian Economy : PerspectivesIndian Economy : PerspectivesIndian Economy : PerspectivesIndian Economy : Perspectives
A synoptic view of overall assessment and perspectives on the Indian
economy in this part of the chapter is based on a select few important
studies/reports out of the current flow of literature on Indian economy. To keep
the assessment and perspective balanced and unbiased, the studies/reports
selected are from three sources : Government of India and Reserve Bank of India;
International Institutions (IMF, World Bank, ADB, JBIC and UNDP); and
academic studies by a few individual experts (See Annex-1.1 for highlights). It
emerges from these reports/studies that the main determinants of India's
economic development; at least during the medium term, would include sustained
higher growth rate, removal of infrastructure bottlenecks, further deregulation
particularly of agriculture sector, renewed focus an social sector, fiscal
consolidation, and above all a strategy on sharp reduction in poverty level.
Growth Rate: Growth Rate: Growth Rate: Growth Rate: The average real growth rate of the economy at 6.4 per cent during
1992-93 to 1999-2000 was higher than 5.9 per cent during the 1980s.
Notwithstanding the fact that with these growth rates, India has been among the
fastest growing economies in the world over the last two decades, these are not
being considered adequate to meet the real challenges of poverty reduction. 'When
a satellite is put into orbit, it requires high velocity to ensure exit from the earth's
gravitational force; similarly if our economy is to exit from the gravitational pull
of poverty, it requires an exit velocity of double-digit growth rate over the next two
decades' (Kelkar, 1999). Though not specific to the growth target, Finance
Minister while presenting the Union Budget 2000-2001 declared the next ten
years as 'India's decade of development'. Bajpai and Sachs (April, 2000) referring
to the Finance Ministers statement said: 'we concur that India has a chance for a
tremendous breakthrough in economic development this decade' and suggested
that government of India may like to set for itself at least two broad goals: First,by the year 2010, the per capita income of India would be doubled. Income
doubling within a decade requires annual growth in per capita income of 7 per
cent per annum; Second, by the year 2010, there would be universalisation of
education until Class VIII, with a special effort for girls and disadvantaged groups.

28
There is thus a growing view that even the current relatively higher growth
is not adequate and the economy needs to achieve a still higher and sustained
growth rate over the longer-term. According to a recent assessment (RBI, Sept.,
2000), 'the real GDP growth of the Indian economy is widely believed to be
hovering around its "filtered trend rate (a rate that is obtained by smoothening
out of cyclical fluctuations around the trend), but the economy has still to 'catch
up' to achieve an average growth of 7-8 per cent per-annum or the potential
growth as determined by the production possibility frontier. Such an outcome
would be rendered possible if the requisite real investment growth occurs along
with technology improvements and efficiency gains.
Infrastructure: Infrastructure: Infrastructure: Infrastructure: It is by now well recognized that 'infrastructure bottlenecks are
liekly to constrain the achievement of a higher growth rate of 7 per cent and
above' (ADB, 2000). In fact 'the need to improve economic infrastructure such as
electric power, which constitutes the greatest impediment to economic growth,
remains as higher as ever (OECF, 1999). That is why one of the elements listed in
the strategy outlined by the Finance Minister for 'India's decade of development'
is to "mount a sustained assault on infrastructure bottlenecks in power, roads,
ports, telecom, railways and airways". In perspective, 'infrastructure productivity
will determine how India will cope with the increasing pace of urbanization,
globalization and technological innovations in manufacturing. (Rangarajan C.,
2000)
Expenditure reorientation: Expenditure reorientation: Expenditure reorientation: Expenditure reorientation: An important area of concern expressed in most of the
reports/studies focusing on poverty in India has been the lack of priority in public
expenditure in social sectors like primary education, health etc. The central issue
raised in the well known study by Dreze and Sen (1995) on 'India: Economic
Development and Social Opportunity', has been 'to expand the social opportunities
open to the people'. The need to take the debate on economic policy well beyond
the issue of economic reforms in the present form is by now well recognized.
'While the case for economic reforms may take good note of the diagnosis that
India has too much government in some fields, it ignores the fact that India also
has too little government activities in many other fields, including basic education
and health care, which makes people's lives miserable and which also limits the
possibility of economic expansion (Dreze and Sen, 1997). Finally, the sensitivity or
lack of it, on allocation of resources has reached a point where one strongly feels to
say that 'resource transfer to the rich is described as 'incentives' while income-
transfer to the poor is described as a 'subsidy' - commonly perceived to be a
derogatory term. And, therefore, it is proposed that 'pro-poor oriented growth is
possible when intellectual community and policy makers treat markets with the
suspicions that they deserve and the poor with the respect that they need' (Reddy,
2000).
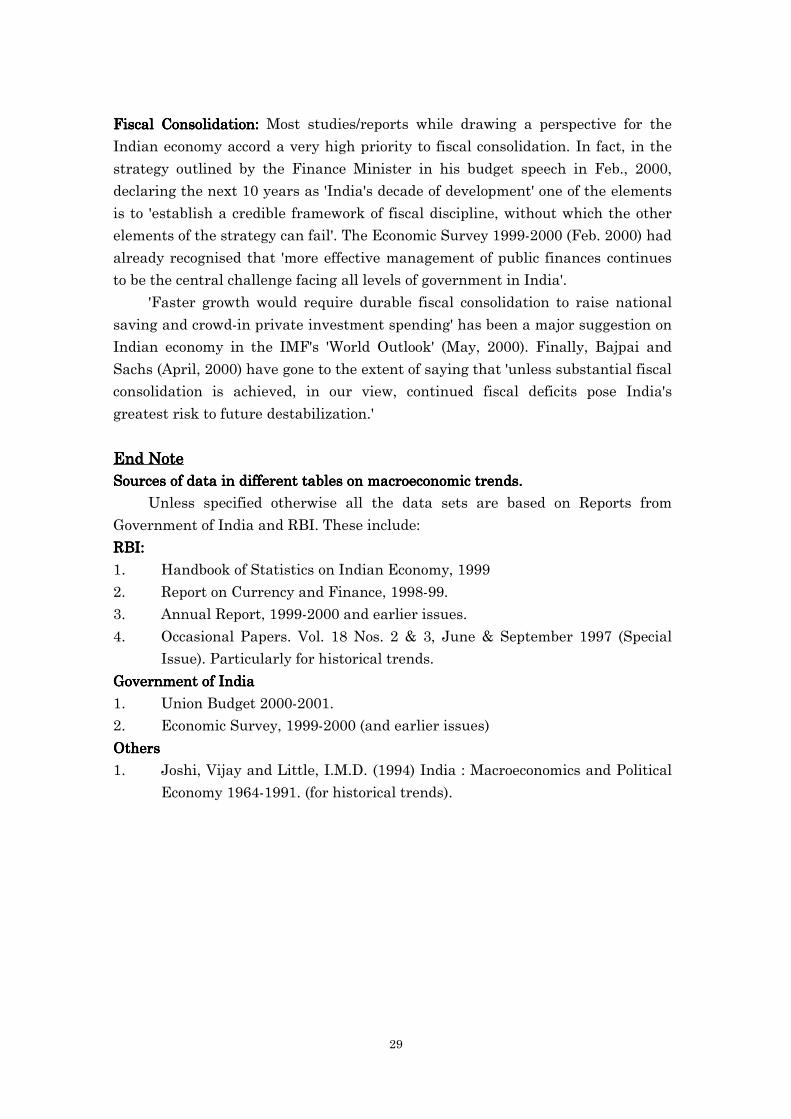
29
Fiscal Consolidation: Fiscal Consolidation: Fiscal Consolidation: Fiscal Consolidation: Most studies/reports while drawing a perspective for the
Indian economy accord a very high priority to fiscal consolidation. In fact, in the
strategy outlined by the Finance Minister in his budget speech in Feb., 2000,
declaring the next 10 years as 'India's decade of development' one of the elements
is to 'establish a credible framework of fiscal discipline, without which the other
elements of the strategy can fail'. The Economic Survey 1999-2000 (Feb. 2000) had
already recognised that 'more effective management of public finances continues
to be the central challenge facing all levels of government in India'.
'Faster growth would require durable fiscal consolidation to raise national
saving and crowd-in private investment spending' has been a major suggestion on
Indian economy in the IMF's 'World Outlook' (May, 2000). Finally, Bajpai and
Sachs (April, 2000) have gone to the extent of saying that 'unless substantial fiscal
consolidation is achieved, in our view, continued fiscal deficits pose India's
greatest risk to future destabilization.'
End NoteEnd NoteEnd NoteEnd NoteSources of data in different tables on macroeconomic trends.Sources of data in different tables on macroeconomic trends.Sources of data in different tables on macroeconomic trends.Sources of data in different tables on macroeconomic trends.
Unless specified otherwise all the data sets are based on Reports from
Government of India and RBI. These include:
RBI:RBI:RBI:RBI:
1. Handbook of Statistics on Indian Economy, 1999
2. Report on Currency and Finance, 1998-99.
3. Annual Report, 1999-2000 and earlier issues.
4. Occasional Papers. Vol. 18 Nos. 2 & 3, June & September 1997 (Special
Issue). Particularly for historical trends.
Government of IndiaGovernment of IndiaGovernment of IndiaGovernment of India
1. Union Budget 2000-2001.
2. Economic Survey, 1999-2000 (and earlier issues)
OthersOthersOthersOthers
1. Joshi, Vijay and Little, I.M.D. (1994) India : Macroeconomics and Political
Economy 1964-1991. (for historical trends).
30
Appendix 1.1 (a)Appendix 1.1 (a)Appendix 1.1 (a)Appendix 1.1 (a)Indian Economy :
Comparison of Economic Performance Among Select CountriesIndices India Singa- China Pakistan Sri Lanka South Mexico USA Japan
pore Africa1. GNP (World bank Atlas method)
a. per capita 1999 (in $) 450 29,610 780 470 820 3,160 4,400 30,600 32,320b. ranking of countries 162 9 140 160 137 86 71 8 6
2. GNP (PPP)a. per capita 1999 (in $) 2,149 27,024 3,291 1,757 3,056 8,318 7,719 30,600 24,041b. ranking of countries 153 7 128 159 136 69 75 4 14
3. GNP annual growth rate of %a. 1980-90 5.8 6.7 10.1 6.3 4.0 1.0 1.1 3.0 4.0b. 1990-99 6.1 8.0 10.7 4.0 5.3 1.9 2.7 3.4 1.4
4. Average annual rate ofInflation 1990-98 (in %)
8.9 2.1 9.7 11.1 9.7 10.6 19.5 1.9 0.2
5. Gross domesticinvestment(GDI) as % ofGDP (1997-1999)
23.9 34.5 38.8 15.7 24.8 15.9 24.8 18.5 29.2
6. Average annual growthof GDI (1990-99)
7.4 8.5 12.8 2.1 6.2 3.0 3.9 7.0 1.1
7. Gross domestic savingsas % of GDP(1997-1999)
20.3 51.4 42.5 11.2 18.3 17.3 23.8 16.7 30.0
8. Average annual growthof exports of goods &services(1990-99)
11.3 - 13.0 2.7 8.4 5.3 14.3 9.3 5.1
9. 23.0 - 16.4 52.8 54.9 18.9 42.0 - -External debt as % ofGNP (1998)
10. Gross reserves (in US$ billion)a. per capita 1999 (in $) 5.64 27.75 34.48 1005 0.45 2.58 10.22 113.1 87.83b. ranking of countries 32.7 76.84 157.73 1.51 1.64 6.35 31.78 60.5 286.92
11. Net foreign direct investment (in US$ billion)a. annual Average
1987-19920.06 3.67 4.65 0.23 0.06 -0.024 4.31 46.21 0.91
b. 1998 2.26 7.22 45.5 0.5 0.35 0.37 10.24 193.4 3.1912. Composite ICRG risk
rating (March 2000)64.3 89.0 72.3 54.3 60.3 70.5 70.5 80.0 82.0
13. 45.3 80.4 56.6 18.8 35.4 45.2 49.8 92.9 86.9Institutional investorcredit Rating (March2000)
14. Stock marketcapitalization(in US $ billion) in 1999
184.6 198.4 330.7 6.97 1.58 262.5 154.0 16635 4547
15. Stock marketcapitalization As % ofGDP in 1997
33.7 110.0 22.9 17.8 13.9 179.8 38.9 144.4 52.9
16. Subsidies & othercurrent Transfers as %of total expenditure in1997
40 8 - 8 20 49 51 60 -
17. Education Profilea) 3.2 3.0 2.3 2.7 3.4 8.0 4.9 5.4 3.6Public education
expenditure as % ofGNP (1995-97)
b) 11.6 23.4 12.2 7.1 8.9 23.9 23.0 14.4 9.9Public educationexpenditure as % ofGovt. Expenditure(1995-97)
c) Share of pre-primary,primary andsecondary ineducation expenditure(1994-97) (%)
66.0 60.3 69.6 79.8 74.8 73.1 82.8 74.8 81.2
d) adult literacy rate1998
55.7 91.8 82.8 44.0 91.1 84.6 90.8 99.0 99.0
e) youth literacy rate1998
70.9 99.7 97.2 61.4 96.5 90.8 96.6 - -
18. Health Profilea) 0.6 1.1 2.0 0.9 1.4 3.2 2.8 6.5 5.9Public expenditure on
health as % of GDP(1990-98)
b) 81 100 90 60 46 70 83 - 96% of population withaccess to improvedwater source (1990-95)
(Continued…..)

31
Indian Economy :Comparison of Economic Performance Among Select Countries (Concluded)Indices India Singa- China Pakistan Sri Lanka South Mexico USA Japan
pore Africac) % of population with
access to sanitation(1990-96)
16 100 21 30 52 46 66 - 100
d) ranking of countriesper 1000 live births(1998)
70 4 31 91 16 51 30 7 4
e) life expectancy atbirth (in year)
62.9 77.3 70.1 64.4 73.3 53.2 72.3 76.8 80.0
f) daily per capita supplyof calories (1997)
2,496 - 2,897 2,476 2,302 2,990 3,097 3,699 2,932
g) daily per capitasupply of protein ingrams (1997)
59 - 78 61 52 77 83 112 96
h) Doctors per 1 lakhpopulation (1992-95)
48 147 115 52 23 59 85 245 177
i) Tuberculosis per 1lakh people in 1997
118.3 57.5 33.7 3.1 35.7 242.7 25.0 6.4 33.6
j) per cent of infantswith low birth weight(1990-97)
33 7 9 25 25 - 7 7 7
19. Military expenditureas % of GNP in 1997
2.8 5.7 2.2 5.7 5.1 1.8 1.1 3.3 1.0
20. Highest marginal taxrate in % in 1999a) individual 30.0 28 45 - 35 45 40 40 50b) corporate 35 26 30 - 35 30 35 35 35
21. Power & Transportationa) power consumption
per capita KWH (1997)363 7,944 714 333 227 3,800 1,459 11,822 7,241
b) T&D losses (1997)(per cent)
18 4 8 24 17 8 14 6 4
c) paved road as % oftotal (1998)
45.7 97.3 - 57 95 11.8 29.7 58.8 74.9
d) goods transported byrail thousand ton-kmper $ million of GDP(PPP) (1998)
137.1 - 304.8 26.3 2.03 283.3 62.1 213.8 101.7
e) air passenger carried‘00000s(1998)
165.2 133.3 532.3 54.1 12.1 64.8 177.2 5,881.2 1017
22. Communications, information &Science & technology per 1000peoplea) radios (1997) 121 822 333 98 209 317 325 2,146 955b) TV sets (1998) 69 348 272 88 92 125 261 847 707c) Telephone mainlines
(1998)22 562 70 19 28 115 104 661 503
d) PCs (1998) 2.7 458.4 8.9 3.9 4.1 47.4 47 458.6 237.2e) internet hosts per
10,000(January 2000)0.23 452.3 0.57 0.34 0.63 39.2 40.9 1,940 208
f) scientists &engineers in R&Dper million people(1987-97)
149 2,318 454 72 191 1,031 214 3,676 4,909
g) high technologyexports as % ofmanufacturingexports
5 59 15 0 - 9 19 33 26
h) waiting time fortelephone connectionin year (1997)
1.0 0.0 0.1 1.2 6.3 0.4 0.8 0.0 0.0
23. GFD of Central Govt.(% of GDP)a) 1990 -7.5 10.8 -1.9 -5.4 -7.8 -4.1 -2.5 -3.9 -1.6b) 1998 -5.2 11.8 -1.5 -6.3 -8.0 -2.9 -1.1 0.9 -
24. Capital Expenditure ofCentral Government (%of GDP)a) 1990 1.8 5.1 - 2.6 6.1 3.1 2.5 1.8 2.0b) 1998 1.6 5.1 - 2.5 5.3 1.2 1.9 0.6 -
Note : The date for making country comparisons are primarily culled out from World Development Reportsand Human Development Reports, World Bank. For the performances of Indian economy during the post-Independence period, they are mostly drawn from Economic Surveys, Government of India, WorldDevelopment Reports, World Bank and RBI Occasional Papers Vol. 18 Nos. 2 and 3.Source : Reddy, Y.V. (December, 2000) Indian Economy: 1950; 2000; 2020, RBI Bulletin.

32
Appendix 1.1 (b)Appendix 1.1 (b)Appendix 1.1 (b)Appendix 1.1 (b)Indian Economy :
Ranking of Select Countries based on various Socio-Economic Indices
Indices India Singa- China Pakistan Sri Lanka South Mexico USA Japan Total No.pore Africa of countries
surveyed1. Economic creativity 38 3 48 - - 26 35 1 21 59
Index (2000)a. Technology Index (2000) 38 3 47 - - 32 11 1 6 59b. Start-up Index (2000) 38 7 46 - - 19 51 1 37 59
2. Growth competitiveness 49 2 41 - - 33 43 1 21 59Index (2000)
3. Current competitiveness 37 9 44 - - 27 42 2 14 58Index (2000)
4. Microeconomic competi- 42 12 49 - - 26 34 1 14 58tiveness index (1999)
5. Environmental regulatory 43 - 40 - - 27 30 9 12 53Index (1996) $
6. Financial market sophisti- 39 9 50 - - 14 35 1 26 59cation (1999)
7. Corruption perception 46 7 50 53 - 23 38 15 17 54Index (1996) $
8. Human Development 128 24 99 135 84 103 55 3 9 174Index (1998)a. GDP (ppp) index 0.51 0.92 0.57 0.47 0.57 0.74 0.73 0.95 0.91 174b. Education index 0.55 0.86 0.79 0.44 0.83 0.88 0.84 0.97 0.94 174c. Life expectancy index 0.63 0.87 0.75 0.66 0.81 0.47 0.79 0.86 0.92 174
9. Human Poverty 58 - 30 68 35 33 12 18 9Index (1998)*
10. Recessionary expectations 6.0 6.2 5.4 - - 6.3 5.2 5.7 4.6(January 2000) (on scorebetween 0 to 7) #
11. Gloablisation Index 2.0 6.0 7.0 - - 4.0 -4.5 5.0 0.5annual average % change,1993-94
12. Emerging market access 46 86 37 - - 72 68 - -Index (2000)
* for 85 developing countries and 18 industrialized countries (in which USA and Japan belong)separately.
$ - higher the rank greater is the degree of perceived corruption or lack of transparency.# - higher the value less is the Recessionary Expectations.Source : Reddy, Y.V. (December, 2000) Indian Economy: 1950; 2000; 2020, RBI Bulletin.

33
SOCIO-ECONOMIC INDICES AND THEIR INTERPRETATION
Type of IndexType of IndexType of IndexType of Index What does the Index Attempt to Gauge and its estimationWhat does the Index Attempt to Gauge and its estimationWhat does the Index Attempt to Gauge and its estimationWhat does the Index Attempt to Gauge and its estimation
1. Technology Index Based on observed data and survey results, the index measuresthe level of technology in a country. It takes into account ofcountries’ involvement in innovation and import of technologyfrom abroad.
2. Start-up Index This index is also based on observed data and survey results. Itmeasures the condition favouring business start-ups.
3. Economic CreativityIndex
This index combines the above two indices in order to gauge acountry’s involvement in economically effective innovation ortransfer of technology (‘technology index’) and the conditionfavouring business start-ups (‘start-up index’). The most creativecountries are also among the fastest-growing over the past decade.America has pace setting innovation and the best start-upenvironment. Though Singapore is not a great innovator, itseconomic creativity is very high through rapid import oftechnology.
4. Growth CompetitivenessIndex
It aims to measure the factors that contribute to future growth ofan economy, measured as the rate of change of GPD per person, inorder to explain why some countries are improving theirprosperity faster than others. Variables that contribute to levels ofproductivity, high rates of accumulation and innovation andimprovements in productivity and statistically significantly aretaken into account in constructing the index. The indices are‘economic creativity index’, as explained above, ‘finance index’ and‘international index’ all of which are assigned equal weights ofone-third. ‘Finance index’ measures the efficiency of financialsystem which is conducive to high rates of saving and investmentand the ‘international index’ measures the degree of economicintegration with the rest of the world.
5. MicroeconomicCompetitiveness Index
It attempts to measure the microeconomic foundations ofeconomic development, rooted in firms’ operating practices andstrategies as well as in the business inputs, infrastructure,institutions and policies that constitute the environment in whicha nation’s firms compete. Bivariate relationships between thesemicroeconomic variables and GDP per capita are estimated. Andweighting all the variables, common factor analysis is employed toprovide a single composite picture of relative microeconomiccompetitiveness. The factor score of the dominant factor whichcaptures the variance among the variables is interpreted as theindex.
6. Current CompetitivenessIndex
This index is built upon the microeconomic competitiveness index.The index to identify the factors that underpin high currentproductivity and hence current economic performance, measuredby the level of GDP per person. The index takes into account of anation’s firms’ operating practices and strategies and the qualityof the nation’s business environment. A variety of measuresreflecting the sophistication of company operations and strategiesare statistically related to GDP per capita and are combined into asub-index of the sophistication of company operations. Next, avariety of measures reflecting the quality of business environmentviz., quality of inputs, availability and sophistication of local
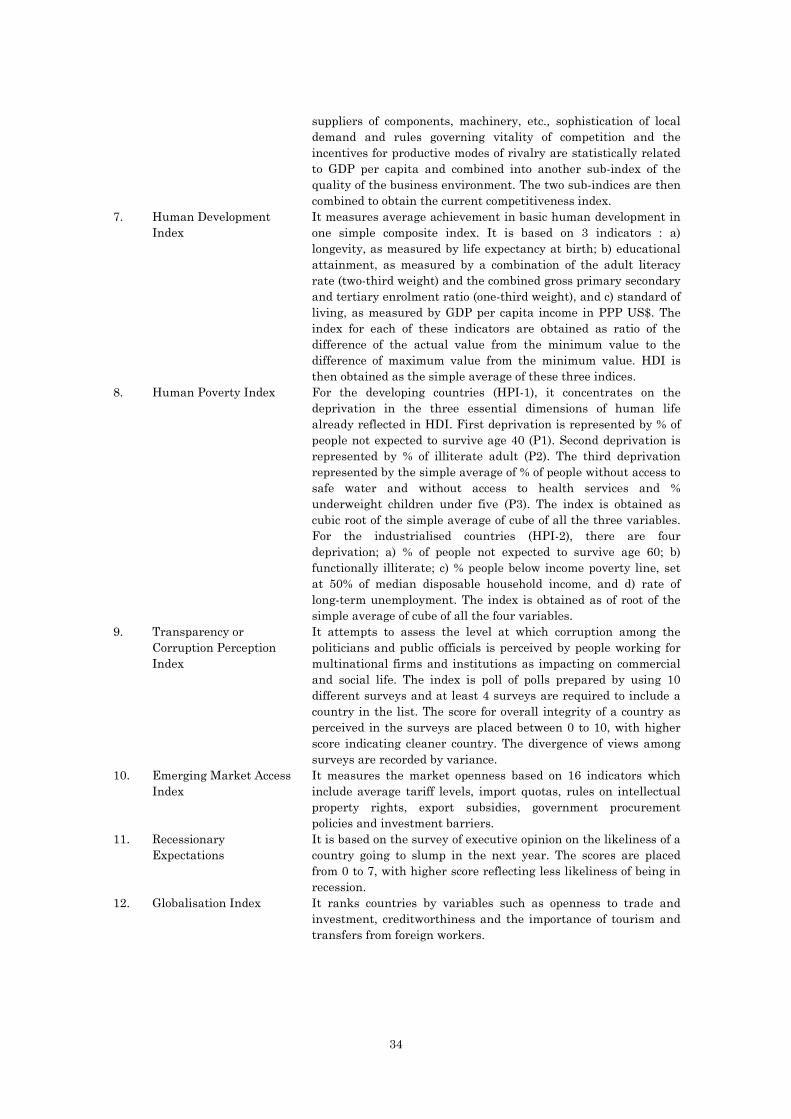
34
suppliers of components, machinery, etc., sophistication of localdemand and rules governing vitality of competition and theincentives for productive modes of rivalry are statistically relatedto GDP per capita and combined into another sub-index of thequality of the business environment. The two sub-indices are thencombined to obtain the current competitiveness index.
7. Human DevelopmentIndex
It measures average achievement in basic human development inone simple composite index. It is based on 3 indicators : a)longevity, as measured by life expectancy at birth; b) educationalattainment, as measured by a combination of the adult literacyrate (two-third weight) and the combined gross primary secondaryand tertiary enrolment ratio (one-third weight), and c) standard ofliving, as measured by GDP per capita income in PPP US$. Theindex for each of these indicators are obtained as ratio of thedifference of the actual value from the minimum value to thedifference of maximum value from the minimum value. HDI isthen obtained as the simple average of these three indices.
8. Human Poverty Index For the developing countries (HPI-1), it concentrates on thedeprivation in the three essential dimensions of human lifealready reflected in HDI. First deprivation is represented by % ofpeople not expected to survive age 40 (P1). Second deprivation isrepresented by % of illiterate adult (P2). The third deprivationrepresented by the simple average of % of people without access tosafe water and without access to health services and %underweight children under five (P3). The index is obtained ascubic root of the simple average of cube of all the three variables.For the industrialised countries (HPI-2), there are fourdeprivation; a) % of people not expected to survive age 60; b)functionally illiterate; c) % people below income poverty line, setat 50% of median disposable household income, and d) rate oflong-term unemployment. The index is obtained as of root of thesimple average of cube of all the four variables.
9. Transparency orCorruption PerceptionIndex
It attempts to assess the level at which corruption among thepoliticians and public officials is perceived by people working formultinational firms and institutions as impacting on commercialand social life. The index is poll of polls prepared by using 10different surveys and at least 4 surveys are required to include acountry in the list. The score for overall integrity of a country asperceived in the surveys are placed between 0 to 10, with higherscore indicating cleaner country. The divergence of views amongsurveys are recorded by variance.
10. Emerging Market AccessIndex
It measures the market openness based on 16 indicators whichinclude average tariff levels, import quotas, rules on intellectualproperty rights, export subsidies, government procurementpolicies and investment barriers.
11. RecessionaryExpectations
It is based on the survey of executive opinion on the likeliness of acountry going to slump in the next year. The scores are placedfrom 0 to 7, with higher score reflecting less likeliness of being inrecession.
12. Globalisation Index It ranks countries by variables such as openness to trade andinvestment, creditworthiness and the importance of tourism andtransfers from foreign workers.
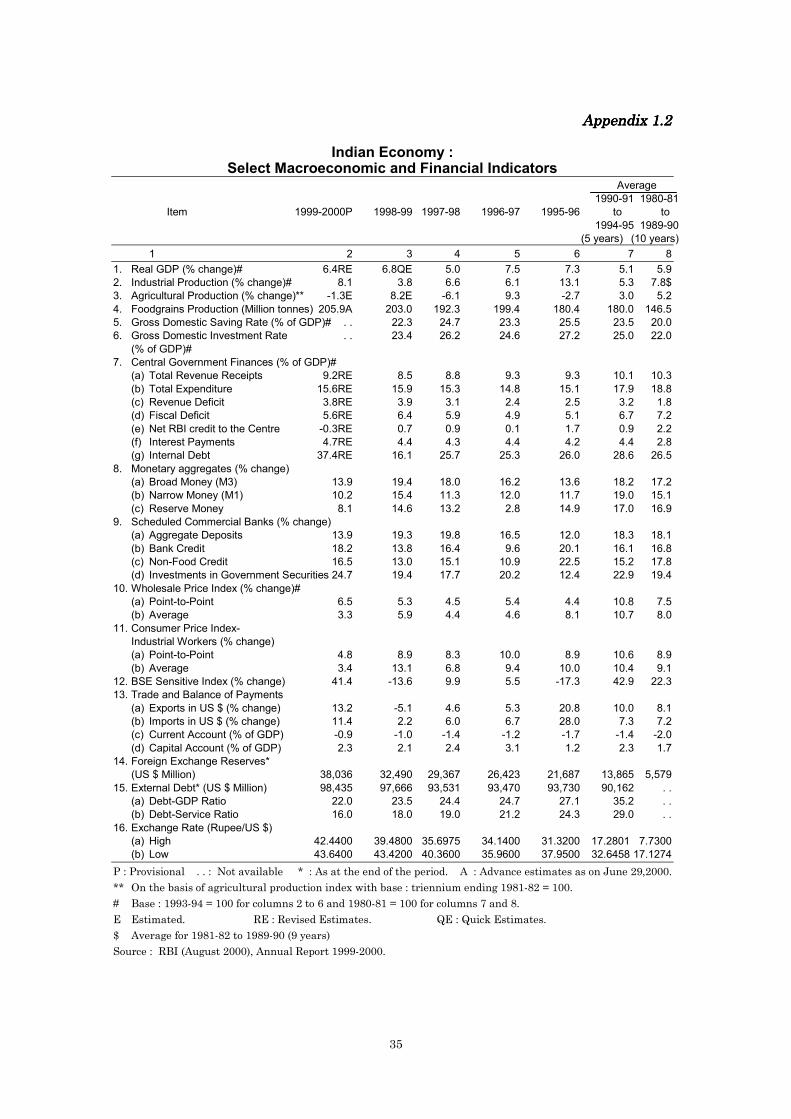
35
Appendix 1.2Appendix 1.2Appendix 1.2Appendix 1.2
Indian Economy :Select Macroeconomic and Financial Indicators
Average1990-91 1980-81
Item 1999-2000P 1998-99 1997-98 1996-97 1995-96 to to1994-95 1989-90
(5 years) (10 years)1 2 3 4 5 6 7 8
1. Real GDP (% change)# 6.4RE 6.8QE 5.0 7.5 7.3 5.1 5.92. Industrial Production (% change)# 8.1 3.8 6.6 6.1 13.1 5.3 7.8$3. Agricultural Production (% change)** -1.3E 8.2E -6.1 9.3 -2.7 3.0 5.24. Foodgrains Production (Million tonnes) 205.9A 203.0 192.3 199.4 180.4 180.0 146.55. Gross Domestic Saving Rate (% of GDP)# . . 22.3 24.7 23.3 25.5 23.5 20.06. Gross Domestic Investment Rate . . 23.4 26.2 24.6 27.2 25.0 22.0
(% of GDP)#7. Central Government Finances (% of GDP)#
(a) Total Revenue Receipts 9.2RE 8.5 8.8 9.3 9.3 10.1 10.3(b) Total Expenditure 15.6RE 15.9 15.3 14.8 15.1 17.9 18.8(c) Revenue Deficit 3.8RE 3.9 3.1 2.4 2.5 3.2 1.8(d) Fiscal Deficit 5.6RE 6.4 5.9 4.9 5.1 6.7 7.2(e) Net RBI credit to the Centre -0.3RE 0.7 0.9 0.1 1.7 0.9 2.2(f) Interest Payments 4.7RE 4.4 4.3 4.4 4.2 4.4 2.8(g) Internal Debt 37.4RE 16.1 25.7 25.3 26.0 28.6 26.5
8. Monetary aggregates (% change)(a) Broad Money (M3) 13.9 19.4 18.0 16.2 13.6 18.2 17.2(b) Narrow Money (M1) 10.2 15.4 11.3 12.0 11.7 19.0 15.1(c) Reserve Money 8.1 14.6 13.2 2.8 14.9 17.0 16.9
9. Scheduled Commercial Banks (% change)(a) Aggregate Deposits 13.9 19.3 19.8 16.5 12.0 18.3 18.1(b) Bank Credit 18.2 13.8 16.4 9.6 20.1 16.1 16.8(c) Non-Food Credit 16.5 13.0 15.1 10.9 22.5 15.2 17.8(d) Investments in Government Securities 24.7 19.4 17.7 20.2 12.4 22.9 19.4
10. Wholesale Price Index (% change)#(a) Point-to-Point 6.5 5.3 4.5 5.4 4.4 10.8 7.5(b) Average 3.3 5.9 4.4 4.6 8.1 10.7 8.0
11. Consumer Price Index-Industrial Workers (% change)(a) Point-to-Point 4.8 8.9 8.3 10.0 8.9 10.6 8.9(b) Average 3.4 13.1 6.8 9.4 10.0 10.4 9.1
12. BSE Sensitive Index (% change) 41.4 -13.6 9.9 5.5 -17.3 42.9 22.313. Trade and Balance of Payments
(a) Exports in US $ (% change) 13.2 -5.1 4.6 5.3 20.8 10.0 8.1(b) Imports in US $ (% change) 11.4 2.2 6.0 6.7 28.0 7.3 7.2(c) Current Account (% of GDP) -0.9 -1.0 -1.4 -1.2 -1.7 -1.4 -2.0(d) Capital Account (% of GDP) 2.3 2.1 2.4 3.1 1.2 2.3 1.7
14. Foreign Exchange Reserves*(US $ Million) 38,036 32,490 29,367 26,423 21,687 13,865 5,579
15. External Debt* (US $ Million) 98,435 97,666 93,531 93,470 93,730 90,162 . .(a) Debt-GDP Ratio 22.0 23.5 24.4 24.7 27.1 35.2 . .(b) Debt-Service Ratio 16.0 18.0 19.0 21.2 24.3 29.0 . .
16. Exchange Rate (Rupee/US $)(a) High 42.4400 39.4800 35.6975 34.1400 31.3200 17.2801 7.7300(b) Low 43.6400 43.4200 40.3600 35.9600 37.9500 32.6458 17.1274
P : Provisional . . : Not available * : As at the end of the period. A : Advance estimates as on June 29,2000.** On the basis of agricultural production index with base : triennium ending 1981-82 = 100.# Base : 1993-94 = 100 for columns 2 to 6 and 1980-81 = 100 for columns 7 and 8.E Estimated. RE : Revised Estimates. QE : Quick Estimates.$ Average for 1981-82 to 1989-90 (9 years)Source : RBI (August 2000), Annual Report 1999-2000.

36
CCCChapter hapter hapter hapter ⅡⅡⅡⅡFiscal System in India : Main FeaturesFiscal System in India : Main FeaturesFiscal System in India : Main FeaturesFiscal System in India : Main Features
The Fiscal System :The Fiscal System :The Fiscal System :The Fiscal System : Fiscal system refers to the mechanism through which
financial resources for the government and its agencies are procured, channeled or
raised, and the scale and pattern of allocation of such resources is determined. In
the Indian fiscal system, the budgetary resources and expenditures are
determined through the annual budget of the Central Government and the State
Governments. The five yearly as well as annual resources and expenditure for
development plans of the public sector as a whole are determined by the Planning
Commission. Before discussing the fiscal sector reforms and trends in the next
chapter, an introduction to important features of the Indian fiscal system in this
chapter may be found of use.
2.12.12.12.1 Some Dimensional FeaturesSome Dimensional FeaturesSome Dimensional FeaturesSome Dimensional Features
2.1.12.1.12.1.12.1.1 Budgetary ParametersBudgetary ParametersBudgetary ParametersBudgetary Parameters
For a synoptic macro view of the fiscal system, the combined budgetary
disbursements and receipts both for the Central government budget and State
governments' budgets are shown in table 2.1. The estimates for budgetary
transactions for the third tier of the government i.e. panchayats (rural local
bodies) and municipalities (urban local bodies) are not yet available in necessary
details, as well as, for the latest period. In any case, as of now, most part of the
expenditures of the local bodies are out of the transfers from the Central or State
government, and thus covered in the disbursements given in table 2.1. The
important features of budgetary transactions both for the Central as well as State
governments are as follows:
• Total disbursements out of the budgets of the Central government andState governments (net of inter-se transfer) form about 29 per cent of GDP.
• Total receipts including the borrowings account for about 28 per cent ofGDP.
• Combined (net of transfers) revenue receipts i.e. tax plus non-tax receipts
form about 18 per cent of GDP, of which tax receipts are 14 per cent of
GDP.
• Combined revenue expenditure i.e. current expenditure out of the budgets,is about 23 per cent of GDP.
• Recently available estimates indicate that the expenditures of the 'third
tier' of the government i.e. local governments (both rural and urban) is
about 11.5 per cent of GDP. These are not additive to the expenditures of
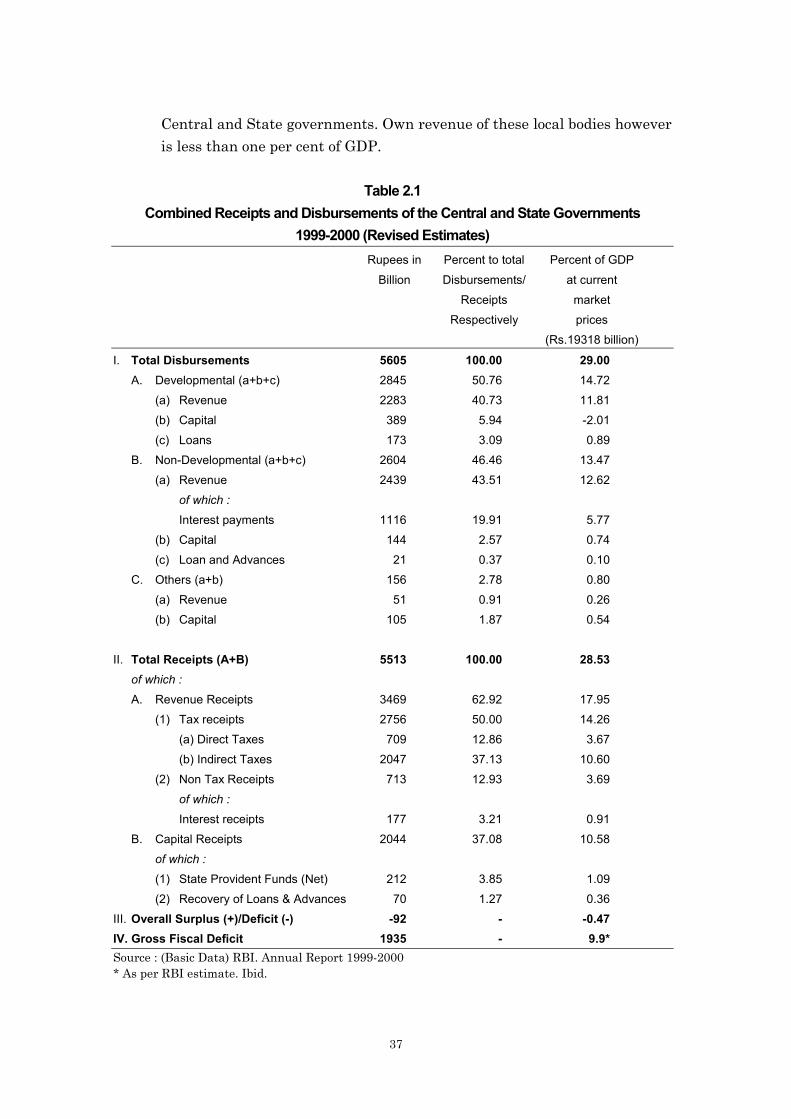
37
Central and State governments. Own revenue of these local bodies however
is less than one per cent of GDP.
Table 2.1Combined Receipts and Disbursements of the Central and State Governments
1999-2000 (Revised Estimates)Rupees in Percent to total Percent of GDP
Billion Disbursements/ at currentReceipts market
Respectively prices(Rs.19318 billion)
I. Total Disbursements 5605 100.00 29.00A. Developmental (a+b+c) 2845 50.76 14.72
(a) Revenue 2283 40.73 11.81(b) Capital 389 5.94 -2.01(c) Loans 173 3.09 0.89
B. Non-Developmental (a+b+c) 2604 46.46 13.47(a) Revenue 2439 43.51 12.62
of which :Interest payments 1116 19.91 5.77
(b) Capital 144 2.57 0.74(c) Loan and Advances 21 0.37 0.10
C. Others (a+b) 156 2.78 0.80(a) Revenue 51 0.91 0.26(b) Capital 105 1.87 0.54
II. Total Receipts (A+B) 5513 100.00 28.53of which :A. Revenue Receipts 3469 62.92 17.95
(1) Tax receipts 2756 50.00 14.26(a) Direct Taxes 709 12.86 3.67(b) Indirect Taxes 2047 37.13 10.60
(2) Non Tax Receipts 713 12.93 3.69of which :Interest receipts 177 3.21 0.91
B. Capital Receipts 2044 37.08 10.58of which :(1) State Provident Funds (Net) 212 3.85 1.09(2) Recovery of Loans & Advances 70 1.27 0.36
III. Overall Surplus (+)/Deficit (-) -92 - -0.47IV. Gross Fiscal Deficit 1935 - 9.9*Source : (Basic Data) RBI. Annual Report 1999-2000* As per RBI estimate. Ibid.
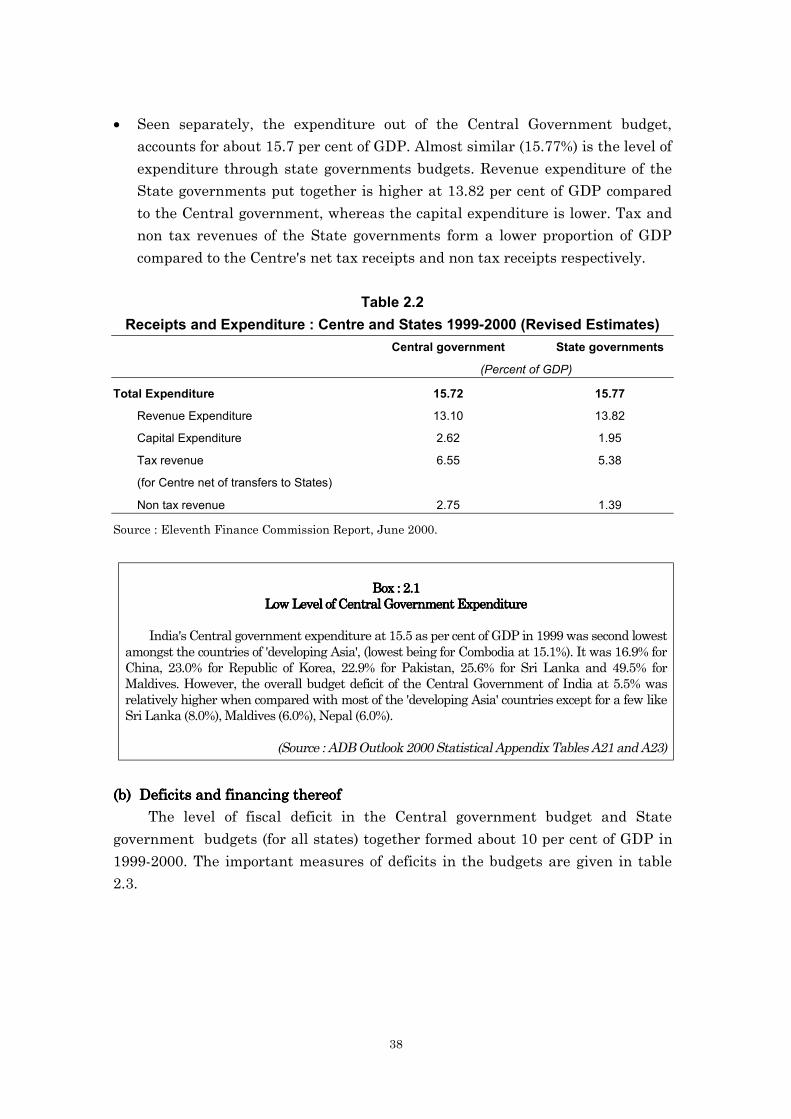
38
• Seen separately, the expenditure out of the Central Government budget,
accounts for about 15.7 per cent of GDP. Almost similar (15.77%) is the level of
expenditure through state governments budgets. Revenue expenditure of the
State governments put together is higher at 13.82 per cent of GDP compared
to the Central government, whereas the capital expenditure is lower. Tax and
non tax revenues of the State governments form a lower proportion of GDP
compared to the Centre's net tax receipts and non tax receipts respectively.
Table 2.2Receipts and Expenditure : Centre and States 1999-2000 (Revised Estimates)
Central government State governments
(Percent of GDP)
Total Expenditure 15.72 15.77
Revenue Expenditure 13.10 13.82
Capital Expenditure 2.62 1.95
Tax revenue 6.55 5.38
(for Centre net of transfers to States)
Non tax revenue 2.75 1.39
Source : Eleventh Finance Commission Report, June 2000.
Box : 2.1Box : 2.1Box : 2.1Box : 2.1Low Level of Central Government ExpenditureLow Level of Central Government ExpenditureLow Level of Central Government ExpenditureLow Level of Central Government Expenditure
India's Central government expenditure at 15.5 as per cent of GDP in 1999 was second lowestamongst the countries of 'developing Asia', (lowest being for Combodia at 15.1%). It was 16.9% forChina, 23.0% for Republic of Korea, 22.9% for Pakistan, 25.6% for Sri Lanka and 49.5% forMaldives. However, the overall budget deficit of the Central Government of India at 5.5% wasrelatively higher when compared with most of the 'developing Asia' countries except for a few likeSri Lanka (8.0%), Maldives (6.0%), Nepal (6.0%).
(Source : ADB Outlook 2000 Statistical Appendix Tables A21 and A23)
(b) Deficits and financing thereof(b) Deficits and financing thereof(b) Deficits and financing thereof(b) Deficits and financing thereof
The level of fiscal deficit in the Central government budget and State
government budgets (for all states) together formed about 10 per cent of GDP in
1999-2000. The important measures of deficits in the budgets are given in table
2.3.
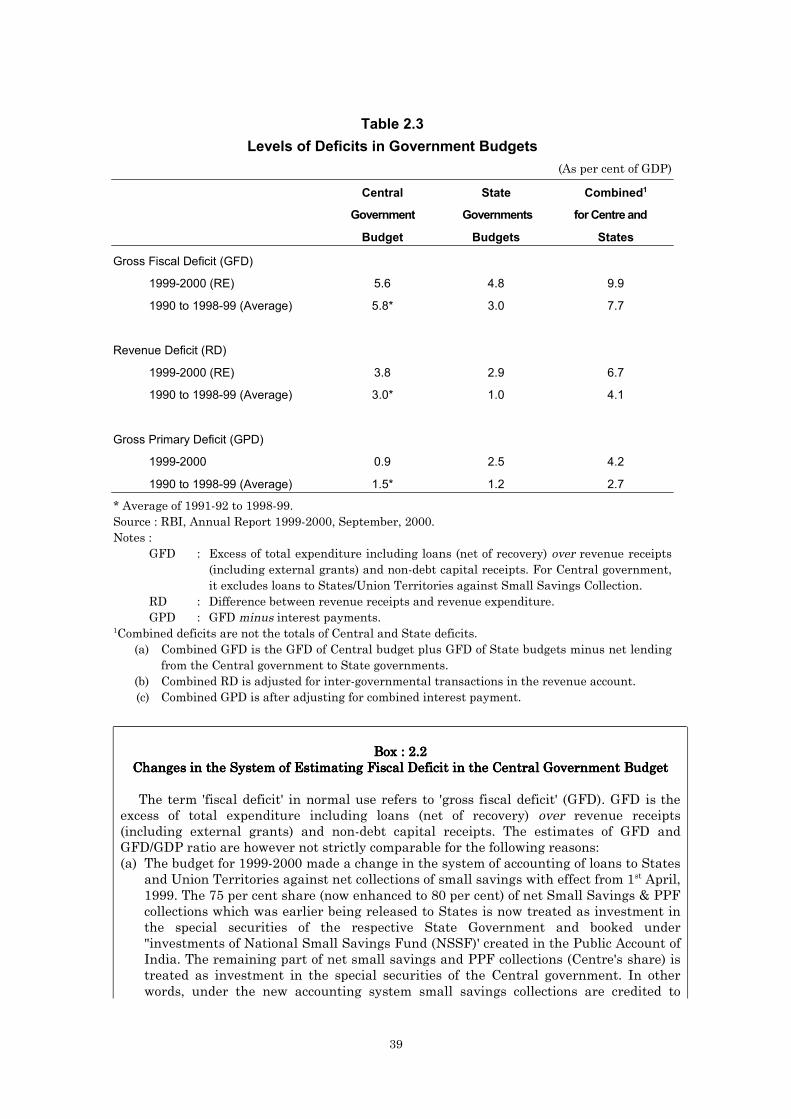
39
Table 2.3Levels of Deficits in Government Budgets
(As per cent of GDP)
Central State Combined1
Government Governments for Centre and
Budget Budgets States
Gross Fiscal Deficit (GFD)
1999-2000 (RE) 5.6 4.8 9.9
1990 to 1998-99 (Average) 5.8* 3.0 7.7
Revenue Deficit (RD)
1999-2000 (RE) 3.8 2.9 6.7
1990 to 1998-99 (Average) 3.0* 1.0 4.1
Gross Primary Deficit (GPD)
1999-2000 0.9 2.5 4.2
1990 to 1998-99 (Average) 1.5* 1.2 2.7
* Average of 1991-92 to 1998-99.Source : RBI, Annual Report 1999-2000, September, 2000.Notes :
GFD : Excess of total expenditure including loans (net of recovery) over revenue receipts(including external grants) and non-debt capital receipts. For Central government,it excludes loans to States/Union Territories against Small Savings Collection.
RD : Difference between revenue receipts and revenue expenditure.GPD : GFD minus interest payments.
1Combined deficits are not the totals of Central and State deficits.(a) Combined GFD is the GFD of Central budget plus GFD of State budgets minus net lending
from the Central government to State governments.(b) Combined RD is adjusted for inter-governmental transactions in the revenue account.(c) Combined GPD is after adjusting for combined interest payment.
Box : 2.2Box : 2.2Box : 2.2Box : 2.2Changes in the System of Estimating Fiscal Deficit in the Central Government BudgetChanges in the System of Estimating Fiscal Deficit in the Central Government BudgetChanges in the System of Estimating Fiscal Deficit in the Central Government BudgetChanges in the System of Estimating Fiscal Deficit in the Central Government Budget
The term 'fiscal deficit' in normal use refers to 'gross fiscal deficit' (GFD). GFD is theexcess of total expenditure including loans (net of recovery) over revenue receipts(including external grants) and non-debt capital receipts. The estimates of GFD andGFD/GDP ratio are however not strictly comparable for the following reasons:(a) The budget for 1999-2000 made a change in the system of accounting of loans to States
and Union Territories against net collections of small savings with effect from 1st April,1999. The 75 per cent share (now enhanced to 80 per cent) of net Small Savings & PPFcollections which was earlier being released to States is now treated as investment inthe special securities of the respective State Government and booked under"investments of National Small Savings Fund (NSSF)' created in the Public Account ofIndia. The remaining part of net small savings and PPF collections (Centre's share) istreated as investment in the special securities of the Central government. In otherwords, under the new accounting system small savings collections are credited to
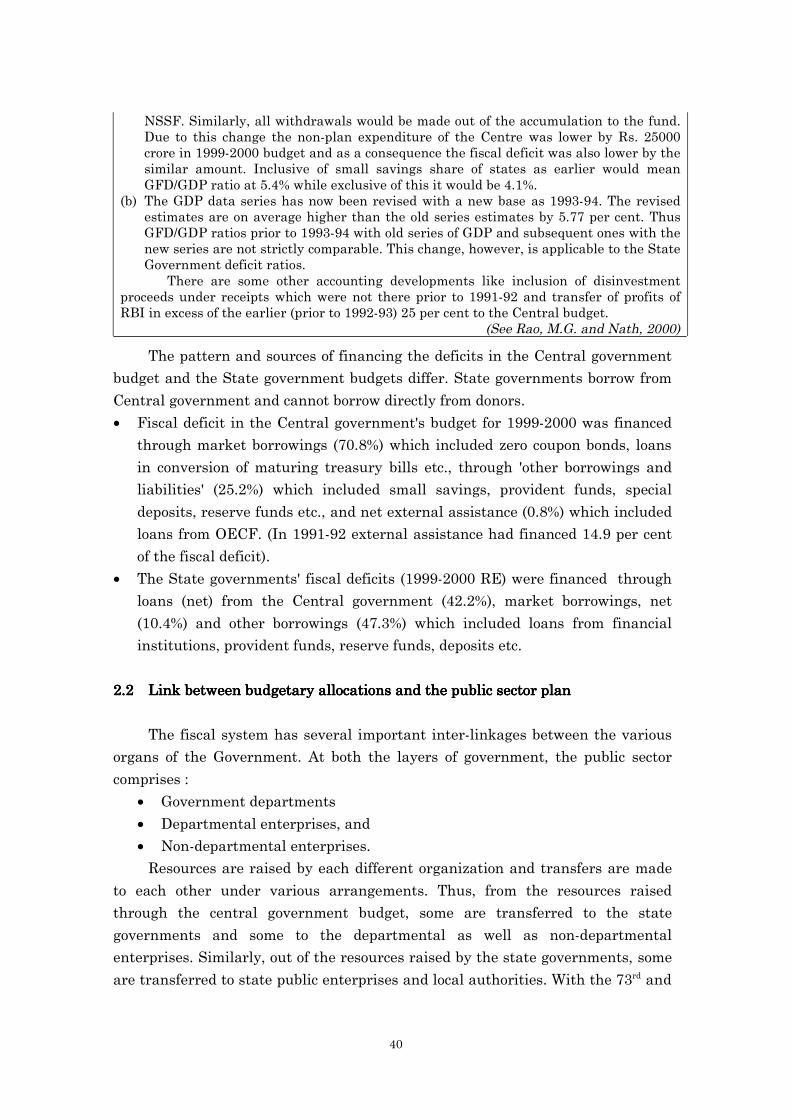
40
NSSF. Similarly, all withdrawals would be made out of the accumulation to the fund.Due to this change the non-plan expenditure of the Centre was lower by Rs. 25000crore in 1999-2000 budget and as a consequence the fiscal deficit was also lower by thesimilar amount. Inclusive of small savings share of states as earlier would meanGFD/GDP ratio at 5.4% while exclusive of this it would be 4.1%.
(b) The GDP data series has now been revised with a new base as 1993-94. The revisedestimates are on average higher than the old series estimates by 5.77 per cent. ThusGFD/GDP ratios prior to 1993-94 with old series of GDP and subsequent ones with thenew series are not strictly comparable. This change, however, is applicable to the StateGovernment deficit ratios.
There are some other accounting developments like inclusion of disinvestmentproceeds under receipts which were not there prior to 1991-92 and transfer of profits ofRBI in excess of the earlier (prior to 1992-93) 25 per cent to the Central budget.
(See Rao, M.G. and Nath, 2000)
The pattern and sources of financing the deficits in the Central government
budget and the State government budgets differ. State governments borrow from
Central government and cannot borrow directly from donors.
• Fiscal deficit in the Central government's budget for 1999-2000 was financed
through market borrowings (70.8%) which included zero coupon bonds, loans
in conversion of maturing treasury bills etc., through 'other borrowings and
liabilities' (25.2%) which included small savings, provident funds, special
deposits, reserve funds etc., and net external assistance (0.8%) which included
loans from OECF. (In 1991-92 external assistance had financed 14.9 per cent
of the fiscal deficit).
• The State governments' fiscal deficits (1999-2000 RE) were financed through
loans (net) from the Central government (42.2%), market borrowings, net
(10.4%) and other borrowings (47.3%) which included loans from financial
institutions, provident funds, reserve funds, deposits etc.
2.22.22.22.2 Link between budgetary allocations and the public sector planLink between budgetary allocations and the public sector planLink between budgetary allocations and the public sector planLink between budgetary allocations and the public sector plan
The fiscal system has several important inter-linkages between the various
organs of the Government. At both the layers of government, the public sector
comprises :
• Government departments
• Departmental enterprises, and
• Non-departmental enterprises.
Resources are raised by each different organization and transfers are made
to each other under various arrangements. Thus, from the resources raised
through the central government budget, some are transferred to the state
governments and some to the departmental as well as non-departmental
enterprises. Similarly, out of the resources raised by the state governments, some
are transferred to state public enterprises and local authorities. With the 73rd and
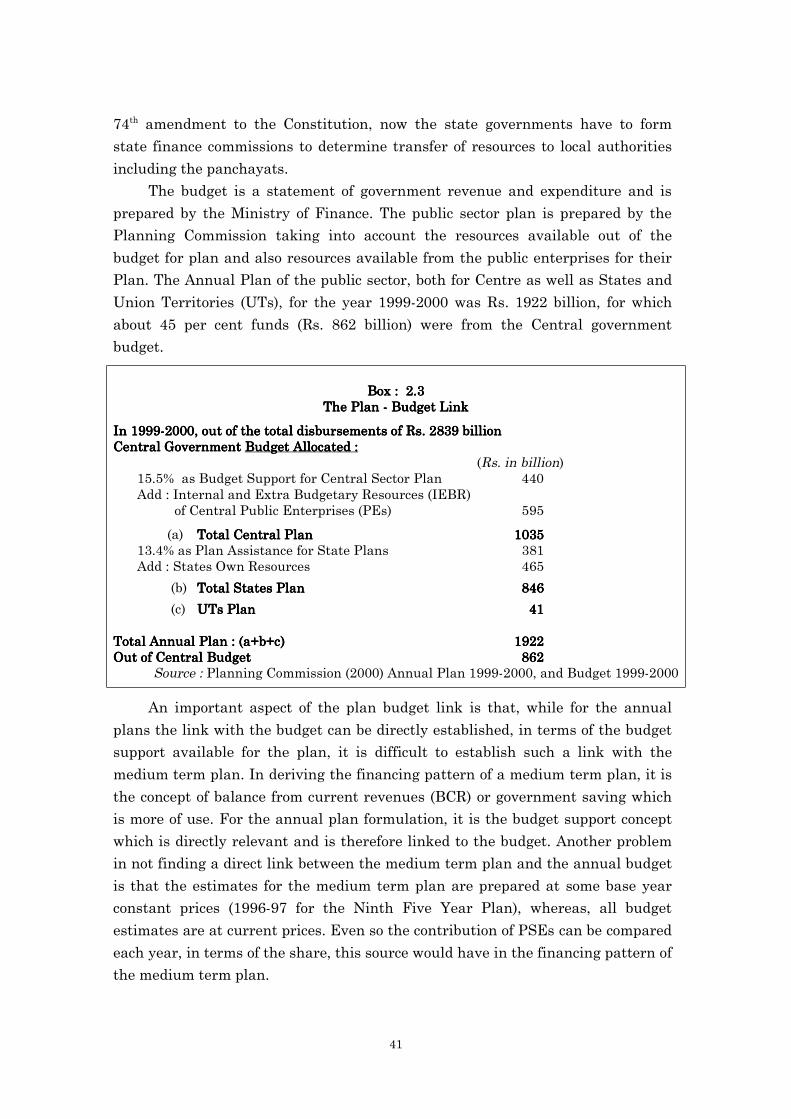
41
74th amendment to the Constitution, now the state governments have to form
state finance commissions to determine transfer of resources to local authorities
including the panchayats.
The budget is a statement of government revenue and expenditure and is
prepared by the Ministry of Finance. The public sector plan is prepared by the
Planning Commission taking into account the resources available out of the
budget for plan and also resources available from the public enterprises for their
Plan. The Annual Plan of the public sector, both for Centre as well as States and
Union Territories (UTs), for the year 1999-2000 was Rs. 1922 billion, for which
about 45 per cent funds (Rs. 862 billion) were from the Central government
budget.
Box : 2.3Box : 2.3Box : 2.3Box : 2.3The Plan - Budget LinkThe Plan - Budget LinkThe Plan - Budget LinkThe Plan - Budget Link
In 1999-2000, out of the total disbursements of In 1999-2000, out of the total disbursements of In 1999-2000, out of the total disbursements of In 1999-2000, out of the total disbursements of Rs. 2839 billionRs. 2839 billionRs. 2839 billionRs. 2839 billionCentral Government Central Government Central Government Central Government Budget Allocated :Budget Allocated :Budget Allocated :Budget Allocated :
(Rs. in billion)15.5% as Budget Support for Central Sector Plan 440Add : Internal and Extra Budgetary Resources (IEBR)
of Central Public Enterprises (PEs) 595
(a) Total Central PlanTotal Central PlanTotal Central PlanTotal Central Plan 103510351035103513.4% as Plan Assistance for State Plans 381Add : States Own Resources 465
(b) Total States PlanTotal States PlanTotal States PlanTotal States Plan 846846846846
(c) UTs PlanUTs PlanUTs PlanUTs Plan 41414141
Total Annual Plan : (Total Annual Plan : (Total Annual Plan : (Total Annual Plan : (a+b+c)a+b+c)a+b+c)a+b+c) 1922192219221922Out of Central BudgetOut of Central BudgetOut of Central BudgetOut of Central Budget 862862862862
Source : Planning Commission (2000) Annual Plan 1999-2000, and Budget 1999-2000
An important aspect of the plan budget link is that, while for the annual
plans the link with the budget can be directly established, in terms of the budget
support available for the plan, it is difficult to establish such a link with the
medium term plan. In deriving the financing pattern of a medium term plan, it is
the concept of balance from current revenues (BCR) or government saving which
is more of use. For the annual plan formulation, it is the budget support concept
which is directly relevant and is therefore linked to the budget. Another problem
in not finding a direct link between the medium term plan and the annual budget
is that the estimates for the medium term plan are prepared at some base year
constant prices (1996-97 for the Ninth Five Year Plan), whereas, all budget
estimates are at current prices. Even so the contribution of PSEs can be compared
each year, in terms of the share, this source would have in the financing pattern of
the medium term plan.

42
In the case of States' plan, not all the loans and grants flowing from the
union budget enter as resources for the plan. It is the central plan assistance part,
both in terms of loans and grants, that is added to the state's own resources for
arriving at the size of the state's plan. In preparing the annual plan for the states,
the Planning Commission reassesses all the estimates of states own resources. In
this respect, while States' revenue and expenditure are critically reviewed by the
Planning Commission, the Union budget estimates are usually accepted as
provided by the Ministry of Finance.
2.32.32.32.3 The Fiscal Federal SystemThe Fiscal Federal SystemThe Fiscal Federal SystemThe Fiscal Federal System
Constitution of India has specified the expenditure responsibilities as well as
the resource raising domains for the central as well as the state governments
through the three lists: Union list, State list, and the Concurrent list. Similarly,
the revenue raising powers are also specified. Recognizing well an asymmetry in
the assignment of tax powers and expenditure responsibilities of the states and
the consequent need of transfer of resources from the centre to the states, the
Constitution provides for a system of revenue sharing arrangements. Besides, the
Planning Commission, Government of India also affect resource transfers under a
well developed system.
2.3.12.3.12.3.12.3.1 Forms and channels of central budgetary transfersForms and channels of central budgetary transfersForms and channels of central budgetary transfersForms and channels of central budgetary transfers
The current system of federal transfers in India provides for flow of the
Centre's revenue to the States in segments, viz., devolution of a part of the
Centre's divisible taxes and grants-in-aid of revenue to States in need of
assistance under article 275 of the Constitution through the Finance Commission
(FC), transfers through the Planning Commission (PC) in the form of assistance
for State Plans, transfers to implement Centrally Sponsored Schemes (CSS) under
the Central Sector Plan, and other discretionary transfers. The statutory transfers
also have several components, viz., tax devolution, revenue deficit grants, grants
for up gradation and special problems, and grants meant for local bodies and
calamity relief. Statutory transfers made up of tax devolution and grants under
article 275 account for the bulk (about 65 to 70 per cent). Plan grants also form a
sizeable proportion (about 30 to 35 per cent).

43
Box : 2.4Box : 2.4Box : 2.4Box : 2.4Forms and channels of Central budgetary transfers to StatesForms and channels of Central budgetary transfers to StatesForms and channels of Central budgetary transfers to StatesForms and channels of Central budgetary transfers to States
• In 1999-2000 out of the total transfers of In 1999-2000 out of the total transfers of In 1999-2000 out of the total transfers of In 1999-2000 out of the total transfers of Rs. 1265 billion (Rs. 1265 billion (Rs. 1265 billion (Rs. 1265 billion (loans+grants) from loans+grants) from loans+grants) from loans+grants) from CentreCentreCentreCentreto States :to States :to States :to States :
38% were through Finance Commission recommendations40% through Planning Commission22% through Finance Ministry.
• The Form of Transfers :The Form of Transfers :The Form of Transfers :The Form of Transfers : Share in Taxes 36% Grants 27% Loans 37%
• Eleventh Finance Commission (EFC) in July, 2000 has recommended that :Eleventh Finance Commission (EFC) in July, 2000 has recommended that :Eleventh Finance Commission (EFC) in July, 2000 has recommended that :Eleventh Finance Commission (EFC) in July, 2000 has recommended that :• 29.5% of net proceeds of Central tax receipts be transferred to States
Rs. 20 billion per annum as grants to States for Local bodies.for Local bodies.for Local bodies.for Local bodies.
2.3.22.3.22.3.22.3.2 Some recent changes for Statutory TransfersSome recent changes for Statutory TransfersSome recent changes for Statutory TransfersSome recent changes for Statutory Transfers
Article 280(3) of the Constitution requires the Finance Commission to make
recommendations as to the distribution of the net proceeds of shareable taxes
between Union and the States, and the allocation between the States of their
shares in such proceeds. Formulation of principles that should guide the
assignment of share to the States and the determination of individual share of
each State constitutes a central task of the Commission.
The Constitution (Eightieth Amendment) Act, 2000 has altered the pattern
of sharing of Central taxes between the Centre and the States in a fundamental
way. Prior to this amendment, Taxes on Income other than agriculture income
and Union duties of excise were shared with States under articles 270 and 272
respectively. The Eightieth Amendment Act has substituted a new article for
article 270 and omitted the old article 272. The new article 270 provides as under:
"270(1) All taxes and duties referred to in the Union List, except
the duties and taxes referred to in articles 268 and 269, respectively,
surcharge on taxes and duties referred to in article 271 and any
case levied for specific purposes under any law made by Parliament
shall be levied and collected by the Government of India and shall
be distributed between the Union and the States in the manner
provided in clause (2).
(2) Such percentage, as may be prescribed, of the net proceeds of any such tax
or duty in any financial year shall not form part of the Consolidated Fund
of India, but shall be assigned to the States within which that tax or duty
is livable in that year, and shall be distributed among those States in such
44
manner and from such time as may be prescribed in the manner provided
in clause (3).
(3) In this article, "prescribed" means,-
(i) until a Finance Commission has been constituted, prescribed by the
President order, and
(ii) after a Finance Commission has been constituted, prescribed by the
President by order after considering the recommendations of the
Finance Commission".
The Finance Commission is now required to recommend such percentage of
taxes or duties referred to in the new article 270 that may be assigned to the
States and also recommend the manner in which these may be distributed among
the States.
The main changes brought about by this amendment are as follows :
(a) All Central taxes and duties, except those referred in articles 268 and 269
respectively and surcharges and ceases, are to be shared between the
Centre and the States.
(b) Only States in which these taxes and duties are 'livable in that year' are
entitled to get a share in these taxes and duties.
(c) A percentage of "net proceeds" of these taxes and duties as may be
prescribed by the President by order after considering the
recommendations of the Finance Commission is to be shared by States.
(d) The percentage of "net proceeds" of these taxes and duties which is
assigned to the States in any financial year shall not form part of the
Consolidated Fund of India.
(e) The article 270(2) which referred to taxes on income prior to the
amendment contained the following provision:
"Such percentage as may be prescribed, of the net proceeds in any financial
year of any such tax, except in so far as those proceeds represent proceeds
attributable to Union Territories or to taxes payable in respect of Union
emoluments, shall not form part of the Consolidated Fund of India."
In the new article 270 which refers to all taxes the words "net proceeds"
attributed to Union Territories or to "tax payable in respect of Union
emoluments" have been omitted.
(f) The recommendation of the Tenth Finance Commission regarding sharing
of "gross proceeds" was also not accepted in the new Amendment Act and
the words "the share of net proceeds" was prescribed in order to maintain
consistency between articles 270, 279 and 280.
Article 269 has been recast by the Amendment Act. The new article includes
only taxes on sale and purchase of goods and taxes on the consignment of goods.
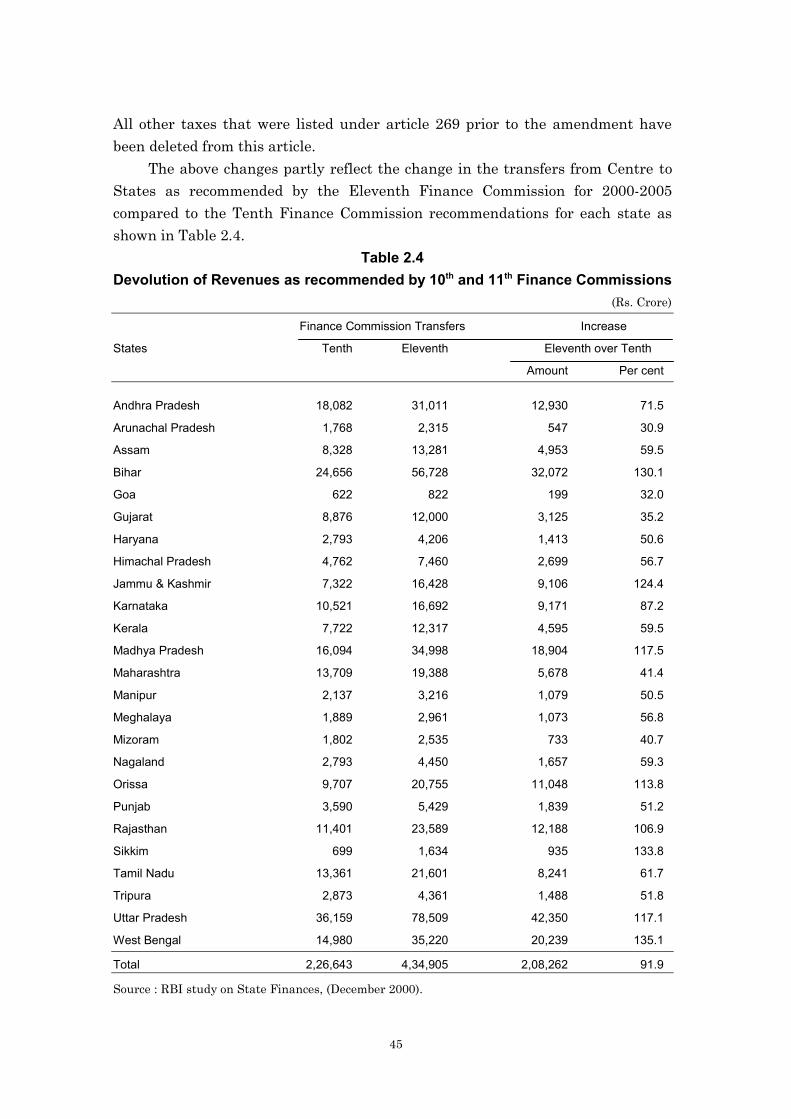
45
All other taxes that were listed under article 269 prior to the amendment have
been deleted from this article.
The above changes partly reflect the change in the transfers from Centre to
States as recommended by the Eleventh Finance Commission for 2000-2005
compared to the Tenth Finance Commission recommendations for each state as
shown in Table 2.4.
Table 2.4Devolution of Revenues as recommended by 10th and 11th Finance Commissions
(Rs. Crore)
Finance Commission Transfers Increase
States Tenth Eleventh Eleventh over Tenth
Amount Per cent
Andhra Pradesh 18,082 31,011 12,930 71.5
Arunachal Pradesh 1,768 2,315 547 30.9
Assam 8,328 13,281 4,953 59.5
Bihar 24,656 56,728 32,072 130.1
Goa 622 822 199 32.0
Gujarat 8,876 12,000 3,125 35.2
Haryana 2,793 4,206 1,413 50.6
Himachal Pradesh 4,762 7,460 2,699 56.7
Jammu & Kashmir 7,322 16,428 9,106 124.4
Karnataka 10,521 16,692 9,171 87.2
Kerala 7,722 12,317 4,595 59.5
Madhya Pradesh 16,094 34,998 18,904 117.5
Maharashtra 13,709 19,388 5,678 41.4
Manipur 2,137 3,216 1,079 50.5
Meghalaya 1,889 2,961 1,073 56.8
Mizoram 1,802 2,535 733 40.7
Nagaland 2,793 4,450 1,657 59.3
Orissa 9,707 20,755 11,048 113.8
Punjab 3,590 5,429 1,839 51.2
Rajasthan 11,401 23,589 12,188 106.9
Sikkim 699 1,634 935 133.8
Tamil Nadu 13,361 21,601 8,241 61.7
Tripura 2,873 4,361 1,488 51.8
Uttar Pradesh 36,159 78,509 42,350 117.1
West Bengal 14,980 35,220 20,239 135.1
Total 2,26,643 4,34,905 2,08,262 91.9
Source : RBI study on State Finances, (December 2000).

46
2.3.32.3.32.3.32.3.3 Transfers to Local Bodies (The third tier of the Government)Transfers to Local Bodies (The third tier of the Government)Transfers to Local Bodies (The third tier of the Government)Transfers to Local Bodies (The third tier of the Government)
The rural and urban local bodies, that is, the panchayats and the
municipalities, were in existence even before the seventy-third and the seventy-
fourth amendment to Constitution in 1992. Every State had enacted suitable
legislation for devolution of functions, powers and responsibilities to these bodies,
including the power to raise resources. The Constitutional changes, however,
envisage the panchayat and municipalities as institutions of self-governments. It
has been made mandatory, under the Constitution, to hold regular elections to
these bodies under the supervision of the State Election Commissions.
Representation of SCs/STs and women has been made obligatory. The devolution
of financial resources to these bodies has been ensured through periodic
constitution of the State Finance Commissions that are required to make
recommendations on the sharing and assignment of various taxes, duties, tolls,
fees etc., and on the grants-in-aid to these bodies from the Consolidated Funds of
the States. These provisions are closely related to articles 243G and 243W of the
Constitution which require that the State legislature may, by law, entrust these
bodies with such powers, functions and responsibility so as to enable them to
function as institutions of self-government. In particular, the panchayats and the
municipalities may be required to prepare plans for economic development and
social justice, and implement the schemes relating thereto including those which
are included in the Eleventh and Twelfth Schedules of the Constitution,
respectively. The operationalisation of the changes contemplated under the
Constitution requires action by both the Centre and the States. The pace of
empowerment of these bodies to function as institutions of self-government has,
however, generally been slow (EFC, 2000).
A total grant of Rs. 1,600 crore for the panchayats and Rs. 400 crore for the
municipalities is recommended by the EFC to be given to States for each of the
five years starting from the financial year 2000-01. The amounts indicated by the
Finance Commission for maintenance of accounts, audit of accounts and for the
development of database, would be the first charge on these grants and would be
released by the concerned Ministries of the Government of India, after the
arrangements suggested become operational.
Inter-se shares of States in the grants recommended by the Finance
Commission for the panchayats and the municipalities have been based on the
rural/urban population of the State (40 per cent), index of decentralization (20 per
cent), distance from the highest per capita income (20 per cent), revenue effort of
the local bodies (10 per cent) and geographical area (10 per cent).
47
2.42.42.42.4 Role of the Central Bank : The Reserve Bank of IndiaRole of the Central Bank : The Reserve Bank of IndiaRole of the Central Bank : The Reserve Bank of IndiaRole of the Central Bank : The Reserve Bank of India
The Reserve Bank of India as the Central Bank acts as a banker, debt
manger, and adviser in several matters relating to budgetary operations of both
the Central we well as State governments.
2.4.12.4.12.4.12.4.1 RBI and Central GovernmentRBI and Central GovernmentRBI and Central GovernmentRBI and Central Government
Apart from the most important role of a banker to the government, the RBI
acts as a debt manager in close coordination with the Department of Economic
Affairs, Ministry of Finance. An important development during 1990s relates to
evolution of a system of ways and means of advances to the Central government.
Through an agreement between the Central government and the RBI a
system of Ways and Means Advances (WMA)--short-term loans from the RBI to
the government has been in operation since 1994. The broad features are as
follows:
• A scheme of WMA by the Reserve Bank of India to the Government ofIndia has been evolved to accommodate temporary mismatches in
Government receipts and payments.
• The limit for WMA and the rate of interest on WMA is mutually agreed
between the RBI and the Government from time to time.
• Any drawls by the Government from the Reserve Bank of India in excess ofthe limit of WMA is permissible only for ten consecutive working days.
• When 75 per cent of WMA is utilised, the Reserve Bank triggers freshfloatation of Government securities.
• With the discontinuance of the ad hoc Treasury Bills and Tap Treasury
Bills and the introduction of WMA, the concept of conventional budget
deficit loses its relevance. Therefore, the practice of showing budgetary
deficit in the Union Budget has been discontinued; instead, gross fiscal
deficit has become the key indicator of deficit. As a transparent way of
reporting the monetised deficit or net RBI credit to the Central
Government, the likely extent of RBI support in respect of dated securities
and auction Treasury Bills is to be separately shown as the 'monetised
deficit' in the budget document.
A word on the mechanism prior to the introduction of WMA system may be
necessary to understand the importance of the new system. At the advent of
planning and towards mid-1950s it was mutually agreed between the Central govt.
and the RBI that a minimum cash balance of Rs. 50 crore on Fridays and Rs. 4
crore on other days would be held by the Central govt. To adhere to this
administrative arrangement, it was agreed that whenever the cash balances in
48
the Government's account dropped below these levels, the RBI would replenish by
creation of ad-hoc treasury bills in its favour. The ad-hoc Treasury Bills, which
were meant to be temporary, gained a permanent as well as a cumulative
character. Indeed, they became an attractive source of financing government
expenditure since they were available at an interest rate pegged at 4.6 per cent
per annum since 1974, i.e. actually at a negative real interest rate. This was a
system of automatic magnetization of government deficit.
The new system of WMA from ad-hocs required a process of transition. First,
through limits on the creation of adhoc Treasury Bills which operated between
1994-95 and 1996-97; Second, during the transition period of two years beginning
1st April, 1997, when ad-hocs were eliminated and the new system of WMA was
introduced, an overdraft above ways and means was permissible beyond ten
continues days, though at a cost. Finally, in order to manage the system a
"Monitoring Group on Cash and Debt Management of the Central Government"
with representatives from Government of India (Budget Division, Tax Collection
Units, Accountants) and the RBI is in operation since April 1997. The group
periodically reviews, inter-alia the monthly fiscal deficit, progress of borrowing
program, instruments of borrowing and cash position of the Central Government
on an ongoing basis so as to identify suitable strategies for effective cash
management.
2.4.22.4.22.4.22.4.2 RBI and State GovernmentsRBI and State GovernmentsRBI and State GovernmentsRBI and State Governments
Twenty three States have entrusted their banking business, including
payments, receipts, collection, remittance of money, management of public debt
and issue of new loans to the RBI voluntarily entering into an agreement under
Section 21A of the Reserve Bank of India Act, 1934. The RBI advises the States
about their daily cash balance at the close of each working day. (See Thorat andPattnaik, 1999).
Provision of Ways and Means Advances (WMA)Under Section 17(5) of RBI Act, 1934, the RBI provides Ways and Means
Advances (WMA) of the States banking with it to help them to tide over
temporary mismatches in the cash flow of their receipts and payments. Such
advances, are under the Act, "repayable in each case not later than three months
from the date of making that advance". There are two types of WMA - normal and
special. While normal WMA are clean advances, special WMA are secured
advances provided against the pledge of Government of India securities. Any
amount drawn by a State in excess of WMA is an Overdraft. An Overdraft
Regulation Scheme has been in force from October 2, 1985. As per the scheme in
existence before March 1, 1999, both normal and special WMA were linked with

49
the cash balances of States maintained with the Reserve Bank and the limits for
normal and special WMA were revised from time to time depending on the
evolving liquidity situation faced by State Governments, ten revisions were
affected to the limits of WMA available to States between April 1937 and end
February 1999.
The scheme of WMA to State Governments has been revised on the basis of
recommendation of the Informal Advisory Committee on Ways and Means
Advances to State Governments (Chairman: Shri B.P.R. Vithal). The main
features of the revised scheme made effective from March 1, 1999 are:
(a) The base for the revised WMA limits was three year average of revenue
receipts plus capital expenditure. Accordingly, the normal WMA limits
have been increased by 65 per cent to Rs. 3,685 crore (from Rs. 2,234.40
crore).
(b) The limits of Rs. 851.20 crore existing at present in respect of Special WMA
were liberalized. Accordingly, under the revised scheme, there is no upper
limit on special WMA as a multiple of minimum balance. The States will be
provided special WMA against their actual holdings of dated Government
of India securities.
(c) No State shall be allowed to run an overdraft with RBI for more than ten
consecutive working days. If overdraft remains beyond ten consecutive
working days RBI will stop payment on behalf of the State. The overdraft
shall not exceed 100 per cent of WMA limit in a financial year. On the first
occasion RBI will advise the State Governments; on a second or any
subsequent occasion, the State shall be given only three working days'
notice to bring down the overdraft within 100 per cent limit. If this is not
adhered to, payments will be stopped.
(d) The interest rate charged on WMA and overdrafts at present are at the
Bank Rate and at the Bank Rate plus two percentage points respectively.
If the overdraft persists beyond ten consecutive working days, the Reserve
Bank stops payment on behalf of that State Government.
During 1998-99, 17 States resorted to overdraft; of them 11 States took
frequent recourse to overdrafts. Five States could not clear their overdrafts with
the Reserve Bank within the stipulated time limit and consequently the Reserve
Bank had to stop payments on their behalf. (RBI Annual Report-1998-99).
2.4.32.4.32.4.32.4.3 Management of Market BorrowingsManagement of Market BorrowingsManagement of Market BorrowingsManagement of Market Borrowings
The Reserve Bank manages the market borrowings of the State
Governments. The market borrowing program of State Governments is finalized
by Government of India and Planning Commission. Estimates of aggregated
50
market borrowings for Centre and State together is indicated to the Government
by Reserve Bank of India taking into account the monetary parameters. The
Government of India advises State-wise allocation of borrowings to Reserve Bank
of India. These amounts are raised from the market in two or three trenches with
a pre-announced coupon rate and maturity decided by Government of India. The
Reserve Bank of India decides the timing of the floatation of the loan in
consultation with the Government of India. A decision has been taken in
November 1997 that a choice may be given to State Governments to raise 5-35 per
cent of the market borrowing allocations through "Auction" or through "Tap issue"
where the amount is not pre-notified.
2.52.52.52.5 Game players in budget formulationGame players in budget formulationGame players in budget formulationGame players in budget formulation
Macroeconomic Policy :Macroeconomic Policy :Macroeconomic Policy :Macroeconomic Policy : The annual budget formulation exercise is based on
macroeconomic policy for the economy as a whole. In the process :
• The Economic Division of the Department of Economic Affairs led by the
Chief Economic Adviser reviews the latest trends in the economy and
provides a macroeconomic perspective in the form of an Annual Economic
Survey.
• The Finance Minister holds regular meetings with the team of officials of
the Ministry of Finance led by Finance Secretary, which comprises
Secretary (Revenue), Secretary (Expenditure), Chief Economic Adviser and
the Additional Secretary (Budget).
• The Finance Minister also invites, for seeking suggestions, leaders ofvarious groups which represent, agriculture, industry, small scale units,
trade unions, voluntary organizations, financial institutions, economists,
about two months in advance while the process of budget formulation is on.
• Regular consultations are held with the Reserve Bank of India at different
levels on all aspects having impact of budgetary outcome on monetary
policy and financial sector.
Revenue Estimates:Revenue Estimates:Revenue Estimates:Revenue Estimates: The Department of revenue prepares estimates of
revenue based on the continuing discussions in the meetings taken by the Finance
Minister, where various alternate scenarios are considered.
Non-Plan Expenditure:Non-Plan Expenditure:Non-Plan Expenditure:Non-Plan Expenditure: Secretary, Expenditure, through a series of meetings
with financial advisers discusses the non-plan expenditure estimates for the
current year as well as for the next year. Additional Secretary, Budget finally
adopts them as input in the budget.
Plan Expenditure:Plan Expenditure:Plan Expenditure:Plan Expenditure: Based on an estimated ceiling given by the Department of
Expenditure for plan expenditure in the budget, the Planning Commission
finalizes the ministry-wise allocations of the budget support for plan

51
programs/schemes for the Central government. These are based on extensive
discussions with each Ministry/Department and the PSEs on their plan proposals
and estimates of resources.
External Assistance:External Assistance:External Assistance:External Assistance: The Project Management Unit (PMU) of the
Department of Economic Affairs, in consultation with the Controller of Aid
Accounts and Audit (CAA&A) prepares project-wise/state-wise estimates of
external assistance and these estimates are given to the Planning Commission for
incorporating the same while making plan allocations.
(Some of the important features of the budgetary process are given in Annex-2.1).

52
Chapter Chapter Chapter Chapter ⅢⅢⅢⅢFiscal Sector : Reforms and TrendsFiscal Sector : Reforms and TrendsFiscal Sector : Reforms and TrendsFiscal Sector : Reforms and Trends
3.13.13.13.1 Fiscal Sector ReformsFiscal Sector ReformsFiscal Sector ReformsFiscal Sector Reforms
Fiscal sector reforms were perhaps the most critical part of the
macroeconomic stabilization and reforms initiatives taken by the government
after the 1991 economic crisis. Notwithstanding the initial fiscal adjustment
measures for correcting the fiscal imbalances immediately after the crisis and
the subsequent fiscal reforms, a high level of deficits in the government budgets
particularly during the second half of 1990s, continue to constrain growth
impulses for the economy. The level of fiscal deficit combined both for the Central
government and State governments is more or less at the same level at the end
of 1990's as it was at the beginning. Government debt is approaching a critical
mark beyond which it could be labeled as unsustainable. Almost all the state
governments are facing hard budget constrain in providing even the basic
minimum services through budget. Capital expenditure through budget has
come down sharply. Public sector saving has hit the bottom, it being almost
negligible.
Any review or assessment of fiscal sector reforms should perhaps be seen in
the backdrop of certain operational features of the Indian fiscal system which
have resulted in a slow and less satisfactory outcome. The complexity of the
fiscal issues inter linked with all other macro variables, deeply entrenched
systemic elements of administration, historically strengthened rigidities of
expenditure pattern, democratic constraints on unpopular fiscal and tax
measures, and above all political uncertainties made fiscal reforms, the most
challenging task for all shades (different political parties) of governments
notwithstanding a near consensus on the need of such reforms. The structural
rigidities, therefore, continue despite a wide ranging reform measures.
Complexity and inter-linkages :Complexity and inter-linkages :Complexity and inter-linkages :Complexity and inter-linkages : Tax rationalization process particularly for
indirect taxes was not only a matter of complex structure but also inter-linked to
reform measures to be taken in other sectors like foreign trade policy, industrial
policy, opening of the economy for foreign investment, financial sector reforms
etc. The fiscal reform measures thus need be sequenced, aligned and
restructured alongwith the reforms in all other sectors.
Administrative structure : Administrative structure : Administrative structure : Administrative structure : The deeply entrenched complex and rigid tax
administrative structure has to change with modern practices and even with
psychology and spirit of reforms. Even the tax payers lobbies could have interest
53
in continuing with the same structure of discretionary concessions and ad hocbenefits.
Rigidities of expenditure pattern : Rigidities of expenditure pattern : Rigidities of expenditure pattern : Rigidities of expenditure pattern : The allocation of budgetary expenditure
in terms of contractual and obligatory payments like interest payments, pensions,
defence, transfers to states, etc. have been growing in such a proportion that
there has been very little scope of any sharp change in the allocation pattern of
expenditure in a short period.
Democratic limitations :Democratic limitations :Democratic limitations :Democratic limitations : It is now well known that there remain certain
basic issues which no elected government would prefer to even raise. Taxing
agricultural income, sharp reduction of food subsidy, sharp downsizing of
government staff etc. are some such issues which no government has been able to
face head on, howsoever, critical these may be for correcting fiscal imbalances.
Political uncertainties : Political uncertainties : Political uncertainties : Political uncertainties : Political uncertainties particularly during the
second half of the 'nineties was an important factor for delays in implementation
of reforms-so speedily required in a well structured sequence.
Late start of State level reforms :Late start of State level reforms :Late start of State level reforms :Late start of State level reforms : It actually took long to realize, formulate
and initiate fiscal sector reforms at state government levels despite the need for
a well synchronized mechanism for reforms.
Given the wide range of fiscal sector reforms, particularly at micro level, in-
terms of changes in tax reforms and expenditure management, it is well beyond
the scope of this study to list out all the measures taken during the last decade
or so. An attempt, therefore, has been made in this part of the chapter to
highlight the major areas of reforms strictly confined to fiscal sector at macro
level.
3.1.13.1.13.1.13.1.1 Tax ReformsTax ReformsTax ReformsTax Reforms
Tax reforms during 1990s have been mainly guided by the report of the
Chelliah Committee on tax reform (1993). The main objectives have been
simplification of the tax system, rationalization of tax rates, fairness in tax
system, improvement in tax administration and above all providing a growth
promoting tax structure. The wide range of reform measures taken during the
last decade includein the case of direct taxes: moderation of tax rates,
widening of tax base, incentives for development of infrastructure and housing
and strengthening of enforcement, andin the case of indirect taxes: reduction
in multiplicity of rates, rationalization of the rate structure, drastic reduction in
the scope for discretionary changes and uniform floor rates for sales tax by the
States. Further, rationalization and improvements in tax administration, of
course, is a continuing process.

54
An assessment of tax reform measures in India (World Bank, Jan., 2000)
has shown significant improvements (compared to pre-reform status) in tax
structure in terms of 'economic neutrality', equity, revenue predictability
(actual/budget ratio), administrative effectiveness etc. but deterioration in
revenue adequacy (tax buoyancy) and revenue stability. (see Annex-3.1)
3.1.23.1.23.1.23.1.2 DisinvestmentDisinvestmentDisinvestmentDisinvestment //// Privatization/Public Sector restructuringPrivatization/Public Sector restructuringPrivatization/Public Sector restructuringPrivatization/Public Sector restructuring
The strategy towards public sector enterprises reform encompasses a
judicious mix of strengthening strategic units, privatizing non strategic ones
through gradual disinvestment or strategic sale and devising viable
rehabilitation strategies for weak units. The latest policy announced in the
budget speech 2000-2001 by the Finance Minister in Feb., 2000 had the following
as main elements:
• Restructure and revive potentially viable PSUs;
• Close down PSUs which cannot be revived;
• Bring down Government equity in all non-strategic PSUs to 26% orlower, if necessary; and
• Fully protect the interests of workers.During the last two years, financial restructuring of 20 PSUs has been
approved by the Government. As a result, many PSUs have been able to
restructure their operations, improve productivity and achieve a turnaround in
performance. Even so, a large number of procedural as well as policy issues
continue to constrain the progress on disinvestment process.
Various fiscal reform measures relating to Central Public Enterprises
(CPEs) undertaken by the Central government have shown some noticeable
improvements in the finances of these enterprises during the decade (1990s). In
particular, it needs to be noted that budget support (plan+non-plan) to CPEs as a
per cent of GDP has come down to only 0.5 per cent in 1998-99 from 1.5 per cent
in 1990-91 and CPEs deficit GDP ratio has come down to 1.3 per cent in 1998-99
from 3.0 per cent in 1990-91. Moreover, profitability trends have shown a distinct
improvement. The profit after tax, as per cent of net worth, for CPEs, had
increased to 10.4 per cent in 1997-98 from 3.9 per cent in 1990-91 (See Annex-
3.2).
3.1.33.1.33.1.33.1.3 Systemic reforms in Government's borrowing processSystemic reforms in Government's borrowing processSystemic reforms in Government's borrowing processSystemic reforms in Government's borrowing process
Though largely treading on financial sector reforms, the significant changes
in the process of central government borrowings to meet the budgetary deficits
and temporary mismatches have been part of the fiscal sector reforms as well.

55
Switchover to borrowings by government at market related interest rates,
abolition of the system of automatic monetization of the budget deficit,
implementing a new system of ways and means advances, and developing as well
as deepening government securities market have changed the whole system of
financing the budgetary deficit and its relation with monetary policy stance. (SeeAnnex-3.3 for an authentic summary of reform measures relating to Government
Securities Market).
The new system of ways and means advances (WMA), already explained in
chapter 2, implies vacation of advances made by the RBI to the government with
limits fixed for a given time period (Ten days). This system has provided scope
for a judicious credit creation, possibilities for monetary targeting, a closer
monetary and fiscal policy interactions, and mechanisms for open market
operations to take care of surges in inflows of foreign capital. (Reddy, 2000b).
Notwithstanding the fact that greater reliance on market borrowings and
bond finance (BF) and that too at market related rates rather than less
borrowing along with monetization route, has led to an excessive debt burden for
the government, empirical testing in a recent research study (Moorthy et.al. 2000
June) has shown that move to market borrowings has been beneficial as :
(i) there is no evidence of a systematic shift to an unstable debt
regime during the 1990s;
(ii) reduction in monetization has helped curb the fiscal deficit by
inducing a fall in primary expenditures larger than the rise in
interest payments,
(iii) the decline in private sector interest rates due to the move to
market borrowing indicates that overall costs of private
borrowings are likely to have declined, and
(iv) there has been a surge in private investment relative to public
investment.
Nevertheless, the study points out that Central and State government
finances are in precarious condition due to large non-market debt, unfounded
liabilities and contingent liabilities.
3.1.43.1.43.1.43.1.4 Expenditure Reforms CommissionExpenditure Reforms CommissionExpenditure Reforms CommissionExpenditure Reforms Commission
To carry the process of reducing the growth in non-developmental
expenditure, the government has set up (in February, 2000) an Expenditure
Reforms Commission. The main terms of reference for the Commission are as
follows :

56
• To suggest a road map for reducing the functions, activities and
administrative structure of the Central Government.
• To review the framework of all subsidies, both explicit and implicitfor maximizing their impact on the target population and minimize
cost.
• To review the framework for determination of user charges of
Departmental and Commercial activities : suggest an effective
strategy for cost recovery.
• To review the adequacy of staffing under Central government
Ministries, attached offices etc.
• To review the procedure for setting up of government funded
autonomous institutions.
• To consider any other relevant issue concerning expenditure
management in government and make suitable recommendation.
The Commission has already submitted to the government a few interim
Reports.
3.1.53.1.53.1.53.1.5 Fiscal Reforms Program for the StatesFiscal Reforms Program for the StatesFiscal Reforms Program for the StatesFiscal Reforms Program for the States
Of late, several State governments have been facing acute financial
problems due to various structural rigidities as well as ad hoc compulsions
including steep pay hikes to their employees. Specific time bound fiscal reform
programs have, therefore, been discussed in the National Development Council
(represented by the Chief Ministers of States) and with the Finance Minister. It
was felt that joint effort on the part of the Centre as well as Sates is required to
devise a medium term strategy for fiscal reform programs in the States. This
strategy has taken the form of a package of advance financial assistance to be
provided by the Centre to the States for an appropriate time bound reform
program by signing a Memorandum of Understanding (MOU). Thirteen States
have so far entered into an agreement with the Centre. These states are Punjab,
Rajasthan, Himachal Pradesh, Manipur, Nagaland, Mizoram, Orissa, Sikkim,
Uttar Pradesh, Madhya Pradesh, Assam, Andhra Pradesh and Jammu &
Kashmir.
The main objective of the program is to wipe out the revenue deficit in the
State budget in the medium term. The program components are:
• Reduction in Non Plan Revenue Expenditure, through appropriatetaxation and expenditure measures and down-sizing of Government,
where possible;
• Pricing/subsidy reforms, to reduce fiscal burden of the State andimprove allocative efficiency;
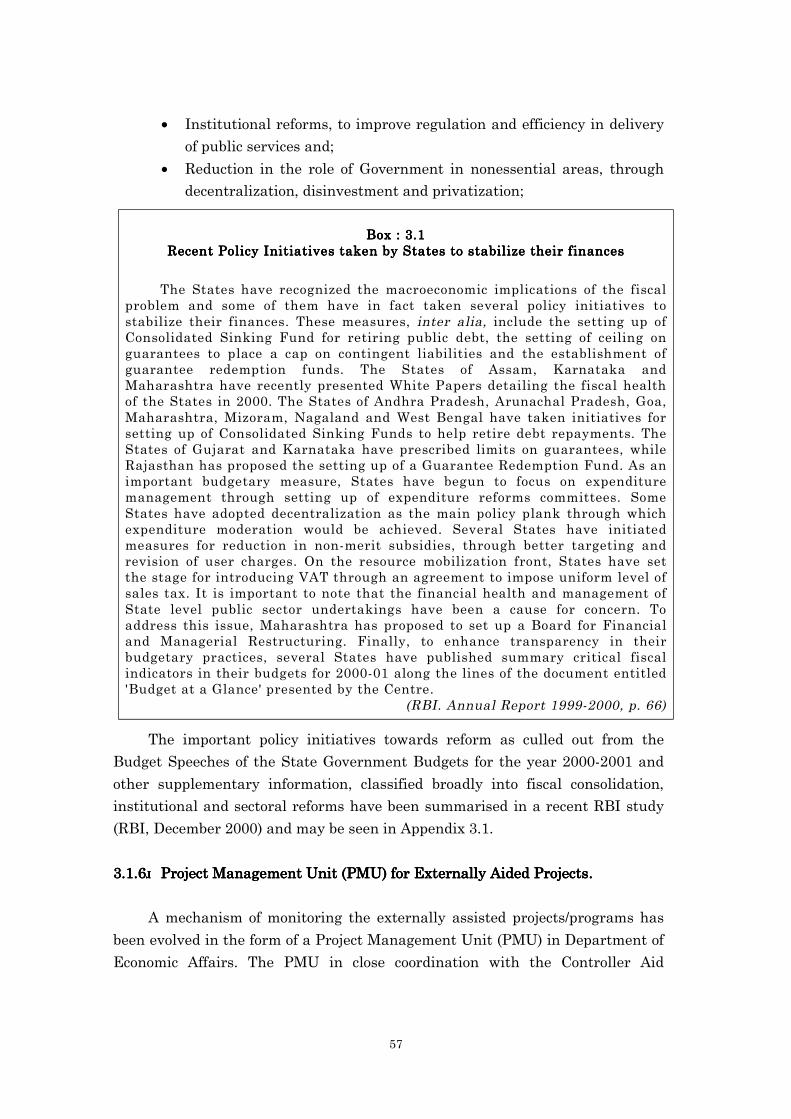
57
• Institutional reforms, to improve regulation and efficiency in delivery
of public services and;
• Reduction in the role of Government in nonessential areas, throughdecentralization, disinvestment and privatization;
Box : 3.1Box : 3.1Box : 3.1Box : 3.1Recent Policy Initiatives taken by States to stabilize their financesRecent Policy Initiatives taken by States to stabilize their financesRecent Policy Initiatives taken by States to stabilize their financesRecent Policy Initiatives taken by States to stabilize their finances
The States have recognized the macroeconomic implications of the fiscalproblem and some of them have in fact taken several policy initiatives tostabilize their finances. These measures, inter alia, include the setting up ofConsolidated Sinking Fund for retiring public debt, the setting of ceiling onguarantees to place a cap on contingent liabilities and the establishment ofguarantee redemption funds. The States of Assam, Karnataka andMaharashtra have recently presented White Papers detailing the fiscal healthof the States in 2000. The States of Andhra Pradesh, Arunachal Pradesh, Goa,Maharashtra, Mizoram, Nagaland and West Bengal have taken initiatives forsetting up of Consolidated Sinking Funds to help retire debt repayments. TheStates of Gujarat and Karnataka have prescribed limits on guarantees, whileRajasthan has proposed the setting up of a Guarantee Redemption Fund. As animportant budgetary measure, States have begun to focus on expendituremanagement through setting up of expenditure reforms committees. SomeStates have adopted decentralization as the main policy plank through whichexpenditure moderation would be achieved. Several States have initiatedmeasures for reduction in non-merit subsidies, through better targeting andrevision of user charges. On the resource mobilization front, States have setthe stage for introducing VAT through an agreement to impose uniform level ofsales tax. It is important to note that the financial health and management ofState level public sector undertakings have been a cause for concern. Toaddress this issue, Maharashtra has proposed to set up a Board for Financialand Managerial Restructuring. Finally, to enhance transparency in theirbudgetary practices, several States have published summary critical fiscalindicators in their budgets for 2000-01 along the lines of the document entitled'Budget at a Glance' presented by the Centre.
(RBI. Annual Report 1999-2000, p. 66)
The important policy initiatives towards reform as culled out from the
Budget Speeches of the State Government Budgets for the year 2000-2001 and
other supplementary information, classified broadly into fiscal consolidation,
institutional and sectoral reforms have been summarised in a recent RBI study
(RBI, December 2000) and may be seen in Appendix 3.1.
3.1.63.1.63.1.63.1.6 Project Management Unit (Project Management Unit (Project Management Unit (Project Management Unit (PMU) for Externally Aided Projects.PMU) for Externally Aided Projects.PMU) for Externally Aided Projects.PMU) for Externally Aided Projects.
A mechanism of monitoring the externally assisted projects/programs has
been evolved in the form of a Project Management Unit (PMU) in Department of
Economic Affairs. The PMU in close coordination with the Controller Aid
58
Accounts and Audit, Planning Commission and State governments performs the
following tasks:
• The Effective monitoring of implementation of EAPs.
• Regular review of disbursements to States.
• Strengthening of procurement procedures.
• Release of advance assistance.
• Coordination between Budget, Planning Commission, ExternalFinance Division and CAA&A.
• Conducting regular training programs.
3.1.73.1.73.1.73.1.7 RBI initiatives on Reforms in State FinancesRBI initiatives on Reforms in State FinancesRBI initiatives on Reforms in State FinancesRBI initiatives on Reforms in State Finances
In response to the emerging new balances, it has been recognized that
finances at the provincial level are critical to the realignment of the role of the
state in the economy. Contextually, the Reserve Bank started a close and more
intensive interaction with State Governments on a regular basis, and on a wide
range of relevant issues. Accordingly, several significant initiatives have been
taken during the recent years. (RBI, Jan., 2000)
• Reserve Bank in its role as adviser to the States, had examined theimplications of contingent liabilities/guarantees granted by the States to
facilitate economic activities. A Committee of State Finance Secretaries
has, with the active involvement of Reserve Bank, recommended limits on
Government guarantees.
• With the support from Reserve Bank, a Committee of Finance Secretariesof State Governments is presently working on the issue of transparency
and voluntary disclosure norms for State Budgets.
• Recently, the States have also been encouraged to access the market for apart of their market borrowings. Within the approved borrowing program,
the State Governments are provided with the option of raising resources
in a flexible manner in terms of method, timing and maturates. The State
Governments can borrow from the market between 5 per cent to 35 per
cent of the approved borrowing limit under the new scheme. The State of
Punjab, Andhra Pradesh, Tamil Nadu and Karnataka have raised funds
directly from the market. The gains from the auction mechanism were
seen from the fact that the auction based yield were below the pre-
announced rates.
• A Committee of the State Finance Secretaries is currently acting in an
advisory capacity to oversee the indicators of financial parameters by the
Reserve Bank.

59
• The Reserve Bank has been advising the State Governments in areas
such as cash management, funds management and reforms in budgetary
practices. Cash management techniques relate to updating of accounts,
data analysis, technology improvements, updating of financial accounting
and other codes and prompt analysis of monthly data. Modernization of
budgetary procedures and financial practices and development of
forecasting models or expert systems are some of the issues being
examined as a part of reforms in budgetary practices.
• Mounting debt of the State Governments is increasing the burden on
future generations. To achieve some inter-generational equity, Reserve
Bank has, in consultation with State Finance Secretaries, developed a
scheme for Consolidated Sinking Fund which is optional for State
Governments.
3.1.83.1.83.1.83.1.8 Fiscal Responsibility ActFiscal Responsibility ActFiscal Responsibility ActFiscal Responsibility Act
On December 11, 2000 the Government has introduced a Bill in the
Parliament titled as "The Fiscal Responsibility and Budget Management Bill,
2000" (Annex 3.4). The proposed legislation is to provide for the responsibility of
the Central Government to ensure inter-generational equity in fiscal
management and long-term macro-economic stability by achieving sufficient
revenue surplus, eliminating fiscal deficit and removing fiscal impediments in
the effective conduct of monetary policy and prudential debt management,
consistent with fiscal sustainability, through limits on the Central Government
borrowings, debts and deficits, greater transparency in fiscal operations of the
Central Government and conducting fiscal policy in a medium-term framework
and for matters connected therewith or incidental thereto.
7. The important features of the Bill, inter alia, provide as under:--
(a) laying before both Houses of parliament, along with the annual
budget, the Medium-term Fiscal Policy Statement, Fiscal Policy Strategy
Statement and Macro-economic Framework Statement by the Central
Government;
(b) appropriate measures by Central Government to eliminate
revenue deficit and fiscal deficit and build up adequate revenue surplus;
(c) elimination of revenue deficit by 31st March, 2006 and bringing
down fiscal deficit to 2% of GDP in the same period;
(d) prohibition of direct borrowings by the Central Government from
the Reserve Bank of India after three years except by way of advances to
meet temporary cash needs in certain circumstances;
60
(e) greater transparency in fiscal operations and to minimization of,
as far as practicable, secrecy in the preparation of the annual budget;
(f) quarterly review of the trends in receipts and expenditures in
relation to the budget by the Finance Minister and placing the outcome of
such reviews before both Houses of Parliament.
(g) the Central Government to cut expenditure authorizations in a
proportionate manner, while protecting the “charged” expenditure,
whenever there is a shortfall of revenue or excess of expenditure over
specified targets.
(h) Finance Minister to make a statement in both Houses of
Parliament explaining any deviation in meeting the obligations cast on
the Central Government under this Act and the remedial measures the
Central Government proposes to take.
(i) relaxation from deficit reduction targets to deal with unforeseen
demands on the finances of the Central Government on account of
national security or natural calamities of national dimension.
3.23.23.23.2 Recent Trends in Government FinancesRecent Trends in Government FinancesRecent Trends in Government FinancesRecent Trends in Government Finances
Trends in government finances in India continue to remain worrisome. The
stabilization measures and economic reform initiatives taken since 1991 after
the economic crisis had an encouraging impact in correcting the fiscal imbalances,
particularly during the first two years. The trend, however, could not be
maintained. Budgetary imbalances widened again reaching almost the same
level towards the end of the decade, as it was at the beginning. Analysis of these
developments has revealed dominance of structural rigidities in the government
finances, erosion of tax-GDP ratio over a longer period, virtual stagnation of non
tax revenue and higher growth rates in expenditure compared to growth rates in
revenue receipts. This part of the chapter presents a macro review of recent
trends in government finances in India.
Box : 3.2Box : 3.2Box : 3.2Box : 3.2Basics of Structure of Public FinancesBasics of Structure of Public FinancesBasics of Structure of Public FinancesBasics of Structure of Public Finances
Before reviewing the trends in government finances in India it may be of useto first recall the basics of the structure of public finances in a country. These arebest summarised in the Report of the Eleventh Finance Commission as follows:
"The structure of public finances in an economy is defined by the level andcomposition of expenditure of the government (current and capital) and theinstruments relied upon to finance them, viz., the tax and the non-tax revenuesources and borrowings. The excess of government expenditure over currentrevenues and other non-debt receipts gets reflected in fiscal deficits financedeither by way of borrowings from internal and external sources or through

61
seignorage, that is money printing. If expenditure persistently exceedsrevenues, fiscal deficit, to the extent it is not covered by seignorage, steadilyadds to outstanding debt, resulting in increasing interest payments. Unlessmet with larger revenue receipts, this gives rise to a self-perpetuating spiral ofdebt and deficit. In the absence of commensurate increase in domestic savings,deficits in government budgets tend to spill over to the external sector in theform of current account deficit leading eventually to adverse balance ofpayments. This, in turn, jeopardizes the macro-stability, judged by stability ofprices consistent with growth at attainable full employment levels. Thesolvency of the economy also comes under doubt. A restructuring programme iscalled for to steer public finances away from such a spiral towards sustainablelevels of debt and deficit".
3.2.13.2.13.2.13.2.1 Trends in Aggregate Budgetary BalancesTrends in Aggregate Budgetary BalancesTrends in Aggregate Budgetary BalancesTrends in Aggregate Budgetary Balances
Trends in different measures of budgetary balances both for the Central
government and State governments as given in table 3.1 for 1990s show that:
• The level of fiscal deficit fiscal deficit fiscal deficit fiscal deficit in 1999-2000 combinedcombinedcombinedcombined for Central and State
governments at 9.84 per cent of GDP was almost at the same level
(9.64%) as in 1990-91, the crisis year. Latest available estimates (RBI,
2000, Aug.) show that for 2000-01 (BE) the combined fiscal deficit level
at 8.6 per cent of GDP is significantly higher compared to the average
of actuals for such a ratio during the period from 1990-91 to 1998-99
which is 7.7 per cent.
• Fiscal deficit in the Central government Central government Central government Central government budget for 1999-2000 (RE) at5.6 per cent of GDP though lower, compared to the 1990-91 level of 8.3
per cent is not significantly lower from any other year during 1990s
except for 1993-94. Comparable estimates (excluding states share in
small savings) show that the 1999-2000 (RE) level at 5.6 per cent of
GDP is higher than the average level of fiscal deficit during 1991-92 to
1998-99, which was 5.0 per cent (RBI, 2000 Aug.).
• State governments together had a fiscal deficit of 4.7 per cent of GDPat its historical high in 1999-2000(RE)-way above the average of 3 per
cent for the period 1990-91 to 1998-99.

62
Table 3.1 Aggregate Budgetary Balance : Centre and StatesYear Fiscal deficit Revenue Deficit Primary Deficit
Centre States Combined Center StateCombined Centre States Combined
(% of GDP Old Series)
1990-91 8.33 3.28 9.64 3.47 0.84 4.31 4.32 1.69 5.00
1991-92 5.89 2.93 7.17 2.64 0.81 3.45 1.58 1.19 2.19
1992-93 5.69 2.92 7.38 2.63 0.72 3.36 1.29 1.06 2.23
1993-94 7.43 2.49 8.68 4.04 0.47 4.51 2.90 0.56 3.39
1994-95 5.99 2.86 7.36 3.22 0.73 3.95 1.42 0.84 1.93
1995-96 5.38 2.75 6.81 2.66 0.77 3.43 0.91 0.86 1.61
1996-97 5.23 2.97 6.82 2.56 1.43 3.98 0.57 0.97 1.35
1997-98 6.21 3.10 7.74 3.24 1.29 4.53 1.63 1.00 1.40
1998-99 6.80 4.47 9.50 4.08 2.72 6.80 2.13 2.34 3.23
1999-2000(RE\BE) 5.96 4.98 10.40 4.03 3.13 7.16 0.96 2.55 2.13
(% of GDP New Series)
1993-94 7.01 2.35 8.19 3.81 0.45 4.25 2.74 0.52 3.20
1994-95 5.71 2.73 7.02 3.07 0.70 3.77 1.35 0.80 1.84
1995-96 5.10 2.60 6.44 2.52 0.73 3.25 0.86 0.81 1.52
1996-97 4.90 2.79 6.40 2.40 1.34 3.73 0.53 0.91 1.26
1997-98 5.87 2.93 7.32 3.06 1.22 4.28 1.54 0.94 1.33
1998-99 6.43 4.23 8.99 3.85 2.57 6.43 2.01 2.22 3.06
1999-2000(RE/BE) 5.64 4.71 9.84 3.81 2.96 6.77 0.90 2.41 2.02Note: Figures in italics indicate deficits as per cent of GDP (New Series). Old series for 1997-98 to1999-00 have been derived from the New Series by using a conversion factor 1.0577. For 1999-00,FD and PD of the Centre exclude the States' and UT's share of small savings.Source: Report of Eleventh Finance Commission, June 2000.
BBBBOX OX OX OX : 3.3: 3.3: 3.3: 3.3Data and Reviews on Government FinancesData and Reviews on Government FinancesData and Reviews on Government FinancesData and Reviews on Government Finances
Government finances being the key to macroeconomic stability remainunder constant watch and review and exhaustive reviews on trends and currentstatus are available periodically both from the government as well as RBIpublications. It has been a welcome coincidence for this study to have anauthentic and detailed review of government finances in the Report of theEleventh Finance Commission, (a statutory body set up every fifth year)published in June, 2000 by the Government of India. One of the terms ofreference of the Commission was to 'review the state of finances of the Unionand the States and suggest ways and means whereby the governments,collectively and severally, may bring about a restructuring of the publicfinances so as to restore budgetary balance and maintain macro-economicstability'. This part of the chapter, therefore, draws heavily on the analysisand data given in the Eleventh Finance Commission Report as well as inReports from the RBI.
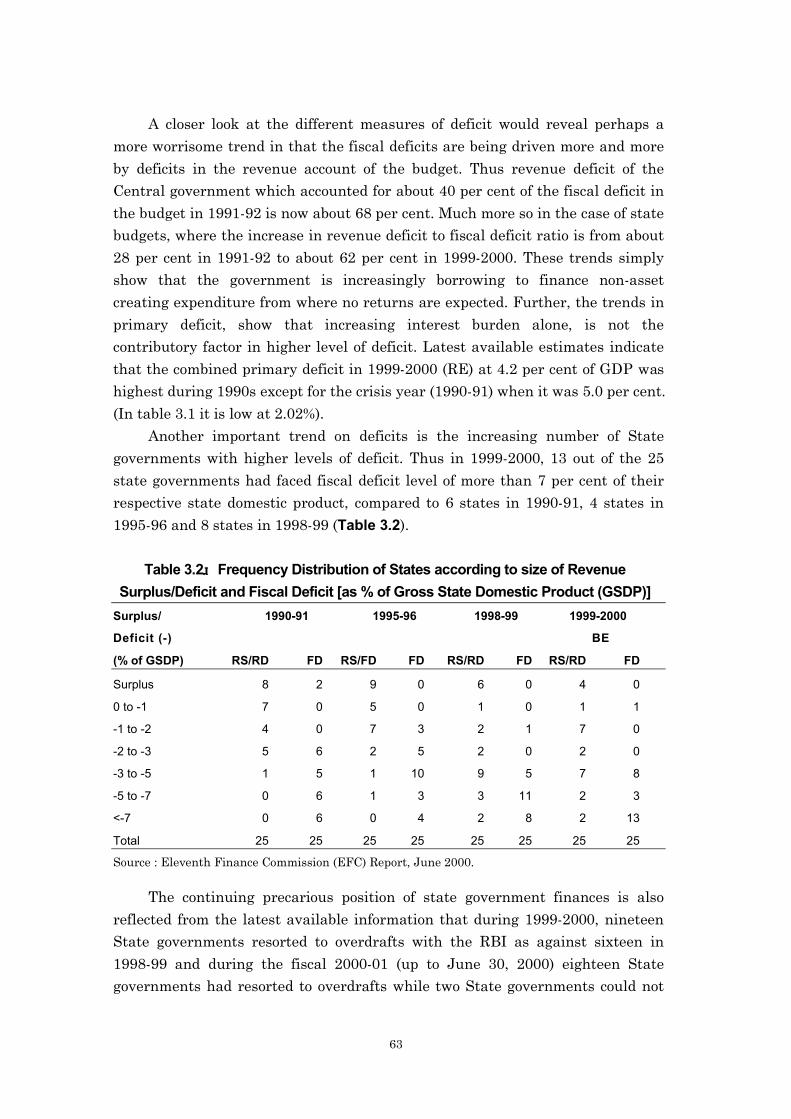
63
A closer look at the different measures of deficit would reveal perhaps a
more worrisome trend in that the fiscal deficits are being driven more and more
by deficits in the revenue account of the budget. Thus revenue deficit of the
Central government which accounted for about 40 per cent of the fiscal deficit in
the budget in 1991-92 is now about 68 per cent. Much more so in the case of state
budgets, where the increase in revenue deficit to fiscal deficit ratio is from about
28 per cent in 1991-92 to about 62 per cent in 1999-2000. These trends simply
show that the government is increasingly borrowing to finance non-asset
creating expenditure from where no returns are expected. Further, the trends in
primary deficit, show that increasing interest burden alone, is not the
contributory factor in higher level of deficit. Latest available estimates indicate
that the combined primary deficit in 1999-2000 (RE) at 4.2 per cent of GDP was
highest during 1990s except for the crisis year (1990-91) when it was 5.0 per cent.
(In table 3.1 it is low at 2.02%).
Another important trend on deficits is the increasing number of State
governments with higher levels of deficit. Thus in 1999-2000, 13 out of the 25
state governments had faced fiscal deficit level of more than 7 per cent of their
respective state domestic product, compared to 6 states in 1990-91, 4 states in
1995-96 and 8 states in 1998-99 (Table 3.2).
Table 3.2 Frequency Distribution of States according to size of RevenueSurplus/Deficit and Fiscal Deficit [as % of Gross State Domestic Product (GSDP)]
Surplus/ 1990-91 1995-96 1998-99 1999-2000
Deficit (-) BE
(% of GSDP) RS/RD FD RS/FD FD RS/RD FD RS/RD FD
Surplus 8 2 9 0 6 0 4 0
0 to -1 7 0 5 0 1 0 1 1
-1 to -2 4 0 7 3 2 1 7 0
-2 to -3 5 6 2 5 2 0 2 0
-3 to -5 1 5 1 10 9 5 7 8
-5 to -7 0 6 1 3 3 11 2 3
<-7 0 6 0 4 2 8 2 13
Total 25 25 25 25 25 25 25 25
Source : Eleventh Finance Commission (EFC) Report, June 2000.
The continuing precarious position of state government finances is also
reflected from the latest available information that during 1999-2000, nineteen
State governments resorted to overdrafts with the RBI as against sixteen in
1998-99 and during the fiscal 2000-01 (up to June 30, 2000) eighteen State
governments had resorted to overdrafts while two State governments could not
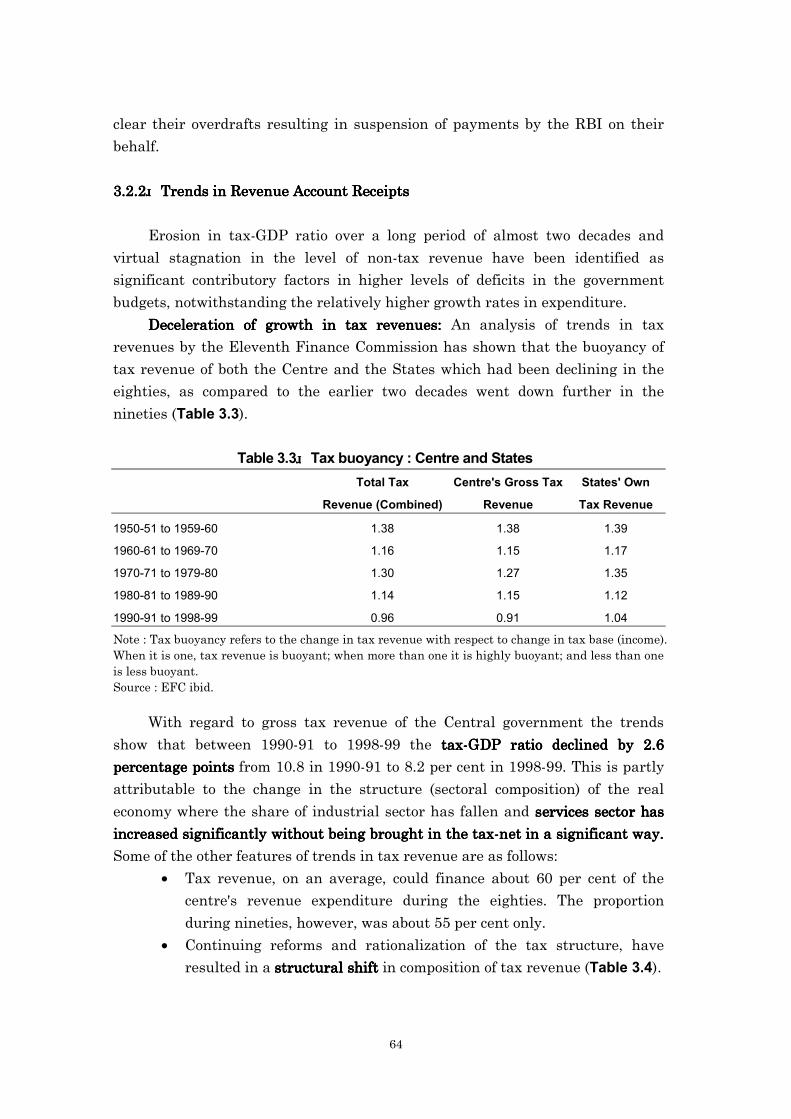
64
clear their overdrafts resulting in suspension of payments by the RBI on their
behalf.
3.2.23.2.23.2.23.2.2 Trends in Revenue Account ReceiptsTrends in Revenue Account ReceiptsTrends in Revenue Account ReceiptsTrends in Revenue Account Receipts
Erosion in tax-GDP ratio over a long period of almost two decades and
virtual stagnation in the level of non-tax revenue have been identified as
significant contributory factors in higher levels of deficits in the government
budgets, notwithstanding the relatively higher growth rates in expenditure.
Deceleration of growth in tax revenues:Deceleration of growth in tax revenues:Deceleration of growth in tax revenues:Deceleration of growth in tax revenues: An analysis of trends in tax
revenues by the Eleventh Finance Commission has shown that the buoyancy of
tax revenue of both the Centre and the States which had been declining in the
eighties, as compared to the earlier two decades went down further in the
nineties (Table 3.3).
Table 3.3 Tax buoyancy : Centre and StatesTotal Tax Centre's Gross Tax States' Own
Revenue (Combined) Revenue Tax Revenue
1950-51 to 1959-60 1.38 1.38 1.39
1960-61 to 1969-70 1.16 1.15 1.17
1970-71 to 1979-80 1.30 1.27 1.35
1980-81 to 1989-90 1.14 1.15 1.12
1990-91 to 1998-99 0.96 0.91 1.04
Note : Tax buoyancy refers to the change in tax revenue with respect to change in tax base (income).When it is one, tax revenue is buoyant; when more than one it is highly buoyant; and less than oneis less buoyant.Source : EFC ibid.
With regard to gross tax revenue of the Central government the trends
show that between 1990-91 to 1998-99 the tax-tax-tax-tax-GDP ratio declined by 2.6GDP ratio declined by 2.6GDP ratio declined by 2.6GDP ratio declined by 2.6
percentage pointspercentage pointspercentage pointspercentage points from 10.8 in 1990-91 to 8.2 per cent in 1998-99. This is partly
attributable to the change in the structure (sectoral composition) of the real
economy where the share of industrial sector has fallen and services sector hasservices sector hasservices sector hasservices sector has
increased significantly without being brought in the tax-net in a significant way.increased significantly without being brought in the tax-net in a significant way.increased significantly without being brought in the tax-net in a significant way.increased significantly without being brought in the tax-net in a significant way.
Some of the other features of trends in tax revenue are as follows:
• Tax revenue, on an average, could finance about 60 per cent of the
centre's revenue expenditure during the eighties. The proportion
during nineties, however, was about 55 per cent only.
• Continuing reforms and rationalization of the tax structure, have
resulted in a structural shift structural shift structural shift structural shift in composition of tax revenue (Table 3.4).

65
• A fall in the share of indirect tax collections from about 80 per cent of
total tax revenue in eighties to about 70 per cent in the nineties could
not be fully compensated by the increase in direct tax revenue.
• On the states' side, the dip in tax buoyancy occurred as revenue from
sales tax, the principal component of their own tax revenue, showed a
declining growth trend owing to tax competition among the States to
attract trade and industry. (EFC, 2000).
Table 3.4 Composition and Tax GDP ratio : Central Taxes
1990-91 1995-96 1996-97 1997-98 1998-99@ 1999-2000
(BE)
Tax Revenue as a Percentage of Gross Tax Revenue
Direct (a) 19.1 30.2 30.2 34.7 32.2 33.5
Personnel Income Tax 9.3 14.0 14.2 12.3 14.0 15.2
Corporate Income Tax 9.3 14.8 14.4 14.4 17.0 17.4
Indirect (b) 78.4 69.1 69.1 64.5 66.8 65.9
Customs 35.9 32.1 33.3 28.9 28.6 28.5
Excise 42.6 36.1 35.0 34.5 36.9 36.1
Tax Revenue as a Percentage of Gross Domestic Product
Direct (a) 2.1 2.8 2.9 3.2 2.6 3.1
Personnel Income Tax 1.0 1.3 1.3 1.1 1.1 1.4
Corporate Income Tax 1.0 1.4 1.4 1.3 1.4 1.6
Indirect (b) 8.4 6.5 6.5 5.9 5.5 6.0
Customs 3.9 3.0 3.2 2.7 2.3 2.6
Excise 4.6 3.4 3.3 3.2 3.0 3.3
Gross Tax Revenue# 10.8 9.4 9.5 9.2 8.2 9.2
(a) also includes taxes pertaining to expenditure, interest, wealth, gift, estate duly and VDIS for1997-98 and 1998-99;
(b) also includes service tax; # includes taxes referred in (a) & (b) and taxes of Union Territoriesand "other" taxes. Tax revenue figures for the year 1999-2000 are budget estimates and forthe years 1997-98 and earlier these are actuals.
@ : Tax data based on Provisional unaudited tax figures as per Controller General Accounts.Note : 1. Ratio to GDP at current market prices for the year 1990-91 use old series (Base 1980-
81) and from 1995-96 onwards use new series (Base 1993-94) of National AccountsStatistics released by the Central Statistical Organization (CSO).
2. The ratios to GDP at current market prices for 1999-2000 are based on CSO's AdvanceEstimates.
Source : Economic Survey, 1999-2000.

66
Following are some of the findings relating to Tax Revenue of Central
Government and Sales Tax Revenue of States, in a recent study (Chaudhuri S.,2000b).
• Union excise duty collections have failed to keep pace with manufacturing
output growth. The weakness has been in the system.
• The principal factor behind the fall in excise duty collections with respect to
GDP is not tax policy per se, but the administrative mechanism of collection--
the amalgam of compliance and of enforcement.
• The reason for the decline in customs duty with respect to GDP is quite
obvious. The reduction in very high specific rates has not been fully offset by
the combination of a steady depreciation in the external value of the rupee
and the increase in the quantum (volume) of imports. It is unlikely that any
reversal of the downward movement in the customs duties to GDP would be
greatly reversed.
• The most notable feature of the movement of tax collections has been thesteadily rising trend in direct tax collections--almost wholly made up of
personal income tax and corporation tax collections. The annualized rate of
growth for personal income tax in the period 1992-93 to 1999-2000 has been
17.8 per cent. The counterpart figure for corporation tax was 18.4 per cent.
Given that the trend rate of growth of GDP at current market prices was 15.4
per cent in this period, the strong buoyancy for both the major direct taxes
suggests enhanced collection efficiency--of compliance and of enforcement.
• Although the ratio of sales tax collections to GDP has not changed much, we
do know that rate wars between States and competitive fiscal incentives had
significantly eroded sales tax collection capability in the States. The
concordat mediated by the Union Government in November 1999 has
resulted in Uniform Sales Tax code and resulted in better collections in most
States in the current fiscal (2000-01). The agreement between the States has
also frozen any fresh sales tax incentives to new investment, although
incentives already granted would continue to be operative.
3.2.33.2.33.2.33.2.3 Trends in Non Tax RevenueTrends in Non Tax RevenueTrends in Non Tax RevenueTrends in Non Tax Revenue
On the whole, non-tax revenue growth has practically stagnatedpractically stagnatedpractically stagnatedpractically stagnated at both
levels of government, during the nineties. For the Central government budget, it
was, on average, 2.5 per cent of GDP during eighties and the same level during
nineties. Apart from the interest receipts the other two main items of non-tax
receipts are (i) return on investments of the Government and (ii) recovery of cost
of public services. By way of dividend and interest, return on Central
government investment in public enterprises even though has shown some
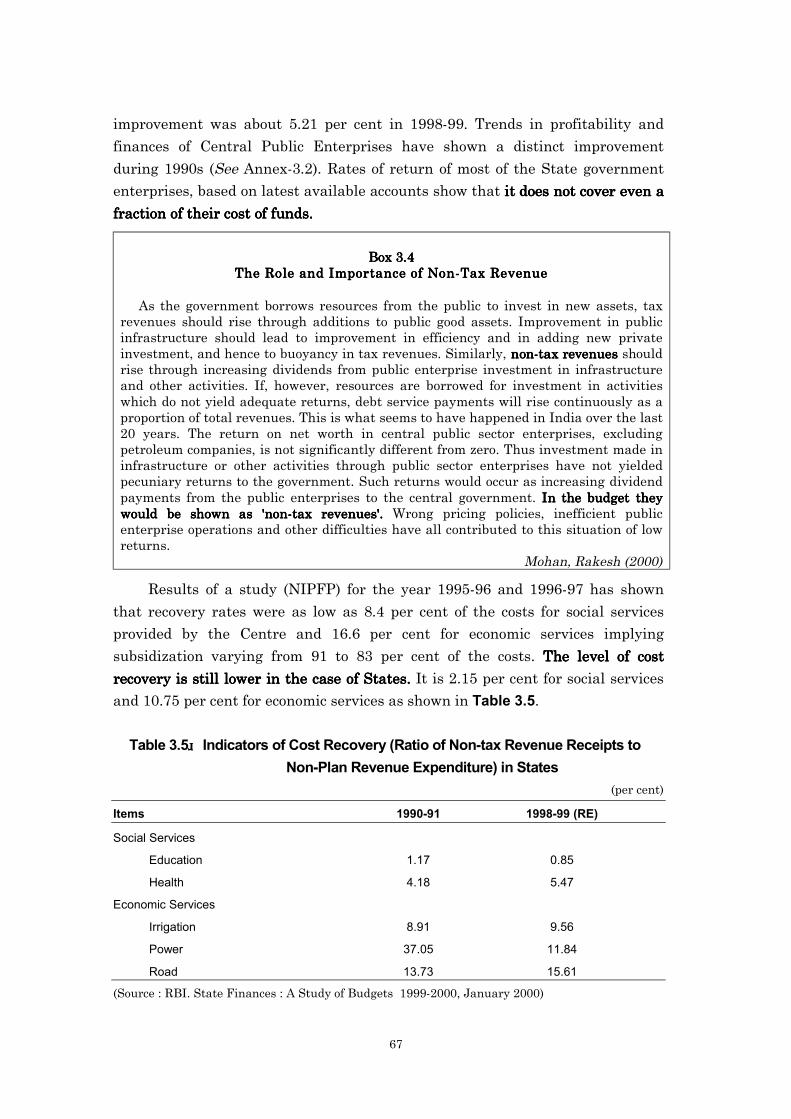
67
improvement was about 5.21 per cent in 1998-99. Trends in profitability and
finances of Central Public Enterprises have shown a distinct improvement
during 1990s (See Annex-3.2). Rates of return of most of the State government
enterprises, based on latest available accounts show that it does not cover even ait does not cover even ait does not cover even ait does not cover even a
fraction of their cost of funds.fraction of their cost of funds.fraction of their cost of funds.fraction of their cost of funds.
Box 3.4Box 3.4Box 3.4Box 3.4The Role and Importance of Non-Tax RevenueThe Role and Importance of Non-Tax RevenueThe Role and Importance of Non-Tax RevenueThe Role and Importance of Non-Tax Revenue
As the government borrows resources from the public to invest in new assets, taxrevenues should rise through additions to public good assets. Improvement in publicinfrastructure should lead to improvement in efficiency and in adding new privateinvestment, and hence to buoyancy in tax revenues. Similarly, non-tax revenuesnon-tax revenuesnon-tax revenuesnon-tax revenues shouldrise through increasing dividends from public enterprise investment in infrastructureand other activities. If, however, resources are borrowed for investment in activitieswhich do not yield adequate returns, debt service payments will rise continuously as aproportion of total revenues. This is what seems to have happened in India over the last20 years. The return on net worth in central public sector enterprises, excludingpetroleum companies, is not significantly different from zero. Thus investment made ininfrastructure or other activities through public sector enterprises have not yieldedpecuniary returns to the government. Such returns would occur as increasing dividendpayments from the public enterprises to the central government. In the budget theyIn the budget theyIn the budget theyIn the budget theywould be shown as 'non-tax revenues'.would be shown as 'non-tax revenues'.would be shown as 'non-tax revenues'.would be shown as 'non-tax revenues'. Wrong pricing policies, inefficient publicenterprise operations and other difficulties have all contributed to this situation of lowreturns.
Mohan, Rakesh (2000)
Results of a study (NIPFP) for the year 1995-96 and 1996-97 has shown
that recovery rates were as low as 8.4 per cent of the costs for social services
provided by the Centre and 16.6 per cent for economic services implying
subsidization varying from 91 to 83 per cent of the costs. The level of costThe level of costThe level of costThe level of cost
recovery is still lower in the case of States.recovery is still lower in the case of States.recovery is still lower in the case of States.recovery is still lower in the case of States. It is 2.15 per cent for social services
and 10.75 per cent for economic services as shown in Table 3.5.
Table 3.5 Indicators of Cost Recovery (Ratio of Non-tax Revenue Receipts toNon-Plan Revenue Expenditure) in States
(per cent)
Items 1990-91 1998-99 (RE)
Social Services
Education 1.17 0.85
Health 4.18 5.47
Economic Services
Irrigation 8.91 9.56
Power 37.05 11.84
Road 13.73 15.61
(Source : RBI. State Finances : A Study of Budgets 1999-2000, January 2000)
68
Although not much appears to have been done by the State Governments to
increase recovery rates and thus enhance non-tax revenue receipts, some of the
State Governments have, of late, announced some specific measures towards
increasing non-tax revenue. Punjab government, for example has announced in
the State budget for 2000-2001 for Indexation of user charges and fees for
transport, power sectors to cost of fuel, salaries, electricity etc. (see Appendix 3.1
for state-wise policy initiative).
3.2.43.2.43.2.43.2.4 Trends in Budget ExpenditureTrends in Budget ExpenditureTrends in Budget ExpenditureTrends in Budget Expenditure
(a) Central Government(a) Central Government(a) Central Government(a) Central Government
• Central Government's total budget expenditure (Revenue+capital)as a proportion to GDP is lower at 15.72 per cent in 1999-2000
(RE) compared to 17.85% in first half of nineties and 20.47 per cent
in the second half of eighties (1985-90).
• But the worst thing to happen is a sharp fall in capital
expenditure/GDP ratio from (average) 6.78 per cent during 1985-
90 to just the half at 3.17 per cent (average) during 1995-2000. It
was only 2.62 per cent in 1999-2000(RE).
• Even revenue expenditure ratio was lower at 12.16 per cent of
GDP during the second half of nineties compared to 13.69 per cent
in the second half of eighties.
• The reduction in revenue expenditure/GDP ratio is despite the fact
that interest payments/GDP ratio has increased from 3.38 per cent
in second half of eighties to 4.73 per cent in 1999-2000.

69
Table 3.6 Trends in Expenditure : Central Government(As % of GDP)
ITEMS 1980-81 1985-86 1990-91 1995-96 1999-2000
to to to to (RE)
1984-85 1989-90 1994-95 1999-2000
(Average) (Average) (Average) (Average)
Total Expenditure 16.82 20.47 17.85 15.33 15.72
(Revenue+Capital)
Revenue Exp. 10.69 13.69 13.24 12.16 13.10
Capital Exp. 6.13 6.78 4.61 3.17 2.62
Interest Payments 2.20 3.38 4.37 4.61 4.73
Revenue Expenditure
minus Interest Payment 8.49 10.31 8.87 7.55 8.37
Pension 0.27 0.42 0.40 0.49 0.74
Revenue Expenditure
minus Interest & Pension 8.22 9.89 6.47 7.06 7.63
Grants to States 1.96 2.45 2.44 1.58 1.52
Source : Based on data in Appendix 3.2(a).
• The other major item of expenditure which has increased sharply
is the expenditure on pensions.
• Thus, revenue expenditure excluding interest and pension as a percent to GDP has fallen from about 10 per cent (average) during
1985-90 to about 7 per cent (average) during 1995-2000.
• Contrary to general perception, expenditure on subsidies as per
cent of GDP has fallen in the second half of nineties compared to
'eighties, notwithstanding, a slight upward trend during 1995-96
to 1998-99. It has been reduced even in absolute terms during
2000-01 compared to the previous year.
• Even revenue expenditure on defence as percent of GDP has been
less than 2 per cent during nineties compared to more than 2.5 per
cent during eighties (on average).
• Budgetary support for the Central Plan as proportion to GDP has
not increased during nineties.
• Grants to States as per cent to GDP have been lower during 1995-
2000 compared to 1990-95 and 1985-90 (on average basis).
• An important recent development leading to bulge in non-plan
revenue expenditure during 1997-98 and 1998-99 has been an
abnormal increase in the expenditure on salaries of the
government staff.

70
• In 1997-98, as a consequences of revision in pay and pensions, the
salary bill of Central government employees (excluding Telecom,
Posts and Railway-being departmental undertakings) registered
an increase of 33.6 per cent and pension bill by 35 per cent and put
together accounted for almost 2 per cent of GDP.
• In fact salaries and pensions together used 20.8 per cent of the
total revenue receipts in 1998-99 compared to 17.4 per cent earlier
(prior to revision).
A profile of expenditure on major items as per cent of total expenditure
(Appendix 3.3a) also brings out that the share of 'other non-plan expenditure'
(other than the major items) has shown a decline of almost 2 percentage points
in 1999-2000 when compared to the average level of such a share during the
second half of eighties.
(b) States : Budgetary expenditure(b) States : Budgetary expenditure(b) States : Budgetary expenditure(b) States : Budgetary expenditure
• Total budgetary expenditure (Revenue+capital) of all the State
governments, as a percentage to GDP is lower by about one
percentage point from second half of eighties (1985-90) to second half
of nineties (1995-2000) on average basis.
• The reduction in total expenditure to GDP ratio from 16.37 per cent in
1985-90 to 15.44 per cent in 1995-2000 is only because of a reduction
in capital expenditure to GDP ratio from 3.21 per cent to 2.11 per cent.
• The revenue expenditure to GDP ratio is marginally higher at 13.33
per cent during 1995-2000 (on average) from 13.16 per cent in 1985-90
(on average) mainly because of an unprecedented increase on ratio
during 1999-2000 when the ratio is 14.61 (Table 3.7).

71
Table 3.7 Trends in Expenditure : All States(as % of GDP)
1980-81to
1984-85(Average)
1985-86to
1989-90(Average)
1990-91to
1994-95(Average)
1995-96to
1999-00(Average)
1999-2000(RE)
Total Expenditure(Revenue+Capital)
15.26 16.37 16.08 15.44 15.77
Revenue Expenditure 11.47 13.16 13.51 13.33 13.82
Capital Expenditure 3.79 3.21 2.57 2.11 1.95
Interest Payments 0.99 1.42 1.83 2.00 2.27
Revenue expenditureminus Interest Payment
10.48 11.74 11.68 11.22 11.55
Pensions 0.29 0.47 0.62 0.87 1.04
Revenue Expenditureminus Interest andPensions
10.19 11.27 11.06 10.35 10.51
Source : Based on data in Appendix 3.2 (b).
• However, if interest payments and expenditure on pension is taken
out, the remaining revenue expenditure as per cent of GDP has fallen
from 11.27 per cent in 1985-90 (on average) to 10.35 per cent in 1995-
2000 (on average).
• Thus, the increases in interest payments and pensions have been atthe cost of capital expenditure of the State governments. 'The net
result is that with falling overall expenditure and rising non-
developmental expenditures, the State governments' ability to invest
in productive activities has been compromised very significantly.'
(Mohan, Rakesh, 2000) (see Appendix 3.3b)
• The impact of revision in salaries and pensions during the last three
years has been much more severe on the state government finances.
In several States, salary related expenditure absorbs over two-third
and in some (e.g., Maharashtra), nearly three-fourths, of their revenue
receipts. According to one estimate (RBI, 1999b) 'additional
expenditure commitment on account of pay revision was to the extent
of 1.1 per cent of the GDP.'
• Results of an analysis of trends in state government finances during
the last two decades in a recent study (Chaudhuri, S, 2000) have
shown that the pay revision not only impacted on the 'non-
development' component of revenue expenditure, but also the
'developmental component, since these needs include a large
proportion of salary related expenses, such as grants-in-aid to schools
and colleges for payment of teachers salaries.
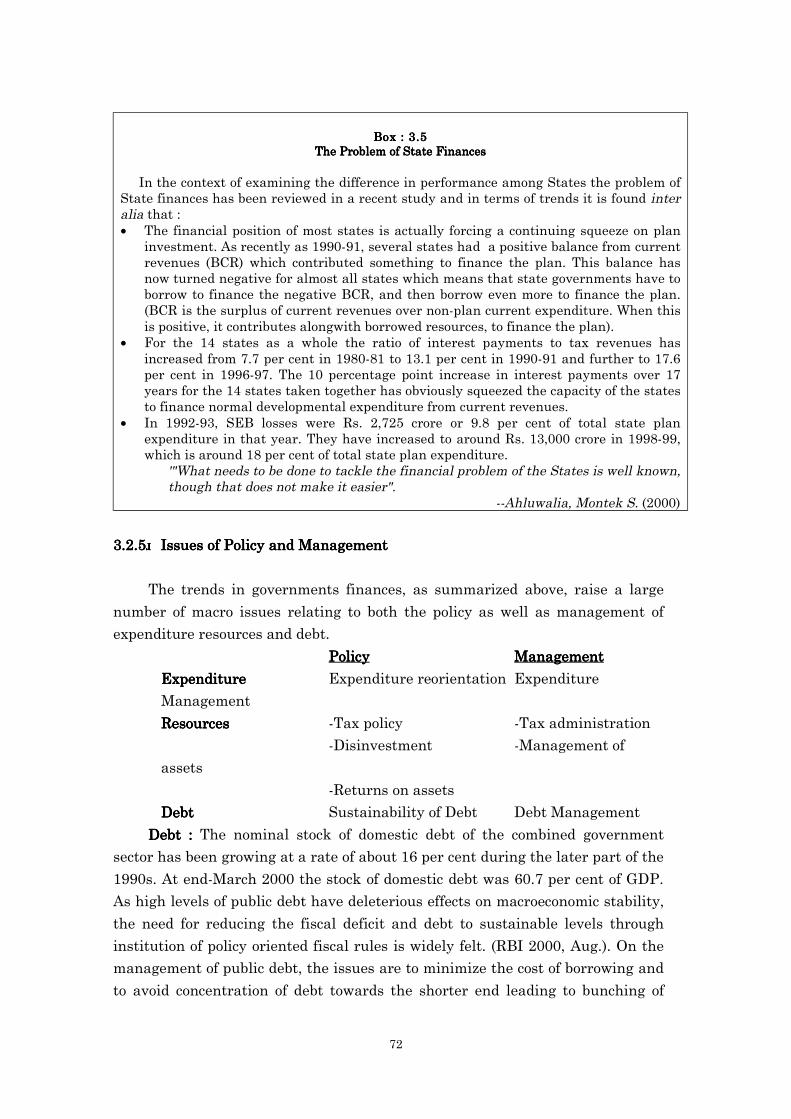
72
Box : 3.5Box : 3.5Box : 3.5Box : 3.5The Problem of State FinancesThe Problem of State FinancesThe Problem of State FinancesThe Problem of State Finances
In the context of examining the difference in performance among States the problem ofState finances has been reviewed in a recent study and in terms of trends it is found interalia that :• The financial position of most states is actually forcing a continuing squeeze on plan
investment. As recently as 1990-91, several states had a positive balance from currentrevenues (BCR) which contributed something to finance the plan. This balance hasnow turned negative for almost all states which means that state governments have toborrow to finance the negative BCR, and then borrow even more to finance the plan.(BCR is the surplus of current revenues over non-plan current expenditure. When thisis positive, it contributes alongwith borrowed resources, to finance the plan).
• For the 14 states as a whole the ratio of interest payments to tax revenues hasincreased from 7.7 per cent in 1980-81 to 13.1 per cent in 1990-91 and further to 17.6per cent in 1996-97. The 10 percentage point increase in interest payments over 17years for the 14 states taken together has obviously squeezed the capacity of the statesto finance normal developmental expenditure from current revenues.
• In 1992-93, SEB losses were Rs. 2,725 crore or 9.8 per cent of total state planexpenditure in that year. They have increased to around Rs. 13,000 crore in 1998-99,which is around 18 per cent of total state plan expenditure.
'"What needs to be done to tackle the financial problem of the States is well known,though that does not make it easier".
--Ahluwalia, Montek S. (2000)
3.2.53.2.53.2.53.2.5 Issues of Policy and ManagementIssues of Policy and ManagementIssues of Policy and ManagementIssues of Policy and Management
The trends in governments finances, as summarized above, raise a large
number of macro issues relating to both the policy as well as management of
expenditure resources and debt.
PolicyPolicyPolicyPolicy ManagementManagementManagementManagement
ExpenditureExpenditureExpenditureExpenditure Expenditure reorientation Expenditure
Management
ResourcesResourcesResourcesResources -Tax policy -Tax administration
-Disinvestment -Management of
assets
-Returns on assets
DebtDebtDebtDebt Sustainability of Debt Debt Management
Debt :Debt :Debt :Debt : The nominal stock of domestic debt of the combined government
sector has been growing at a rate of about 16 per cent during the later part of the
1990s. At end-March 2000 the stock of domestic debt was 60.7 per cent of GDP.
As high levels of public debt have deleterious effects on macroeconomic stability,
the need for reducing the fiscal deficit and debt to sustainable levels through
institution of policy oriented fiscal rules is widely felt. (RBI 2000, Aug.). On the
management of public debt, the issues are to minimize the cost of borrowing and
to avoid concentration of debt towards the shorter end leading to bunching of
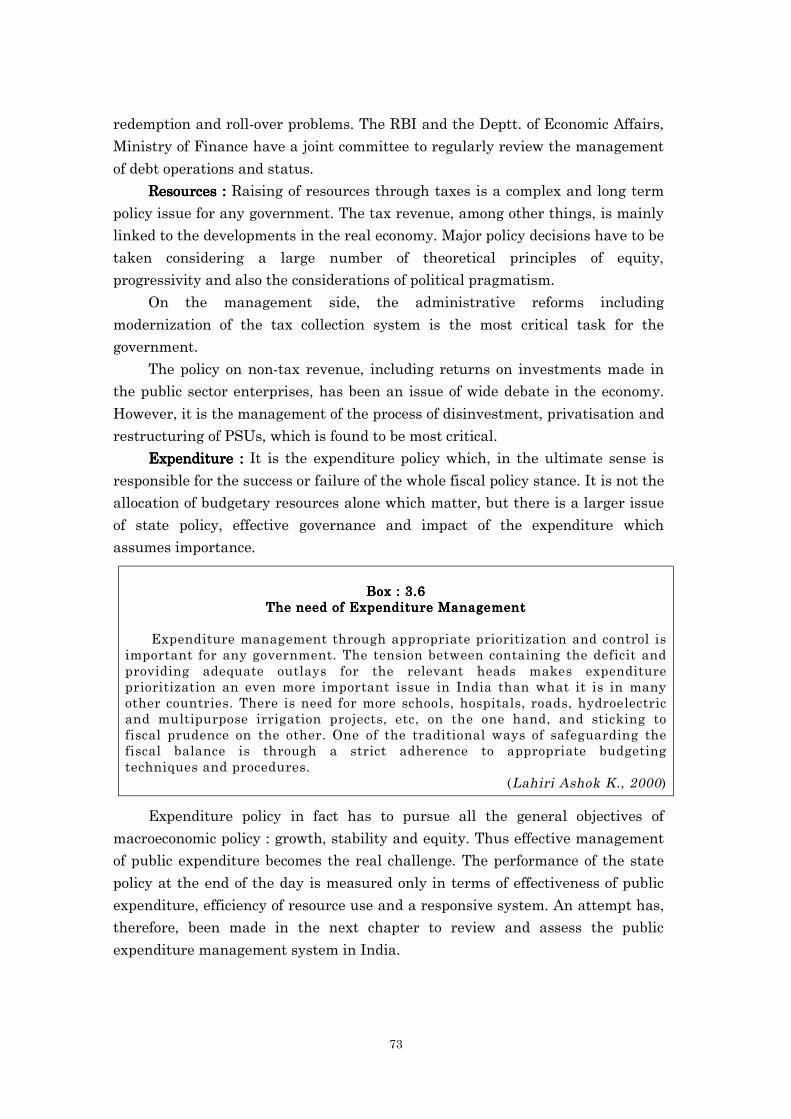
73
redemption and roll-over problems. The RBI and the Deptt. of Economic Affairs,
Ministry of Finance have a joint committee to regularly review the management
of debt operations and status.
Resources :Resources :Resources :Resources : Raising of resources through taxes is a complex and long term
policy issue for any government. The tax revenue, among other things, is mainly
linked to the developments in the real economy. Major policy decisions have to be
taken considering a large number of theoretical principles of equity,
progressivity and also the considerations of political pragmatism.
On the management side, the administrative reforms including
modernization of the tax collection system is the most critical task for the
government.
The policy on non-tax revenue, including returns on investments made in
the public sector enterprises, has been an issue of wide debate in the economy.
However, it is the management of the process of disinvestment, privatisation and
restructuring of PSUs, which is found to be most critical.
Expenditure :Expenditure :Expenditure :Expenditure : It is the expenditure policy which, in the ultimate sense is
responsible for the success or failure of the whole fiscal policy stance. It is not the
allocation of budgetary resources alone which matter, but there is a larger issue
of state policy, effective governance and impact of the expenditure which
assumes importance.
Box : 3.6Box : 3.6Box : 3.6Box : 3.6The need of Expenditure ManagementThe need of Expenditure ManagementThe need of Expenditure ManagementThe need of Expenditure Management
Expenditure management through appropriate prioritization and control isimportant for any government. The tension between containing the deficit andproviding adequate outlays for the relevant heads makes expenditureprioritization an even more important issue in India than what it is in manyother countries. There is need for more schools, hospitals, roads, hydroelectricand multipurpose irrigation projects, etc, on the one hand, and sticking tofiscal prudence on the other. One of the traditional ways of safeguarding thefiscal balance is through a strict adherence to appropriate budgetingtechniques and procedures.
(Lahiri Ashok K., 2000)
Expenditure policy in fact has to pursue all the general objectives of
macroeconomic policy : growth, stability and equity. Thus effective management
of public expenditure becomes the real challenge. The performance of the state
policy at the end of the day is measured only in terms of effectiveness of public
expenditure, efficiency of resource use and a responsive system. An attempt has,
therefore, been made in the next chapter to review and assess the public
expenditure management system in India.

74
Appendix 3.1
Statement A : Major Policy Initiatives by State Governments in 2000-01
States Fiscal Institutional Sectional1. Andhra Pradesh To identify performance
indicators to assess thequality of expenditurerestructuring. To alsocarry out the exercise ofZero Based Budgeting.
Strengtheninggovernance to ensureprovision of efficient andresponsive services tothe common manthrough streamlining ofsystems andprocedures.
Continuation of therestructuring of thepower sector bysetting up fourdistributioncompanies.
2. Arunachal Pradesh Sales tax levied for thefirst time, on five items.
Submission of the reportof State ResourceMobilization andEconomy Commission.
Focus on horticultureby preparing a macrolevel plan for theentire State.
3. Assam Proposed to introduceAssam Taxation(Settlement of Disputes)Bill to expeditecollections.
Proposed to constitutean ‘Assam InfrastructureDevelopment Fund’.
Thrust to be given tofarm mechanization.Inauguration of anExport PromotionIndustrial Park
4. Bihar Proposed to incorporatecodes to the sub headsin various accounts toavoid financialirregularities.
Proposed tocomputerize the revenuerecords.
Attempt to strengthenthe electricity andirrigation sectors withthe help of NABARD.
5. Goa Proposed to levy entrytax. Also proposed tolevy cess on milk fordairy development.
Strengthening ofdecentralization process.
Focus onenvironmentprotection through‘Green Goa-Fund’and ‘plasticscontainment fund’.
6. Gujarat Revision/introduction ofuser charges/fees byGovernmentdepartments.
Computerization of 10per cent of office work inGovernment.
Five milestones setup for HumanDevelopment Index.Set up an IndianInstitute ofInformationTechnology (I.I.I.T.)
7. Haryana Fiscal restructuringmeasures throughdownsizing theGovernment.
To set up an ‘EconomicDevelopment Board’under the Chief Minister.
Constitute a ‘HaryanaLive StockDevelopment Board’.
8. Himachal Pradesh White paper on fiscalposition and emergingfiscal scenario prepared.
Proposal for a 9-pointcharter to determine aworking plan for eachdepartment.
Focus on prioritizingthe upgradation offarm machinery.
9. Karnataka T ensure that theborrowing programmewould be confined topriority sectors and usedfor capital expenditures.Aboilition of 80 per centof vacant posts in thegovernment.
A public sectorrestructuring committeehas been set up to makerecommendationsregarding the future ofthe State’s PSUs.
Commissioning of aSoftware TechnologyPark. Setting up ofthe InfrastructureDevelopmentCorporation ofKarnataka andcontinuation of theinfrastructure cess.
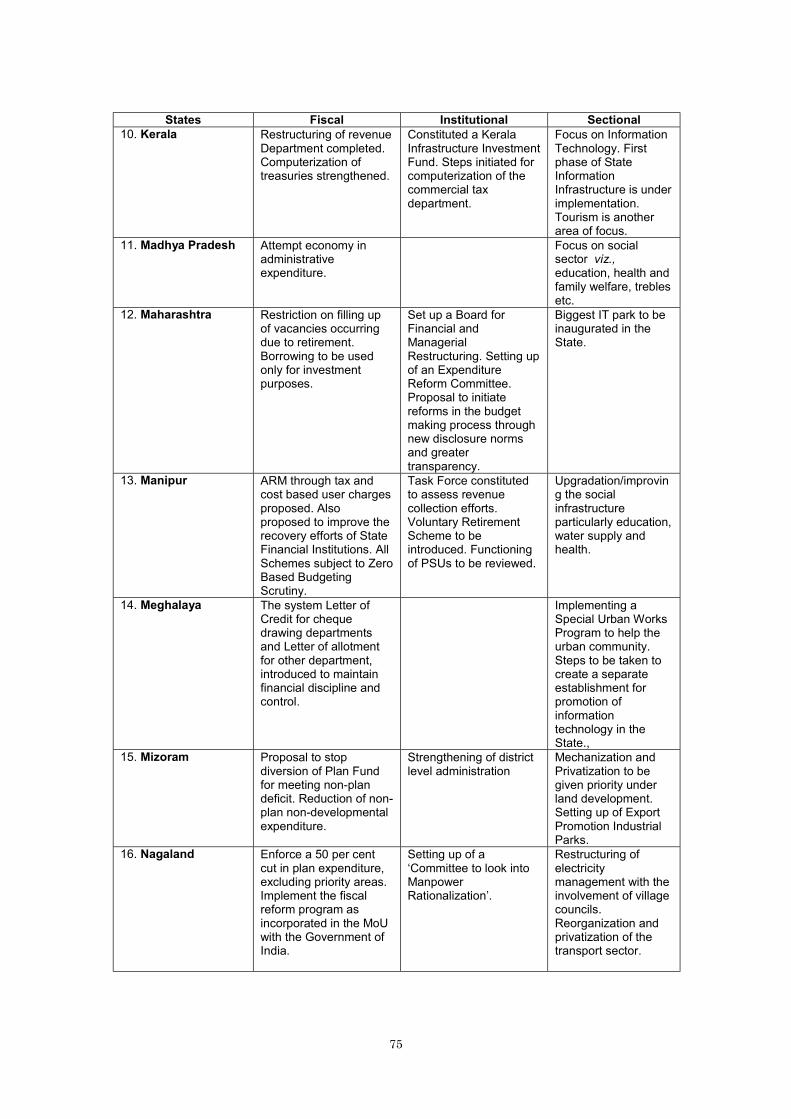
75
States Fiscal Institutional Sectional10. Kerala Restructuring of revenue
Department completed.Computerization oftreasuries strengthened.
Constituted a KeralaInfrastructure InvestmentFund. Steps initiated forcomputerization of thecommercial taxdepartment.
Focus on InformationTechnology. Firstphase of StateInformationInfrastructure is underimplementation.Tourism is anotherarea of focus.
11. Madhya Pradesh Attempt economy inadministrativeexpenditure.
Focus on socialsector viz.,education, health andfamily welfare, treblesetc.
12. Maharashtra Restriction on filling upof vacancies occurringdue to retirement.Borrowing to be usedonly for investmentpurposes.
Set up a Board forFinancial andManagerialRestructuring. Setting upof an ExpenditureReform Committee.Proposal to initiatereforms in the budgetmaking process throughnew disclosure normsand greatertransparency.
Biggest IT park to beinaugurated in theState.
13. Manipur ARM through tax andcost based user chargesproposed. Alsoproposed to improve therecovery efforts of StateFinancial Institutions. AllSchemes subject to ZeroBased BudgetingScrutiny.
Task Force constitutedto assess revenuecollection efforts.Voluntary RetirementScheme to beintroduced. Functioningof PSUs to be reviewed.
Upgradation/improving the socialinfrastructureparticularly education,water supply andhealth.
14. Meghalaya The system Letter ofCredit for chequedrawing departmentsand Letter of allotmentfor other department,introduced to maintainfinancial discipline andcontrol.
Implementing aSpecial Urban WorksProgram to help theurban community.Steps to be taken tocreate a separateestablishment forpromotion ofinformationtechnology in theState.,
15. Mizoram Proposal to stopdiversion of Plan Fundfor meeting non-plandeficit. Reduction of non-plan non-developmentalexpenditure.
Strengthening of districtlevel administration
Mechanization andPrivatization to begiven priority underland development.Setting up of ExportPromotion IndustrialParks.
16. Nagaland Enforce a 50 per centcut in plan expenditure,excluding priority areas.Implement the fiscalreform program asincorporated in the MoUwith the Government ofIndia.
Setting up of a‘Committee to look intoManpowerRationalization’.
Restructuring ofelectricitymanagement with theinvolvement of villagecouncils.Reorganization andprivatization of thetransport sector.
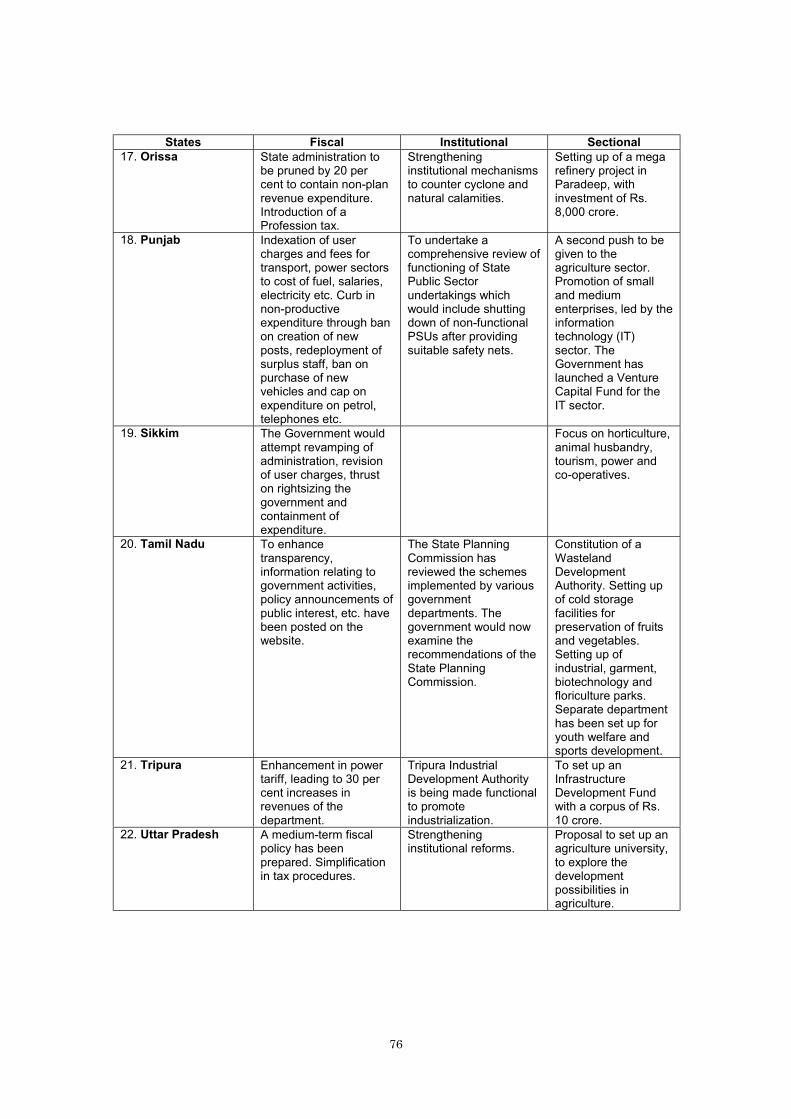
76
States Fiscal Institutional Sectional17. Orissa State administration to
be pruned by 20 percent to contain non-planrevenue expenditure.Introduction of aProfession tax.
Strengtheninginstitutional mechanismsto counter cyclone andnatural calamities.
Setting up of a megarefinery project inParadeep, withinvestment of Rs.8,000 crore.
18. Punjab Indexation of usercharges and fees fortransport, power sectorsto cost of fuel, salaries,electricity etc. Curb innon-productiveexpenditure through banon creation of newposts, redeployment ofsurplus staff, ban onpurchase of newvehicles and cap onexpenditure on petrol,telephones etc.
To undertake acomprehensive review offunctioning of StatePublic Sectorundertakings whichwould include shuttingdown of non-functionalPSUs after providingsuitable safety nets.
A second push to begiven to theagriculture sector.Promotion of smalland mediumenterprises, led by theinformationtechnology (IT)sector. TheGovernment haslaunched a VentureCapital Fund for theIT sector.
19. Sikkim The Government wouldattempt revamping ofadministration, revisionof user charges, thruston rightsizing thegovernment andcontainment ofexpenditure.
Focus on horticulture,animal husbandry,tourism, power andco-operatives.
20. Tamil Nadu To enhancetransparency,information relating togovernment activities,policy announcements ofpublic interest, etc. havebeen posted on thewebsite.
The State PlanningCommission hasreviewed the schemesimplemented by variousgovernmentdepartments. Thegovernment would nowexamine therecommendations of theState PlanningCommission.
Constitution of aWastelandDevelopmentAuthority. Setting upof cold storagefacilities forpreservation of fruitsand vegetables.Setting up ofindustrial, garment,biotechnology andfloriculture parks.Separate departmenthas been set up foryouth welfare andsports development.
21. Tripura Enhancement in powertariff, leading to 30 percent increases inrevenues of thedepartment.
Tripura IndustrialDevelopment Authorityis being made functionalto promoteindustrialization.
To set up anInfrastructureDevelopment Fundwith a corpus of Rs.10 crore.
22. Uttar Pradesh A medium-term fiscalpolicy has beenprepared. Simplificationin tax procedures.
Strengtheninginstitutional reforms.
Proposal to set up anagriculture university,to explore thedevelopmentpossibilities inagriculture.
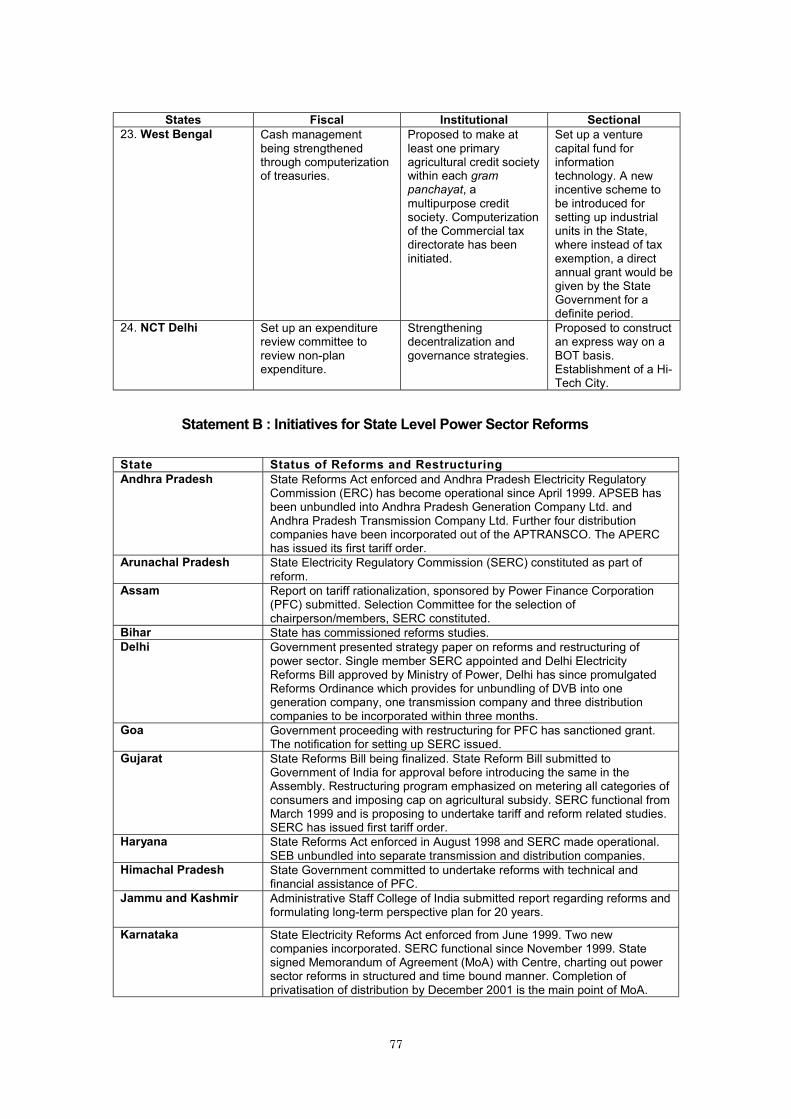
77
States Fiscal Institutional Sectional23. West Bengal Cash management
being strengthenedthrough computerizationof treasuries.
Proposed to make atleast one primaryagricultural credit societywithin each grampanchayat, amultipurpose creditsociety. Computerizationof the Commercial taxdirectorate has beeninitiated.
Set up a venturecapital fund forinformationtechnology. A newincentive scheme tobe introduced forsetting up industrialunits in the State,where instead of taxexemption, a directannual grant would begiven by the StateGovernment for adefinite period.
24. NCT Delhi Set up an expenditurereview committee toreview non-planexpenditure.
Strengtheningdecentralization andgovernance strategies.
Proposed to constructan express way on aBOT basis.Establishment of a Hi-Tech City.
Statement B : Initiatives for State Level Power Sector Reforms
State Status of Reforms and RestructuringAndhra Pradesh State Reforms Act enforced and Andhra Pradesh Electricity Regulatory
Commission (ERC) has become operational since April 1999. APSEB hasbeen unbundled into Andhra Pradesh Generation Company Ltd. andAndhra Pradesh Transmission Company Ltd. Further four distributioncompanies have been incorporated out of the APTRANSCO. The APERChas issued its first tariff order.
Arunachal Pradesh State Electricity Regulatory Commission (SERC) constituted as part ofreform.
Assam Report on tariff rationalization, sponsored by Power Finance Corporation(PFC) submitted. Selection Committee for the selection ofchairperson/members, SERC constituted.
Bihar State has commissioned reforms studies.Delhi Government presented strategy paper on reforms and restructuring of
power sector. Single member SERC appointed and Delhi ElectricityReforms Bill approved by Ministry of Power, Delhi has since promulgatedReforms Ordinance which provides for unbundling of DVB into onegeneration company, one transmission company and three distributioncompanies to be incorporated within three months.
Goa Government proceeding with restructuring for PFC has sanctioned grant.The notification for setting up SERC issued.
Gujarat State Reforms Bill being finalized. State Reform Bill submitted toGovernment of India for approval before introducing the same in theAssembly. Restructuring program emphasized on metering all categories ofconsumers and imposing cap on agricultural subsidy. SERC functional fromMarch 1999 and is proposing to undertake tariff and reform related studies.SERC has issued first tariff order.
Haryana State Reforms Act enforced in August 1998 and SERC made operational.SEB unbundled into separate transmission and distribution companies.
Himachal Pradesh State Government committed to undertake reforms with technical andfinancial assistance of PFC.
Jammu and Kashmir Administrative Staff College of India submitted report regarding reforms andformulating long-term perspective plan for 20 years.
Karnataka State Electricity Reforms Act enforced from June 1999. Two newcompanies incorporated. SERC functional since November 1999. Statesigned Memorandum of Agreement (MoA) with Centre, charting out powersector reforms in structured and time bound manner. Completion ofprivatisation of distribution by December 2001 is the main point of MoA.
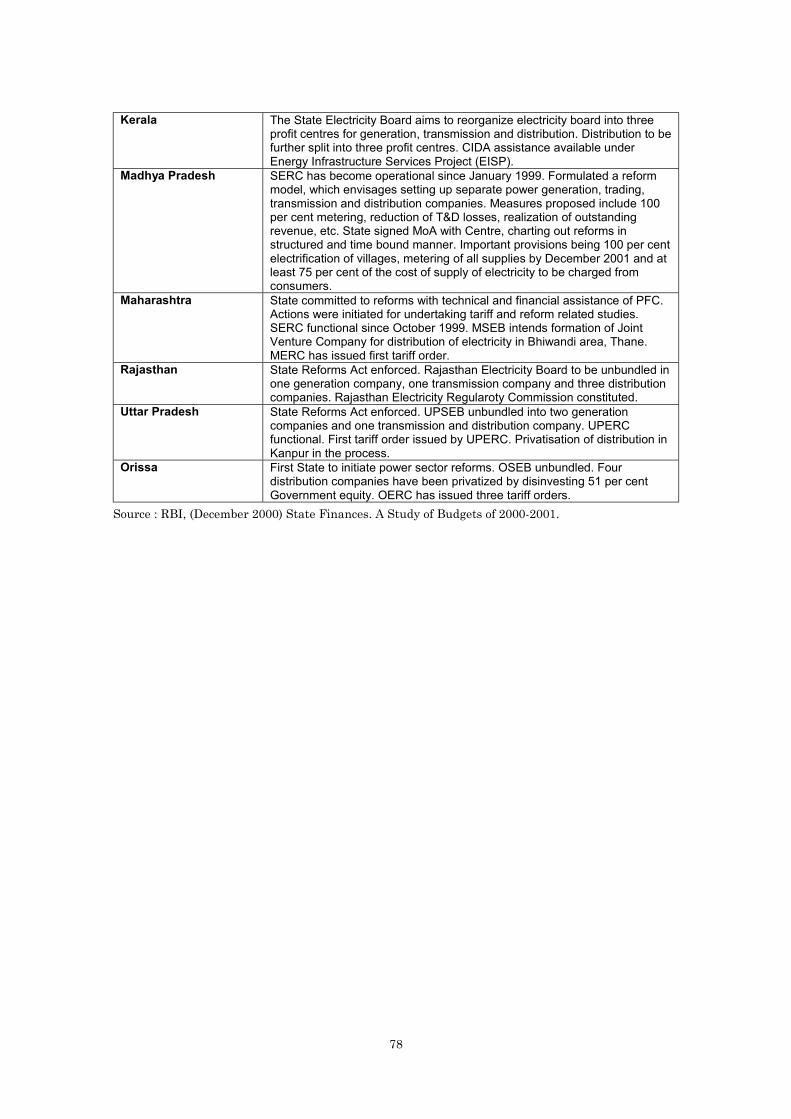
78
Kerala The State Electricity Board aims to reorganize electricity board into threeprofit centres for generation, transmission and distribution. Distribution to befurther split into three profit centres. CIDA assistance available underEnergy Infrastructure Services Project (EISP).
Madhya Pradesh SERC has become operational since January 1999. Formulated a reformmodel, which envisages setting up separate power generation, trading,transmission and distribution companies. Measures proposed include 100per cent metering, reduction of T&D losses, realization of outstandingrevenue, etc. State signed MoA with Centre, charting out reforms instructured and time bound manner. Important provisions being 100 per centelectrification of villages, metering of all supplies by December 2001 and atleast 75 per cent of the cost of supply of electricity to be charged fromconsumers.
Maharashtra State committed to reforms with technical and financial assistance of PFC.Actions were initiated for undertaking tariff and reform related studies.SERC functional since October 1999. MSEB intends formation of JointVenture Company for distribution of electricity in Bhiwandi area, Thane.MERC has issued first tariff order.
Rajasthan State Reforms Act enforced. Rajasthan Electricity Board to be unbundled inone generation company, one transmission company and three distributioncompanies. Rajasthan Electricity Regularoty Commission constituted.
Uttar Pradesh State Reforms Act enforced. UPSEB unbundled into two generationcompanies and one transmission and distribution company. UPERCfunctional. First tariff order issued by UPERC. Privatisation of distribution inKanpur in the process.
Orissa First State to initiate power sector reforms. OSEB unbundled. Fourdistribution companies have been privatized by disinvesting 51 per centGovernment equity. OERC has issued three tariff orders.
Source : RBI, (December 2000) State Finances. A Study of Budgets of 2000-2001.

79
Appendix 3.2 (a)Revenue and Expenditure of the Central Government
(As % of GDP - Old and New Series)
Item Average Average Average 1995-96 1996-97 1997-98 1998-99 1999-2000(1980-81 (1985- (1990- (RE)to 1984- 86 to 91 to
85) 1989- 1994-90 95)
Gross Tax Revenue 9.93 11.20 10.23 9.94 10.08 9.72 8.63 9.319.41 9.45 9.19 8.16 8.80
less State's & UT's Share 2.63 2.86 2.75 2.62 2.75 3.04 2.35 2.382.48 2.57 2.87 2.22 2.25
Net Tax Revenue 7.30 8.34 7.48 7.32 7.34 6.68 6.28 6.926.93 6.88 6.31 5.94 6.55
Non-Tax 2.13 2.77 2.57 2.52 2.55 2.67 2.69 2.902.39 2.39 2.52 2.54 2.75
Net Revenue Receipt 9.43 11.11 10.05 9.84 9.89 9.34 8.97 9.839.32 9.27 8.83 8.48 9.29
Revenue Expenditure 10.69 13.69 13.24 12.50 12.45 12.58 13.05 13.85of which 11.83 11.67 11.90 12.34 13.10Interest 2.20 3.38 4.37 4.47 4.66 4.58 4.67 5.01
4.23 4.37 4.33 4.42 4.73Defence 2.57 2.62 1.83 1.68 1.64 1.83 1.79 1.96
1.59 1.54 1.73 1.69 1.86Subsidies 1.41 1.95 1.77 1.20 1.28 1.36 1.49 1.41
1.13 1.20 1.29 1.41 1.33Pension 0.27 0.42 0.40 0.38 0.40 0.48 0.60 0.78
0.36 0.37 0.45 0.57 0.74
Grants to States 1.96 2.45 2.44 1.90 1.81 1.56 1.49 1.611.80 1.70 1.47 1.41 1.52
Non-Plan 0.41 0.57 0.52 0.54 0.48 0.29 0.24 0.330.51 0.45 0.27 0.23 0.31
Plan 1.55 1.88 1.92 1.36 1.34 1.27 1.25 1.281.29 1.25 1.20 1.18 1.21
Capital Expenditure 6.13 6.78 4.61 3.43 3.29 3.61 3.72 2.783.25 3.09 3.41 3.51 2.62
Revenue Deficit 1.11 2.58 3.20 2.66 2.56 3.24 4.08 4.032.52 2.40 3.06 3.85 3.81
Fiscal Deficit 6.41 8.21 6.67 5.38 5.23 6.21 6.80 5.965.10 4.90 5.87 6.43 5.64
Primary Deficit 4.21 4.83 2.30 0.91 0.57 1.63 2.13 0.960.86 0.53 1.54 2.01 0.90
Revenue Deficit as %Of fiscal deficit 17.25 31.44 47.96 49.35 48.93 52.23 59.91 67.52GDP at market prices(Old Series) 1118964 1276974 1432964 1666455 1826434GDP at market prices (New Series) 1181961 1361952 1515646 1762609 1931819
Source :Source :Source :Source : Report of the Eleventh Finance Commission, June 2000.Note :Note :Note :Note : (1) (-) indicates surplus and (+) indicates deficit.
(2) The figures in italics indicate ratios with respect to GDP at market prices (NewSeries).
(3) The GDP (Old Series) figures for the years 1997-98 to 1999-2000 have beenarrived at by applying the conversion factor 1.0577 on the New Series for therespective years.

80
Appendix 3.2 (b)Revenue and Expenditure of All States, consolidated
(As % of GDP - Old and New Series)
Item Average Average Average 1995-96 1996-97 1997-98 1998-99 1999-2000(1980-81 (1985- (1990- (RE)to 1984- 86 to 91 to
85) 1989- 1994-90 95)
Revenue Receipts 11.90 12.85 12.79 12.02 11.72 11.73 10.37 11.4911.38 10.99 11.09 9.80 10.86
of whichTax 5.18 5.67 5.64 5.52 5.37 5.46 5.16 5.70
5.23 5.04 5.17 4.87 5.38Non-Tax 2.14 2.02 1.97 2.05 1.84 1.75 1.44 1.47
1.94 1.72 1.65 1.36 1.39
Revenue Expenditure 11.47 13.16 13.51 12.79 13.15 13.02 13.09 14.6112.11 12.33 12.31 12.38 13.82
of whichInterest 0.99 1.42 1.83 1.89 2.01 2.10 2.13 2.40
1.79 1.88 1.98 2.01 2.27Pension 0.29 0.47 0.62 0.70 0.77 0.81 0.97 1.10
0.67 0.73 0.77 0.92 1.04
Capital Expenditure 3.79 3.21 2.57 2.29 2.01 2.20 1.97 2.062.17 1.89 2.08 1.87 1.95
Revenue Deficit -0.43 0.31 0.72 0.77 1.43 1.29 2.72 3.130.73 1.34 1.22 2.57 2.96
Fiscal Deficit 2.98 3.20 2.90 2.75 2.97 3.10 4.47 4.982.60 2.79 2.93 4.23 4.71
Primary Deficit 1.98 1.78 1.07 0.86 0.97 1.00 2.34 2.550.81 0.91 0.94 2.22 2.41
Revenue deficit as% of Fiscal Deficit 22.14 12.02 24.54 28.06 47.91 41.56 60.90 56.86
GDP at market prices(Old Series) 1118964 1276974 1432964 1666455 1826434GDP at market prices(New Series) 1181961 1361952 1515646 1762609 1931819
Figures in italics indicate ratios with respect to GDP (New Series).Source:Source:Source:Source: Report of the Eleventh Finance Commission, June, 2000.
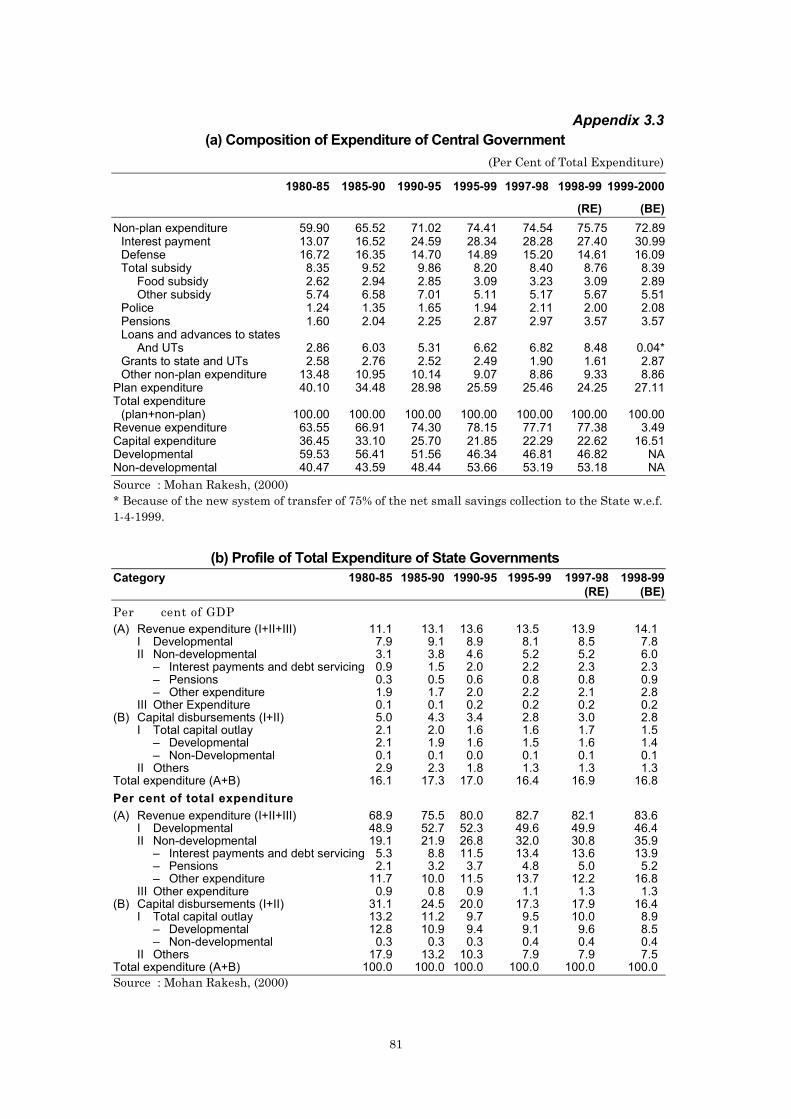
81
Appendix 3.3(a) Composition of Expenditure of Central Government
(Per Cent of Total Expenditure)
1980-85 1985-90 1990-95 1995-99 1997-98 1998-99 1999-2000
(RE) (BE)Non-plan expenditure 59.90 65.52 71.02 74.41 74.54 75.75 72.89
Interest payment 13.07 16.52 24.59 28.34 28.28 27.40 30.99Defense 16.72 16.35 14.70 14.89 15.20 14.61 16.09Total subsidy 8.35 9.52 9.86 8.20 8.40 8.76 8.39
Food subsidy 2.62 2.94 2.85 3.09 3.23 3.09 2.89Other subsidy 5.74 6.58 7.01 5.11 5.17 5.67 5.51
Police 1.24 1.35 1.65 1.94 2.11 2.00 2.08Pensions 1.60 2.04 2.25 2.87 2.97 3.57 3.57Loans and advances to states
And UTs 2.86 6.03 5.31 6.62 6.82 8.48 0.04*Grants to state and UTs 2.58 2.76 2.52 2.49 1.90 1.61 2.87Other non-plan expenditure 13.48 10.95 10.14 9.07 8.86 9.33 8.86
Plan expenditure 40.10 34.48 28.98 25.59 25.46 24.25 27.11Total expenditure
(plan+non-plan) 100.00 100.00 100.00 100.00 100.00 100.00 100.00Revenue expenditure 63.55 66.91 74.30 78.15 77.71 77.38 3.49Capital expenditure 36.45 33.10 25.70 21.85 22.29 22.62 16.51Developmental 59.53 56.41 51.56 46.34 46.81 46.82 NANon-developmental 40.47 43.59 48.44 53.66 53.19 53.18 NASource : Mohan Rakesh, (2000)* Because of the new system of transfer of 75% of the net small savings collection to the State w.e.f.1-4-1999.
(b) Profile of Total Expenditure of State GovernmentsCategory 1980-85 1985-90 1990-95 1995-99 1997-98 1998-99
(RE) (BE)Per cent of GDP(A) Revenue expenditure (I+II+III) 11.1 13.1 13.6 13.5 13.9 14.1
I Developmental 7.9 9.1 8.9 8.1 8.5 7.8II Non-developmental 3.1 3.8 4.6 5.2 5.2 6.0
– Interest payments and debt servicing 0.9 1.5 2.0 2.2 2.3 2.3– Pensions 0.3 0.5 0.6 0.8 0.8 0.9– Other expenditure 1.9 1.7 2.0 2.2 2.1 2.8
III Other Expenditure 0.1 0.1 0.2 0.2 0.2 0.2(B) Capital disbursements (I+II) 5.0 4.3 3.4 2.8 3.0 2.8
I Total capital outlay 2.1 2.0 1.6 1.6 1.7 1.5– Developmental 2.1 1.9 1.6 1.5 1.6 1.4– Non-Developmental 0.1 0.1 0.0 0.1 0.1 0.1
II Others 2.9 2.3 1.8 1.3 1.3 1.3Total expenditure (A+B) 16.1 17.3 17.0 16.4 16.9 16.8Per cent of total expenditure(A) Revenue expenditure (I+II+III) 68.9 75.5 80.0 82.7 82.1 83.6
I Developmental 48.9 52.7 52.3 49.6 49.9 46.4II Non-developmental 19.1 21.9 26.8 32.0 30.8 35.9
– Interest payments and debt servicing 5.3 8.8 11.5 13.4 13.6 13.9– Pensions 2.1 3.2 3.7 4.8 5.0 5.2– Other expenditure 11.7 10.0 11.5 13.7 12.2 16.8
III Other expenditure 0.9 0.8 0.9 1.1 1.3 1.3(B) Capital disbursements (I+II) 31.1 24.5 20.0 17.3 17.9 16.4
I Total capital outlay 13.2 11.2 9.7 9.5 10.0 8.9– Developmental 12.8 10.9 9.4 9.1 9.6 8.5– Non-developmental 0.3 0.3 0.3 0.4 0.4 0.4
II Others 17.9 13.2 10.3 7.9 7.9 7.5Total expenditure (A+B) 100.0 100.0 100.0 100.0 100.0 100.0Source : Mohan Rakesh, (2000)
82
Chapter Chapter Chapter Chapter ⅣⅣⅣⅣPublic Expenditure Management (Public Expenditure Management (Public Expenditure Management (Public Expenditure Management (PEM) in IndiaPEM) in IndiaPEM) in IndiaPEM) in India
4.14.14.14.1 IntroductionIntroductionIntroductionIntroduction
There are no two opinions on any Government's objective of removal of
poverty. Sustained growth of the economy is considered to be a necessary
condition to reduce poverty. Without macroeconomic stability sustained growth
cannot be achieved. And continuing high levels of fiscal deficits pose a serious
danger to macroeconomic stability. Fiscal deficits cannot be corrected without
effective and efficient public expenditure management (PEM). PEM therefore has
to be a central instrument of State policy and effective governance.
This chapter first traces the link between the ultimate objective of economic
policythat of removal of poverty and public expenditure management. Asgovernance encompasses PEM, the essentials of good governance and effective
PEM are highlighted. With the purpose of assessing effectiveness of PEM in India
a framework of PEM cycle is adopted. Each stage of the PEM is then assessed to
identify the tasks ahead. An alternate assessment of the budget and financial
management practices is also reviewed.
4.1.14.1.14.1.14.1.1 Growth and PovertyGrowth and PovertyGrowth and PovertyGrowth and Poverty
Latest research covering the period of 1980s and 1990s shows that, as in the
very long run, growth was a powerful force for reducing income poverty in
countries. On average, growth in consumption of the poorest fifth of the
population tracked economic growth one-for-one over this period. In the vast
majority of cases growth led to rising consumption in the poorest fifth of the
population, while economic decline led to falling consumption (WDR 2000-2001). A
large number of factors including initial conditions, institutional capacity, right
kind of economic policies including fiscal policy reflected in modulate budget
deficits and the absence of high inflation, education and life expectancy are
conducive to economic growth. The past few decades have yielded a rich crop of
lessons about the kind of economic policies that support development. Analysis of
these and other experiences consistently find a core set of policies that appear to
be essential for growth (WDR, 1997): providing macroeconomic stability; avoiding
price distortions; liberalizing trade and investment.
PEM as an instrument is indispensable to achieve the objectives of State
policy. Macroeconomic stability requires, among other things fiscal discipline i.e.expenditure control; growth and equity requires, among other things, optimal

83
allocation and efficient use of resources including allocation of public money
conducive to growth.
Box: 4.1Box: 4.1Box: 4.1Box: 4.1Fundamental tasks of a StateFundamental tasks of a StateFundamental tasks of a StateFundamental tasks of a State
Five fundamental tasksFive fundamental tasksFive fundamental tasksFive fundamental tasks lie at the core of every Government's mission, withoutwhich sustainable, shared, poverty reducing development is impossible:
• Establishing a foundation of law• Maintaining a non distortionary policy environment including macroeconomic
stability.• Investing in basic social services and infrastructure• Protecting the vulnerable• Protecting the environment
(World Development Report, 1997)
Macroeconomic stability could be endangered by high levels of fiscal deficits.
Substantial evidence exists that, in most cases, fiscal profligacy is the main factor
behind high inflation, increase in current account deficit (BOP) and finally
sluggish or negative negative negative negative output growth. High levels of government borrowing (to meet
revenue deficit in particular) can hamper growth of real economy by 'crowding out'
private investment. It generates upward pressure on interest rates and also
reduces the amount of funds available for the private sector investment. Besides
crowding out, the public sector investment/expenditure may provide less efficient
outcomes compared to the private sector. A recent result of an econometric
exercise (World Bank, 2000) for Indian economy has shown that the reduction in
the consolidated public sector deficit in the early years of 1990s was accompanied
by at least a one for one increase in corporate investment which was the engine of
three high growth years.
4.1.24.1.24.1.24.1.2 Governance and Governance and Governance and Governance and PEMPEMPEMPEM
Governance encompasses the methods that societies use to distribute power
and manage public resources and problems. It has been found that effective
Governance is often the "Missing Link" between national anti-poverty efforts and
poverty reduction. Even when a country tries to implement economic policies to
foster pro-poor growth and mount targeted poverty programs, inept or
unresponsive governance institutions can nullify the impact. (UNDP, 2000)

84
Box : 4.2Box : 4.2Box : 4.2Box : 4.2Governance and Control of Public MoneyGovernance and Control of Public MoneyGovernance and Control of Public MoneyGovernance and Control of Public Money
To govern govern govern govern, according to an old proverb, is to choose. The choiceschoiceschoiceschoices are conditioned bypolitical aspirations and governed by economic realities. Once choices are made,financial resources are allocatedallocatedallocatedallocated to achieve the underlying objectives. The choices andthe allocation of resources are predicated on the performanceperformanceperformanceperformance or the outcome to besecured. The key actions of choice, allocation, and performancechoice, allocation, and performancechoice, allocation, and performancechoice, allocation, and performance form the heartheartheartheart of theprocess of the control of public money.
(Premchand A., 2000)Of the World's 6 billion people, 2.98 billion-almost half live on less than $1 a
day, with 44 per cent living in South Asia. (WDR 2000-2001). And what the Asian
economies need? 'More than anything else, Asia's success in overcoming its social
challenge will depend on the quality of its governance. Good governance requires
adopting a policy framework that is responsive to the needs of the people. It also
means efficient and equitable public expenditure managementpublic expenditure managementpublic expenditure managementpublic expenditure management that results in
appropriate investments in human resources, physical infrastructure and social
protection.' (ADB 2000).
Box : 4.3Box : 4.3Box : 4.3Box : 4.3Good Governance and GrowthGood Governance and GrowthGood Governance and GrowthGood Governance and Growth
In a study to find the differences in performance among States (sub-nationallevels) in India, it is found that the overall policy environment and the quality ofgovernance are important factors determining the growth potential of a state.
'There are several ways in which good governance affects growth. First, it has adirect impact on the effectiveness with which developmental programs areimplemented….. Second, the quality of governance can help stimulate growth bymaking the policy environment more business friendly through deregulation, decontroland procedural simplification….. Third, the general conditions for law and order are areflection of the overall level of governance and are particularly important forstimulating private sector investment.
(Ahluwalia, Montek S., 2000)
It being an instrument of governance the well known 'four pillars' of
governance are relevant to PEM as well (ADB 1999). These are :
• Predictability :Predictability :Predictability :Predictability : Lack of it undermines strategic prioritization, makes it
hard for public officials to plan for the provision of services, is an
excellent alibi for non-performance to boot. This is needed as a signpost
to guide private sector decisions in production, marketing, investment.
• Transparency :Transparency :Transparency :Transparency : The IMF assembled in 1998 a 'code of Good Practices onFiscal Transparency' which covers : clarity of roles and responsibility;
public availability of information; open budget preparation, execution
and reporting; independent assurances of integrity.

85
• Participation : Participation : Participation : Participation : Needed for (i) sound formulation of expenditure
programs; (ii) involvement of external entities; (iii) monitoring of
operational efficiency and (iv) feedback.
• Accountability :Accountability :Accountability :Accountability : For use of public money and for the results of
spending it. All accountability must be for ‘‘‘‘performance'performance'performance'performance' defined as
'achievement of agreed results within the funding provided, without
diluting their quality and respecting the prevailing norms of due
process.’
4.24.24.24.2 PEM : Concept, Objectives and Dimensions.PEM : Concept, Objectives and Dimensions.PEM : Concept, Objectives and Dimensions.PEM : Concept, Objectives and Dimensions.
4.2.14.2.14.2.14.2.1 PEM : The ConceptPEM : The ConceptPEM : The ConceptPEM : The Concept
As already noted, Public Expenditure Management is an instrument of state
policy. It is part of the system of governance. There is a necessary distinction
between the expenditure policy question of 'what' is to be done, and the
expenditure management question of 'how' it is to be done. (ADB, 1999). Thus the
techniques required for formulation of expenditure policy are different from the
techniques of using PEM as an instrument to implement the policy. The
information and data requirement of PEM would be different from those required
for policy.
It also needs to be recognized that PEM in principle, is an analytical
framework that enables the state to diagnose and give prescriptions for remedial
measures for policy. PEM is not a panacea for mismanagement of macro-economy
and poor budget outcomes (JBIC, 2000).
Finally, there is no one-size-fit all PEM theory. It is only a technique. Like
any other technology from water pumps to agricultural fertilizers to construction
public expenditure 'technology' must be appropriate technology, in terms of (i)
local factor endowments, (ii) local institutions, and (iii) real local needs (ADB,
1999).
4.2.24.2.24.2.24.2.2 Objectives of Objectives of Objectives of Objectives of PEMPEMPEMPEM
Governments collect money from the public in variety of formstaxation,rate of services, sale of assets and borrowings. The public in turn expects the
provision of cost effective services, and more significantly, a prudent fiscal state of
the nation. With the changing role of government, experience of the use of PEM
technique in a large number of countries, and the ultimate purpose of state policy
in view the objectives of PEM illustrated in table 4.1 below, have a universality
about them (Premchand A. 2000).
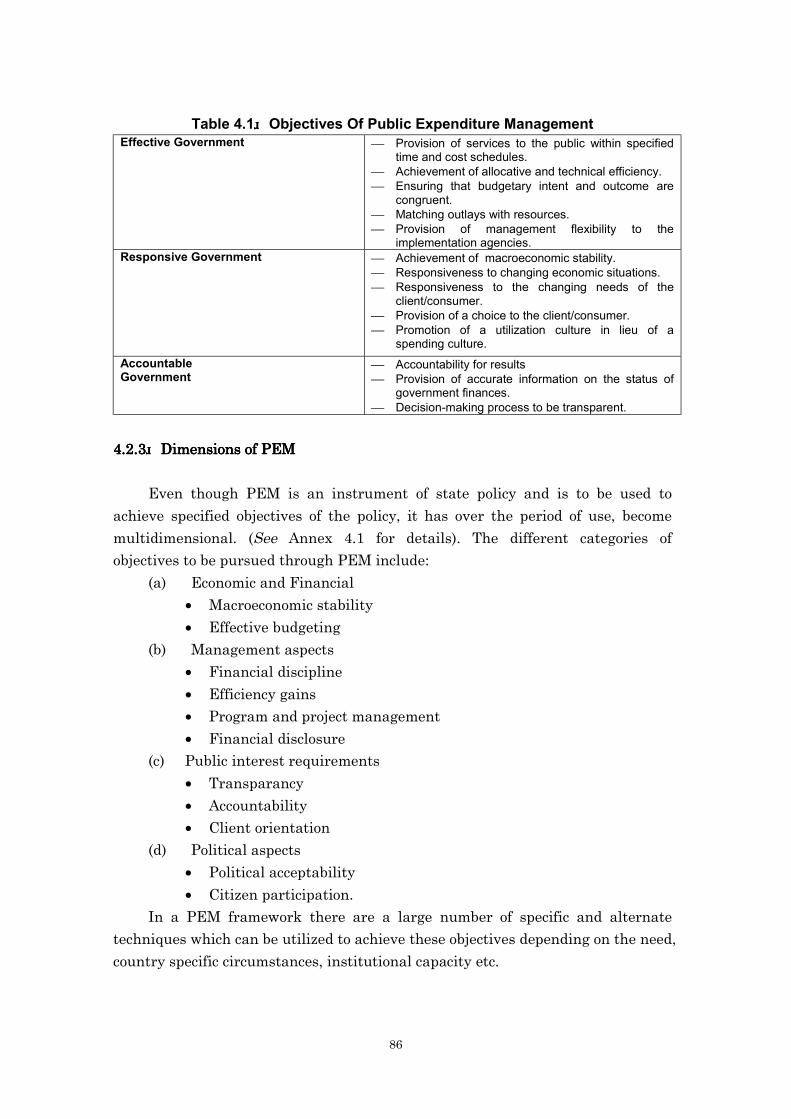
86
Table 4.1 Objectives Of Public Expenditure ManagementEffective Government Provision of services to the public within specified
time and cost schedules. Achievement of allocative and technical efficiency. Ensuring that budgetary intent and outcome are
congruent. Matching outlays with resources. Provision of management flexibility to the
implementation agencies.Responsive Government Achievement of macroeconomic stability.
Responsiveness to changing economic situations. Responsiveness to the changing needs of the
client/consumer. Provision of a choice to the client/consumer. Promotion of a utilization culture in lieu of a
spending culture.AccountableGovernment
Accountability for results Provision of accurate information on the status of
government finances. Decision-making process to be transparent.
4.2.34.2.34.2.34.2.3 Dimensions of Dimensions of Dimensions of Dimensions of PEMPEMPEMPEM
Even though PEM is an instrument of state policy and is to be used to
achieve specified objectives of the policy, it has over the period of use, become
multidimensional. (See Annex 4.1 for details). The different categories of
objectives to be pursued through PEM include:
(a) Economic and Financial
• Macroeconomic stability
• Effective budgeting
(b) Management aspects
• Financial discipline
• Efficiency gains
• Program and project management
• Financial disclosure(c) Public interest requirements
• Transparancy
• Accountability
• Client orientation
(d) Political aspects
• Political acceptability
• Citizen participation.
In a PEM framework there are a large number of specific and alternate
techniques which can be utilized to achieve these objectives depending on the need,
country specific circumstances, institutional capacity etc.
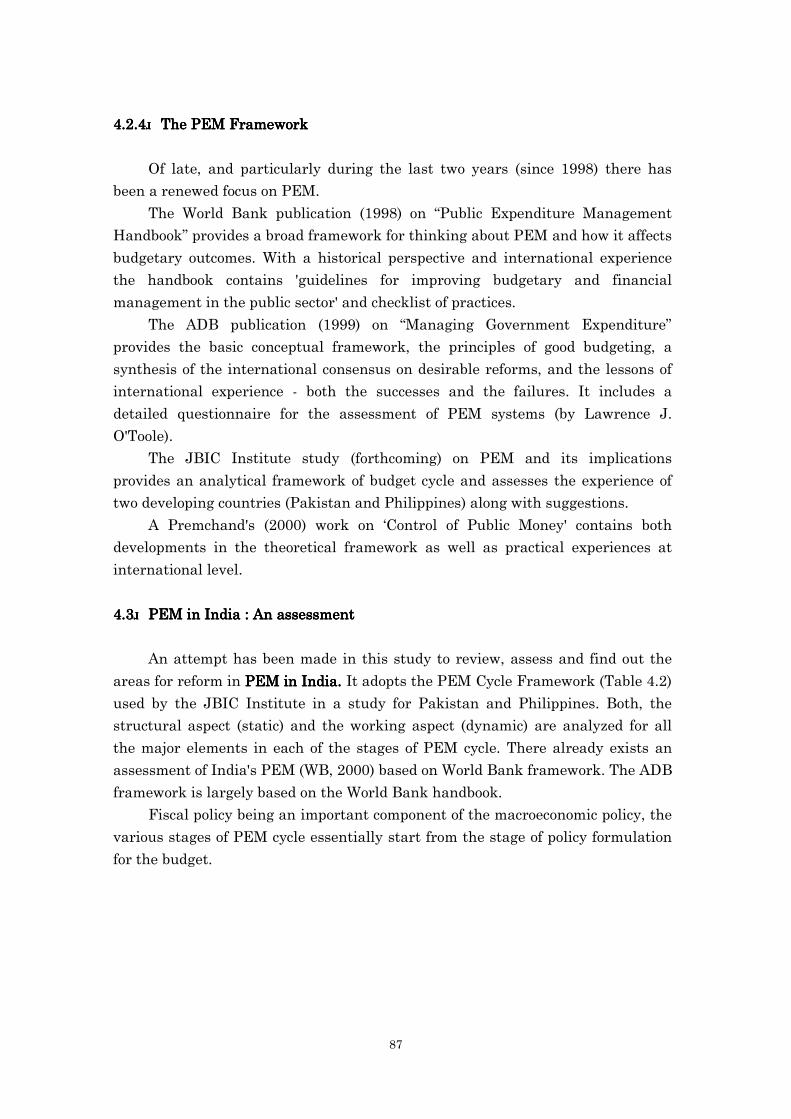
87
4.2.44.2.44.2.44.2.4 The The The The PEM FrameworkPEM FrameworkPEM FrameworkPEM Framework
Of late, and particularly during the last two years (since 1998) there has
been a renewed focus on PEM.
The World Bank publication (1998) on “Public Expenditure Management
Handbook” provides a broad framework for thinking about PEM and how it affects
budgetary outcomes. With a historical perspective and international experience
the handbook contains 'guidelines for improving budgetary and financial
management in the public sector' and checklist of practices.
The ADB publication (1999) on “Managing Government Expenditure”
provides the basic conceptual framework, the principles of good budgeting, a
synthesis of the international consensus on desirable reforms, and the lessons of
international experience - both the successes and the failures. It includes a
detailed questionnaire for the assessment of PEM systems (by Lawrence J.
O'Toole).
The JBIC Institute study (forthcoming) on PEM and its implications
provides an analytical framework of budget cycle and assesses the experience of
two developing countries (Pakistan and Philippines) along with suggestions.
A Premchand's (2000) work on ‘Control of Public Money' contains both
developments in the theoretical framework as well as practical experiences at
international level.
4.34.34.34.3 PEM in India : An assessmentPEM in India : An assessmentPEM in India : An assessmentPEM in India : An assessment
An attempt has been made in this study to review, assess and find out the
areas for reform in PEM in India. PEM in India. PEM in India. PEM in India. It adopts the PEM Cycle Framework (Table 4.2)
used by the JBIC Institute in a study for Pakistan and Philippines. Both, the
structural aspect (static) and the working aspect (dynamic) are analyzed for all
the major elements in each of the stages of PEM cycle. There already exists an
assessment of India's PEM (WB, 2000) based on World Bank framework. The ADB
framework is largely based on the World Bank handbook.
Fiscal policy being an important component of the macroeconomic policy, the
various stages of PEM cycle essentially start from the stage of policy formulation
for the budget.

88
Table 4.2 Stages and Elements in PEM cycle (JBIC framework)Stages of PEM Cycle Major Elements
Departure from Incremental "Line-Item Budgeting" to
"Activity-Based Budgeting" (Budget Projectization)From "Plan/Program/Activity" to
"Budgeting" "Costing" as a Base for PEM Cycle
(Costs Directization)
Internal Control SystemFrom "Budgeting" to "Execution"
Compliance Audit by External Auditors.
Financial Statements based on Generally Accepted
Public Accounting Standard
Performance StatementFrom "Execution" to "Evaluation"
Multi-Layered Performance Evaluation System
Internal Monitoring System of Feedback ActionFrom "Evaluation" to "Feedback"
Feedback Monitoring by External Auditors
For the purpose of assessing the PEM in India, the method adopted here is to
first view the system as it exists today, find the strengths and weaknesses of the
system and finally to identify the tasks ahead for each of the stages for each of the stages for each of the stages for each of the stages in the PEM
cycle.
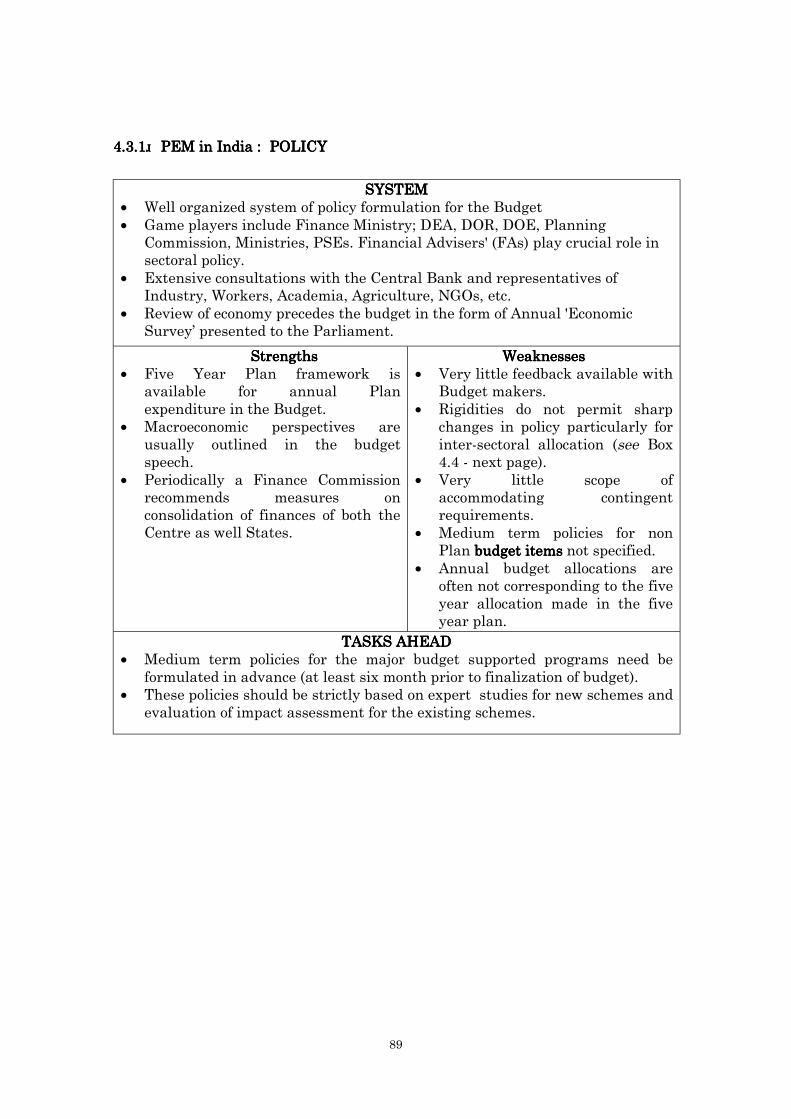
89
4.3.14.3.14.3.14.3.1 PEM in India : POLICYPEM in India : POLICYPEM in India : POLICYPEM in India : POLICY
SYSTEMSYSTEMSYSTEMSYSTEM• Well organized system of policy formulation for the Budget• Game players include Finance Ministry; DEA, DOR, DOE, Planning
Commission, Ministries, PSEs. Financial Advisers' (FAs) play crucial role insectoral policy.
• Extensive consultations with the Central Bank and representatives ofIndustry, Workers, Academia, Agriculture, NGOs, etc.
• Review of economy precedes the budget in the form of Annual 'EconomicSurvey’ presented to the Parliament.
StrengthsStrengthsStrengthsStrengths• Five Year Plan framework is
available for annual Planexpenditure in the Budget.
• Macroeconomic perspectives areusually outlined in the budgetspeech.
• Periodically a Finance Commissionrecommends measures onconsolidation of finances of both theCentre as well States.
WeaknessesWeaknessesWeaknessesWeaknesses• Very little feedback available with
Budget makers.• Rigidities do not permit sharp
changes in policy particularly forinter-sectoral allocation (see Box4.4 - next page).
• Very little scope ofaccommodating contingentrequirements.
• Medium term policies for nonPlan budget itemsbudget itemsbudget itemsbudget items not specified.
• Annual budget allocations areoften not corresponding to the fiveyear allocation made in the fiveyear plan.
TASKS AHEADTASKS AHEADTASKS AHEADTASKS AHEAD• Medium term policies for the major budget supported programs need be
formulated in advance (at least six month prior to finalization of budget).• These policies should be strictly based on expert studies for new schemes and
evaluation of impact assessment for the existing schemes.

90
Box 4.4Box 4.4Box 4.4Box 4.4 Rigidities in Budgetary AllocationsRigidities in Budgetary AllocationsRigidities in Budgetary AllocationsRigidities in Budgetary Allocations
(a)(a)(a)(a) Rigidities in Central Government ExpenditureRigidities in Central Government ExpenditureRigidities in Central Government ExpenditureRigidities in Central Government Expenditure"Over the years the composition of Central Government expenditure has
become highly rigid and prone to large, pre-committed increases. More than halfof the annual budget outlays are transfer payments. Interest payments, Defense,Internal Security, Major Subsidies, Salaries, Allowances and Pensions and non-plan grants to States account for about 95% of non-plan expenditure and about70% of total expenditure." (Finance Minster's Budget Speech while presentingCentral Government Budget for 2000-2001).
The following table brings out the items of expenditure accounting for about92 per cent of the total expenditure where significant reallocation in a year or twomay not be feasible without a medium term framework for the same.
2000-2001 BudgetRs. Billion Percent of TotalTotal Expenditure 3385 100.00
Interest Payments 1013 29.93Defense 586 17.31Subsidies 228 6.74Pension 158 4.67Police 67 1.98
(a) Sub-Total 2052 60.63Transfers to States(Loans + Grants)
544 16.07
Support for Central Plan 513 15.15(b) Sub-Total (Plan) 1057 31.32
(c) Sub Total (a) + (b) 3109 91.95(b) Rigidities of State Governments Expenditure(b) Rigidities of State Governments Expenditure(b) Rigidities of State Governments Expenditure(b) Rigidities of State Governments Expenditure
The Reserve Bank of India has a forum where Finance Secretaries of StateGovernments regularly meet to discuss the fiscal adjustment problems.
"In terms of managing the fiscal adjustment, the State Finance Secretarieshave articulated several issues. The main consensus expressed in the latest(Seventh) Conference can be summarized. The main fiscal problem is structuraland, solutions attempted are incremental and consequently their major pre-occupation is how to pay the each day's bills. They argued, that whenever fiscaladjustment is attempted, there is a cut, in non-committed expenditure but not innon-essential one. A predominant part of the budget is committed expenditure,A predominant part of the budget is committed expenditure,A predominant part of the budget is committed expenditure,A predominant part of the budget is committed expenditure,especially interest, pensions, and salaries, which has no flexibility. especially interest, pensions, and salaries, which has no flexibility. especially interest, pensions, and salaries, which has no flexibility. especially interest, pensions, and salaries, which has no flexibility. As aconsequence, there is often an atrophy of delivery of services in as much as theremay be hospitals manned by doctors and nurses but no medicines, electricity orwater supply. Grants to several institutions performing vital services are oftenpostponed or reduced on account of fiscal adjustment. They apprehend that cuts inoutput tend to be highly disproportional to cuts in expenditure makingexpenditure cuts of non-committed items highly unproductive, thus underminingthe reform process. Some of the Secretaries also questioned the efficacy ofincreasing social expenditures on the ground that opening of new schools oftenmeant only appointed of new teachers who do not turn up in schools in any case. Afew felt that efficacy of social expenditures can be improve by decentralizationwhile a others advocated contract employment of teachers instead of life-timeemployment. There was virtual unanimity among the State Finance SecretariesThere was virtual unanimity among the State Finance SecretariesThere was virtual unanimity among the State Finance SecretariesThere was virtual unanimity among the State Finance Secretariesthat the structural problems underlying fiscal situation in the States cannot bethat the structural problems underlying fiscal situation in the States cannot bethat the structural problems underlying fiscal situation in the States cannot bethat the structural problems underlying fiscal situation in the States cannot besolved unless the issue of high committed expenditures is resolved. solved unless the issue of high committed expenditures is resolved. solved unless the issue of high committed expenditures is resolved. solved unless the issue of high committed expenditures is resolved. There was alsoa consensus that the fiscal problem is not State specific but an all-Indiaphenomenon, often a result of policies of the Central Government such as in payhikes and, solutions would warrant initiatives by and setting an example by theUnion Government."
Source : Reddy Y.V. (2000, Nov.) Fiscal Reforms at State-level : Review andProspects. India States Reforms Forum, 2000.

91
4.3.24.3.24.3.24.3.2 PEM in India : PLAN/PROGRAM/ACTIVITYPEM in India : PLAN/PROGRAM/ACTIVITYPEM in India : PLAN/PROGRAM/ACTIVITYPEM in India : PLAN/PROGRAM/ACTIVITY
SYSTEMSYSTEMSYSTEMSYSTEM• Budget estimates for next years' proposals and current years' revised
estimates are sought from Ministries well in advance (six months).• Specific guidelines are given while seeking information on budget estimates.• A system of scrutiny at Financial Adviser's (FA) level in the line Ministry.• Scrutiny, review and discussion in the Deptt. of Expenditure (DoE).• Finalization of Plan expenditure after review and discussions in the Planning
Commission• A pre-structured investment decision making process exists.
StrengthsStrengthsStrengthsStrengths• Overall ceilings are conveyed by the
DOExp to Financial Advisers for non-plan expenditure.
• Ceiling limit for budget support forPlan expenditure is conveyed to thePlanning Commission.
• Allocation for programs are made bythe Ministries after discussions withthe Planning Commission whichindicate sectoral ceiling.
• Resources and investment plans ofPSEs are estimated jointly by theMinistry, PSEs, PC and DOE.
• Investment decision making processfollowed strictly in accordance withwell laid down guidelines.
WeaknessesWeaknessesWeaknessesWeaknesses• Large part of the non-plan
expenditure escapes activity-wisescrutiny.
• Absolute lack of cost (value forAbsolute lack of cost (value forAbsolute lack of cost (value forAbsolute lack of cost (value formoney) consciousness.money) consciousness.money) consciousness.money) consciousness.
• No medium term perspective forthe continuing activities andallocations for the same
• Lack of information on macroLack of information on macroLack of information on macroLack of information on macropolicy thrustpolicy thrustpolicy thrustpolicy thrust at the level wherebudget estimates are prepared.
• Most spending authorities do notundertake any meaningfulexercise to review the need forcontinuing the activity.
• Lack of feedback, performanceresults, information etc.
TASKS AHEADTASKS AHEADTASKS AHEADTASKS AHEAD• Macro policy framework and performance feedback needs to be indicated in
advance to those who are supposed to prepare activity-wise budget estimates.• Activity-wise allocations particularly on non-plan expenditure items need to
be discussed in necessary detail.• Initiate, develop and insist on cost consciousness for each majorInitiate, develop and insist on cost consciousness for each majorInitiate, develop and insist on cost consciousness for each majorInitiate, develop and insist on cost consciousness for each major
activity/program.activity/program.activity/program.activity/program.• Discuss and explore 'least-cost options' with beneficiaries/target groups andDiscuss and explore 'least-cost options' with beneficiaries/target groups andDiscuss and explore 'least-cost options' with beneficiaries/target groups andDiscuss and explore 'least-cost options' with beneficiaries/target groups and
professionals.professionals.professionals.professionals.• Integrate thinly spread activities for achieving the same objectives.
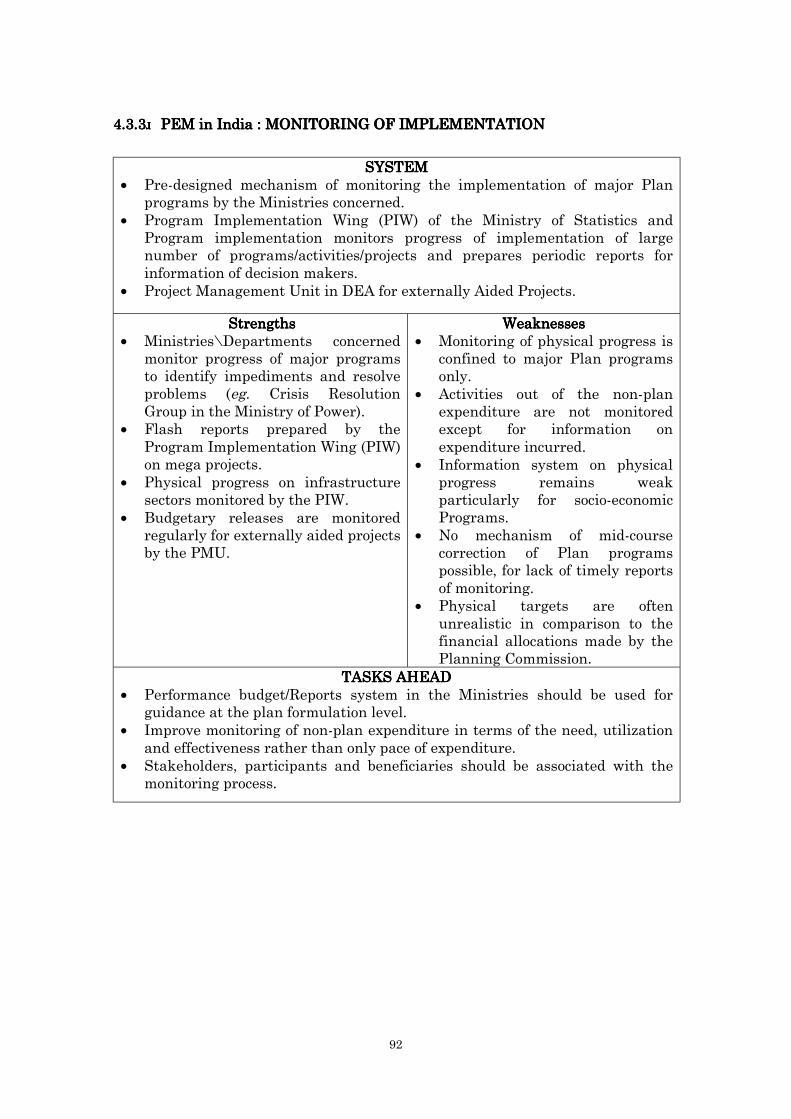
92
4.3.34.3.34.3.34.3.3 PEM in India : MONITORING OF IMPLEMENTATIONPEM in India : MONITORING OF IMPLEMENTATIONPEM in India : MONITORING OF IMPLEMENTATIONPEM in India : MONITORING OF IMPLEMENTATION
SYSTEMSYSTEMSYSTEMSYSTEM• Pre-designed mechanism of monitoring the implementation of major Plan
programs by the Ministries concerned.• Program Implementation Wing (PIW) of the Ministry of Statistics and
Program implementation monitors progress of implementation of largenumber of programs/activities/projects and prepares periodic reports forinformation of decision makers.
• Project Management Unit in DEA for externally Aided Projects.
StrengthsStrengthsStrengthsStrengths• Ministries\Departments concerned
monitor progress of major programsto identify impediments and resolveproblems (eg. Crisis ResolutionGroup in the Ministry of Power).
• Flash reports prepared by theProgram Implementation Wing (PIW)on mega projects.
• Physical progress on infrastructuresectors monitored by the PIW.
• Budgetary releases are monitoredregularly for externally aided projectsby the PMU.
WeaknessesWeaknessesWeaknessesWeaknesses• Monitoring of physical progress is
confined to major Plan programsonly.
• Activities out of the non-planexpenditure are not monitoredexcept for information onexpenditure incurred.
• Information system on physicalprogress remains weakparticularly for socio-economicPrograms.
• No mechanism of mid-coursecorrection of Plan programspossible, for lack of timely reportsof monitoring.
• Physical targets are oftenunrealistic in comparison to thefinancial allocations made by thePlanning Commission.
TASKS AHEADTASKS AHEADTASKS AHEADTASKS AHEAD• Performance budget/Reports system in the Ministries should be used for
guidance at the plan formulation level.• Improve monitoring of non-plan expenditure in terms of the need, utilization
and effectiveness rather than only pace of expenditure.• Stakeholders, participants and beneficiaries should be associated with the
monitoring process.
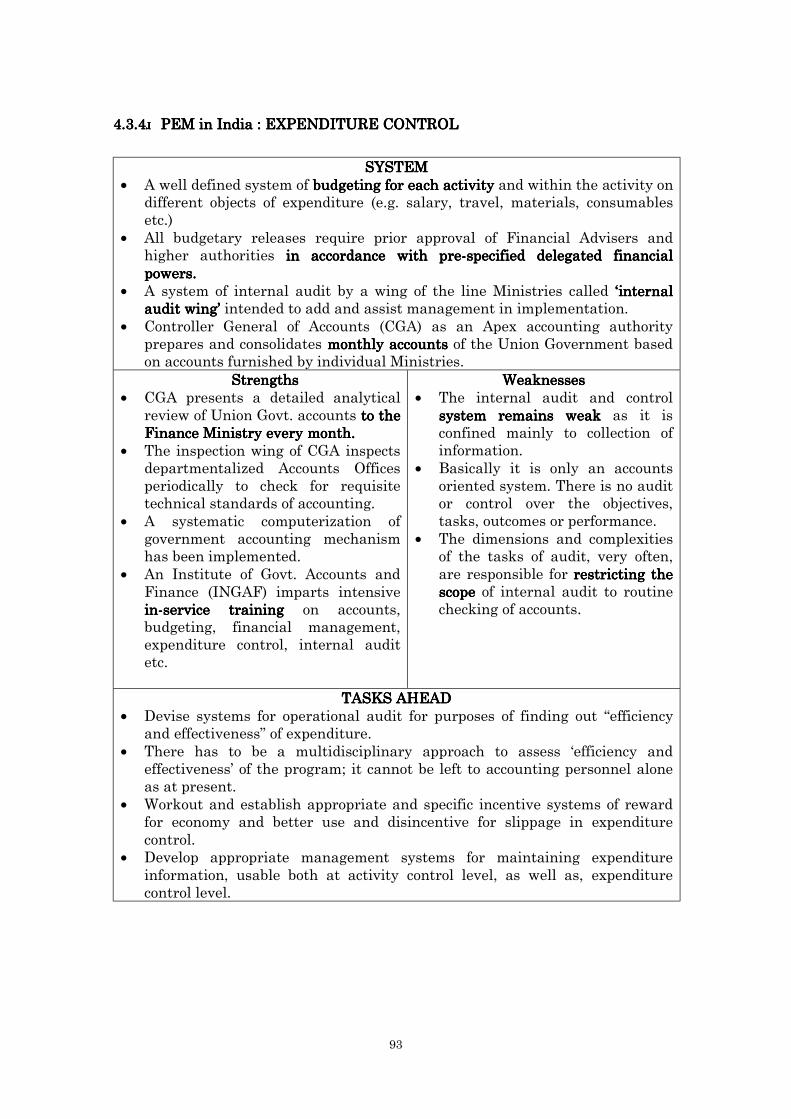
93
4.3.44.3.44.3.44.3.4 PEM in India : PEM in India : PEM in India : PEM in India : EXPENDITURE CONTROLEXPENDITURE CONTROLEXPENDITURE CONTROLEXPENDITURE CONTROL
SYSTEMSYSTEMSYSTEMSYSTEM• A well defined system of budgeting for each activitybudgeting for each activitybudgeting for each activitybudgeting for each activity and within the activity on
different objects of expenditure (e.g. salary, travel, materials, consumablesetc.)
• All budgetary releases require prior approval of Financial Advisers andhigher authorities in accordance with pre-specified delegated financialin accordance with pre-specified delegated financialin accordance with pre-specified delegated financialin accordance with pre-specified delegated financialpowers.powers.powers.powers.
• A system of internal audit by a wing of the line Ministries called ‘‘‘‘internalinternalinternalinternalaudit wingaudit wingaudit wingaudit wing’’’’ intended to add and assist management in implementation.
• Controller General of Accounts (CGA) as an Apex accounting authorityprepares and consolidates monthly accountsmonthly accountsmonthly accountsmonthly accounts of the Union Government basedon accounts furnished by individual Ministries.
StrengthsStrengthsStrengthsStrengths• CGA presents a detailed analytical
review of Union Govt. accounts to theto theto theto theFinance Ministry every month.Finance Ministry every month.Finance Ministry every month.Finance Ministry every month.
• The inspection wing of CGA inspectsdepartmentalized Accounts Officesperiodically to check for requisitetechnical standards of accounting.
• A systematic computerization ofgovernment accounting mechanismhas been implemented.
• An Institute of Govt. Accounts andFinance (INGAF) imparts intensivein-service trainingin-service trainingin-service trainingin-service training on accounts,budgeting, financial management,expenditure control, internal auditetc.
WeaknessesWeaknessesWeaknessesWeaknesses• The internal audit and control
system remains weaksystem remains weaksystem remains weaksystem remains weak as it isconfined mainly to collection ofinformation.
• Basically it is only an accountsoriented system. There is no auditor control over the objectives,tasks, outcomes or performance.
• The dimensions and complexitiesof the tasks of audit, very often,are responsible for restricting therestricting therestricting therestricting thescopescopescopescope of internal audit to routinechecking of accounts.
TASKS AHEADTASKS AHEADTASKS AHEADTASKS AHEAD• Devise systems for operational audit for purposes of finding out “efficiency
and effectiveness” of expenditure.• There has to be a multidisciplinary approach to assess ‘efficiency and
effectiveness’ of the program; it cannot be left to accounting personnel aloneas at present.
• Workout and establish appropriate and specific incentive systems of rewardfor economy and better use and disincentive for slippage in expenditurecontrol.
• Develop appropriate management systems for maintaining expenditureinformation, usable both at activity control level, as well as, expenditurecontrol level.
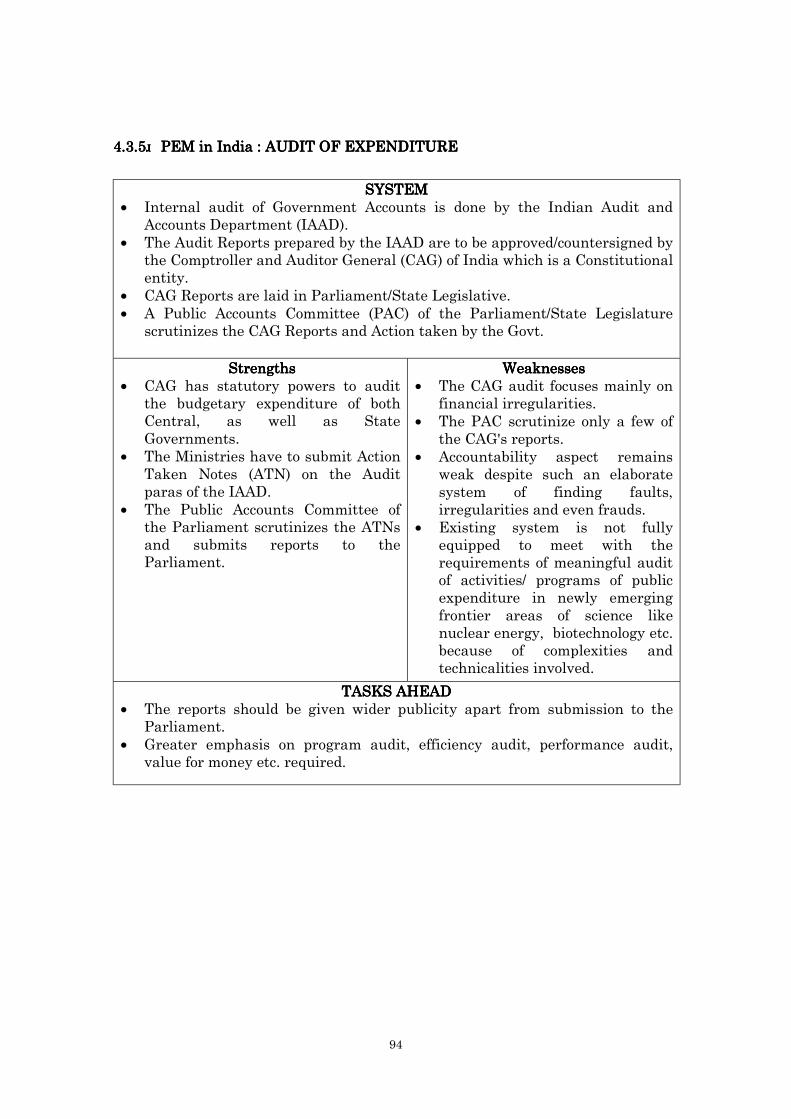
94
4.3.54.3.54.3.54.3.5 PEM in India : PEM in India : PEM in India : PEM in India : AUDIT OF EXPENDITUREAUDIT OF EXPENDITUREAUDIT OF EXPENDITUREAUDIT OF EXPENDITURE
SYSTEMSYSTEMSYSTEMSYSTEM• Internal audit of Government Accounts is done by the Indian Audit and
Accounts Department (IAAD).• The Audit Reports prepared by the IAAD are to be approved/countersigned by
the Comptroller and Auditor General (CAG) of India which is a Constitutionalentity.
• CAG Reports are laid in Parliament/State Legislative.• A Public Accounts Committee (PAC) of the Parliament/State Legislature
scrutinizes the CAG Reports and Action taken by the Govt.
StrengthsStrengthsStrengthsStrengths• CAG has statutory powers to audit
the budgetary expenditure of bothCentral, as well as StateGovernments.
• The Ministries have to submit ActionTaken Notes (ATN) on the Auditparas of the IAAD.
• The Public Accounts Committee ofthe Parliament scrutinizes the ATNsand submits reports to theParliament.
WeaknessesWeaknessesWeaknessesWeaknesses• The CAG audit focuses mainly on
financial irregularities.• The PAC scrutinize only a few of
the CAG's reports.• Accountability aspect remains
weak despite such an elaboratesystem of finding faults,irregularities and even frauds.
• Existing system is not fullyequipped to meet with therequirements of meaningful auditof activities/ programs of publicexpenditure in newly emergingfrontier areas of science likenuclear energy, biotechnology etc.because of complexities andtechnicalities involved.
TASKS AHEADTASKS AHEADTASKS AHEADTASKS AHEAD• The reports should be given wider publicity apart from submission to the
Parliament.• Greater emphasis on program audit, efficiency audit, performance audit,
value for money etc. required.

95
4.3.6 4.3.6 4.3.6 4.3.6 PEM in India : PEM in India : PEM in India : PEM in India : EVALUATIONEVALUATIONEVALUATIONEVALUATION
SYSTEMSYSTEMSYSTEMSYSTEM• As an integral part of the Planning Commission, Government of India,
Program Evaluation Organization (PEO) evaluates plan programs.• There exists a pre-designed built in system for evaluation of the
programs/projects which are financed through external assistance/donoragencies. World Bank, JBIC and other donors evaluate their financedprograms independently.
• Some of the programs are got evaluated by the government through externalagencies/institutions (by giving grants).
StrengthsStrengthsStrengthsStrengths• PEO is a well established
organization (since 1952) and hasproduced 177 evaluation reports.
• PEO can be assigned any specificevaluation study by the Ministries orthe Planning Commission.
WeaknessesWeaknessesWeaknessesWeaknesses• There is no regular mechanism for
evaluating all the programs/schemes in a time bound manner.
• The focus of the evaluationstudies has been only on findingthe constraints in implementationand general impact.
• Most evaluation reports lack focuson 3Es (Economy, Efficiency andEffectiveness) aspects of theexpenditure.
• Lack of professionalism andexpertise of the evaluators.
TASKS AHEADTASKS AHEADTASKS AHEADTASKS AHEAD• The focus of the evaluation studies has to be on 3Es.• There has to be a consistency in evaluation studies in terms of a time bound
schedule for all the major Program/schemes.• Stakeholders, participants and beneficiaries of the programs should be closely
associated with evaluation study.• Encourage independent third party evaluation mechanisms on the pattern of
donor financed projects.• Adequate expertise and professionalism is required in the evaluation studies.

96
4.3.74.3.74.3.74.3.7 PEM in India : PEM in India : PEM in India : PEM in India : FEEDBACKFEEDBACKFEEDBACKFEEDBACK
SYSTEMSYSTEMSYSTEMSYSTEM• Of late evaluation studies of PEO are being published and are now beingbeingbeingbeing put
on Internet System as well.• The Ninth Five Year Plan Document (Vol. I) has taken stock of evaluation
studies for charting out the strategy for the Plan• For the first time the Annual Plan (1999-2000) includes brief review of some
of the recent evaluation reports.• Some of the Evaluation studies got done from outside agencies are being
published by the Govt. (Study on subsidies by NIPFP).
StrengthsStrengthsStrengthsStrengths• There is an increased reporting and
awareness of evaluation reports, bothwithin the government and outside.
• Corrective actions in the schemesbased on evaluation studies arevisible in the Plan document.
• Donor agencies are now increasinglyusing the evaluation results forformulation of plans of assistance tospecific sectors.
WeaknessesWeaknessesWeaknessesWeaknesses• A large number of major
programs/schemes continue to befinanced despite some majorweakness because either therehas not been any evaluation at allor the non availability ofevaluation reports in time.
• There are no visible lessons learntin improving economy andefficiency in implementation ofmost of the programs/schemes.
TASKS AHEADTASKS AHEADTASKS AHEADTASKS AHEAD• The demand on specified evaluation studies should emerge from policy
makers in the budgetary process.• The economy aspects of evaluation studies must reflect in the budgetary
allocation.

97
4.3.84.3.84.3.84.3.8 Substantiating the assessmentSubstantiating the assessmentSubstantiating the assessmentSubstantiating the assessment
The assessment made for each stage of PEM cycle in the preceding section of
this chapter can well be substantiated with a large number of specific activities,
programs, schemes being financed through the budgetary expenditure of the
Central as well as state governments. A large number of official evaluation
reports, academic and research studies and finally the CAG reports have
specifically proved the weakness in the system of public expenditure management
in India. The examples can be multiplied. A positive development is that theA positive development is that theA positive development is that theA positive development is that the
Planning Commission has taken a serious view of these reports and have not onlyPlanning Commission has taken a serious view of these reports and have not onlyPlanning Commission has taken a serious view of these reports and have not onlyPlanning Commission has taken a serious view of these reports and have not only
started incorporating these reports in the Plan documents but also have initiatedstarted incorporating these reports in the Plan documents but also have initiatedstarted incorporating these reports in the Plan documents but also have initiatedstarted incorporating these reports in the Plan documents but also have initiated
corrective measures.corrective measures.corrective measures.corrective measures.
Following are a few excerpts from the most authentic document on 'Mid-
Term Appraisal of the Ninth Five Year Plan, 1992-97 (PC 2000, Oct.) from the
Planning Commission, Government of India to illustrate the weaknesses of the
PEM system as identified for different stages in the preceding sections of this
Chapter.
Policy :Policy :Policy :Policy :
• Policies and budgetary provisions, despite the rhetoric, have not beenPolicies and budgetary provisions, despite the rhetoric, have not beenPolicies and budgetary provisions, despite the rhetoric, have not beenPolicies and budgetary provisions, despite the rhetoric, have not beenintegrated so far.integrated so far.integrated so far.integrated so far. They sometimes run on parallel tracks. On lesser-known
reason of this isolation is that development and planning in India are
associated with spending of money. That Planning = Expenditure =
Development is the mindset behind such beliefs. Changes in policy or laws, are
not seen as an integral part of the development process because these have no
direct financial implications. The Indian planner, unfortunately, has still toThe Indian planner, unfortunately, has still toThe Indian planner, unfortunately, has still toThe Indian planner, unfortunately, has still to
understand the difference between planning and budgeting.understand the difference between planning and budgeting.understand the difference between planning and budgeting.understand the difference between planning and budgeting. (emphasis added)
Planning Commission, 2000 Oct. p. 490.
• The policy approach to agriculture, particularly in the 1990s, has been more toThe policy approach to agriculture, particularly in the 1990s, has been more toThe policy approach to agriculture, particularly in the 1990s, has been more toThe policy approach to agriculture, particularly in the 1990s, has been more to
secure increased production through subsidies in inputs such as power, watersecure increased production through subsidies in inputs such as power, watersecure increased production through subsidies in inputs such as power, watersecure increased production through subsidies in inputs such as power, water
and fertilizer, rather than through building new capital assets in irrigationand fertilizer, rather than through building new capital assets in irrigationand fertilizer, rather than through building new capital assets in irrigationand fertilizer, rather than through building new capital assets in irrigation
and power.and power.and power.and power. This has reduced the pace and pattern of technological change in
agriculture and effected TFP (total factor productivity) adversely….. The fiscal
problems of the central and state governments suggest that the subsidies
cannot continue to grow, and the stock of rural productive assets and
technological basis for growth will be limited by the past pattern of spending,
unless low cost options are pursued, which have a higher capital-output ratio.
(ibid, page 56)
Plan/Plan/Plan/Plan/Programme/Activities:Programme/Activities:Programme/Activities:Programme/Activities:
Though a rigorous procedure has been in place for introducing new Centrally
sponsored Scheme (CSS), there is a proliferation of there is a proliferation of there is a proliferation of there is a proliferation of CSS which could not be keptCSS which could not be keptCSS which could not be keptCSS which could not be kept

98
in check.in check.in check.in check. Following a direction from the National Development Council, several
CSS schemes were sought to be transferred to the states. In February 1999 the
Planning Commission prepared a list of such schemes with an outlay of Rs. 3,709
crore annually for handing them over to the states. But Central Ministries have
been reluctant to fall in line, and as of July 2000 they have agreed to give up
schemes worth only Rs. 163 crore and transfer them to the states. In the
meanwhile several new CSS have been introduced in the last two years….
Schemes like 'National Reconstruction Corps' (1999) and 'Annapurna' (1999),
which were brought in midway, duplicate ongoing schemes, yet they get
introduced as new schemes on non-economic considerations. (ibid, page 485, 486)
Monitoring and ImplementationMonitoring and ImplementationMonitoring and ImplementationMonitoring and Implementation
The reasons for poor implementation of Centrally Sponsored Schemes are
many, such as:
• There are too many schemes to be monitored.There are too many schemes to be monitored.There are too many schemes to be monitored.There are too many schemes to be monitored. The Department of
Agriculture has for instance about 150 Centrally Sponsored Schemes.
The number could be curtailed so that systems for effective monitoring
can be developed.
• There is unwillingness to accept poor performance,There is unwillingness to accept poor performance,There is unwillingness to accept poor performance,There is unwillingness to accept poor performance, for fear of being
questioned by Parliament or adverse press publicity. In the process,
shortcomings are concealed and independent evaluation is not
encouraged. Since weaknesses are not highlighted, no corrective action
is taken to set them right.
• Capacity to do monitoring is limited, and often does not exist.Capacity to do monitoring is limited, and often does not exist.Capacity to do monitoring is limited, and often does not exist.Capacity to do monitoring is limited, and often does not exist. Thus
there is neither will nor capability for the task.
• Since schemes are implemented by the states, sensitivity associated
with centre-state relations often precludes the Centre from asking
embarrassing questions or makes it go slow with monitoring state
sector schemes, although these may have important bearing on the
sector with which the Central Ministry is concerned.
• Uniformity of schemes all over the country from Mizoram to Kerala--
without sufficient delegation to states to change the schemes to suit
local conditions--leads to a situation where the states even knowingstates even knowingstates even knowingstates even knowing
that a scheme is not doing well become indifferent to itsthat a scheme is not doing well become indifferent to itsthat a scheme is not doing well become indifferent to itsthat a scheme is not doing well become indifferent to its
implementation.implementation.implementation.implementation.
Many schemes assume a highly committed delivery machinery which will act
as 'friend, philosopher and guide' of the people. Such rare individuals, if they
existed in government, do not stay at a particular post for long to make a lasting
impact (ibid,
page 484). (emphasis added).
EvaluationEvaluationEvaluationEvaluation

99
As a part of the project schedule, there is need to provide for evaluation, bothAs a part of the project schedule, there is need to provide for evaluation, bothAs a part of the project schedule, there is need to provide for evaluation, bothAs a part of the project schedule, there is need to provide for evaluation, both
concurrent and post-project, but such a need is yet to be concurrent and post-project, but such a need is yet to be concurrent and post-project, but such a need is yet to be concurrent and post-project, but such a need is yet to be recognised.recognised.recognised.recognised. In this
respect, Externally Aided Projects are definitely on an advantage since the donor
agencies do regular evaluation of the projects. Absence of such a mechanism in the
case of other national projects makes it difficult to know the progress in various
components and apply mid-term corrections, if need be, in physical and financial
targets. (ibid, page 486)
From early 1960s/70s, schemes are being implemented without having anyFrom early 1960s/70s, schemes are being implemented without having anyFrom early 1960s/70s, schemes are being implemented without having anyFrom early 1960s/70s, schemes are being implemented without having any
evaluation done to know their shortcomings or impact.evaluation done to know their shortcomings or impact.evaluation done to know their shortcomings or impact.evaluation done to know their shortcomings or impact. While doling out money,
due consideration is not given to the likely delivery of inputs. For example, money
is invested in revival/modernization of sugar mills but after modernization the
mills are in red, their net worth completely eroded. A major problem being faced
by those mills, i.e. artificially high state-administered prices of sugar can, has not
been addressed. (ibid, page 486)
Some of the weaknesses of the Public Expenditure Management System can
also be illustrated through an evaluation report on the "Employment Assurance
Scheme (EAS)" a few result of which are summarized in Appendix 4.1.
4.3.94.3.94.3.94.3.9 Some limitations of the assessmentSome limitations of the assessmentSome limitations of the assessmentSome limitations of the assessment
The assessment of PEM in India attempted in section 2 of this chapter is
strictly in the framework already used in the JBIC study for two other developing
countries i.e. Pakistan and Philippines. It is based on a large number official
reports and other studies which provide information on the expenditure
management system in India. An earlier study on 'Management of Indian
Economy - Systems and Process' by the present author and published by the
OECF in 1995 was also found of use in the present study to the extent of
indicating the systems aspects in various stages of PEM cycle. Finally a draft of
this assessment was discussed with experts on the subject at a presentation made
by this author at the JBIC Institute, for obtaining expert comments, before
finalizing this part of the study. Even so the assessment has a few limitations,Even so the assessment has a few limitations,Even so the assessment has a few limitations,Even so the assessment has a few limitations,
which need to be kept in view while considering the 'tasks ahead' indicated in the
assessment.
(a) The tasks ahead indicated in this assessment of The tasks ahead indicated in this assessment of The tasks ahead indicated in this assessment of The tasks ahead indicated in this assessment of PEM in India arePEM in India arePEM in India arePEM in India are
general and macro in nature.general and macro in nature.general and macro in nature.general and macro in nature. Also, these are limited to the stages in
PEM cycle only.
It, however, needs to be recognized that identification of the tasks ahead
is the first necessary stage towards improving a PEM system. Specific
measures can be worked out only at a second stage when the suggestions
are considered in depth for implementation - a task beyond the scope of
100
this study. Incidentally, a comprehensive and in-depth analysis of
government finances is found in the report of the Eleventh Finance
Commission (July 2000) where some specific measures have been
indicated for restructuring the government finances in India. Some of the
important specific suggestions relating to expenditure management made
in the Report include :
(i) government may examine the feasibility of introducing a multi-year
budgeting process,
(ii) introduce objective methods of preparing budget estimates so as to
improve the quality of budget estimation,
(iii) stipulate a maximum time within which, reports of C&AG are
scrutinized by Public Accounts Committee and examined by
Parliament or Legislature, as the case may be,
(iv) review all expenditure classifications other than revenue and
capital,
(v) fully computerize cash flow management, at all levels of
government.
(vi) Another necessary reform in budgeting is, to do away with the
dichotomy between 'plan' and 'non-plan' in expenditure. With the
introduction of planning, budget heads have come to be divided
under 'plan' and 'non-plan' and the distinction runs through all
items of expenditure on revenue as well as capital accounts. Apart
from creating problems in keeping the revenue deficits and thereby
fiscal deficits in control, as pointed out earlier, the distinction has
had a deleterious effect on the quality of public services. Essential
maintenance has been neglected as they do not come under the plan
and existing assets including schools and hospitals are starved of
much needed support for their running. In recognition of these ill-
effects of the plan/non-plan distinction in budgeting, the Union
Finance Minister had observed in the budget speech for 1998-99:
The distinction between plan and non-plan expenditure in ourbudgetary system has created several problems. It has led to anexcessive focus on so called plan expenditure with acorresponding neglect of items such as maintenance which isclassified as non-plan. Various bodies, including the FinanceCommission have advocated the elimination of the plan andnon-plan distinction in the budget. I propose to constitute aTask Force, including representatives of Planning Commission,Finance Ministry, Comptroller and Auditor General of Indiaand State Governments to examine these issues in a
101
comprehensive manner and to make recommendations for afunctionally viable and more focussed presentation ofgovernment expenditure in the budget.
(vii) In order to improve the efficiency of public expenditure we need to
have better targeted, beneficiary oriented programs and an effective
monitoring mechanism. It may be mentioned that the evaluation of
public programs has so far been primarily expenditure oriented.
However, expenditure is not an end by itself. Evaluation of
performance, in terms of achievements, related to the objective is
seldom done. This needs to be remedied.
(b) The assessment is primarily focussed on Central government'sThe assessment is primarily focussed on Central government'sThe assessment is primarily focussed on Central government'sThe assessment is primarily focussed on Central government's
expenditure management.expenditure management.expenditure management.expenditure management. The assessment is largely based on the system
and institutions relevant mainly to the Central government, except in
case of audit.
Even though the statutory provisions for state government budgetary
system is well defined and common, given the number of 26 state budgets,
wide range of levels of implementation practices, and lack of specific
information, it is rather not feasible to make a systematic common
assessment of the type attempted here. Though not in the framework
adopted here, an indicative partial assessment of state government
budgets system could be had from the annual comprehensive study on
State government budgets undertaken by the RBI, which includes an
analysis of 'Fiscal Marksmanship' in state budgets. Fiscal marksmanship
essentially reflects the degree of accuracy between 'estimates' and
'actuals' of the budget data. It shows the degree to which the budgetary
forecasts that have been made are accurate. The deviation between
budget estimates and actual outcome has been more pronounced
particularly, in 1997-98, the latest year for which accounts data are
available.

102
Table 4.3 State-wise Fiscal Marksmanship (Major States)(Per cent deviation in actuals over Budgeted)
Revenue Expenditure Capital Disbursements
States 1995-96 1996-97 1997-98 1995-96 1996-97 1997-98
Andhara Pradesh -2.52 19.38 5.92 31.24 -27.22 24.1
Assam -3.80 -21.86 -12.74 -7.72 -31.48 5.52
Bihar 0.55 -9.79 -13.32 -48.16 -12.43 -25.45
Gujarat 6.96 12.27 13.14 8.76 12.34 -7.26
Haryana 6.20 35.98 -18.87 -20.31 4.41 -7.83
Karnataka -6.73 -4.12 -8.99 7.07 4.62 12.5
Kerala 0.85 -5.02 -6.30 16.87 -2.89 27.61
Madhya Pradesh -5.64 5.71 -4.57 5.1 4.38 -2.09
Maharashtra 2.40 4.49 4.07 25.15 -1.84 12.96
Orissa -8.16 -7.65 -9.61 -17.3 -11.59 -7.73
Rajasthan 4.30 6.97 -1.76 14.2 7.98 44.42
Tamil Nadu 10.09 7.91 -34.28 2.76 29.61 12.88
Uttar Pradesh -2.69 -7.91 -13.73 -5.2 -13.09 -34.2
West Bengal -8.30 1.04 -5.91 18.3 4.33 -23.27
Source : RBI, State Finances, January, 2000.
A comparative picture of fiscal marksmanship for the Central government
budget would show that the level is only a shade better over the state
governments and thus the assessment made in this study could broadly hold good
for state budgets also. The averages of such deviations (Actuals/Budgeted) for the
period from 1994-95 to 1998-99 are as follows:
Percent deviationPercent deviationPercent deviationPercent deviation
Actual/BudgetActual/BudgetActual/BudgetActual/Budget
Total Expenditure 2.4
A. Revenue Expenditure 1.1
of which:
(i) Interest payments -1.7
(ii) Subsidies 10.2
(iii) Defense 2.3
B. Capital Expenditure 7.2
(a) Capital outlay -6.5
(b)Loans and Advances 16.4
(RBI Bulletin, May 2000)(c) The assessment lacks quantification.The assessment lacks quantification.The assessment lacks quantification.The assessment lacks quantification. The assessment made in
terms of strengths and weaknesses for different stages of the PEM
cycle in India is qualitative in nature and it lacks any quantification
103
to enable an evaluate on in terms of degree of performance. This,
however, could at best be a subjective task and may have resulted
in undue biases. An indicative quantification of budget and
financial management practices is, however, given in the next part
of this chapter, which is based on the World Bank framework on
PEM.
4.44.44.44.4 PEM in India : An Assessment in World Bank FrameworkPEM in India : An Assessment in World Bank FrameworkPEM in India : An Assessment in World Bank FrameworkPEM in India : An Assessment in World Bank Framework
4.4.14.4.14.4.14.4.1 General ObservationsGeneral ObservationsGeneral ObservationsGeneral Observations
A World Bank study (2000) on India contains some general observations on
governance and budgetary process in India along with evaluation and specific
suggestions. A few important general observations are:
• India fares about average among developing countries, on Governancethough it ranks well below industrial countries.
• India's 'outcomes' tend to be worse than the evaluations of its governanceprocess, particularly in public service delivery, which suggests
implementation problems.
• India's ranking on its budgetary processes and efficiency, and equity of
revenues and expenditures in international comparisons is fairly high.
However, in terms of the more general category, of management of public
finances, India-ranks much lower. An appraisal that is borne out by India's
high fiscal deficit, where India ranks among the worst 10% of countries in
the world.
4.4.24.4.24.4.24.4.2 Evaluation through ChecklistEvaluation through ChecklistEvaluation through ChecklistEvaluation through Checklist
As noted earlier, the World Bank Handbook on Public Expenditure
Management (1998) provides for a checklist of practices that are relevant to
assessing a country's strengths and weaknesses in budgeting and financial
management . Also provided in the handbook is a detailed diagnostic
questionnaire covering various aspects including aggregate fiscal discipline,
budget execution and monitoring, expenditure prioritization and allocative
efficiency, technical efficiency in terms of autonomy and accountability.
Based on the checklist in the handbook a summary evaluation of the budget
and financial management practices in India has been given in the World Bank
(2000) Report on India which quantifies the stage of development of each practices
on a scale of 1 to 10 with 1 as inadequate, 5 as adequate and 10 as excellent. This
evaluation by the World Bank is given in table 4.4. Also given in the table is an
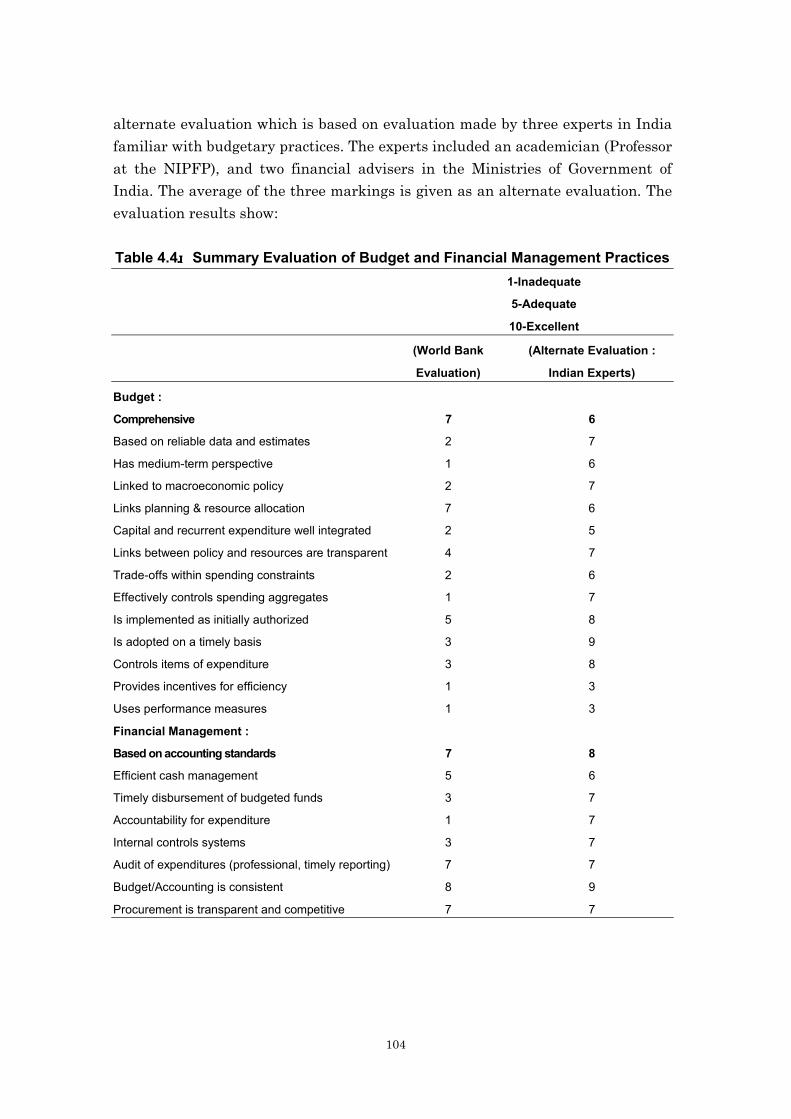
104
alternate evaluation which is based on evaluation made by three experts in India
familiar with budgetary practices. The experts included an academician (Professor
at the NIPFP), and two financial advisers in the Ministries of Government of
India. The average of the three markings is given as an alternate evaluation. The
evaluation results show:
Table 4.4 Summary Evaluation of Budget and Financial Management Practices1-Inadequate
5-Adequate
10-Excellent
(World Bank (Alternate Evaluation :
Evaluation) Indian Experts)
Budget :
Comprehensive 7 6
Based on reliable data and estimates 2 7
Has medium-term perspective 1 6
Linked to macroeconomic policy 2 7
Links planning & resource allocation 7 6
Capital and recurrent expenditure well integrated 2 5
Links between policy and resources are transparent 4 7
Trade-offs within spending constraints 2 6
Effectively controls spending aggregates 1 7
Is implemented as initially authorized 5 8
Is adopted on a timely basis 3 9
Controls items of expenditure 3 8
Provides incentives for efficiency 1 3
Uses performance measures 1 3
Financial Management :
Based on accounting standards 7 8
Efficient cash management 5 6
Timely disbursement of budgeted funds 3 7
Accountability for expenditure 1 7
Internal controls systems 3 7
Audit of expenditures (professional, timely reporting) 7 7
Budget/Accounting is consistent 8 9
Procurement is transparent and competitive 7 7

105
4.4.34.4.34.4.34.4.3 Output and OutcomesOutput and OutcomesOutput and OutcomesOutput and Outcomes
Further, the World Bank study also has assessed the public financial
management in India in terms of Output and Outcomes as given in the table
below:
Table 4.5 Public Financial Management in India : Outputs and Outcomes(World Bank Assessment)
(i) Aggregate Fiscal Discipline
PFM Outputs PFM OutcomesInstitutionalArrangements
• Medium term expenditure framework? NO• Hard Budget Constraint? NO• Comprehensive Budget? LARGELY
• Revenue/Expenditure targetachieved? NO
Accountability • Ex post reconsiliation of the expenditures?YES
• Sanctions for agency over-or under spending?NO
• Limited agencyoverspending? NO
Transparency • Publication of budget and fiscal results? YES,PARTLY
(ii) Strategic Prioritization
PFM Outputs PFM OutcomesInstitutionalArrangements
• Budgetary planning consultative withstakeholders? PARTLY?
• Strategic targets linked to allocations?PARTLY
• Line agency allocation discretion? NO
• Expenditure matched tostrategic goals? NO
Accountability • Outcomes reported? SOME• Ex post evaluation of results? LIMITED
(INSTEAD, EX ANTE CONTROL)• Sanctions applied? NO
• Clear responsibility formismatch? NO
Transparency • Adequate Stakeholder voicemechanisms? NO
• Outcome performancepublished? SOME
(iii) Operational Effectiveness and Efficiency
PFM Outputs PFM Outcomes
InstitutionalArrangements
• Relative line agency autonomy? NO • Efficient serviceDelivery? NO
Accountability • Internal and External Audit? YES• Personnel policies performance based?
NO• Service delivery standards? SOME• Customer satisfaction surveys? FEW
Transparency • Program performance published? SOME• Client voice mechanism? FEW

106
4.4.44.4.44.4.44.4.4 Suggested Reform ProgramsSuggested Reform ProgramsSuggested Reform ProgramsSuggested Reform Programs
Given the above assessment the study (World Bank, 2000) has also listed
specific suggestions for a reform program on Budgeting and Expenditure
Management in India as follows:
Regarding aggregate fiscal discipline• A multi-year expenditure framework;
• A budget procedure with revenue budgeting and revenue policy setting before
expenditure budgeting;
• Removal of the Plan/Non-plan categorization as suggested by several experts;
• Clearly defined expenditure caps, if possible through a Constitutional
amendment;
• Creation of a contingency fund under the control of the MoF (different from
the Contingency Fund of India) from which genuine unforeseen expenditure
increases can be met;
• A budget circular incorporating expenditure ceilings for departments;
• Introduction of zero-base budgeting as announced by the Finance Minister andeventual revision of Demands for Grants by a document giving past outputs
and linking realistically costed current and projected outputs to multi-year
expenditure estimates. Strict zero-base budgeting as introduced in the United
States may not be appropriate in the Indian context especially for development
programs not directly executed by the center. However, the principal of (i)
linking past outcomes to current expenditure proposals and (ii) evaluating the
social return and/or prioritization of expenditure proposals is important.
• Improved cash management to permit eventual emulation of "just in time"
inventory management, through positive and negative incentives to line
ministry FAs to improve disbursement forecasts;
Regarding strategic allocation of expenditures• Effective individual accountability and sanctions (or rewards if merited) for
overspending or overbudgeting and for underspending;
• Development and tracking of program-wise output performance indicators ininininthe budgets the budgets the budgets the budgets as is currently done in Annual Reports of some departments and
ministries;
• Positive incentives for efficiency improving reforms rather than pursuit offortuitous savings;
• Enhanced public involvement of stakeholder groups earlier in the budgetformulation and post-budget stages;
Regarding effective and efficient service delivery• Improved control of disbursements to on-spending agencies through the use of
contractual positive incentives and negative sanctions (rather than ex ante

107
controls); and a reporting system providing information on both financial
expenditure and physical progress;
• Improved internal audit capabilities and strengthening the role of externaloversight to enable long term pursuit of management improvements where
weaknesses are identified by external audit review;
• Stepped up implementation of computerization of accounts down to the
program implementation level;
• The introduction of client satisfaction surveys, conducted by independent
central and local agencies for each government program and feedback from
client surveys to ministry budget allocations.
Regarding implementation of the reform program• Setting up of a high powered reform management body to oversee
implementation and deal with teething problems.
4.54.54.54.5 Summary ConclusionsSummary ConclusionsSummary ConclusionsSummary Conclusions
Removal of poverty is the ultimate objective, as it has been, for the economic
policy of the Government of India. There is evidence to show that without a
sustained higher growth rate, the objective of removal of poverty cannot be
achieved. Macroeconomic stability is a necessary precondition for a sustained high
level of growth rate of the economy. Continuing fiscal deficit particularly driven by
the revenue deficit in the government budgets poses a real danger to
macroeconomic stability. Public expenditure management (PEM) is the key
instrument for correcting such fiscal imbalances. Also, an effective and responsive
governance requires effective PEM.
Box 4.5Box 4.5Box 4.5Box 4.5Good Governance and Development OutcomesGood Governance and Development OutcomesGood Governance and Development OutcomesGood Governance and Development Outcomes
Development is an outcome of efficient institutions rather than the other way around.Good Governance has therefore entered the development lexicon, even though how toachieve good governance remains debatable. There cannot be two opinions that thequality of governance must be improved. Focus must be shifted from maximising thequantity of development funding to maximising of development outcomes andeffectiveness of public service delivery. This will help in improving the perception ofinvestors and donor agencies about the investment climate in the States. It will alsocontribute to increasing the revenue collecting ability of States.
--Planning Commission (2000, Oct.) Page 491-492.
An assessment of PEM in India made in this chapter brings out a large
number of weaknesses notwithstanding the well established systems with some
built in strengths. The assessment also identifies the major tasks ahead. Some
other reviews of PEM have also made wide ranging suggestions for improving

108
expenditure management in India. What is now needed is a holistic approach to
remove the identified weaknesses at each stage of the PEM cycle rather than
tinkering with a few sub systems without linking them to the ultimate objectives
of an effective, responsive and accountable governance, as well as, PEM. The
major tasks ahead are:
(a) Strengthen policy formulation system :Strengthen policy formulation system :Strengthen policy formulation system :Strengthen policy formulation system : Medium term policies for
the major budget supported programs should be formulated in
advance before finalizing the budget proposals. Eleventh Finance
Commission has also recommended that the government may
examine the feasibility of introducing a multi-year budgeting
process.
(b) Develop cost consciousness for each major activity/program.Develop cost consciousness for each major activity/program.Develop cost consciousness for each major activity/program.Develop cost consciousness for each major activity/program.
Activity-wise allocations in the budget need to be examined in more
details to avoid incremental budgeting and bringing in cost
consciousness. For the purpose, least cost options need to be
explored in consultation with users, beneficiaries and target groups
of the budget allocations.
(c) Associate stakeholders, participants and beneficiaries withAssociate stakeholders, participants and beneficiaries withAssociate stakeholders, participants and beneficiaries withAssociate stakeholders, participants and beneficiaries with
monitoring process.monitoring process.monitoring process.monitoring process. The system of monitoring the implementation
of programs is confined mainly to monitoring of expenditure.
Effectiveness of implementation can be increased if participants and
beneficiaries are associated with the monitoring process.
(d) Develop appropriate management systems for expenditure control.Develop appropriate management systems for expenditure control.Develop appropriate management systems for expenditure control.Develop appropriate management systems for expenditure control.
There has to be a multi-disciplinary management approach towards
control and internal audit of expenditure. The internal audit system
cannot be left to accounting personnel alone, as at present.
(e) Lay greater emphasis on program audit, efficiency audit andLay greater emphasis on program audit, efficiency audit andLay greater emphasis on program audit, efficiency audit andLay greater emphasis on program audit, efficiency audit and
performance audit.performance audit.performance audit.performance audit. The CAG audit focuses mainly on financial
irregularities. The other aspects of efficient use of resources,
performance and value for money remain weak in the reports.
(f) Focus Focus Focus Focus 3Es (Economy, Efficiency and Effectiveness) in evaluation3Es (Economy, Efficiency and Effectiveness) in evaluation3Es (Economy, Efficiency and Effectiveness) in evaluation3Es (Economy, Efficiency and Effectiveness) in evaluation
studies.studies.studies.studies. The system of evaluation studies needs to be strengthened,
for its coverage, regularity and time bound schedules along with a
focus on 3Es.
(g) Ensure timely feed back for evaluation results to policy makers.Ensure timely feed back for evaluation results to policy makers.Ensure timely feed back for evaluation results to policy makers.Ensure timely feed back for evaluation results to policy makers.
Results of evaluation studies should reach the policy formulation
stage of budgetary process well in advance, to avoid incremental
budgeting despite poor outcomes of expenditure incurred earlier.
Apart from the above mentioned major tasks, there would emerge several
micro-level systemic weaknesses which may need technical examination. A few
109
suggestions made by the Eleventh Finance Commission, in this context, deserve
special attention. Review of all expenditure classifications other than revenue and
capital, doing away with the dichotomy between 'plan' and 'non-plan', avoiding the
practice of providing a 'token' provision resulting in thin spread of resources, etc.
are some such tasks which can go a long-way in improving the PEM systems.
Finally, as already mentioned, the tasks ahead and suggestions available
need to be examined, considered, and implemented in a comprehensive manner.
Setting up of a high powered reform management body, to oversee
implementation and deal with teething problems is included in the list of
suggested reform program in the World Bank study. The Expenditure Reforms
Commission set up in February 2000 could be assigned the task of considering
and overseeing the implementation of reforms in public expenditure management
in a comprehensive manner.

110
Appendix 4.1Appendix 4.1Appendix 4.1Appendix 4.1Employment Assurance Scheme (Employment Assurance Scheme (Employment Assurance Scheme (Employment Assurance Scheme (EAS)EAS)EAS)EAS)
Launched on Gandhi Jayanti day (2nd October) in 1993, the Employment
Assurance Scheme (EAS) was initially in operation in 1772 backward blocks. The
blocks were identified in drought prone areas, deserts, tribal areas and hill region
areas where the Revamped Public Distribution System (RPDS) was in operation.
Gradually, EAS was extended to other blocks and by 1997-98 the scheme was
being implemented in country's 5448 rural blocks in all. This scheme has theThis scheme has theThis scheme has theThis scheme has the
highest level of allocation amongst all the five 'Major Rural Developmenthighest level of allocation amongst all the five 'Major Rural Developmenthighest level of allocation amongst all the five 'Major Rural Developmenthighest level of allocation amongst all the five 'Major Rural Development
Programmes' during the Ninth Plan. The Plan allocation for 1999-2000 was Programmes' during the Ninth Plan. The Plan allocation for 1999-2000 was Programmes' during the Ninth Plan. The Plan allocation for 1999-2000 was Programmes' during the Ninth Plan. The Plan allocation for 1999-2000 was Rs.Rs.Rs.Rs.
24.32 billion accounting for 27.7 per cent of the total allocation (24.32 billion accounting for 27.7 per cent of the total allocation (24.32 billion accounting for 27.7 per cent of the total allocation (24.32 billion accounting for 27.7 per cent of the total allocation (Rs.87.68 billion)Rs.87.68 billion)Rs.87.68 billion)Rs.87.68 billion)
for the five programs.for the five programs.for the five programs.for the five programs.
As its primary objective, EAS is to create additional wage employment
opportunities during a period of acute shortage through manual work for the rural
poor. The secondary objective is the creation of durable community, social and
economic assets for sustained employment and development. Though open to all
rural poor, the the the the programme is expected to attract only unskilled people below theprogramme is expected to attract only unskilled people below theprogramme is expected to attract only unskilled people below theprogramme is expected to attract only unskilled people below the
poverty line because it offers only the minimum wages.poverty line because it offers only the minimum wages.poverty line because it offers only the minimum wages.poverty line because it offers only the minimum wages.
As experience showed, employment provided under As experience showed, employment provided under As experience showed, employment provided under As experience showed, employment provided under EAS was EAS was EAS was EAS was meagre.meagre.meagre.meagre. The
Third Report of 1995 of the Comptroller and Auditor General stated that on an
average each person was provided 18 days and 16 days of employment during
1994-95 and 1995-96 respectively.
According to a comprehensive evaluation by the Programme Evaluation
Organisation (PEO) of Planning Commission in 14 States, EAS is being executed
through contractors in most States in violation of central guidelines; the norm of
60:40 for wage and material is not maintained; genuine muster rolls are not being
maintained by the Gram Panchayats. Family cards have not been issued; the
system of registration of job seekers with Gram Panchayats is not in vogue; and
even though Central allocation seems to have been made on the basis of minimum
national requirement, a vast majority of the Blocks did not get this allocation.
This could be due to the inability of the States to contribute their matching share
in the pooled fund for EAS.
As to As to As to As to EAS' impact, the study found that the estimated proportion ofEAS' impact, the study found that the estimated proportion ofEAS' impact, the study found that the estimated proportion ofEAS' impact, the study found that the estimated proportion of
registered job seekers who actually got any employment was as low as 25 per centregistered job seekers who actually got any employment was as low as 25 per centregistered job seekers who actually got any employment was as low as 25 per centregistered job seekers who actually got any employment was as low as 25 per cent
in sample villages.in sample villages.in sample villages.in sample villages. The average number of days of employment per person per
year was less than 53 as per official records. However, information gathered from
the beneficiaries reveals that 69 per cent of them got less than 30 days of
employment and another 17 per cent between 30 days and 50 days. The overall
average for the sample States works out to 31 days.
111
Even in the matter of asset creation, the study finds that Central norms have
not been followed. For example, none of the sample States has earmarked 40 per
cent of funds for watershed development and 20 per cent for minor irrigation, link
roads and buildings for schools and anganwadis. In Bihar, 69 per cent of EAS
funds were allocated to activities like school buildings/anganwadis which are not
labour-intensive. Similarly, in Gujarat, Haryana and West Bengal the unit cost of
employment generation in school buildings/anganwadis is abnormally high (Rs
200 to Rs 300) It is difficult to justify allocation of funds to such activities under
employment generation scheme. No inventory of assets was kept and it wasNo inventory of assets was kept and it wasNo inventory of assets was kept and it wasNo inventory of assets was kept and it was
difficult to know whether the asset created was community asset or private one.difficult to know whether the asset created was community asset or private one.difficult to know whether the asset created was community asset or private one.difficult to know whether the asset created was community asset or private one.
A profile of the EAS beneficiaries shows that over 78 per cent belonged to
daily wage earning class. To that extent the scheme appears to have been well-
targeted. Although bulk of EAS beneficiaries were illiterate or below
matriculation level, some skilled and semi-skilled workers were also among them.
This is further supported by the wide variation in wage rates paid in some states
(for instance, Rs 25-100 in Rajasthan, Rs 22-150 in Tamil Nadu and Rs 20-80 in
Madhya Pradesh). This could also be a reflection of the involvement of contractors
who may have shown their employees as EAS beneficiaries.
The The The The PEO study concludes that PEO study concludes that PEO study concludes that PEO study concludes that EAS has not realized its objectives ofEAS has not realized its objectives ofEAS has not realized its objectives ofEAS has not realized its objectives of
generation of sustained and gainful employment, supplementing the income ofgeneration of sustained and gainful employment, supplementing the income ofgeneration of sustained and gainful employment, supplementing the income ofgeneration of sustained and gainful employment, supplementing the income of
rural wage-earning class in agricultural lean seasons and improving the well-rural wage-earning class in agricultural lean seasons and improving the well-rural wage-earning class in agricultural lean seasons and improving the well-rural wage-earning class in agricultural lean seasons and improving the well-
being of rural poor.being of rural poor.being of rural poor.being of rural poor. With universalisation of EAS and without an element of
assurance of employment of 100 days in a year as initially envisaged, there is
practically no difference between JGSY and EAS except that the former is being
implemented through PRIs and the latter by the administrative apparatus. There
is, therefore, need to have another look at EAS.
Several lacunae have come to notice in the design and implementation ofSeveral lacunae have come to notice in the design and implementation ofSeveral lacunae have come to notice in the design and implementation ofSeveral lacunae have come to notice in the design and implementation of
EAS.EAS.EAS.EAS. First, bogus reporting. Field staff have learnt to report figures in the
manner expected of them, that is, they must show that targets have been fully
achieved irrespective of what the ground situation is. Collectors are under
pressure to furnish utilization certificates so that states could draw the next
installment from the Cetnre. Money is considered to have been spent once is
allotted from district to panchayats, even when no physical expenditure has taken
place.
Second, employment generation programs create incomes for the rural poor
but leave no assets behind. Once such programs are withdrawn, the poor may
again fall below the poverty line in the absence of family based assets.
Third, development of vital infrastructure like road, water supply, electricity,
schools and the like is neither labour-intensive nor results in assets primarily for
use by the poor.
112
Fourth, employment schemes provide massive funds for road and school
construction, in which villagers become (temporary) state employees of the
concerned departments and thus remain in a continued state of psychological
dependence and expectation from the state.
Lastly, such programs have encouraged corruption, both at political and
administrative levels.
Source : Planning Commission, (2000 Oct.), Mid-Term Appraisal of Ninth Five
Year Plan (1997-2000).
(Page 144 and 145)
113
Chapter Chapter Chapter Chapter ⅤⅤⅤⅤDecentralization in India : Developments and IssuesDecentralization in India : Developments and IssuesDecentralization in India : Developments and IssuesDecentralization in India : Developments and Issues
5.15.15.15.1 IntroductionIntroductionIntroductionIntroduction
Lack of peoples' participation in formulation and implementation of public
expenditure programs for basic needs has been identified as a major weakness in
achieving the ultimate objective of removal of poverty. There has, therefore, been
no major dissension over the purpose and advantages of taking governance closer
to people. And decentralization of functional and financial power has been
considered to be the most powerful means of self governance at local level. What,
however, under debate is that in practice there is no guarantee that
decentralization would succeed. The path towards decentralization is not devoid of
pitfalls.
Box 5:1Box 5:1Box 5:1Box 5:1Rationale of Decentralized Local GovernmentRationale of Decentralized Local GovernmentRationale of Decentralized Local GovernmentRationale of Decentralized Local Government
Admittedly the most important rationale of decentralized local government is theprovision of certain basic services and infrastructures of standard quality at the locallevel. No citizen should suffer because of her/his choice of location of residence. Todeprive a citizen of adequate level of schooling, drinking water, primary health care andother basic services because of her location is an injustice. That even after more thanfifty years of planning, the union and the state governments have woefully failed thepeople of India in this respect needs no documentation. At the same time the marketmediated regime underway also cannot be trusted to promote territorial equity. Theneed for local government involvement is greater than ever before.
(Oommen, M.A., 1999)
In the context of public expenditure management in India, a limited purpose
of this chapter is to identify the main issues responsible for weakening the
effectiveness of the expenditure management system notwithstanding the
significant developments towards strengthening the decentralization process
particularly during the nineties. The focus thus is limited to fiscal decentralization
rather than the larger issues of political and institutional developments. But before
all that, a glimpse of international experience is considered desirable.
5.25.25.25.2 Decentralization : Concept and International ExperienceDecentralization : Concept and International ExperienceDecentralization : Concept and International ExperienceDecentralization : Concept and International Experience
The term decentralization encompasses a wide range of distinct processes:
'The main ones are administrative decentralization, or the transfer of state
functions from higher to lower levels of government while retaining central control
of budgets and policy making; fiscal decentralization, or the ceding of influence
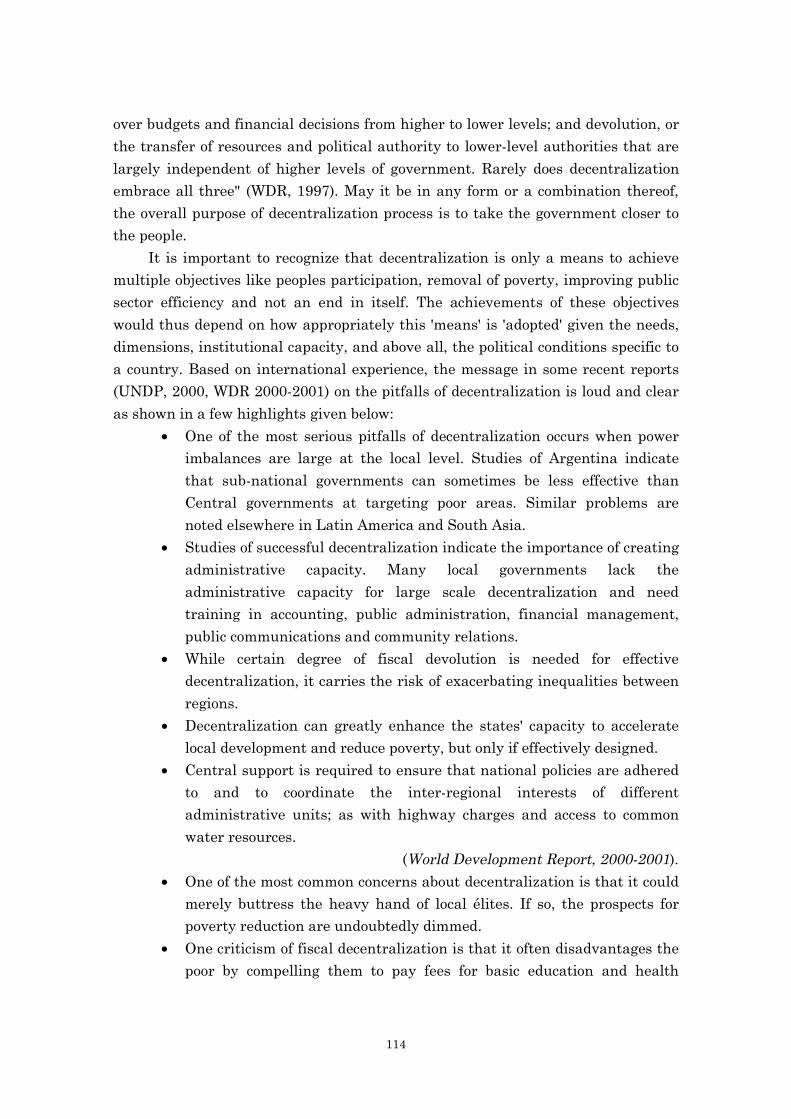
114
over budgets and financial decisions from higher to lower levels; and devolution, or
the transfer of resources and political authority to lower-level authorities that are
largely independent of higher levels of government. Rarely does decentralization
embrace all three" (WDR, 1997). May it be in any form or a combination thereof,
the overall purpose of decentralization process is to take the government closer to
the people.
It is important to recognize that decentralization is only a means to achieve
multiple objectives like peoples participation, removal of poverty, improving public
sector efficiency and not an end in itself. The achievements of these objectives
would thus depend on how appropriately this 'means' is 'adopted' given the needs,
dimensions, institutional capacity, and above all, the political conditions specific to
a country. Based on international experience, the message in some recent reports
(UNDP, 2000, WDR 2000-2001) on the pitfalls of decentralization is loud and clear
as shown in a few highlights given below:
• One of the most serious pitfalls of decentralization occurs when powerimbalances are large at the local level. Studies of Argentina indicate
that sub-national governments can sometimes be less effective than
Central governments at targeting poor areas. Similar problems are
noted elsewhere in Latin America and South Asia.
• Studies of successful decentralization indicate the importance of creating
administrative capacity. Many local governments lack the
administrative capacity for large scale decentralization and need
training in accounting, public administration, financial management,
public communications and community relations.
• While certain degree of fiscal devolution is needed for effective
decentralization, it carries the risk of exacerbating inequalities between
regions.
• Decentralization can greatly enhance the states' capacity to accelerate
local development and reduce poverty, but only if effectively designed.
• Central support is required to ensure that national policies are adhered
to and to coordinate the inter-regional interests of different
administrative units; as with highway charges and access to common
water resources.
(World Development Report, 2000-2001).
• One of the most common concerns about decentralization is that it could
merely buttress the heavy hand of local élites. If so, the prospects for
poverty reduction are undoubtedly dimmed.
• One criticism of fiscal decentralization is that it often disadvantages the
poor by compelling them to pay fees for basic education and health

115
services, or by compelling local authorities to raise taxes on the poor to
finance these services.
• Badly planned decentralization can worsen regional inequalities. Left totheir own devices, richer regions are likely to develop faster than poor
ones. And a system of matching grants, intended by central government
to motivate local government to raise funds, typically exacerbates
regional disparities.
• If decentralization implies dumping responsibilities onto lower levels of
government"load shedding"it can be done fairly quickly. But if it
implies strengthening democracy"empowering decentralization"itwill take some time, considerable resources and extensive capacity
building.
• Widespread popular participation is vital to successful decentralization
without it, the potential benefits of local information cannot be realized.
• To have the biggest impact, decentralization should go hand in handwith strengthening accountable local government and fostering popular
participation.
(UNDP, Poverty Report, 2000)
5.35.35.35.3 Decentralization in IndiaDecentralization in IndiaDecentralization in IndiaDecentralization in India
India has a three tier structure of Government. The Central government,
State governments, and local bodies i.e. panchayats and municipalities. The
constitutional changes in 1992 (73rd and 74th amendments) now envisage the
panchayats (rural local bodies) and municipalities (urban local bodies) as
institutions of self government. These rural and local institutions have been in
existence even before the constitutional amendments. But now, with these
amendments it has become mandatory for the States to hold regular elections for
these bodies under the supervision of State Election Commissions. Besides,
detailed provisions have been made under which state legislature, by law, may
entrust the local bodies with such powers, functions and responsibility so as to
enable them to function as institutions of self government. Before a review of
recent developments and issues a look at the main features of the Indian system
may be of use.
5.3.15.3.15.3.15.3.1 BackgroundBackgroundBackgroundBackground
The concept of decentralization, the purposes and the institutional system for
the same is not new to India. It was under the Directive Principles of the
Constitution that Article 40 requires that "the State shall take steps to organize
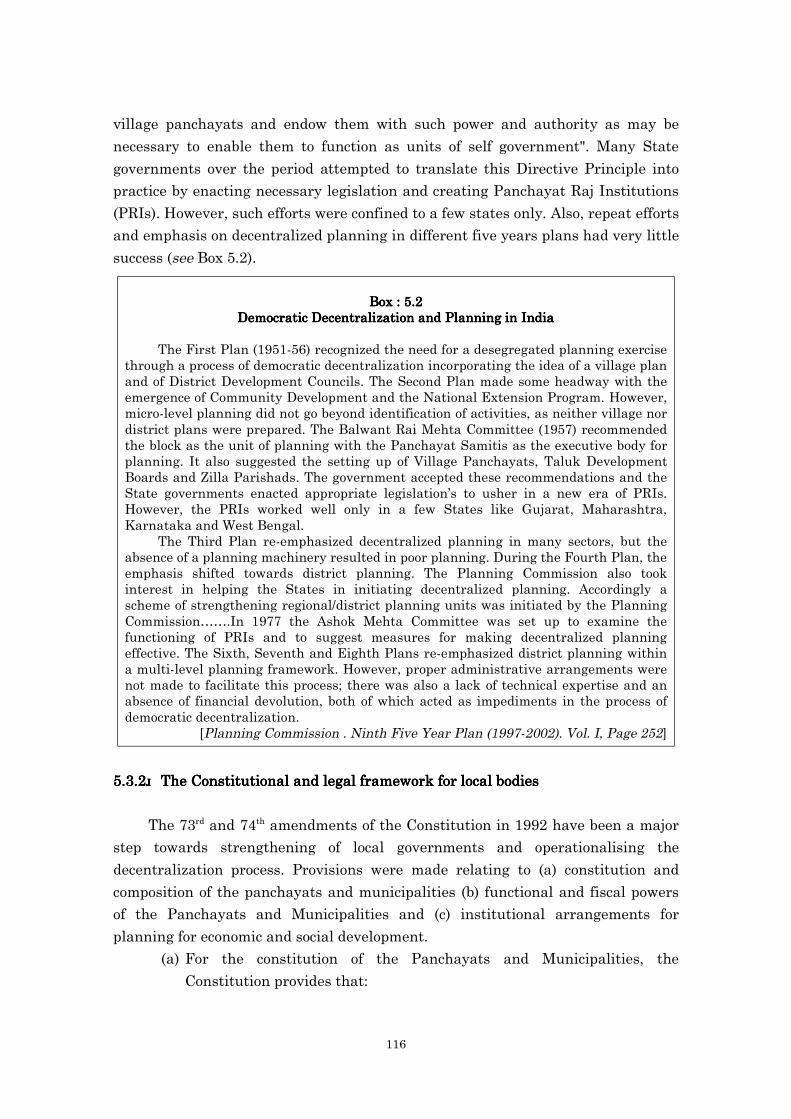
116
village panchayats and endow them with such power and authority as may be
necessary to enable them to function as units of self government". Many State
governments over the period attempted to translate this Directive Principle into
practice by enacting necessary legislation and creating Panchayat Raj Institutions
(PRIs). However, such efforts were confined to a few states only. Also, repeat efforts
and emphasis on decentralized planning in different five years plans had very little
success (see Box 5.2).
Box : 5.2Box : 5.2Box : 5.2Box : 5.2Democratic Decentralization and Planning in IndiaDemocratic Decentralization and Planning in IndiaDemocratic Decentralization and Planning in IndiaDemocratic Decentralization and Planning in India
The First Plan (1951-56) recognized the need for a desegregated planning exercisethrough a process of democratic decentralization incorporating the idea of a village planand of District Development Councils. The Second Plan made some headway with theemergence of Community Development and the National Extension Program. However,micro-level planning did not go beyond identification of activities, as neither village nordistrict plans were prepared. The Balwant Rai Mehta Committee (1957) recommendedthe block as the unit of planning with the Panchayat Samitis as the executive body forplanning. It also suggested the setting up of Village Panchayats, Taluk DevelopmentBoards and Zilla Parishads. The government accepted these recommendations and theState governments enacted appropriate legislation’s to usher in a new era of PRIs.However, the PRIs worked well only in a few States like Gujarat, Maharashtra,Karnataka and West Bengal.
The Third Plan re-emphasized decentralized planning in many sectors, but theabsence of a planning machinery resulted in poor planning. During the Fourth Plan, theemphasis shifted towards district planning. The Planning Commission also tookinterest in helping the States in initiating decentralized planning. Accordingly ascheme of strengthening regional/district planning units was initiated by the PlanningCommission…….In 1977 the Ashok Mehta Committee was set up to examine thefunctioning of PRIs and to suggest measures for making decentralized planningeffective. The Sixth, Seventh and Eighth Plans re-emphasized district planning withina multi-level planning framework. However, proper administrative arrangements werenot made to facilitate this process; there was also a lack of technical expertise and anabsence of financial devolution, both of which acted as impediments in the process ofdemocratic decentralization.
[Planning Commission . Ninth Five Year Plan (1997-2002). Vol. I, Page 252]
5.3.25.3.25.3.25.3.2 The Constitutional and legal framework for local bodiesThe Constitutional and legal framework for local bodiesThe Constitutional and legal framework for local bodiesThe Constitutional and legal framework for local bodies
The 73rd and 74th amendments of the Constitution in 1992 have been a major
step towards strengthening of local governments and operationalising the
decentralization process. Provisions were made relating to (a) constitution and
composition of the panchayats and municipalities (b) functional and fiscal powers
of the Panchayats and Municipalities and (c) institutional arrangements for
planning for economic and social development.
(a) For the constitution of the Panchayats and Municipalities, the
Constitution provides that:
117
"there shall be constituted in every State, Panchayats at the village,
intermediate and district levels in accordance with the provisions of
this Part. Panchayats at the intermediate level may not beconstituted in a State having a population not exceeding 20 lakh"
(Article 243 B).
"There shall be constituted in every State• a Nagar Panchayat for a transitional area, that is to say, an area
in transition from a rural area to an urban area;
• a Municipal Council for a smaller urban area, and
• a Municipal Corporation for a larger urban area" (Article 243Q).(b) Regarding functional and fiscal powers, now the Constitution contains
two schedules, viz Schedule XI (243G) and Schedule XII (Article 243W)
which comprise a list of functions considered appropriate for devolution
to Panchayats and Municipalities. The list of functions is illustrative in
nature (See Annex 5.1). The Constitution thus maintains the prerogative
of the State in respect of determining the functional/spending
responsibilities of the Panchayats and Municipalities.
The Constitution has provided for the setting up of a finance commission
in every State, for the propose of reviewing the financial position of the
Panchayats and Municipalities, and making recommendations to the
Governor as to the principles which would govern :
• The distribution between the State and Panchayats, and the Stateand Municipalities of the net proceeds of the taxes, duties, toll and
fees leviable by the State;
• The determination of the taxes, duties, tolls and fees which may be
assigned to, or appropriated by, the Panchayats and Muncipalities.
• The grants-in-aid to the Panchayats and Municipalities from theConsolidated Fund of the State, and
• Any other measure that would improve the finances of thePanchayats and Municipalities.
(c) For institutional arrangements the Constitution now provides for the
constitution of District Planning Committee (DPCs) and Metropolitan
Planning Committees (MPCs). Articles providing for the constitution of
such Committees are a significant step in the direction of initiating a
process of planning from below. The DPCs are to be responsible for the
consolidation of plans prepared by the Panchayats and the
Municipalities, and preparation of a draft development plan for the
district. The MPCs are to be responsible for the preparation of draft
development plans for the metropolitan areas. The composition and
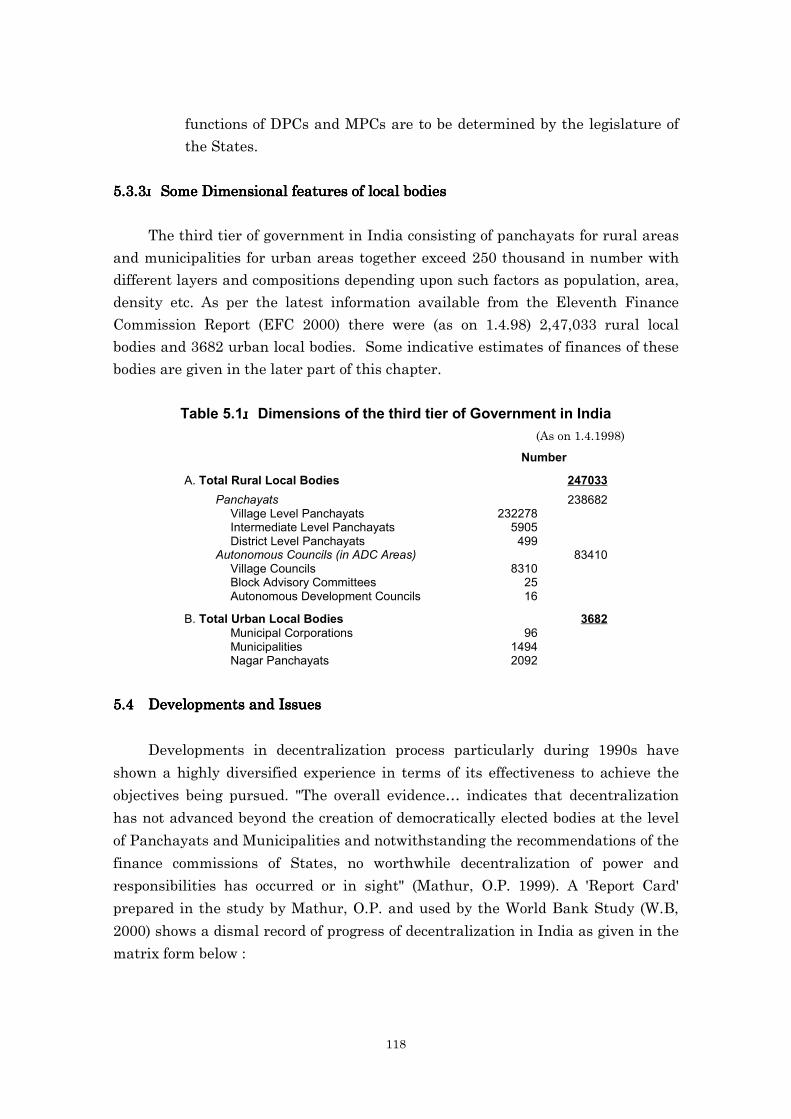
118
functions of DPCs and MPCs are to be determined by the legislature of
the States.
5.3.35.3.35.3.35.3.3 Some Dimensional features of local bodiesSome Dimensional features of local bodiesSome Dimensional features of local bodiesSome Dimensional features of local bodies
The third tier of government in India consisting of panchayats for rural areas
and municipalities for urban areas together exceed 250 thousand in number with
different layers and compositions depending upon such factors as population, area,
density etc. As per the latest information available from the Eleventh Finance
Commission Report (EFC 2000) there were (as on 1.4.98) 2,47,033 rural local
bodies and 3682 urban local bodies. Some indicative estimates of finances of these
bodies are given in the later part of this chapter.
Table 5.1 Dimensions of the third tier of Government in India(As on 1.4.1998)
Number
A. Total Rural Local Bodies 247033Panchayats 238682
Village Level Panchayats 232278Intermediate Level Panchayats 5905District Level Panchayats 499
Autonomous Councils (in ADC Areas) 83410Village Councils 8310Block Advisory Committees 25Autonomous Development Councils 16
B. Total Urban Local Bodies 3682Municipal Corporations 96Municipalities 1494Nagar Panchayats 2092
5.45.45.45.4 Developments and IssuesDevelopments and IssuesDevelopments and IssuesDevelopments and Issues
Developments in decentralization process particularly during 1990s have
shown a highly diversified experience in terms of its effectiveness to achieve the
objectives being pursued. "The overall evidence… indicates that decentralization
has not advanced beyond the creation of democratically elected bodies at the level
of Panchayats and Municipalities and notwithstanding the recommendations of the
finance commissions of States, no worthwhile decentralization of power and
responsibilities has occurred or in sight" (Mathur, O.P. 1999). A 'Report Card'
prepared in the study by Mathur, O.P. and used by the World Bank Study (W.B,
2000) shows a dismal record of progress of decentralization in India as given in the
matrix form below :

119
Performance Capacity Institution BuildingPolicy Formulation •Largely unassisted • Inadequate •Limited autonomy
•Incomplete functional and Fiscal devolution•Wide inter-State differences
Accountability •Unassisted except in Selected cities
• Negligible •Inadequate or absent external accountability provisions
Service delivery and • Poor where assessed • Very •Overlapping jurisdictionsRevenue Collection • Some improvement in Inadequate Limited in selected cities
and States
Given the dimensions of the developments in terms of implementation of the
mandatory provisions in the constitutional amendments like periodic holding of
elections, legislative amendments at state level, constitution of various committees
at different levels, delegation and devolution from Centre and States to the local
bodies it is much beyond the scope of this study even to summarize the major
changes over the period. For the same reasons (dimensional aspects) any
generalizations on progress or performance of the local bodies could only be
misleading. While experiences and developments with decentralization in Kerala
State are reportedly exemplary in terms of success story at one extreme, some field
survey reports on the other extreme point out disastrous failure of local bodies in
the State of Uttar Pradesh and absolute systemic failure of the process in the State
of Bihar where even the mandatory process of decentralization has not been
completed.

120
Box : 5.3Box : 5.3Box : 5.3Box : 5.3Extreme examples of success and failure of decentralization process in IndiaExtreme examples of success and failure of decentralization process in IndiaExtreme examples of success and failure of decentralization process in IndiaExtreme examples of success and failure of decentralization process in India
First, the success story: First, the success story: First, the success story: First, the success story: Decentralisation, as Kerala's People's Planning Campaign hasshown, can lead to genuine empowerment of the disadvantaged groups, provided theyare not only given the representation they deserve in the elected local bodies because oftheir numbers but also their participation in the gram sabhas and other lower levelgroups, formed as part of the planning exercise for prioritization, plan implementationand beneficiary selection is insisted upon and properly monitored.
According to the information now made available, the major focus of theproductive schemes of the local bodies was on bringing additional area undercultivation, followed by the distribution of livestock, including poultry. The additionalarea brought under cultivation in the first three years is reported to be 3.16 lakh acresand the number of livestock distributed 21.43 lakh, of which poultry was 18.68 lakh.Under social welfare schemes the number of houses constructed under the local bodyplans was 3.06 lakh and the number of houses repaired was another 1.18 lakh. Inaddition, the number of toilets constructed during the same period was 4.13 lakh. Nodoubt these are impressive achievements in both the productive and social welfaresectors. It needs to be taken note also that while the share of the Scheduled Castes andScheduled Tribes population in the area additionally brought under cultivation was10.1 per cent, their share of the livestock distributed was 45.4 per cent. The share ofthese disadvantaged groups in new houses constructed was 38.25 per cent and in thenumber of houses repaired 49.2 per cent. Of the total number of toilets constructedunder the local plans, the combined share of the SC and ST population was 20.7 percent.
These figures suggest that while in the productive sector our disadvantagedgroups got their due share keeping in mind their combined population ratio of 11.1 percent, in the social welfare sector they have received significantly larger attention at thehands of the panchayati raj institutions.
(Source : Economic and Political Weekly, July 15-21, 2000. Editorial)[Also see Annex 5.2 on 'The Kerala Experience' by Vijayanand, S.M. (2000)]
The extreme example of failure:The extreme example of failure:The extreme example of failure:The extreme example of failure:A Gram A Gram A Gram A Gram Panchayat in Panchayat in Panchayat in Panchayat in Hathras District (Hathras District (Hathras District (Hathras District (Uttar Uttar Uttar Uttar Pradesh)Pradesh)Pradesh)Pradesh)
The Gram Sabha meeting was not held since at the Panchayat elections. Some ofthe village elders from the poor section of Balmiki caste approached the Chairperson(Jatav caste) to provide a tap for drinking water in their areas as they were not allowedto use the village well at times. Their request was turned down due to shortage offunds. A local retired school teacher raised this issue in the presence of the DistrictMagistrate and made a request to arrange a Gram Sabha meeting in 1996. On theorders from the official agency, the Chairperson convened a meeting and also mobilizedsupport from his community. It led to wide scale violence in the village assemblydeterring other groups to support the cause of Balmiki community. Besides, some fromthe Balmiki community were implicated in false police cases. The Balmiki communitystill awaits their tap connection.
[The above report is based on a filed survey undertaken by Kaushik P.D. as givenby him in his paper on 'Information Technology : Decentralization and the Rural Poor inIndia,' published in Gangopadhyay, S and Wadhwa, W (2000).]
The Expenditure Finance Commission while analyzing the process of
implementation of the 73rd and 74th amendments has come across several problem
areas which need to be looked into to make decentralization process effective.
(a)(a)(a)(a) Administrative and legal issues:Administrative and legal issues:Administrative and legal issues:Administrative and legal issues:

121
Notwithstanding the fact that all the States (except Arunachal Pradesh) have
either enacted a new Panchayat/Municipal Act or have brought the existing
legislation in conformity with the 73rd and 74th amendments there remain
significant gaps in administrative measures taken, uncertainties of role assigned to
the local bodies, and deviations from true spirit of amendments.
(i)(i)(i)(i) Schemes not yet transferred to local bodies.Schemes not yet transferred to local bodies.Schemes not yet transferred to local bodies.Schemes not yet transferred to local bodies. The EFC found that the
schemes relating to the subjects included in the Eleventh and
Twelfth Schedules have not yet been transferred by the States to the
local bodies. States' legislation merely enumerate the subjects
indicated in the two schedules but do not specify the schemes that
have to be implemented by these bodies as contemplated in articles
243G and 243W. Thus the funds and functionaries relating to these
schemes remain under the control of the departments of the State
governments.
(ii)(ii)(ii)(ii) Planning Committees not made operational.Planning Committees not made operational.Planning Committees not made operational.Planning Committees not made operational. The District Planning
Committees (DPCs) have not become operational in most States;
Metropolitan Planning Committees have not been constituted in any
State. On the other hand, in some States, DPCs have been entrusted
with executive functions, by which they overshadow the local bodies.
(iii)(iii)(iii)(iii) Extension of 73Extension of 73Extension of 73Extension of 73rdrdrdrd and 74 and 74 and 74 and 74thththth amendments either not complete or not in amendments either not complete or not in amendments either not complete or not in amendments either not complete or not in
true spirits. true spirits. true spirits. true spirits. Provisions of the Central Act 1992, had excluded out of
its purview Fifth Schedule areas falling in some 9 States. After the
Parliament had passed an Extension Act in 1996 these States were
to amend their existing Acts in consonance with the Extension Act
within a year (by Dec. 24, 1997). Except Bihar all other States have
amended their Acts. However, it has been noticed that these States
have kept provisions in such a way so as to make the extension to
scheduled areas meaningless because the powers have been retained
by the state governments themselves. (see Mahi Pal, May 2000 for
details). Further the Parliament has yet to pass the extension act for
the sixth schedule areas.
(iv)(iv)(iv)(iv) High degree of uncertainty in the role of local bodies. High degree of uncertainty in the role of local bodies. High degree of uncertainty in the role of local bodies. High degree of uncertainty in the role of local bodies. A hierarchical
structure of Panchayats has been contemplated in the States'
legislation with the intermediate level panchayats supervising the
village level panchayats and the district level panchayats
supervising, advising and coordinating the activities of village level
and intermediate level panchayats. However, the role of the three
tiers of the panchayats has not been clearly delineated in the State
legislation and the matter has usually been left to be decided by way
of executive instructions.
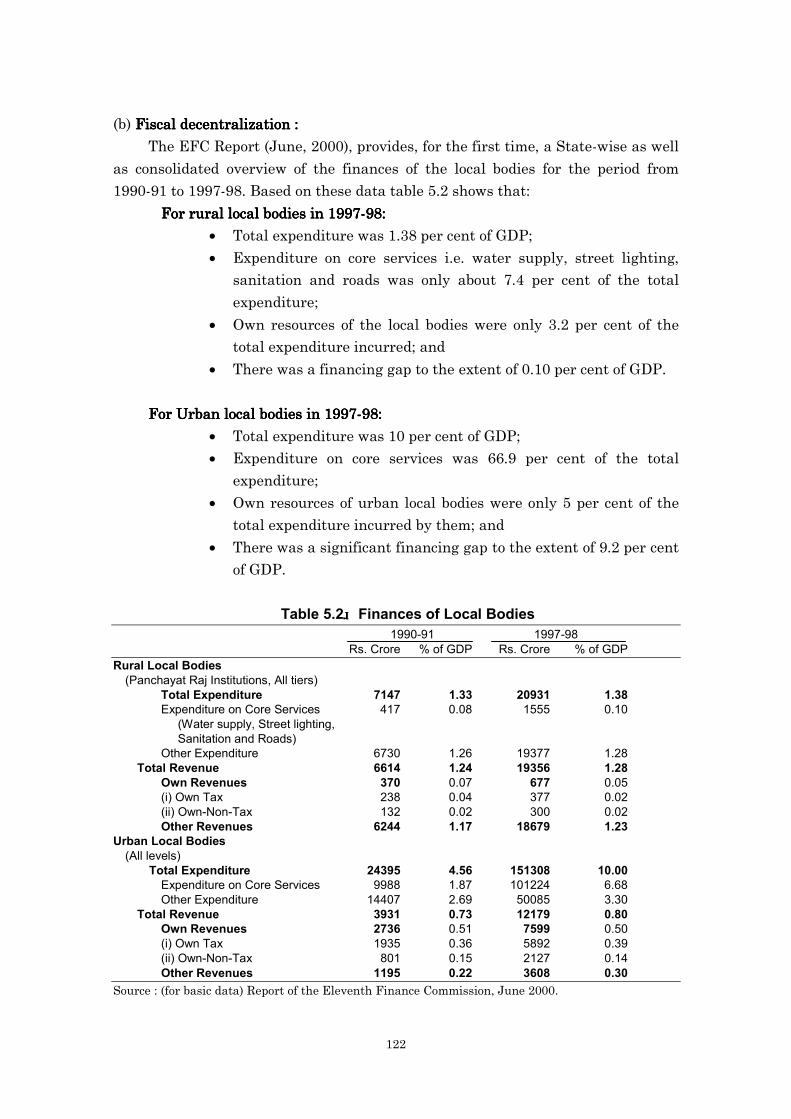
122
(b) Fiscal decentralization :Fiscal decentralization :Fiscal decentralization :Fiscal decentralization :
The EFC Report (June, 2000), provides, for the first time, a State-wise as well
as consolidated overview of the finances of the local bodies for the period from
1990-91 to 1997-98. Based on these data table 5.2 shows that:
For rural local bodies in 1997-98:For rural local bodies in 1997-98:For rural local bodies in 1997-98:For rural local bodies in 1997-98:
• Total expenditure was 1.38 per cent of GDP;
• Expenditure on core services i.e. water supply, street lighting,sanitation and roads was only about 7.4 per cent of the total
expenditure;
• Own resources of the local bodies were only 3.2 per cent of thetotal expenditure incurred; and
• There was a financing gap to the extent of 0.10 per cent of GDP.
For Urban local bodies in 1997-98:For Urban local bodies in 1997-98:For Urban local bodies in 1997-98:For Urban local bodies in 1997-98:
• Total expenditure was 10 per cent of GDP;
• Expenditure on core services was 66.9 per cent of the total
expenditure;
• Own resources of urban local bodies were only 5 per cent of the
total expenditure incurred by them; and
• There was a significant financing gap to the extent of 9.2 per cent
of GDP.
Table 5.2 Finances of Local Bodies1990-91 1997-98
Rs. Crore % of GDP Rs. Crore % of GDPRural Local Bodies
(Panchayat Raj Institutions, All tiers)Total Expenditure 7147 1.33 20931 1.38Expenditure on Core Services 417 0.08 1555 0.10 (Water supply, Street lighting, Sanitation and Roads)Other Expenditure 6730 1.26 19377 1.28
Total Revenue 6614 1.24 19356 1.28Own Revenues 370 0.07 677 0.05(i) Own Tax 238 0.04 377 0.02(ii) Own-Non-Tax 132 0.02 300 0.02Other Revenues 6244 1.17 18679 1.23
Urban Local Bodies(All levels)
Total Expenditure 24395 4.56 151308 10.00Expenditure on Core Services 9988 1.87 101224 6.68Other Expenditure 14407 2.69 50085 3.30
Total Revenue 3931 0.73 12179 0.80Own Revenues 2736 0.51 7599 0.50(i) Own Tax 1935 0.36 5892 0.39(ii) Own-Non-Tax 801 0.15 2127 0.14Other Revenues 1195 0.22 3608 0.30
Source : (for basic data) Report of the Eleventh Finance Commission, June 2000.
123
From an overview of the finances of local bodies it would appear that :
(a) The financing gap for the rural local bodies is not yet significant.
This could be primarily because the rural local bodies spend only
what is made available to them by the State government. In any case
these institutions would not have many sources of tax and non-tax
revenue at the local level.
(b) The finance gap with the urban local bodies on the other hand is
significant. This is mainly because while these institutions have the
sole responsibility of providing core services in the urban areas they
are administratively weak in realizing cost related user charges of
these services. Also these institutions, thus increasingly depend on
funds provided by the State government which in most cases remain
under severe financial constraint.
It is clear that fiscal decentralization is the key to the sustainability of any
decentralization effort. The noteworthy features of Kerala's financial devolution to
local governments clearly demonstrate the importance of fiscal decentralization. In
1996, a land mark decision was taken by the Kerala Government to allot more than
a third of the State's Plan Resources (i.e., invisible funds) to the local governments,
with the PRIs getting an 85% share in accordance with the rural population around
90% of the Plan funds is given in a practically untied form to the local governments
to prepare their own schemes and implement them within certain broad policy
framework. (see Annex 5.1 for details).
A word of caution may be in order. Various aspects of decentralization and
PRIs have been reviewed in 'Mid Term Appraisal of the Ninth Plan' recently
published by the Planning Commission (Oct., 2000), Government of India. One of
the conclusions based on field studies indicates an important shortcoming of the
system as follows:
"From these studies, it appears that though the ordinary village people feel
optimistic about the potential of panchayats, they think that it has not
brought the fruits of development to them. Corruption is singled out as the
most important cause for the ineffective functioning of these institutions.
Control which is exercised by the Sarpanch and Block Level officials over
Village Panchayats and Gram Sabhas has not only buttressed corruption,
but it has also led to pessimism that villagers on their own and at their level
cannot change or improve things because of heavy dependence on elected
functionaries and Block officials. The present system is, therefore, seen to
have actually reinforced dominance and unequal access to power, besides
rendering the villagers helpless and alienated." (Page 185).
The Eleventh Finance Commission did the whole exercise of analyzing the
developments on fiscal decentralization for local bodies because for the first time, a
124
finance commission, in its terms of references, was required to make
recommendations on the measures needed to augment the consolidated funds of
the States to supplement the resources of the local bodies on the basis of the
recommendations of the Sate Finance Commission (SFC). Also, the EFC was
required to make its own assessment wherever SFCs have not reported or even
constituted. It is in this process of assessment and recommending the measures
that the EFC has found significant problems and issues confronting the smooth
functioning of the fiscal decentralization from states to local bodies. State Finance
Commission mechanism could be found of not much help to the EFC. Study reports
sponsored by the EFC to two research institutions could not provide usable
estimates of financial requirements of local bodies. Perhaps the most intriguing
fact is that States' memoranda to EFC did not even give the position in regard to
transfer of powers, authority and responsibility or the financial powers devolved on
the local bodies to raise resources. The powers of taxation mentioned in the
legislation have been made subject not only to the rules, notifications and orders to
be issued by the State governments, but also to the procedures and limits to be
prescribed. Finally, in quite a few States action is yet to be taken. Some of the
important problem areas in fiscal decentralization as identified by the EFC are as
follows:
(a) SFCs mechanism is not working well.SFCs mechanism is not working well.SFCs mechanism is not working well.SFCs mechanism is not working well. The fact that EFC could not
utilize the outcomes of SFC mechanism is an indication enough of a
systemic failure. The EFC found that:
• There is no synchronization of the periods covered by the SFCs
with that of the Finance Commission.
• Many SFC reports have not addressed the specific terms listed in
articles 243I and 243Y, nor have they provided a clear idea of the
powers, authority and responsibilities actually entrusted to the
local bodies.
• In some States the action taken report (ATR) on therecommendations of the SFC is yet to be submitted to the state
legislature, despite the fact that the reports have been available
for about two to three years.
• Several important recommendations of the SFC, relating to
sharing/transfer of resources, are often reported to be under
consideration for months or even years.
• In some states, serving government officers are appointed aschairperson and members of the SFCs and that too in ex-officiocapacities. This puts limitation on the ability of the SFC to act as
an autonomous body to make recommendations in a free and
independent manner, as has been envisaged in the Constitution.
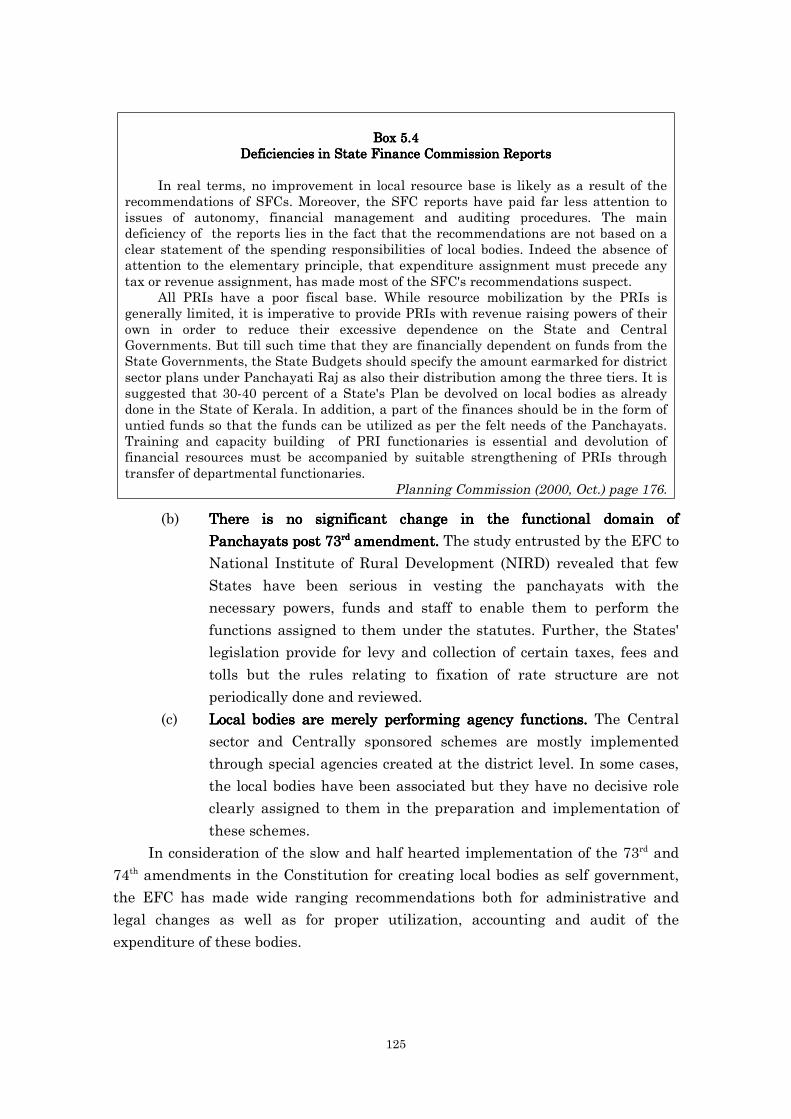
125
Box 5.4Box 5.4Box 5.4Box 5.4Deficiencies in State Finance Commission ReportsDeficiencies in State Finance Commission ReportsDeficiencies in State Finance Commission ReportsDeficiencies in State Finance Commission Reports
In real terms, no improvement in local resource base is likely as a result of therecommendations of SFCs. Moreover, the SFC reports have paid far less attention toissues of autonomy, financial management and auditing procedures. The maindeficiency of the reports lies in the fact that the recommendations are not based on aclear statement of the spending responsibilities of local bodies. Indeed the absence ofattention to the elementary principle, that expenditure assignment must precede anytax or revenue assignment, has made most of the SFC's recommendations suspect.
All PRIs have a poor fiscal base. While resource mobilization by the PRIs isgenerally limited, it is imperative to provide PRIs with revenue raising powers of theirown in order to reduce their excessive dependence on the State and CentralGovernments. But till such time that they are financially dependent on funds from theState Governments, the State Budgets should specify the amount earmarked for districtsector plans under Panchayati Raj as also their distribution among the three tiers. It issuggested that 30-40 percent of a State's Plan be devolved on local bodies as alreadydone in the State of Kerala. In addition, a part of the finances should be in the form ofuntied funds so that the funds can be utilized as per the felt needs of the Panchayats.Training and capacity building of PRI functionaries is essential and devolution offinancial resources must be accompanied by suitable strengthening of PRIs throughtransfer of departmental functionaries.
Planning Commission (2000, Oct.) page 176.
(b) There is no significant change in the functional domain ofThere is no significant change in the functional domain ofThere is no significant change in the functional domain ofThere is no significant change in the functional domain of
Panchayats post 73Panchayats post 73Panchayats post 73Panchayats post 73rdrdrdrd amendment. amendment. amendment. amendment. The study entrusted by the EFC to
National Institute of Rural Development (NIRD) revealed that few
States have been serious in vesting the panchayats with the
necessary powers, funds and staff to enable them to perform the
functions assigned to them under the statutes. Further, the States'
legislation provide for levy and collection of certain taxes, fees and
tolls but the rules relating to fixation of rate structure are not
periodically done and reviewed.
(c) Local bodies are merely performing agency functions.Local bodies are merely performing agency functions.Local bodies are merely performing agency functions.Local bodies are merely performing agency functions. The Central
sector and Centrally sponsored schemes are mostly implemented
through special agencies created at the district level. In some cases,
the local bodies have been associated but they have no decisive role
clearly assigned to them in the preparation and implementation of
these schemes.
In consideration of the slow and half hearted implementation of the 73rd and
74th amendments in the Constitution for creating local bodies as self government,
the EFC has made wide ranging recommendations both for administrative and
legal changes as well as for proper utilization, accounting and audit of the
expenditure of these bodies.
126
In the ultimate sense, however, it will all depend on the sincerity of purpose
with the State governments to see that the local bodies do function as the 'self
government' in its real effective form. No one can help filling up the pitfalls if theseNo one can help filling up the pitfalls if theseNo one can help filling up the pitfalls if theseNo one can help filling up the pitfalls if these
are created by those who are supposed to fill them up. There are clear examples ofare created by those who are supposed to fill them up. There are clear examples ofare created by those who are supposed to fill them up. There are clear examples ofare created by those who are supposed to fill them up. There are clear examples of
success stories on decentralization like those of success stories on decentralization like those of success stories on decentralization like those of success stories on decentralization like those of Kerala within the same frameworkKerala within the same frameworkKerala within the same frameworkKerala within the same framework
as available to other states. as available to other states. as available to other states. as available to other states. (see Annex 5.2 on Kerala experience) 'One must
understand that empowering panchayats and local governments in any developing
country is a critical economic and political issue. While the 'economics' part is fairly
clear, political hurdles are enormous since hierarchies which promote 'panchayats',
may not be interested in providing them with the required financial freedom.
(Marjit, S. 1999).

127
Annex - 1.1
Perspectives on Indian Economy :Highlights of Select Reports/Studies
For a synoptic view of overall assessment and perspectives on the Indian
economy an attempt has been made to select a few important studies/reports out
of the vast literature and present the main highlights from them. To keep the
assessment and perspective unbiased and balanced, the studies/reports selected
are from Government of India and the Reserve Bank of India, International
Institutions (IMF, World Bank, ADB, UNDP and JBIC) and academic studies
published by a few individual experts (with apology to all others).
1. Government of India : Planning Commission
The Ninth Five Year Plan (1997-2002) document is the most
comprehensive study available from the Planning Commission,
Government of India to ascertain the assessment and perspectives on the
Indian economy. The Plan was approved (in Feb., 2000) by the National
Development Council-the highest body on economic development headed
by the Prime Minister with members of Planning Commission, Cabinet
Ministers and Chief Ministers of the States as members. The document
provides specific objectives of the Planned economic progress of the country
for a medium term and also for the long-term.
'As we look back over the past 50 years of our development as an
independent nation, we can take justifiable pride in having successfully reversed
the worst inequities of our colonial heritage and building a nation of considerable
economic strength in a framework of democracy and federalism. We cannot,
however, overlook our shortcomings or to the magnitude of the challenges that lie
ahead of us. Despite all our achievements, one third of our citizens still live below
a modestly defined poverty line.'
(Excerpt from Prime Minister's 'foreword' to the Ninth Plan Document, Vol. I, Feb. 2000)
The focus of the Ninth Plan can be described as : "Growth with Social Justice
and Equity".
The specific objectives of the Ninth Plan as approved by the National
Development Council are as follows:
• Priority to agriculture and rural development with a view to generating
adequate productive employment and eradication of poverty;
• Accelerating the growth rate of the economy with stable prices;

128
• Ensuring food and nutritional security for all, particularly the vulnerable
sections of society;
• Providing the basic minimum services of safe drinking water, primary
health care facilities, universal primary education, shelter and connectivity
to all in a time bound manner;
• Containing the growth rate of population;
• Ensuring environmental sustainability of the development process through
social mobilization and participation of people at all levels;
• Empowerment of women and socially disadvantaged groups such as
Scheduled Castes, Scheduled Tribes and Other Backward Classes and
Minorities as agents of socio-economic change and development;
• Promoting and developing people's participatory institutions like
Panchayati Raj institutions, cooperatives and self-help groups;
• Strengthening efforts to build self-reliance.
(Ninth Five Year Plan-1997-2002, Vol. I)
2. Government of India : Finance Minister
In his budget speech (2000-01) the Finance Minister, Government of
India, declared the next 10 years as 'India's decade of development' and to
achieve this objective listed the elements of the strategy as follows:
A broad-based industrial recovery is under way. Despite lower growth of
agriculture due to inclement weather, overall economic growth this year is
expected to be nearly 6%. The infrastructure sector is performing much better. For
the first time in 17 years the inflation rate has stayed below 4% for 42 consecutive
weeks.
The next 10 years will be Indian's decade of development. To achieve this
objective our strategy must encompass the following elements:
• Strengthen the foundations of growth of our rural economy, especially
agriculture and allied activities.
• Nurture the revolutionary potential of the new knowledge-based
industries such as infotech, biotechnology and pharmaceuticals.
• Strengthen and modernize traditional industries such as textiles,
leather, agro processing and the SSI sector.
• Mount a sustained assault on infrastructure bottlenecks in power,
roads, ports, telecom, railways and airways.
• Accord the highest priority to human resource development through
programs and policies in education, health and other social services,
with special emphasis on the poorest and weakest sections of society.

129
• Strengthen our role in the world economy through rapid growth of
exports, higher foreign investment and prudent external debt
management.
• Establish a credible framework of fiscal discipline, without which the
other elements of our strategy can fail.
3. Government of India : Finance Ministry
Just before the presentation of the Union Budget, the Ministry of
Finance presents an annual 'Economic Survey' which besides covering all
the important sectoral developments in the economy during the year under
review, also brings out critical issues, challenges and priorities for the
macroeconomic policy. Some of the highlights of the assessment and
challenges given in the Economic Survey 1999-2000 are as follows:
• To sustain and accelerate the growth of our economy and employment, while
ensuring low inflation, our economic policies must combine fiscal discipline
with rapid economic reforms wherever necessary.
• More effective management of public finances continues to be the central
challenge facing all levels of government in India.
• Many of our administrative practices and methods have not changed since
colonial times. We need to introduce urgently modern management practices
in departments which provide well-defined services such as Posts or have well
defined objectives like tax collection.
• Many people feel that our legal system is creaking, if not collapsing, under the
burden of too many laws and too little enforcement.
• Laws and institutions constitute the "software" of the state and society. Their
reform and effective operation will be crucially important for successful
economic performance in the new millennium.
• Confronted by the continuing challenges of globalization the central lesson of
the nineties is to persevere with the thrust of our economic reforms. This
includes continued liberalization of our foreign trade, reduction of customs
tariffs, clear and decisive policies to encourage foreign direct investment,
continued prudence on external debt, carefully calibrated expansion of
convertibility on capital account and continued reliance on a market-
determined exchange rate policy.
4. Reserve Bank of India : Currency and Finance Report
Unlike in the past, for the first time, the Annual 'Report on Currency
and Finance, 1998-99' from the RBI is essentially a research document
focusing on the theme namely 'the structural transformation of the Indian
Economy' keeping the time frame of analysis the 'eighties and the 'nineties.
130
The report thus provides an analytical assessment of the economy with
recent developments in the backdrop of 'eighties and also 'the perspectives'
on the Indian economy. A few highlights from the first chapter on 'The
perspectives' are as follows:
• The Indian economy, as it moves into the twenty-first century, is poised to
further the institutional reforms that have been initiated in a structured
manner in the early 'nineties, for purposes of enhancing the prospects of
higher growth with enduring stability.
• The policy orientations in the last eight years or so have given considerable
resilience and dynamism to the economy, enabling it to realize, more
effectively, the gains from allocative efficiency.
• The Indian experience is, in several respects, fascinating. The adoption of
development planning in the early 'fifties was considered as unique. It was
also appealing. Over time, however, the experiment with planning has been
rendered ineffective by the introduction of a plethora of controls and licences.
The resultant inefficiencies, distortions and rent seeking activities had to be,
therefore, addressed by elimination of controls, freeing prices and building in
appropriate incentives.
• By the early 'eighties, it became evident that gradual liberalization and
opening up of the economy would need to be introduced through a process of
'learning by doing'. Accordingly, deregulation was initiated by relaxing the
energy barriers and the restrictive clauses in the MRTP Act, and by allowing
expansion of capacities. Modernization of industries through acquisition and
upgradation of technology was encouraged. Import restrictions, especially on
capital goods, were reduced. In the area of domestic financial sector, the yield
on long-term Government securities was raised, and measures to develop the
money market in India and to introduce new instruments were initiated.
• It is important to recognize that development planning has failed to deliver to
the expected extent because of absence of incentives and because of the
inadequacy of supportive institutions. The economy had become vulnerable to
external payment crisis by the beginning of the 'nineties, partly due to the
presence of the external factor, viz., the Gulf War, and partly owing to the
unsustainable fundamentals. The relatively high rate of growth in the second
half of the 'eighties proved to be fragile; in the context of the sharp increase in
the external current account deficit (CAD) and the steep rise in gross fiscal
deficit of the Central Government, respectively, to 3.2 per cent and 8.3 per cent
of GDP in 1990-91. The foreign exchange reserves declined to a mere US $ 975
million on July 12, 1991 (barely sufficient to cover the country's imports for a
week).
131
• The crisis was also reflected in the sharp downgrading of India's credit rating,
the curtailment of foreign private lending and the acceleration of inflation. The
correction to this situation required the application of a relatively
comprehensive macroeconomic and structural adjustment policies alongwith a
shift in the development strategy in favour of market orientation and provision
of appropriate incentives. The underlying thrust of such a regime shift is to
provide an environment that enables both growth and stability to move hand
in hand on s sustained basis.
• The experience of the 'nineties vis-à-vis that of the eighties shows that therehas been a marked structural transformation of the Indian economy.
• The 'nineties brought to the fore a number of challenges. Apart from the need
to containing fiscal deficit, there are issues relating to sustainable trade
position, the strategies to promote capital flows keeping in view their
implications for domestic monetary management and exchange rates, the
sustainability of external debt, and the nature and kinds of strategies need to
pursue legal and institutional reforms, and modern technologies, particularly
those affecting the payments and settlement systems in a synchronous
manner.
• The Indian economy has undergone a gradual transformation during the post-
independence period, the pace of such transformation, however, being
relatively rapid since the last decade.
• With the Indian economy shifting to a high growth path during the eighties, it
was evident that the economy has emerged from a phase of stagnation, which
had set in since the mid-sixties.
5. Reserve Bank of India : Monetary Policy background
Another first time from the RBI is a report on 'Macroeconomic and
Monetary Developments in 1999-2000' issued alongwith the statement on
Monetary and Credit Policy for the first half of the financial year 2000-
2001, on 27th April, 2000. This brief review of macroeconomic provided an
insight in the recent developments. A few highlights are a follows:
The recent trends in real GDP growth highlight three distinct though inter-
related developments in the real economy.
• First, there has been a significant decline in the overall saving and
investment rates in the economy since they peaked in 1995-96, largely on
account of a sharp decline in public saving.
• While the gross domestic saving rate declined from 25.5 per cent of GDP in
1995-96 to 22.3 per cent in 1998-99, the gross domestic capital formation
rate fell from 27.2 per cent to 23.4 per cent during this period. The public
saving rate declined from 2.0 per cent in 1995-96 to near zero in 1998-99.
132
While household saving rate remained flat at 18.5 per cent, between 1995-
96 and 1998-99, the private corporate saving rate moved down from 5.0 per
cent to 3.8 per cent.
• Available indicators imply a mixed prospect in the saving front for 1999-
2000. The rates of expansion of both currency and aggregate deposits in
1999-2000 have been lower than those in the previous year. On the positive
side, the household saving is expected to get a boost from the revival of
equity market and a substantial increase in small savings (gross) and
provident fund collections.
• The private corporate saving is expected to improve in 1999-2000 given the
early trends in profit after tax. On the other hand, the saving performance
of the public sector may exhibit a further deterioration as revealed by the
large increase in the revenue deficit of the central government in the
revised estimates of 1999-2000. The advance estimates of GDP growth for
1999-2000 has been placed at 5.9 per cent. Implicit in this estimate would
be an investment rate of 22 to 24 per cent that would be consistent with
the trend value of the incremental capital-output ratio (ICOR).
• Secondly, growth impulses in recent years seem to have emerged fromproductivity growth in the economy. The underlying permanent component of
ICOR is estimated to move down from 4.1 in 1995-96 to 3.9 in 1998-99. There
has also been evidence of significant improvement in total factor productivity
in the economy during 1990s.
• Thirdly, cyclical factors, both in the demand and supply sides have played arelatively large role in the growth experience of recent years. While supply
cycles reflected fluctuations in agricultural growth, demand cycles have
largely followed the trends in consumption and investment of the private and
public sectors. Private consumption demand witnessed a decline from 72.1 per
cent of GDP in 1980-81 to 63.7 per cent of GDP in 1995-96 and further to 63.3
per cent of GDP in 1998-99. Public consumption, on the other hand, has
remained steady at around 10 to 12 per cent of GDP in 1980s and 1990s.
Investment demand has fallen sharply in the public sector from over 10 per
cent of GDP in 1980s to around 6 to 7 per cent in the second half of 1990s
which was only partly corrected by increase in the private investment demand
(from around 10 to 14 per cent of GDP in 1980s to 15 to 18 per cent in the
second half of 1990s).
• These structural and cyclical factors in the growth dynamics have implications
for monetary policy in terms of their impact on the potential and actual output.
While the developments in the potential output have a bearing on the medium
to long term stance of monetary policy, the monetary policy would itself matter

133
to the growth outcomes in the short-run through credit, interest rate,
exchange rate and other mechanisms.
6. World Bank
The World Bank report on 'India: Policies to Reduce Poverty and
Accelerate Sustainable Development', January 2000, is a pilot in the World
Bank's new approach to country economic reports, embodying the Bank's
Comprehensive Development Framework. The new approach to economic
reports provides a medium-term perspective and the economy's potential
vulnerabilities, including those in the short run. A few highlights of the
report on overall assessment and perspectives on the Indian economy are
as follows:
• India's trend growth of 5.7% p.a. since 1980 is the highest outside Southeastand East Asia among large developing countries. However, despite this
relatively high growth, poverty incidence is still 34% and India's economic
structure remains relatively unchanged.
• By comparison, even after the Southeast Asian crisis, Korea, Thailand and
Indonesia have substantially higher per capita incomes and social indicators,
and considerably lower poverty than India, although the countries had similar
per capita incomes in the 1960s.
• The experience of Southeast Asia suggests that India needs sustained, higher,
more labor-using, outward-oriented growth, coupled with improved social
service delivery, in order to reduce poverty.
• A rapid reduction in India's poverty and increased growth will depend on a
second wave of reform, as all recent governments have recognized. Reducing
poverty and increasing development will depend on a comprehensive
framework that improves access of the poor to education and health services,
improves infrastructure, and provides good governance, transparency, a sound
legal and judiciary system, a strong financial system, and human and
environmental sustainability. Sustained development will also critically
depend upon continued sound macroeconomic policy, namely:
• Greater openness to trade, to encourage more efficient resource use and
increase labor demand, and
• Sounder public finance, namely reduced subsidies and deficits and the realignment
of government away from non-core public sector activities and consumption
spending and towards more and better infrastructure and basic social services.

134
India and High Growth East Asia : A statistical ComparisonGDP Per Capita 1997 National GDP Openess/a Investment Rate/b Literacy Rate/c
PPPS $ Current 1996/ 1996/ 1997/ 1970 1997 1970 1996 1970 1997
$ 1970 1970 1977
Growth Growth (Female)(Female)
Rates p.a. Rates p.a.
India 1510 451 3.4 4.7 5.2 7.2 17.8 14.6 22.9 33.6 62.0
(18.1) (50.0)
China 3120 745 5.9/c 10.5/d 10.4/e 11.2/e 35.4 28.3/f 33.8 51.7 82.9
(35.8) (74.5)
Indonesia 3490 1079 5.6 6.9 6.4 22.9 44.1 13.6 31.8 56.3 85.0
(44.0) 79.5)
Korea 13580 9623 8.1 8.4 7.8 32.2 63.6 23.0 35.0 86.6 97.2
(79.8) 95.5)
Malaysia 8190 4544 6.3 7.3 7.1 77.8 159.7 17.7 42.4 58.3 85.6
(46.1) (81.)
Thailand 6690 1959 6.5 7.5 7.3 28.4 77.3 23.7 35.6 80.0 94.7
(72.7) (92.8)
a. Openess equals total trade (exports+imports) as share of GDP.b. Gross fixed investment as a share of GDP.c. Figures in the brackets are female literacy rates.d. Data pertains to 1978-1996.e. Data pertains to 1978-1997.f. Data pertains to 1979.Source : IMF, International Financial Statistics; World Bank, World Development Indicators.
• Although India's growth has been among the fastest in the world and povertyhas fallen in the last twenty years, the poor still number over 300 million,
more than in all of Sub-Saharan Africa. And, despite the growth, little has
changed structurally: trade remains a much smaller percentage of GDP. East
Asian countries including China, almost 73% of the people living in rural areas,
and social indicators, despite improvement, still low. India's human
development and per capita consumption has not risen nearly as fast as in
East Asia, even taking into account East Asia's recent crisis.
• A Second Wave of Reforms will be needed to achieve this poverty-reducing
growth and banish the risk of a slowdown including macroeconomic, structural
policy reform, governance and institutional concerns.
7. International Monetary Fund (IMF)
The 'World Economic Outlook', published twice a year presents IMF
staff economists' analysis of global economic developments during the near
and medium term. The May, 2000 'Outlook', contains a 'box writeup' on
'India: Reinvigorating the Reform Process' wherein in the backdrop of an
incisive analysis of the Indian economy over a period the perspective is
also presented. A few highlights are as follows:

135
• India has been among the fastest-growing economies in the world over the last
two decades, and has achieved trend improvements in growth, literacy,
mortality, and poverty rates. In recent years, deft handling of monetary policy
has helped India to successfully weather the Asian crisis, while maintaining
low inflation and a comfortable external position. Yet despite these gains,
poverty rates remain high, with more than a third of the population still living
below the official poverty line. This uneven progress raises questions about the
impact of the economic and structural reforms implemented since the mid
1980s on growth in India, and what more can be done to make greater inroads
into poverty reduction.
• In the three decades following independence in 1947, growth in India was
stifled by a high degree of government planning and regulation, with per
capita GDP rising by only 1.5 per cent per annum. Industrial controls were
pervasive, and restrictions on private credit, the role of the public enterprise
sector, and subsidy programs increased throughout the period. Strict controls
on foreign direct investment, in import licensing system, and from the 1970s-
high tariff rates further limited the economy's growth potential.

136
Expenditure and Sectoral Components of Growth1
(Average annual percent unless otherwise noted)
1951-79 1980-90 1992-96 1997-992
Real per capita GDP growth3 1.5 3.8 4.7 4.1
Real GDP growth3 3.7 5.9 6.7 5.8
Contribution to growth,
by expenditure item:
Private consumption 2.4 3.8 3.9 2.5
Public consumption 0.4 0.8 0.5 1.4
Gross fixed investment 0.8 1.5 1.9 1.2
Private investment … 0.8 1.8 0.9
Public investment … 0.6 0.1 0.3
Net exports4 … 0.1 0.1 0.6
Contribution to growth,
by sectors:
Public 1.1 1.7 2.8 5.2
Private 2.2 4.2 3.8 0.7
Contribution to growth,
by sectors:
Agriculture 1.1 1.6 1.4 0.5
Industry 1.0 1.7 2.0 1.5
Services 1.4 2.5 3.2 3.8
ICORs, by sector:5
Overall … 4.2 4.1 4.8
Agriculture … 2.0 1.5 2.6
Industry … 5.7 6.8 10.7
Services … 4.0 2.9 2.1
Source : Central Statistical Organization (CSO), National Accounts Statistics.1Averages computed over fiscal years beginning in April.21999 figures on GDP and sectoral production are CSO Advance Estimates; annual population
growth assumed constant at 1.7 percent; average contribution of expenditure categories and privateand public production computed over 1997-1998.
3Measured at market prices; base year is 1980 for data until 1993, and 1993 thereafter.4Includes statistical discrepancy.5The incremental capital output ratio (ICOR) is the ratio of the investment rate to the GDP
growth rate; a falling ICOR over time therefore indicates improved capital productivity.

137
Explaining India's Relative Growth Performance
Estimated Difference in
Average Value (percent) Contribution to Growth Rates1
India East Asia (percentage points)
Factors contributing to growth
during 1970-95
Investment/GDP 21.9 29.6 -1.2
Net FDI/GDP 0.1 2.5 -0.8
Trade/GDP 4.5 113.5 -1.1
Government consumption/
GDP 10.3 10.4 0.0
Secondary school enrollment
Rate 35.2 50.5 -0.3
CPI inflation rate 8.8 8.4 0.0
Convergence effect and
Other factors … … 0.2
Real per capita GDP growth
(1970-95 average) 2.4 5.7 -3.3
Source : P. Kongsamut and A. Vamvkidis, "Economic Growth," Chapter 2 in Philippines: TowardSustainable and Rapid Growth, IMF Occasional Paper No. 187 (Washington: InternationalMonetary Fund, 2000).
1Calculated as the estimated coefficient times the difference in the independent variable value(India less East Asia). Reported differences in growth rates of real per capita GDP are actual.
• Faster growth would require durable fiscal consolidation to raise national
saving and crowd-in private investment spending; further liberalization of
foreign trade and investment flows; and additional reforms to labor markets
and in the agricultural, industrial, and financial sectors to promote greater
efficiency and export competitiveness. These reforms need to include removal
of domestic pricing distortions, improvements to bankruptcy procedures, and
an easing of restrictions on firm and farm size and regulations that make it
difficult to shed labor (and therefore impede job creation). Fiscal priorities
also need to be redirected toward investment in human and physical capital.
8. United Nations (UN)
In June 2000, UN has brought out a Report on 'India: Common
Country Assessment'. The Common Country Assessment (CCA) is the first
step towards developing the 'United Nations Development Assistance
Framework' (UNDAF) - a strategic framework that enables the UN system
to act with a common vision, purpose and approach to accelerate human
development. Preparation of the UNDAF in India was validated by the
Triennial Comprehensive Policy Review resolution of the General

138
Assembly passed in 1998. The Framework is being developed in
collaboration with the Government of India.
The CCA assesses the country's development situation in the context of
national development priorities. A few highlights of the assessment of
Indian economy contained in the CDA are as follows:
• India has achieved considerable success along several dimensions of human
development over the past 50 years. Distinctly visible are the significant
expansion and diversification of production, made possible by the application
of modern science and technology and the introduction of modern management.
Between 1950-51 and 1997-98, for instance, the index of agricultural
production increased nearly four fold, the index of industrial production went
up from 7.9 to 137.6, and electricity generation increased from 5.1 billion kwh
to 421 billion kwh. Between 1960-98, wheat production went up from 11
million tonnes to 66 million tonnes, and the production of rice increased from
35 million to 82 million tonnes. All this has contributed to a steady and
impressive growth in India's GDP. With the exception of 4 years, the country
has recorded a positive growth rate in its GDP every years since 1950.
Between 1950-51 and 1980-81,over 30 years, India's GDP grew at an annul
average rate of 3.6%.
• However, after 1981, and particularly after the mid 1980, India's GDP began
to grow much faster. Between 1980-81 and 1990-91, it grew on average by
5.7% per annum. Annum growth in GDP fell sharply to 0.8% in the crisis year
of 1991-92, but revived quickly to around 5% per annum in the two subsequent
years before reaching a high of 7.7% in each of three successive years. GDP
growth rates fell again to 5% in 1997-98 and improved marginally to 6% in
1998-99.
• India's growth record in recent years has been particularly impressive giventhat it has been able to avert the fiscal crisis that many East Asian economies
experienced over the past few years. India has been able to record a steady
growth in its per capita income as well. Between 1950-81, the annual average
rate of growth in per capita income was around 1.2%, but since then, there has
been a significant change. Between 1980-91, per capita Net National Product
grew on average by 3.1% every year. The financial crisis of the early 1990s saw
a slowing down in the growth of per capita income, but there has been quick
recovery. Per capita NNP has grown on average by 5.2% every year between
1993-98.
• Achievements have also been recorded in many spheres of social development.
Life expectancy at birth has gone up from 32 years at the time of
Independence to 61 years in 1998.

139
• India has put in place an extensive system of public health services. Table 1
shows the expansion in health services between 1951-97. Remarkable progress
has been achieved in immunizing children, and in the control and eradication
of guineaworm. Since the 1960s, infant mortality has been halved to 71 deaths
per 1000 live births in 1998.
Achievements ShortfallsHealth
• Life expectancy at birth has doubled to 61years between 1950-97.
• Infant mortality has been halved between1960-98 to 71 deaths per 1000 live births.
• Guineaworm has been almost eradicated.• Significant gains have been made in the
control of communicable diseases, and in theeradication of polio.
• An extensive public health and medicalsystem has been put in place.
• Close to 2 million children annually die before reachingthe age of one - and most of these deaths areavoidable.
• Maternal mortality remains high - 437 deaths per100,000 live births. Maternal mortality accounts for20% of the world's death from pregnancy relatedcauses.
• Only 35% of children between 12-23 months werefound to be fully immunized in 1992-93.
• Quality of public health care leaves much to bedesired.
Education• Literacy rates have gone up from 18% to 52%
between 1951-91.• Significant gains have been made in the field
of higher education - in medicine, technologyand management.
• Some 95% of villages have a primary schoolwithin walking distance of one kilometer.
• Some 69 million children between 6-14 years of ageare out of school.
• Against the Constitutional requirement of ensuring freeand compulsory education for 8 years, the averageyears of schooling is only 2 years.
• Discrimination on the ground of caste, class andgender continues to deny children equal access togood quality basic education.
Water and sanitation• Some 90% of urban population have access
to safe drinking water.• Nearly 87% of rural population have access to
safe drinking water.
• Water contamination by arsenic, fluoride and otherchemicals pose a serious threat.
• Indiscriminate drilling has led to rapid depletion ofwater in many parts.
• 20% of rural population have access to latrines.Income poverty
• Between 1973-74 and 1993-94, theproportion of rural population below thepoverty line has come down from 56.4% to37.3%.
• Between 1973-74 and 1993-94, theproportion of urban population below thepoverty line fell from 49% to 32.4%.
• There were 321 million people below the incomepoverty line in 1973-74. By 1993-94, the number hadcome down to 320 million.
• In 1993-94, there were 244 million people in ruralareas below the income poverty line.
Food and nutritional security• The yield per hectare of wheat has gone up
from 11 million tonnes to 65.9 million tonnesbetween 1960-98.
• Between 1951-98, per capita food availabilitywent up from 395 grams per day to 484grams.
• The country has built up a reserve stock offoodgrains-around 20 million tonnes in 1999.
• Some 53% of children below the age of five remainmoderately and severely malnourished (under-weight).
• Nearly 75 million children below the age of five yearmalnourished-the largest number in the world.
Gender• Constitutional Amendments have ensured
that one-third of all seats in local elections arereserved for women.
• The singular mean age at marriage forwomen has gone up from 18.4 years in 1981to 20 years in 1992-93.
• Total Fertility Rate has come down from 4.9 in1982 to 3.4 in 1992-93.
• The female-to-male population ratio remains adverse-and has been worsening.
• Instances of female feticide and infanticide areregularly reported.
• Women constitute less than 10% of elected Lok Sabha(Lower House of Parliament) members.
• Female illiteracy rates remain unacceptably high.
140
9. Asian Development Bank (ADB)
ADB brings out an Annual Report "Asian Development Outlook". The
'Outlook 2000' contains a review of the Indian economy along with the
challenges being faced. A few highlights are:
• The recovery is being sustained, and the new government passed several
important reform bills at the beginning of its term. However, the unfinished
agenda of economic reform remains substantial. In particular, while reforms
undertaken so far clearly have helped promote economic growth, progress has
been less impressive in developing better social opportunities for the poor.
• Dependence on the private sector and markets does not mean that the
government has no role. Reorienting its contribution to the economy is crucial,
and government can help create conditions for accelerated growth.
• Infrastructure bottlenecks are likely to constrain the achievement of a higher
growth rate of 7 per cent and above.
• The poor state of human resource development is an even more serious
constraint to sustainable development.
• Restructuring public sector enterprises through disinvestment or privatization
must be accelerated.
• The economic reforms undertaken have yielded good results, but progress has
been less impressive in terms of better social opportunities for the poor.
• The government needs to spend more in education and health, but not only
because investments in human capital are instrumental for economic growth.
10. OECF (Now JBIC)
In its Annual Report 1999 OECF (now JBIC) had made the following
important observations regarding India :
• After the economic crisis caused by the Gulf Crisis in 1991, the Government of
India had launched economic reforms including making up the budget deficit,
deregulation, liberalization in trade and investment, and reforms in financial
sector, those which rewarded with good results in some extent.
• In India, the need to improve economic infrastructure such as electric power,
which constitutes the greatest impediment to economic growth, remain as
high as ever. In addition, there is going to be an increasing demand for
confessional funds allocated specifically in the social and environmental sector,
such as water supply and sewerage, agricultural and rural development,
primary education, and medical treatment and health care, etc. furthermore,
in view of the needs to consider global environmental problems like global
warming, it will be essential to make every effort to minimize the impact on

141
the environment when promoting the improvement of economic infrastructure,
particularly in the transportation and power and energy sectors.
11. Vijay Kelkar :
In an article (EPW, August 14, 1999) on 'India's Emerging Economic
Challenges', Vijay Kelkar (ex-Finance Secretary, Government of India)
provides a review of the strategic policy failures which landed the Indian
economy, till very recently, in a low productivity, low growth impasse and
a discussion of the critical areas to focus on in the next phase of economic
reforms. A few highlights are as follows:
• In the last few years, the Indian economy has been a sea of tranquillity in the
turbulent world economy, especially in Asian region. In fact, in the year 1998
India achieved one of the highest growth rates in the world and this year the
growth rate is expected to be higher than last year. Equally, in terms of other
macro-economic indicators, such as the rate if inflation or exchange rate
stability, once again the performance of the Indian economy in recent years
has been quite outstanding. The rate of inflation is less than 4 per cent and
exchange rates have been relatively stable. There is, in fact, some evidence
that during the nineties the growth rate in India has shown some acceleration.
However, there are a number of weaknesses which we need to overcome to
meet the objective of rapidly removing poverty.
• Seen in the context of the contemporary experience of other economies of Asia,
such as China, Japan or South Korea, our performance is far short.
• When a satellite is put into orbit, it require high velocity to ensure exit from
the earth's gravitational force; similarly, if our economy is to exit from the
gravitational pull of poverty, it requires an exit velocity of double-digit growth
rate over the next two decades.
• At present we are among the bottom 20 of the all the countries in terms of
Human Development Index. In the year 2020 we should be among the first 20.
This is possible and it is entirely up to us to build the necessary consensus for
accelerated reform and implement it.
12. Nirupam Bajpai and Jeffrey D Sachs
Based on the ongoing analysis of India's economy at the Centre for
International Development (CID) in the Kennedy School of Government at
Harvard University, USA as well as discussion that the authors benefited
from during a trip to India earlier this year, Nirupam Bajpai and Jeffrey D
Sachs in an article (EPW, April 15, 2000) on 'India's Decade of
Development' have summarized ten crucial initiative of reform to make the
142
first decade of the 21st century a true 'Decade of Development' for India.
These relate to (I) Universal literacy, (ii) Aggressive public health complain,
(iii) Enhanced family planning policies, (iv) Completion of economic reform
agenda, (v) Political Decentralization, (vi) Enhanced global role for India,
(vii) Commitment to IT backbone, (viii) Strengthening of
economic/cultural/financial/ investment/scientific ties to overseas Indian
communities, (ix) Strengthening Science and Technology in India's
development policies, and (x) Major commitment to Indian higher
education. Some of the highlights are:
• We concur that India has a chance for a tremendous breakthrough in
economic development this decade. We suggest at least two broad goals that
the government of India may like to set for itself :
• First, by the year 2010, the per capita income of India would be doubled.
Income doubling within a decade requires annual growth in per capita
income of 7 per cent per annum.
• Second, by the year 2010, there would be universalisation of education
until Class VIII, with a special effort for girls and disadvantaged groups.
• Additional targets could well be set regarding health conditions and access to
basic services, such as sanitation, clean water, telecoms, power, and so on,
particularly in rural India.
• To make the first decade of the 21st Century a true 'Decade of Development'
will require a broad-based program of economic and social actions. These
actions will have to be broad-based, requiring new approaches and legislative
reforms in many areas of public policy. The Decade of Development cannot
rest on an unstable fiscal base. Unless substantial fiscal consolidation is
achieved, in our view, continued fiscal deficits pose India's greatest risk to
future destabilization.
• The government needs to promote exports through greater emphasis on
export processing zones, the elimination of product reservation for small-
scale industry, the encouragement of the IT sector, the elimination of
administrative barriers to foreign direct investment, and the elimination of
tax and tariff structures that are anti-export biased.
• India could have achieved what China has achieved in export growth, but
India failed in basic policy strategy.
• Service-sector export based on information technology (IT) is another areas
where the government's policy could do much more to spur export growth.
India is becoming one of the most important players of the world in the IT
sector and it is the fastest growing foreign exchange earner for India. We
believe that the government could do more for this industry, not through

143
direct subsidies necessarily, but actually through liberalization of telecom,
allowing for lower priced telecommunication services, by allowing new
entry of major international players in telecom.
• Economic reforms by themselves are not sufficient to achieve India'sdevelopment goals. A growing body of economic evidence suggests that
social progress - such as increased life expectancy, reduced disease burdens,
lower fertility rates, and improved educational attainments - are at least as
important as the narrower economic policies in meeting goals of higher
economic policies growth and raising living standards. Thus, social goals
are crucial not only in and of themselves, but also for what they contribute
to economic dynamism.
13. Martin Ravallion
A recent special article on 'What is Needed for a More Pro-Poor Growth
Process in India?' by Martin Ravallion published in EPW, March 25, 2000,
synthesizes some recent research findings that help answer the question
as the what conditions are required for more pro-poor growth in the future.
A few conclusions:
• Agriculture growth reduces rural poverty directly, and it foster the conditions
for pro-poor growth in the (urban and rural) non-form sector.
• Without higher and more stable agricultural growth, it will be hard to restore
India's momentum in poverty reduction.
• Agriculture, infrastructure and social spending (especially in lagging rural
areas) will need to get high priority before the poor will be able to participate
fully in India's post-reform economic growth. The conditions for assuring more
pro-poor growth may not develop very quickly, but there is no time like the
present to start.
14. T.N. Srinivasan
In a recent (Oxford, 2000) Volume on 'Eight Lectures on India's
Economic Reforms', T. N. Srinivasan (Samual C. Park, Jr. Professor of
Economics and Chair, Department of Economics at Yale University) has
reviewed :
• The reforms undertaken in major sectors of the Indian economy including
agriculture, industry, foreign trade and investment, infrastructure, education
and health, and financial markets. Their relevance for the overall objective of
poverty eradication is also examined.
• Srinivasan concludes that with further expansion of reforms and India's
integration with the World economy, rapid and sustained growth is achievable.

144
15. Jean Dreze and Amartya Sen
In the book on 'India : Economic Development and Social opportunity',
Oxford (1995), the authors have emphasized:
• The need to take the debates on economic policy well beyond the issue ofeconomic reforms in their present form.
• The Authors have argued for the necessity of askingand addressinga verydifferent set of questions, rather than confining the analysis to examining
different answers to the old familiar questions. The central issue, they have
argued, is to expand the social opportunities open to the people. In so far as
these opportunities are compromiseddirectly or indirectlyby
counterproductive regulations and controls, by restrictions on economic
initiatives, by the stifling of competition and its efficiency-generating
advantages, and so on, the removal of these hindrances must be seen as
extremely important.
• Debates on such questions as the details of tax concessions to be given tomultinationals, or whether Indians should drink Coca Cola, tend to 'crowd out'
the time that is left to discuss the abysmal situation of basic education and
elementary health care, or the persistence of debilitating social inequalities, or
other issues that have a crucial bearing on the well-being and freedom of the
population.
16. C. Rangarajan
In a collection of his essays on 'Perspectives of Indian Economy' (2000,
UBS), c. Rangarajan (Ex-Governor, RBI and present Governor of Andhra
Pradesh) has included an essay on Indian Economy : The Years Ahead' in
which with a detailed historical perspective the medium-term prospects are
given as follows:
• Over the medium term, the broad economic parameters do point to the
feasibility of the economy growing around 7 per cent per annum. With the
domestic savings rate ranging between 25 per cent and 26 per cent and even
with a modest current account deficit of 2 per cent of the GDP, a growth rate of
7 per cent is possible, with the ICOR remaining more or less at 4. With an
improvement in the savings rate and better efficiency in the use of capital, it
may be possible to even improve on this growth rate. Perhaps even to grow at
7 per cent comfortably, an improvement in the savings rate is required. This
can be achieved if the fiscal deficit is brought under control and the public
savings rate rises. All these broad parameters only indicate that the necessary
conditions exist for achieving a 7 per cent rate of growth.
In a more recent article (EPW, April 15, 2000) on 'State, Market and the
Economy Dr. Rangarajan has reviewed critical issues in the ongoing debate on

145
perhaps the most important topic that of state v/s market and has suggested
as follows:
• The serious question which we have to address is not one of either state of
market, but one of how much state intervention, what kind and by what
means.
• The crucial factor for determining the mix is that of comparative efficiency. It
is necessary to create a matrix of activities and the kind of intervention and
determine for each activity what form of intervention is best. The matrix can
take the following form:
Activities Manu- Physical Social Financialfactures Infrastructure Infrastructure and other
ServicesIntervention
MarketState(a) Direct investment(b) Regulatory(c) Indicative(d) Unbundling
17. Dr. Y. V. Reddy
In a recent (June 2000, RBI Bulletin) article on Pro-Poor Growth : New
Realities and Emerging Questions' Dr. Y. V. Reddy, Deputy Governor, RBI has
brought out an innovative thinking and suggested a new approach towards
India's problem of eradication of poverty.
• The Approach : In the ultimate analysis, markets, however, efficient they are,are not democratic institutions in the strictest sense, since customer's vote is
proportionate to his/her purchasing power. Secondly, labour is different from
capital since the owner of capital can withhold if he/she thinks that the return
is not adequate while labour cannot withhold because it will then not be able
to survive. He or she has to work to live. Thirdly, the poor can give according
to their ability but if such abilities cease to have markets, they cannot get
what they need even if the need is minimal. Fourth, resource-transfer to the
rich is described as 'incentives' while income-transfer to the poor is described
as a 'subsidy' - commonly perceived to be a derogatory term. Finally, pro-poor
oriented growth is thus possible when intellectual community and policy
makers treat markets with the suspicion that they deserve and the poor with
the respect that they need.
• A suggestion : Indeed, it may be useful to explore a Poverty Alleviation Forum
(PAF) with close involvement of corporates, technology-leaders, financial
intermediaries, and non-Governmental organizations or self-help groups, say

146
under the aegis of an international organisation such as the ADB. The main
objective of such a forum should be to arrive at a consensus on managing
globalisation, while ensuring not merely financial stability, but also poverty-
alleviation.
And finally,
• Indian Economy is to grow in close cooperation with Japanese Economy.
• Japanese Prime Minister Yoshiro Mori, during his recent visit to India on
21st August, 2000 had the following to say in a press interview in
Bangalore, India :
“I understand that India is an advanced nation in the IT
sector and I intend to create opportunities to forge close
cooperation between Japan and India through both the
government and the private sector.”
--Times of India, 22nd August, 2000.
• Earlier and not long ago, on March 29, 2000 in Mumbai, India,
Dr. Eisuke Sakakibara, former Vice Minister of Finance for International
Affairs, Japan, in his Exim Bank Commencement Day Annual Lecture,
2000 on “Asia in the 21st Century” The Role of India and Japan had
observed the following :
“India and Japan could play a catalytic and strategic role
in spreading and enhancing IT revolution and globalization
in Asia, as well as to defend the region from negative
aspects of the revolution. I think that the time has come
for India and Japan to make strenuous efforts to quickly
improve and expand our bilateral relationship and to take
the leadership role in promoting regional cooperation in
greater Asia.”

147
Annex - 1.2
An Overview of Policy Recommendations of the Country FrameworkReport for India, under the Auspices of the World Bank Group's
Infrastructure Action Program, with funding from the WorldBank and the Japanese government
(World Bank, 2000)
There has been some progress since the infrastructure sectors were opened
to private investment. But a deepening of reforms will be required if the private
sector is to make a full contribution to meeting India's infrastructure needs.
Telecommunications
Strengthen the regulator's role
• Amend legislation so that TRAI has clear authority over interconnection
and all tariffs for service provision in the sector.
• Develop clear policy guidelines that the Telecom Regulatory Authority of
India (TRAI) can observe when making rulings to reduce the scope for ad
hoc, after-the-fact intervention by the central government.
• Strengthen TRAI's role in influencing opening of sector and introduction of
new service providers by giving it a formal role in the licensing process and
the introduction of new service providers.
Open telecommunications markets
• Liberalise long-distance voice and data services without delay.
• Establish standard qualification requirements for opening fixed services
and allowing qualified new players to enter.
• For long-distance and local fixed services, set license fees at low levels that
recover the costs of regulation alone.
• Initiate the liberalisation of international services.
• Introduce new entrants to cellular, concomitant with the proposed
migration of existing license holders to a revenue-sharing regime.
• Lift the restriction on Internet telephony--because it is difficult to enforce,
hinders competition in the sector, and prevents consumers and service
providers from benefiting from technology convergence.
Clarify universal service obligations
• Assess what genuinely constitutes non-commercial service.
• Reimburse the Department of Telecommunications through the New
Telecom Policy fund proposed to encourage expansion into noneconomic
areas. Base this reimbursement on the excess costs that the department is

148
incurring to meet its universal service obligations, not on its cellular
license fee.
Allocate the spectrum efficiently
• Relocate defence and security use from parts of the commercially attractive
bands and provide suitable compensation. Consider auctioning the
spectrum, particularly in areas where there are constraints on its
availability.
Power
Privatise the power sector
• Make distribution the priority for privatisation. Corporatisation of SEBs
while a necessary starting point, is unlikely to produce the conditions
required for improving performance and stopping the theft of power.
• Introduce comprehensive legislation that transfers state electricity board
assets to successor companies, outlines the new industry structure, and
creates a regulator with appropriate powers as the starting point for
privatisation.
Create strong regulatory agencies to ensure that tariffs reflect costs
• Create these regulatory agencies through legislation rather than
government notification.
• Grant a wide range of powers to regulatory agencies through this
legislation, include licensing, resolving disputes among service providers,
and regulating their quality of service, in addition to setting tariffs.
• Curtail the scope for ad hoc policy interference through the legislation.
Encourage power reform through central government support
• Require beneficiary states to undertake these reforms through further
support from the central government to private power projects—for
example, from the Power Trading Corporation.
Urban Water and Sewer Systems
Introduce private participation into urban water systems
• For sustainable improvement in performance, allow full management
control to the private sector (including the authority to hire and fire
workers and the ability to provide incentives for good performance).
• Phase in price increases over time to match improvements in water
availability and better quality—and to allow a transition from the current
low prices.
• Include targeted government support to finance revenue gap, with explicit
targets for reducing them over time, or provide capital investments to
match private sector resources.
• Provide a policy framework so that informal water providers can continue
to provide services to the poor.

149
• Address water resource and allocation issues, particularly in water-
deficient areas.
Establish a regulatory framework
• Ensure the continuity and stability of the contractual environment, to aid
private participation in the water sector.
• Give to an independent agency the role of overseeing concessions to
insulate tariff and investment decisions from political interference.
• Allow municipalities to grant contracts and licenses, but give power of
enforcement and monitoring to a start regulatory agency.
Institute Central government policies to compare performance of water systems
and enhance fiscal support for municipalities
• Develop a benchmarking scheme to help stimulate public debate by
comparing the technical and financial performance of water systems in
towns across India.
• Enhance fiscal support for municipalities attempting to reform water
distribution.
Road
Monitor and gradually reduce public support for private road projects
• Review the need for certain forms of public sector support for roads, such
as covering senior debt in the event of a concessionaire default, following
the first phase of successful concessions. In addition, develop public sector
support mechanisms that are well targeted and easy for the government to
monitor.
Establish incentive structures and demand risk in road concessions
• Consider establishing a system for the government to award projects on
the basis of the lowest present value of gross revenues at a concession
auction. The concessioning authority would set toll and discount rates, and
the concession would not have a fixed term but would end when the
concessionaire ears what it bid.
• Establish a measurable value of the concession to simplify issues related to
compensation for early termination.
Consider other countries’ approaches to public support for privately funded road
projects
• Shadow tolls. A capacity payment is made as long as the concessionaire
complies with certain key technical or social parameters. The capacity
payment can be sized to cover a certain proportion of the project’s fixed
costs. Or it can be a variable payment based on actual usage by vehicle
type (the greater the weight on the variable payment, the lower the
government’s exposure to demand risk).

150
• Toll road utility. Project financing is converted into corporate financing
once several projects are operating successfully.
Ports
Restructure the ports sector
• Develop a new institutional structure for the sector, separating policy,
regulatory, and commercial functions clearly and providing a nexus for
central and local interests.
Include the following elements in this new structure
• Corporatized Port Trusts—with private and public operating companies
conducting commercial activities related to ship services and cargo traffic
management and handling.
• National Ports Council—to determine national port policy and strategic
planning objectives, and define main sector regulations to be enforced by
the Port Authorities. The council would comprise representatives from the
Ministry of Surface Transportation (MoST), the Ministry of Railways, and
the Ministry of Environment and Forests (MOEF), mayors of port cities,
and Port Authority managers.
• Port Authorities—autonomous public institutions that enforce navigation
safety measures and environmental protection regulations, monitor
concessions, lease contracts governing private sector activities in the port
area, and market the port facilities to attract new investors.
Improve interministerial coordination
• Improve cooperation between such actors as Indian Railways, the
Container Corporation of India, and the Central Warehousing Corporation.
• Improve the interface between railways and ports, possible using
agreements at Jawaharlal Nehru as a model, to eliminate long delays in
cargo transfer.
Address labor practices at the major ports
• Realign the workforce consistently with modern traffic and cargo handling
requirements.
• Allow private operators to adjust their workforce to actual operational
requirements over time if the private sector is called in before this issue is
resolved.
• Provide retraining, voluntary retirement, indemnity payments for
voluntary departure, and a temporary workers’ pool as needed.
Establish efficient award criteria for concessions
• When competition in the market is strong, the government would take bids
on the highest price paid for the assets or shares of the enterprise being
privatised, the highest concession fee (one-time), or the highest net present

151
value of discounted revenue streams over the concession period to accrue to
the government.
• When competition in the market is weak or nonexistent, the government
would be alert to the risk of rent-seeking behaviour, and therefore take
bids on the basis of the lowest tariff charged to consumers.
Airports
Undertake a wide-ranging privatisation of operations at existing airports, in
addition to concessioning out Greenfield sites to the private sector for
development.
Shift the functions of the Airports Authority of India away from operations and
focus on its policy, planning, and statutory functions
Create a separate independent authority to handle economic regulation for the
sector :
• Define the authority’s powers clearly to ensure that it concentrates on area
where competition is restricted. This would include oversight of the terms
and conditions of leases and concessions.
• Continue to have the Directorate General of Civil Aviation handle
technical and safety aspects.
Developing Infrastructure Regulatory Bodies
Establish regulatory independence through clearly defined provisions in
legislation
• Clearly separate the policy role and reduce the scope for ad hoc policy
interventions by government in the decisions of regulatory agencies.
Place the creation of an independent regulator within a broader restructuring of
the sector
Fund regulators from sources outside the regular government budget
• Consider establishing funding for regulatory agencies through a small
charge on regulated companies.
• Provide for scrutiny of the regulators’ budgets by the legislature and by
auditors to ensure accountability.
Consider establishing multisector regulatory agencies at the state level
Developing a Genuine Market for Long-Term Debt
Institute pensions and insurance reform
• Pass the Insurance Regulatory Authority Bill, which will allow competition
in the insurance industry.
• Phase out guaranteed returns on provident funds to ensure that the
absence of a guaranteed rate of return will not be detrimental to
participant interests and to encourage investment in infrastructure.

152
• Establish fully funded pension schemes to increase national savings and
the demand for long-term debt, making more funds available for
infrastructure.
Make the debt market work better
• Simplify taxes to reduce distortions. Remove the stamp tax on secondary
debt market trades to allow the establishment of a dematerialised
settlement system for fixed-income instruments.
• Regulate the debt private placement market to provide adequate protection
to institutional investors.
• Institute reforms to promote securitization.
• Institute legal reforms to allow for securitization without perfection of the
security, facilitate special purpose vehicles, and permit provident funds
and insurers to invest in securitized instruments and transactions.
• Develop appropriate accounting standards and clarify the status (under the
Income Tax Act) of a special purpose vehicle structured as a trust.
• Simplify and harmonise the Reserve Bank of India’s debt auction
procedures.
Improving Efficiency and Transparency in Contracting Infrastructure Projects to
the Private Sector
Consider establishing a one-stop shop for contracting
• Establish a single state government body responsible for contracting and
obtaining necessary clearances and for interacting with private developers
and investors.
• Ensure that the body coordinates effectively with public sector agencies,
including the state electricity board, the Public Woks Department, and
municipal bodies that provide water services.
Report and Value contingent liabilities
Great liquid funds that will allow public agencies to meet liabilities as they arise,
rather than wait for the next annual budget cycle
Audit public support for private infrastructure projects
• Have one public sector agency undertake project design and contracting,
negotiating, and providing documentation on why award decisions were
made.
• Supplement the skills of central government units with the skills of
professional advisers, including lawyers, investment bankers, and
accountants.
• Work toward establishing capabilities to audit the award of public-private
infrastructure project to assure the public that the government has
achieved value for its money.

153
Annex - 2.1
Main Features of Budgetary Process in India
In the case of Union budget, Article 112 of the Constitution states that “the
President shall in respect of every financial year cause to be laid before both the
Houses of the Parliament a statement of the estimated receipts and expenditure
of the Government of India for that year, in this part referred to as the Annual
Financial Statement.” Accordingly, an Annual Financial Statement (AFS), along
with other supplementary documents commonly known as Union Budget, is
placed before the Parliament by the Union Finance Minister every year. The
financial year in India being 1st April to 31st March, the budget is presented on
the last day of February, i.e., a month before the financial year begins.
The Budget formulation process for the ensuing financial year (April-
March) starts in the month of September of the current year when the Budget
Division in the Department of Economic Affairs, Ministry of Finance, issues a
‘budget circular’ seeking statement of budget estimates from various Ministries
and other organizations concerned. Specific performance are enclosed with the
‘budget circular’ along with the time frame within which the information is to be
sent to the Budget Division.
Simultaneously, the Planning Commission also addresses letters to
different Central Ministries and State Governments seeking their annual plan
proposals. The Planning Commission through a process of detailed discussions
finalizes the plan allocations for different Ministries in which the budget support
component is clearly specified so as to fix the budgetary outgo for the plan
schemes of the Central Ministries/Departments. In the case of states, the
Planning Commission after detailed reviews and discussions finalizes the
magnitudes of central assistance to be extended to the states which is an outgo
from the Union Budget. Special attention is given to the budgetary support to be
given to Central Ministries and assistance given to the states for
programs/projects which are financed through external assistance. Thus,
necessary plan allocations as well as central assistance allocation for externally
aided projects is provided for as far as possible. For the purpose, there is a
continuous interaction between the External Finance Division of the Department
of Economic Affairs and the Planning Commission.
Expenditure Estimates : The process of preparation of expenditure
estimates starts from the issue of the budget circular. The financial advisers
(FAs) forward this circular to the Ministry/Department with which they are
associated for obtaining the required information. The ministries in turn collect
estimates from organizations under their control or prepare the same for their

154
own activities. These are scrutinized by the budget. units of the ministries and
submitted to the FAs. The FAs review and examine these estimates before
sending the same in the form of their recommendations to the Budget Division in
the Ministry of Finance. These recommendations classified under separate
‘demand for grants’ in details up to the object head and labeled as statement of
budget estimates (SBEs), are discussed by the Secretary (Expenditure) with each
FA in a series of meetings where the ministry’s budget division is also
represented. After these discussions the budget division conveys budget ceilings
to each FA for revising all the estimates within the ceilings and sending the
SBEs in the final form. The final SBEs are to be sent to the budget division in
two stages. In the first stage, the SBEs include (i) revised non-plan expenditure
for the current year and budget estimate for the next year, and (ii) revised plan
expenditure for the current year. At the second stage of SBEs, FAs send to the
budget division budge estimates for plan expenditure for the next year as
approved by the Planning Commission. Meanwhile, the Controller of Aid
Accounts & Audit (CAA&A) also sends the estimates on external debt,
repayment of external loans and other payments.
Revenue Estimates : The budget division obtains revenue estimates from a
large number of organisations. Estimates on central taxes and duties are
obtained from the Revenue Department in the Ministry of Finance. The Central
Board of Direct Taxes (CBDT) and the Central Board of Excise and Customs
(CBEC) provide revised estimates on direct and indirect tax revenues
respectively, initially for the current year and later the budget estimates for the
next year after several interactions depending on proposals under consideration
at various stages. The Chief Controllers of Accounts (CCAs) and Accountants
General (AGs) of Union Territory (UT) administrations send to the budget
division estimates of taxes, duties etc. for the UTs concerned. Chief Controller of
Accounts (CCAs) of different ministries send to the Budget Division their
estimates on various types of receipts (non-tax) including those from public
accounts after getting the same approved from obtained by the budget division
directly from the State Accountants General (SAGs). For external aid receipts
the CAA&A prepares the estimates after obtaining information from different
credit units of the external finance division of the Department of Economic
affairs, and sends the same to the budget division. Finally, the budget division
obtains from the RBI estimates on possibilities as well as sources of market
borrowings which may be required by the government. This process continues
over a long period from October till the time of giving a final shape to the budget
as the various alternatives to fill the gap between receipts and disbursements
are to be worked out till the end.
155
Flow of Estimates : The various estimates on receipts and expenditure keep
flowing in the budget division from October till the budget is given a final shape
towards the end of the February. In the process there are to and for movements
also for several estimates amongst the different units of the Ministry of Finance
and also amongst the Budget Division of Ministry of Finance, Planning
Commission, different ministries, state governments and other organizations of
which RBI is most important. apart from the receipt estimates which are
finalized only in the middle of February, it is on the plan expenditure of the
central ministries, central assistance to the states and resources of the central
public sector enterprises that the changes in the estimates continue over the
period owing to discussions at various levels and in different stages. The annual
plan discussions in the Planning Commission with the central ministries and the
states continue, at times, till the end of January and it is only after finalization
of these estimates that the FAs of different ministries can send final SBEs for
central plan expenditure to the budget. In working out these estimates Planning
Commission associates the plan finance division of the Department of
Expenditure, the external finance division of the Department of Economic Affairs,
etc.
An Overview : With different flows of estimates, overall estimates of
resources and expenditure continue to be made by the budget division. From
December onwards the broad estimates are reviewed, discussed and simulated
under the overall guidance and supervision of the Additional Secretary (Budget),
who obtains guidance from Secretary (Expenditure), Secretary (Economic
Affairs), Chief Economic Adviser, Secretary (Revenue) and the Finance Secretary.
This group receives an overall guidance from the Finance Minister. Meanwhile,
the Finance Minister invites a group of leading economists, representatives of
industry and trade, labour and trade unions, consumer organizations, small scale
sector and science and technology sector, for pre-budget discussions and receives
their suggestions for the budget. The Finance Minister also consult the members
of the Consultative Committee of Parliament for the Ministry of Finance.
After the presentation of the budget in the Parliament, the Parliamentary
Standing Committee reviews the budget proposals, the budget proposals are
debated in the Parliament and various bills are passed to approve the budget.
(Source : Mathur, K.B.L., (1995) Management of Indian Economy - Systems
and Processes. OECF, New Delhi Office.)
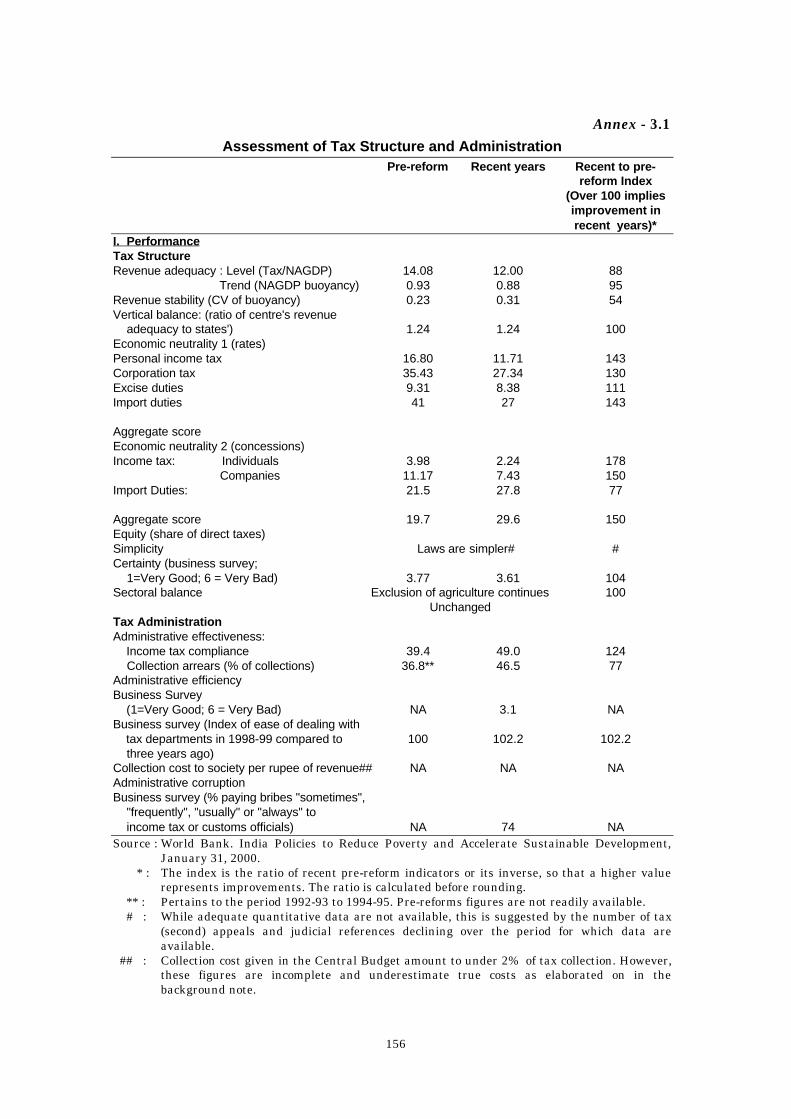
156
Annex - 3.1
Assessment of Tax Structure and AdministrationPre-reform Recent years Recent to pre-
reform Index(Over 100 impliesimprovement inrecent years)*
I. PerformanceTax StructureRevenue adequacy : Level (Tax/NAGDP) 14.08 12.00 88 Trend (NAGDP buoyancy) 0.93 0.88 95Revenue stability (CV of buoyancy) 0.23 0.31 54Vertical balance: (ratio of centre's revenue adequacy to states') 1.24 1.24 100Economic neutrality 1 (rates)Personal income tax 16.80 11.71 143Corporation tax 35.43 27.34 130Excise duties 9.31 8.38 111Import duties 41 27 143
Aggregate scoreEconomic neutrality 2 (concessions)Income tax: Individuals 3.98 2.24 178 Companies 11.17 7.43 150Import Duties: 21.5 27.8 77
Aggregate score 19.7 29.6 150Equity (share of direct taxes)Simplicity Laws are simpler# #Certainty (business survey; 1=Very Good; 6 = Very Bad) 3.77 3.61 104Sectoral balance Exclusion of agriculture continues 100
UnchangedTax AdministrationAdministrative effectiveness: Income tax compliance 39.4 49.0 124 Collection arrears (% of collections) 36.8** 46.5 77Administrative efficiencyBusiness Survey (1=Very Good; 6 = Very Bad) NA 3.1 NABusiness survey (Index of ease of dealing with tax departments in 1998-99 compared to 100 102.2 102.2 three years ago)Collection cost to society per rupee of revenue## NA NA NAAdministrative corruptionBusiness survey (% paying bribes "sometimes", "frequently", "usually" or "always" to income tax or customs officials) NA 74 NASource : World Bank. India Policies to Reduce Poverty and Accelerate Sustainable Development,
January 31, 2000. * : The index is the ratio of recent pre-reform indicators or its inverse, so that a higher value
represents improvements. The ratio is calculated before rounding. ** : Pertains to the period 1992-93 to 1994-95. Pre-reforms figures are not readily available. # : While adequate quantitative data are not available, this is suggested by the number of tax
(second) appeals and judicial references declining over the period for which data areavailable.
## : Collection cost given in the Central Budget amount to under 2% of tax collection. However,these figures are incomplete and underestimate true costs as elaborated on in thebackground note.

157
Annex - 3.2
(a) Profitability of Central Public Sector Undertakings(Rs. Billion)
1990-91 1991-92 1996-97 1997-98
1. Number of units 236 237 238 2362. Paid-up capital 432.4 457.0 624.3 657.63. Net Worth 588.7 603.3 1138.9 1324.44. Capital employed 1020.8 1179.9 2015.0 2230.55. Gross profit 111.0 136.7 306.1 360.96. Pre-tax profits 35.0 40.0 152.1 193.87. Profit after tax (PAT) 22.7 23.6 99.9 137.28. %Gross Margin to Capita employed 17.9 18.8 22.2 23.69. %Gross profit to Capital employed 10.9 11.6 15.2 16.210. %Pre-tax profit to Capital employed 3.4 3.4 7.5 8.711. %PAT to Net Worth 3.9 3.9 8.8 10.4
Source : Economic Survey, 1999-2000
(b) Finances of Central Public Enterprises(Rs. Billion)
1990-91 1991-92 1998-99 1999-00RE BE
Net Internal Resources (NIR) 107.2 120.1 335.1 386.1of which :
Petroleum 27.2 26.3 101.8 107.6Telecommunications 24.9 26.6 126.6 145.9
Plan Expenditure 280.5 294.2 578.0 681.6of which :
Petroleum 42.7 41.4 123.8 121.2Telecommunications 31.1 36.5 134.9 167.9
Overall Balance -173.3 -174.1 -242.8 -295.5Financing: 173.3 174.1 242.8 295.5
External (net) 25.5 18.5 43.7 54.5Domestic 147.8 155.6 199.1 241.0Budget Support 76.0 69.2 75.8 86.4
Loans 24.8 27.4 21.6 28.8Equity 51.2 41.8 54.2 57.5
Bonds 49.3 57.2 89.2 109.8Other 22.5 29.2 34.1 44.9
Memo(%):CPE deficit/GDP1 -3.0 -2.6 -1.3 -1.5CPE deficit/GDP2 -2.6 -2.2 -1.2 -1.3Plan Exp./GDP 4.8 4.4 3.2 3.4NIR/GDP 1.9 1.8 1.9 1.9Budget Support (plan+non-plan)/GDP 1.5 1.2 0.5 0.5Share of Petroleum and Telecom in Plan Exp. 26.3 26.5 44.8 42.4Share of Petroleum and Telecom in NIR 48.6 44.1 68.1 65.7Non-Plan loans to CPEs (Rs. Billion) 10.7 7.6 18.5 17.41Refers to the deficit of all Central Public Enterprises.2Refers to the CPE deficit excluding Petroleum and Telecom.Note: RE=Revised Estimate; BE=Budget Estimate.Source : World Bank. India Policies to Reduce Poverty and Accelerate Sustainable Development,January 31, 2000.

158
An
nex
- 3
.3R
efo
rm M
easu
res
rela
tin
g t
o G
ove
rnm
ent
Sec
uri
ties
Mar
ket
Ele
men
ts o
f R
efo
rmP
re-R
efo
rm M
easu
res
Ref
orm
Mea
sure
sC
urr
ent
Sta
tus
Co
mm
ents
/Ou
tlo
ok
1. P
olic
y•
Abs
ence
of i
nter
nal d
ebt
man
agem
ent p
olic
y.
• A
utom
atic
mon
estis
atio
nof
bud
get d
efic
it th
roug
ha
syst
em o
f ad-
hoc
T-
Bill
s at
inte
rest
rat
e of
4.6
per
cent
.
• S
yste
m o
f Tap
T-B
ills
at4.
6 pe
r ce
nt.
• A
ctiv
e de
bt m
anag
emen
t pol
icy.
• A
bolit
ion
of s
yste
m o
f ad-
hoc
T-
Bill
s (s
ince
Apr
il 1,
199
7) a
ndin
trod
uctio
n of
sys
tem
of w
ays
and
mea
ns a
dvan
ces
(WM
A)
with
in a
gree
d lim
its a
t Ban
kra
tes.
Max
imum
per
iod
ofov
erdr
aft a
t Ban
k ra
te p
lus
2pe
rcen
tage
poi
nts.
• T
ap T
-Bill
s re
plac
ed b
y 14
-Day
Inte
rmed
iate
T-B
ills
(sin
ce A
pril
1, 1
997)
.
• Li
mit
of W
MA
for
the
first
half
of 1
998-
99 fi
xed
atR
s. 1
1,00
0 cr
ore
and
for
the
seco
nd h
alf a
t R
s.7,
000
cror
es.
• M
onito
ring
Gro
up o
fC
ash
and
Deb
t Mar
ket
cons
titut
ed w
ith R
BI a
ndde
bt o
ffici
als.
• Li
mits
of W
MA
to b
ere
view
ed fu
rthe
r.
• N
o ov
erdr
aft w
ill b
epe
rmitt
ed b
eyon
d 10
days
afte
r M
arch
31,
1999
.
2. D
ated
Gov
ernm
ent
Sec
uriti
es
• D
ated
Sec
uriti
es s
old
atlo
w p
rean
noun
ce c
oupo
nra
te.
• Lo
ng-D
ated
Sec
uriti
es o
f20
-30
yers
wer
e be
ing
issu
ed.
• In
stru
men
t use
d w
aspl
ain
vani
lla fi
xed
coup
onse
curit
y.
• S
ecur
ities
sol
d th
roug
h au
ctio
npr
oces
s (J
une
1992
).
• D
iscr
imin
ator
y ty
pe o
f auc
tion
(Jun
e, 1
992)
.
• M
atur
ity o
f sec
urity
usu
ally
not
mor
e th
an 1
0 ye
ars.
• V
arie
ty o
f ins
trum
ents
use
d su
chas
zer
o-co
upon
bon
ds, f
loat
ing
rate
bon
ds, p
artly
pai
d st
ock,
capi
tal i
ndex
ed b
onds
, etc
• N
otifi
ed a
mou
nt p
rean
noun
ce in
resp
ect o
f eac
h au
ctio
n (O
ct.
1998
).
• A
por
tion
of th
e no
tifie
d am
ount
unde
rwrit
ten
by P
rimar
y D
eale
rs(P
Ds)
(si
nce
June
199
7). T
his
repl
aced
the
syst
em o
fco
mm
issi
on in
trod
uced
in J
uly
1996
.
• S
ecur
ities
gen
eral
ly s
old
thro
ugh
disc
rimin
ator
yau
ctio
n pr
oces
s.
• S
ecur
ities
als
o so
ld a
tm
arke
t rel
ated
prea
nnou
nce
coup
on r
ate
and
also
on
tap,
depe
ndin
g on
pre
vaili
ngco
nditi
ons.
• C
an c
onsi
der
new
inst
rum
ents
.
• A
im to
mov
e to
tota
llym
arke
t cle
arin
g yi
elds
at
auct
ions
.

159
3. T
reas
ury
Bill
s•
14-d
ay T
ap T
-Bill
s at
aco
upon
of 4
.6 p
er c
ent.
• 18
2-D
ay T
- B
ills.
• T
ap T
-Bill
s re
plac
ed b
y 14
Day
Inte
rmed
iate
T-B
ills
(Apr
il 1,
1997
).
• A
var
iety
of T
-Bill
s ex
ist -
14
-D
ay, 9
1-da
y an
d 36
4-D
ay, 1
82-
Day
T-B
ills
with
draw
n.
• T
-Bill
s so
ld th
roug
h au
ctio
nba
sis
(sin
ce A
pril
1992
).
• N
otifi
ed a
mou
nts
pre-
anno
unce
d.
• N
on-c
ompe
titiv
e bi
ds (
allo
wed
inre
spec
t of 1
4-D
ay a
nd 9
1-D
ay T
-B
ills)
kep
t out
side
not
ified
amou
nts.
• T
-Bill
s au
ctio
n un
derw
ritte
n by
PD
s.
• T
-Bill
s so
ld th
roug
hac
tions
.
• 14
-Day
and
91-
Day
T-
Bill
s au
ctio
ns h
eld
ever
yF
riday
and
364
-Day
auct
ions
eve
ry a
ltern
ate
Wed
nesd
ays.
• D
iscr
imin
ator
y au
ctio
nsus
ed in
res
pect
of 1
4-da
yan
d 36
4-da
y T
-Bill
s an
dun
iform
type
auc
tion
inre
spec
t of 9
1-D
ay T
-Bill
s.
• N
otifi
ed a
mou
nt v
arie
dde
pend
ing
on p
reva
iling
mar
ket c
ondi
tions
.
• A
nnou
nced
inte
ntio
n to
intr
oduc
e 28
-day
T-B
ills
and
rein
trod
uce
182-
day
T-B
ills.
• C
ould
sel
l thr
ough
unifo
rm o
r di
scrim
inat
ory
auct
ions
dep
endi
ng o
nex
perie
nce
gain
ed.
4. In
stitu
tiona
lD
evel
opm
ent
• N
o sp
ecia
lized
inst
itutio
n.•
Sec
uriti
es T
radi
ng C
orpo
ratio
nof
Indi
a Lt
d. P
rom
oted
by
RB
I(J
uly
1994
) to
dev
elop
trad
ing
inG
over
nmen
t Sec
uriti
es.
• A
sys
tem
of P
rimar
y D
eale
rs(M
arch
199
5) a
nd S
atel
lite
Dea
lers
(D
ecem
ber
1996
) ha
vebe
en e
stab
lishe
d to
act
ivat
epr
imar
y an
d se
cond
ary
mar
kets
and
reta
il G
over
nmen
tS
ecur
ities
.
• R
BI h
as d
ilute
d m
ost o
fits
hol
ding
s in
ST
CI a
ndis
a m
inor
ity s
hare
hold
er.
• S
TC
I has
acq
uire
d P
Dst
atus
.
•
5. P
rimar
y D
eale
rs•
Did
not
exi
st•
Initi
ally
six
PD
s lic
ense
d (M
arch
1996
).
• P
Ds
give
n bi
ddin
g co
mm
itmen
ts.
• P
Ds
have
acc
ess
to c
all m
oney
mar
ket b
oth
as b
orro
wer
s an
dle
nder
s (M
arch
199
6) a
nd c
anra
ise
fund
s th
roug
h is
sue
of C
P,
by w
ay o
f loa
ns fr
om b
anks
and
from
the
inte
rcor
pora
te m
arke
t(S
epte
mbe
r 19
96).
• R
ecen
tly, s
even
new
PD
sha
ve b
een
give
n in
-pr
inci
ple
appr
oval
(Oct
ober
199
8).
• In
divi
dual
PD
s ca
nnot
unde
rwrit
e m
ore
than
30
per
cent
of t
he n
otifi
edam
ount
.
• P
Ds
have
form
ed a
nS
RO
cal
led
Prim
ary
• C
onsi
der
incr
easi
ng th
enu
mbe
r of
PD
s.
• In
crea
se th
e pr
opor
tion
ofun
derw
ritin
g to
100
per
cent
of n
otifi
ed a
mou
nt.
• C
onsi
der
intr
oduc
ing
whe
n-is
sued
mar
ket.

160
• P
Ds
unde
rwrit
e 50
per
cen
t of
notif
ied
amou
nts
in a
uctio
n(A
ugus
t 199
8).
Dea
lers
Ass
ocia
tion.
6. S
atel
lite
Dea
lers
• D
id n
ot e
xist
• N
ine
SD
s re
gist
ered
initi
ally
(Nov
. 199
7).
• T
wo
in-p
rinci
ple
appr
oval
giv
ento
ban
ks (
Nov
. 199
7).
• S
Ds
do n
ot h
ave
acce
ss to
call/
notic
e m
oney
mar
ket.
• F
our
out o
f nin
e S
Ds
have
gra
duat
ed a
s P
Ds.
• S
Ds
perm
itted
to is
sue
CP
(Ju
ne 1
998)
.
• C
onsi
der
incr
easi
ng th
enu
mbe
r of
SD
s.
7. S
ettle
men
tS
yste
m•
Thr
ough
Sub
sidi
zed
Gen
eral
Led
ger
Acc
ount
sm
aint
aine
d in
the
Pub
licD
ebt O
ffice
of R
BI.
• B
anks
, FIs
, PF
s ho
ldin
gS
GL
acco
unt
• M
anua
l Acc
ount
ing
and
no D
eliv
ery
Ver
sus
Pay
men
t.
• T
hrou
gh S
GL
acco
unts
mai
ntai
ned
in P
DO
of R
BI.
• C
ompu
teriz
ed e
nviro
nmen
t with
DV
P s
yste
m fo
r se
ttlem
ent.
• P
artic
ipan
ts g
iven
two
SG
Lac
coun
ts, o
ne fo
r ow
ntr
ansa
ctio
ns a
nd th
e ot
her
for
cons
titue
nts.
• P
Fs
aske
d to
clo
se S
GL
acco
unts
with
RB
I and
enco
urag
ed to
ope
n co
nstit
uent
acco
unts
with
ban
ks, e
tc.
• D
VP
sys
tem
in o
pera
tion.
• B
anks
/FIs
/PD
s/N
SE
/NS
DL/
SH
CIL
hav
e S
GL
and
curr
ent a
ccou
nt w
ith R
BI.
• T
o m
ove
to r
eal t
ime
gros
s se
ttlem
ent s
yste
m.
• T
o in
tegr
ate
SG
L an
dcu
rren
t acc
ount
.
8. S
econ
dary
Mar
ket
Tra
ding
• T
rans
actio
ns c
ondu
cted
over
tele
phon
e.
• T
rans
actio
ns r
oute
dth
roug
h br
oker
s.
• T
ax d
educ
ted
at s
ourc
e(T
DS
) in
res
pect
of
inco
me
from
sec
onda
rym
arke
t tra
nsac
tions
.
• T
rans
actio
ns c
ontin
ue to
be
cond
ucte
d ov
er te
leph
one.
• T
rans
actio
ns a
re u
sual
ly d
irect
lybe
twee
n co
unte
rpar
ts.
• If
rout
ed th
roug
h br
oker
s th
eym
ust b
e th
roug
h a
reco
gniz
edst
ock
exch
ange
.
• In
divi
dual
bro
ker
limits
fixe
d fo
rba
nks.
Any
incr
ease
in b
roke
rlim
its n
eeds
rat
ifica
tion
by b
ank
Boa
rds.
• T
DS
abo
lishe
d.
• P
Ds,
fore
ign
bank
s an
dne
w p
rivat
e se
ctor
ban
ksar
e us
ually
act
ive
in th
ese
cond
ary
mar
kets
.
• P
Ds
are
expe
cted
to g
ive
activ
e tw
o w
ay q
uote
s.
• E
lect
roni
c D
ealin
gS
yste
m b
eing
put
inpl
ace.
• E
ase
in in
divi
dual
bro
ker
limits
may
be
cons
ider
ed.

161
9. In
ter-
Ban
k R
epos
• F
reel
y do
ne•
Hea
vily
res
tric
ted.
• B
anks
and
PD
s ca
n bo
rrow
and
lend
thro
ugh
repo
s (J
une
1994
.)
• M
utua
l fun
ds/o
ther
sel
ect
hold
ers
can
lend
thro
ugh
repo
s(A
pril
1997
).
• M
inim
um p
erio
d of
rep
o re
duce
dto
1 d
ay (
Oct
ober
199
8).
• B
anks
and
PD
s ca
n le
ndan
d bo
rrow
thro
ugh
repo
s.
• N
on-b
ank
part
icip
ants
who
are
lend
ers
in c
all
mon
ey m
arke
t can
lend
thro
ugh
repo
s.
• M
inim
um p
erio
d of
rep
osis
one
day
.
• It
is p
ropo
sed
to m
ake
the
inte
rban
k ca
ll m
oney
mar
ket p
urel
y in
terb
ank.
The
seq
uenc
ing
will
requ
ire a
ll no
n-ba
nkpa
rtic
ipan
ts to
allo
wac
cess
to th
e re
pom
arke
t in
Gov
ernm
ent
and
Non
-Gov
ernm
ent
debt
in d
emat
eria
lized
form
.
• E
ncou
rage
dem
ater
ializ
atio
n of
Non
-G
over
nmen
t deb
t.
• In
trod
uce
diffe
rent
form
of r
epos
.
• In
trod
uce
code
of
cond
uct f
or m
arke
tpr
actic
es a
ndst
anda
rdiz
ed c
ontr
acts
for
repo
s.
10.
RB
I Rep
os•
•
RB
I con
duct
s 3/
4/14
day
s re
pos.
• R
epos
con
duct
ed b
oth
onau
ctio
n ba
sis
and
fixed
rat
evo
lum
e te
nder
(N
ov. 1
997)
.
• C
urre
ntly
RB
I con
duct
s3/
4 da
y re
pos
on fi
xed
rate
vol
ume
tend
er b
asis
.
• 1
day
repo
bei
ngco
ntem
plat
ed a
nd w
ill b
eco
nduc
ted
as a
nd w
hen
nece
ssar
y.
11. F
orei
gnIn
vest
men
t•
NR
I/Ove
rsea
s C
orpo
rate
Bod
ies/
For
eign
Inst
itutio
nal
Inve
stor
s ca
n op
erat
e D
ated
Sec
uriti
es in
prim
ary
and
seco
ndar
y m
arke
ts.
• S
ince
May
199
8, F
IIs p
erm
itted
inve
stm
ent i
n T
-Bill
s al
so in
bot
hpr
imar
y an
d se
cond
ary
mar
kets
.
• •
Sou
rce
: Red
dy Y
.V.,
Fin
anci
al S
ecto
r R
efor
m: R
evie
w a
nd
Pro
spec
ts. K
eyn
ote
Add
ress
at
the
Con
fere
nce
on
"G
row
th, G
over
nan
ce a
nd
empo
wer
men
t :
Th
e fu
ture
of
Indi
a's
Eco
nom
y at
Un
iver
sity
of
Cal
ifor
nia
, San
ta C
ruz
on N
ov.,
20, 1
998,
pu
blis
hed
in
RB
I B
ull
etin
, Jan
uar
y 19
99.
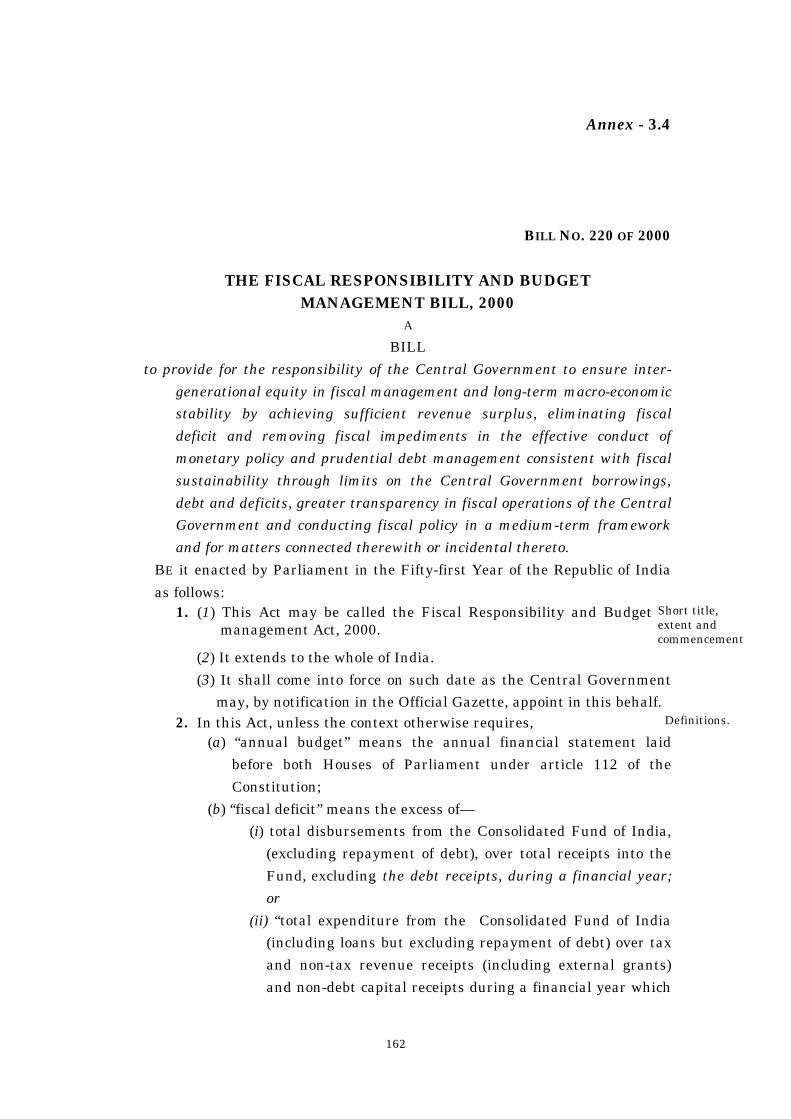
162
Annex - 3.4
BILL NO. 220 OF 2000
THE FISCAL RESPONSIBILITY AND BUDGETMANAGEMENT BILL, 2000
A
BILL
to provide for the responsibility of the Central Government to ensure inter-
generational equity in fiscal management and long-term macro-economic
stability by achieving sufficient revenue surplus, eliminating fiscal
deficit and removing fiscal impediments in the effective conduct of
monetary policy and prudential debt management consistent with fiscal
sustainability through limits on the Central Government borrowings,
debt and deficits, greater transparency in fiscal operations of the Central
Government and conducting fiscal policy in a medium-term framework
and for matters connected therewith or incidental thereto.
BE it enacted by Parliament in the Fifty-first Year of the Republic of India
as follows:1. (1) This Act may be called the Fiscal Responsibility and Budget
management Act, 2000.Short title,extent andcommencement
(2) It extends to the whole of India.
(3) It shall come into force on such date as the Central Government
may, by notification in the Official Gazette, appoint in this behalf.2. In this Act, unless the context otherwise requires, Definitions.
(a) “annual budget” means the annual financial statement laid
before both Houses of Parliament under article 112 of the
Constitution;
(b) “fiscal deficit” means the excess of—
(i) total disbursements from the Consolidated Fund of India,
(excluding repayment of debt), over total receipts into the
Fund, excluding the debt receipts, during a financial year;
or
(ii) “total expenditure from the Consolidated Fund of India
(including loans but excluding repayment of debt) over tax
and non-tax revenue receipts (including external grants)
and non-debt capital receipts during a financial year which
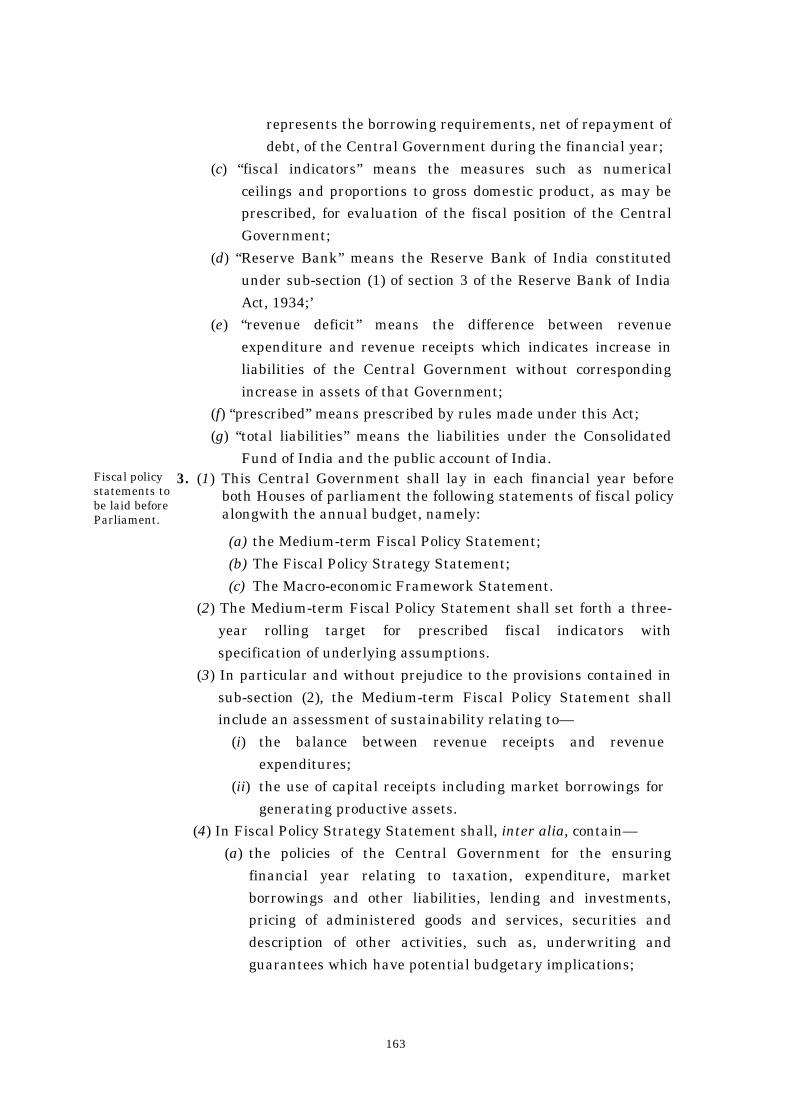
163
represents the borrowing requirements, net of repayment of
debt, of the Central Government during the financial year;
(c) “fiscal indicators” means the measures such as numerical
ceilings and proportions to gross domestic product, as may be
prescribed, for evaluation of the fiscal position of the Central
Government;
(d) “Reserve Bank” means the Reserve Bank of India constituted
under sub-section (1) of section 3 of the Reserve Bank of India
Act, 1934;’
(e) “revenue deficit” means the difference between revenue
expenditure and revenue receipts which indicates increase in
liabilities of the Central Government without corresponding
increase in assets of that Government;
(f) “prescribed” means prescribed by rules made under this Act;
(g) “total liabilities” means the liabilities under the Consolidated
Fund of India and the public account of India.Fiscal policystatements tobe laid beforeParliament.
3. (1) This Central Government shall lay in each financial year beforeboth Houses of parliament the following statements of fiscal policyalongwith the annual budget, namely:
(a) the Medium-term Fiscal Policy Statement;
(b) The Fiscal Policy Strategy Statement;
(c) The Macro-economic Framework Statement.
(2) The Medium-term Fiscal Policy Statement shall set forth a three-
year rolling target for prescribed fiscal indicators with
specification of underlying assumptions.
(3) In particular and without prejudice to the provisions contained in
sub-section (2), the Medium-term Fiscal Policy Statement shall
include an assessment of sustainability relating to—
(i) the balance between revenue receipts and revenue
expenditures;
(ii) the use of capital receipts including market borrowings for
generating productive assets.
(4) In Fiscal Policy Strategy Statement shall, inter alia, contain—
(a) the policies of the Central Government for the ensuring
financial year relating to taxation, expenditure, market
borrowings and other liabilities, lending and investments,
pricing of administered goods and services, securities and
description of other activities, such as, underwriting and
guarantees which have potential budgetary implications;

164
(b) the strategic priorities of the Central Government for the
ensuing financial year in the fiscal area;
(c) the key fiscal measures and rationale for any major deviation
in fiscal measures pertaining to taxation, subsidy,
expenditure, administered pricing and borrowings;
(d) an evaluation as to how the current policies of the Central
Government are in conformity with the fiscal management
principles set out in section 4 and the objectives set out in the
Medium-term Fiscal Policy Statement.
(5) The medium-term Fiscal Policy Statement, the Fiscal Policy
Strategy Statement and the Marco-economic Framework
Statement referred to in sub-section (I) shall be in such form as
may be prescribed.4. (1) The Central Government shall take appropriate measures to
eliminate the revenue deficit and fiscal deficit and build upadequate revenue surplus.
FiscalManagementprinciples.
(2) In particular, and without prejudice to the generality of the
foregoing provision, the Central Government shall(a) reduce revenue deficit by an amount equivalent to one-half per
cent. Or more of the estimated gross domestic product at the
end of each financial year beginning on the 1st day of April,
2001;
(b) reduce revenue deficit to nil within a period of five financial
years beginning from the initial financial year on the 1st day of
April, 2001 and ending on the 31st day of March, 2006;
(c) build up surplus amount of revenue and utilise such amount
for discharging liabilities in excess of assets;
(d) reduce fiscal deficit by an amount equivalent to one-half per
cent. Or more of the estimated gross domestic product at the
end of each financial year beginning on the 1st day of April,
2001;
(e) reduce fiscal deficit for a financial year to not more than two
per cent. Of the estimated gross domestic product for that year,
within a period of five financial years beginning from the
initial financial year on the 1st day of April, 2001 and ending
on the 31st day of March, 2006:
(f) not give guarantee for any amount exceeding one-half per cent.
of the estimated gross domestic product in any financial year;
(g) ensure within a period of ten financial years, beginning from
the initial financial year on the 1st day of April, 2001, and
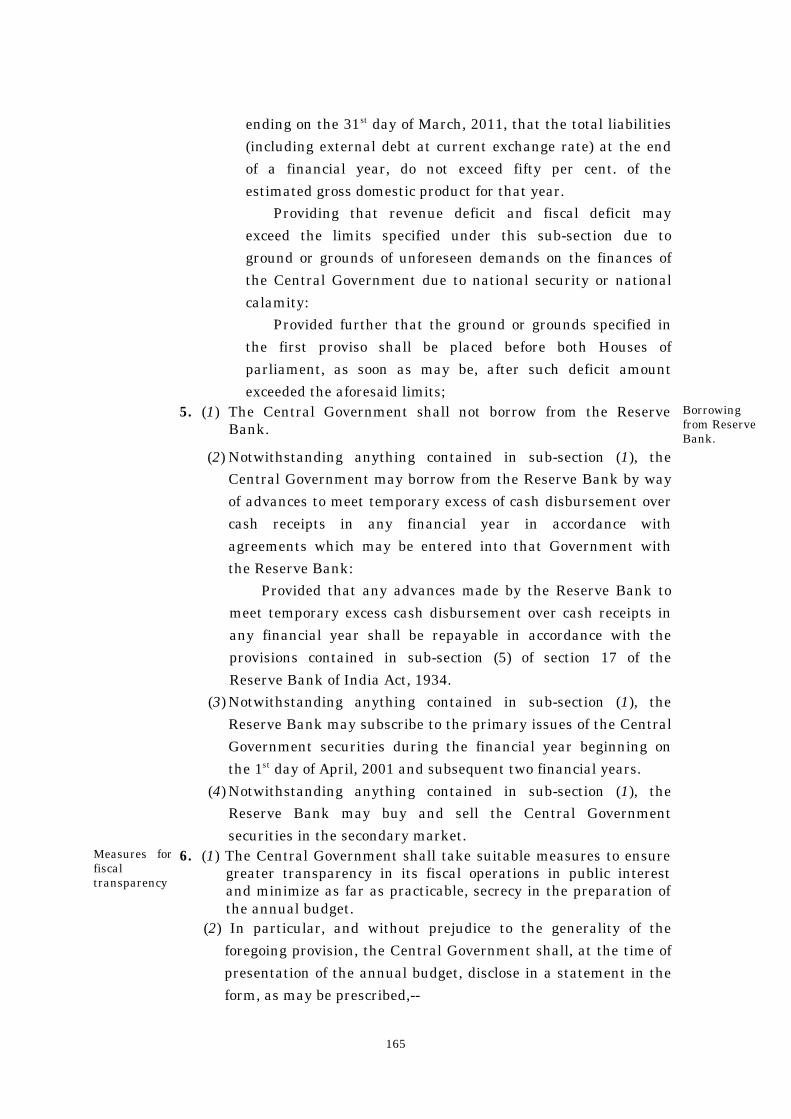
165
ending on the 31st day of March, 2011, that the total liabilities
(including external debt at current exchange rate) at the end
of a financial year, do not exceed fifty per cent. of the
estimated gross domestic product for that year.
Providing that revenue deficit and fiscal deficit may
exceed the limits specified under this sub-section due to
ground or grounds of unforeseen demands on the finances of
the Central Government due to national security or national
calamity:
Provided further that the ground or grounds specified in
the first proviso shall be placed before both Houses of
parliament, as soon as may be, after such deficit amount
exceeded the aforesaid limits;5. (1) The Central Government shall not borrow from the Reserve
Bank.Borrowingfrom ReserveBank.
(2) Notwithstanding anything contained in sub-section (1), the
Central Government may borrow from the Reserve Bank by way
of advances to meet temporary excess of cash disbursement over
cash receipts in any financial year in accordance with
agreements which may be entered into that Government with
the Reserve Bank:
Provided that any advances made by the Reserve Bank to
meet temporary excess cash disbursement over cash receipts in
any financial year shall be repayable in accordance with the
provisions contained in sub-section (5) of section 17 of the
Reserve Bank of India Act, 1934.
(3) Notwithstanding anything contained in sub-section (1), the
Reserve Bank may subscribe to the primary issues of the Central
Government securities during the financial year beginning on
the 1st day of April, 2001 and subsequent two financial years.
(4) Notwithstanding anything contained in sub-section (1), the
Reserve Bank may buy and sell the Central Government
securities in the secondary market.Measures forfiscaltransparency
6. (1) The Central Government shall take suitable measures to ensuregreater transparency in its fiscal operations in public interestand minimize as far as practicable, secrecy in the preparation ofthe annual budget.
(2) In particular, and without prejudice to the generality of the
foregoing provision, the Central Government shall, at the time of
presentation of the annual budget, disclose in a statement in the
form, as may be prescribed,--
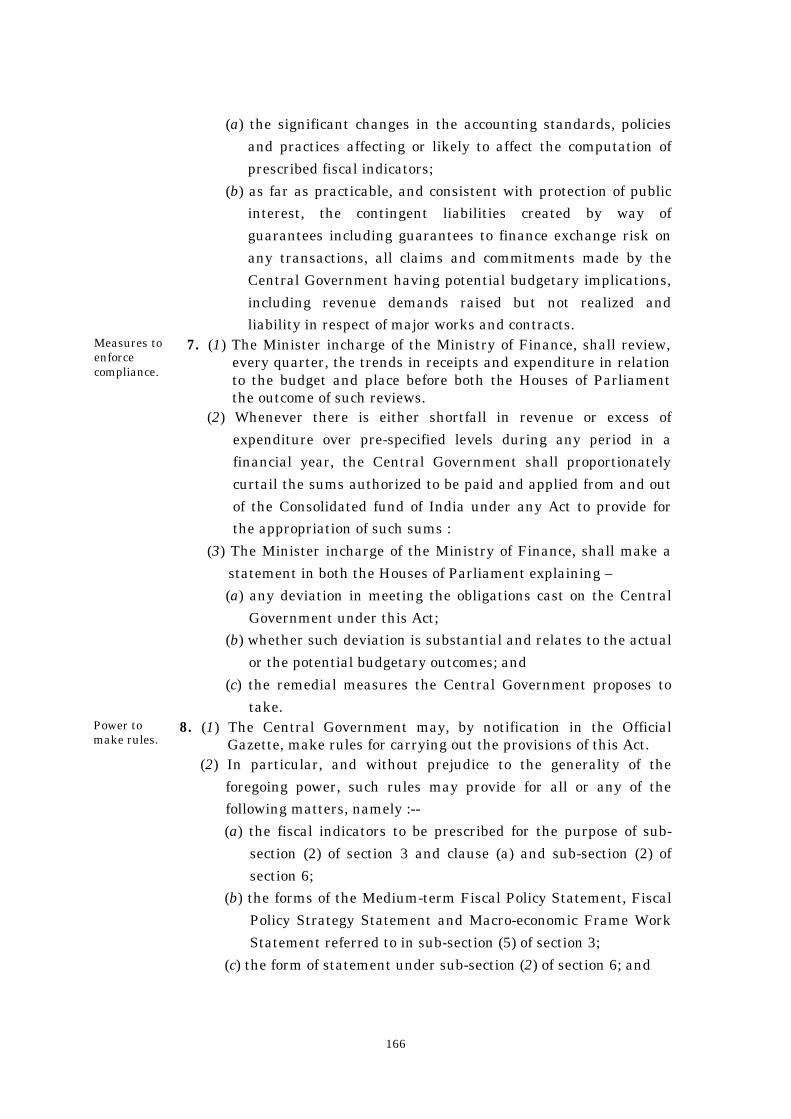
166
(a) the significant changes in the accounting standards, policies
and practices affecting or likely to affect the computation of
prescribed fiscal indicators;
(b) as far as practicable, and consistent with protection of public
interest, the contingent liabilities created by way of
guarantees including guarantees to finance exchange risk on
any transactions, all claims and commitments made by the
Central Government having potential budgetary implications,
including revenue demands raised but not realized and
liability in respect of major works and contracts.Measures toenforcecompliance.
7. (1) The Minister incharge of the Ministry of Finance, shall review,every quarter, the trends in receipts and expenditure in relationto the budget and place before both the Houses of Parliamentthe outcome of such reviews.
(2) Whenever there is either shortfall in revenue or excess of
expenditure over pre-specified levels during any period in a
financial year, the Central Government shall proportionately
curtail the sums authorized to be paid and applied from and out
of the Consolidated fund of India under any Act to provide for
the appropriation of such sums :
(3) The Minister incharge of the Ministry of Finance, shall make a
statement in both the Houses of Parliament explaining –
(a) any deviation in meeting the obligations cast on the Central
Government under this Act;
(b) whether such deviation is substantial and relates to the actual
or the potential budgetary outcomes; and
(c) the remedial measures the Central Government proposes to
take.Power tomake rules.
8. (1) The Central Government may, by notification in the OfficialGazette, make rules for carrying out the provisions of this Act.
(2) In particular, and without prejudice to the generality of the
foregoing power, such rules may provide for all or any of the
following matters, namely :--
(a) the fiscal indicators to be prescribed for the purpose of sub-
section (2) of section 3 and clause (a) and sub-section (2) of
section 6;
(b) the forms of the Medium-term Fiscal Policy Statement, Fiscal
Policy Strategy Statement and Macro-economic Frame Work
Statement referred to in sub-section (5) of section 3;
(c) the form of statement under sub-section (2) of section 6; and
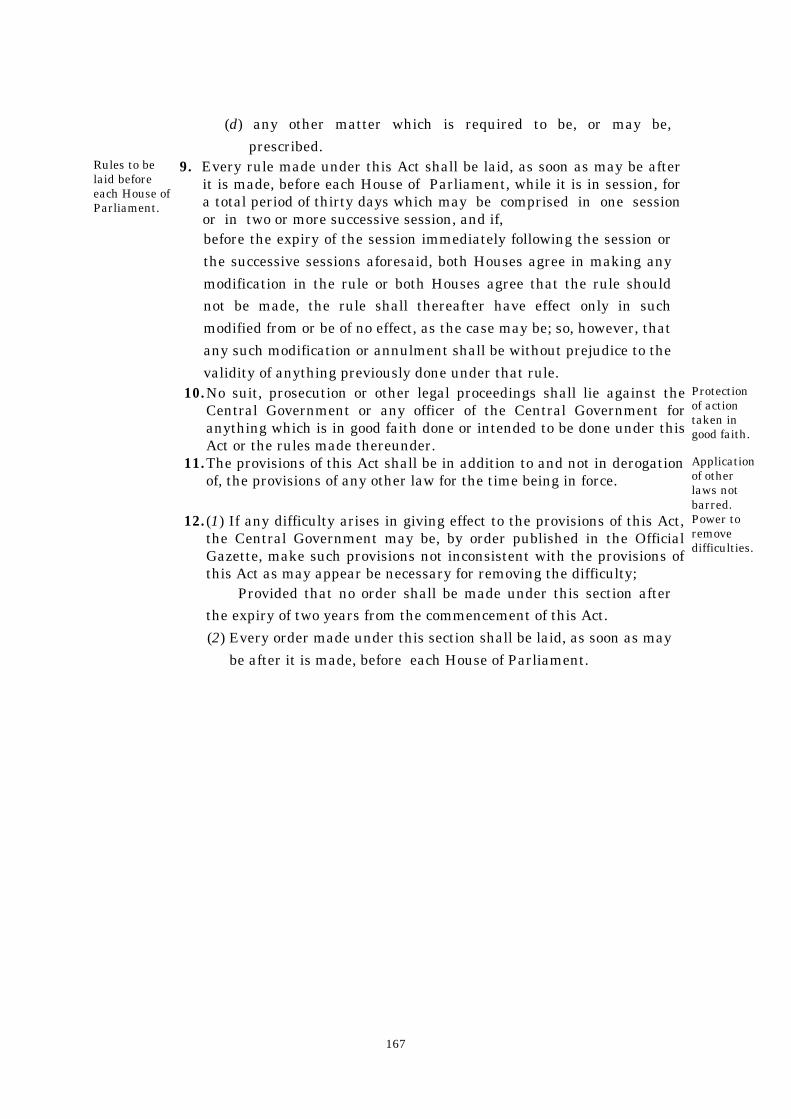
167
(d) any other matter which is required to be, or may be,
prescribed.Rules to belaid beforeeach House ofParliament.
9. Every rule made under this Act shall be laid, as soon as may be afterit is made, before each House of Parliament, while it is in session, fora total period of thirty days which may be comprised in one sessionor in two or more successive session, and if,before the expiry of the session immediately following the session or
the successive sessions aforesaid, both Houses agree in making any
modification in the rule or both Houses agree that the rule should
not be made, the rule shall thereafter have effect only in such
modified from or be of no effect, as the case may be; so, however, that
any such modification or annulment shall be without prejudice to the
validity of anything previously done under that rule.10.No suit, prosecution or other legal proceedings shall lie against the
Central Government or any officer of the Central Government foranything which is in good faith done or intended to be done under thisAct or the rules made thereunder.
Protectionof actiontaken ingood faith.
11.The provisions of this Act shall be in addition to and not in derogationof, the provisions of any other law for the time being in force.
Applicationof otherlaws notbarred.
12. (1) If any difficulty arises in giving effect to the provisions of this Act,the Central Government may be, by order published in the OfficialGazette, make such provisions not inconsistent with the provisions ofthis Act as may appear be necessary for removing the difficulty;
Power toremovedifficulties.
Provided that no order shall be made under this section after
the expiry of two years from the commencement of this Act.
(2) Every order made under this section shall be laid, as soon as may
be after it is made, before each House of Parliament.

168
Annex - 3.5
Excerpts from the Report on the Committee onFiscal Responsibility Legislation
(Ministry of Finance, Dept. of Economic Affairs, 2000)
Trends in Central Government’s finances
1. Fiscal consolidation has been one of the main elements of economic
reforms adopted since July 1991. However, Government finances continue to be a
matter of serious concern, as may be seen from the movements of key fiscal
indicators, viz., revenue deficit, fiscal deficit, primary deficit and primary revenue
balance (Table 1). The persistence of large fiscal deficit and primary deficit has
resulted in a large debt stock (Table 2). More significantly, revenue deficit, which
surfaced in 1979-80, became a permanent feature in the Indian fiscal system.
Persistence of revenue deficit emanating from growing interest burden has
resulted in a vicious circle of deficit and debt (Table 3 and 4). Apart from growing
and persistent fiscal imbalances which have raised the issue of fiscal
sustainability and macro-economic stability, the integrity of the budget has been
questioned on account of large variations from the original estimates in the
Budget. Such variations have been persisting and growing.
2. If the present fiscal scenario continues, the future seems to be a matter of
serious concern. Assuming that GDP grows at 12 per cent in nominal terms and at
7 per cent in real terms, domestic debt grows at 15 per cent, revenue receipts,
revenue expenditure, and capital expenditure grow at 13.5 per cent, 11.1 per cent
and 13.2 per cent, respectively (the same as the level of 2000-01); the revenue
deficit and fiscal deficit would be around 2.4 per cent and 4.5 per cent of GDP,
respectively, at the end of fiscal 2005-06. The interest payments wold be 5.9 per
cent of GDP and primary deficit and primary revenue balance would be 1.4 per
cent and 3.5 per cent, respectively and domestic debt to GDP ratio would be
around 59 per cent. A tentative calculation further shows that if the revenue
receipts and revenue expenditures would increase at the rate of 2000-01 level, i.e.,
13.5 per cent and 11.1 per cent, respectively, the zeroing of revenue deficit would
be possible only in fiscal 2012-13., This scenario implies severe fiscal stress and
calls for bold fiscal measures either in terms of large mobilization of non-debt
resources or through expenditure compression.
3. The continuation of fiscal stress as mentioned above underscores the need
for steeper fiscal correction and consolidation along with an emphasis on stricter
fiscal adjustment. This implies containing fiscal deficit and, more importantly,

169
revenue deficit to moderate levels in order to ensure that interest payments do not
result in preempting greater part of revenue receipts. Reduction of fiscal deficit
would in turn result in reduction in the debt to GDP ratio over the medium term.
This would be facilitated, if adequate surplus could be generated in the primary
balance both in revenue account and overall account of the budget. In particular,
in the medium term, there is a need to have an adequate surplus in the non-
interest revenue account which would meet the interest obligation. In addition,
there is also a need to ensure adequate return on a sustained basis in respect of
borrowings deployed for capital expenditure so that revenue budget would be
benefited over time from higher productivity in the country.
Table 1 Trends in Deficit Indicators Relative to GDP(in per cent)
Year RD GFDI GFD2 PD1 PD2 PRB1 PRB2 MD
1970-75* -0.29 3.16 2.78 1.85 1.46 -1.60 -0.44 1.08
1975-80* -0.29 4.27 3.81 2.63 2.17 -1.94 -0.73 0.87
1980-85* 1.02 5.75 5.13 3.73 3.10 -1.01 0.33 2.03
1985-90* 2.37 7.55 6.57 4.44 3.47 -0.73 0.91 2.10
1990-91 3.19 7.66 6.46 3.97 2.77 -0.50 0.99 2.53
1991-96* 2.80 5.60 4.87 1.49 0.75 -1.31 0.29 0.65
1996-97 2.32 4.73 3.98 0.51 -0.24 -1.90 -0.33 0.14
1997-98 2.97 5.69 4.68 1.49 0.48 -1.23 0.39 0.66
1998-99 3.82 6.39 5.10 2.01 0.72 -0.56 1.13 0.17
1999-00 3.78 6.99 5.60 2.29 0.90 -0.92 0.84 N.A.
2000-01 3.55 6.57 5.10 2.03 0.46 -1.09 0.59 N.A.
1996-01* 3.29 6.07 4.89 1.67 0.46 -1.14 0.52
Notes : (-) Minus represents surplus. The GDP figures have been revised taking intoaccount the base as 1993-94 with a link factor of 1.08878.
* Annual Averages.RD Revenue Deficit.GFD1 Gross Fiscal Deficit (including small savings loans to States)GFD2 Gross Fiscal Deficit (excluding small savings loans to States)PD1 Primary Deficit (including small savings loans to States)PD2 Primary Deficit (excluding small savings loans to States)PRB1 Primary Revenue Balance (Revenue balance – Interest payments)PRB2 Primary Revenue Balance (Revenue balance – Net Interest payments)MD Monetised Deficit

170
Table 2 Vicious Circle of Deficit, Debt and Expenditure(in per cent)
Year RD/GFD2 OD/Y IP/Y RE/Y TE/Y
1970-75* -10.43 42.50 1.23 7.39 12.90
1975-80* -7.61 43.60 1.31 8.95 15.18
1980-85* 19.88 45.21 1.70 9.83 15.78
1985-90* 36.07 56.36 2.83 12.59 18.82
1990-91 49.38 53.97 3.69 12.62 18.08
1991-96* 57.49 52.27 4.11 11.98 15.77
1996-97 58.29 47.93 4.22 11.27 14.28
1997-98 63.46 49.78 4.20 11.53 14.84
1998-99 74.90 50.12 4.38 12.22 15.70
1999-00 67.50 53.01 4.70 13.01 15.62
2000-01 69.61 54.07 4.64 12.88 15.51
1996-01* 67.28 50.98 4.43 12.18 15.19
Notes : (-) Minus represents surplus. The GDP figures have been revised taking intoaccount the base as 1993-94 with a link factor of 1.08878.
* Annual averages.RD Revenue Deficit.OD Total Outstanding Debt (Gross)IP Interest PaymentsRE Revenue ExpenditureTE Total ExpenditureY Revised GDP at current market prices
Table 3 Evolution of Debt(in per cent)
Year OD/Y DOD/Y EOD/Y NAG/Y EOD*/Y EOD**/Y OD*/Y OD**/Y
1980-85* 45.21 35.12 10.09 -1.23 @ @ @ @
1985-90* 56.36 46.19 10.17 -8.82 @ @ @ @
1990-91 53.97 48.59 5.38 -12.50 12.92 24.29 61.51 72.88
1991-96* 52.27 47.54 4.73 -15.85 14.99 27.92 62.53 75.46
1996-97 47.93 44.08 3.85 -17.18 12.11 22.75 56.19 66.83
1997-98 49.78 46.24 3.54 -19.14 10.93 21.48 57.17 67.72
1998-99 50.12 46.91 3.21 -19.92 10.05 20.95 56.96 67.86
1999-00 53.01 50.04 2.97 -23.28 9.89 21.44 59.93 71.48
2000-01 54.07 51.47 2.60 -25.98 N.A. N.A. N.A. N.A.
1996-01* 50.98 47.17 3.81 -21.06 N.A. N.A. N.A. N.A.
Notes : * annual averages, NA Not Available (-) Minus represents net liabilities. The GDPfigures have been revised taking into account the base as 1993-94 with a linkfactor of 1.0878.
OD Total Gross DebtDOD Total Domestic DebtEOD External Debt at Historical Exchange ratesNAG Net Assets(+) or Net Liabilities(-)EOD* Government External Debt at Current Exchange RateEOD** Total External Debt at Current Exchange RateOD* Total Gross Debt Corresponding to EOD*OD** Total Gross Debt Corresponding to EOD**Y Revised GDP

171
Table 4 Interest Burden(in per cent)
Year IP/Y IP/RR IP/RE NIP/Y PRB/IP
1970-75* 1.31 17.20- 17.88 0.16 122.71
1975-80* 1.64 17.79 18.33 0.44 120.58
1980-85* 2.02 22.94 20.56 0.68 50.52
1985-90* 3.10 30.17 24.64 1.90 23.11
1990-91 3.69 39.12 29.24 2.19 13.66
1991-96* 4.11 44.94 34.33 2.50 32.04
1996-97 4.22 47.10 37.42 2.65 45.10
1997-98 4.20 49.02 36.39 2.58 29.23
1998-99 4.38 52.09 35.82 2.69 12.81
1999-00 4.70 50.93 36.13 2.95 19.57
2000-01 4.64 49.72 36.03 2.96 23.54
1996-01* 4.43 49.77 36.36 2.77 26.05
Notes : * Annual Averages.The GDP figures have been revised taking into account the base as 1993-94 witha link facor of 1.0878.
IP Interest PaymentsRR Revenue ReceiptsNIP Net Interest Payment (Interest payment minus interest receipts)PRB Primary Revenue Balance (Revenue balance minus Interest payments)Y Revised GDP at current market pricesRE Revenue Expenditure
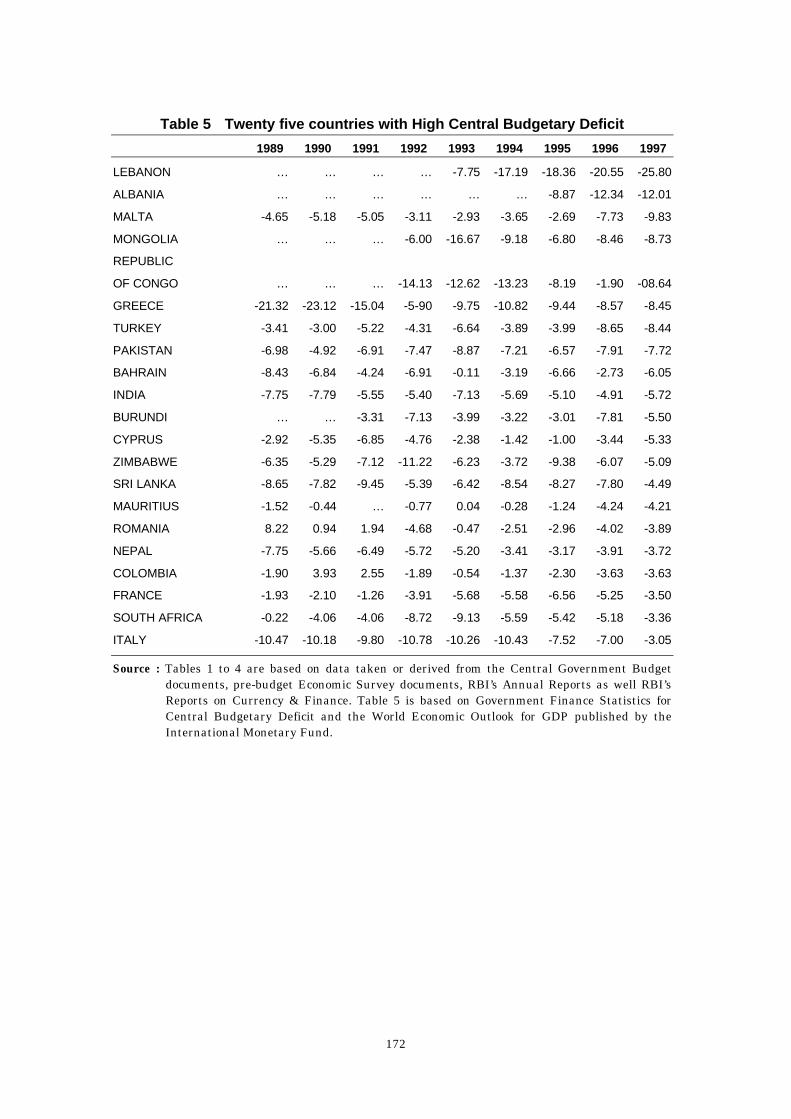
172
Table 5 Twenty five countries with High Central Budgetary Deficit
1989 1990 1991 1992 1993 1994 1995 1996 1997
LEBANON … … … … -7.75 -17.19 -18.36 -20.55 -25.80
ALBANIA … … … … … … -8.87 -12.34 -12.01
MALTA -4.65 -5.18 -5.05 -3.11 -2.93 -3.65 -2.69 -7.73 -9.83
MONGOLIA … … … -6.00 -16.67 -9.18 -6.80 -8.46 -8.73
REPUBLIC
OF CONGO … … … -14.13 -12.62 -13.23 -8.19 -1.90 -08.64
GREECE -21.32 -23.12 -15.04 -5-90 -9.75 -10.82 -9.44 -8.57 -8.45
TURKEY -3.41 -3.00 -5.22 -4.31 -6.64 -3.89 -3.99 -8.65 -8.44
PAKISTAN -6.98 -4.92 -6.91 -7.47 -8.87 -7.21 -6.57 -7.91 -7.72
BAHRAIN -8.43 -6.84 -4.24 -6.91 -0.11 -3.19 -6.66 -2.73 -6.05
INDIA -7.75 -7.79 -5.55 -5.40 -7.13 -5.69 -5.10 -4.91 -5.72
BURUNDI … … -3.31 -7.13 -3.99 -3.22 -3.01 -7.81 -5.50
CYPRUS -2.92 -5.35 -6.85 -4.76 -2.38 -1.42 -1.00 -3.44 -5.33
ZIMBABWE -6.35 -5.29 -7.12 -11.22 -6.23 -3.72 -9.38 -6.07 -5.09
SRI LANKA -8.65 -7.82 -9.45 -5.39 -6.42 -8.54 -8.27 -7.80 -4.49
MAURITIUS -1.52 -0.44 … -0.77 0.04 -0.28 -1.24 -4.24 -4.21
ROMANIA 8.22 0.94 1.94 -4.68 -0.47 -2.51 -2.96 -4.02 -3.89
NEPAL -7.75 -5.66 -6.49 -5.72 -5.20 -3.41 -3.17 -3.91 -3.72
COLOMBIA -1.90 3.93 2.55 -1.89 -0.54 -1.37 -2.30 -3.63 -3.63
FRANCE -1.93 -2.10 -1.26 -3.91 -5.68 -5.58 -6.56 -5.25 -3.50
SOUTH AFRICA -0.22 -4.06 -4.06 -8.72 -9.13 -5.59 -5.42 -5.18 -3.36
ITALY -10.47 -10.18 -9.80 -10.78 -10.26 -10.43 -7.52 -7.00 -3.05
Source : Tables 1 to 4 are based on data taken or derived from the Central Government Budgetdocuments, pre-budget Economic Survey documents, RBI’s Annual Reports as well RBI’sReports on Currency & Finance. Table 5 is based on Government Finance Statistics forCentral Budgetary Deficit and the World Economic Outlook for GDP published by theInternational Monetary Fund.

173
Country Experiences
A number of countries have experimented with medium-term fiscal
adjustment for making a credible reduction in fiscal deficit and debt – GDP ratio,
often backed by rule-based fiscal policy framework. The rules have varied from
Constitutional and legal arrangements within the countries to agreements
between countries. Following is a summary account of the international
experience in this regard.
European Union—Under Maastricht Treaty (1991), most EU countries have
recognized and implemented two separate limits for overall borrowings : one
based on the debt during a year, i.e., the ‘Public Deficit’ representing net
borrowings of the general Government, and the other based on the debt stock
representing the gross debt at nominal value outstanding at the end of every
financial year. The Treaty seeks to place a limit of 3 per cent for the ratio between
Public Deficit and the Gross Domestic product (GDP) at market prices and a limit
of 60 per cent for the ratio between Public Debt and GDP at market prices. (At an
annual nominal GDP growth rate of 5 per cent, assuming 3 per cent real growth
and 2 per cent inflation, in the long run, observance of a fiscal deficit limitof 3 per
cent of GDP will result in a public debt of 60 per cent of GDP.) Only indirect
central bank credit to the government (defined as the acquisition of government
securities by the central bank from a third party) is permitted and that too has to
be entirely at the discretion of the bank. Most EU countries now refer to the
Maastricht criteria as their primary aggregate fiscal goal. These have served as a
particular incentive for fiscal consolidation in countries with significantly higher
deficit and debt levels than the Maastricht criteria. There can reasonably be
debate about the durability of this mechanism and the aptness of the targets so
far chosen but fiscal rectitude has generally entered the objective functions of the
EU and potential EU countries, to a degree not seen before.
United States of America – USA had for two centuries since independence
followed a policy (not statutory) of balanced budget. It was only in 1980s that the
US government incurred huge budget deficits because of reduction in taxes
accompanied by a significant increase in expenditure. The Balanced Budget and
Emerging Deficit Control Act (Gramm-Rudman Hollings Acts of 1985 and 1987)
required a steady decline in the federal government’s deficit to zero level within a
stipulated time frame. The Omnibus Budget Reconciliation Acts of 1990 and 1993,
and the Balanced Budget Act of 1997 have been the main legislative framework in
USA. The latest budgetary rules have been successful in controlling discretionary
spending by setting caps on government investment and consumption. If the
annual appropriation exceeds the caps, the law invokes an automatic
sequestration, which means any excess discretionary spending over the specified
174
limits is subject to sequestration, by a uniform percentage across activities (The
Budget Enforcement Act of 1990). While the caps have been amended annually,
real discretionary spending has fallen every year since 1991. With the policy of
moving towards balanced budget (or zero deficit) by year 2002, the total debt to
GDP ratio is expected to come down to about 60 per cent in 2002, from 68 per cent
in 1995.
New Zealand – The recent reforms of economic policy and public sector
management in New Zealand have attracted attention internationally. In
particular, the financial management regime that has been put in place since
June 1994 under the Fiscal Responsibility Act has resulted in major advances in
transparency and accountability of fiscal policy decisions. The Act specifies
requirements for information and policy decisions through open budgetary
processes, while establishing statutory accountability for the government. The Act
also specifies principles of responsible fiscal management and transparency on
key budget parameters and other aggregate fiscal reports, with the intention that
any fiscal strategy proposed by the government should be amendable to
evaluation in relation to specified criteria. The important mechanism operating
here is that governments have to explain the policy rationale behind five crucial
fiscal indicators. The fact that they have to do this repeatedly builds in
commitment. The Act enunciates five principles for responsible fiscal
management : (i) reducing total debt to prudent levels by achieving operating
surpluses every year until prudent level of debt has been obtained; (ii)
maintaining total debt at a prudent level by ensuring that average operating
expenses do not exceed operating revenue; (iii) achieving and maintaining levels
of net worth that provide a buffer against adverse future events; (iv) prudent
management of fiscal risks; (v) pursuit of policies consistent with a reasonable
degree of predictability about the level and stability of tax rules.
Australia – Budget Honesty Act, 1998 aims to increase transparency in fiscal
policy making and fiscal results. A notable feature it shares with the New Zealand
approach is the requirement to publish a set of fiscal updates prior to all elections
to prevent governments from withholding information on the true fiscal position.
This produces a number of desirable features including sharing a common
economic and fiscal outlook in the debate and preventing a newly elected
government from being “shocked” at the state of finances.
Germany – The golden rule, embodied in Article 115 of the Constitution,
specifies that over the cycle the Government will borrow only to invest and not to
fund current expenses (including depreciation and maintenance). The balanced
budget rule is stipulated in the Constitution and confirmed in the respective
budget laws for both the federal and sub-national governments. In any year,
175
government borrowings must not exceed government investment expenditure,
except in circumstances of a “macroeconomic disequilibrium.”
United Kingdom – U.K.’s Code for Fiscal Stability has a number of features
that are quite similar to the New Zealand law. This code includes adherence to
“the golden rule,” targeted debt, and real operating expenditure levels. The United
Kingdom’s golden rule differs from the German one by allowing deficits to exceed
investment in any specific year as long as the rule is fulfilled over the course of
the economic cycle. On the other hand, it is stricter by referring explicitly to net
instead of gross investment. Further, U.K. follows a traditional prohibition on the
central bank credits to the government.
Japan – While the fiscal deficit and debt to GDP ratio in Japan is high from
international standards and a law enacted in 1997 intended to promote fiscal
restraint was suspended in 1998 to provide fiscal stimulus to deal with
recessionary conditions, its debt management has certain salutary features. The
Japanese golden rule is institutionalized by the virtual separation of government
“deficit bonds’ from government “construction bonds” and the aim of limiting
government borrowing to construction bonds only in the medium term, implied
redemption in 60- years through a system akin to sinking fund contributions and
the use of postal savings for supporting a public investment program generating
income surpluses.
The advantages of a golden rule followed by several countries are twofold: it
puts a limit on the scope for government borrowings without preventing beneficial
government investment from being undertaken. The underlying idea of the rule is
that government investment generates a future stream of income and/or services
that justifies the allocation of some of the expenditure to the future. However, a
golden rule does not rule out government borrowing to finance even investment
projects with low economic or social returns.
Switzerland – The Swiss government has proposed that its fiscal
consolidation target be enshrined in the Constitution. The new Constitutional
clause would set the authorized deficits for coming years. Should these objectives
not be achieved, a mandatory procedure would be set in train, requiring savings to
be made based on financial priorities. It has still to be presented for approval by
the parliament, the cantons and a public referendum.
Netherland – The structural deficit ceiling, which was introduced as a policy
norm in 1961, was abandoned in 1974. Under a more recent approach, introduced
in 1995, the Netherlands is pursuing a similar rule to meet the EU deficit
reference value.
Indonesia – The Guidelines for State Policy (1966) prohibit deficit spending
and mandate strict adherence to balanced budget policy under which public
expenditure should not exceed the government’s domestic budgetary revenue and
176
foreign aid flows. The same applies to provincial and municipal governments. The
definition of foreign aid as a form of revenue rather than a means of financing a
deficit has permitted the government to accept substantial volumes of foreign
borrowing to fund public sector development projects. In practice, therefore,
Indonesian government does not issue domestic bonds in the market. The
balanced-budget strictures have been relaxed to a certain extent in the recent
years following a proposal that the government would have to be able to pursue a
more effective counter cyclical fiscal policy if it permitted budgetary surpluses or
deficits to be recorded in individual years as long as a broad balance is maintained
over a period of, say, five years.
Kenya – Significant amendments to the Central Bank of Kenya Act, 1966
have been introduced by the Amendment Act, 1997. The principal object of the
bank has been redefined to make it focus on formulating and implementing
monetary policy directed to achieving and maintaining stability in the general
level of prices. The scope of the government to get direct advances from the central
bank has been considerably narrowed down.
South Africa – Public Finance Management Act, 1999 incorporates many
salutary features of responsible fiscal management such as budget disclosure of
intentions regarding borrowing and other forms of pubic liability during current
and future financial years, provision of giving projections of multi-year budget to
Parliament with key macro-economic projections, borrowing power limited to
budgeted deficit, Ministers’ responsibility regarding guarantees, to be defrayed in
the first instance from the funds budgeted for the department issuing the
guarantee, percentage limits for re-appropriations and unbudgeted expenditure
etc.
The fiscal rules for select countries highlighting targets, effective period,
statutory instrument, government level and penalty for non-compliance are set
out below.

177
selected countries – fiscal policy rules4
Countries Target Effective Statutory Government Penalty for
or Ceiling Period Instrument Level Non-Compliance
Netherlands Structural 1961-74 Government Central Reputational
Deficit Limit Policy Government
European Medium-term Since 1997 International General Reputational
Union Overall balance treaty (Stage Government Financial
Members yearly deficit 3 of EMU) (from 1999)
Limit (3 per
Cent of GDP)
United States Yearly Overall Proposal Constitutional Federal Judicial
Balance amendment Government
Costa Rica Yearly deficit proposal Constitutional Public Judicial
Limit (1 per amendment sector
cent of GDP
Switzerland Cyclically Proposal Constitutional Federal Reputational
Adjusted amendment Government
balance
New Zeland Medium-term Since 1994 Legal Public Reputational
Operating provision sector
Balance
Germany Yearly Current Since 1949 Constitutional Federal and Judicial
Balance amendment sub-national
Governments
Japan Yearly current 1946-75 and Legal Central Judicial
Balance proposed provision Government
From 2003
United States Yearly current Various Constitutional Subnational Judicial
Balance amendments Governments
Canada Overall balance Since 1993 Legal Subnational Judicial
Or deficit limit provision Governments
Indonesia No domestic Since 1967 Government General Reputational
borrowing policy Government
European No borrowing Since 1994 International General Judicial
Union from Central Treaty (Stage Government
Members bank. 2 of EMU)
Argentina, No borrowing Various Various General Judicial
Canada, Chile, from Central Government
Ecuador, bank.
Hungary,
Japan, Peru,
United States
Brazil, Egypt, Borrowing from Various Various General Judicial or
Morocco, Central bank Government reputational
Philippines, limited as fixed
Slovak proportion of last
Republic year’s revenue
European Gross debt Since 1997 International General Judicial
Union limit (60 per treaty (Stage Government
members cent of GDP) 3 of EMU)4 George Kopits and Steven Symansky, “Fiscal Policy Rules”, IMF Occasional Paper 1998.

178
REQUIREMENTS OF A MINIMUM STANDARD OF FISCALTRANSPARENCY
Clarity of Roles and Responsibilities
* General Government should be defined as in the System of National Accounts
(SNA, 1993) or the IMF Manual on Government Finance Statistics, (GFS,
1986).
* Government equity holding should be identified.
* Extrabudgetary activities should be subject to Government review and
priority setting as part of the budget process.
* Significant quasi-fiscal activities of the central bank, Public Financial
Institutions (PFIs), and Non-Financial Public Enterprises (NFPEs) should be
identified.
* A budget law or administrative framework, covering budgetary as well as
extrabudgetary activities and specifying fiscal management responsibilities
should be in place.
* Taxation should be under the authority of law and the administrative application of tax
laws should be subject to procedural safeguards.
Public Availability of Information
* Extrabudgetary activities should be covered in budget documents and
accounting reports.
* Original and revised budget estimates for the two years preceding the budget
should be included in budget documents.
* Budget documents should include statements of the main Central
Government contingent liabilities and tax expenditures, and a statement of
significant quasi-fiscal activities of the Central bank, PFIs and NFPEs.
* The level and composition of Central Government debt should be reported
annually with a lag of no more than six months.
* A statement of fiscal reporting practices should be published.
* Advance release date calendars should be announced for the year ahead showing no later
than release dates for annual reports and a range of dates for more frequent reports.
Open Budget Preparation, Execution and Reporting
* A fiscal and economic outlook paper should be presented with the budget,
including a statement of fiscal policy objectives and priorities, a summary of
economic prospects and a qualitative assessment of fiscal sustainability.
* A statement should be made of the medium-term macro economic framework
for the budget, including the macro economic forecasts on which the budget is
based. Key forecasting assumption should also be reported.
179
* A statement of fiscal risks should be presented with the budget documents,
covering the impact of variations in assumptions on fiscal forecasts,
contingent liabilities and the other main uncertainties about the costs of
certain programs.
* All general government activities should be covered by the budget and
accounts classification. Transactions should be recorded on a gross basis and
a classification by economic, functional and administrative categories should
be derived.
* The classification system should identify administrative responsibility for the
collection and use of public funds.
* The overall balance should be reported in budget documents, with an
analytical table showing its derivation from budget estimates.
* A statement of accounting standards should be presented with the budget.
* GDDS standards for periodicity and timeliness of Central Government
reports (each quarter within a quarter) should be followed.
* Final Central Government accounts should reflect high standards of coverage and
reliability, should be reconciled with budget appropriations, and should be audited by an
independent external auditor. Audited accounts should be prepared within 12 months of
the end of the fiscal year.
Independent Assurances of Integrity
* Mechanisms should be in place to ensure that external audit findings are
reported to the legislature and that remedial action is taken.
* Standards of external audit practice should be consistent with international
standards.
* Working methods and assumptions used in producing macro economic
forecasts should be made publicly available.
________________Source : IMF Code of Good Practices of Fiscal Transparency to be adopted by member countries on
voluntary basis.

180
major fiscal indicators
Deficit Indicators
1 Revenue Deficit (RD) The revenue deficit denotes the difference
between revenue receipts and revenue
expenditure signifies disserving of the
Government.
2 Monetised Deficit (MD) The magnetized deficit is the increase in
the net RBI credit to the Central
Government, which is the sum of
increases in the RBI’s holdings of (i)
Central Government dated securities, (ii)
Treasury Bills, (iii) rupee coins and (iv)
Loans and Advances from RBI to the
Centre since April 1, 1997 adjusted for
changes is the Centre’s cash balances
with RBI. Signifies extend of monetisation
of GFD.
3 Gross Fiscal Deficit (GFD) The gross fiscal deficit is the excess of
total expenditure including loans, net of
recovery, over revenue receipts (including
external grants) and non-debt capital
receipts. Measures the net borrowing
requirements of the Government.
4 Net fiscal Deficit (NFD) The net fiscal deficit is the difference
between gross fiscal deficit and net
lending. Measures the net borrowing
requirement in the absence of the lending
operations of the Government.
5 Gross Primary Deficit (GPD) The gross primary deficit is the difference
between the gross fiscal deficit and
interest payments. Measures the
borrowing requirement in the absence of
the debt service burden of past
borrowings of the Government.
6 Net Primary Deficit (NPD) The net primary deficit denotes net fiscal
deficit minus net interest payments.
7 Government Sector Fiscal Government sector fiscal deficit is the
deficit
Deficit (GSFD) of Central and State Government net of
inter-governmental transactions.

181
Debt and Sustainability Indicators
1 Debt Public debt and other liabilities
which include small savings,
provident funds, reserve funds,
deposits etc.
2 Combined Central & State Debt Total liabilities of the Centre
and the States net of loans and
advances given by the Centre to
the States.
3 Interest burden Interest payments as ratio to
revenue receipts.
4 Nominal interest rate on government debt Relatively higher interest rate
exceeding GDP growth rate has
implications for debt stability.
5 Debt/GDP ratio higher debt/GDP ratio puts
strain on government finances
and affects future sustainability
of fiscal policy.
6 Contingent liabilities Guarantees issued by
governments for various
purposes. These may include
credit guarantees, interest
payment guarantees or
exchange risk guarantees.
Indicators of Fiscal Stress
1 Ratio of Revenue Receipts to GDP Lower ratio adds to stress
2 Ratio of Tax Revenue to GDP Lower ratio adds to stress
3 Ratio of Non-Tax revenue to GDP Lower ratio adds to stress
4 Ratio of Direct Tax to GDP Lower ratio adds to stress
5 Ratio of Indirect tax to GDP Lower ratio adds to stress
6 Revenue Expenditure as proportion to GDP High ratio indicates fiscal stress
7 Capital Expenditure of GDP Lower ratio indicates fiscal
stress
8 Ratio of Interest Payments to Revenue High ratio indicates inflexibility
Expenditure/Total Expenditure/Revenue of budget
Receipts
9 Non-developmental expenditures as High ratio indicates poor
proportion to revenue receipts, total allocative efficiency of budget
expenditures and GDP

182
An
nex
4.1
Dim
ensi
on
s o
f P
ub
lic E
xpen
dit
ure
Man
agem
ent
Cat
ego
ries
of
Ob
ject
ives
1
Bro
ad C
on
ten
t
2
Tec
hn
iqu
es U
tiliz
ed f
or
Ach
ievi
ng
Ob
ject
ives
3
Co
mm
ents
4
Eco
no
mic
an
dfi
nan
cial
Mac
roec
onom
icst
abili
tyD
eter
min
atio
n of
aggr
egat
e sp
endi
ng,
size
of
defic
it/su
rplu
s an
d its
finan
cing
or
utili
zatio
n.
Spe
cific
atio
n of
ove
rall
mac
roec
onom
ic p
olic
ies
and
desi
gn o
f fis
cal p
olic
y; in
volv
es th
eap
plic
atio
n of
mac
roec
onom
ic fi
nanc
ial p
lann
ing
tech
niqu
es; t
echn
ique
s of
med
ium
-ter
m p
lann
ing
are
also
ext
ensi
vely
util
ized
.
Thi
s pr
ovid
es th
e an
nual
pol
icy
fram
ewor
k an
d a
link
with
mon
etar
y po
licy.
The
det
erm
inat
ion
of a
ggre
gate
spen
ding
cou
ld in
volv
e a
two-
tier
appr
oach
- o
ne fo
r th
eap
prop
riatio
ns w
hich
may
be
on a
n ob
ligat
ion
orac
crua
l bas
is, a
nd a
cas
h-ba
sed
appr
oach
to to
tal
spen
ding
.E
ffect
ive
budg
etin
gM
atch
ing
outla
ys w
ithre
sour
ces;
det
erm
inin
gin
tens
ity o
f allo
catio
n of
reso
urce
s am
ong
func
tions
and
with
infu
nctio
ns, a
mon
gpr
ogra
ms
and
activ
ities
.
Rol
ling
expe
nditu
re p
lann
ing;
prio
ritiz
atio
n;pl
anni
ng-p
rogr
amm
ing-
budg
etin
g; fu
ndam
enta
lex
pend
iture
rev
iew
s; z
ero-
base
bud
getin
g;ta
rget
-bas
ed b
udge
ting;
bel
ow-b
ase
budg
etin
g;lin
e-ite
m r
evie
w; d
evel
opm
ent p
lans
; out
put
budg
etin
g sy
stem
; acc
rual
-bas
ed b
udge
ting
syst
em.
Tec
hniq
ues
show
n in
col
umn
3 ar
e ge
nera
lly a
pplie
din
depe
nden
tly o
f eac
h ot
her.
In a
ny e
vent
, the
re a
rese
vera
l fea
ture
s th
at a
re c
omm
on to
thes
e te
chni
ques
.T
he a
ctua
l tec
hniq
ues
used
in a
yea
r de
pend
ver
ym
uch
on th
e ec
onom
ic s
ettin
g an
d th
e go
als
of fi
scal
polic
y. In
mos
t dev
elop
ing
coun
trie
s, a
com
bina
tion
oflin
e-ite
m r
evie
ws
and
deve
lopm
ent p
lans
, and
ad
hoc
budg
et-c
uttin
g m
easu
rem
ents
are
in o
pera
tion.
Man
agem
ent
asp
ects
Fin
anci
al d
isci
plin
eB
udge
t out
com
e to
be
cong
ruen
t with
est
imat
e.S
yste
m o
f tim
e-sl
ice-
base
d re
leas
e of
bud
get
auth
ority
; cas
h m
anag
emen
t tec
hniq
ues;
intr
ayea
r re
port
ing
and
mon
itorin
g; d
evel
opm
ent
of o
nlin
e sy
stem
s to
trac
k da
y-to
-day
deve
lopm
ents
; pro
visi
on o
f yea
r-en
d fle
xibi
lity.
The
man
agem
ent a
spec
ts s
peci
fied
here
wor
k w
ithin
the
over
all p
olic
y fr
amew
ork
indi
cate
d ab
ove.
Effi
cien
cy g
ains
Ach
ievi
ng e
cono
my
and
effic
ienc
y in
exp
endi
ture
.S
peci
ficat
ion
of c
ost s
tand
ards
; spe
cific
atio
n of
fisca
l div
iden
d; p
erfo
rman
ce b
udge
t sys
tem
;ac
tivity
-bas
ed c
ostin
g sy
stem
; im
prov
edco
mpe
titiv
e te
nder
ing
proc
edur
es.
The
inte
nt is
to s
ecur
e ef
ficie
nt im
plem
enta
tion
ofpr
ogra
ms
and
proj
ects
, and
del
iver
y of
ser
vice
s.
Pro
gram
and
Pro
ject
man
agem
ent u
tiliz
atio
nof
res
ourc
es
Man
ager
s to
hav
eop
erat
iona
l fle
xibi
lity
tofu
lfill
obje
ctiv
es w
ithin
spec
ified
bud
geta
ryre
sour
ces.
Per
form
ance
bud
getin
g; m
anag
emen
t con
trac
ts;
new
man
agem
ent p
hilo
soph
y; v
alue
-for
-mon
eyau
dit;
eval
uatio
n.
The
se te
chni
ques
may
be
appl
ied
in ta
sks
orie
nted
agen
cies
.

183
Cat
ego
ries
of
Ob
ject
ives
1
Bro
ad C
on
ten
t
2
Tec
hn
iqu
es U
tiliz
ed f
or
Ach
ievi
ng
Ob
ject
ives
3
Co
mm
ents
4F
inan
cial
dis
clos
ure
Pro
visi
on o
f acc
urat
ein
form
atio
n on
the
stat
usof
gov
ernm
ent f
inan
ces
topo
licym
aker
s, m
anag
ers,
and
the
publ
ic.
Acc
rual
-bas
ed a
ccou
ntin
g; d
ecis
ion-
rela
ted
info
rmat
ion;
spe
cific
atio
n of
acc
ount
ing
stan
dard
s.
Gov
ernm
ents
hav
e a
resp
onsi
bilit
y to
pro
vide
unb
iase
din
form
atio
n at
reg
ular
inte
rval
s.
Pu
blic
inte
rest
req
uir
emen
tsT
rans
pare
ncy
Cle
ar d
ecis
ion-
mak
ing
proc
edur
es.
Impr
oved
bud
get d
ocum
enta
tion
that
sho
ws
the
obje
ctiv
es a
nd fe
atur
es o
f pro
gram
s an
dpr
ojec
ts; p
repa
ratio
n of
ann
ual r
epor
ts o
fag
enci
es; d
isse
min
atio
n of
key
fina
ncia
lin
form
atio
n; c
ompl
ete
annu
al a
ccou
nts.
In g
ener
al, t
rans
pare
ncy
has
ofte
n be
en v
iew
ed a
slim
ited
to th
e re
quire
men
ts o
f the
legi
slat
ure;
it h
as,
how
ever
, bro
ader
req
uire
men
ts v
is-à
-vis
the
publ
ic. T
heem
phas
is o
n tr
ansp
aren
cy a
nd a
ccou
ntab
ility
cou
ldco
ntrib
ute
to th
e pu
rsui
t of d
efen
se m
echa
nism
s in
the
exec
utiv
e w
ing.
Thi
s co
uld
be o
verc
ome
in th
e lo
ng-r
unth
roug
h th
e rig
orou
s im
plem
enta
tion
of s
tand
ards
for
tran
spar
ency
and
acc
ount
abili
ty.
Acc
ount
abili
tyP
rovi
sion
of g
oods
and
serv
ices
with
in s
peci
fied
qual
ity, c
ost,
and
time
sche
dule
s.
Per
form
ance
bud
getin
g sy
stem
; acc
ount
abili
tyan
d pe
rfor
man
ce-o
rient
ed s
ervi
ce c
ontr
acts
;an
nual
rev
iew
or
eval
uatio
n; v
alue
-for
-mon
eyau
dit.
Acc
ount
abili
ty is
not
mer
ely
for
the
mon
ey s
pent
, but
for
resu
lts; t
he e
mph
asis
is n
ot m
erel
y to
be
criti
cal o
f the
exis
ting
syst
ems
and
proc
edur
es b
ut to
faci
litat
e th
eev
olut
ion
of a
ltern
ativ
e sy
stem
s of
del
iver
y of
goo
dsan
d se
rvic
es.
Clie
nt o
rient
atio
nG
over
nmen
t sys
tem
s an
dpr
oced
ures
sho
uld
bede
sign
ed to
ser
ve th
ene
eds
of th
e cl
ient
grou
ps.
Inte
rnal
eva
luat
ion;
gro
up s
urve
ys o
f clie
ntel
evi
ews.
The
pub
lic is
the
final
judg
e of
the
qual
ity a
nd q
uant
ityof
ser
vice
s pr
ovid
ed b
y th
e go
vern
men
t, ei
ther
dire
ctly
or in
dire
ctly
. The
ope
ratio
nal p
roce
sses
of e
ach
agen
cysh
ould
be
so d
esig
ned
as to
faci
litat
e in
tera
ctio
n w
ithth
e pu
blic
.P
olit
ical
asp
ects
Pol
itica
l acc
epta
bilit
yC
omm
unity
's a
ppro
val f
oral
l the
abo
ve fa
cets
isvi
tal f
or th
eim
plem
enta
tion
ofpo
licie
s.
Legi
slat
ive
appr
oval
; mar
ket a
ppro
val;
dono
rap
prov
al (
whe
re fo
reig
n ai
d is
an
impo
rtan
t par
tof
the
budg
et);
bro
ad s
uppo
rt fr
om o
ther
laye
rs o
fgo
vern
men
t.
Gov
ernm
ent f
inan
cial
man
agem
ent h
as a
sig
nific
ant
impa
ct o
n th
e co
mm
unity
. It's
voi
ces
com
e in
a v
arie
tyof
form
s an
d sh
ould
not
be
view
ed a
s be
ing
limite
d to
the
legi
slat
ure
only
.
Citi
zen
part
icip
atio
nT
o pr
ovid
e op
port
uniti
esto
the
com
mun
ity to
part
icip
ate
in c
erta
insp
here
s of
eco
nom
icm
anag
emen
t.
Ser
ving
on
the
tend
er o
r co
ntra
ct c
omm
ittee
;se
rvin
g in
the
eval
uatio
n m
achi
nery
; and
ser
ving
in th
e ad
viso
ry a
nd r
elat
ed p
olic
y co
unci
ls.
In s
ever
al w
ays,
this
is a
n ar
ea th
at r
emai
ns to
be
deve
lope
d fu
lly. A
ssoc
iatio
n of
citi
zens
to lo
ok a
t iss
ues
that
tran
scen
d th
e fin
anci
al a
spec
ts, a
nd th
ose
asso
ciat
ed w
ith th
e st
reet
-leve
l bur
eauc
racy
, has
dist
inct
adv
anta
ges
in p
avin
g th
e w
ay fo
r so
cial
con
trol
of p
ublic
fina
nces
.S
ourc
e : P
rem
chan
d A
(20
00).
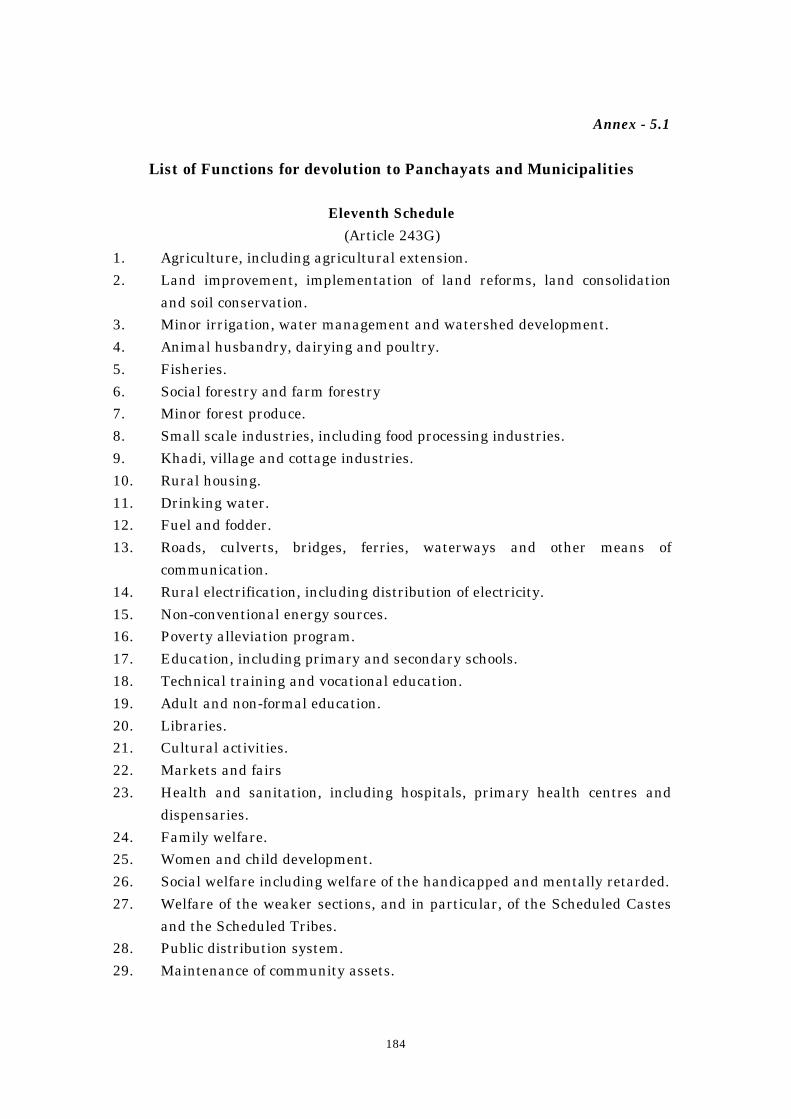
184
Annex - 5.1
List of Functions for devolution to Panchayats and Municipalities
Eleventh Schedule
(Article 243G)
1. Agriculture, including agricultural extension.
2. Land improvement, implementation of land reforms, land consolidation
and soil conservation.
3. Minor irrigation, water management and watershed development.
4. Animal husbandry, dairying and poultry.
5. Fisheries.
6. Social forestry and farm forestry
7. Minor forest produce.
8. Small scale industries, including food processing industries.
9. Khadi, village and cottage industries.
10. Rural housing.
11. Drinking water.
12. Fuel and fodder.
13. Roads, culverts, bridges, ferries, waterways and other means of
communication.
14. Rural electrification, including distribution of electricity.
15. Non-conventional energy sources.
16. Poverty alleviation program.
17. Education, including primary and secondary schools.
18. Technical training and vocational education.
19. Adult and non-formal education.
20. Libraries.
21. Cultural activities.
22. Markets and fairs
23. Health and sanitation, including hospitals, primary health centres and
dispensaries.
24. Family welfare.
25. Women and child development.
26. Social welfare including welfare of the handicapped and mentally retarded.
27. Welfare of the weaker sections, and in particular, of the Scheduled Castes
and the Scheduled Tribes.
28. Public distribution system.
29. Maintenance of community assets.
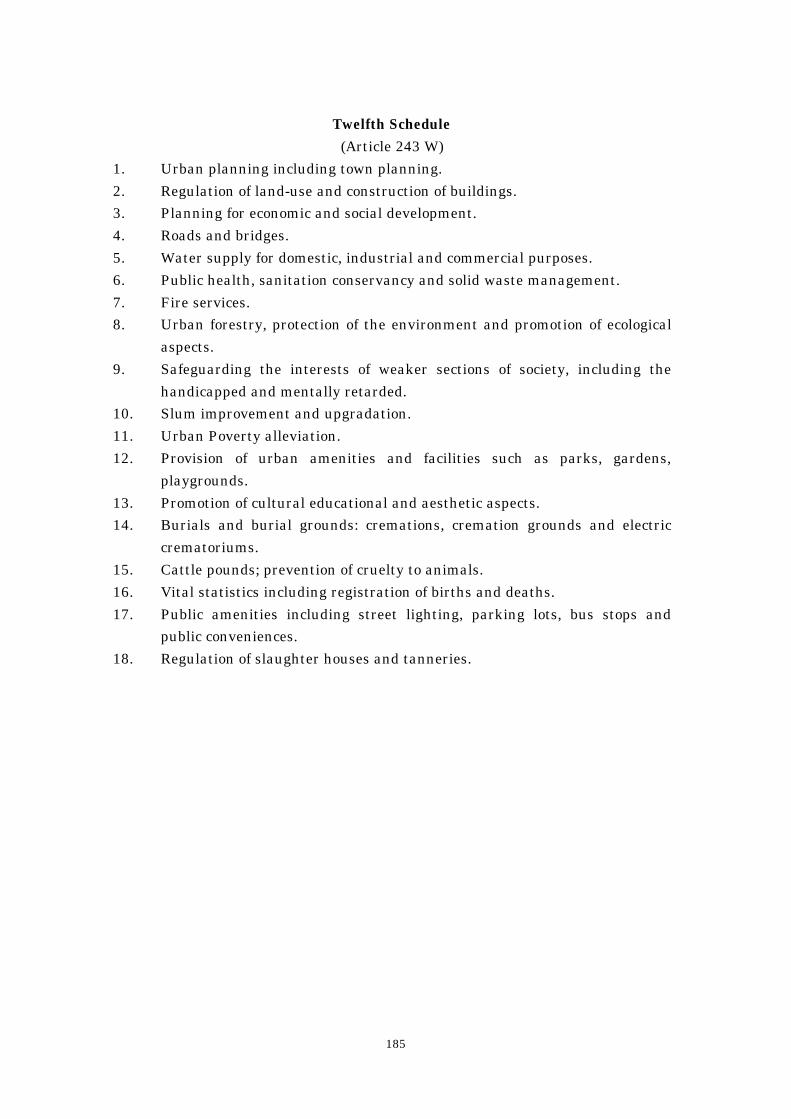
185
Twelfth Schedule
(Article 243 W)
1. Urban planning including town planning.
2. Regulation of land-use and construction of buildings.
3. Planning for economic and social development.
4. Roads and bridges.
5. Water supply for domestic, industrial and commercial purposes.
6. Public health, sanitation conservancy and solid waste management.
7. Fire services.
8. Urban forestry, protection of the environment and promotion of ecological
aspects.
9. Safeguarding the interests of weaker sections of society, including the
handicapped and mentally retarded.
10. Slum improvement and upgradation.
11. Urban Poverty alleviation.
12. Provision of urban amenities and facilities such as parks, gardens,
playgrounds.
13. Promotion of cultural educational and aesthetic aspects.
14. Burials and burial grounds: cremations, cremation grounds and electric
crematoriums.
15. Cattle pounds; prevention of cruelty to animals.
16. Vital statistics including registration of births and deaths.
17. Public amenities including street lighting, parking lots, bus stops and
public conveniences.
18. Regulation of slaughter houses and tanneries.

186
Annex 5.2
Excerpts from the Study on
DECENTRALIZATION - THE KERALA EXPERIENCE
By Vijayanand, S.M
Presented in 'India States' Reform Forum 2000', (Nov. 2000)
(www.statesforum.ogr)
Kerala has embarked on a trajectory of rapid decentralization. The State has
moved ahead at good pace with the transfer of not only functions and
responsibilities but also the authority to carry them out along with resources, both
human and financial. Though historically Kerala had not achieved anything
significant in decentralized development, after the 73rd and 74th Constitutional
Amendments, it has carried out certain pioneering reforms worthy of attention
and study. The reforms carried out in the State to decentralize governance
particularly in the developmental field have been very fundamental. It cannot be
dubbed as a political fad or as a tokenist gesture; it is no populist gimmick either.
It is an earnest attempt to set up genuine institutions of local self government as
envisaged in the Constitution.
** ** ** **
THE DECENTRALIZATION PROCESS.
A. Background.
There are certain peculiar Socio-political features, which need to be
clarified for a clear understanding of Panchayati Raj in Kerala. First is
the relative size of the three tiers. The Grama Panchayats (991 Nos) are
very large in size – their distribution according to population (1991
census) is as follows:
Below 10,000 - 1510,000 to 20,000 - 28820,000 to 30,000 - 42630,000 to 40,000 - 18040,000 to 50,000 - 6050,000 to 60,000 - 1860,000 to 70,000 - 1Above 70,000 - 2(The largest 20 Grama Panchayats have now been bifurcated).

187
This has several implications. It provides the natural “right size” for
several development services, especially viable service areas for Primary
Health Centres, Veterinary Hospitals, Krishi Bhavans and so on. Of
course it makes it difficult for direct participation by people of the whole
village and this problem can be surmounted only by limiting it to the
ward level -–i.e. the electoral constituency of a Grama Panchayat
Member. With large village Panchayats and relatively compact Districts
(14 Nos), it becomes difficult to earmark exclusive functions for Block
Panchayats (152 Nos.) which they alone can perform better than others.
Next is the rural-urban continuum, which exists in the settlement
pattern in Kerala. This is reflected in the functional responsibilities of
rural and urban local bodies. PRIs especially the Village Panchayats
have several civic and regulatory functions and the municipal bodies
have several developmental and welfare functions.
Another feature is the influence of the political milieu. All elections are
fought on party basis and there is considerable polarization in the
political composition of local governments. This had led to the policy
decision to treat PRIs as non-hierarchical – i.e., the District Panchayat
has no control over Block or Village Panchayats. This arrangement while
it keeps the system free of political squabbles, strengthens local
government autonomy and instills a sense of responsibility, creates
operational problems in monitoring, reporting, financial supervision,
passing down of information and even in integration of plans across tiers.
B. The Strategy of Decentralization.
Kerala has followed an unorthodox strategy of decentralization. It
reverse the traditional paradigm of gradualist transfer of powers to local
governments in accordance with perceived improvement in their
capacities to exercise them. It opted for a big bang approach by
transferring functions, authority and resources in one fell blow and then
attempting to build the capacity of local governments to perform
efficiently. This methodology first transferred powers and then set up
umpiring systems; it devolved funds and then structured procedures and
systems. It facilitated learning by doing and at the same time was backed
up by a system, which responded quickly to the ups and downs of the
process. In a sense this reversal of the conventional sequence, placed an

188
onus on Government to ensure that the right environment was created
for the local governments to function well. At the same time the local
governments were pushed by the new responsibilities to carry out their
responsibilities to the best of their ability. Hind-sight proves that it was a
very wise move strategically, as it is well nigh impossible to transfer
power in degrees.
To operationalise decentralization, Kerala chose the path of participatory
local level planning as the entry point. This succeeded to a considerable
extent in harnessing public action in favour of decentralization. In order
to push the system and force the process a campaign approach was
followed for decentralized planning - known as the 'People's Planning
Campaign'. This campaign created a powerful demand factor for
decentralization to be guided along the right path. To a large degree the
campaign has succeeded in setting the agenda for decentralization.
C. Steps in Decentralization.
(1) Creation of legal entitlements and defining of the functional domain: The
Kerala Panchayat Raj Act was passed by the legislature and brought into
effect in May 1994. Based on the initial experience in decentralization, it
was radically restructured in March 1999, significantly fortifying the
decentralization process. The 11th Schedule of the Indian Constitution
actually does not define the functional sphere of local governments. It is
only a suggestive list of developmental subjects in which the local
governments could have a role in planning for economic development and
social justice and in the implementation of such plans. Unlike many State
Acts, Kerala has attempted to define the functional areas of the different
tiers of PRIs as precisely as possible. It was guided by the principles for
transfer of functions laid down by the Committee on Decentralization of
Powers. In areas related to infrastructure and management of public
institutions, the functional differentiation is sharp and clear, but in
productive sectors it is difficult to clearly earmark functions separately for
each tier. Only through experience can the natural functional area in such
sectors get marked. There is a clear recognition that there is a role-range
for local governments – Agent, Adviser, Manager, Partner and Actor – with
the objective being to reduce the agency role and expand the autonomous
Actor role. The Kerala Act classifies functions as mandatory functions,
general functions and sector-wise functions.

189
Another path breaking exercise in broadening the legal entitlements of
local governments was the amendment carried out in March 2000 to 35
State legislations. These amendments which aimed at creating the
necessary legal frame work for the smooth functioning of the local
governments essentially transformed them into the third tier of
governance through the far reaching legislative recognition of the fact that
local governments are not creatures of one or two acts but they are
partners of government in carrying out various developmental functions
and have a legitimate space in all enactments related to their area of
functioning.
(2) Transfer of Institutions and Staff. Various institutions, offices and staff of
government were transferred to the local governments and this was done
in two major instalments - the first was in September 1995 before the first
general elections to the newly set up local governments and the second was
in July 2000, just before the second general elections.
The local governments have operational control over the staff transferred
to them. They can assign duties and supervise, review and inspect
performance. They can also impose minor punishments on the staff if it is
so needed to enforce discipline.
The local governments cannot create new posts. They have to go by the
normative staff pattern laid down by government. Since recruitment to all
posts in the State is done by the Public Service Commission, neither the
government nor the local governments have a say in this. However interim
filling up of vacancies till Public Service Commission recruits join duty can
be done by the local governments.
The quantum and quality of decentralization as delineated in laws and
prescribed in government orders can be gauged from the following
statements:
(1) In the Health sector all institutions other than medical colleges
and big regional specialty hospitals have been placed under the control
of the local governments.
(2) In the Education sector, in rural areas the high schools have been
transferred to the District Panchayats and the primary and upper
primary schools have been transferred to Village Panchayats; in urban
areas, all schools have been transferred to the urban local bodies.
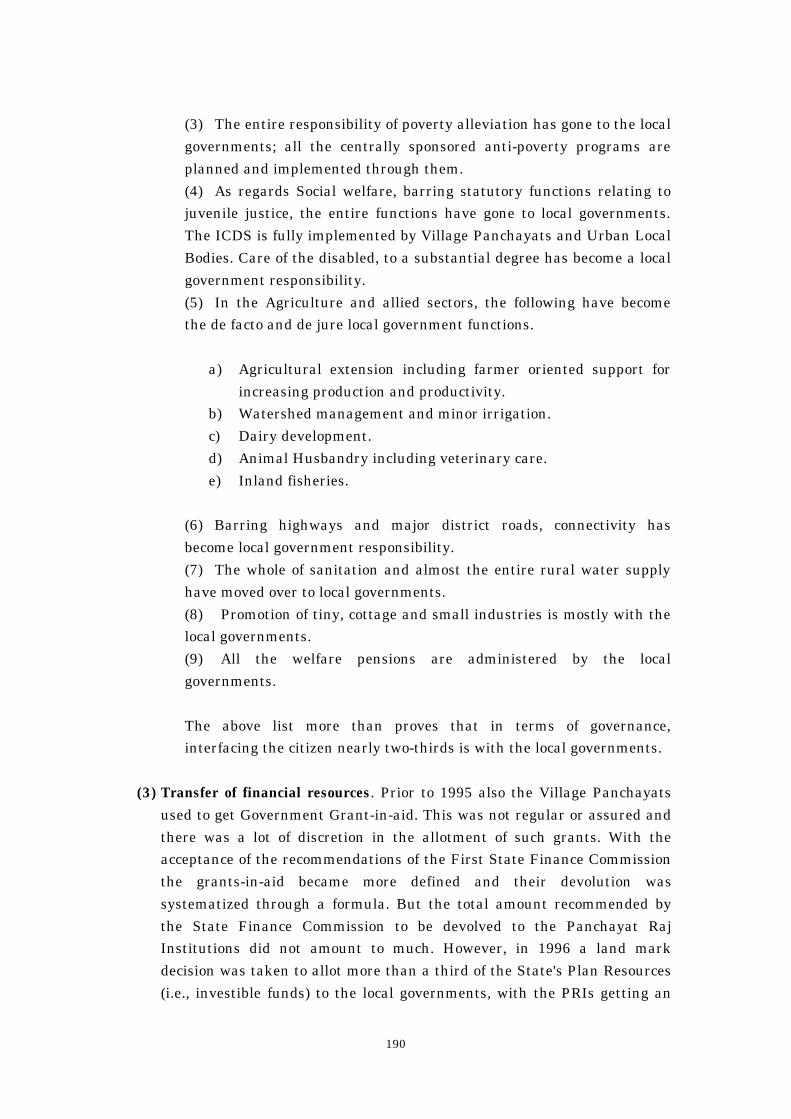
190
(3) The entire responsibility of poverty alleviation has gone to the local
governments; all the centrally sponsored anti-poverty programs are
planned and implemented through them.
(4) As regards Social welfare, barring statutory functions relating to
juvenile justice, the entire functions have gone to local governments.
The ICDS is fully implemented by Village Panchayats and Urban Local
Bodies. Care of the disabled, to a substantial degree has become a local
government responsibility.
(5) In the Agriculture and allied sectors, the following have become
the de facto and de jure local government functions.
a) Agricultural extension including farmer oriented support for
increasing production and productivity.
b) Watershed management and minor irrigation.
c) Dairy development.
d) Animal Husbandry including veterinary care.
e) Inland fisheries.
(6) Barring highways and major district roads, connectivity has
become local government responsibility.
(7) The whole of sanitation and almost the entire rural water supply
have moved over to local governments.
(8) Promotion of tiny, cottage and small industries is mostly with the
local governments.
(9) All the welfare pensions are administered by the local
governments.
The above list more than proves that in terms of governance,
interfacing the citizen nearly two-thirds is with the local governments.
(3) Transfer of financial resources. Prior to 1995 also the Village Panchayats
used to get Government Grant-in-aid. This was not regular or assured and
there was a lot of discretion in the allotment of such grants. With the
acceptance of the recommendations of the First State Finance Commission
the grants-in-aid became more defined and their devolution was
systematized through a formula. But the total amount recommended by
the State Finance Commission to be devolved to the Panchayat Raj
Institutions did not amount to much. However, in 1996 a land mark
decision was taken to allot more than a third of the State's Plan Resources
(i.e., investible funds) to the local governments, with the PRIs getting an

191
85% share in accordance with the rural population. The noteworthy
features of Kerala's financial devolution to local governments are listed
below:
1. The quantum of Plan funds earmarked for local governments is the
highest in the country.
2. Around 90% of the Plan funds is given in a practically untied form to
the local governments to prepare their own schemes and implement
them within certain broad policy framework, which stipulates that at
least 40% of the funds should be invested in productive sectors, not
more than 30% should be invested on roads and at least 10% should be
earmarked for gender sensitive schemes and which has fixed a
consensual upper ceiling for subsidies in different categories of schemes.
3. The entire Plan grant is investible. This can be called "pure money", as
it does not carry any staff salaries or other administrative costs.
(Normally at the State level 20 to 25% of the plan is taken away by
such commitments.)
4. All the Plan grants due to local governments are separately budgeted in
a document given as Annexure IV of the State Budget. Since it is
passed by the Legislature it is non-divertible for other purposes by the
executive.
5. Contrary to universal practice, it is the Village Panchayats which get
the bulk of the Grants with nearly 70% of the rural share going to them
and the District and Block Panchayats only sharing the remaining 30%
more or less equally.
6. Every single rupee devolved to local governments whether under Plan
or other categories is given as per a transparent formula and there is
no room for patronage or partisanship in allocation of resources to local
governments.
7. A flow of funds procedure has been designed. The funds flow in four
instalments. A local government has to spend at least 75% of its
allocation during a year failing which the shortfall would be reduced
from the next year's allotment.
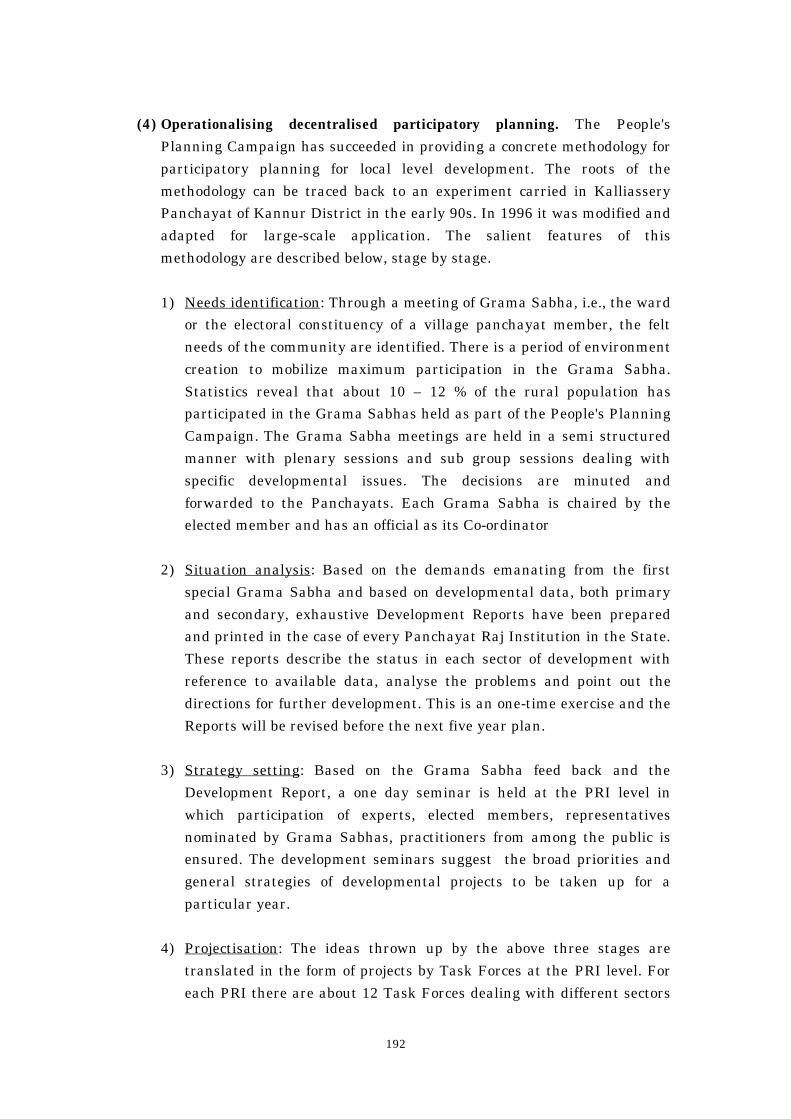
192
(4) Operationalising decentralised participatory planning. The People's
Planning Campaign has succeeded in providing a concrete methodology for
participatory planning for local level development. The roots of the
methodology can be traced back to an experiment carried in Kalliassery
Panchayat of Kannur District in the early 90s. In 1996 it was modified and
adapted for large-scale application. The salient features of this
methodology are described below, stage by stage.
1) Needs identification: Through a meeting of Grama Sabha, i.e., the ward
or the electoral constituency of a village panchayat member, the felt
needs of the community are identified. There is a period of environment
creation to mobilize maximum participation in the Grama Sabha.
Statistics reveal that about 10 – 12 % of the rural population has
participated in the Grama Sabhas held as part of the People's Planning
Campaign. The Grama Sabha meetings are held in a semi structured
manner with plenary sessions and sub group sessions dealing with
specific developmental issues. The decisions are minuted and
forwarded to the Panchayats. Each Grama Sabha is chaired by the
elected member and has an official as its Co-ordinator
2) Situation analysis: Based on the demands emanating from the first
special Grama Sabha and based on developmental data, both primary
and secondary, exhaustive Development Reports have been prepared
and printed in the case of every Panchayat Raj Institution in the State.
These reports describe the status in each sector of development with
reference to available data, analyse the problems and point out the
directions for further development. This is an one-time exercise and the
Reports will be revised before the next five year plan.
3) Strategy setting: Based on the Grama Sabha feed back and the
Development Report, a one day seminar is held at the PRI level in
which participation of experts, elected members, representatives
nominated by Grama Sabhas, practitioners from among the public is
ensured. The development seminars suggest the broad priorities and
general strategies of developmental projects to be taken up for a
particular year.
4) Projectisation: The ideas thrown up by the above three stages are
translated in the form of projects by Task Forces at the PRI level. For
each PRI there are about 12 Task Forces dealing with different sectors
193
of development. Each Task Force is headed by an elected member and
is convened by the concerned government official. The Vice Chairman
of the Task Force is normally a non-government expert in the sector.
The projects are prepared in the suggested format outlining the
objectives, describing the benefits, explaining the funding and detailing
the mode of execution and phasing of the project.
5) Plan finalization: From among the projects, based on the allocation
communicated, the concerned PRI finalizes its plan for the year and
this plan is submitted to the District Planning Committees (DPCs)
through the Expert Committees. The Panchayat is free to take up any
project, irrespective of its cost, subject of course to the resources
actually available and within the sectoral limits.
6) Plan vetting: The Expert Committees at the Block or the District level
vet the projects for their technical viability and conformity with the
mandatory government guidelines on planning and costing and forward
them to the DPC. They cannot change priorities or projects; they can
only ask for rectification.
7) Plan approval: The DPC gives the formal approval to the plans after
which the PRI can start implementation. It is to be noted that the DPC
also cannot change the priority of a PRI. It can only ensure that
government guidelines are followed. Administrative approval for
implementation is given project-wise by the PRI. Every PRI has
unlimited powers of Administrative sanctions subject only to the limits
of its Financial resources.
(5) Setting up Appropriate Administrative Support Systems. A remarkable
feature of Kerala's decentralization has been the achievement of the State
Government in having created a sub set of laws and procedures to
facilitate the smooth functioning of PRIs. A fact often not realized is that
for day to day exercise of powers and functions, mere provisions in the Act
would not be sufficient. They have to be fleshed out with appropriate rules,
which constitute the subordinate legislation, and more important, to make
the system dynamic, government orders, manuals and circulars would
have to be infused into this system to provide the life blood. Since the deep
structure of various governmental procedures are attuned for a centralized
functioning, it is necessary to radically alter them to bring about a sub
system, which in keeping with the spirit of decentralized governance. It is
194
all the more necessary because of the fact that almost the whole of the
developmental sphere of government is governed not by legislation but by
executive decisions expressed in the form of government orders, manuals,
guide lines, circulars and clarifications. Kerala has been able to realize this
practical point and has succeeded in considerable measure in laying the
foundation for new systems. Some of the important administrative
measures worth mentioning, are summarized below:
• In a fundamental shift from the existing method of execution of public works a
set of rules for execution of public works by Panchayati Raj Institutions was
issued. It provides for community contracting of works through committees of
beneficiaries along with stringent provisions to guard against 'benami'
contractors masquerading as convenors or nominees of beneficiary committees.
The rules provide for compulsory transparency with all records relating to a
public work right from preliminary estimates, up to final bills and payment
vouchers being declared as public documents for any one to peruse or take
copies. The rules also insist on preparation of a summary of the estimate in
layman's language and exhibition of this summary as well as details of
execution at the work site. In addition the process of technical approval is
sought to be demystified so that government could, through an executive order
bestow powers of technical sanction on institutions as well as Committees of
government or non-government professionals. This radical feature provides for
easy access to technical expertise. In pursuance of these rules the government
have embarked on a program of creating a separate public works manual for
local governments with updated specifications and standards and more
accountable and people-friendly methods of preparation of estimates and
taking measurements of public works. This ambitious program when it is
carried to its logical conclusion is expected to revolutionize the execution of
public works by reducing chances of corruption and facilitating social audit.
• Another innovation is the setting up of Expert Committees. Originally
a Volunteer Technical Corps (VTC) was set up as part of the People's
Planning Campaign at Block and District levels. This consisted of
experts in various fields who responded to the call of Government to
render voluntary professional services in the cause of local level
development. These VTCs were converted into Block Level Expert
Committees (BLEC) and District Level Expert Committees (DLEC) by
adding to its membership through the nomination of professionals from
Government. These Expert Committees are given a three-fold role.
Firstly they are expected to provide technical advice to the PRIs.
195
Secondly they are empowered to technically vet the projects of PRIs
before they are sent to the District Planning Committee for approval.
Here the Expert Committees function as the Technical Advisory
Groups of the DPC. However these Expert Committees are not
empowered to change the priority of a PRI; they can only insist on
following of technical standards, proper costing and phasing of various
programs. The third function of the Expert Committee is to provide
technical sanction for works, which require such approval. In this role
they function as the Technical Support Group of the PRIs. For technical
sanction, sub groups consisting of at least three Experts are formed in
which as far as possible the Government professional is the conveyor
and the non-government professional is the Chairperson. This system
of technical approval is faster, cheaper and more transparent. It has
debureaucratised and demystified the process of giving technical
sanction. In the case of PRIs without engineers, the members of these
Expert Committees are allowed to perform the engineering support
functions subject to the payment of a small fee not exceeding 21/2 % of
the estimate of a work for the full range of functions. This outsourcing
of technical services has been institutionalized.
• In order to improve the quality of implementation and to facilitate
speedy execution of public works a system of accrediting non-
government organizations for carrying out public works has been
introduced. Accordingly, five NGOs have been accredited including a 75
year old Labour Co-operative Society. Local Governments can directly
approach any of these NGOs and get their works executed without
going through the tendering process. Incidentally three of the NGOs
accredited specialize in appropriate building technologies, attempting
to use cost effective local materials and man power. Also a scheme of
Apprentice Engineers have been introduced which allows fresh
graduates from Engineering Colleges as well as diploma holders from
Polytechnics to lend their services to Village Panchayats for a period of
one year and in return gain hands on experience in designing and
supervising public works projects.
• Another major area of local government functioning is selection of
beneficiaries for various individual and group oriented development
programs, particularly relating to anti poverty and minimum needs
programs for people below poverty line. Without infringing on the basic
autonomy of Panchayat Raj Institutions, the Government have

196
prescribed a due process for beneficiary selection. The key elements of
this process are fixing of definite and transparent eligibility criteria for
each scheme as well as prioritization criteria among those eligible for
such scheme. The prioritization criteria have to be given weightages in
the form of points or marks. These criteria have to be published and
application forms invited after widespread publicity. In fact full-page
advertisements are issued by Government alerting the people about
impending beneficiary selection and exhorting them to approach the
PRIs. Each application received has to be acknowledged. Thereafter it
has to be enquired into either through officials or preferably through a
committee of officials and non-officials and marks awarded for each
criterion and totaled. A draft priority list based on these marks has to
be prepared and taken to the Grama Sabha in which the applicants
from that particular ward also participate. The marks have to be
justified in the Grama Sabha and altered if decided by the Grama
Sabha. Once the Grama Sabha approves the list, the priority cannot be
changed by the Panchayat. In order to ensure equitable distribution of
benefits among the different wards of a Village Panchayat, ward-wise
physical target is prepared in proportion to eligible applicants. Even for
selection of beneficiaries to schemes sponsored by Block Panchayats
and District Panchayats it is the Grama Panchayat which is to perform
the function through its Grama Sabhas in the manner prescribed above.
All records relating to selection of beneficiaries have again been
declared as public documents. This insistence of due process has
considerably reduced patronage and nepotism in the selection of
beneficiaries.
• Over a period of time in the absence of genuine democratic institutions
at the District level or levels below, various agencies have been set up
for various schemes. They are all nominated power centres of one kind
or the other and exercise functions and take decisions in areas related
to the subject under the control of local governments. Government of
Kerala has realized that such parallel systems are detrimental to the
growth of genuine PRIs and a conscious decision has been taken to
abolish such institutions. In pursuance of this decision the DRDA and
Development Authorities in the non-Corporation areas have been
disbanded. An exercise is being undertaken to dismantle Fish Farmers
Development Agencies (FFDA) and Brackish Water Fish Farmers
Development Agencies (BWFFDA) also.

197
• An interesting administrative feature is the role of the District
Collector. The Collector has practically no role in the developmental
sphere and has no control whatsoever over the PRIs. But he is the chief
co-ordinator of decentralized planning and implementation, playing a
critical role in providing support services in monitoring and in trouble
shooting. The experience and expertise of Collectors are harnessed to
the full without in any way affecting the independence of PRIs.
• A very successful administrative innovation is the functioning of the
Co-ordination Committee which is a high power Committee constituted
by the Council of Ministers to which its powers have been delegated for
taking most of the policy decisions in respect of decentralization. This
Committee is chaired by the Minister for Local Self Government and
has as its members the Secretaries in charge of Local Self Government,
SC/ST Development, Planning and Finance Departments, Members of
the State Planning Board in charge of Resources and Decentralized
Planning and the Heads of Panchayat, Municipalities, Rural
Development Departments. This Committee which meets every week
has been a great success in providing online response to issues arising
out of the decentralization process by virtue of its empowered nature. It
has helped in taking quick policy decisions and issue of critical
government orders and circulars to remove bottlenecks.
• There is a system of identifying beacon Grama Panchayats and
conferring Grama Shree Awards based on certain criteria of
performance. These Panchayats are encouraged through incentive
grants. Similarly Panachayats which have shown best practices in
various developmental fields are given a nodal role in providing
training to elected members and officials of sister Grama Panchayats,
by inviting them to the Panchayat and sharing their experience.
• Some of the administrative reform measures which have been approved
and are under operationalisation are listed below:
i. A Committee has been set up to prepare new modern manuals dealing
with budgeting, accounting and auditing of local governments. Another
Committee has been set up to prepare a detailed manual for procurement
of goods and services by the local governments.
ii. A detailed government order outlining the rights of citizen vis-à-vis local
governments, is under preparation and is to be given to every family. This
198
is expected to be a powerful tool of empowerment in a literate society.
Similarly a government order on the rights of elected members is also to be
prepared.
iii. Manuals for effective management of institutions transferred to local
Governments are under preparation.
iv. Information Kerala Mission has been launched with the objective of
introducing information technology in local governments. Every Village
Panchayat is expected to be networked by mid 2001.
(6) Capacity Building. A huge capacity building exercise has been attempted
right from the beginning. In the first year a cascading system of training
was introduced to enable quick outreach to the cutting edge level. About
600 Key Resource Persons (KRPs) were identified at the State level both
from Government and outside representing various disciplines. These
persons were utilized to train practically every elected member of local
governments as well as key officials. At the district level about 10,000
District Resource Persons (DRPs) and at the local government level about
100,000 Local Resource Persons (LRPs) were selected. All the DRPs and
LRPs and a good number of KRPs were selected by the Local Governments
themselves from government officials, professionals and activists. The
massive training program ensured that at the level of the Village
Panchayat, there would be nearly 100 persons sensitized on the objectives
and methodology of decentralized planning. These Resource Persons took
active part in spearheading the campaign as well as intervening in critical
stages of the Plan preparation and implementation cycle.
In order to fortify and simplify the training system in the second year,
handbooks on various development sectors were prepared by expert panels
and circulated widely among the local governments and Resource persons.
These handbooks outline the problems and possibilities of the sector and
contain model projects, which can be adapted according to local needs.
Sixteen such handbooks were prepared.
Now the focus is on strengthening the capacity of the Task Forces on
various sectors. Institutions like Medical College, Agricultural University,
Centre for Water Resource Development and Management (CWRDM) etc.,
are being utilized to provide high quality technical training to members of
Task Forces in their respective disciplines. In addition, local governments
which have evolved successful models are now utilized to train fellow local
governments by exposing them to the models evolved.
199
All these training programs are getting consolidated and institutionalized
around the Kerala Institute of Local Administration, one of the few
institutions of that kind existing in the country. It was set up by pooling
the funds of various Village Panchayats and Municipal bodies and this
institute is perceived as one owned by the local governments and has
excellent credibility in reaching out to them. The experience from the
training programs is being utilized to strengthen the Kerala Institute of
Local Administration which is expected to grow into a national centre of
excellence for capacity building for local governments.
(7) Accountability Mechanisms.
(a) Institutions: There is a conscious decision by Government to give up
direct control over local governments and to set up independent
institutions to deal with various aspects of local government functioning.
The institutions which have been created and which are in the offing are
listed below:
i) The State Election Commission. The Election Commission has
been given powers which go beyond those required for the
conduct of elections. It is empowered to delimit Wards which
were formerly done by the executive and it has been given
powers to disqualify defectors.
ii) The State Finance Commission. This has been given the
mandate as required by the Constitution. The first SFC was
constituted in 1994 and the second SFC in 1999.
iii) Ombudsman for Local Governments. This is a high power
institution (it is the name given to an institution rather than
an individual as is the conventional practice) consisting of
seven members – a High Court Judge, two District Judges,
two Secretaries to Government and two eminent public men
selected in consultation with the Leader of Opposition. This
institution has been given vast powers to check malfeasance in
local governments in the discharge of developmental functions.
iv) Appellate Tribunals. These are to be constituted at the
Regional/District level to take care of appeals by citizens
against decisions of the local government taken in the exercise
of their regulatory role like issue of licences, grant of permits
etc.
200
v) Audit Commission. Though this has not yet been legislated a
policy decision has been taken to set up an Audit Commission
which would be independent of governmental control and
which would function on the lines of Comptroller and Auditor
General of India and would be able to set its own standards of
audit.
vi) State Development Council. This is headed by the Chief
Minister and consists of the entire Cabinet, Leader of
opposition, Vice-Chairman of the State Planning Board, the
Chief Secretary, all the District Panchayat Presidents who are
also Chairperson of District Planning Committee and
representatives of other tiers of local governments. This
institution is expected to take the lead in policy formulation
and in sorting out operation issues.
(b) Conventional Accountability Systems. The conventional systems of
accountability have both been newly brought in or the existing practices
reinvigorated. Some of the important ones are summarized below:
i. The fund flow is through treasuries and the accounts are
maintained in Treasury Personal Deposit Accounts. Every
receipt and payment is recorded and a system of certification is
relied on for release of funds.
ii. Local Government decides the "implementing officer" for each
project and thereafter the funds for that project are transferred
to the implementing officer who is to implement the project as
approved by the local government expend funds under the close
supervision of the local government and report to it regularly.
He can withdraw funds only on the specific authorization of the
local government. This achieves a double purpose - the
involvement of the officer ensures observance of the due process
and the supervision of local governments provides social control.
iii. Traditionally audit of local governments in Kerala have been
performed by the Local Fund Audit Department controlled by
the Finance Department of the State. With decentralization
surplus staff of the Panchayat, Rural Development, and
Municipalities Departments at the District level have been
formed into Performance Audit Teams whose function is to carry
out periodical concurrent audit mainly with the objective of
enabling proper maintenance of accounts and adherence to basic

201
procedures rather than post facto fault-finding. In cases of
complaint, Government resorts to making requests for special
audit by the Accountant General.
iv. The local governments are inspected by the Finance Inspection
Wing, the Vigilance Department on sample basis or on receipt of
serious complaints. With decentralization a Technical Audit
Team has been set up to randomly check the quality of public
works and sort out disputes between local governments and
engineering staff.
v. A Grievance Enquiry Committee has been constituted at the
District and State level to enquire into complaints and if serious
faults are noticed they are referred to the Ombudsman.
(c) New Accountability Mechanisms.
With the new empowerment of local governments, certain new
procedures and systems to ensure accountability have come into
being. They are described below:
(i) The Government frequently launches IEC Campaigns of a
non-propagandist nature bringing to the notice of the
citizen his rights and duties vis-à-vis local governments.
This is done through full page advertisements in major
newspapers. In a State where newspaper readership, is
extremely high this has good effect.
(ii) All local governments follow the council system of decision
making. No individual or group is given the power to
decide. Everything can be decided only by the full
Committee of a local government. The meetings of local
governments are open and can be attended by members of
the public as well as the Press.
(iii) Grama Sabhas have been strengthened and given powers
to select beneficiaries as well as the right to know every
item of expenditure in the Village Panchayat.
(iv) The 12 Task Forces each headed by a Member of the Local
Government having both official as well as non-official
experts in the sector, function as Monitoring Committees.
They carry out field visits and inspections to verify that the
projects are properly carried out.

202
(v) The Expert Committees described earlier make sure that
basic technical standards are maintained and that costs
are reasonably fixed.
(vi) The due process in beneficiary selection prescribed by a
Government Order has made it legally enforceable.
(vii) The broad frame work of formulation of schemes provides
the rational boundaries to autonomy and acts as a check on
run-away misutilisation of funds.
(viii) The right to information has been enshrined in the
Panchayat Raj and Municipality Acts making all
documents relating to public works and other items of
expenditure public documents available to anyone for
scrutiny. Information Boards have been set up in each
Ward where information on developmental matters are
exhibited regularly.
NEW INITIATIVES
In order to consolidate the gains of the formative years and to sort out
the problems, the following initiatives are in the offing.
(1) Strengthen Grama Sabhas further through action research
projects in which NGOs and eminent citizens are involved.
This to bring about greater participation of all sections of
society especially the better-off ones and encourage more in-
depth discussions on local development issues and detailed
social audit
(2) Upscale the Social Audit systems now tried out in selected
local governments and make social auditing an integral part of
local government system. This is to facilitate greater control
from below.
(3) Move from annual planning to five year planning to ensure
more sustainable developmental schemes. This is to reduce the
tendency to spread the resources thin and help develop a
strategic vision of development.
(4) Attempt to attract institutional finance for local development
effort. This will help curb the tendency to give high subsidies
in individual beneficiary-oriented projects and motivate taking

203
up of commercially viable projects or projects which have a
revenue stream from user equity and user charges.
(5) Restructure the existing Kerala Urban Development Finance
Corporation (KUDFC) and making it into financing agency for
all local governments with a special responsibility to develop
viable projects for institutional funding.
(6) Prepare a shelf of B.O.T/B.O.O. projects for willing local
governments to pick up.
(7) Provide an incentive stream to Village Panchayats from the
Plan grant to raise local resources.
(8) Develop modern but simple systems for budgeting, accounting
and auditing and prepare elaborate self-speaking manuals on
these aspects. This is to inculcate greater financial discipline.
(9) Design a new Public Works Manual incorporating appropriate
standards and specifications as well as methods of estimation.
This is to allow flexibility and simplicity for community
contracting and demystify the process of preparing cost
estimates of public work. A major threat to decentralization is
the scope for corruption inherent in archaic and arbitrary
procedures of estimate preparation and measurement of work
done. Moreover, innovative methods of competitive bidding
and contracting out of works need to be introduced into the
system.
(10) Network local governments through computers, initially for
Plan monitoring and later for other purposes for increased
accountability and for easing the workload.
(11) Move on to electronic budgeting linked to computerized
treasuries. This is to reduce the tendency to divert funds.
(12) Publish Citizen's Charters for each local government. This is
to focus on quality of services, that is, on the software of
governance.
(13) Lay down a Code of Conduct for elected representatives and
officials. This to define expectations of behavioral norms and
ethical standards and demarcate the domains of professional
freedom and political control.
(14) Adopt modern office management methods.
(15) Focus on management of institutions and delivery of services,
moving away from mere implementation of public works and
beneficiary oriented programs. For this simple but detailed

204
management manuals are to be prepared for each kind of
institution/office.
(16) Promote community management of assets created, starting
with water supply.
(17) Publish citizen entitlements as well as elected representative
entitlements and reach them to every family and every elected
member.
(18) Allow beacon panchayats full freedom from existing rules
and procedures for a fixed period. This is to document best
practices and adopt them into the system for replication.
(19) Create a cadre of development professionals to serve as chief
executives of local governments. This is to get over the
problems of co-ordination particularly at the Village
Panchayat level.
The Achievements
The experience of the first few years of decentralization has proved that in
providing basic minimum needs infrastructure like housing, water supply,
sanitation and connectivity, the Local Governments have performed
creditably. The speed and extent of coverage as well as efficiency in
implementation in respect of provision of minimum needs has been superior
to that of Government. The details of local government achievement in
poverty related programs in the last three years are summarized below:

205
A. Asset distributions for economic development (Major items)
1. Cattle 2,74,572 Nos.(Of which 86792 under Special Component Plan(SCP) for Scheduled Castes & 10520 underTribal Sub Plan (TSP) to Scheduled Tribes.
2. Cattle sheds 74,636 Nos. (11,570 SCP/ 1047 TSP)
3. Poultry 18,67,517 (310653 SCP/ 24305 TSP)
4. Sewing Machines 53,472 (15766 SCP/ 732 TSP)
B. Basic Needs.
1 House Plots 15099 (10079 - SCP 7115 - TSP)
2 New Houses 3,06,288 Nos. (103040 SCP/ 14133 TSP)
3. Upgradation of Houses 1,18,019 (51511 - SCP 6634 - TSP)
4. Wiring of houses 10,07,717 (41138 SCP 4577 TSP0
5. Toilets 4,13, 174 (80941 - SCP 9567-TSP)
6. Drinking Water Wells 87, 591 (19,637 SCP 1647 TSP)
7. Drinking Water Taps 32,503 (6432 SCP 1131 TSP)
8. Additional space created inschools
93,548 sq.mts.
9. Additional space created inhospitals
90,021 sq.mts.
10. Additional space created inpublic markets
56,328 sq.mts
11. Roads upgraded 17,188 kms.
Next to minimum needs, the local governments have done reasonably well in
natural resource management particularly in utilization of water resources
for productive purposes. As regards the productive sector there have only
been isolated successes where agricultural production and productivity have
been increased manifold.
However in providing services like health and education, success stories
have been relatively less in number. Of course outreach of health services as
well as remedial coaching for laggard students has definitely improved and
the infrastructure for health and education has rapidly been upgraded. But
management of professionals and other staff to provide better quality
services requires further effort.

206
On the whole an encouraging feature is the fact that in most of the sectors
relating to poverty reduction there have been viable models evolved by
individual local governments. A major challenge would be to upscale and
replicate them. It is pertinent to note that funds spent on poverty reduction
program by local governments significantly exceeds earlier investments.
This is suggestive of the higher priority given to anti poverty programs by
local governments. The spread of this investment is also much wider and
generally more equitable.
Another significant area relating to poverty reduction where the local
governments have performed well is the implementation of social security
schemes like pensions. The coverage has improved and the targeting has
been fairly satisfactory.
The good governance aspect of decentralization particularly transparency as
well as the opportunities for participation have improved the quality of anti
poverty programs formulated and implemented by local governments. There
is considerably less leakage and definitely the identification of beneficiaries
is better.
What holds the biggest promise for poverty reduction is the attempt to
develop a network of self help groups of families below the poverty line (BPL),
each represented by a woman. Essentially, it is based on a community based
identification of BPL families on non monetary indicators which are
transparent and which are reflective of social perceptions of poverty.
Identified families are organized into Neighborhood Groups (NHGs) of 20 -
25 members who are federated into an organization called Area
Development Society (ADS) at the Panchayat Ward/Grama Sabha level and
further networked into a registered NGO of poor women called the
Community Development Society (CDS) at the level of the Village Panchayat.
This experiment which has been tried out in the most backward district of
Malappuram has now been expanded to cover one-third of the Village
Panchayats in the State. [Incidentally this system of poverty reduction has
been awarded the Gold Medal by the Commonwealth Association of Public
Management (CAPAM) from among international best practices in Public
Management for the year 2000].
207
Bibliography
Ahluwalia, Isher Judge and Little, I.M.D. (1998) 'India's Economic Reforms and
Development' Essays for Manmohan Singh. (Ed) Oxford University Press.
Ahluwalia, Montek S. (1998) 'Infrastructure Development in India's Reforms'. In
Ahluwalia and Little (Ed) 1998.
__________(2000) 'Economic Performance of States in Post-Reforms Period'.
Economic & Political Weekly, May 6-12.
Asian Development Bank (2000) 'Asian Development Outlook' 2000.
__________(1999) 'Managing Government Expenditure'. (Salvatore Schiavo and
Daniel Tommasi).
Bajpai, N and Sachs, Jeffrey (2000) 'India's Decade of Development' Economic &
Political Weekly, April, 15-21.
Bandyopadhyay. D (2000) 'Constitution Eighty-Seventh Amendment Bill, 1999. A
Sinister Move'. Economic and Political Weekly, April, 29, 2000.
Bhaduri, Amit & Nayyar, Deepak (1996) 'The Intelligent Person's Guide to
Liberalization" Penguin Book India.
Byres, Terence J (1998) 'The Indian Economy'. Major Debates since Independence
(Ed), Oxford.
Campos Ed and Pradhan Sanjay (1996) 'The Impact of Budgetary Institutions on
Expenditure Outcomes'. World Bank.
Cassen, Robert & Joshi, Vijay (1995) India. 'The future of Economic Reforms'.
(Ed.), Oxford.
Chandra Bipan (1992) 'The Colonial Legacy' In Jalan Bimal, (Ed).
Chaudhuri, Saumitra (2000) 'State Government Finances'. Money and Finances,
ICRA Bulletin Vol. 2. No. 1, May-June 2000.
__________(2000b) 'Fiscal Management : An Alternate View of the Circumstances'.
Money and Finance, ICRA Bulletin July-Sept. 2000.
Chelliah, Raja J. (1996) 'Towards Sustainable Growth'. Essays in Fiscal and
Financial Sector Reforms in India. Oxford University Press.
________(1999) 'Economic Reforms Strategy for the Next Decade'. Economic and
Political Weekly, September 4-10.
Corry Dan (Ed.) (1994) 'Public Expenditure'. Effective Management and Control.
Institute for Public Policy Research (IPPR) London.
Dreze, Jean Sen, Amartya (1995) 'India : Economic Development and Social
Opportunity'. Oxford University Press.
__________(1997) 'Indian Development'. Selected Regional Perspectives. Oxford
University, Press.
Economic and Political Weekly (2000). 'Panchayati Raj. Old Fear Belied'. Editorial.
July 15.

208
Gangopadhyay, S and Wadhwa, W (2000) 'Economic Reforms for the Poor'. (Ed)
Rajiv Gandhi Institute for Contemporary Studies. Konark, New Delhi.
GOI (1999) 'Speech of Minister of Finance'. Presenting Central Government's
Budget for 1999-2000. Feb., 27.
GOI (2000) 'Speech of Minister of Finance'. Presenting Central Government's
Budget for 2000-2001. Feb., 29.
Government of India (GOI) (2000, June) 'Report of the Eleventh Finance
Commission' (EFC) (for 2000-2005).
International Monetary Fund (2000) 'World Economic Outlook, May 2000'.
Jalan, Bimal (Ed) (1992) 'The Indian Economy' Viking Penguin India.
__________(1996) 'India's Economic Policy' Viking Penguin India.
Japan Bank for International Cooperation (JBIC), (2000) 'Public Expenditure
Management and its Implication'. Research Institute for Development and
Finance (RIDF).
Jha, S.N. and Mathur, P.C. (2000) 'Decentralization and Local Politics'. SAGE.
Joseph, K.P. (2000) 'Budget Deficits Are Forever'. Economic & Political Weekly,
August 19-25.
Joshi, Vijay and Little, I.M.D. (1994) 'India. Macroeconomics and Political
Economy, 1964-1991'. Oxford Univ. Press.
__________(1996) 'India's Economic Reforms'. Oxford University Press.
Kaushik, P.D. (2000) 'Information Technology : Decentralization and the Rural
Poor in India'. In Gangopadhyay and Wadhwa (2000) Ed).
Kazuv, Takahashi (Ed) (1998) 'Asia's Development Experience', FASID, Tokyo.
__________(Ed) (1999) 'Agenda for International Development', FASIC,
International Development Research Institute (IDRI), Tokyo.
Kelkar, Vijay (1999) 'India's Emerging Economy Challenges'. Economic & Political
Weekly, August 14-21.
Lahiri, Ashok K. (2000) 'Sub-National Public Finance in India'. Economic &
Political Weekly April 29-May 5, 2000.
__________and Fardoust, Shahrokh (2000 Nov.) 'Indian States : The Road to
Reform' Paper presented in Indian States' Reform Forum, 2000, World
Bank, (www.stateforum.org)
Marjit, Sugata (1999). 'Decentralised Financing, Governance and Public-Private
Co-operation'. Economic & Political Weekly, May 15-21.
Mathur B.P. (Ed.) (1999) 'Budgetary Reforms and Expenditure Management in
Government'. National Institute of Financial Management, Faridabad,
India. Mudrit.
Mathur, K.B.L. (1995) 'Management of Indian Economy-Systems and Processes.'
OECF, New Delhi.
209
Mathur, O.P. (1999). 'Decentralization in India : A Report Card'. NIPFP, New
Delhi, March.
Ministry of Finance, GOI (2000) 'Economic Survey, 1999-2000.'
Mohan, Rakesh (2000) 'Fiscal Correction for Economic Growth-Data analysis and
Suggestions'. Economic & Political Weekly, June 10-16.
Moorthy, Vivek, Bhoupal Singh, Sarat Chandra Dhal (2000 June) 'Bond
Financing and Debt Stability : Theoretical Issues and Empirical analysis
for India'. Development Research Group Study No. 19, RBI, Mumbai.
Mundle, Sudipto (Ed). (1997) 'Public Finance Policy Issues for India'. Oxford Univ.
Press. New Delhi.
Nagaraj, R. (2000). 'Indian Economy since 1980. Virtuous Growth or
Polarisation?' Economic and Political Weekly. August 5-11.
National Institute of Public Finance and Policy (NIPFP). (1999) Reading Material
for Training Programme on 'Expenditure of Sub-national Governments :
Assessment, Management and Control' (September 13-24, 1999)
OECF (1999) 'Annual Report, 1999' OECF, Tokyo.
Oommen, M.A. (1995) 'Devolution of Resources from the State to the Panchayati
Raj Institutions'. Institute of Social Sciences, New Delhi. Occasional Paper
Series…..18.
__________(1999) 'Panchayati Raj Institutions, Eleventh Finance Commission and
Working Towards a New Fiscal Federalism'. Paper at the seminar on
Issues Before the Eleventh Finance Commission, organised by NIPFP,
New Delhi, 5-6 January 1999.
Parikh, Kirit S. (1999) 'Indian Development Report: 1999-2000.' (Ed) Oxford Press.
Patel, I.G. (1998) 'Economic Reform and Global Change' Macmillan.
Planning Commission, GOI (2000) 'Ninth Five Year Plan, 1997-2002'.
__________(2000b) 'Annual Plan 1999-2000'.
__________(2000 Oct.) 'Mid Term Appraisal of Ninth Five Year Plan (1997-2002)'.
Premchand A. (2000). 'Control of Public Money' : The Fiscal machinery in
developing countries. Oxford.
Purohit, Mahesh C. (2000 Nov.) 'Road Map for National and Sub-National VAT in
India'. Paper presented in Indian States' Reform Forum, 2000, World Bank,
(www.stateforum.org).
Rajiv Gandhi Foundation (2000) 'Panchayat Raj in India, Status Report 1999,'
Task Force on PR.
Rakshit, Mihir (2000) 'On correcting Fiscal Imbalances in the Indian Economy.
Some Perspectives'. ICRA Bulletin, July-September, 2000
Ramakrishna S. (1999) 'Expenditure Management and Control : Concepts of
Management and Control.' Presentation at the NIPFP Training

210
Programme on 'Expenditure of Subnational Governments : Assessment,
Management and Control.' (September 13-24, 1999).
Rangarajan C. (2000a). 'Perspectives on Indian Economy.' UBSPD
__________(2000b) 'State, Market and the Economy'. Economic and Political
Weekly, April 15, 2000.
Rani, P. Geetha (1999) 'State Finance Commissions and Rural Local Bodies.
Devolution of Resources.' Economic & Political Weekly, June 19-25.
Rao, M. Govinda and Nath, H.K. Amar (2000) 'Fiscal Correction : Illusion and
Reality' Economic & Political Weekly, August 5-11.
Rao, M. Govinda and Sen, Tapas K. (1996) 'Fiscal Federalism in India. Theory
and Practice.' Macmillan India.
Rao. S.L. (1996) 'Reforming State Enterprises.' (Ed) NCAER, New Delhi.
Ravallion, Martin (2000) 'What is Needed for a More Pro-Poor Growth Process in
India?' Economic & Political Weekly, March 25.
Reddy. Y.V. (1999a) 'Financial Sector Reform : Review and Prospects.' Key note
address at the Conference on 'Growth, Governance and Empowerment :
The Future of India's Economy', at University of California, Santra Cruz on
Nov. 20, 1998. Published in RBI Bulletin Jan, 1999.
__________(2000b) 'Monetary and Financial Sector Reforms in India. A Central
Banker's Perspectives,' UBSP
__________(2000c) 'Pro-Poor Growth : New Realities and Emerging Questions'.
Presentation made at a Seminar on 'The New Social Policy and Poverty
Agenda for Asia and the Pecific' by the ADB, Chiang Mai, Thailand on May
5, 2000. Published in RBI Bulletin. June.
__________(2000 Nov.) 'Fiscal Reforms at State Level : Review and Prospects'.
Paper presented in Indian States' Reform Forum, 2000, World Bank,
(www.stateforum.org).
__________(2000 Dec.) 'Indian Economy : 1950; 2000; 2020'. RBI Bulletin.
Reserve Bank of India (RBI) (1997) 'Occassional Papers,' Special Issue, Vol. 18
Nos. 2 & 3, June & Sept.
__________(1999a) 'Handbook of Statistics on Indian Economy'.
__________(1999b) 'Report on Currency and Finance 1998-99'.
__________(2000 Jan.) 'State Finances, A Study of Budgets of 1999-2000'.
__________(2000 Aug.) 'Annual Report 1999-2000'.
__________(2000 Dec.) 'State Finances, A Study of Budgets of 2000-2001'.
Sakakibara, Eisuke (2000) 'Asia in the 21st Centuary. The Role of India and
Japan.' Exim Bank Commencement Day Annual Lecture 2000, on 29th
March, 2000 at Mumbai. India.
Shariff, Abusaleh (1999) 'India : Human Development Report,' NCAER
Srinivasan, T.N. (2000) 'Eight Lectures on India's Economic Reforms.' Oxford.
211
Srivastava, D.K. (1999) 'Budget Processes and Expenditure Management in
India.' Paper in the Training Material. See NIPFP (1999).
Thorat, Usha and Pattnaik, R.K. (1999) 'An Analysis of Cashflow Management at
Sub-National levels: An India Experience'. Paper in the Training Material,
NIPFP (1999).
UNDP (2000a) 'Human Development Report 2000', Oxford University Press.
UNDP (2000b) 'Overcoming Human Poverty, Poverty Report 2000.'
UN (2000) 'India Common Country Assessment'. May UNDP, India.
Vijayanand, S.M. (2000) 'Decentralization -- The Kerala Experience'. Paper
presented in Indian States' Reform Forum, 2000, World Bank,
(www.stateforum.org).
World Bank (1997) 'World Development Report, 1997' Oxford University Press.
__________(1998) 'Public Expenditure Management Handbook'.
__________(1999) India. Towards Rural Development & Poverty Reduction'. June
24, Report No. 18921-IN
__________(2000 Jan.) 'India : Policies to Reduce Poverty and accelerate
sustainable Development.' January 31, Report No. 19471-IN.
__________(2000) 'World Development Report 1999/2000.'
__________(2000, March) 'India - Country Framework Report for Private
Participation in Infrastructure'.
__________(2001) 'World Development Report 2000/2001.'

JAPAN BANK FOR INTERNATIONAL COOPERATION (JBIC)
http://www.jbic.go.jp/
4-1, Ohtemachi 1-Chome Chiyoda-ku, Tokyo 100-8144, Japan
Telephone +81-3-5218-9720 (Research Institute for Development and Finance)
Facsimile +81-3-5218-9846
Osaka Branch
13th Fl., Aqua Dojima East 4-4, Dojimahama 1-Chome Kita-ku, Osaka 530-0004, Japan
Telephone +81-6-6346-4770 Facsimile +81-6-6346-4779
Overseas Network
Representative Office in Beijing3131, 31st Fl., China World Trade Center,No.1 Jian Guo Men Wai Ave., Beijing100004,The People's Republic of ChinaTel. 86-10-6505-8989, 3825~8, 1196, 1197Fax.86-10-6505-3829,1198
Hong Kong OfficeSuite 3706, Level37, One Pacific Place,88 Queensway, Hong KongTel. 852-2869-8505~7Fax.852-2869-8712
Representative Office in Bangkok14th Fl., Nantawan Building,161 Rajdamri Road,Bangkok 10330, ThailandTel. 66-2-252-5050Fax.66-2-252-5514,5515
Representative Office in Hanoi4th Fl., 63 Ly Thai To Street,Hanoi, Viet NamTel. 84-4-8248934~6Fax.84-4-8248937
Representative Office in JakartaSummitmas II 7th Fl.,Jalan Jenderal Sudirman, Kav. 61- 62,Jakarta Selatan, Jakarta, IndonesiaTel. 62-21-522-0693Fax.62-21-520-0975
Representative Office in Kuala Lumpur22nd Fl., UBN Tower, Letter Box No.59,Jalan P, Ramlee 50250,Kuala Lumpur, MalaysiaTel. 60-3-2323255,2322201,2322202Fax.60-3-2322115
Representative Office in Manila Office31st / Floor, Citibank Tower,Valero St. corner Villar St.,Makati, Metro Manila, PhilippinesTel. 63-2-848-1828, 752-5682Fax.63-2-848-1833~35
Representative Office in Singapore9 Raffles Place, #53-01 Republic Plaza,Singapore 048619Tel. 65-557-2806, 239-5701, 5702Fax. 65-557-2807
Representative Office in ColomboLevel 13, Development Holdings 42,Navam Mawatha, Colombo 2,Sri LankaTel. 94-1-300470, 300471, 300472Fax.94-1-300473
Representative Office in DhakaSonargaon Hotel (Room No.351~355),107 Kazi Nazrul Islam Ave.,Dhaka, BangladeshTel.880-2-811-1005, 2011 (Hotel) (Ext. 4351~5)
811-4081, 6700(Direct in)
Fax.880-2-811-3336(Direct in)
Representative Office in IslamabadHouse No. 62, Ataturk Avenue, G- 6/3,Islamabad, PakistanTel. 92-51-2820119Fax.92-51-2822546
Representative Office in New Delhi3rd Fl., DLF Center, Sansad Marg,New Delhi 110001, IndiaTel. 91-11-371-4362, 4363, 7090, 6200Fax.91-11-371-5066, 373-8389
Representative Office in SydneySuite 2501, Level 25, Gateway1 Macquarie Place, Sydney,N.S.W. 2000, AustraliaTel. 61-2-9241-1388Fax.61-2-9231-1053
Representative Office in Moscow123610 Moscow,Krasnopresnenskaya Nab.12,World Trade Center, Office No. 905,Russian FederationTel. 7-095-258-1832, 1835, 1836Fax.7-095-258-1858

Representative Office in FrankfurtTaunustor 2, 60311 Frankfurt am Main,GermanyTel. 49-69-2385770Fax.49-69-23857710
Representative Office in London4th Fl., River Plate House,7- 11 Finsbury Circus, London,EC2M 7EX, U.K.Tel. 44-20-7638-0175Fax.44-20-7638-2401
Representative Office in Paris21, Boulevard de la Madeleine75038 Paris Cedex 01, FranceTel. 33-1-4703-6190Fax.33-1-4703-3236
Representative Office in CairoAbu El Feda Bldg., 16th Fl.,3 Abu El Feda Street, Zamalek,Cairo, EgyptTel. 20-2-738-3608~9Fax.20-2-738-3607
Representative Office in Nairobi6th Fl., International House,Mama Ngina Street, P.O. Box 49526,Nairobi, KenyaTel. 254-2-221420, 221637Fax.254-2-221569
Representative Office in Los Angeles601 South Figueroa Street, Suite 4590,Los Angeles, CA 90017, U.S.ATel. 1-213-627-3500Fax.1-213-627-3900
Representative Office in New York520 Madison Avenue, 40th Floor,New York, NY 10152, U.S.A.Tel. 1-212-888-9500, 9501, 9502Fax.1-212-888-9503
Representative Office in Washington,D.C.1909 K st., N.W., Suite 300,Washington, D.C. 20006, U.S.A.Tel. 1-202-785-5242Fax.1-202-785-8484
Representative Office in Buenos AiresAve. del Libertador No.498, Piso19, 1001Capital Federal Buenos Aires, ArgentinaTel. 54-11-4394-1379, 1803Fax.54-11-4394-1763
Representative Office in LimaAv.Central,Moreyra N°380Lima 27, PeruTel. 51-1-442-3301Fax.51-1-440-9657
Representative Office in Mexico CityPaseo de la Reforma 265 Piso-16,Col. Cuauhtemoc,Mexico, D.F. 06500, MexicoTel. 5525-67-90Fax.5525-34-73
Representative Office in Rio de JaneiroPraia de Botafogo, 228-801 B,Botafogo,Rio de Janeiro, RJ,CEP.22359-900, BrazilTel. 55-21-553-0817Fax.55-21-554-8798
Representative Office in BogotaCalle 100, 8A-55, Oficina 715,World Trade Center, Torre C,Santafé de Bogotá, D.C., ColombiaTel. 57-1-621 -1828, 1838, 1845, 1849, 1878, 1889Fax.57-1-610-7293
Toronto Liaison OfficeP. O.Box493,2 First Canadian Place, Suite3660,Toronto, Ontario, M5X 1E5, CanadaTel. 1-416-865-1700Fax.1-416-865-0124
JBIC Research Paper Series1
1. Issues of Sustainable Economic Growth from the Perspective of the Four East Asian Countries,
December 1999
2. Organizational Capacity of Executing Agencies in the Developing Countries: Case Studies on
Bangladesh, Thailand and Indonesia, December 1999
3. Urban Development and Housing Sector in Viet Nam, December 1999
4. Urban Public Transportation in Viet Nam: Improving Regulatory Framework, December 1999*
5. Current Situation of Rice Distribution System in Indonesia, December 19992
6. Energy Balance Simulations to 2010 for China and Japan, March 2000
7. Rural Enterprises Finance: A Case Study of the Bank for Agriculture and Agricultural
Cooperatives (BAAC) in Thailand, November 20003
8-1. Issues of Sustainable Development in Asian Countries: Focused on SMIs in Thailand, December
2000
8-2. Issues of Sustainable Development in Asian Countries: Focused on SMIs in Malaysia, December
2000
9. Policy Issues and Institutional Reform in Road Sector in Developing Countries, February 20014
10. Public Expenditure Management in Developing Countries, March 2001
11. INDIA: Fiscal Reforms and Public Expenditure Management, August 2001
Research Institute for Development and Finance,
Japan Bank for International Cooperation
4-1, Ohtemachi 1-chome, Chiyoda-ku, Tokyo 100-8144, JapanTel: 03-5218-9720, Fax: 03-5218-9846 (Planning and Coordination Division)Internet: http://www.jbic.go.jp/
1 Full texts can be downloaded from JBIC Website (www.jbic.go.jp/).2 In Japanese only. English summary can be downloaded from JBIC Website (www.jbic.go.jp/).3 In Japanese only4 In Japanese only

ISSN 1345-2339
4-1, Ohtemachi 1-chome, Chiyoda-ku, Tokyo 100-8144, JapanTel: 03-5218-9720 (Research Institute for Development and Finance)
Internet: http://www.jbic.go.jp/