india’s top residential investment opportunities · 19% rs 26 l rs 10 l ravet pune 20% rs 28 l rs...
TRANSCRIPT

India’s top residential
investment
opportunities Investment Advisory Report
November 2012
1
INVESTMENT DESTINATIONS - INDIA
Presented by:-
Gulam Zia
Executive Director, Advisory, Retail & Hospitality
2nd February 2013

2
20-YEARS PERFORMANCE OF VARIOUS
ASSET CLASSES
Current value of Rs.1 crore invested in 1992
* Prices exhibits South Mumbai property Real Estate
Silver
Gold
Sensex
USD
1.9 Cr
4 Cr
7 Cr
7.5 Cr
10 Cr

3

APPROACH FOR IDENTIFICATION OF THE TOP
RESIDENTIAL INVESTMENT DESTINATIONS
4
DESTINATION Connectivity to important locations
Proximity to office space Access to social infra Planned Development
Land availability Lifestyle shift
ZONE Employment: Occupied office space, industrial activity
Social & physical infrastructure: Analysis of development plan and extensive field survey
TOP 5 CITIES Business activities:
Banking penetration, hotel room demand, air passenger traffic Infrastructure development:
Current and proposed infrastructure spending
TOP 100 CITIES Top 100 cities based on population
INDIA Urban centres

MUMBAI
Ulwe
• Proximity to IT/ITeS hubs of Navi Mumbai
• Upcoming Trans Harbour Link & International airport
• Upcoming Seawood-Uran suburban rail network
• Prices to increase by 145% in the next five years from 4,000/sq.ft. to 9,800/sq.ft
Wadala
• Proximity to premium office markets
• Upcoming infrastructure projects like Monorail and Eastern Freeway
• Prices to increase by 133% in the next five years from 15,000/sq.ft. to 35,000/sq.ft
Chembur
• Proximity to premium office markets
• Upcoming infrastructure projects like Monorail, Eastern Freeway and Santacruz
Chembur link road
• Prices to increase by 125% in the next five years from 12,000/sq.ft. to 27,000/sq.ft
5

6
MUMBAI

DELHI-NCR
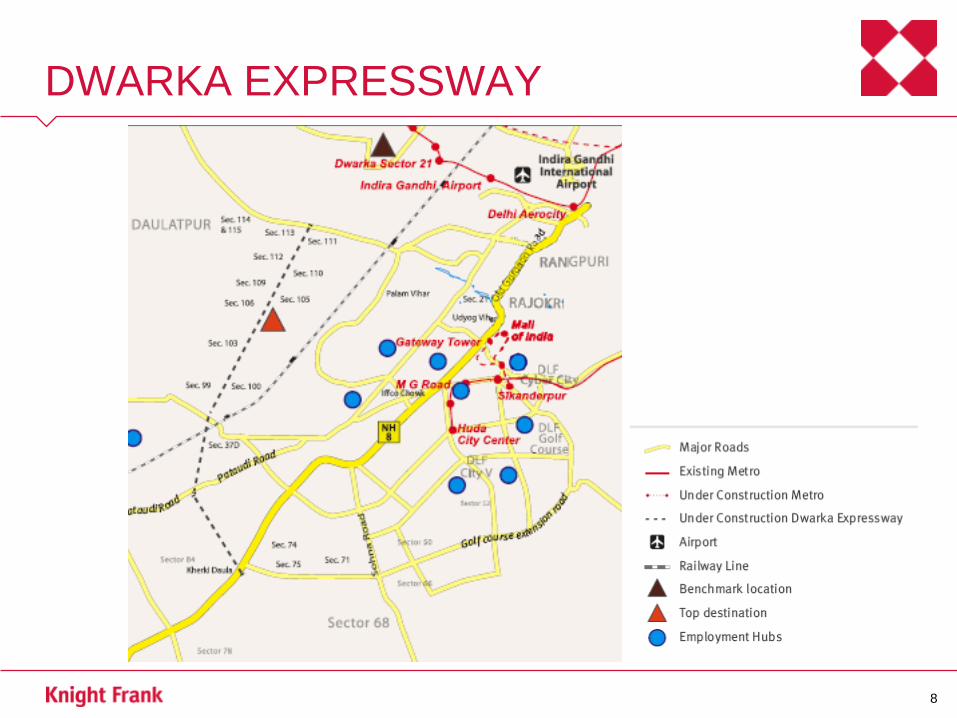
Dwarka Expressway
• Growth of IT/ITeS, BFSI & Consulting sectors
• Enhanced connectivity between Delhi & Gurgaon
• Upcoming diplomatic enclave
• Prices to increase by 108% in the next five years from 4,900/sq.ft. to 10,200/sq.ft
Noida Extension
• Growth of IT/ITeS, BFSI & Consulting sectors
• Enhanced connectivity between Delhi & Noida
• Existing sound infrastructure & affordable pricing
• Prices to increase by 111% in the next five years from 3,200/sq.ft. to 6,760/sq.ft
7
DWARKA EXPRESSWAY
8

9
NOIDA EXTENSION

CHENNAI
Medavakkam and Pallikarnai
• Growth of the IT/ITeS & Auto sector
• Proximity to employment hubs on OMR and GST Road
• Occupied office space on OMR & GST Road to increase by 64% from 29 mn sq.ft. in
2012 to 47.9 mn sq.ft in 2017
• Upcoming Monorail corridor
• Prices in Medavakkam to increase by 103% in the next five years from 3,800/sq.ft. to
7,700/sq.ft
• Prices in Pallikarnai to increase by 93% in the next five years from 4,200/sq.ft. to
8,100/sq.ft
10

CHENNAI
11

PUNE
Hinjewadi, Tathawade, Ravet and Wakad
• Growth of the IT/ITeS sector
• Strategic location on the Mumbai-Pune Bypass Road
• Proximity to employment hubs of West Pune (Hinjewadi IT Park)
• Occupied office space in West Pune to increase by 81% from 22 mn sq.ft. in 2012 to
39.5 mn sq.ft in 2017
• Prices in Hinjewadi to increase by 100% in the next five years from 4,000/sq.ft. to
8,000/sq.ft
• Prices in Tathawade to increase by 98% in the next five years from 4,300/sq.ft. to
8,500/sq.ft
• Prices in Ravet to increase by 97% in the next five years from 3,950/sq.ft. to 7,800/sq.ft
• Prices in Wakad to increase by 91% in the next five years from 4,500/sq.ft. to 8,600/sq.ft
12

13
PUNE

BENGALURU
Hebbal
• Growth of the IT/ITeS & Bio-technology sector
• Benefits of IT investment Region in North Bengaluru
• Upcoming Monorail and widening of existing roads
• Occupied office space in North Bengaluru to increase by 80% from 7.5 mn sq.ft. in 2012
to 13.5 mn sq.ft in 2017
• Prices in Hebbal to increase by 94% in the next five years from 4,250/sq.ft. to 8,230/sq.ft
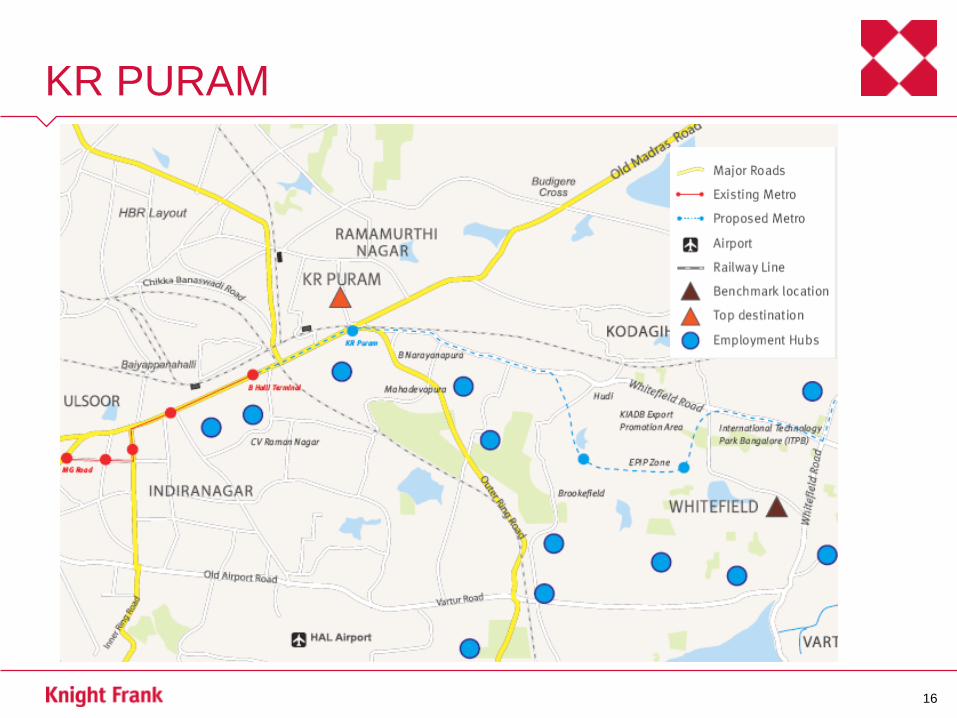
KR Puram
• Growth of the IT/ITeS & Bio-technology sector
• Lifestyle shift
• Upcoming metro connectivity
• Prices in KR Puram to increase by 91% in the next five years from 3,245/sq.ft to
6,200/sq.ft
14

15
HEBBAL
KR PURAM
16

INVESTMENT OPTIONS:
BUDGET OF UP TO RS 25 LAKH
17
Noida Extension Delhi - NCR
Destination City Min. ticket
size Investor
contribution Investor returns
23% Rs15 L Rs 6 L
Ulwe Mumbai 29% Rs15 L Rs 6L
Meddvakam Chennai 21% Rs 21 L Rs 8L
Hinjewadi Pune 21% Rs 23 L Rs 9L
Pallikarni Chennai 19% Rs 24L Rs 10L
Tathawade Pune 20% Rs 25 L Rs 10L
* Investor Returns based on Loan to Value ratio of 60%, mortgage rate of 10.5% and loan tenure of 20 yrs.

INVESTMENT OPTIONS:
BUDGET BETWEEN RS 25 TO 50 LAKH
18
Wakad Pune
Destination City Min. ticket
size Investor
contribution Investor returns
19% Rs 26 L Rs 10 L
Ravet Pune 20% Rs 28 L Rs 11L
K R Puram Bengaluru 19% Rs 31 L Rs 12L
Hebbal Bengaluru 19% Rs 36L Rs 14L
Dwarka Exp. Delhi-NCR 22% Rs 47L Rs 19L
* Investor Returns based on Loan to Value ratio of 60%, mortgage rate of 10.5% and loan tenure of 20 yrs.

INVESTMENT OPTIONS:
BUDGET OF RS 50 LAKH AND ABOVE
19
Chembur Mumbai
Destination City Min. ticket
size Investor
contribution Investor returns
26% Rs 54L Rs 22L
Wadala Mumbai 27% Rs 183 L Rs 73L
* Investor Returns based on Loan to Value ratio of 60%, mortgage rate of 10.5% and loan tenure of 20 yrs.

20
Rank Destination City2012 Average
Price (Rs./sq.ft.)
2017 Forecasted
Price (Rs./sq.ft.)
Price
Appreciation
Prices to double
In (Years)
1 Ulwe Mumbai 4,000 9,800 145% 3.4
2 Wadala Mumbai 15,000 35,000 133% 3.8
3 Chembur Mumbai 12,000 27,000 125% 4.0
4 Noida Extension Delhi-NCR 3,200 6,760 111% 4.5
5 Dwarka Expressway Delhi-NCR 4,900 10,200 108% 4.6
6 Medavakkam Chennai 3,800 7,700 103% 4.9
7 Hinjewadi Pune 4,000 8,000 100% 5.0
8 Tathawade Pune 4,300 8,500 98% 5.1
9 Ravet Pune 3,950 7,800 97% 5.1
10 Hebbal Bengaluru 4,250 8,230 94% 5.3
11 Pallikarnai Chennai 4,200 8,100 93% 5.4
12 Wakad Pune 4,500 8,600 91% 5.5
13 KR Puram Bengaluru 3,245 6,200 91% 5.5
TOP DESTINATIONS

Thank You