india equity research| consumer goodsbreport.myiris.com/es1/hinlever_20110919.pdf · ·...
TRANSCRIPT

Edelweiss Research is also available on www.edelresearch.com, Bloomberg EDEL <GO>, Thomson First Call, Reuters and Factset. Edelweiss Securities Limited
Our positive stance on Hindustan Unilever (HUL) is reinforced post our meeting with the company’s management as it creates new growth drivers based on the innovation plank (ranked 6th among World’s most innovative companies by Forbes). Finer focus on high‐margin categories (personal products and foods), premiumisation, soft ad spending, higher growth in modern trade and increased pricing power will render higher margin. It is one of our top picks in consumer space. We maintain ‘BUY’. Sowing seeds for future growth: Focusing on PP, food HUL is aggressively investing in categories that will pay dividends from a three-five year perspective. Premium skin lightening, anti ageing creams, male grooming products and hair conditioners are key examples. HUL is committed to building a stronger food portfolio as reflected in recent launches of Knorr ready–to-cook foods, Bru (Exotica and Lite) and Lipton iced tea and hiring of Ms. Geetu Verma (PepsiCo ED).
Cautious price hikes, effective ad spending to boost margin The calibrated price hikes, peaking raw material costs and cut in ad rates on TV channels are likely to ease margin pressure. Also, with Hindi GECs now a four-player race, we expect higher bargaining power for HUL. HUL is resorting to youth-focused means of communication like Facebook and mobile marketing.
Modern trade exposure aids margin and volumes Greater exposure to modern trade (8-10%) leads to positive working capital, but renders higher margin due to superior sales mix. HUL holds a positive view on FDI entry in multi brand retail and GST implementation.
Outlook and valuations: Positive; maintain ‘BUY’ HUL has outperformed the Sensex ~45%, vindicating our report, Go Contra; Turnaround signals getting louder, dated May 26, 2010. At CMP, the stock is trading at 30.8x and 25.9x FY12E and FY13E, respectively. We maintain ‘BUY/SO’ on the stock.
VISIT NOTE
HINDUSTAN UNILEVERDriving innovation for a brighter future
EDELWEISS 4D RATINGS
Absolute Rating BUY
Rating Relative to Sector Outperformer
Risk Rating Relative to Sector Low
Sector Relative to Market Equalweight
MARKET DATA (R: HLL.BO, B: HUVR IN)
CMP : INR 338
Target Price : INR 360
52-week range (INR) : 355 / 264
Share in issue (mn) : 2,160.9
M cap (INR bn/USD mn) : 730 / 15,294
Avg. Daily Vol.BSE/NSE(‘000) : 2,528.8
SHARE HOLDING PATTERN (%)
* Promoters pledged shares (% of share in issue)
: NIL
PRICE PERFORMANCE (%)
Stock Nifty
EW Consumer Goods Index
1 month 9.3 1.0 0.8
3 months 6.7 (5.8) 1.6
12 months 24.5 (12.8) 14.9
Abneesh Roy +91 22 6620 3141 [email protected] Harsh Mehta +91 22 4063 5543 [email protected]
India Equity Research| Consumer Goods
September 19, 2011
Promoters*52.5%
MFs, FIs & Banks11.8%
FIIs18.4%
Others17.3%
FinancialsYear to March FY10 FY11 FY12E FY13ERevenues (INR mn) 177,643 196,910 222,602 252,021Rev. growth (%) (13.3) 10.8 13.0 13.2EBITDA (INR mn) 25,759 23,771 28,661 33,521Net profit (INR mn) 21,566 22,961 24,136 28,135Shares outstanding (mn) 2,180 2,180 2,160 2,160Diluted EPS (INR) 9.7 9.8 11.0 13.0EPS growth (%) (15.6) 1.7 11.6 18.8Diluted P/E (x) 35.0 34.4 30.8 25.9EV/EBITDA (x) 27.8 30.2 24.6 20.7ROAE (%) 87.6 79.8 77.2 73.8

Consumerr Goods
2
Key
Sow
In tetomcatetechbranappCom Tab
HULpersandportand Fig
High
The volupersbusion Pepmancate
y manageme
wing seeds of fu
erms of new lamorrow’; focusiegories which hnology-driven nd equity. Theropriately as i
mpanies’ by For
ble 1: HUL – Wo
L is aggressivelyspective. Prem hair conditiontfolio as reflect Lipton iced tea
1: Recent laun
her focus on pe
soaps & deteumes in single sonal productsinesses and stathe foods catesiCo's executiv
nagement and egory.
Rank Com1 Sales2 Ama3 Intut4 Tenc5 Appl6 Hind
ent meet ta
uture growth
aunches, HUL isng both on nmake busines
innovative proe company’s is evident frombes, scoring an
orld’s 6th most
y investing in caium skin lighteners are key eed in recent lau
a.
nches aiding gr
ersonal care an
rgents industrydigit (HUL’s am
s will be in thnd to make a h
egory HUL hireve director and
will lead its
mpanysforce.com
azon.comtive Surgicalcent Holdingsle
dustan Unilever
keaways
s planning to foniche and masss sense fromducts which wiinnovation strm it being ran
innovation pre
t innovative co
ategories that wning creams, a
examples. HUL unches of Knorr
rowth
d foods catego
y is expected tmbition is to behe limelight ofhigher revenue ed MS. Geetu
vice-presidentfoods division
Edelw
ocus on strategss market pro
m long-term pell differentiate ategy is beingnked 6th amonemium of 47.7 p
ompany
will be growth dnti ageing creais committed
r ready–to-cook
ories
to have a long e in line / aheaf HUL’s focus contribution. AVerma, bever
t, for innovatio to stir mome
weiss Securities Lim
gy of ‘Winning tducts. It planserspective. It it from competg recognized ang ‘World’s Mopoints.
drivers from a tams, male groo
to building a k foods, Bru (Ex
So
term annual gad of the markas these are
As part of its agrage and snackn. She will be entum in inno
Innova
mited
today, winning s to focus on is betting on
titors and build and rewarded ost Innovative
Source: Forbes
three-five year oming products
stronger food xotica and Lite)
ource: Company
growth rate in et). Foods and higher margin
ggressive stress ks foods giant part of its top
ovation in this
tion premium75.158.957.652.348.247.7

Cha
B
art 1: Shifting f
Personal Products
27%
Beverages11%
PackaFoo
6%
Personal Products
36%
Beverages9%
PackFo
2
focus to margi
aged ods%
Exports6%
Q1FY10 rev
kaged oods2%
Q1FY10 ‐ EB
3
n lucrative cat
•
Fig 2
venues
Exports3%
BIT contributio
tegories ‐ pers
Personal carevolume growtpremium skin ageing produccare posted dcare as a catbrand-conscio
2: Personal care
Soaps and Detergent
s50%
Soaps and Detergent
s50%
on
onal care prod
: HUL earns ~5th. The compan
lightening creacts and Vaselin
double digit groegory is differe
ous and thus thr
e product port
B
ducts and food
58% of its profitny offers a variam, hand and bne lip care wheowth in Q1FY12ent from soapreat from local
tfolio
Personal Products
30%
Beverages11%
PackFo
7
PersonaProduct
54%
Beverages10%
PackaFood
2%
Q1FY1
H
Edelw
ds
Source
t from personaiety of productbody creams, mre it envisages2 in both Closes & detergentsplayers is lowe
kaged ods
7%
Exports5%
Q1FY12 re
al s
ged ds
%
12 ‐ EBIT contr
Hindustan U
weiss Securities Lim
e: Company, Ede
al products assits in the skin camale grooming s huge growth e‐up and Pepsos since consumr in this segmen
s
evenues
SD
Exports3%
ibution
Unilever
mited
elweiss research
sted by strongare segment—products, anti-potential. Oral odent. Personal mers are more nt.
Soaps and Detergent
s47%
Soaps and Detergent
s31%
s

Consumer Goods
4 Edelweiss Securities Limited
Source: Company
To ensure retention and to fuel growth, HUL re-launched its anti-dandruff offering Clear with a high-voltage advertising campaign. It has become the market leader in the conditioner segment (growing at 30-40%). The company has also deployed a full portfolio in facial cleansing market to tap the growth potential (growing at 40% plus).
Chart 2: 19.4% Y‐o‐Y growth in sales Chart 3: Margins expand 53bps Y‐o‐Y
Source: Company, Edelweiss research
• Foods: Unilever owns a strong global portfolio in foods and is committed to build large
foods business in India. Recent food launches- Knorr ready–to-cook foods, Bru (Exotica and Lite) and Lipton iced tea, look promising. We expect more launches in the next two-three years. Having established ground in the noodles category with Soupy noodles, which was launched nationally a year ago (met company’s expected performance level), HUL may look into exploring this category further with mainline products at an appropriate time. Other soft launched products ‘Soya juice’ (launched only in Delhi, Mumbai and Chennai) and ‘Kissan creamy spread’ (mayo-based bread spread launched in 20 cities) are in initial phases of launch.
Fig 3: Foods product portfolio
Source: Company
(5.0)
2.0
9.0
16.0
23.0
30.0
Jun-
08
Sep-
08
Dec
-08
Mar
-09
Jun-
09
Sep-
09
Dec
-09
Mar
-10
Jun-
10
Sep-
10
Dec
-10
Mar
-11
Jun-
11
(PP
sale
s gro
wth
%)
0.0
8.0
16.0
24.0
32.0
40.0
Jun-
08
Sep-
08
Dec
-08
Mar
-09
Jun-
09
Sep-
09
Dec
-09
Mar
-10
Jun-
10
Sep-
10
Dec
-10
Mar
-11
Jun-
11
(PP
mar
gins
%)

Hindustan Unilever
5 Edelweiss Securities Limited
The company is bullish on the ready-to-cook category (not to be confused with ready-to-eat which will be a niche segment in India) from a three-five year perspective. It is enthusiastic about the savoury segment (soups, RTC and snacks) in particular where it has a stronghold on the global front. HUL manufactures breads in six cities and believes the segment has good scalability potential though margin expansion is restricted. Distribution network in breads also aids in sale of other food categories.
Chart 4: 17.3% Y‐o‐Y growth in sales Chart 5: Margins revive
Source: Company, Edelweiss research
• Beverages: HUL’s performance in the premium segment of coffee (two player market)
has been good with Bru Exotica (the company plans to offer new international flavours), Bru Cappuccino and newly launched Bru Lite specially targeted towards mild coffee drinkers of North India. The company is currently not present in 100% coffee category. Lipton iced tea launched this summer has also performed well. HUL plans to develop flavours in the tea segment to differentiate itself and beat competition in this category.
Chart 6: Upward trend in sales growth Chart 7: Robust margins
Source: Company, Edelweiss research
(5.0)
3.0
11.0
19.0
27.0
35.0
Jun-
08
Sep-
08
Dec
-08
Mar
-09
Jun-
09
Sep-
09
Dec
-09
Mar
-10
Jun-
10
Sep-
10
Dec
-10
Mar
-11
Jun-
11
(Pac
kage
d Fo
od sa
les g
row
th %
)
(5.0)
2.0
9.0
16.0
23.0
30.0
Jun-
08
Sep-
08
Dec
-08
Mar
-09
Jun-
09
Sep-
09
Dec
-09
Mar
-10
Jun-
10
Sep-
10
Dec
-10
Mar
-11
Jun-
11
(Bev
erag
es sa
les g
row
th %
)
(5.0)
(3.0)
(1.0)
1.0
3.0
5.0
Jun-
08
Sep-
08
Dec
-08
Mar
-09
Jun-
09
Sep-
09
Dec
-09
Mar
-10
Jun-
10
Sep-
10
Dec
-10
Mar
-11
Jun-
11
(PPa
ckag
ed F
ood
mar
gins
%)
0.0
4.0
8.0
12.0
16.0
20.0
Jun-
08
Sep-
08
Dec
-08
Mar
-09
Jun-
09
Sep-
09
Dec
-09
Mar
-10
Jun-
10
Sep-
10
Dec
-10
Mar
-11
Jun-
11
(Bev
erag
es m
argi
ns %
)

Consumer Goods
6 Edelweiss Securities Limited
• Soaps & detergents: Q1FY12 sales grew 13% Y-o-Y in soaps & detergents aided by low single digit volume growth. In Q1FY12, margin dipped 175bps Y-o-Y to 9.2%; however, it improved 171bps Q-o-Q. The company expects margin in this segment to improve with time and reach sustainable levels unlike the biscuits category wherein margins have stagnated at around 5-7%.
Fig 4: Soaps and detergents product portfolio
Source: Company
Chart 8: Gross margins seem to have bottomed out
Source: Company, Edelweiss research
This is because the competitive intensity in both the categories is diverse—biscuits’ has 500 plus players and soaps & detergents seem to have higher brand loyalty. Also, local players in the detergents segment, except Ghari, have been losing market share in the past two years and the industry is increasingly experiencing consolidation.
39.0
41.6
44.2
46.8
49.4
52.0 Q
1CY0
7
Q2C
Y07
Q3C
Y07
Q4C
Y07
Q1F
Y09
Q2F
Y09
Q3F
Y09
Q4F
Y09
Q5F
Y09
Q1F
Y10
Q2F
Y10
Q3F
Y10
Q4F
Y10
Q1F
Y11
Q2F
Y11
Q3F
Y11
Q4F
Y11
Q1F
Y12
(%)

Hindustan Unilever
7 Edelweiss Securities Limited
Chart 9: 13% Y‐o‐Y growth led by 8% volume spurt Chart 10: Margin likely to have hit bottom
Source: Company, Edelweiss research
• Ice‐creams: This segment, which contributes ~1.5% to total sales, is highly capital
intensive in terms of manufacture and distribution, but is showing good traction with new launches like Choco disc and Swirl parlours gaining success.
• Water: Puriet has achieved decent scale and size. HUL has shifted from home-to-home sale (which has worked well as an initiation strategy) to retail sales to achieve scalability and cost efficiencies. The company has no plan to enter bottled water segment in the near future.
• Services: The company operates through eight self owned Bru cafes, ~150 Swirl parlours (of which eight are self owned) and 150 plus Lakme Salons with a primary view to be a profitable business on its own. These operations aid in boosting brand equity.
Fig 5: Lakme salon, Swirl parlour, BRU world cafe
Source: Company
Cautious price hikes; effective ad spends: Price hikes effected in commodity-sensitive categories (soaps & detergents) in the past two quarters have not been commensurate with the price surge in commodities due to which margins have taken a hit. These hikes are a function of detailed thought, brand strength and pack sizes due to which volumes have not been impacted.
(5.0)
2.0
9.0
16.0
23.0
30.0
Jun-
08
Sep-
08
Dec
-08
Mar
-09
Jun-
09
Sep-
09
Dec
-09
Mar
-10
Jun-
10
Sep-
10
Dec
-10
Mar
-11
Jun-
11
(S&
D sa
les g
row
th %
)
0.0
4.0
8.0
12.0
16.0
20.0
Jun-
08
Sep-
08
Dec
-08
Mar
-09
Jun-
09
Sep-
09
Dec
-09
Mar
-10
Jun-
10
Sep-
10
Dec
-10
Mar
-11
Jun-
11
(S&
D m
argi
ns %
)
Consumer Goods
8 Edelweiss Securities Limited
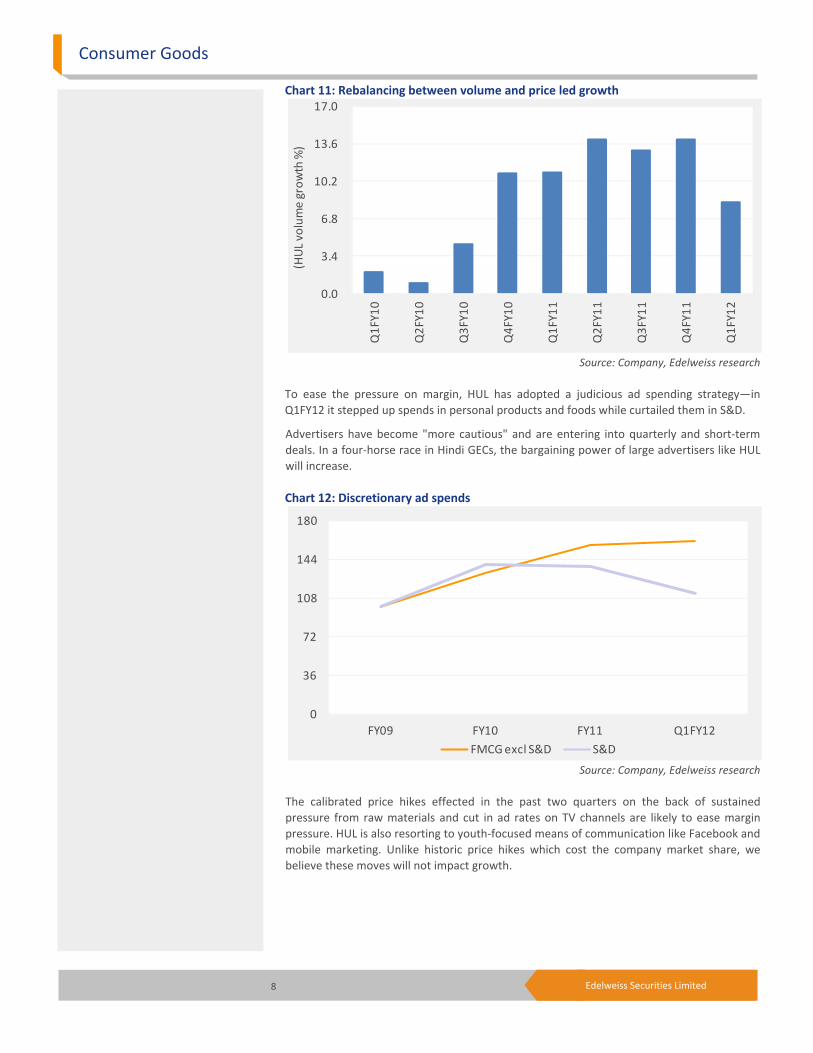
Chart 11: Rebalancing between volume and price led growth
Source: Company, Edelweiss research
To ease the pressure on margin, HUL has adopted a judicious ad spending strategy—in Q1FY12 it stepped up spends in personal products and foods while curtailed them in S&D.
Advertisers have become "more cautious" and are entering into quarterly and short-term deals. In a four-horse race in Hindi GECs, the bargaining power of large advertisers like HUL will increase. Chart 12: Discretionary ad spends
Source: Company, Edelweiss research
The calibrated price hikes effected in the past two quarters on the back of sustained pressure from raw materials and cut in ad rates on TV channels are likely to ease margin pressure. HUL is also resorting to youth-focused means of communication like Facebook and mobile marketing. Unlike historic price hikes which cost the company market share, we believe these moves will not impact growth.
0.0
3.4
6.8
10.2
13.6
17.0
Q1F
Y10
Q2F
Y10
Q3F
Y10
Q4F
Y10
Q1F
Y11
Q2F
Y11
Q3F
Y11
Q4F
Y11
Q1F
Y12
(HU
L vo
lum
e gr
owth
%)
0
36
72
108
144
180
FY09 FY10 FY11 Q1FY12
FMCG excl S&D S&D

Hindustan Unilever
9 Edelweiss Securities Limited
Modern trade exposure aids margin and volumes: HUL has 8-10% exposure to modern trade outlets. Sales to modern trade requires the company to work on positive working capital, but renders better margins on account of richer sales mix compared to Kirana trade. On the same lines, the company plans to co-develop and co-brand a line of bakery products with the Future Group at select Big Bazaar stores. The company stands to gain from FDI in multi-brand retail (which according to current media reports seems to have been put on the back burner) as modern trade will drive premiumisation and margin growth. FDI entry will accelerate category building and development which will differentiate technology-driven companies like HUL from the crowd. This, coupled with GST, will work well for HUL as it will provide a level playing field for all. Strong R&D center: Around 300 employees work in Bengaluru and this site specialises in areas of microbiology, virology and microstructure creation. Focusing on foods and beverages for South East Asia, the centre contributes to brands including Lifebuoy, Pureit, Ponds, Fair and Lovely, Radiant, Omo, Brooke Bond, Lipton, Walls and Knorr. Unilever's recent initiative in water purification was driven predominantly out of this laboratory. Fig 6: HUL’s R&D centers
Source: Company

Consumer Goods
10 Edelweiss Securities Limited
Outlook and valuations: Positive; maintain ‘BUY’ HUL has outperformed the Sensex ~45%, vindicating our report, Go Contra: Turnaround signals getting louder, dated May 26, 2010. We remain positive on the stock reflected in impressive volume growth, positive surprise in earnings and successful new launches. At CMP, the stock is trading at 30.8x and 25.9x FY12E and FY13E, respectively. We reiterate ‘BUY/Sector Outperformer’ recommendation/rating. Chart 13: 1 year PE band chart
Source: Company, Edelweiss research
80
140
200
260
320
380
440
Sep-0
5
Mar-
06
Sep-0
6
Mar-
07
Sep-0
7
Mar-
08
Sep-0
8
Mar-
09
Sep-0
9
Mar-
10
Sep-1
0
Mar-
11
Sep-1
1
(x)
18x
22x
26x
30x
34xLaunched three new products in foods
Calibrated price hikes coupled with softening in ad spends
Five consecutive quarters of double digit volume growth

Hindustan Unilever
11 Edelweiss Securities Limited
Company Description HUL, the largest FMCG Company in India, was formed by merging three subsidiaries of Unilever in 1956. At present, Unilever Plc holds a 52% stake in the company. HUL’s portfolio of products covers a wide spectrum including soaps, detergents, skin creams, shampoos, toothpastes, tea, coffee, packaged foods and branded atta. Powerful brands and an envious distribution network are HUL’s primary strengths. The company operates through segments—soaps & detergents, personal products, beverages, foods,—exports, and other operations. Investment Theme HUL is a play on consumption growth in India. The company has displayed its ability to effect price hikes and avoid impact of inflation in vegetable oils, which, combined with improved outlook for fabric wash and strong growth in processed foods and beverages, boosts our positive outlook on the stock. The recent moves by the company to dispose of its non core assets including few properties give it a near term upside. We believe the price war in the detergent segment with rival P&G has ended and this is likely to add to the profitability from the segment going forward. Key Risks A rise in crude oil prices can result in biodiesel demand resurfacing, which in turn could lead to increase in vegetable oil price inflation; in turn deteriorating the company’s operating margins. The price war in HUL’s popular segments with new entrants entering the fray could hit the company hard. Further risks arise from down trending by consumers in response to recent price hikes, which could hurt the company’s top line.

12 Edelweiss Securities Limited
Consumer Goods
Financial Statements
Income statement (INR mn) Year to March FY09 FY10 FY11 FY12E FY13ENet revenue 205,011 177,643 196,910 222,602 252,021Materials costs 109,660 90,115 102,386 115,585 129,663 Gross profit 95,351 87,528 94,524 107,016 122,358 Employee costs 11,890 9,709 10,102 11,798 13,861 Other Expenses 35,114 27,829 32,687 36,173 40,953 Advertisement & sales costs 21,538 24,230 27,965 30,385 34,023 EBITDA 26,810 25,759 23,771 28,661 33,521 Depreciation & Amortization 2,000 1,919 2,293 2,366 2,627 EBIT 24,810 23,840 21,478 26,295 30,894 Other income 5,801 3,440 5,893 4,464 5,647 EBIT incl. other income 30,611 27,279 27,371 30,758 36,541 Interest expenses 265 75 10 1 1 Profit before tax 30,346 27,205 27,361 30,757 36,539 Provision for tax 5,392 6,153 5,919 7,074 8,404 Core profit 24,954 21,052 21,442 23,683 28,135 Prior period adjustments (net) 145 594 1,624 453 - Minority interest (54) (80) (106) - - Profit after minority interest 25,045 21,566 22,961 24,136 28,135 Basic shares outstanding (mn) 2,180 2,180 2,180 2,160 2,160 Basic EPS (INR) 11.4 9.7 9.8 11.0 13.0 Diluted equity shares (mn) 2,180 2,180 2,183 2,160 2,160 Diluted EPS (INR) 11.4 9.7 9.8 11.0 13.0 CEPS (INR) 12.4 10.5 10.9 12.1 14.2 Dividend per share (INR) 7.5 6.5 6.5 6.9 8.0 Dividend payout (%) 65.3 65.7 61.4 61.4 61.4
Common size metrics ‐ as % of net revenues Year to March FY09 FY10 FY11 FY12E FY13EMaterials costs 53.5 50.7 52.0 51.9 51.4Employee expenses 5.8 5.5 5.1 5.3 5.5 Advertising & sales costs 10.5 13.6 14.2 13.7 13.5 Other expenses 17.1 15.7 16.6 16.3 16.3 Depreciation 1.0 1.1 1.2 1.1 1.0 Interest expenditure 0.1 - - - - EBITDA margins 13.1 14.5 12.1 12.9 13.3 EBIT margins 12.1 13.4 10.9 11.8 12.3 Net profit margins 12.2 11.9 10.9 10.6 11.2
Growth ratios (%) Year to March FY09 FY10 FY11 FY12E FY13ERevenues 48.0 (13.3) 10.8 13.0 13.2EBITDA 41.4 (3.9) (7.7) 20.6 17.0 PBT 40.9 (10.4) 0.6 12.4 18.8 Net profit 40.8 (15.6) 1.9 10.4 18.8 EPS 40.7 (15.6) 1.7 11.6 18.8

13 Edelweiss Securities Limited
Hindustan Unilever
Balance sheet (INR mn) As on 31st March FY09 FY10 FY11 FY12E FY13EEquity capital 2,180 2,182 2,160 2,160 2,160Reserves & surplus 19,195 24,508 24,934 31,810 39,825 Shareholders funds 21,453 26,794 27,239 34,115 42,130 Minority interest (BS) 78 105 146 146 146 Secured loans 1,563 105 - 25 25 Unsecured loans 2,778 4 27 1 1 Borrowings 4,341 108 27 27 27 Sources of funds 25,794 26,902 27,266 34,142 42,157Gross block 29,591 36,672 38,541 43,041 47,541Depreciation 13,012 14,529 16,307 18,673 21,300 Net block 16,580 22,144 22,235 24,369 26,242 Capital work in progress 4,779 2,800 2,997 2,997 2,997 Investments 2,876 12,244 11,885 11,885 11,885 Inventories 25,805 22,264 28,738 28,767 32,500 Sundry debtors 5,606 6,917 9,549 9,246 10,399 Cash and equivalents 18,641 20,124 17,873 25,760 35,257 Loans and advances 7,453 5,895 6,632 6,632 6,632 Total current assets 57,702 55,393 63,169 70,783 85,166 Sundry creditors and others 43,325 53,522 61,730 64,602 72,843 Provisions 15,349 14,638 13,359 13,359 13,359 Total current liabilities & provisions 58,674 68,160 75,089 77,962 86,202 Net current assets (972) (12,767) (11,920) (7,179) (1,037) Uses of funds 25,794 26,902 27,266 34,142 42,157Book value per share (INR) 9.8 12.3 12.5 15.8 19.5
Free cash flow (INR mn) Year to March FY09 FY10 FY11 FY12E FY13ENet profit 25,045 21,566 22,961 24,136 28,135Add : Non cash charge 2,173 1,480 785 1,914 2,628 Depreciation 2,000 1,919 2,293 2,366 2,627 Others 174 (440) (1,508) (452) 1 Gross cash flow 27,218 23,046 23,745 26,050 30,764 Less: Changes in WC (11,914) (12,428) 898 (3,146) (3,355) Operating cash flow 39,132 35,474 22,848 29,196 34,118 Less: Capex 2,901 7,081 1,869 4,500 4,500 Free cash flow 36,231 28,393 20,979 24,696 29,618
Cash flow metrics Year to March FY09 FY10 FY11 FY12E FY13EOperating cash flow 39,132 35,474 22,848 29,196 34,118Investing cash flow (5,777) (16,449) (1,509) (4,500) (4,500) Financing cash flow (15,056) (20,872) (16,512) (16,808) (20,122) Net cash flow 18,298 (1,847) 4,827 7,888 9,497 Capex (2,901) (7,081) (1,869) (4,500) (4,500) Dividends paid (19,133) (16,564) (16,420) (17,260) (20,120) Share issuance/(buyback) 2,180 2 (22) - -

14 Edelweiss Securities Limited
Consumer Goods
Profitability & efficiency ratios Year to March FY09 FY10 FY11 FY12E FY13EROAE (%) 140.1 87.6 79.8 77.2 73.8ROACE (%) 219.9 126.9 143.0 139.7 117.6 Inventory day 46 49 47 47 47 Debtors days 10 13 15 15 15 Payable days 89 116 121 122 122 Cash conversion cycle (days) (33) (54) (59) (59) (60) Current ratio 1.0 0.8 0.8 0.9 1.0 Debt/EBITDA 0.2 - - - - Debt/Equity 0.2 - - - - Adjusted debt/equity 0.2 - - - - Interest coverage 93.8 319.1 2,126.5 19,770.5 23,228.6
Operating ratios Year to March FY09 FY10 FY11 FY12E FY13ETotal asset turnover 10.1 6.7 7.3 7.2 6.6Fixed asset turnover 12.9 9.2 8.9 9.6 10.0 Equity turnover 11.6 7.4 7.3 7.3 6.6
Du pont analysis Year to March FY09 FY10 FY11 FY12E FY13ENP margin (%) 12.2 11.9 10.9 10.6 11.2Total assets turnover 10.1 6.7 7.3 7.2 6.6 Leverage multiplier 1.1 1.1 1.0 1.0 1.0 ROAE (%) 140.1 87.6 79.8 77.2 73.8
Valuation parameters Year to March FY09 FY10 FY11 FY12E FY13EDiluted EPS (INR) 11.4 9.7 9.8 11.0 13.0Y‐o‐Y growth (%) 40.0 (15.6) 1.7 11.6 18.8 CEPS (INR) 12.4 10.5 10.9 12.1 14.2 Diluted PE (x) 29.5 35.0 34.4 30.8 25.9 Price/BV (x) 34.3 27.5 27.0 21.4 17.3 EV/Sales (x) 3.5 4.0 3.7 3.2 2.8 EV/EBITDA (x) 26.9 27.8 30.2 24.6 20.7 Dividend yield (%) 2.2 1.9 1.9 2.0 2.4

15 Edelweiss Securities Limited
Company Absolute
reco
Relative
reco
Relative
risk
Company Absolute
reco
Relative
reco
Relative
Risk
Asian Paints BUY SP M Colgate HOLD SU M
Dabur BUY SO M Emami BUY SO H
Godrej Consumer BUY SO H Hindustan Unilever BUY SO L
ITC BUY SO L Marico BUY SP M
Nestle Ltd HOLD SU L United Spirits BUY SP H
RATING & INTERPRETATION
ABSOLUTE RATING
Ratings Expected absolute returns over 12 months
Buy More than 15%
Hold Between 15% and - 5%
Reduce Less than -5%
RELATIVE RETURNS RATING
Ratings Criteria
Sector Outperformer (SO) Stock return > 1.25 x Sector return
Sector Performer (SP) Stock return > 0.75 x Sector return
Stock return < 1.25 x Sector return
Sector Underperformer (SU) Stock return < 0.75 x Sector return
Sector return is market cap weighted average return for the coverage universe within the sector
RELATIVE RISK RATING
Ratings Criteria
Low (L) Bottom 1/3rd percentile in the sector
Medium (M) Middle 1/3rd percentile in the sector
High (H) Top 1/3rd percentile in the sector
Risk ratings are based on Edelweiss risk model
SECTOR RATING
Ratings Criteria
Overweight (OW) Sector return > 1.25 x Nifty return
Equalweight (EW) Sector return > 0.75 x Nifty return
Sector return < 1.25 x Nifty return
Underweight (UW) Sector return < 0.75 x Nifty return
16 Edelweiss Securities Limited
Consumer Goods
Edelweiss Securities Limited, Edelweiss House, off C.S.T. Road, Kalina, Mumbai – 400 098. Board: (91-22) 4009 4400, Email: [email protected]
Vikas Khemani Head Institutional Equities [email protected] +91 22 2286 4206
Nischal Maheshwari Head Research [email protected] +91 22 6623 3411
Coverage group(s) of stocks by primary analyst(s): Consumer Goods Asian Paints, Colgate, Dabur, Godrej Consumer , Emami, Hindustan Unilever, ITC, Marico, Nestle Ltd, United Spirits
Distribution of Ratings / Market Cap
Edelweiss Research Coverage Universe
Rating Distribution* 119 47 15 184* 3 stocks under review
Market Cap (INR) 111 57 16
Date Company Title Price (INR) Recos
Access the entire repository of Edelweiss Research on www.edelresearch.com
Recent Research
13-Sep-11 Godrej Consumer Products
International business takes centerstage; Visit Note
428 Buy
17-Aug-11 Godrej Consumer Products
Many more HITs to come; Visit Note
417 Buy
17-Aug-11 Emami Fair growth, handsome volume; Result Update
478 Buy
> 50bn Between 10bn and 50 bn < 10bn
Buy Hold Reduce Total
Rating Interpretation
Buy appreciate more than 15% over a 12-month period
Hold appreciate up to 15% over a 12-month period
Reduce depreciate more than 5% over a 12-month period
Rating Expected to
This document has been prepared by Edelweiss Securities Limited (Edelweiss). Edelweiss, its holding company and associate companies are a full service, integrated investment banking, portfolio management and brokerage group. Our research analysts and sales persons provide important input into our investment banking activities. This document does not constitute an offer or solicitation for the purchase or sale of any financial instrument or as an official confirmation of any transaction. The information contained herein is from publicly available data or other sources believed to be reliable, but we do not represent that it is accurate or complete and it should not be relied on as such. Edelweiss or any of its affiliates/ group companies shall not be in any way responsible for any loss or damage that may arise to any person from any inadvertent error in the information contained in this report. This document is provided for assistance only and is not intended to be and must not alone be taken as the basis for an investment decision. The user assumes the entire risk of any use made of this information. Each recipient of this document should make such investigation as it deems necessary to arrive at an independent evaluation of an investment in the securities of companies referred to in this document (including the merits and risks involved), and should consult his own advisors to determine the merits and risks of such investment. The investment discussed or views expressed may not be suitable for all investors. We and our affiliates, group companies, officers, directors, and employees may: (a) from time to time, have long or short positions in, and buy or sell the securities thereof, of company (ies) mentioned herein or (b) be engaged in any other transaction involving such securities and earn brokerage or other compensation or act as advisor or lender/borrower to such company (ies) or have other potential conflict of interest with respect to any recommendation and related information and opinions. This information is strictly confidential and is being furnished to you solely for your information. This information should not be reproduced or redistributed or passed on directly or indirectly in any form to any other person or published, copied, in whole or in part, for any purpose. This report is not directed or intended for distribution to, or use by, any person or entity who is a citizen or resident of or located in any locality, state, country or other jurisdiction, where such distribution, publication, availability or use would be contrary to law, regulation or which would subject Edelweiss and affiliates/ group companies to any registration or licensing requirements within such jurisdiction. The distribution of this document in certain jurisdictions may be restricted by law, and persons in whose possession this document comes, should inform themselves about and observe, any such restrictions. The information given in this document is as of the date of this report and there can be no assurance that future results or events will be consistent with this information. This information is subject to change without any prior notice. Edelweiss reserves the right to make modifications and alterations to this statement as may be required from time to time. However, Edelweiss is under no obligation to update or keep the information current. Nevertheless, Edelweiss is committed to providing independent and transparent recommendation to its client and would be happy to provide any information in response to specific client queries. Neither Edelweiss nor any of its affiliates, group companies, directors, employees, agents or representatives shall be liable for any damages whether direct, indirect, special or consequential including lost revenue or lost profits that may arise from or in connection with the use of the information. Past performance is not necessarily a guide to future performance. The disclosures of interest statements incorporated in this document are provided solely to enhance the transparency and should not be treated as endorsement of the views expressed in the report. Edelweiss Securities Limited generally prohibits its analysts, persons reporting to analysts and their family members from maintaining a financial interest in the securities or derivatives of any companies that the analysts cover. The analyst for this report certifies that all of the views expressed in this report accurately reflect his or her personal views about the subject company or companies and its or their securities, and no part of his or her compensation was, is or will be, directly or indirectly related to specific recommendations or views expressed in this report. Analyst holding in the stock: no. For recipients in the United States: This report was prepared by Edelweiss Securities, which is not a FINRA member nor a broker-dealer registered with the SEC. US persons receiving this research and wishing to effect any transactions in any security discussed in the report should contact an SEC-registered broker-dealer. In order to conduct business with Institutional Investors based in the U.S., Edelweiss Securities has entered into a chaperoning agreement with a U.S. registered broker-dealer, Marco Polo Securities Inc. ("Marco Polo").
Copyright 2009 Edelweiss Research (Edelweiss Securities Ltd). All rights reserved