india and the wto's agreement on agriculture (a-o-a...
TRANSCRIPT

India and the WTO's Agreement on Agriculture (A-o-A)
Kaliappa Kalirjan Kanhaiya Singh
Invited paper prepared for presentation at the International Association of Agricultural Economists Conference,
Gold Coast, Australia, August 12-18, 2006
Copyright 2006 by Kaliappa Kalirjan and Kanhaiya Singh . All rights reserved. Readers may make verbatim copies of this document for non-commercial
purposes by any means, provided that this copyright notice appears on all such copies.
2
India and the WTO's Agreement on Agriculture (A-o-A)
Kaliappa Kalirjan Foundation for Advanced Studies on International Development
Tokyo and
Kanhaiya Singh National Council of Applied Economic Research
New Delhi
Abstract
This paper examines issues related to the WTO’s Agreement on Agriculture from India’s point of view. Why India should work towards the success of the Doha Round is also discussed.
1. The Setting According to the Indian Census 2001, the share of cultivators and agriculture
labourers in the total labour force of India declined from 64.8 per cent in 1991 to
58.2 per cent in 2001, while the share of agriculture value added in total value
added of the country dropped from 31.3 per cent to 24.5 per cent. Thus, a 6.8 per
cent shift in the output from agriculture to non-agriculture resulted in a shift of
just about 6.6 per cent labour from farming to non-farming sector. If this were
the case, then even if the share of agriculture is completely overtaken by the
other sectors, the problem of huge income inequality between rural and urban
will remain daunting. The ratio of income defining the poverty line in urban and
rural India has increased from 1.29 in 1983-84 to 1.4 in 1999-00. Nevertheless,
the urban-rural income differential in India is much smaller than that of
developed countries (Table 1). In order to bridge these inequalities, the
developed countries generally tend to resort to heavy subsidies to their
agricultural sector. The rural-urban divide in India is increasing steadily and it
would have to face the same problem as other developed countries are facing at
present (Table 1). However, India could not afford to employ the same balancing
strategy as practiced by the developed countries of providing subsidy to the
agricultural sector, because its rural population is very large.

3
Therefore, the solution to reduce the rural-urban divide in India lies in
employment-generating large-scale industrialization and expansion of
agriculture processing and exports, so that each percentage poin t shift in the
share of agriculture value added to other sectors leads to at least two percentages
points shift in the labour force from farm sector to non-farm sector. Maintaining
this target itself will inherently lead to a comparable growth in per capita income
of the farm sector.
Table 1: Urban-Rural Divide and the Quantum of Subsidy
Ratio of per capita urban income to per capita rural income
Subsidy as percentage of agriculture value added
1980 1990 2001 1986-88 2002 India 6 7 9 6 7 Canada 7 11 12 48 31 United States 13 17 19 38 26 Japan 8 12 20 71 84 European Monetary Union 8 10 13 77 65 High income OECD 9 11 15 67 54 Source: (Basic data WDI 2005, Agriculture Statistics 2005, Acharya (2001)): Per capita rural income = agriculture value added (current US$) to rural population; Per capita urban income = (total GDP at current US$ less agriculture value added (current US$) to urban population (basic data WDI 2005); Indian agriculture Subsidy 1986-88 from Acharya (2001); Other data on Subsidy from OECD (2004) cited in GOI (2005).
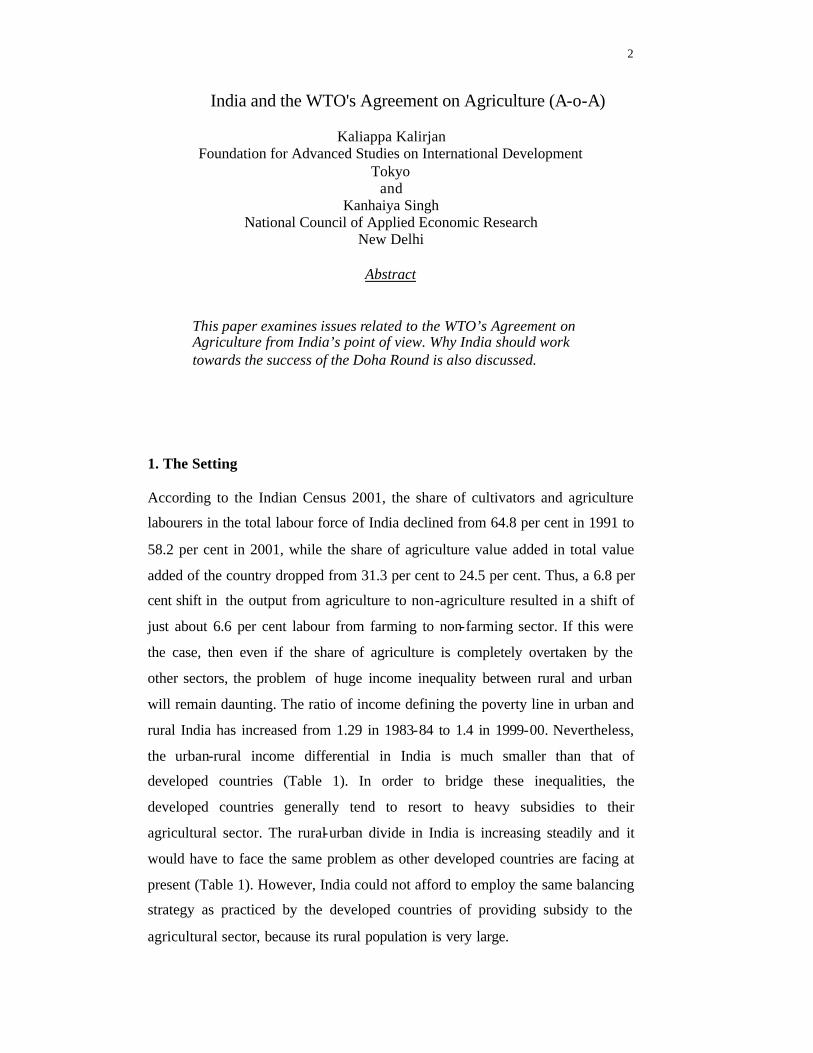
However, the food price inflation in India has been traditionally much higher
than those in developed countries such as the United States, Japan or Canada
making it harder to export agricultural processed products. After remaining at an
average annual rate of 9 per cent during 1981-90 and almost 11 per cent during
1991-98, the food price inflation has come down to the level of these countries
only recently (Figure 1). The general inflation in India during 1998-2003 has
been about 4.5 per cent and a similar trend continued during the later periods of
2004-2006. Clearly, if imports were going to reduce the food prices further, it
would not be increasing the welfare of farmers, unless substantial gains are made
through food based manufacturing export-enhancing strategies.
4
Figure 1: Food price inflation in selected countries (2000 = 100) Source (basic data): World Development Indicators 2005, the World Bank
However, with agriculture subsidies and export promotions, developed countries
have dominated the world agriculture market historically. More than 67 per cent
of world food exports during 2001-03 originated from the high-income countries
(Table 2), while countries such as India where more than 65 per cent people
survive on agriculture, contributed only 1.1 per cent of food exports.
Table 2: Food Exports: Share (%) in World Food Exports 1971-80 1981-90 1991-00 2001-03 China 2.5 3.1 India 1.1 0.9 1.0 1.1 East Asia & Pacific 7.9 9.0 European Monetary Union 31.5 35.7 35.8 High income 60.6 64.8 69.0 67.4 Latin America & Caribbean 11.6 10.2 10.4 12.2 Source (Basic data): World Development Indicators 2005, the World Bank. Clearly, world food exports situation indicates that the Agreements on
Agriculture (A-o-A) negotiations are more important for developed countries
too. Given the high stakes and conflicts in interests, the A-o-A negotiations are
no doubt going to be North-North as much as North-South. The interests of
-4
-2
0
2
4
6
8
10
12
14
16
18
1980
1981
1982
1983
1984
1985
1986
1987
1988
1989
1990
1991
1992
1993
1994
1995
1996
1997
1998
1999
2000
2001
2002
Foo
d pr
ice
infla
tion
(per
cen
t ann
ual)
India Canada United States Japan
5
Cairns group1, the EU and the United States, are all wide apart. United States is
trying to preserve subsidy on cotton while the European Union, is trying to
preserve domestic support to food products. The least developed countries are
still on the periphery.
It is very clear that expecting developed countries to maintain the rural-urban
divide of the extent appearing in Table 1 is self-defeating. However, the often
stated reasons to provide subsidy does not include these aspects. The commonly
discussed objectives include (1) to make sure that enough food is produced to
meet the country’s needs; (2) to shield farmers from the effects of the natural
calamities and swings in world prices and (3) to preserve rural society. If this
was so simple then why should developed countries work hard to produce
surplus food and take pains to export even in the absence of revealed
comparative advantage? Food security does not require producing surpluses,
neither it requires that surpluses be diverted to meet aid obligation for the least
developed countries. On the other hand, transfer of technology could make the
least developed countries more self-sufficient. Often a prolonged food aid
program could render a country net importer of food due to the dependency
created by circumstances. With such dependency, the governments cannot afford
to raise tariff on food imports in order to encourage domestic production. Once
such a vicious circle is created it becomes difficult to come out of it. EU gives
huge amount of aid to least developed countries in the form of food and other
subsidised products. It is argued that the US grain imports and cheap EU
exports of subsidized beef into Africa had destroyed the pastoral economy
including small-scale cattle growers in Sub-Saharan Africa.
However, the problem of developing countries like India gets escalated, when it
is asked to give agriculture market access to the developing countries by
reducing tariff, particularly in a situation where India cannot afford to adopt
alternative schemes like detached income, an option already existing in the
developed world. India is a net exporter in the agriculture sector and therefore, it
1 A group formed in 1986 at Cairns, Australia. The group includes major food exporters from both developed and developing countries: Argentina, Australia, Bolivia, Brazil, Canada, Chile, Colombia, Costa Rica, Fiji, Guatemala, Indonesia, Malaysia, New Zealand, Paraguay, the Philippines, Thailand, South Africa, an d Uruguay

6
is likely to be benefited by provisions of Agreement on Agriculture (A-o-A).
However, it is important to note that the gains from agriculture exports may not
outsmart the losses incurred on account of compromising the market access in
industry and services. For India to take advantage of the reduction in tariff in
industrial sector and conceding access to services, requires it to develop
comparative advantage in these areas quickly. The development agenda of the
WTO is a constructive tool in this regard and the directions of future
negotiations are critical for its success.
With respect to Swiss formula concerning tariff reduction, the current proposals
would translate in a reduction of the EU's average bound rates to 2.3 per cent
and that of the US to 2.1 per cent (Lamy 2006). Considering the fact that these
two Members absorb about 28 per cent of India’s manufactured export products,
such reductions could substantially affect India's total exports in a market where
its goods ‘already suffer hugely from the discrimination resulting from trade
preferences to most of its competitors in the EU and North American markets’
(Panagariya, 2004). Therefore, at the outset, it is believed that India has most to
gain from a successful completion of the Doha round.
It is in this context, this paper examines issues related to India’s agriculture
trade, policies, and its potential strategies for negotiations with respect to agenda
concerning agriculture. Rest of the paper is organised as follows. Section 2
presents an overview of the extent of agriculture trade in the World and in India.
Agriculture and the World Trade Organization with particular emphasis on the
Agreements on Agriculture (A-o-A) and India’s standing on A-o-A are discussed
in section 3. We present the readiness of India for international integration with
respect to its current agriculture policy regime in section 4. Overall conclusions
of this paper are drawn in Section 5.
2. Trade in agriculture thus far: World and India
Whether the WTO regime has been successful in accelerating growth in trade in
general and agriculture trade in particular, remains a matter of debate and so are
the possible welfare gains and likely beneficiaries of proposed trade
liberalization in agriculture sector. The average import duty on international
7
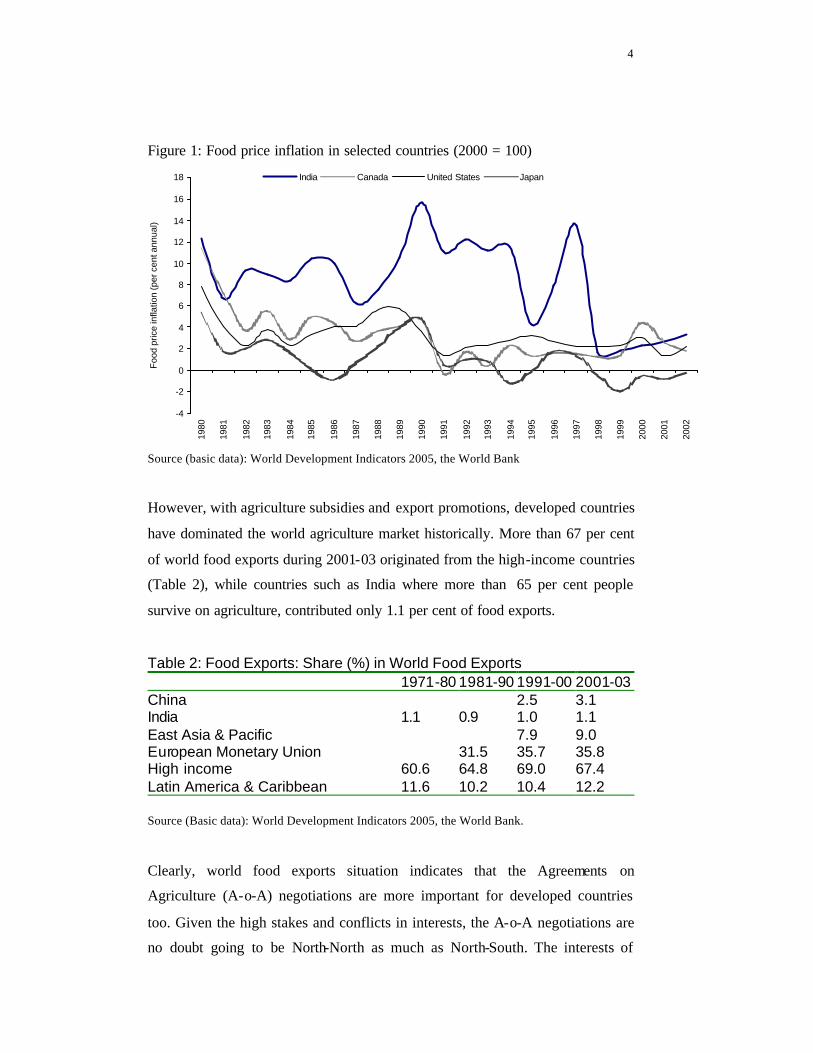
goods in developed countries was around 40 per cent during 1948, which has
been brought down to 6.4 per cent by 1990 as a result of efforts by GATT. This
is reflected in high growth in world trade during 1960s and 1970s (Table 3 and
Figure 2). However, the average growth of global agriculture exports during
1980s and 1990s has been just around 3.3 per cent while total exports have
grown by more than six per cent (Table 3).
It is only during 2003 that agriculture exports recorded a double digit growth of
about 16 per cent pulling up the average for 2001-03 to seven per cent. As a
result of the prolonged sluggishness in agriculture exports growth, their share in
total exports has reduced to almost 9.8 per cent during 2001-03 (average) as
compared to almost 20 per cent during early 1970s. Such trends are observed
across all segments of countries with respect to food exports and food imports
(Table 4). Only the sub-Sahara Africa has recorded improvement in agriculture
exports and imports growth.
Table 3: Average growth in global exports (annual per cent) Total Agricultural products Mining products Manufactures
1961-70 7.8 4.8 10.1 10.8 1971-80 21.6 17.2 30.6 19.4 1981-90 5.7 3.6 -0.7 8.7 1991-00 6.5 3.1 6.9 7.0 2001-03 5.4 7.2 4.2 5.3 Source (basic data): WTO (2005): World Trade Statistics Figure 2: Pattern of world trade in agriculture and other commodities
0
20
40
60
80
100
120
140
160
1960
1963
1966
1969
1972
1975
1978
1981
1984
1987
1990
1993
1996
1999
2002
Tra
de In
dex
(199
5=10
0)
Total a Agricultural products Manufactures

8
Source (basic data): WTO world trade statistics Table 4: Food exports (% of merchandise exports) and Food imports (% of merchandise imports) Imports Exports
1961-70
1971-80
1981-90
1991-00
2001-03
1961-70
1971-80
1981-90
1991-00
2001-03
Food exports (% of merchandise exports)
China 8.4 4.9 3.6 14.2 8.6 4.9 India 23.0 16.5 7.7 5.1 5.8 33.8 31.5 22.2 16.5 12.2 European Monetary Union 19.3 15.0 12.0 10.4 8.8 16.6 13.2 11.6 10.2 8.9 High income 19.1 13.5 9.9 8.4 7.4 15.9 12.5 10.0 8.1 7.1 Latin America & Caribbean 9.9 11.2 11.9 8.8 7.9 46.2 38.7 25.2 20.9 18.3 Low income 20.3 17.3 12.9 11.6 9.6 38.1 30.8 23.6 19.9 21.0 Middle income 12.2 10.9 8.6 8.0 18.9 13.1 9.7 Sub-Saharan Africa 10.8 12.2 13.0 14.3
27.2 16.4 18.2 19.8
World 18.4 13.4 10.1 8.5 7.5 19.4 15.6 12.0 9.3 7.9 Source (basic data): World Development Indicators 2005, the World Bank India’s Comparative Advantage in Agriculture and trade related performance
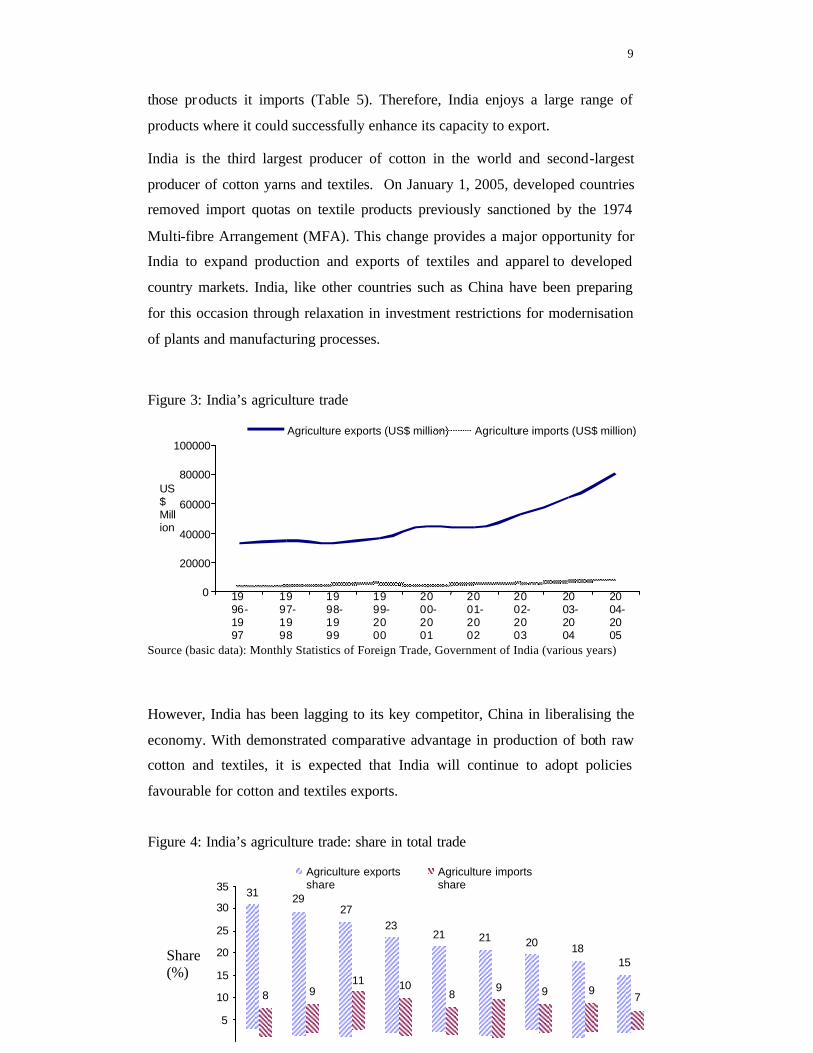
At present, India is a net food exporter. In fact, its share of exports in world
exports is greater for agriculture than it is for manufactured products, the total
export share being less than one per cent. India’s agricultural exports have
continuously grown since 1999 (Figure 3). Therefore, India is likely to gain if
the EU, the US, Japan and other major agriculture subsidisers significantly
reduce their farm subsidies. The sam e can be said of the elimination of export
subsidies on cotton by 2006. It is also in India’s interests that other countries
decrease tariffs to its farm exports on products such as cotton, basmati rice, fish
or meat. India will have to tap other markets also in order to keep pace with its
export growth in manufacturing. The share of Indian exports in agriculture is
sliding down as compared to manufacturing (Figure 4). These labour-intensive
exports are expected to grow much faster and potential areas include textiles and
food processing translating into benefits across a large group of farmers and
contributing to stabilising their incomes. India has demonstrated revealed
comparative advantage (RCA) in almost all the products it exports, and even in
9
those products it imports (Table 5). Therefore, India enjoys a large range of
products where it could successfully enhance its capacity to export.
India is the third largest producer of cotton in the world and second-largest
producer of cotton yarns and textiles. On January 1, 2005, developed countries
removed import quotas on textile products previously sanctioned by the 1974
Multi-fibre Arrangement (MFA). This change provides a major opportunity for
India to expand production and exports of textiles and apparel to developed
country markets. India, like other countries such as China have been preparing
for this occasion through relaxation in investment restrictions for modernisation
of plants and manufacturing processes.
Figure 3: India’s agriculture trade Source (basic data): Monthly Statistics of Foreign Trade, Government of India (various years)
However, India has been lagging to its key competitor, China in liberalising the
economy. With demonstrated comparative advantage in production of both raw
cotton and textiles, it is expected that India will continue to adopt policies
favourable for cotton and textiles exports.
Figure 4: India’s agriculture trade: share in total trade
0
20000
40000
60000
80000
100000
1996-1997
1997-1998
1998-1999
1999-2000
2000-2001
2001-2002
2002-2003
2003-2004
2004-2005
US$ Million
Agriculture exports (US$ million) Agriculture imports (US$ million)
31 29
27 23
21 21 20
18 15
8 9 11
10 8 9 9 9
7
5 10 15 20 25 30 35
Share (%)
Agriculture exports share
Agriculture imports share

10
Source (basic data): Monthly Statistics of Foreign Trade, Government of India (various years)
Table 5: India’s agriculture trade profile (average 2002/03-04/05)
HS code
Item Share in total agriculture export
Share in total agriculture imports
Export based RCA 2003
2 MEAT AND EDIBLE MEAT OFFAL. 3 0 0.8 3 FISH AND CRUSTACEANS, MOLLUSCS AND OTHER
AQUATIC INVERTABRATES. 11 0 3.2
4 DAIRY PRODUCE; BIRDS' EGGS; NATURAL HONEY; EDIBLE PROD. OF ANIMAL ORIGIN, NOT ELSEWHERE SPEC. OR INCLUDED.
1 0 0.3
7 EDIBLE VEGETABLES AND CERTAIN ROOTS AND TUBERS.
3 8 1.3
8 EDIBLE FRUIT AND NUTS; PEEL OR CITRUS FRUIT OR MELONS.
5 8 1.7
9 COFFEE, TEA, MATE AND SPICES. 6 2 6.4 10 CEREALS. 15 0 4.5 12 OIL SEEDS AND OLEA. FRUITS; MISC. GRAINS, SEEDS
AND FRUIT; INDUSTRIAL OR MEDICINAL PLANTS; STRAW AND FODDER.
3 1 1.8
13 LAC; GUMS, RESINS AND OTHER VEGETABLE SAPS AND EXTRACTS.
2 1 10.2
15 ANIMAL OR VEGETABLE FATS AND OILS AND THEIR CLEAVAGE PRODUCTS; PRE. EDIBLE FATS; ANIMAL OR VEGETABLE WAXEX.
2 36 0.8
17 SUGARS AND SUGAR CONFECTIONERY. 2 2 1.9 23 RESIDUES AND WASTE FROM THE FOOD INDUSTRIES;
PREPARED ANIMAL FODER. 5 1 3.3
24 TOBACCO AND MANUFACTURED TOBACCO SUBSTITUTES.
2 0 1.3
40 RUBBER AND ARTICLES THEREOF. 6 8 1.0 41 RAW HIDES AND SKINS (OTHER THAN FURSKINS) AND
LEATHER 5 4 1.3
44 WOOD AND ARTICLES OF WOOD; WOOD CHARCOAL. 1 10 0.1 47 PULP OF WOOD OR OF OTHER FIBROUS CELLULOSIC
MATERIAL; WASTE AND SCRAP OF PAPER OR PAPERBOARD.
0 6 0.0
51 WOOL, FINE OR COARSE ANIMAL HAIR, HORSEHAIR YARN AND WOVEN FABRIC.
1 3 -
52 COTTON. 20 6 7.8
Source (basic data): Monthly Statistics of Foreign Trade, Government of India (various years)

11
3. Agreement on Agriculture (A-o-A) and India
The success of the Agreement on Textiles and Clothing has given legitimate
boosts and seriousness to multilateral trading system. Agreement on Textiles and
Clothing, which promised to put an end to the country-by-country quotas on
imports of textiles and clothing imposed by the major developed countries
including the United States and European Union became a reality from January
1, 2005. On the other hand, the success of the Agreement on Agriculture in
liberalizing agriculture was less than expected but it has opened the door to
future liberalization and concrete results are expected in near future.
3.1. Agreement on Agriculture (A -o-A) or URAA:
The core objective of A-o-A is to establish a fair and market-oriented
agricultural trading system. Its implementation period was six years for
developed countries and nine for developing countries, starting with the date the
agreement came into effect - January 1, 1995. These dates are now extended
under a built-in provision of A-o-A of own review and renewal. That
renegotiation is now underway, under the terms set at the fourth WTO
ministerial conference in Doha and the Framework Decision agreed at the WTO
General Council on August 1, 2004. The AoA comprises three sections referred
to as three pillars of the agreement:
1. Market access, 2. Domestic support and 3. Export subsidies.
However at the outset, the agreement notes that the reform program should be
made in an equitable way among all Members, having regard to non-trade
concerns, including food security and the need to protect the environment;
having regard to the agreement that special and differential treatment (SDT) for
developing countries is an integral element of the negotiations, and taking into
account the possible negative effects of the implementation of the reform
program on least-developed and net food-importing developing countries. In
addition, there are provisions of Special Products and Sensitive Products, which
are to be exempted from stringent discipline of the above provisions of the A-o-
12
A. Provision of Special Products designates a certain number of products of the
developing countries that would be exempt from tariff reduction requirements
and other disciplines in order to protect and promote food production, livelihood
security and rural development. The key issues here are associated with the
mechanism to decide on country-w ise crops. In the case of developed countries
also, certain products, based on political, social and cultural considerations are
designated as Sensitive Products, which will be treated less stringently. Here the
main dispute lies between the United States, which has proposed 1 per cent of
the tariff lines for such products while the EU is asking for 8 per cent of the
tariff line.
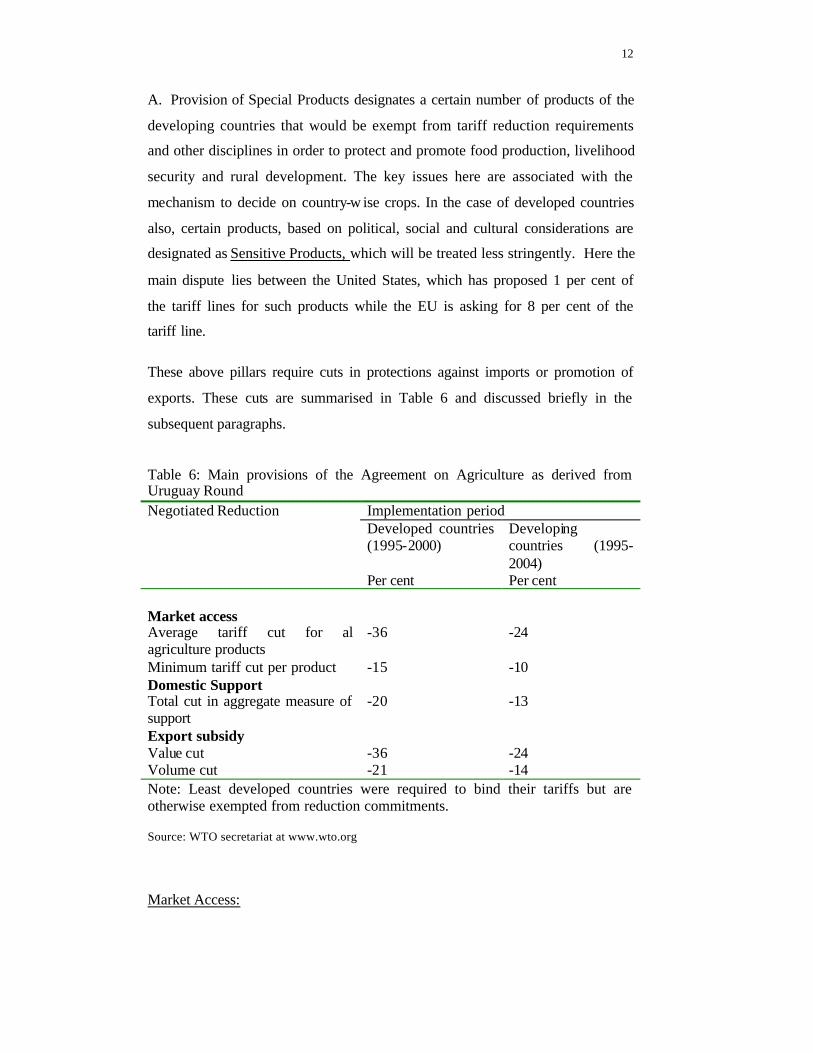
These above pillars require cuts in protections against imports or promotion of
exports. These cuts are summarised in Table 6 and discussed briefly in the
subsequent paragraphs.
Table 6: Main provisions of the Agreement on Agriculture as derived from Uruguay Round Negotiated Reduction Implementation period Developed countries
(1995-2000) Developing countries (1995-2004)
Per cent Per cent Market access Average tariff cut for al agriculture products
-36 -24
Minimum tariff cut per product -15 -10 Domestic Support Total cut in aggregate measure of support
-20 -13
Export subsidy Value cut -36 -24 Volume cut -21 -14 Note: Least developed countries were required to bind their tariffs but are otherwise exempted from reduction commitments. Source: WTO secretariat at www.wto.org
Market Access:

13
The market access requires that tariffs fixed by individual countries be cut
progressively to allow free trade. Since different countries fixed their tariffs at
different levels confronting the interest of each other, several harmonizing
formula such as Uruguay Round formula , Swiss formula, Girard formula , and
Canadian “income tax” formula were suggested to cut tariffs in which steeper
cuts are suggested on higher tariffs, so as to bring all the international tariffs
closer to almost the same level. All these formula have unique coefficients with
different effects. The developed countries preferred Swiss mathematical Formula
in which the coefficients also determine the maximum tariff where the starting
tariffs will end up. For example, if the coefficient is 20, then a very high starting
tariff will end up with a national tariff of exactly 20 percent and lower starting
tariffs will end up proportionately lower, close to 20 percent as well. The
developing countries do not like this formula because it quickly brings them
closure to the competition, a situation they are not prepared. The key arguments
is that the developed countries want to deprive developing countries a facility
that has been extensively used by them to achieve current state of their economy.
Other formulae are more flexible. For example the formula used in the Uruguay
Round for agricultural tariff reductions required that tariffs be cut by a
percentage average over a number of years; in that the developed countries
agreed to cut tariffs by an average of 36 percent over six years with a minimum
of 15 percent on each product; some cuts could be greater than others and thus
the combination of average and minimum reductions allows countries the
flexibility to vary their actual tariff reductions on individual products.
Domestic support and the little boxes
The A-o-A broadly subdivides domestic support programs into three boxes with
colours, green, blue and amber and two other categories namely Development
measures and de minimis. Under current WTO rules, countries are free to
employ subsidies under the "green" and "blue" boxes, certain development
measures, and the de minimis subsidies. In addition there are some Non-trade
concerns (NTCs) listed in the preamble to the A-o-A, which can be used to
legitimize government programs that run contrary to the market-oriented
agricultural trading system. They include food security, rural development and

14
environmental protection. The European Union wants to include animal welfare
and eco-labeling as NTCs.
Subsidies in the Green box (A-o-A Annex 2) have no or minimal distorting
effect on production and hence trade. They include measures decoupled from
output such as income-support payments (decoupled income support), safety-net
programs, payments under environmental programs, and agricultural research-
and-development subsidies.
The Blue box (A-o-A Article 6.5) contains direct payments under production-
limiting programs. They cover payments based on acreage, yield, or number of
livestock in a base year. Because countries are allowed to revise the base year
over time, subsidies in the blue box may have an effect on current output. Both
the United States and the EU’s Common Agricultural Policy rely heavily on
such programs.
Development measures cover direct or indirect permitted (A-o-A article 6.2)
assistance aimed at encouraging agricultural and rural development in
developing countries and is allowed. They include investment subsidies
generally available to agriculture such as research and development, extension
programs, and soil and water conservation; and agricultural input subsidies
available to low-income or resource-poor farmers such as fertilizer, water, and
electricity. Under the de minimis provision, developed countries are allowed to
use other subsidies with an aggregate value of up to 5 percent of the total value
of domestic agricultural production in the case of developed countries and 10 per
cent in the case of developing countries.
The Amber Box (A-o-A Article 6) contains category of domestic support that is
scheduled for reduction based on a formula called the “Aggregate Measure of
Support” (AMS). The AMS calculates the amount of money spent by
governments on agricultural production, except for those contained in the Blue
Box, Green Box and de minimis. It required member countries to report their
total AMS for the period between 1986 and 1988, bind it, and reduce it
according to an agreed-upon schedule. Developed countries agreed to reduce
these figures by 20% over six years starting in 1995. Developing countries
15
agreed to make 13% cuts over 10 years. Least-developed countries do not need
to make any cuts.
Export support
Export support include trade distorting programs such as Export Subsidy, State
Trading Enterprises2, Export Credits, Special and Differential Treatment, Special
Products, and Sensitive Products aimed at benefiting the domestic producers
against the international competition. A-o-A tends to eliminate or minimize such
supports.
Export subsidies are government payments to the exporting firms directed to
encourage use of inputs from the domestic resources. Accordingly, an export
subsidy program will pay the difference between a more expensive domestic
input and a cheaper imported alternative in order to encourage exporters to buy
inputs from domestic market. Dairy products and sugar in EU continue to
receive considerable export subsidies. The U.S. Step 2 program subsidizes its
cotton production through U.S. exporting firms.
Export credits given by a government to underwrite the cost of doing business
on commercial terms also amounts to export subsidy. Often, the United States is
criticized for such policies where the United States Government gives credit to
its domestic companies to deliver goods in another country but the payments are
recovered from the importing countries government in long installments and
cheaper interest rate making it more lucrative for the poor countries to import
from the United States. This is also one of the major points of dispute between
the United States and the EU and it is now agreed that such credit line will not
exceed 180 days.
3.2. Doha Round: brief of the package encompassing A -o-A
The Fourth WTO Ministerial Conference was held in Doha , Qatar from 9 to 14
November 2001. In fact, the Doha Ministerial was a starting of a new round with
unique feature foc used on implementation of A-o-A and “Development” of the
developing countries so that they could meaningfully become part of the
2 Article XVII of the GATT 1994 deals with state trading enterprises and their operations

16
multilateral global trading system. The following Fifth WTO Ministerial
Conference held in Cancun, Mexico from 10 to 14 September 2003 was
dedicated to stock taking of progress in negotiations and other work under the
Doha Development Agenda (DDA). However, the DDA required correcting the
imbalances that penalize developing countries and improve the commitment of
WTO members. The modalities3 for the Doha Round are to be completed by the
end of April 2006, the draft schedule based on these modalities by 31 July 2006
and the Round is expected to conclude by the end of 2006, a date chosen
carefully for the Ministerial Meeting when the term of ‘Trade Promotion
Authority of the United States’ ends. In this round the latest Ministerial was held
in Hong Kong Ministerial (Dec 13-18, 2005), which has given some hope for
success as for the first time developing countries have managed to get a mention
from developed countries of reduction in their subsidies otherwise most of the
previous commitments have been falsified. The issues related to implementation
of A-o-A dominate the Doha Round and they include:
1. High agriculture trade distorting subsidies granted by rich countries 2. Agriculture export subsidies 3. High tariffs on exports of agricultural and industrial products of interest
to developing countries However, at various Ministerial negotiations new items from other agenda have
been added to make it a comprehensive round. For example, the modalities of
the A-o-A are being coupled with GATS, and investment issues. Therefore, the
proposals for negotiation have transformed to include among others the
following (list of all items is provided in following sub-section):
1. On agriculture, 2013 as the end date for the elimination of export
subsidies with an important part frontloaded by 2010 2. Agreement that the EU, US and Japan will undertake the biggest
reductions on agricultural subsidies that distort trade and that these will be effective cuts, which is a serious improvement as compared to the previous round.
3 Modalities describe the kind of commitments or targets (including numerical targets) that governments make in a trade agreement. The negotiations are all about modalities. They determine what is forbidden, what is allowed, how things should change and at what pace. Modalities are complemented by the schedules and together these complete an agreement.
17
3. On cotton, which is of key importance to many African countries, export subsidies on cotton to be eliminated by 2006 and cuts to domestic subsidies will be greater and faster than for the rest of products.
4. Special agriculture products and a safeguard to protect those agricultural
products of developing countries with concerns about livelihood security, food security and rural development
5. On industrial products, a Swiss formula to cut tariffs, with high tariffs
subject to bigger cuts, thus addressing tariffs peaks and tariff escalation in particular on products of interest for developing countries. Developing countries will for a start cut tariffs only in proportion to the cuts by developed countries.
6. A step forward towards a completely duty-free and quota -free access for
the world poorest country Members of the WTO 7. On Services, the door has been opened to plurilateral negotiations
8. Countries have started tabling collective requests in the services of
sectors that are of particular interest to them 9. Aid for Trade package, to help developing countries address their
supply-side constraints (Lamy 2006) 3.3. India’s Ministerial Positions at Doha rounds and on A-o-A
Pascal Lamy, WTO General Secretary visited India on April 5 2006 for the
second time in last six months, which is an indicator of the gravity of problems
being faced by Indians in meeting the demands of developed countries. The
Indian position is that the development agenda and the farmers’ interest cannot
be diluted and that the industrial and agriculture issues should not be mixed,
while at the same time the Indian negotiators feel that no change is made in
subsidy position of the developed countries, yet new elements are being
introduced. Nevertheless the Indian leadership has come up to the age of
globalization and is slowly shedding its defensive posture and it has been
demonstrating dynamism in the WTO negotiations.
India rejected the idea of introducing new issues such as Investment,
Competition, Trade Facilitation or Transparency in Government Procurement,
and did not consider the basic trade principles like non-discrimination or market
18
access appropria te for dealing with issues like Investment and Competition. The
Minister for Commerce and Industry raised the concerns that sensitive industries
in developing countries including small-scale industries, which sustain a large
labour force, could be destroyed. India was firmly opposed to any linkage
between trade and labour standards and recalled that the Singapore Declaration
had once and for all dealt with this issue and there was no need to refer to it
again. Similarly, on environment, India was strongly opposed to the use of
environmental measures for protectionist purposes and to imposition of
unilateral trade restrictive measures and considered that the existing WTO rules
were adequate to deal with all legitimate environmental concerns. In fact the
Minister termed them as Trojan horses of protectionism.
Doha Ministerial was saved from failure to continue the work program. The
African countries, deserted Indian hopes because they were promised the
continuation of their trade preferences into the EU marke t for some more years.
However, to the windfall pleasure of India, the round was launched with services
brought into the fold of international rules through the General Agreement on
Trade in Services (GATS).
At the Cancun Ministerial (10-14 September 2003), India felt that the draft
Cancún Ministerial Text was grossly inadequate on implementation issues,
precision, operational and effectiveness and fixing responsibility and would
severely affect the interests of developing countries in agriculture, industrial
tariffs and Singapore issues. There was no progress in removing barriers to
export from developing countries to the developed countries.
India argued that all the time-lines set at Doha for their resolution have been
breached. On certain issues even the mandate itself has been questioned. To
make matters worse, the draft Ministerial text accords low priority to these
issues. It does not envisage any time-frame for taking decisions for resolving
outstanding issues. This is in sharp contrast to the issues of interest to developed
countries for which time-lines have been provided for taking decisions.
On agriculture subsidies, India argued that the prevailing subsidies in the
developed countries were not targeted to keeping small struggling family farms

19
in business but to provide hefty rents to large farmers or corporates. On the other
hand, against equity, justice and fair play, developing countries are being asked
to liberalize their agriculture.
India felt there was an urgent need to bring down the high tariffs and non-tariff
barriers on products of export interest to developing countries while ensuring
that special and differential treatment for developing countries and policy space
to deal with sensitive products remain an integral part of all elements of
negotiations. India reiterates that under no circumstances can it accept any form
or harmonization of tariffs in agriculture or obligations to create and expand
tariff rate quotas.
On market access negotiations on non-agricultural products (NAMA), India
favored the formula mandated by the Doha Declaration, without any amendment
in any aspect of the formula.
On investment, (one of the Singapore issues, others being, competition,
transparency in government procurement, and trade facilitation) India felt that
WTO was not the right forum, that the traditional WTO principles of non-
discrimination particularly national treatment are not appropriate for a
development policy-related issue like investment and that trade negotiators are
not the right people to deal with movements of capital that have dynamics of
their own. It may be noted that China nor Brazil do not share this sentiment.
There was failure to adopt Draft Ministerial Declaration and it was left for
further work and resulting delays. India was mor e progressive as it offered to
undertake modest liberalisation in industrial products and agreed to negotiate on
two of the four so-called Singapore issues: transparency in government
procurement and trade facilitation. Why did then the negotiations fail?
Panagariya (2004) blames western Non Government Organizations (NGOs),
their media campaign that the current trading system is unfair to the poor
countries and also the role of the United States, which departed from Cairns
group and joined EU, the later having too ambitious agenda on including
investment and competition.

20
At the Hong Kong Ministerial (13 - 18 December 2005), on agriculture trade and
subsidies and other non-tariff barriers, India quipped that its farmers are quite
willing to deal with trade flows – but not with an avalanche of subsidy flows
from developed countries. India argued that exporters from developing countries
face incredible non-tariff barriers. These include the abuse of both anti-dumping
measures and technical standards, often dealing with peripheral matters and
extraneous considerations. India also insisted the need to finalize the proposal
for duty-free and quota-free access for exports of least developed countries to
developed country markets, without hedging. On development, India holds the
view that no single 'harmonized' development strategy could be adopted. Each
country must choose the path that best suits its own genius. Clearly, a room for
negotiation has been created.
3.4 Contentious issues and on-going Debate
The main com plaint about policies supporting domestic prices, subsidized
production and subsidised exports is that they encourage over-production. This
works as deterrent to imports and promotes low-priced dumping on world
markets. However, there are also arguments in favour of subsidies, particularly
in the case of net importers of agriculture products. Such countries do benefit
from imports at suppressed prices, (see for example (Panagariya, 2005) .
Nevertheless, depending on prolonged food aid progra m could render a country
net importer of food due to the dependency created by circumstances and could
discourage domestic production. Once such a vicious circle is created it becomes
difficult to come out of it.
Agriculture subsidies
About 84 percent of farmer households in India survive with less than 2.0
hectare of land with average size of their holding being 0.63 hectare, while
average size of all holdings in India is just about 1.4 hectare. Survival of such
farmers is at stake if they do not get alternative means of livelihood. Where will
these farmers get employment if Indian markets are flooded with foreign
agricultural products under the market access program?

21
In India the product-specific support is negative, while the non-product specific
support i.e., subsidies on agricultural inputs, such as, power, irrigation, fertilisers
etc., is well below the permissible level of 10 per cent of the value of agricultural
output. Therefore, India is under no obligation to reduce domestic support
currently extended to the agricultural sector. Yet, subsidies are wisely considered
burden in India and they are being rationalized.
On the other hand, domestic subsidies in OECD countries during 2002
accounted for about US$ 226.5 billion (Table 6), which has increased to
US$279.5 billion in 2004.
United States spent US$4 billion as subsidy to support its 25,000 cotton
producers (US$160, 000 per producer) in 2003. 4 It is also argued that in
countries such as United States, subsidies are enjoyed by a selected few, mostly
producing corn, wheat, cotton, soybean, and rice, while growers of 400 other
crops hardly get any such subsidy. Because of income and price support
programs, the farmers in OECD countries are reported to use high levels of
pesticides, fertilizers and herbicides in order to increase productivity of the land
and maximize profits. But, these acts also lead to pollution of rivers and lakes.
Therefore, in overall assessment, it is argued that the social benefits of subsidies
may be much less and deserve to be curtailed (Cooper 2004) and also see
information uploaded at www.ewg.org/farm/).
Table (6) compares 2002 values of subsidy for India and selected OECD
countries. Subsidy constitutes almost 54 percent of the agriculture value added in
OECD as compared to seven per cent in India. This figure will further go down
when taken as percentage of value of agriculture output.
Opposition to subsidy is also from within than outside. In the case of United
States six reasons are promoted to kill farm subsidy: (1) Lower Food Prices for
American Families, (2) Lower Costs and increased Exports for American
Companies, (3) Budget Savings and Equity for the U.S. Tax Payers, (4) More
Environment friendly Land Use, (5) Lager Market for U.S. Farmers and
4 Oxfam, “Agriculture Dumping in Africa.” July 8, 2003.

22
Economic Diversification for Rural America, and (6) A more Hospitable World
(Griswold, Slivinsy and Preble 2006).
It is not that, the farmers in OECD countries will become jobless if subsidies are
removed. The population dependency on farm is extremely thin in these
countries. It is not like India, where more than 60 per cent of the population
depends on farm. In OECD countries the farmers can easily switch to better
options quickly as demonstrated in New Zealand, which was heavily subsidizing
its sheep farmers until 1984. The sheep farm subsidy was completely removed
within a span of one year after 1984 and today New Zealand is one of the least
subsidized countries among OECD countries, with a subsidy incidence of just
about 0.3 billion (3 per cent of total farm receipt as compared to 30 per cent in
OECD)5 in 2004.
Table 6: Rural population condition and incidence of subsidy (2002) Rural
population (million)
Agriculture value added (US$) per capita rural population (2002 or latest available)
Agriculture value added (PPP international $) per capita rural population (2002 or latest available)
Total subsidy US$ (million)
Total subsidy: PPP based International $ (million)
Subsidy per capita rural population US$
Subsidy per capita rural population PPP based International $
Subsidy as %age of Agriculture value added
India 754 140 768 7206 39605 10 53 7 Canada 7 2340 3024 4798 6200 732 946 31 USA 64 2340 2324 39105 38844 608 604 26 Japan 27 1979 1701 44162 37968 1657 1424 84 EMU 68 2050 2450 91407 109214 1337 1598 65 OECD 188 2226 2334 226451 237431 1203 1262 54 Source (basic data): OECD 2005 cited in GOI (2005): Agriculture Statistics 2005, WDI 2005
How much agricultural production subsidy and agricultural export promotion
subsidy may developed countries provide to their farmers without significant
opposition from developing countries?
Drawing on the game theoretical model of Gershenson and Grossman (2000), a
simple model can be formulated to answer the above question. Let us assume
5 Agriculture policies in OECD Countries: Monitoring and Evaluation 2005, OECD, Paris, 2005.

23
that there are two countries – a developed country (DDC) and a developing
country (DGC) – struggling to succeed with their agricultural trade policy
options. The DDC will always try to be stern on its trade policy options,
particularly the agricultural subsidies and agricultural export promotion
measures, while the DGC will seek to eliminate DDC’s agricultural subsidies, its
agricultural trade restrictions on DGC’s agricultural exports, and also to protect
its industrial and agricultural sectors arising as a consequence of the restrictive
agricultural trade policy of the DDC. We assume that both DDC and DGC
maximize expected benefits they seek by engaging in A-o-A negotiations in
WTO to achieve their respective trade policy options. Let B1 denote the
expected payoff for the DDC should it succeed in convincing the DGC to accept
its trade policy options of agricultural subsidies and agricultural export
promotion measures. In quantitative terms, this is equal to the product of its
probability that the DDC succeeds in retaining its agricultural subsidies and
exports promotion measures (T1), and the value in socio-economic terms that
DDC attaches to retaining its existing subsidy policy (V1), minus the amount
that the DDC spends on subsidies and export promotion measures (S1). It
chooses S1 to maximize T1, where
B1 = [(T1)(V1)] – S1. (1)
It is assumed that V1 is a positive function of economic resources (GDP1) of
DDC, and 1
1GDP
V∂
∂ > 0. S1 is the nonnegative amount that the DDC spends on
agricultural subsidies and export promotion measures.
The expected payoff for the DGC is denoted as B2. It is equal to the product of
the probability (1-T1) that the DGC gains towards DDC’s abolition of
agricultural subsidies and opening up the DDC for the agricultural trade of DGC
and the value in socio-economic terms that the DGC attaches to gaining from the
removal of the DDC’s subsidies to its agricultural sector and from access for its
agricultural trade into the DDC (V2), minus the amount, S2 that the DGC spends
on protecting its industry and agriculture sectors in a way challenging the
existing trade policy option of the DDC. The DGC chooses S2 to maximize B2
in a such way that
24
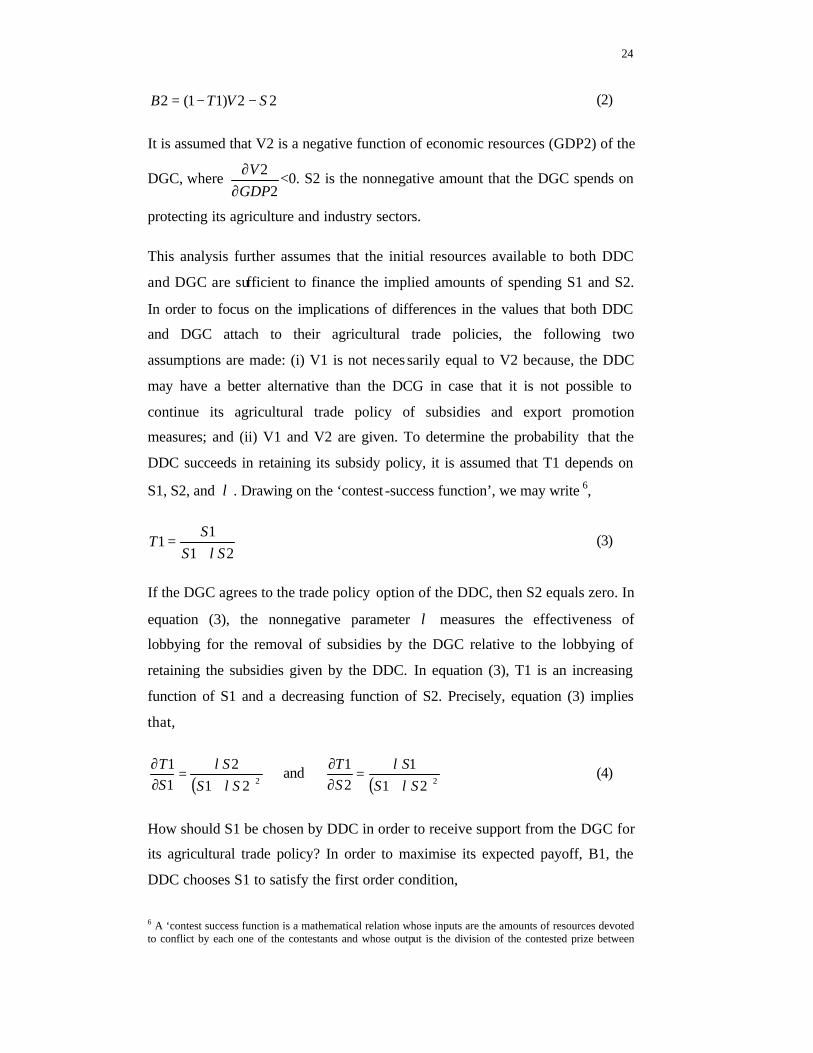
22)11(2 SVTB −−= (2)
It is assumed that V2 is a negative function of economic resources (GDP2) of the
DGC, where 2
2GDP
V∂
∂ <0. S2 is the nonnegative amount that the DGC spends on
protecting its agriculture and industry sectors.
This analysis further assumes that the initial resources available to both DDC
and DGC are sufficient to finance the implied amounts of spending S1 and S2.
In order to focus on the implications of differences in the values that both DDC
and DGC attach to their agricultural trade policies, the following two
assumptions are made: (i) V1 is not neces sarily equal to V2 because, the DDC
may have a better alternative than the DCG in case that it is not possible to
continue its agricultural trade policy of subsidies and export promotion
measures; and (ii) V1 and V2 are given. To determine the probability that the
DDC succeeds in retaining its subsidy policy, it is assumed that T1 depends on
S1, S2, and λ . Drawing on the ‘contest -success function’, we may write 6,
211
1SS
ST
λ+= (3)
If the DGC agrees to the trade policy option of the DDC, then S2 equals zero. In
equation (3), the nonnegative parameter λ measures the effectiveness of
lobbying for the removal of subsidies by the DGC relative to the lobbying of
retaining the subsidies given by the DDC. In equation (3), T1 is an increasing
function of S1 and a decreasing function of S2. Precisely, equation (3) implies
that,
( )2212
11
SSS
ST
λλ+
=∂∂ and
( )2211
21
SSS
ST
λλ+
=∂∂ (4)
How should S1 be chosen by DDC in order to receive support from the DGC for
its agricultural trade policy? In order to maximise its expected payoff, B1, the
DDC chooses S1 to satisfy the first order condition,
6 A ‘contest success function is a mathematical relation whose inputs are the amounts of resources devoted to conflict by each one of the contestants and whose output is the division of the contested prize between

25
(5)
With the assumptions that S2 is equal to zero and B1 is a decreasing linear
function of S1, equations (1) and (3) imply either that B1 has an interior
maximum at a value of S1 that satisfies
011
=∂∂
SB with 210 VS λ<< (6)
or that B1 is maximised at 21 VS λ= with
011
>∂∂
SB for all 21 VS λ< (7)
Equation (6) indicates that if the DDC chooses subsidies and export promotion
measures, S1 less than λ times the value that the DGC attaches to gaining in
socio-economic terms from the removal of subsidies and export promotion
measures (V2) of DDC, then S1 is such that there will be zero marginal increase
in benefit due to the marginal increase in S1. The marginal benefit of S1
includes both a direct effect of S1 on T1 and an indirect effect of S1 on T1 via
the effect of S1 on S2.
On the other hand, equation (7) states that if the DDC chooses S1 equal to 2Vλ ,
then for all values of S1 less than 2Vλ , the marginal benefit of S1 exceeds the
marginal cost. Therefore, the DDC would be interested in situations in which S1
≥ 2Vλ .
Now, substituting values for the terms on R.H.S. in equation (5), conditions
given in equations (6) and (7), imply that
22
1411
2
VVVS λ
λ<= for λ2
21 <
VV (8)
21 VS λ= for λ221 ≥
VV (9)
them, or the average expected likelihood of success for each one of the contestants. For a comprehensive analysis, see Hirshleifer (2001).
( ) ( ) 111
12
21
211
212
11
1112
21
11
11
22 −
−+
−+
+=
∂∂
−
∂∂
∂∂+
∂∂=
∂∂
VS
VSS
SSS
SSB
VSS
ST
ST
SB
λλλλ
λλ

26
Equation (8) shows that for 21
VV is less than λ2 implies that the DGC spends a
positive amount on protection of its sectors in response to the level of subsidies
and export promotion measures used by the DDC. Thus, as long as 21
VV is
smaller than λ2 , the existing subsidy policy results not in conflict with the
DGC. In this situation, 2
141 2
VV
λ is the amount that the DDC chooses to
spend on agricultural subsidies and export promotion measures, which is less
than 2Vλ and an insufficient amount to create a potential conflict with the
DGC.
On the other hand, equation (9) indicates that if 21
VV is as large as or larger than
λ2 , this means that the amount of agricultural subsidies and export promotion
measures spent by the DDC is sufficient to trigger strong opposition for its
agricultural policy from the DGC. Though it may be difficult to measure
accurately, V1, V2, and λ , which is also beyond the scope of this paper, data
given in Table 6 facilitate conjecturing that the ratio 21
VV might be as large as or
larger than λ2 . That could be the reason that in the Doha Round of Hong Kong
Ministerial (Dec 13-18, 2005), for the first time developing countries have
managed to get a mention of reduction in subsidies by developed countries.
4. India’s Readiness: Agriculture Policy Regime
As a general policy of trade reforms in India, some 1,400 quantitative
restrictions including those on agriculture products were replaced by the custom
tariffs. While tariff rates have been declining and aimed to achieve the level of
ASEAN countries, the average MFN tariff7 is still over 20 per cent. However,
almost all the tariff lines in the case of agriculture are bound 8. The average
7 The MFN tariff is based on “standard” rates of duty, which are statutory tariffs and may only be changed through legislation. 8 Binding plays an important role in signaling to the business community an upper limit for possible tariff increases. As a result of the Uruguay Round negotiations, India had bound about 67 per cent of its tariff lines, while applied tariff were kept below bound rates. Subsequently, India submitted rectification and modifications of its schedule under Article XXVIII: 1 of the GATT, 1994 and increased the number of bound tariffs from 67%, to 72.4% in 2001. Bindings have been undertaken for previously unbound products, such as textiles and clothing, while India renegotiated some commitments on previously bound
27
applied tariff on agriculture products in 2004 was about 49 per cent while the
average bound rate was 125 per cent. In addition, anti-dumping measures have
become an important element in India's trade policy.
With the removal of QRs on Indiaís imports, apprehensions have been expressed
that such removal may impact the domestic producers adversely and result in a
surge and dumping of imports into the country. However, necessary mechanisms
have been put in place to provide adequate protection and a level playing field to
domestic players vis-à-vis imports. Appropriate tariffication, at peak customs
duty, have been effected for these QRs. A number of agricultural and
horticultural products placed on the free list of imports in earlier years have also
been brought to the peak rate to ensure adequate protection to Indian farmers.
Tariff binding for such products have also been renegotiated at substantially
higher levels. For sensitive agricultural products, suitable enabling provision has
been made to fix the statutory tariff rates at appropr iate high levels. It has also
been decided to amend the 1992 Foreign Trade (Development & Regulation)
Act for vesting the Government with necessary powers to impose QRs as a
temporary safeguard measure. EXIM Policy announced on 31.3.2001 further
provides for the following measures to protect the domestic producers:
• Import of agricultural products like wheat, rice, maize, other coarse cereals,
copra and coconut oil has been placed in the category of State Trading. The
nominated State Trading Enterprise will conduct the imports of these
commodities solely as per commercial considerations. Similarly, import of
petroleum products including petrol, diesel and ATF has also been placed in
the category of State Trading. Import of urea will also be done through the
mechanism of State Trading.
items, relating mainly to agriculture. India bound 100% of all agricultural lines (under the WTO definition of agriculture) and 68.2% of lines for non-agricultural products. Bindings were not made in several chapters including fish and crustacean products (HS 3) in agriculture; and leather products (HS 42), footwear (HS 64), headgear (HS 65), and base metals (HS 83) in manufacturing (Chart III.1). In general, India bound its tariff at ceiling rates ranging from 40% for non-agricultural products to 100% for most agricultural products and 300% for edible oils. As a result of India's commitments, the final average bound tariff is expected to be 50.6% in 2005, with an average of 115.7% in agriculture (HS 1-24) and 37.7% in non-agricultural products (Table III. 1)14. These averages do not include lines where different parts of the HS six-digit line were bound at different rates (WTO 2002).The rectification and modifications of India's Schedule have resulted in an increase in a number of tariffs; however, they are not yet certified because of reservations raised. India has nevertheless, pursuant to Article XXVIII(3) of the GATT 1947, applied these higher rates. As a result, although most final bound tariffs are considerably higher than their corresponding current MFN rates, MFN rates on a few tariff lines appear to be higher than the final bound rate. The products concerned include milk and cream products, wheat and muslin, alcoholic products, and some fabrics (WTO 2002)
28
• Imports have also been made subject to various existing domestic regulations
like Food Adulteration Act and Rules there under, Meat Food Product Order,
Tea Waste (Control Order) and import of textile material using the
prohibited dyes has been banned.
• To ensure that import of agricultural products do not lead to unwanted
infiltration of exotic diseases and pests in the country, it has been decided to
subject imports of all primary products of plant and animal origin to ëBio
Security & Sanitary and Phyto-Sanitary Permití. Import of foreign liquor,
processed food products and tea wastes have been subjected to already
existing domestic regulations concerning health and hygiene.
Export promotion
To boost exports of farm goods, quantitative restrictions on exports of
agricultural items like wheat, wheat products, coarse grains, butter and non-
basmati rice and packaging restrictions on exports of pulses were removed in
February 2002. Export restrictions were removed on groundnut oil, agr icultural
seeds, wheat and wheat products, butter, rice and pulses from April 2002. Exim
policy 2002-07 has further liberalized the agriculture exports. Nevertheless,
agriculture sector requires further reforms to improve its productive efficiency
(Kalirajan, Mythili, and Sankar, 2001).
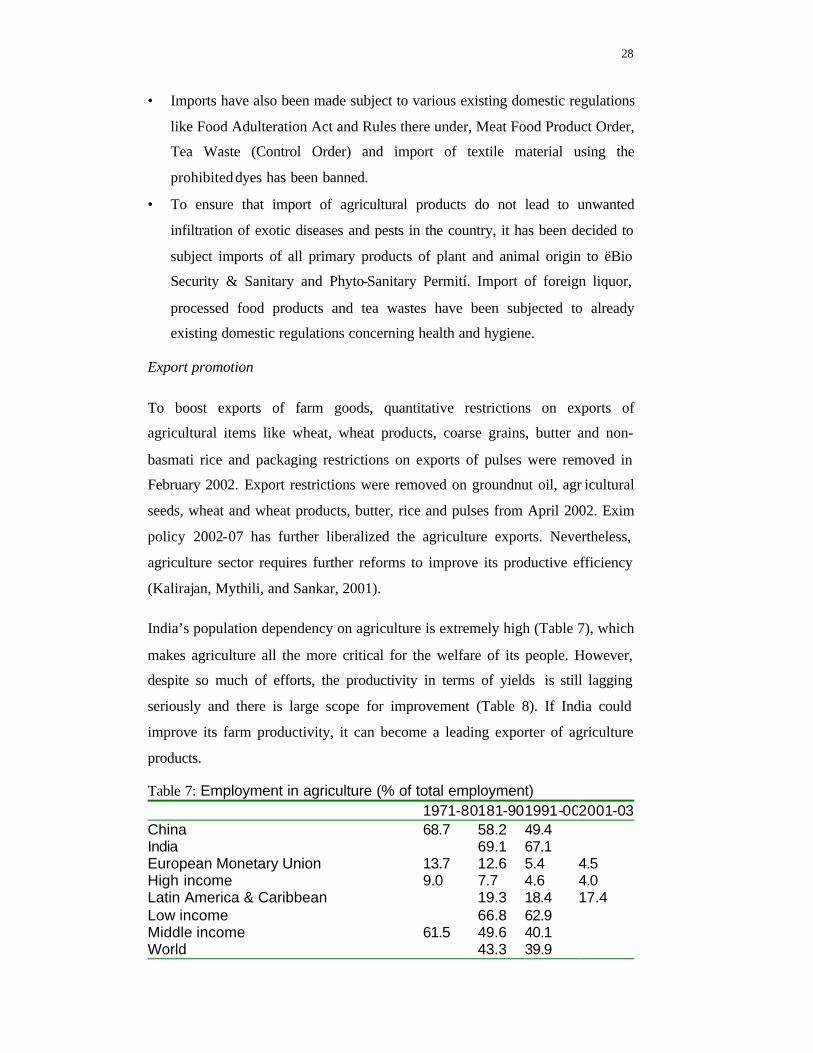
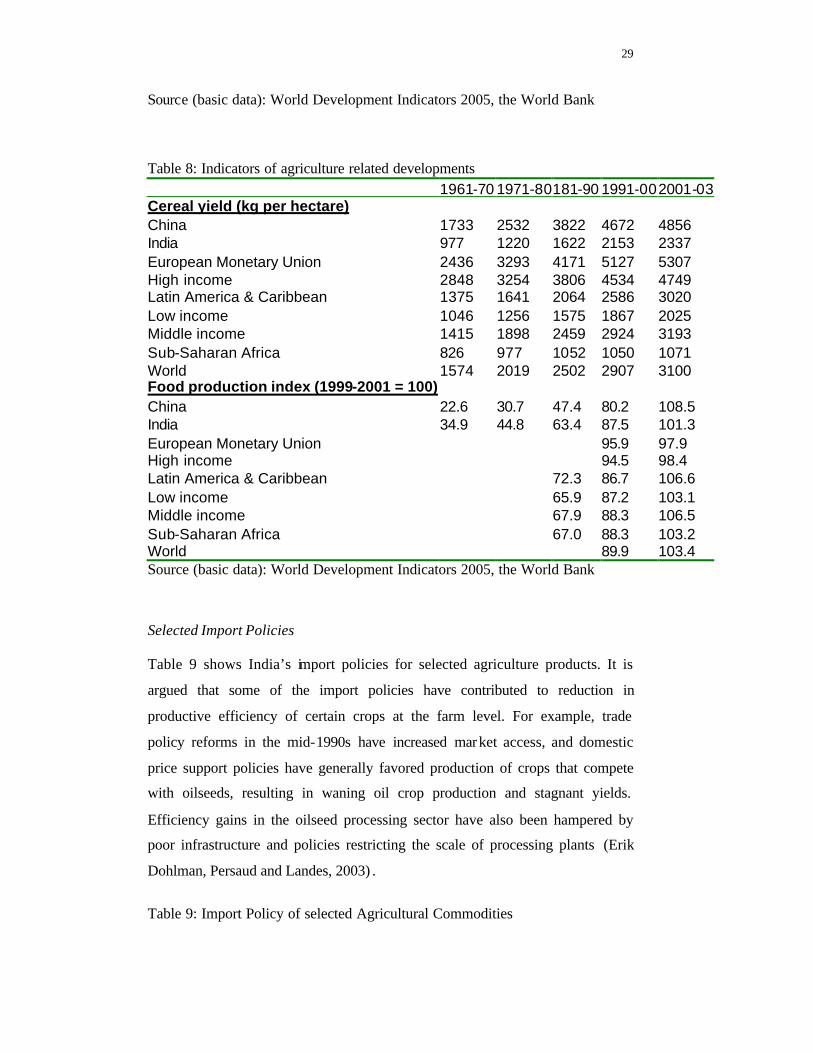
India’s population dependency on agriculture is extremely high (Table 7), which
makes agriculture all the more critical for the welfare of its people. However,
despite so much of efforts, the productivity in terms of yields is still lagging
seriously and there is large scope for improvement (Table 8). If India could
improve its farm productivity, it can become a leading exporter of agriculture
products.
Table 7: Employment in agriculture (% of total employment) 1971-80181-901991-002001-03China 68.7 58.2 49.4 India 69.1 67.1 European Monetary Union 13.7 12.6 5.4 4.5 High income 9.0 7.7 4.6 4.0 Latin America & Caribbean 19.3 18.4 17.4 Low income 66.8 62.9 Middle income 61.5 49.6 40.1 World 43.3 39.9
29
Source (basic data): World Development Indicators 2005, the World Bank Table 8: Indicators of agriculture related developments 1961-70 1971-80181-90 1991-00 2001-03 Cereal yield (kg per hectare) China 1733 2532 3822 4672 4856 India 977 1220 1622 2153 2337 European Monetary Union 2436 3293 4171 5127 5307 High income 2848 3254 3806 4534 4749 Latin America & Caribbean 1375 1641 2064 2586 3020 Low income 1046 1256 1575 1867 2025 Middle income 1415 1898 2459 2924 3193 Sub-Saharan Africa 826 977 1052 1050 1071 World 1574 2019 2502 2907 3100 Food production index (1999-2001 = 100) China 22.6 30.7 47.4 80.2 108.5 India 34.9 44.8 63.4 87.5 101.3 European Monetary Union 95.9 97.9 High income 94.5 98.4 Latin America & Caribbean 72.3 86.7 106.6 Low income 65.9 87.2 103.1 Middle income 67.9 88.3 106.5 Sub-Saharan Africa 67.0 88.3 103.2 World 89.9 103.4 Source (basic data): World Development Indicators 2005, the World Bank
Selected Import Policies Table 9 shows India’s import policies for selected agriculture products. It is
argued that some of the import policies have contributed to reduction in
productive efficiency of certain crops at the farm level. For example, trade
policy reforms in the mid-1990s have increased market access, and domestic
price support policies have generally favored production of crops that compete
with oilseeds, resulting in waning oil crop production and stagnant yields.
Efficiency gains in the oilseed processing sector have also been hampered by
poor infrastructure and policies restricting the scale of processing plants (Erik
Dohlman, Persaud and Landes, 2003) .
Table 9: Import Policy of selected Agricultural Commodities

30
Commodity Bound duty (%) (As on 01.01.2004)
Duty on Import (%) (As on 29.06.2001)
Basic customs duty (%) (As on 01.03.2005
Key Aspects of Import Policy
Rice 80 Up to 80 80 • Canalized through Food Corporation of India (FCI)
• *Rice with 50% or more broken is allowed freely.
Wheat 100 50 50 • Import is canalized FCI • Import by Roller Flour Mills (RFMs) was
also allowed freely till recently. • STC/ MMTC/PEC are permitted to
import wheat on behalf of RFMs. Maize 70 50 50 • Import is canalized through FCI and
PEC Ltd. • Import of maize for manufactures of
poultry and animal feed is permitted freely on actual user condition subject to registration of import contract/ letter of credit with NAFED.
• Import of maize for supply to poultry and animal feed manufactures and for starch industry up to 50,000 MT each by NAFED has been permitted.
Sorghum 80 50 80 • Import is canalized through FCI and PEC Ltd.
Barley 100 50 Free • Import is canalized through FCI and PEC Ltd.
Jowar 70 50 70 Import is canalized through FCI and PEC Ltd. Oilseeds (except Copra) 100 35 30 • Import is allowed freely. Rapeseed oil 75 35 75 • Import is allowed freely. Sunflower oil 300 35 85 • Import is allowed freely. Crude palm oil (edible grade)
300 75 80 • Import is allowed freely.
Soybean oil 45 38.5 45 • Import is allowed freely. Pulses 100 5 10 • Import is allowed freely. Sugar 150 60 60+CVD • Import is allowed freely Vegetables (except onion)
100 15 30 • Import is allowed freely.
Onion 100 0 5 • Import is allowed freely. Fruits (a) Dates 100 35 30 • Import is allowed freely. (b) Fresh Grapes 100 25 25 (c) Apples 50 50 50
Source: Agriculture statistics, Government of India (Various)
The import policy of the government with respect to sugar, which is one of the
internationally discussed product, and products like that are heavily influenced
by the domestic treatment of the product. In the case of sugar, as stated earlier,
the domestic producers are subjected to dual control. Part of the product is
subjected to price control while the price of key input the sugarcane is fixed by
the state governments in each of the 19 sugar producing regions of the country.
Clearly, in such a situation the domestic producers cannot be subjected to third
agony of matching the international price in the domestic market. Accordingly,
heavy duties are imposed on the imported sugar although the import itself is
under OGL with contracts registered with APEDA. The rate of duty again varies
31
according to the prevailing market prices because government cannot afford high
fluctuation in the market price of sugar. As such, sugar is subjected to
countervailing duty of Indian Rs. 850 (approximately, US$18) per tonne while
customs rates have varied between zero and 100 per cent during 19990s.
Cotton is another internationally strategic commodity, particularly in the United
States. For the export of cotton, the Government allocates quotas of raw cotton
with the bulk going to state agencies like CCI and MCGF, and the rest going to
state level marketing federations and private traders. Many a time, the state
agencies contract out these quotas to private traders for a commission (Bathla
2006). Import of cotton was allowed for exporting units directly after 1994.
Also, import of raw cotton was made free till 1999 (with no import duty) to
ensure easy availability of cotton at competitive prices for the Indian textile
industry. From March 1999, a duty of 5 per cent plus a surcharge of 1 0 per cent
has been imposed.
5. Conclusions
Though India has demonstrated that there exists broad political support to its
economic reform programme, as has been proved by the transition of several
Governments in the last decade through the political space, agricultural trade
policy reforms need to be accelerated much more than what has been done so
far. The challenge is to mitigate the inefficiency that exists in the Indian
agriculture to close the gap between its potential and actual performances
through a proper policy framework.
India being a net exporter in agriculture products, it has more to gain from the
trade reforms. It has sufficiently high bound rates on most of the products and
therefore, flexibility can be ensured against unfair competition. India does not
have to worry about its subsidy, as it is already below the required line and it
also does not have any domestic support to recon with. All these place India in
an advantageous position. Moreover, the ongoing negotiations are likely to yield
enough flexibility in product choice and tariff selection. A multilateral trading
system is in the interest of India, given the fact that it is placed in such a
situation where no clear group fits well. Therefore, India should work towards
32
the success of the Doha round and in the mean time make use of the opportunity
to reform its domestic market to bring in more efficiency.
The interests of India are certainly at variance from the common interest of least
developed countries, which became amply clear during the Tokyo and Doha
Ministerials, when the least developed countries left India alone. Many of these
countries are net importers of food and the subsidy in the exporting countries
makes them better off. Moreover, under the Everything But Arms (EBA)
initiative of the European Union, the LDCs have quota - and duty-free access to
the EU market9, a facility that was never available to India. The services sector
for India is critical to its growth and increasing the pace of industrial growth is
its necessity. With favourable bound rates for agriculture onboard, the
negotiating framework of India must be different from that of other developing
countries. The situation is highly tenacious for India, particularly in view of the
fact that the developed countries have managed to link agriculture subsidy with
the market access in services and industry. If the European Union needs to do
more on agricultural tariffs, and the US needs to do more on reducing
agricultural subsidies, then the G-20 group of countries, where India is a key
member, are also needed to do more on industrial tariffs. This is a hard ball
game. Moreover, all these issues are dynamically linked to the future agenda of
the WTO inter -alia in terms of substantial opening up trade in services; rules
governing transparency in bilateral trade agreements, anti-dumping and
subsidies; trade facilitation; trade & environment; WTO agreement on
Intellectual Property Rights (TRIPS) and its relation with Convention on Bio-
Diversity (CBD), and extensions to geographical indication protection (GIs);
Dispute Settlement and Aid for Trade.
Traditionally, India has fallen prey to the group dynamics because its interests
do not fully confirm to the least developed countries, whose cause it used to
champion nor does it radically differ from those of developed countries, who it
confronts. Therefore, the time has come for India to come out of ambiguity and
take a rational step in the negotiation process to harness best of its own interests.
Some sacrifices are worth taking in order to gain a wider market.
9 Currently, there are three exceptions: bananas, rice and sugar where quotas exist. But the quotas are slated to end between 2006 and 2008.

33
References
Anderson, Kym and Martin, Will (eds) 2005 Agricultural Trade Reform and the
Doha Development Agenda, New York: The World Bank and Palgrave
Macmillan.
Bathla, Seema 2006 'Trade Policy Reforms and Openness of Indian Agriculture:
Analysis at the Comodity Level', South Asia Economic Journal 7(1): 19-53.
Bhagwati, Jagdish 2005 'From Seattle to Hong Kong', Foreign Affairs December
2005 -- WTO Special Edition.
Birthal, P.S., Joshi, P.K. and Gulati, A. 2005 'High Value Food Commodities
and Vertical Coordination in India: Implications for Smallholders."' Toward
High-Value Agriculture and Vertical Coordination: Implications for
Agribusiness and Smallholders, National Agricultural Science Centre, Pusa,
New Delhi, 7 March 2005.
Cooper, Sarah Fitzgerald 2004 'A Tough Row to Hoe', Research Reports:
American Institute for Economic Research LXXI(18): 101-102.
Erik Dohlman, Persaud, Suresh and Landes, Rip 2003 'November 2003 India’s
Edible Oil Sector:
Imports Fill Rising Demand' Electronic Outlook Report from the Economic
Research Service, USDA, Vol. OCS-0903-01 (November) available at
www.ers.usda.gov.
Gershenson, Dmitriy, and Grossman, Herschel. 2000. "Civil Conflict: Ended or
Never Ending", Journal of Conflict Resolution, 44(6): 808-822.
Griswold, Daniel, Slivinsy, Stephen and Preble, Christopher 2006 'Six Reasons
to Kill Farm Subsidy and Trade Barriers: A no-nonsense Reform strategy',
February 2006 Edition: http://www.reason.com/phprint.php (download
13.04.2006).
34
Hirshleifer, David. 2001. "Investor Psychology and Asset Pricing", Journal of
Finance, 56(4): 1533-1597.
Kalirajan, K.P., Mythili, G., and Sankar, U. 2001. Accelerating Growth Through
Globalization of Indian Agriculture, New Delhi: Macmillan.
Kelch, David and Nirmile, Mary Anne 2004a 'European Union Adopts
Significant Farm Reforms', Electronic Outlook Report from the Economic
Research Service, USDA (www.ers.usda.gov/AMBERWAVES) WRS-04-07,
August 2004.
Khor, Martin 2005 'Imbalance Outcome', Economic and Political weekly 40(52):
Commentary.
Lamy, Pascal 2006 'The WTO and the Doha Round: The Way Foorward' Speech
at Indian Council for Research on International Relations (ICRIER), New Delhi,
April 06.
Muralidharan, Sukumar 2005 'Development Deficit Agenda of Doha Round',
Economic and Political weekly 40(52): Commentary.
Panagariya, Arvind 2004 'If this is success, what will be failure?', Economic
Times September 24, 2004.
Panagariya, Arvind 2005 'Liberalizing Agriculture', Foreign Affairs -- WTO
Special Edition December 2005.
Singh, Gurdev and Ashokan, S. R. 2001 'Impact of WTO on Indian (edible) Oil
Seed Sector', in S. K. Datta and S. Y. Deodhar (eds) Implications of WTO
Agreements for Indian Agriculture, New Delhi: Oxford University Press and
IBH Publishing Company Ltd.
WTO, 2002. Trade Policy Review of India , Geneva: World Trade Organisation.