independent boards and innovation - mack institute … · independent boards and innovation∗...
TRANSCRIPT

Independent Boards and Innovation∗
Benjamin Balsmeier†, Lee Fleming‡and Gustavo Manso§
January 14, 2015
Preliminary and Incomplete - Please Do Not Circulate
Abstract
Much research has suggested that independent boards of directors are more ef-fective in reducing agency costs and improving firm governance. Less clear, how-ever, is how independent boards influence innovation and innovation search strate-gies. Relying on regulatory changes that caused shareholders to appoint a major-ity of independent directors, we demonstrate how the transition to independentboards results in greater but less creative patenting. Firms that transition to inde-pendent boards are less likely to explore uncrowded and unfamiliar technologies.Such firms patent more and get more average citations to their patents, though theincrease comes only from patents in the middle of the citation distribution - thenumber of uncited and highly cited patents does not change. Consistent with thisresult, the coefficient of variation of citations to a firm’s patent portfolio decreaseswith a transition to an independent board. We argue that these effects are drivenby independent boards being less tolerant of failure and more likely to constrainthe manager’s strategic flexibility. The results are robust to alternate explanationssuch as increased managerial effort.
Keywords: Corporate Governance, Innovation, Patents, Board Composition, Indepen-dent Directors
JEL Classification: G34, L14, L25, M21
∗The authors thank Gabe Fierro and Guan-Cheng Li for invaluable research assistance. Balsmeier ac-knowledges financial support from the Flemish Science Foundation. This work is supported by NSF grant1360228; errors and omissions remain the authors’.
†University of Paderborn, Dept. of Management, and University of Münster, Institute for Organisa-tional Economics, Germany, email: [email protected]
‡Fung Institute for Engineering Leadership, University of California, Berkeley, USA, e-mail: [email protected]
§Haas School of Business, University of California, Berkeley, USA, email: [email protected]
1 Introduction
The board of directors has an important role in the governance of corporations. Charged
with overseeing and advising managers, it can effectively reduce agency costs that arise
from the separation of ownership and control.
Several authors have argued that independent directors, with no ties to the com-
pany other than their directorship, are better suited to perform this role as they can
credibly limit managerial discretion and are thus more likely to produce decisions
that are consistent with shareholder-wealth maximization (e.g. Fama and Jensen, 1983;
Williamson, 1983).
Such limited managerial discretion, however, may have unintended effects on cor-
porate innovation. A manager with limited discretion may be reluctant to engage in
exploratory projects, since the value of those projects depends on the flexibility to adapt
after observing outcomes (Manso, Balsmeier, and Fleming, 2015). Friendly boards, whose
interests are aligned with the manager, guarantee managerial discretion and may be
more effective in motivating exploration and innovation. On the other hand, managers
are less likely to explore under independent boards because of limited future flexibil-
ity. Exploration requires adaptability, but at any point in time, an independent board
may disagree with the manager about the best course of action. This lack of future flex-
ibility may cause the manager to eschew new exploration strategies in favor of extant
exploitation strategies.
Evidence for the model comes from observing search strategies for firms that were
forced by regulatory changes to adopt more independent boards. Starting in 1999, stock
exchanges and the Sarbanes-Oxley Act (SOX) required firms to have a majority of in-
dependent directors (for similar approaches, see Linck et al. 2009; Dunchin et al. 2010).
Comparing firms that changed from less to more independent boards against firms that
already had independent boards, we find increased output - but less exploration. Firms
whose boards become more independent patent more and receive more citations to
their patents, however, this effect is insignificant for uncited and highly cited patents.
Firms whose boards become more independent also work in more crowded and more
familiar technologies. The results are robust to inclusion of controls for greater effort
and efficiency and to greater focus on quantifiable results by the manager. The work
implies a more nuanced relationship between oversight and search; greater oversight
appears to lead to greater effort and output, but less innovative exploration.
1

2 Related Literature
A large literature studies the role and influence of board characteristics (for an overview
see Adams, Hermalin, and Weisbach, 2010; for the economic relevance of boards see
Ahern and Dittmar, 2012). Much of the literature focuses on the role of independent
board members (most recently e.g. Masulis and Mobbs, 2014; Brochet and Srinivasan,
2014). Several studies have analyzed how independent directors influence CEO com-
pensation (e.g. Faleye, Hoitash, and Hoitash 2011; Coles, Daniel, and Naveen, 2008; De-
nis and Sarin, 1999; Core, Holthausen and Larcker, 1999), CEO appointments and dis-
missals (Knyazeva, Knyazeva, and Masulis, 2013; Guo and Masulis, 2011; Borokhovich,
Parrino, and Trapani, 1996; Weisbach, 1988), adoption of antitakeover defenses (Brick-
ley, Coles, and Terry, 1994) or takeover premiums (Cotter, Shivdasani, and Zenner, 1997;
Byrd and Hickman, 1992). From these studies the picture emerges that independent
board members increase board oversight. Whether such intensified board monitoring
is beneficial or detrimental to shareholder wealth is much harder to answer though,
and the correct answer seems to depend on the complexity of a firm’s operations (Fal-
eye, Hoitash, and Hoitash, 2011; Duchin, Matsusaka, and Oguzhan, 2010; Nguyen and
Nielsen, 2010).
We investigate the effect of board independence on search and innovation processes.
Increased monitoring from independent boards may alleviate agency problems such as
shirking or empire building. However, by punishing managers after failure and lim-
iting managerial discretion, it may also stifle innovation. In contrast to conventional
projects, innovation is the result of experimentation with new ideas (Schumpeter, 1934;
Arrow, 1969; Weitzman, 1979). The central tension that arises with experimentation is
the one between “exploitation” and “exploration” (March, 1991). Because innovation
involves the exploration of untested approach, the optimal incentive scheme that mo-
tivates innovation exhibits substantial tolerance for failure (Manso, 2011). Moreover,
because exploration involves flexibility and adaptability, managerial discretion is es-
sential to induce managers to explore (Manso, Balsmeier, and Fleming, 2015).
Several recent papers empirically study how corporate governance affects innova-
tion, looking at determinants such as managerial compensation (Ederer and Manso,
2013; Baranchuk, Kieschnick, and Moussawi, 2014), firm’s going public decision (Bern-
stein, 2012), private equity/venture capital involvement (Lerner, Sorensen, and Stromberg,
2011; Tian and Wang, 2014; Chemmanur, Loutskina, and Tian, 2014), anti-takeover pro-
visions (Atanassov, 2013; Chemmanur and Tian, 2014), institutional ownership (Aghion,
Van Reenen, and Zingales, 2013), financial market development (Hsu, Tian, and Xu,
2014), conglomerate structure (Seru, 2014), analyst coverage (He and Tian, 2013), and
stock market liquidity (Fang, Tian, and Tice, 2013).
2

Almost all of this literature uses patent data to test their models. Raw patent counts
are usually supplemented by the number of citations that a patent receives, as this
measure correlates with financial and technical value (Harhoff 1999; Hall et al., 2005).
Though less common, measures of originality and generality (Hall, Jaffe, and Trajten-
berg 2001) have been used to measure breadth and impact of innovations, (see Lerner,
Sorensen, and Stromberg, 2011 and Hsu, Tian, and Xu, 2014).
Most similar to the current study, Faleye, Hoitash, and Hoitash (2011) find that mon-
itoring intensity, as proxied by independent director presence on boards and commit-
tees, correlates negatively with citation weighted patent counts. Kang et al. (2014) find a
positive correlation of social connections and assumedly "friendly" boards on the same
measure. Using a sample of German firms, Balsmeier, Buchwald, and Stiebale (2014)
show that executives serving as directors on other firms’ supervisory boards are posi-
tively correlated with the monitored firms’ patenting activities, as long their home firm
is innovative itself.
The current study refines these results with more nuanced measures and an inves-
tigation of the full distribution of citations. Using quantile regression models, we show
that a transition to independent boards results in an increase in citations in the mid-
dle of the distribution but has no effect on the tails. We also demonstrate a decrease in
the coefficient of variation of citations to a firm’s patents, for firms that transition to an
independent board. These results are consistent with a focus on extant and currently
productive technology, at the expense of exploring new areas that are more likely to
either completely fail or become a breakthrough (such patents would assumedly either
receive no citations or a great many citations). We also investigate the rate of prior and
self citation, along with Jaffe’s (1986) measure of technological proximity, to demon-
strate greater patenting in more crowded areas and areas that the firm has previously
patented within.
3 Identification strategy
Identification for our study relies upon regulatory changes that forced public firms to
increase the presence of independent directors on their boards in the early 2000s. The
effects of those regulatory changes on variables other than innovation have been ana-
lyzed elsewhere (see e.g. Linck et al. 2009; and Dunchin et al., 2010, for a setup that is
most similar to ours). In this section, we briefly describe the regulatory framework that
is relevant to our analysis.
Initiated by recommendations of the Blue Ribbon Committee (BRC) in 1999, stock
market rules of the NYSE and Nasdaq have been built upon the assumption that inde-
pendent board members are better able to monitor managers. Subsequent to the BRC
3
recommendations, the Securities and Exchange Commission (SEC) approved new cor-
responding rules in December 1999, requiring public firms to move to a fully inde-
pendent audit committee with the next re-election or replacement of audit committee
members. Further motivated by prominent corporate scandals, e.g. Enron, this rule was
written into U.S. law in 2002 as a part of the Sarbanes-Oxley Act (SOX). It was followed
by subsequent NYSE and Nasdaq regulations in 2003 that imposed even stricter re-
quirements on board composition. In addition to having an audit committee composed
of merely independent directors, both stock exchanges forced firms to have a majority
of independent directors as regular board members, and the compensation and nomi-
nation committees had to consist of 100% independent board members (>50% if firms
are listed on Nasdaq only).
Definitions of director independence vary slightly across each rule. SOX states in
section 301 that a given director is independent if the person does not “accept any con-
sulting, advisory, or other compensatory fee from the issuer” (except for serving the
board), and is not an “affiliated person of the issuer or any subsidiary” (NYSE speaks
of “no material relationship”; and Nasdaq requires no relationship that would interfere
with “independent judgment”). The NYSE and Nasdaq regulations are strict. The inde-
pendence assumption is already violated, for instance, if a director him- or herself or a
direct family member was an employee of the firm during the previous three years, or
a family member works for a third firm with which the given firm has a professional
relationship, or a family member is connected to the firm’s auditor.
These regulations made board changes necessary for a large group of firms. The
number and fraction of independent board members was fairly stable until the year
2000. With the described board regulations becoming effective, more and more inde-
pendent directors were appointed to corporate boards. Figure 1 illustrates the changes
in board composition for the sample of firms used in our study. It resembles a pattern
that has been documented in other studies for differing sets of public firms (e.g. Linck
et al., 2008, and Dunchin et al., 2010). A detailed description of the sample composi-
tion is provided below (section 4). Board composition data are taken from the Investor
Responsibility Research Center (IRRC). From 1996 to 2006 the IRRC tracked individual
board members of all major public U.S. firms and indicated in their database whether
an individual board member is independent, an employee of the firm or otherwise af-
filiated (former employee, employee of an organization that receives charitable gifts
from the company, employee of a customer or supplier to the company, relative of an
executive director, etc.).
Reflecting the previously introduced regulatory changes, Figure 1 shows an increase
of independent director presence on corporate boards from 2001 to 2006. Theoretical
considerations about board control suggest that a crucial difference arise when a board
4
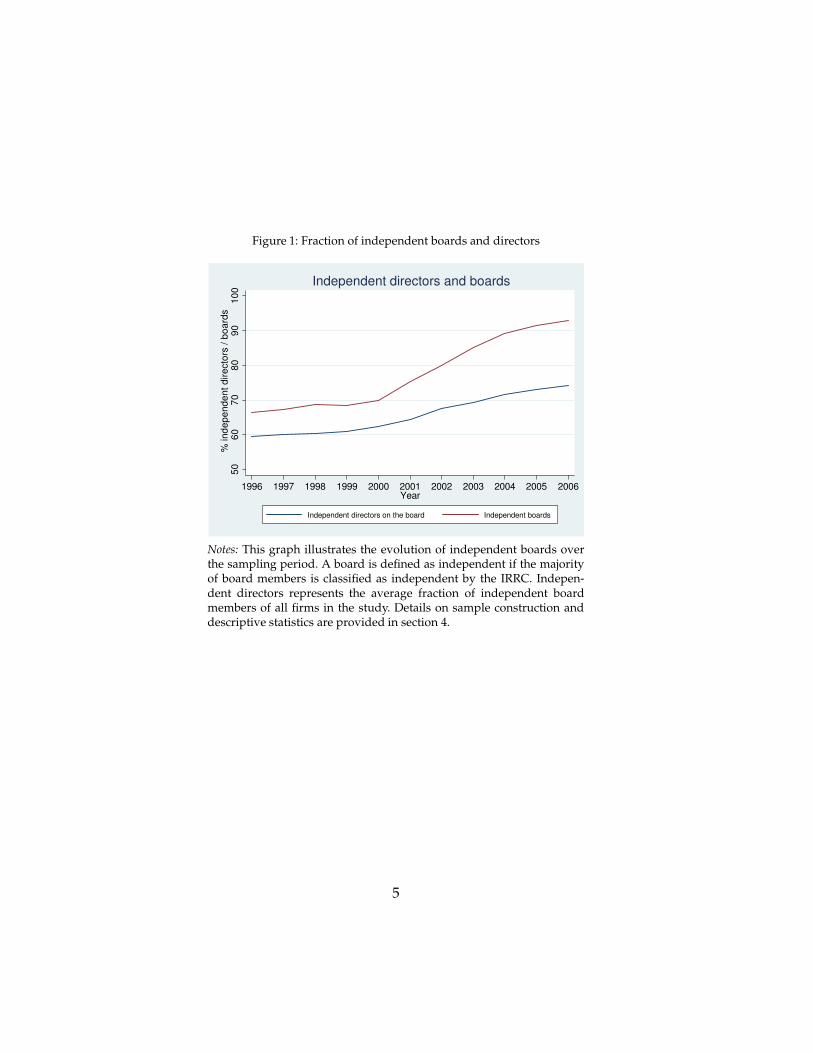
Figure 1: Fraction of independent boards and directors
50
60
70
80
90
10
0%
in
de
pe
nd
en
t d
ire
cto
rs /
bo
ard
s
1996 1997 1998 1999 2000 2001 2002 2003 2004 2005 2006Year
Independent directors on the board Independent boards
Independent directors and boards
Notes: This graph illustrates the evolution of independent boards overthe sampling period. A board is defined as independent if the majorityof board members is classified as independent by the IRRC. Indepen-dent directors represents the average fraction of independent boardmembers of all firms in the study. Details on sample construction anddescriptive statistics are provided in section 4.
5

switches from a minority to a majority of independent board members (Harris and
Raviv, 2008).1 It was further an explicit requirement of regulatory reforms. Thus, our
analysis focuses on this variable. Our data shows that the proportion of firms with a
majority of independent board members stayed rather stable around 68% before 2000
and moved up to about 94% by 2006.
Our empirical identification of the relationship between board independence and
innovative firm activities stems from the difference between firms, who were already
in compliance with the regulatory changes before 2001 (results are robust to taking later
years or 2000 as a threshold value), and those firms who switch to a majority of inde-
pendent directors (hereafter also referred to as an ‘independent board’) after regulatory
changes became affective. Hence, all firms that were not required to change their board
serve as a control group. In line with Dunchin et al. (2010), we define firms as treated
when they switch to an independent board after 2000 and have an audit committee
that contains 100% independent board members. The latter requirement helps to sort
out potential voluntary switches, increasing the amount of truly exogenous increases
of independent board members and making our main variable of interest less likely to
be confounded by endogenous choice. The fraction of independent directors increased
by 25% during 2001 to 2006 by noncompliant firms and by 9% with firms that fulfilled
the regulatory requirements already before 2000.
4 Sample selection
The dataset we built up for our study is determined by the joint availability of data
on the composition of corporate boards and committees from the IRRC, information on
basic firm characteristics from Compustat, and patent data from the NBER, the Fung In-
stitute and the USPTO. The IRRC provides data on corporate board members for 3000
major public U.S. based firms from 1996 to 2006. Compustat has further information
on almost all of the firms covered by IRRC. A major challenge for the empirical re-
searcher interested in those firms’ innovative activities is the identification and compi-
lation of the corresponding patent portfolios. Researchers involved in the NBER patent
data project have spent significant amounts of resources to identify patents that have
been granted to U.S. based firms. The NBER patent database contains, however, only
1The fraction of independent board members provides more variation but has two major disadvan-tages. First, considering board voting behavior, it is likely that the influence of independent directors onboard oversight does not linearly increase with the number or fraction of independent members but ex-hibits a jump when independent directors gain or lose the majority of votes. Second, the switch from aminority to a majority of independent directors was an explicit requirement of regulation, such that it ismuch more likely that observed changes in that regard happened involuntarily, which in turn improvesthe identification of causal effects.
6

those patents that have been granted through 2006. Due to the time lag with which in-
ventions are granted property rights (1-5 years) and the publication of corresponding
data by the USPTO, this results in significantly truncated patent application data for all
years after 2001. Researchers have found ways to use incomplete patent data for the
years 2002 to 2006, exploiting the distribution of applications before 2002, but those ap-
proaches add noise to econometric analyses, and lead to significant estimation errors
in our case, because our sample of board data covers 50% of years for which the NBER
data is severely truncated. The issue becomes even more prevalent if researchers want
to take citations to patents into account that often occur several years after a patent
has been granted. In terms of patent applications, the NBER data misses 18 percent of
patent applications of U.S. based assignees identified in 2002, rising to 99 percent by
2006.2
Recently available disambiguations provide (see Fiero et al., 2014) detailed data for
all patents granted by the USPTO. These data enable us to overcome the truncation of
the NBER patent database and identify comprehensive patent portfolios of the firms in
our sample up to the year 2007.3 Following the literature (e.g. He and Tian 2013), we as-
sign an eventually granted patent to the year it was applied for. Since patent documents
do not contain a unique identifier of assignees, one of the major obstacles that had to
be solved was the match of firm names that appear in our sample with firm names that
appear in ambiguous forms on the patent documents. Matching firm names between
databases thus requires significant amounts of resources if done manually. The issue
becomes obvious if one considers all patents that have been filed by U.S. based pub-
licly listed firms (>500k). Hence, analyzing innovations of a relatively small amount of
firms, using recent patent data, can become a labor-intensive challenge, and the disam-
biguation of assignee names as they appear on the patent documents alone will often
not be sufficient. For individual researchers the costs and the time needed for data col-
lection, cleaning and preparation, quickly exceed available capacities. Moreover, after
disambiguating the assignee names as they appear on the patent documents, it is often
necessary to aggregate patent data at the firm level and merge those aggregated num-
bers to other databases, like Compustat and IRRC. Given the high costs involved, most
research that requires both large scale patent and firm level data still solely relies on the
NBER patent database, restraining the analysis to periods ending latest in 2001.
We extended the reach of the NBER patent database by combining it with USPTO
and Fung Institute data, including patent citations and other detailed information within
2The numbers are derived by comparing all patent applications in the NBER database with all patentsin the Fung Institutes database as published in April 2014.
3We gather patent data through 2007, because we will estimate regressions of firms’ patenting activitiesin year t on board data and controls in t-1, reflecting that patenting activities need some time to be influ-enced by boards and simultaneous determination of variables may otherwise confound the estimation.
7

each patent document. We started with standardized assignee names provided by the
USPTO for all patents granted through December 31, 2012. These standardized assignee
names are largely free of misspellings but still contain many name abbreviations for
individual firms. The crucial advantage of the standardized USPTO assignee names
is that they are re-appear throughout time and have been used by the NBER patent
project team to disambiguate firm names. For almost all US firms that received at least
one patent between 1975 and 2006 the NBER provides a unique time invariant assignee.
We took all variations of standardized assignee names that belong to a given single firm
as a training set, and gave all granted patents that appear with the same standardized
assignee name the same unique NBER identifier.4 These information enabled us to track
firms’ patenting activity over significantly longer time periods, overcoming truncation
issues of patent applications and generally increasing the accuracy of available patent
portfolios.
Finally, we merged unique time invariant Compustat identifiers to the patent as-
signee identifiers as they are provided by the NBER. It is worthwhile to note that in
our analysis we take only those firms into account for which the NBER has identified
Compustat matches, and we assigned zero patents only to those firms where the NBER
team searched for but could not find matches with any patent. In this regard we devi-
ate from other studies that assign zero patents also to those firms that have not been
tested to appear as a patent assignee or not. Thus, we avoid measurement errors at the
expense of a smaller but more accurate dataset.
In order to circumvent potential selection effects to confound our estimation of
the relationship between board independence and innovation, we further removed all
firms that appear only before the year 2000 or entered the sample in the year 2000 or
later, such that the remaining firms can be observed over a timespan where the previ-
ously described regulatory changes took place. Finally, we arrive at a sample of 6107
observations on 799 firms observed during the period from 1996 to 2006 for which we
could gather all information of interest. All firms in the sample combined have applied
for 328,463 patents during the sample period.
4.1 Measuring innovative search
An extensive literature on corporate governance and innovation has used patent data
to measure innovation (e.g. Atanassov, 2013; He and Tian, 2013). Raw patent counts are
usually supplemented by the number of citations that a patent receives, as this measure
correlates with financial and technical value (Harhoff 1999; Hall et al., 2005). Though
less common, measures of originality and generality (Hall, Jaffe, and Trajtenberg 2001)
4Based on the first assignee that appears on the patent document. It allowed us to identify ~250k addi-tional patents granted to U.S. based assignees after 2006.
8

have been used to measure breadth and impact of innovations (see Lerner, Sorensen,
and Stromberg, 2011 and Hsu, Tian, and Xu, 2014).
To be comparable with the extant literature we will show how board independence
influences patent counts and citations. Raw patent counts and citations are, however,
of limited use to identify differences in innovative search, specifically towards more or
less exploration, which is essential to test the implications of our argument. Therefore,
we introduce new measures that are based on further, so far largely unaccounted, infor-
mation contained in each patent document (for a detailed introduction and descriptive
analysis see Manso, Balsmeier and Fleming 2015). Those patent metrics will serve as
additional dependent variables beside raw patent counts and citations, enabling us to
draw a consistent picture of how board independence affects not only the rate of inno-
vation but also the direction of innovation.
First, we calculate the number of citations that each patent makes to other patents.
An increase in the number of backward citations reflects direct relations to more prior
art that must be specified in the patent application (required by law). This correlates
with innovative search in relatively better-known and mature technological areas.
Second, we take the number of times a given patent cites other patents owned by the
same company. More self-cites indicate constraining search within previously known
areas of expertise while fewer self-citations indicate a broadening of innovative search
or efforts to explore areas that are new to the firm (Sorenson and Stuart, 2000).
Third, supplementing the analysis of differences in backward citations, we calculate
the number of patents that are filed in technology classes previously unknown to the
firm. Unknown patent classes are defined as those in which a given firm has not applied
for any patent beforehand (starting in 1976). The counter part is the number of patents
applied for in known classes. A more sophisticated measure of whether firms stay or
deviate from known research areas is the technological proximity between the patents
filed in year t and the existing patent portfolio held by the same firm up to year t-1. We
calculate this measure according to Jaffe (1986). It can formally be written as:
Pit =K
∑k=1
fikt fikt−1/
(
K
∑k=1
f 2ikt ·
K
∑k=1
f 2ikt−1
)12
where fikt is the fraction of firm i’s patents that belong to patent class k at time t, and
fikt−1is the fraction of firm i’s patent portfolio up to t-1 that belongs to patent class k.
Pitranges between 0 and 1. The highest possible value indicates that the patents filed in
year t are distributed across patent classes in the exact same way as the portfolio of all
patents of the same firm up to the previous year.5 Positive coefficients in a regression
5Reflecting that a value of one indicates no change, the measure takes value one if no patent was applied
9

would thus indicate a more narrow innovation trajectory within known areas.
Fourth, following Azoulay, Graff Zivin and Manso (2011) we categories patents ac-
cording to how many citations they have received relative to other patents that have
been applied for in the same technology class and year. We count a patent as a top 1%
(10%) patent, if the patent falls into the highest percentile (centile) of the citation dis-
tribution in the same technology class and application year of all US patents. Further,
we separately count all patents that received no citation at all and all those patents that
have received at least one citation but do not fall in the top 10% category. We expect
that firms that search more narrowly, i.e. increase exploitation (decrease exploration),
receive patents that are either moderately successful (citations mainly in the middle of
the distribution) or flops (zero cites).
Finally, we estimate the variation of citations over time before and after a board be-
came independent by calculating the variation coefficient of future citations over both
time spans. More narrow search in known areas (increased exploitation) should coin-
cide with lower variation of cites as breakthroughs, which usually receive very high
numbers of future citations, are less likely to occur.
4.2 Control variables
Following the extant literature, we control for a vector of firm characteristics that could
confound the relation between board independence and a firm’s innovative search and
success.6 We compute all variables for firm i over its fiscal year t. Board size measures the
number of board members as we want to insulate the effect of board independence from
contemporary changes in the number of directors. Further, we found that the firms in
our sample differ significantly in terms of R&D spending over total assets and firm size
as measured by total assets - two variables that are naturally positively related to firms’
innovation activities. In order to reduce the skewness in total assets we take the loga-
rithm of total assets in all multivariate econometric analyses. In addition, we control for
firm age (the number of years since the initial public offering date), as older firms may
search in older technological areas. Moreover, leverage (long term debt over total assets)
and capital expenditures (scaled by total assets) account for financial constraints that are
known to harm corporate innovation. Finally, Tobin’s Q enters the regression to control
for differences in growth opportunities.
for in a given year. All results presented below are robust to excluding non-patenting firms.6All results presented below are robust to including different or additional control variables that have
been employed by other studies, e.g. Galasso and Simcoe (2011).
10

4.3 Summary statistics
Table 1 presents summery statistics on the dataset. The patenting activities of the firms
in our sample show the typical skewness with a mean of ~54 patents and a median of
3 patents. Related measures like the amount of R&D investment and citation-weighted
patent counts reveal similar distributions and high concentrations among the most ac-
tive firms. We calculated the number of patents that cite a given patent based on all
US granted patents by April 2014. Although most citations appear during the first five
years after application, the number of citations falls naturally from 1996 to more recent
years. In our estimations we employ time fixed effects to account for these differences
across time that presumably concern all firms equally on average (see also Atanassov,
2013; and Hall, Jaffe, and Trajtenberg, 2001). 680 firms (85%) have applied for at least
one patent during the sampling period.7 The average firm has filed 0.5 (5.0 patents)
in the top 1% (10%) category, 18.1 patents that are never cited and 30.6 that appear in
the middle of the citation distribution. Similar to the number of cites received in the
future, the number of backward citations is quite large on average with 1157.2 cites
(median 26). On average, 176.6 of those backward citations relate to patents that belong
to the same firm (median 0). Further, 1.3 patents are filed in new to the firm technol-
ogy classes, while 52.5 are filed in known classes. The average technological proximity
measure is 0.53.
Regarding other variables of interest, the average firm in our sample shows the
following characteristics: it is 17.8 years old, has 9 board members, a book value of
assets of $7 billion, a R&D to assets ratio of 4.8%, a leverage ratio of 18.2%, capital
expenditures over total assets of 5.3%, and a Tobins Q of 1.2.
4.4 Methodological remarks
In order to analyze how a switch to an independent board affects innovative search
and success we follow the literature on corporate governance and innovation (e.g.
Atanassov, 2013; He and Tian, 2013; Kortum and Lerner, 2000) and estimate the baseline
model in OLS:
log(1 + patentsi,t+1) = β0 + β1 · independentboardit · postt + γ · Zit + θt + αi + ǫit
where patentsi,t+1 is the number of eventually granted patents of firm i applied for
in year t+1. In alternative regressions we will exchange the number of patents with
our previously introduced measures of innovation that allow us to assess the firms’
7The results presented below are robust to excluding non-patenting firms from the analysis.
11
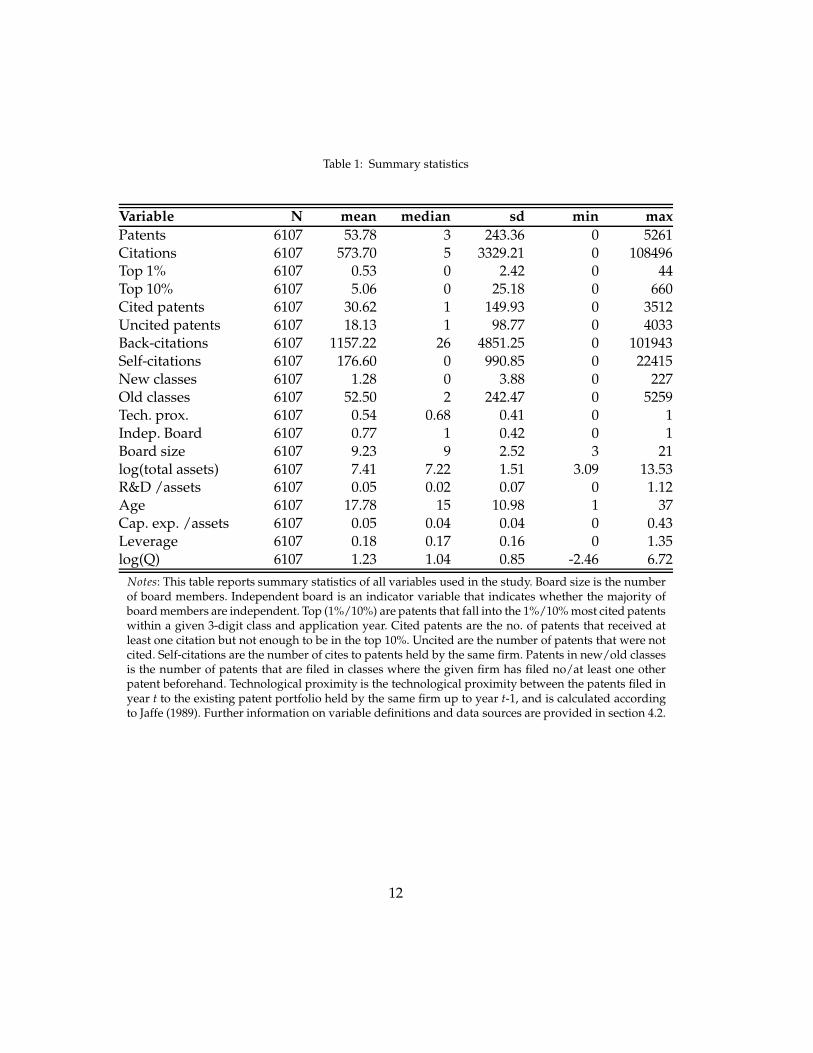
Table 1: Summary statistics
Variable N mean median sd min max
Patents 6107 53.78 3 243.36 0 5261Citations 6107 573.70 5 3329.21 0 108496Top 1% 6107 0.53 0 2.42 0 44Top 10% 6107 5.06 0 25.18 0 660Cited patents 6107 30.62 1 149.93 0 3512Uncited patents 6107 18.13 1 98.77 0 4033Back-citations 6107 1157.22 26 4851.25 0 101943Self-citations 6107 176.60 0 990.85 0 22415New classes 6107 1.28 0 3.88 0 227Old classes 6107 52.50 2 242.47 0 5259Tech. prox. 6107 0.54 0.68 0.41 0 1Indep. Board 6107 0.77 1 0.42 0 1Board size 6107 9.23 9 2.52 3 21log(total assets) 6107 7.41 7.22 1.51 3.09 13.53R&D /assets 6107 0.05 0.02 0.07 0 1.12Age 6107 17.78 15 10.98 1 37Cap. exp. /assets 6107 0.05 0.04 0.04 0 0.43Leverage 6107 0.18 0.17 0.16 0 1.35log(Q) 6107 1.23 1.04 0.85 -2.46 6.72
Notes: This table reports summary statistics of all variables used in the study. Board size is the numberof board members. Independent board is an indicator variable that indicates whether the majority ofboard members are independent. Top (1%/10%) are patents that fall into the 1%/10% most cited patentswithin a given 3-digit class and application year. Cited patents are the no. of patents that received atleast one citation but not enough to be in the top 10%. Uncited are the number of patents that were notcited. Self-citations are the number of cites to patents held by the same firm. Patents in new/old classesis the number of patents that are filed in classes where the given firm has filed no/at least one otherpatent beforehand. Technological proximity is the technological proximity between the patents filed inyear t to the existing patent portfolio held by the same firm up to year t-1, and is calculated accordingto Jaffe (1989). Further information on variable definitions and data sources are provided in section 4.2.
12

innovative search and success in more detail.8 Our main explanatory variable of inter-
est is a dummy that indicates whether a given firm has switched from a minority to
a majority of independent board members in the year 2001 or later when regulatory
changes became effective. Under the assumption that changes in patenting by firms
that switched to a majority of independent board members have been comparable to
changes in patenting by other firms in the absence of a switch to an independent board
β1 captures the effect of board independence on innovation by the affected firms.9 Zit is
a vector of the previously introduced firm characteristics, and year fixed effects θt con-
trol for changes in the macroeconomic environment and systematic changes in patent-
ing activities over time. Our preferred specifications include firm fixed effects αi that
control for any unobserved firm heterogeneity that is time invariant. Hence, we basi-
cally estimate a DiD model, where those firms that switch form a minority to a majority
of independent directors on the board after 2000 are the ‘treated firms’, and all others
are ‘non-treated firms’. In order to unravel the influence of firm fixed effects in our re-
gressions we also show alternative models with industry fixed effects, based on 3-digit
SIC industry dummies, instead of firm fixed effects. To stay within the DiD framework,
we include a dummy variable that marks all treated firms in regressions without firm
fixed effects.
Identification hinges in all models upon the parallel trend assumption, stating that
treated and non-treated firms show similar trends in the depended variable of interest
in the absence of treatment. In order to support the satisfaction of this assumption, be-
low we present estimates of the dynamics of the treatment effect, proving that the DiD
estimator is statistically not significantly different from zero in the absence of treatment.
Our estimation might still be biased, however, if other remaining cross-sectional
heterogeneity of the firms in our sample change systematically with the change to an in-
dependent board and our measures of innovative search. In order to minimize concerns
in this regard, we further re-estimate all our models based on a balanced sample, where
treated and non-treated firms are comparable in terms of key observable characteristics
8In case the dependent variable is a count, all results are robust to alternatively estimating Poissonregressions (not tabulated).
9As can be seen in Figure 2, not all firms switched from a friendly to an independent board at the sametime, because directors were allowed to fulfill their contracts that were signed before the law change. Inprincipal, this gives firms room for strategic choice that could confound our identification. Therefore, wechecked whether the time between the law change and compliance is correlated with pre-SOX innovativeactivity of the firms in our sample. In order to test this, we first defined a variable that measures the yearsuntil the board actually changed from friendly to independent although SOX and other regulations werealready active (2003). We found 17 firms with a one year lag, 14 with a two year lag and 8 with a threeyear lag. Then, we regressed time lag until compliance on firms’ average amount of R&D, patents and citesbefore 2001 (results are robust to taking 2000 or 2002 instead). As we did not find any significant correlationbetween compliance lags and pre-treatment innovative activity, we are confident that our estimation is notbiased by systematic choice of more or less innovative firms to switch later or earlier.
13

before 2002. To achieve a balanced sample we use ‘Coarsened Exact Matching’ (CEM)
(Blackwell et al., 2009).10 CEM has several features that bound the degree of model de-
pendence, reduce causal estimation error, bias, and inefficiency (Iacus, King, and Porro,
2009a, 2009b, 2011). Younge et al. (2014) and Azoulay, Zivin, and Wang (2010) apply
CEM to an empirical setting that is similar to the present one. Based on CEM’s coarsen-
ing function we match treated and non-treated firms on the joint distribution of firms’
R&D spending over total assets, firm size as measured by the natural logarithm of total
assets, the natural logarithm of Tobin’s Q, boardsize and 26 two-digit SIC industry code
dummies. We took the average values of those variables over the years 2000 and 2001 as
matching criteria to ensure highest comparability before treatment.11 Table 2 presents
the differences in mean values of all control variables before and after the matching
procedure.
Panel A and B of Table 2 show that treated firms in the full sample are on average a
little smaller, invest less in R&D and have a smaller board. Except with regard to R&D
spending, the relative differences of the two firm groups appear small in magnitude.
Both firm groups are not statistically significant with regard to the mean values of the
other control variables that have not explicitly been included in the matching. In or-
der eliminate any statistically significant differences of observable firm characteristics,
while keeping as many treated firms as possible in the sample, we ran CEM with the
side condition to differentiate firms according to ten categories of R&D spending and
three categories of firm size, board size and Tobin’s Q. Based on this procedure, for 4
out of the 125 treated firms we could not find any proper match . For the remaining
121 treated firms, CEM selected 430 comparable firms, i.e. 158 incomparable firms are
subsequently discarded from the analysis. Panel B of Table 2 shows that, after match-
ing, there are no statistically significant differences between the treated and non-treated
firms according to two sided t-tests. Although not necessary for a consistent DiD esti-
mation, it is worthwhile to mention that both firm groups do not differ in terms of the
average amount of applied patents after matching.
While balancing the sample should improve identification (at least for firms that are
similar to the treated firms), potential remaining differences in innovation trends might
still have an influence on the estimation. Therefore, we also estimate models that allow
for separate firm specific linear trends in innovation before 2002, using the following
10In alternative models we balanced the sample based on propensity score matching, taking only thenearest neighbor of each treated firm as a control, and find qualitatively the same results.
11The results are robust to taking all available observations before 2001 into account.
14
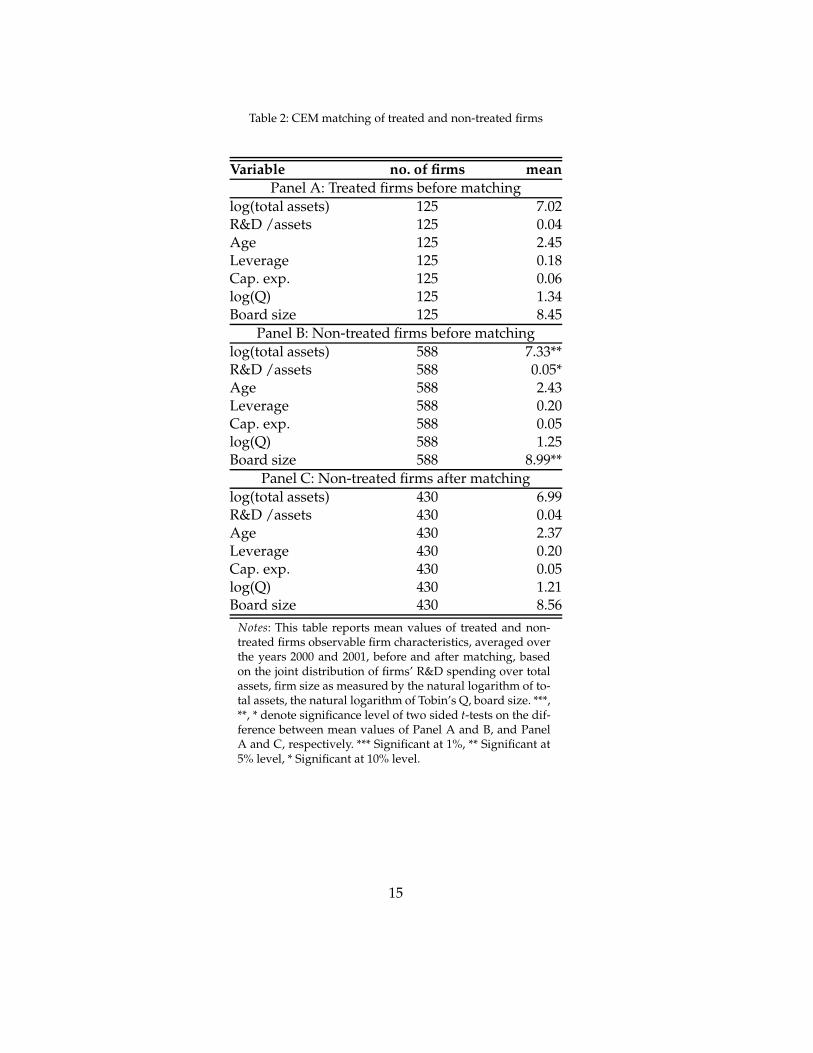
Table 2: CEM matching of treated and non-treated firms
Variable no. of firms mean
Panel A: Treated firms before matching
log(total assets) 125 7.02R&D /assets 125 0.04Age 125 2.45Leverage 125 0.18Cap. exp. 125 0.06log(Q) 125 1.34Board size 125 8.45
Panel B: Non-treated firms before matching
log(total assets) 588 7.33**R&D /assets 588 0.05*Age 588 2.43Leverage 588 0.20Cap. exp. 588 0.05log(Q) 588 1.25Board size 588 8.99**
Panel C: Non-treated firms after matching
log(total assets) 430 6.99R&D /assets 430 0.04Age 430 2.37Leverage 430 0.20Cap. exp. 430 0.05log(Q) 430 1.21Board size 430 8.56
Notes: This table reports mean values of treated and non-treated firms observable firm characteristics, averaged overthe years 2000 and 2001, before and after matching, basedon the joint distribution of firms’ R&D spending over totalassets, firm size as measured by the natural logarithm of to-tal assets, the natural logarithm of Tobin’s Q, board size. ***,**, * denote significance level of two sided t-tests on the dif-ference between mean values of Panel A and B, and PanelA and C, respectively. *** Significant at 1%, ** Significant at5% level, * Significant at 10% level.
15

specification:
log(1 + patentsi,t+1) = β0 + β1 · independent boardit · postt + γ · Zit
+ δ · f irmi · pre2002t · t + θt + αi + ǫit
where pre2002t equals one if the year of observation is 2001 or earlier.
Finally, in alternative specifications we further control for potential systematic changes
in the influence of our controls on innovation after 2001, which may coincide with
changes in board independence, by estimating:
log(1 + patentsi,t+1) = β0 + β1 · independent boardit · postt + γ · Zit
+ δ · f irmi · pre2002t · t + ζ · Zit · postt + θt + αi + ǫit
5 Results
First, we present results on innovation measures that have frequently been used by the
extant literature on corporate governance and innovation.
5.1 R&D, patents, and citation-weighted patents
Tables 3 to 5 estimate regressions of firms’ R&D investments, the number of eventually
granted patents applied for, and the number of citation-weighted patent applications.
Each table contains 5 specifications of the same model. Specification (a) is a standard
OLS model with industry fixed effects, specification (b) is a standard firm fixed effects
model, specification (c) is the same as (b) but estimated on the previously described
balanced sample, specification (d) adds trend controls, and specification (e) adds inter-
action terms of all controls with a post SOX marker. The first model assesses potential
changes in R&D investments after board independence changed, which might drive
subsequent changes in patenting.12 The latter two models provide a simple differenti-
ation between a change in the number of patents and a change in the quality of those
patents. Cite-weighted patent counts have been frequently used in the literature to as-
sess the value of firms’ innovations, because previous studies have shown that cita-
tions by other patents are positively correlated with firms’ value and patent renewals
(Harhoff 1999; and Hall et al., 2005).
Table 3 illustrates that a transition to an independent board is unrelated to the level
of firms’ R&D investments. In contrast, Tables 4 and 5 illustrate how patenting and
12Alternative regressions with R&D investments scaled by total assets reveal a significant positive effectonly in specifications without firm fixed effects. Inclusion of controls for time invariant firm heterogeneityleads to statistically insignificant results.
16

Table 3: Independent boards and R&D
(a) (b) (c) (d) (e)b/se b/se b/se b/se b/se
log(total assets) 0.822*** 0.564*** 0.601*** 0.609*** 0.602***(0.017) (0.044) (0.040) (0.049) (0.049)
log(age) -0.153*** 0.002 -0.006 -0.017 -0.013(0.021) (0.029) (0.038) (0.056) (0.054)
Leverage -0.562*** 0.040 -0.085 -0.211 -0.462**(0.113) (0.107) (0.124) (0.152) (0.212)
Cap. exp. 0.753 0.562 0.542 0.378 0.820(0.616) (0.351) (0.391) (0.431) (0.518)
log(Q) 0.366*** -0.016 -0.015 -0.014 0.022(0.025) (0.024) (0.029) (0.032) (0.035)
Boardsize 0.024** 0.007 0.004 0.006 -0.004(0.009) (0.008) (0.011) (0.013) (0.014)
Independent board 0.071 -0.052 -0.057 -0.059 -0.043(0.090) (0.055) (0.056) (0.064) (0.061)
Observations 6107 6107 4414 4414 4414R2 0.733 0.256 0.254 0.450 0.508Year fixed effects Yes Yes Yes Yes YesFirm fixed effects No Yes Yes Yes YesTrend control No No No Yes YesControls * post-SOX No No No No Yes
Notes: The dependent variable is log(R&D). All explanatory variables are lagged by one period.Specification (a) includes untabulated 3-digit SIC industry dummies and a dummy that marksall treated firms. Independent board is a dummy that indicates firms after they switched from aminority of independent board members to a majority of independent board members in 2001or later. Control variables are defined in section 4.2. Heteroskedasticity-robust standard errorsthat account for autocorrelation at the firm level are reported in parentheses. Coefficients: ***Significant at 1%, ** Significant at 5% level, * Significant at 10% level.
17

Table 4: Independent boards and no. of patents
(a) (b) (c) (d) (e)b/se b/se b/se b/se b/se
log(total assets) 0.767*** 0.273*** 0.284*** 0.369*** 0.425***(0.017) (0.060) (0.064) (0.067) (0.079)
R&D 5.561*** 0.941* 0.842 0.711 0.835(0.568) (0.517) (0.668) (0.713) (0.896)
log(age) 0.105*** 0.068 0.000 0.004 -0.019(0.023) (0.044) (0.039) (0.048) (0.058)
Leverage -0.468*** -0.112 -0.094 -0.253 -0.250(0.123) (0.176) (0.196) (0.188) (0.212)
Cap. exp. 1.635*** 0.147 0.127 0.321 0.325(0.490) (0.484) (0.518) (0.522) (0.561)
log(Q) 0.199*** 0.057* 0.057 0.081** 0.066(0.027) (0.034) (0.037) (0.040) (0.041)
Boardsize 0.015 0.017 -0.003 -0.016 -0.012(0.010) (0.014) (0.016) (0.015) (0.017)
Independent board 0.308*** 0.272*** 0.215*** 0.208** 0.198**(0.083) (0.079) (0.080) (0.087) (0.087)
Observations 6107 6107 4414 4414 4414R2 0.571 0.207 0.176 0.410 0.414Year fixed effects Yes Yes Yes Yes YesFirm fixed effects No Yes Yes Yes YesTrend control No No No Yes YesControls * post-SOX No No No No Yes
Notes: The dependent variable is the logarithm of one plus the no. of eventually granted patents.All explanatory variables are lagged by one period. Specification (a) includes untabulated 3-digitSIC industry dummies and a dummy that marks all treated firms. Independent board is a dummythat indicates firms after they switched from a minority of independent board members to a ma-jority of independent board members in 2001 or later. Control variables are defined in section 4.2.Heteroskedasticity-robust standard errors that account for autocorrelation at the firm level arereported in parentheses. Coefficients: *** Significant at 1%, ** Significant at 5% level, * Significantat 10% level.
18

Table 5: Independent boards and no. of cite-weighted patents
(a) (b) (c) (d) (e)b/se b/se b/se b/se b/se
log(total assets) 0.917*** 0.320*** 0.276*** 0.321*** 0.523***(0.027) (0.089) (0.098) (0.115) (0.126)
R&D 7.700*** 2.464*** 2.706*** 3.292*** 4.767***(0.868) (0.836) (1.036) (1.159) (1.402)
log(age) 0.142*** 0.065 0.006 0.024 -0.056(0.038) (0.056) (0.058) (0.080) (0.089)
Leverage -0.369* 0.124 0.337 0.203 0.146(0.200) (0.262) (0.301) (0.304) (0.388)
Cap. exp. 2.623*** 0.118 0.184 0.551 0.524(0.805) (0.817) (0.852) (0.980) (1.117)
log(Q) 0.355*** 0.221*** 0.240*** 0.244*** 0.275***(0.046) (0.055) (0.061) (0.076) (0.085)
Boardsize 0.000 -0.004 -0.029 -0.045* -0.049(0.015) (0.021) (0.026) (0.027) (0.032)
Independent board 0.594*** 0.635*** 0.536*** 0.423*** 0.411***(0.128) (0.116) (0.119) (0.137) (0.139)
Observations 6107 6107 4414 4414 4414R2 0.506 0.318 0.286 0.446 0.454Year fixed effects Yes Yes Yes Yes YesFirm fixed effects No Yes Yes Yes YesTrend control No No No Yes YesControls * post-SOX No No No No Yes
Notes: The dependent variable is the logarithm of one plus the no. of citation-weighted patents.All explanatory variables are lagged by one period. Specification (a) includes untabulated 3-digitSIC industry dummies and a dummy that marks all treated firms. Independent board is a dummythat indicates firms after they switched from a minority of independent board members to a ma-jority of independent board members in 2001 or later. Control variables are defined in section 4.2.Heteroskedasticity-robust standard errors that account for autocorrelation at the firm level arereported in parentheses. Coefficients: *** Significant at 1%, ** Significant at 5% level, * Significantat 10% level.
19
citations both increase. The effect on patenting ranges between a 30.8% and 19.8% in-
crease in number of patents, and a 63.5% to 41.1% increase in citation-weighted patents.
Figure 2 illustrates the dynamics of the latter two effects. For the graphs we defined
dummy variables for the specific times before and after firms changed to an indepen-
dent board. t0 defines the year of the switch, tn−1 defines the number of years before
the switch, and tn+1 the corresponding years after the switch. Then, we ran regressions
including these variables instead of the single dummy variable in the baseline model
beforehand. As we still include year fixed effects, the coefficients represent the relative
change in patenting per year that is attributable to the board change.
The results are consistent with classic agency theory, suggesting that intensified
monitoring leads to increased effort of the agent, which manifests in our case in in-
creased patenting of inventions. The results of Tables 3, 4 and 5, however, do not sup-
port the notion that managers might be generally more afraid to innovate when they
are more intensively controlled by the board. That firms patent more, but do not spend
more on R&D, actually raises the question whether firms just work more efficiently
with the given resources (‘squeeze the lemon harder’) or exploit extant knowledge at
the expense of less explorative innovation. While classic agency theory can not explain
directions of innovative search, our argument, based on Manso, Balsmeier and Fleming
(2015), suggests that increased board independence actually leads to less explorative
search. The following empirical models aim to shed light on exactly this question.
5.2 The distribution of citations
In this section, we model the distribution of citations. Patent citation as well as patent
value distributions are highly skewed and the citation-value relationship is most likely
not linear. Hence, we split the distribution into subcategories: (1) patents that received
cites within the highest percentile (top 1%) among all patents in the same 3-digit patent
class and application year, (2) patents that received cites within the highest centile (10%)
among all patents in the same 3-digit patent class and application year, (3) patents that
received at least one citation (median is 0), and (4) patents that received no citation.
Tables 6 to 9 present the corresponding results.
Consistent with the models in Tables 4 and 5 we see a positive effect of transitions
on patenting and citation rates. Interestingly, however, the estimated effect is by far
the largest for patents that received at least one citation (but never in the top 10% of
the distribution), while the estimated effect on particular successful patents (top 1%
or top 10%) is very small in magnitude and statistically not consistently significant.
Taking also into account that the effect on the number of unsuccessful patents (no cites)
is statistically insignificant, the evidence is consistent with the notion that firms focus
20

Figure 2: Dynamics of independent board effect on patents and citations
−.5
0.5
11.
5
coef
ficie
nt s
ize
−5 −4 −3 −2 −1 0 1 2 3 4 5
timeline
b−coefficients 95%−confidence−interval
no. patents
−.5
0.5
11.
5
coef
ficie
nt s
ize
−5 −4 −3 −2 −1 0 1 2 3 4 5
timeline
b−coefficients 95%−confidence−interval
no. citations
Notes: These figures illustrate the effect of a change in board indepen-dence on patenting and citations over time. For the graphs we defineddummy variables for the time firms changed from a minority ofindependent board members to an independent board. t0 indicates theyear of the switch and serves as the reference category. tn−1 indicatethe years before the switch, and tn+1 the corresponding years afterthe switch. Coefficients are taken from a regression as introduced insection 4.4, but with the tn dummies instead of the one dummy variableindicating a majority of independent board members.
21

Table 6: Independent boards and Top 1% patents
(a) (b) (c) (d) (e)b/se b/se b/se b/se b/se
log(total assets) 0.166*** 0.037** 0.056*** 0.054*** 0.037*(0.008) (0.016) (0.015) (0.019) (0.020)
R&D 0.724*** -0.092 -0.060 -0.045 -0.102(0.097) (0.136) (0.223) (0.290) (0.364)
log(age) 0.036*** 0.013 0.004 -0.002 -0.008(0.007) (0.010) (0.008) (0.011) (0.013)
Leverage -0.198*** -0.049 -0.113*** -0.145** -0.110(0.035) (0.042) (0.043) (0.058) (0.070)
Cap. exp. 0.489*** -0.109 -0.094 -0.110 -0.049(0.150) (0.118) (0.107) (0.130) (0.152)
log(Q) 0.031*** -0.000 -0.015 -0.021 -0.023(0.009) (0.011) (0.012) (0.015) (0.015)
Boardsize 0.000 0.004 0.000 -0.002 0.002(0.003) (0.003) (0.004) (0.004) (0.005)
Independent board 0.027 0.043* 0.030 0.045* 0.041(0.027) (0.024) (0.025) (0.027) (0.026)
Observations 6107 6107 4414 4414 4414R2 0.312 0.009 0.014 0.179 0.182Year fixed effects Yes Yes Yes Yes YesFirm fixed effects No Yes Yes Yes YesTrend control No No No Yes YesControls * post-SOX No No No No Yes
Notes: The dependent variable is the logarithm of one plus the number of patents that fall inthe top 1% percentile of the citation distribution within patent class and application year. All ex-planatory variables are lagged by one period. Specification (a) includes untabulated 3-digit SICindustry dummies and a dummy that marks all treated firms. Independent board is a dummythat indicates firms after they switched from a minority of independent board members to a ma-jority of independent board members in 2001 or later. Control variables are defined in section 4.2.Heteroskedasticity-robust standard errors that account for autocorrelation at the firm level arereported in parentheses. Coefficients: *** Significant at 1%, ** Significant at 5% level, * Significantat 10% level.
22

Table 7: Independent boards and Top 10% patents
(a) (b) (c) (d) (e)b/se b/se b/se b/se b/se
log(total assets) 0.389*** 0.103*** 0.113*** 0.109*** 0.058(0.014) (0.030) (0.032) (0.035) (0.038)
R&D 2.283*** 0.218 -0.072 -0.120 -0.232(0.265) (0.222) (0.344) (0.420) (0.553)
log(age) 0.072*** 0.040** 0.027* 0.030 0.035(0.015) (0.017) (0.014) (0.019) (0.022)
Leverage -0.300*** 0.049 -0.046 -0.079 -0.064(0.076) (0.072) (0.083) (0.095) (0.110)
Cap. exp. 0.997*** -0.236 -0.196 -0.228 -0.068(0.330) (0.207) (0.219) (0.228) (0.277)
log(Q) 0.101*** 0.030 0.026 0.034 0.028(0.018) (0.019) (0.022) (0.030) (0.028)
Boardsize 0.003 0.004 -0.004 -0.007 -0.001(0.007) (0.006) (0.007) (0.008) (0.009)
Independent board 0.069 0.064* 0.051 0.062 0.061(0.054) (0.039) (0.040) (0.055) (0.054)
Observations 6107 6107 4414 4414 4414R2 0.407 0.017 0.021 0.208 0.214Year fixed effects Yes Yes Yes Yes YesFirm fixed effects No Yes Yes Yes YesTrend control No No No Yes YesControls * post-SOX No No No No Yes
Notes: The dependent variable is the logarithm of one plus the number of patents that fall inthe top 10% centile of the citation distribution within patent class and application year. All ex-planatory variables are lagged by one period. Specification (a) includes untabulated 3-digit SICindustry dummies and a dummy that marks all treated firms. Independent board is a dummythat indicates firms after they switched from a minority of independent board members to a ma-jority of independent board members in 2001 or later. Control variables are defined in section 4.2.Heteroskedasticity-robust standard errors that account for autocorrelation at the firm level arereported in parentheses. Coefficients: *** Significant at 1%, ** Significant at 5% level, * Significantat 10% level.
23
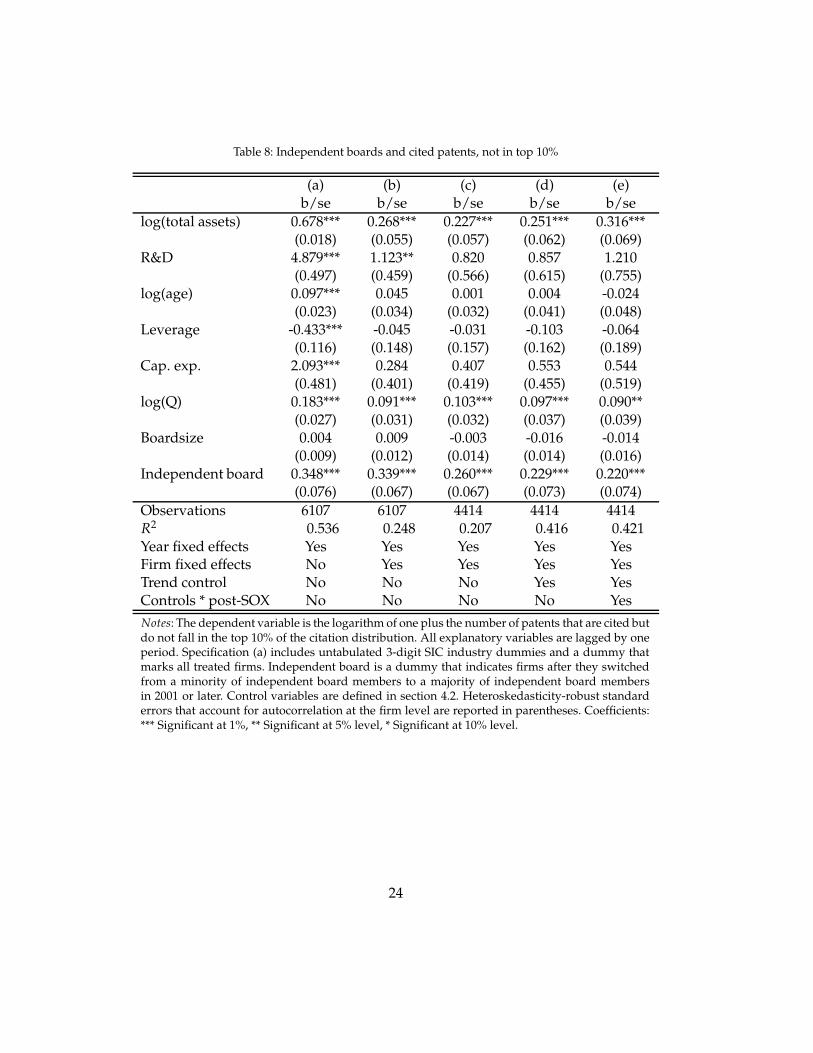
Table 8: Independent boards and cited patents, not in top 10%
(a) (b) (c) (d) (e)b/se b/se b/se b/se b/se
log(total assets) 0.678*** 0.268*** 0.227*** 0.251*** 0.316***(0.018) (0.055) (0.057) (0.062) (0.069)
R&D 4.879*** 1.123** 0.820 0.857 1.210(0.497) (0.459) (0.566) (0.615) (0.755)
log(age) 0.097*** 0.045 0.001 0.004 -0.024(0.023) (0.034) (0.032) (0.041) (0.048)
Leverage -0.433*** -0.045 -0.031 -0.103 -0.064(0.116) (0.148) (0.157) (0.162) (0.189)
Cap. exp. 2.093*** 0.284 0.407 0.553 0.544(0.481) (0.401) (0.419) (0.455) (0.519)
log(Q) 0.183*** 0.091*** 0.103*** 0.097*** 0.090**(0.027) (0.031) (0.032) (0.037) (0.039)
Boardsize 0.004 0.009 -0.003 -0.016 -0.014(0.009) (0.012) (0.014) (0.014) (0.016)
Independent board 0.348*** 0.339*** 0.260*** 0.229*** 0.220***(0.076) (0.067) (0.067) (0.073) (0.074)
Observations 6107 6107 4414 4414 4414R2 0.536 0.248 0.207 0.416 0.421Year fixed effects Yes Yes Yes Yes YesFirm fixed effects No Yes Yes Yes YesTrend control No No No Yes YesControls * post-SOX No No No No Yes
Notes: The dependent variable is the logarithm of one plus the number of patents that are cited butdo not fall in the top 10% of the citation distribution. All explanatory variables are lagged by oneperiod. Specification (a) includes untabulated 3-digit SIC industry dummies and a dummy thatmarks all treated firms. Independent board is a dummy that indicates firms after they switchedfrom a minority of independent board members to a majority of independent board membersin 2001 or later. Control variables are defined in section 4.2. Heteroskedasticity-robust standarderrors that account for autocorrelation at the firm level are reported in parentheses. Coefficients:*** Significant at 1%, ** Significant at 5% level, * Significant at 10% level.
24
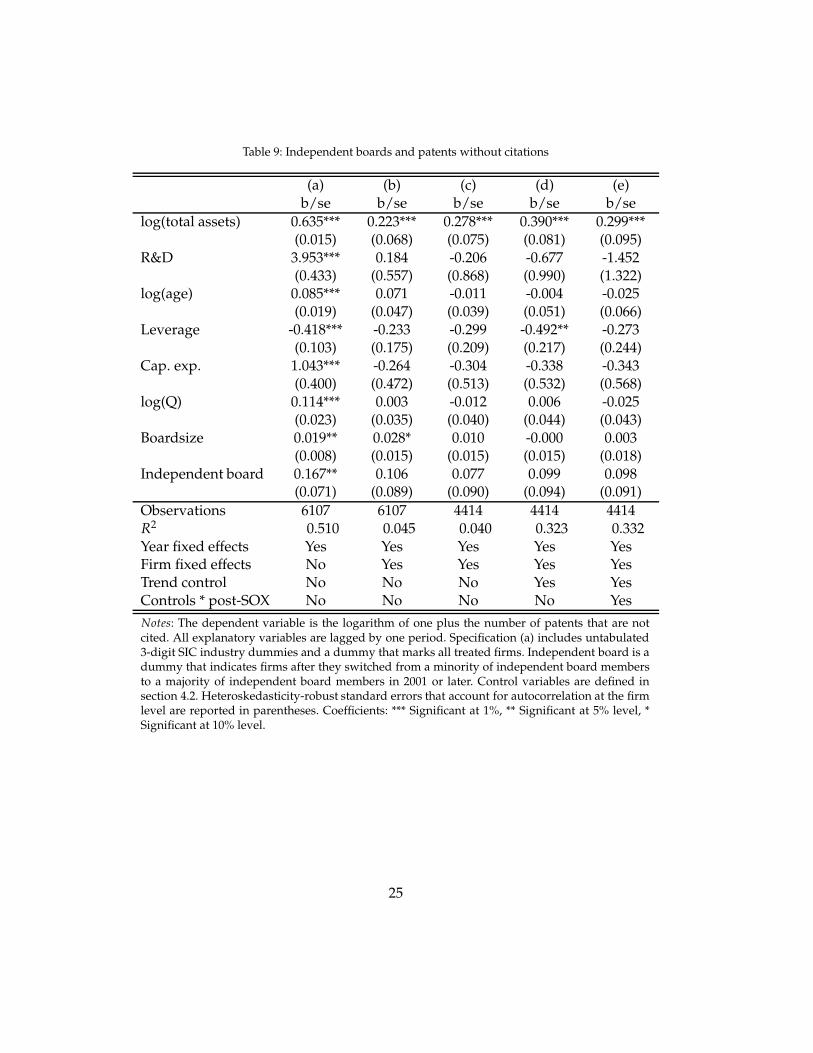
Table 9: Independent boards and patents without citations
(a) (b) (c) (d) (e)b/se b/se b/se b/se b/se
log(total assets) 0.635*** 0.223*** 0.278*** 0.390*** 0.299***(0.015) (0.068) (0.075) (0.081) (0.095)
R&D 3.953*** 0.184 -0.206 -0.677 -1.452(0.433) (0.557) (0.868) (0.990) (1.322)
log(age) 0.085*** 0.071 -0.011 -0.004 -0.025(0.019) (0.047) (0.039) (0.051) (0.066)
Leverage -0.418*** -0.233 -0.299 -0.492** -0.273(0.103) (0.175) (0.209) (0.217) (0.244)
Cap. exp. 1.043*** -0.264 -0.304 -0.338 -0.343(0.400) (0.472) (0.513) (0.532) (0.568)
log(Q) 0.114*** 0.003 -0.012 0.006 -0.025(0.023) (0.035) (0.040) (0.044) (0.043)
Boardsize 0.019** 0.028* 0.010 -0.000 0.003(0.008) (0.015) (0.015) (0.015) (0.018)
Independent board 0.167** 0.106 0.077 0.099 0.098(0.071) (0.089) (0.090) (0.094) (0.091)
Observations 6107 6107 4414 4414 4414R2 0.510 0.045 0.040 0.323 0.332Year fixed effects Yes Yes Yes Yes YesFirm fixed effects No Yes Yes Yes YesTrend control No No No Yes YesControls * post-SOX No No No No Yes
Notes: The dependent variable is the logarithm of one plus the number of patents that are notcited. All explanatory variables are lagged by one period. Specification (a) includes untabulated3-digit SIC industry dummies and a dummy that marks all treated firms. Independent board is adummy that indicates firms after they switched from a minority of independent board membersto a majority of independent board members in 2001 or later. Control variables are defined insection 4.2. Heteroskedasticity-robust standard errors that account for autocorrelation at the firmlevel are reported in parentheses. Coefficients: *** Significant at 1%, ** Significant at 5% level, *Significant at 10% level.
25

Figure 3: Quantile regression of citations
0.00
0.50
1.00
Coe
f. in
dep.
boa
rd
0 .2 .4 .6 .8 1Quantile
Notes: This figure illustrates the effect of a change in board indepen-dence on patent citations at different areas of the patent citationdistribution. Coefficient size is estimated with quantile regressions. Thegrey area represents the 95% confidence band of the quantile regressionestimates. The horizontal dashed lines are the OLS point estimate andthe corresponding 95% confidence band.
more on moderately successful innovations when the board becomes independent.
Supplementing the regression results on patents in different citation categories, Fig-
ure ?? illustrates results of a quantile regression of the logarithm of citations. The hor-
izontal dashed lines represent the OLS estimates and corresponding 95% confidence
band for comparison. The evidence is consistent with independent boards encouraging
more exploitation and less exploration.
5.3 Self and backward citations
In this section, we investigate additional observable implications of our argument, us-
ing more nuanced patent measures. First, we focus on the number of citations that each
patent makes to other patents. An increase in the number of backward citations reflects
more prior art that must be specified in the patent application. This should correlate
with innovative search in relatively better-known and mature technological areas. Sec-
ond, we take the number of times a given patent cites other patents owned by the same
company. More self-cites indicate constraining search within previously known areas of
expertise while fewer self-citations indicate a broadening of innovative search or efforts
26

to explore areas that are new to the firm (Sorenson and Stuart, 2000). Table 10 and 11
present the corresponding results.13 Figure 4 illustrates the dynamics of the effects.
Table 10: Independent boards and backward citations
(a) (b) (c) (d) (e)b/se b/se b/se b/se b/se
log(total assets) 1.030*** 0.399*** 0.383*** 0.556*** 0.535***(0.031) (0.106) (0.119) (0.134) (0.148)
R&D 8.023*** 1.155 1.117 1.342 0.465(0.932) (1.032) (1.211) (1.394) (1.359)
log(age) 0.133*** 0.017 -0.022 0.009 -0.102(0.045) (0.064) (0.076) (0.094) (0.106)
Leverage -0.231 0.213 0.251 -0.137 -0.052(0.238) (0.304) (0.356) (0.363) (0.439)
Cap. exp. 2.028** 0.085 0.044 0.382 0.515(0.915) (0.958) (1.007) (1.099) (1.225)
log(Q) 0.305*** 0.127** 0.160** 0.188** 0.183**(0.052) (0.063) (0.070) (0.083) (0.091)
Boardsize 0.002 -0.002 -0.021 -0.041 -0.044(0.018) (0.023) (0.028) (0.030) (0.035)
Independent board 0.498*** 0.479*** 0.482*** 0.389** 0.388**(0.159) (0.133) (0.139) (0.173) (0.174)
Observations 6107 6107 4414 4414 4414R2 0.450 0.115 0.106 0.295 0.298Year fixed effects Yes Yes Yes Yes YesFirm fixed effects No Yes Yes Yes YesTrend control No No No Yes YesControls * post-SOX No No No No Yes
Notes: The dependent variable is the logarithm of one plus the number of backward citations. Allexplanatory variables are lagged by one period. Specification (a) includes untabulated 3-digit SICindustry dummies and a dummy that marks all treated firms. Independent board is a dummythat indicates firms after they switched from a minority of independent board members to a ma-jority of independent board members in 2001 or later. Control variables are defined in section 4.2.Heteroskedasticity-robust standard errors that account for autocorrelation at the firm level arereported in parentheses. Coefficients: *** Significant at 1%, ** Significant at 5% level, * Significantat 10% level.
All results presented in Tables 10 and 11 and Figure 4 point out that firms with
independent boards tend to narrow their innovative search towards known and mature
technological areas. In the next section we provide complementary findings.
13Alternative untabulated regressions of non-self citations reveal very similar results as estimated forthe total number of backward citations.
27
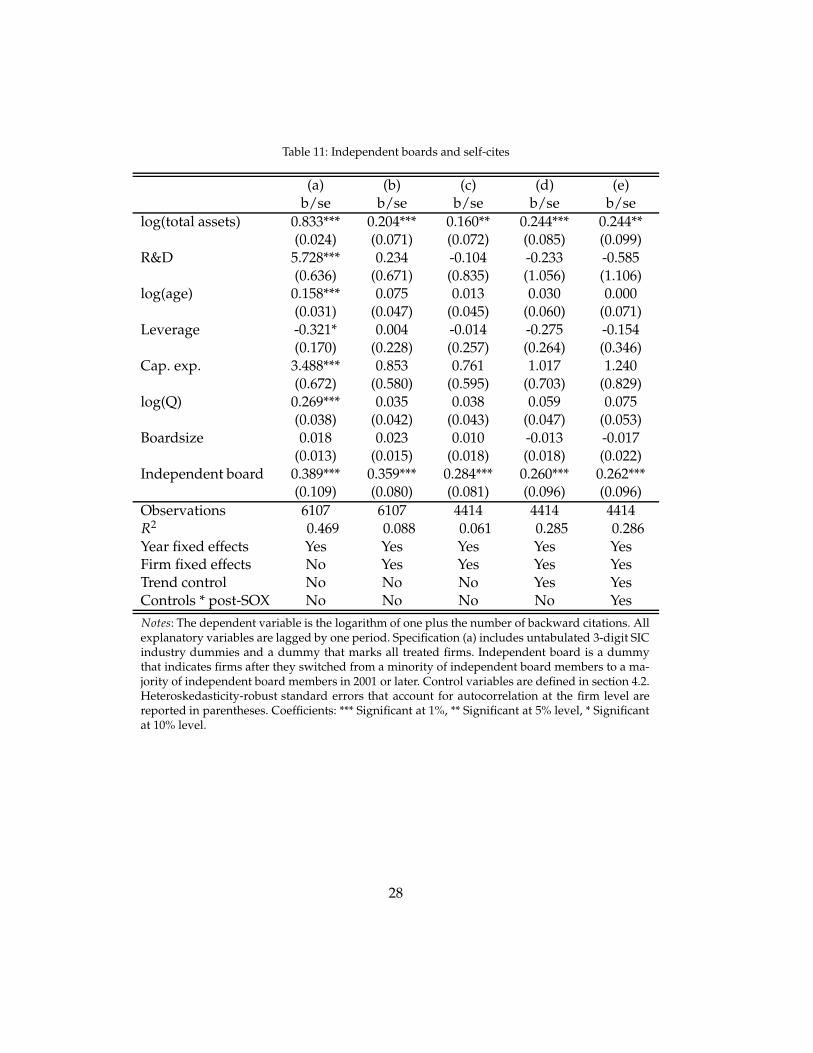
Table 11: Independent boards and self-cites
(a) (b) (c) (d) (e)b/se b/se b/se b/se b/se
log(total assets) 0.833*** 0.204*** 0.160** 0.244*** 0.244**(0.024) (0.071) (0.072) (0.085) (0.099)
R&D 5.728*** 0.234 -0.104 -0.233 -0.585(0.636) (0.671) (0.835) (1.056) (1.106)
log(age) 0.158*** 0.075 0.013 0.030 0.000(0.031) (0.047) (0.045) (0.060) (0.071)
Leverage -0.321* 0.004 -0.014 -0.275 -0.154(0.170) (0.228) (0.257) (0.264) (0.346)
Cap. exp. 3.488*** 0.853 0.761 1.017 1.240(0.672) (0.580) (0.595) (0.703) (0.829)
log(Q) 0.269*** 0.035 0.038 0.059 0.075(0.038) (0.042) (0.043) (0.047) (0.053)
Boardsize 0.018 0.023 0.010 -0.013 -0.017(0.013) (0.015) (0.018) (0.018) (0.022)
Independent board 0.389*** 0.359*** 0.284*** 0.260*** 0.262***(0.109) (0.080) (0.081) (0.096) (0.096)
Observations 6107 6107 4414 4414 4414R2 0.469 0.088 0.061 0.285 0.286Year fixed effects Yes Yes Yes Yes YesFirm fixed effects No Yes Yes Yes YesTrend control No No No Yes YesControls * post-SOX No No No No Yes
Notes: The dependent variable is the logarithm of one plus the number of backward citations. Allexplanatory variables are lagged by one period. Specification (a) includes untabulated 3-digit SICindustry dummies and a dummy that marks all treated firms. Independent board is a dummythat indicates firms after they switched from a minority of independent board members to a ma-jority of independent board members in 2001 or later. Control variables are defined in section 4.2.Heteroskedasticity-robust standard errors that account for autocorrelation at the firm level arereported in parentheses. Coefficients: *** Significant at 1%, ** Significant at 5% level, * Significantat 10% level.
28
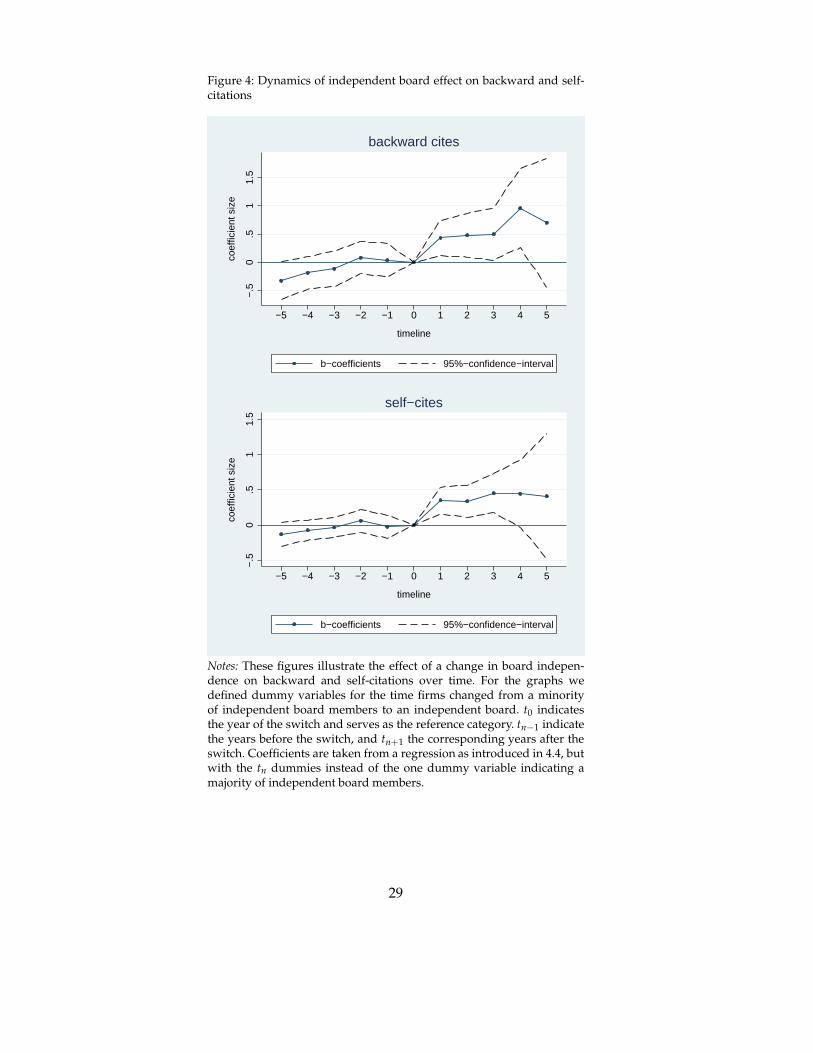
Figure 4: Dynamics of independent board effect on backward and self-citations
−.5
0.5
11.
5
coef
ficie
nt s
ize
−5 −4 −3 −2 −1 0 1 2 3 4 5
timeline
b−coefficients 95%−confidence−interval
backward cites
−.5
0.5
11.
5
coef
ficie
nt s
ize
−5 −4 −3 −2 −1 0 1 2 3 4 5
timeline
b−coefficients 95%−confidence−interval
self−cites
Notes: These figures illustrate the effect of a change in board indepen-dence on backward and self-citations over time. For the graphs wedefined dummy variables for the time firms changed from a minorityof independent board members to an independent board. t0 indicatesthe year of the switch and serves as the reference category. tn−1 indicatethe years before the switch, and tn+1 the corresponding years after theswitch. Coefficients are taken from a regression as introduced in 4.4, butwith the tn dummies instead of the one dummy variable indicating amajority of independent board members.
29

5.4 Technology classes
We now turn to the number of patents that are filed in classes previously unknown to
the firm. Unknown patent classes are defined as those in which a given firm has not
applied for any patent beforehand. The counter part is the number of patents applied
for in known classes. A more sophisticated measure of whether firms stay or deviate
from known research areas is the technological proximity between the patents filed in
year t and the existing patent portfolio held by the same firm up to year t-1.
Tables 12 to 14 present the corresponding regression results. Figure 5 illustrates the
dynamics of the effects on patents in known and unknown areas. As can be seen, inde-
pendent boards have an insignificant effect on exploration of new classes but a strong
and significantly positive effect on search in previously patented classes. These results
are consistent with the measure of technological proximity as well.
6 Discussion and robustness checks
Our proposed mechanism relies upon the manager’s fear that she will lose future flex-
ibility over exploration outcomes. Other mechanisms, not necessarily contradictory,
might demonstrate similar observable outcomes. For example, an independent board
may be more effective at ameliorating moral hazard and decreasing shirking; if this
were the case, then one would expect greater effort from the manager under an inde-
pendent board. In the context of innovation and patenting, this would correspond to
greater (and/or more efficient) research and development, innovation and patenting,
and performance.
Consistent with the results presented above, we found no convincing evidence that
points to a change in research and development investment. The descriptive statistics
do not provide a clear picture and the econometric models are mostly insignificant.
Again from the tables above the evidence is consistent that firms that transition to inde-
pendent boards do receive more patents. Supplementary regressions indicate, however,
that the process is not necessarily more efficient - there is no clear result for the regres-
sion of patents per R&D investment. This is consistent with other research that has
found mixed evidence for the impact of independent boards on overall performance
(see e.g. Duchin, Matsusaka, and Oguzhan, 2010; Nguyen and Nielsen, 2010) that is con-
text dependent, as argued in Adams, Hermalin, and Weisbach (2010) and empirically
confirmed by Duchin, Matsusaka, and Oguzhan, (2010). In the current work, all models
included Tobin’s q as a control, and additional models (included in the appendix) were
robust to the inclusion of controls such as sales/employee. Hence, while independent
boards may indeed make their managers work harder, and this is reflected in greater
30

Table 12: Independent boards and patents in known classes
(a) (b) (c) (d) (e)b/se b/se b/se b/se b/se
log(total assets) 0.779*** 0.275*** 0.290*** 0.368*** 0.431***(0.018) (0.059) (0.063) (0.066) (0.078)
R&D 5.718*** 0.989* 0.743 0.534 0.649(0.572) (0.527) (0.678) (0.732) (0.943)
log(age) 0.107*** 0.061 -0.018 -0.020 -0.038(0.023) (0.046) (0.040) (0.050) (0.059)
Leverage -0.521*** -0.206 -0.217 -0.383** -0.390*(0.124) (0.179) (0.200) (0.191) (0.221)
Cap. exp. 1.622*** -0.009 0.056 0.122 0.167(0.500) (0.471) (0.510) (0.501) (0.553)
log(Q) 0.214*** 0.059* 0.064* 0.091** 0.080*(0.028) (0.034) (0.037) (0.040) (0.042)
Boardsize 0.018* 0.023 0.006 -0.005 -0.001(0.010) (0.014) (0.016) (0.015) (0.017)
Independent board 0.323*** 0.289*** 0.231*** 0.209** 0.198**(0.082) (0.079) (0.079) (0.083) (0.083)
Observations 6107 6107 4414 4414 4414R2 0.572 0.184 0.153 0.401 0.406Year fixed effects Yes Yes Yes Yes YesFirm fixed effects No Yes Yes Yes YesTrend control No No No Yes YesControls * post-SOX No No No No Yes
Notes: The dependent variable is the logarithm of one plus the number of patents filed in classeswhere the given firm had already at least on other patent filed any previous year. All explana-tory variables are lagged by one period. Specification (a) includes untabulated 3-digit SIC indus-try dummies and a dummy that marks all treated firms. Independent board is a dummy thatindicates firms after they switched from a minority of independent board members to a major-ity of independent board members in 2001 or later. Control variables are defined in section 4.2.Heteroskedasticity-robust standard errors that account for autocorrelation at the firm level arereported in parentheses. Coefficients: *** Significant at 1%, ** Significant at 5% level, * Significantat 10% level.
31

Table 13: Independent boards and patents in unknown classes
(a) (b) (c) (d) (e)b/se b/se b/se b/se b/se
log(total assets) 0.171*** 0.096*** 0.103*** 0.101** 0.177***(0.008) (0.032) (0.037) (0.042) (0.045)
R&D 0.994*** 0.329 0.508 0.516 1.039**(0.175) (0.270) (0.379) (0.472) (0.494)
log(age) -0.002 0.018 0.025 0.032 0.021(0.010) (0.019) (0.021) (0.025) (0.029)
Leverage -0.091* 0.099 0.104 0.099 -0.011(0.055) (0.086) (0.098) (0.115) (0.134)
Cap. exp. 0.958*** 0.916*** 0.802** 0.866** 0.975**(0.239) (0.303) (0.322) (0.389) (0.443)
log(Q) 0.062*** 0.064*** 0.053*** 0.026 0.012(0.012) (0.019) (0.020) (0.025) (0.027)
Boardsize 0.002 0.004 -0.004 -0.009 -0.012(0.005) (0.008) (0.011) (0.012) (0.012)
Independent board 0.088** 0.055 0.023 0.037 0.036(0.036) (0.045) (0.044) (0.053) (0.052)
Observations 6107 6107 4414 4414 4414R2 0.319 0.134 0.115 0.284 0.291Year fixed effects Yes Yes Yes Yes YesFirm fixed effects No Yes Yes Yes YesTrend control No No No Yes YesControls * post-SOX No No No No Yes
Notes: The dependent variable is the logarithm of one plus the number of patents filed in classeswhere the given firm had no other patent filed in any previous year. All explanatory variables arelagged by one period. Specification (a) includes untabulated 3-digit SIC industry dummies anda dummy that marks all treated firms. Independent board is a dummy that indicates firms afterthey switched from a minority of independent board members to a majority of independent boardmembers in 2001 or later. Control variables are defined in section 4.2. Heteroskedasticity-robuststandard errors that account for autocorrelation at the firm level are reported in parentheses.Coefficients: *** Significant at 1%, ** Significant at 5% level, * Significant at 10% level.
32

Table 14: Independent boards and technological proximity
(a) (b) (c) (d) (e)b/se b/se b/se b/se b/se
log(total assets) 0.451*** 0.187** 0.224** 0.363*** 0.306**(0.020) (0.085) (0.100) (0.117) (0.124)
R&D 5.353*** 0.859 0.976 0.820 0.033(0.710) (0.835) (1.018) (1.104) (1.132)
log(age) 0.085*** -0.005 -0.024 -0.021 -0.049(0.030) (0.052) (0.063) (0.077) (0.081)
Leverage -0.020 -0.138 -0.075 -0.448 -0.472(0.172) (0.263) (0.313) (0.344) (0.428)
Cap. exp. -0.280 -0.179 -0.362 -0.228 -0.161(0.663) (0.856) (0.937) (0.944) (1.055)
log(Q) 0.177*** 0.038 0.061 0.100 0.097(0.036) (0.048) (0.057) (0.066) (0.074)
Boardsize 0.014 0.023 0.011 0.010 0.022(0.012) (0.018) (0.022) (0.025) (0.030)
Independent board 0.247** 0.255** 0.289** 0.177 0.169(0.115) (0.120) (0.126) (0.138) (0.140)
Observations 6107 6107 4414 4414 4414R2 0.369 0.118 0.112 0.292 0.294Year fixed effects Yes Yes Yes Yes YesFirm fixed effects No Yes Yes Yes YesTrend control No No No Yes YesControls * post-SOX No No No No Yes
Notes: The dependent variable is the technological proximity between the patents filed in year tto the existing patent portfolio held by the same firm up to year t-1, and is calculated accordingto Jaffe (1989). All explanatory variables are lagged by one period. Specification (a) includes unt-abulated 3-digit SIC industry dummies and a dummy that marks all treated firms. Independentboard is a dummy that indicates firms after they switched from a minority of independent boardmembers to a majority of independent board members in 2001 or later. Control variables are de-fined in section 4.2. Heteroskedasticity-robust standard errors that account for autocorrelation atthe firm level are reported in parentheses. Coefficients: *** Significant at 1%, ** Significant at 5%level, * Significant at 10% level.
33
Figure 5: Dynamics of independent board effect on patents in knownand unknown classes
−.5
0.5
1
coef
ficie
nt s
ize
−5 −4 −3 −2 −1 0 1 2 3 4 5
timeline
b−coefficients 95%−confidence−interval
no. of patents in known classes
−.5
0.5
1
coef
ficie
nt s
ize
−5 −4 −3 −2 −1 0 1 2 3 4 5
timeline
b−coefficients 95%−confidence−interval
no. of patents in new classes
Notes: These figures illustrate the effect of a change in board indepen-dence on patents filed in known and unknown classes over time. For thegraphs we defined dummy variables for the time firms changed froma minority of independent board members to an independent board.t0 indicates the year of the switch and serves as the reference category.tn−1 indicate the years before the switch, and tn+1 the correspondingyears after the switch. Coefficients are taken from a regression asintroduced in 4.4, but with the tn dummies instead of the one dummyvariable indicating a majority of independent board members.
34
patenting, that mechanism does not not appear to drive the shift towards exploitation
shown above.
Independent or in addition to pressuring their manager to work harder, boards may
ask them to justify and quantify their results. Given that independent board members
are by definition from outside the firm and possibly the industry, it is likely that in-
dependent board members are less familiar with the firm’s business and technologies.
Hence, it is reasonable that they would ask for easily interpreted measures, such as
patent counts and accounting based performance measures. In order to control for this
possibility, we include return on assets as an additional control in the models shown in
the appendix. Results remain robust to this control as well. Hence, while the evidence
that independent boards decrease agency problems is reasonable, by increasing effort
or highlighting measurable outcomes, those mechanisms cannot account for the more
nuanced results.
The fact that firms which transition to independent boards patent more raises the
concern that the backward and self citation results might simply be an artifact of the
increased patenting. To address this, we estimate regressions of backward and self-
citations per patent. As can be seen in Tables XXX in the Appendix, the results are not
merely an artifact of increased patenting. The proportion of backward and self citations
increases for firms which transition to independent boards.
7 Conclusion
We proposed a model whereby shareholders appoint a board of directors and hire a
manager. We considered a less independent and assumedly more friendly board, whose
beliefs matched the manager. In this case, the firm explores new strategies if the man-
ager is sufficiently optimistic, because she knows she has the flexibility to pursue or
ignore the outcome of the exploration. An independent and assumedly less friendly
board makes the manager less likely to explore new strategies, because the manager
fears a loss of flexibility in deciding whether to pursue the result of the explorative
strategy.
Evidence to support these arguments comes from regulatory changes which made
boards more independent. Following the observable implications, firms whose boards
become more independent are less likely to explore new technologies and more likely
to exploit previously successful areas of expertise. Consistent with an strategy of ex-
ploitation, firms that transition to more independent boards get more but less creative
patents. On average the patents are cited more, however, those citations are made to
patents in the middle of the distribution, and not to breakthrough or completely failed
patents. The coefficient of variation of citations to firms which transition to indepen-
35

dent boards decreases. Firms with more independent boards work in more crowded
and more familiar areas of technology.
These more nuanced measures of search and exploration enable greater insight into
the search and innovation process and highlight the importance of differentiating be-
tween greater effort and incremental output vs. breakthrough inventions. Further work
will seek to establish the impact of exploration and exploitation on the novelty and
technical and financial value of the firm’s inventions.
36
References
Adams, R.B., Hermalin Benjamin E., Weisbach, M.S., 2010. The Role of Boards of Di-
rectors in Corporate Governance: A Conceptual Framework & Survey. Journal of Eco-
nomic Literature 48 (1), 58–107.
Adams, R.B., Ferreira, D., 2007. A Theory of Friendly Boards. Journal of Finance 62 (1),
217–250.
Aghion, P., van Reenen, J.M., Zingales, L., 2013. Innovation and Institutional Owner-
ship. American Economic Review 103 (1), 277–304.
Aghion, P., Blundell, R., Griffith, R., Howitt, P., Prantl, S., 2009. The Effects of Entry
on Incumbent Innovation and Productivity. Review of Economics and Statistics 91 (1),
20–32.
Aghion, P., Tirole, J., 1997. Formal and Real Authority in Organizations. Journal of Po-
litical Economy 105 (1), 1–29.
Arrow, K., 1969. Classificatory Notes on the Production and Diffusion of Knowledge,
American Economic Review 59, 29¡V-35.
Atanassov, J., 2013. Do Hostile Takeovers Stifle Innovation? Evidence from Antitakeover
Legislation and Corporate Patenting, Journal of Finance 68 (3), 1097–1131.
Azoulay, P., Graff Zivin, J.S., Manso, G., 2011. Incentives and Creativity: Evidence from
the Academic Life Sciences. RAND Journal of Economics 42 (3), 527–554.
Balsmeier, B., Buchwald, B., Stiebale, 2014. Outside Directors on the Board and Innova-
tive Firm Performance. Research Policy 43, 1800–1815.
Bebchuk, L.A. und Fried, J.M., 2003. Executive Compensation as an Agency Problem.
Journal of Economic Perspectives 17, 71–92.
Bebchuk, L.A., Cohen, A., Ferrell, A., 2009. What Matters in Corporate Governance?
Review of Financial Studies 22 (2), 783–827.
Bertrand, M., Mullainathan, S., 2003. Enjoying the Quiet Life? Corporate Governance
and Managerial Preferences. Journal of Political Economy 111, 1043–1075.
Beyer, M., Czarnitzki, D., Kraft, K., 2012. Managerial Ownership, Entrenchment, and
Innovation. Economics of Innovation and New Technology 21 (7), 679–699.
Blundell, R., Griffith, R., Windmeijer, F., 2002. Individual Effects and Dynamics in Count
Data Models. Journal of Econometrics 108 (1), 113–131.
Blundell, R., Griffith, R., van Reenen, J.M., 1995. Dynamic Count Data Models of Tech-
nological Innovation. The Economic Journal 105 (429), 333–344.
Borokhovich, K.A., Parrino, R.P., Trapani, T., 1996. Outside Directors and CEO Selec-
tion. Journal of Financial and Quantitative Analysis 31, 337–355.
Brickley, J.A., Coles, J.L., Terry, R.L., 1994. Outside Directors and the Adoption of Poison
Pills. Journal of Financial Economics 35 (3), 371–390.
37

Brochet, F., Srinivasan, S., 2014. Accountability of independent directors: Evidence from
firms subject to securities litigation. Journal of Financial Economics 111, 430–449.
Burkart, M., Gromb, D., Panunzi, F., 1997. Large Shareholders, Monitoring, and the
Value of the Firm. Quarterly Journal of Economics 112, 693–728.
Byrd, J.W., Hickman, K.A., 1992. Do Outside Directors Monitor Managers?: Evidence
from Tender Offer Bids. Journal of Financial Economics 32 (2), 195–221.
Chemmanur, T., Loutskina, E., Tian, X., 2014. Corporate Venture Capital, Value Cre-
ation, and Innovation. Review of Financial Studies 27 (8), 2434–2473.
Chemmanur, T., and Tian, X., 2013. Anti-takeover provisions, innovation, and firm
value: A regression discontinuity analysis, Working paper, Indiana University.
Coles, J.L., Daniel, N.D., Naveen, L., 2008. Boards: Does One Size Fit it All? Journal of
Financial Economics 87 (2), 329–356.
Core, J.E., Holthausen, R.W., Larcker, D.F., 1999. Corporate Governance, Chief Execu-
tive Officer Compensation, and Firm Performance. Journal of Financial Economics 51
(3), 371–406.
Cotter, J.F., Shivdasani, A., Zenner, M., 1997. Do Independent Directors Enhance Target
Shareholder Wealth During Tender Offers? Journal of Financial Economics 43 (2), 195–
218.
Denis, D.J., Sarin, A., 1999. Ownership and Board Structures in Publicly Traded Corpo-
rations. Journal of Financial Economics 52 (2), 187–223.
Duchin, R., Matsusaka, J.G., Oguzhan, O. 2010. When are outside directors effective?
Journal of Financial Economics 96, 195-214.
Ederer, F., Manso, G., 2013. Is Pay for Performance Detrimental to Innovation? Forth-
coming: Management Science (http://dx.doi.org/10.1287/mnsc.1120.1683).
Faleye, O., Hoitash, R., Hoitash, U., 2011. The Costs of Intense Board Monitoring. Jour-
nal of Financial Economics 101 (1), 160–181.
Fang, V., Tian, X. and Tice, S., 2013. Does stock liquidity enhance or impede firm inno-
vation? Journal of Finance, forthcoming.
Fierro, G., Balsmeier, B., Li, G., Johnson, K., Kaulagi, A., Yeh, W., Fleming, L. 2014.
Weekly Disambiguations of US Patent Grants and Applications. Working paper, Fung
Institute for Engineering Leadership http://www.funginstitute.berkeley.edu/sites/default/files/weeklydbig0.09.pdf.
Hall, B.H., Mairesse, J., & Mohnen, P. 2010. Measuring the Returns to R&D, in: B.H. Hall
and N. Rosenberg (eds.), Handbooks in Economics: Economics of Innovation, Amster-
dam: North-Holland: 1033–1082.
Hall, B. H., Jaffe, A., & Trajtenberg, M. 2001. The NBER Patent Citations File: Lessons,
Insights, and Methodological Tools. NBER working paper 8498.
Hall, B. H., Jaffe, A., & Trajtenberg, M. (2005). Market value and patent citations. RAND
Journal of economics, 16-38.
38

He, J., Tian, X., 2013. The Dark Side of Analyst Coverage: The Case of Innovation. Jour-
nal of Financial Economics 109 (3), 856–878.
Hermalin, B.E., Weisbach, M.S., 1998. Endogenously Chosen Boards of Directors and
Their Monitoring of the CEO. American Economic Review 88 (1), 96–118.
Hsu, P.-H., Tian, X., Xu, Y., 2014. Financial Development and Innovation: Cross-Country
Evidence. Journal of Financial Economics 112, 116–135.
Jaffe, A.B., 1989. Characterizing the “Technological Position” of Firms, with Application
to Quantifying Technological Opportunity and Research Spillovers. Research Policy 18,
87-97.
Kang, J., Liu, W., Low, A., Zhang, L., 2014. Friendly Boards and Innovation. SSRN-
id2177857.
Knyazeva, A., Knyazeva, D., Masulis, R.W., 2013. The Supply of Corporate Directors
and Board Independence. Review of Financial Studies 26 (6), 1561-1605.
Lerner, J., Sorensen, M., Stromberg, P., 2011. Private equity and long-run investment:
The case of innovation, Journal of Finance 65, 445-477.
Li, G., Lai, R., Doolin, D., DAmour, A., Yu, A., Sun, Y., Torvik, V., Fleming, L. 2014. Dis-
ambiguation and co-authorship networks of the U.S. Patent Inventor Database, 1975-
2010. Research Policy 43: 941–955.
Manso, G., 2011. Motivating Innovation. Journal of Finance 66 (5), 1823–1860.
Manso, G., Balsmeier, B., Fleming, L. 2015. Working paper, Haas School of Business.
March, J. 1991. Exploration and exploitation in organizational learning. Organization
science, 2(1), 71-87.
Masulis, R.W., Mobbs, S., 2014. Independent director incentives: Where do talented di-
rectors spend their limited time and energy. Journal of Financial Economics 111, 406–
429.
Schumpeter, J., 1934. The Theory of Economic Development. (Harvard University Press
Cambridge, MA).
Sapra, H., Subramanian, A., Subramanian, K.V., 2013. Corporate Governance and In-
novation: Theory and Evidence. Forthcoming: Journal of Financial and Quantitative
Analysis.
Seru, A., 2014. Firm Boundaries Matter: Evidence from Conglomerates and R&D Activ-
ity, Journal of Financial Economics 111 (2), 381–405.
Shleifer, A., Vishny, R., 1997. A survey of corporate governance. Journal of Finance 52,
737-783.
Sørensen, J., Stuart, T 2000. Aging, Obsolescence and Organizational Innovation. Ad-
ministrative Science Quarterly 45: 81-112.
Tian, X., Wang, T., 2014. Tolerance for Failure and Corporate Innovation. Review of
Financial Studies 27 (1), 211–255.
39

Weisbach, M.S., 1988. Outside Directors and CEO Turnover. Journal of Financial Eco-
nomics 20 (1/2), 431–460.
Weitzman, M., 1979. Optimal Search for the Best Alternative, Econometrica 47, 641¡V-
654.
40

8 Appendix
8.1 Robustness checks - additional controls
All regression tables including additional controls for increased effort (log(sales/employee))
and measurable performance (return on assets)
Table 2: Independent boards and R&D
(a) (b) (c) (d) (e)b/se b/se b/se b/se b/se
log(total assets) 0.831*** 0.566*** 0.595*** 0.604*** 0.601***(0.017) (0.043) (0.040) (0.050) (0.049)
log(age) -0.130*** 0.001 -0.004 -0.016 -0.014(0.021) (0.030) (0.038) (0.057) (0.055)
Leverage -0.685*** 0.017 -0.085 -0.213 -0.466**(0.111) (0.109) (0.129) (0.156) (0.215)
Cap. exp. 1.538** 0.618* 0.547 0.371 0.812(0.660) (0.364) (0.413) (0.455) (0.535)
log(Q) 0.390*** -0.005 -0.013 -0.013 0.026(0.025) (0.024) (0.027) (0.031) (0.035)
Boardsize 0.027*** 0.007 0.004 0.006 -0.005(0.009) (0.008) (0.011) (0.013) (0.014)
log(sales/employee) 0.225*** -0.010 0.019 -0.033 -0.004(0.044) (0.050) (0.076) (0.095) (0.082)
ROA -1.647*** -0.233 -0.121 -0.066 -0.144(0.155) (0.161) (0.227) (0.253) (0.231)
Independent board 0.042 -0.063 -0.069 -0.071 -0.050(0.090) (0.054) (0.056) (0.063) (0.061)
Observations 6076 6076 4393 4393 4393R2 0.739 0.253 0.249 0.447 0.507Year fixed effects Yes Yes Yes Yes YesFirm fixed effects No Yes Yes Yes YesTrend control No No No Yes YesControls * post-SOX No No No No Yes
Notes: The dependent variable is log(R&D). All explanatory variables are lagged by one period.Specification (a) includes untabulated 3-digit SIC industry dummies and a dummy that marksall treated firms. Independent board is a dummy that indicates firms after they switched from aminority of independent board members to a majority of independent board members in 2001or later. Control variables are defined in section 4.2. Heteroskedasticity-robust standard errorsthat account for autocorrelation at the firm level are reported in parentheses. Coefficients: ***Significant at 1%, ** Significant at 5% level, * Significant at 10% level.
41

Table 3: Independent boards and no. of patents
(a) (b) (c) (d) (e)b/se b/se b/se b/se b/se
log(total assets) 0.423*** 0.254*** 0.281*** 0.386*** 0.442***(0.019) (0.060) (0.061) (0.066) (0.076)
R&D 0.363*** 0.018 -0.007 -0.021 -0.034(0.013) (0.032) (0.029) (0.035) (0.037)
log(age) 0.148*** 0.066 -0.002 0.005 -0.022(0.023) (0.044) (0.039) (0.049) (0.059)
Leverage -0.260** -0.119 -0.109 -0.291 -0.309(0.116) (0.177) (0.197) (0.188) (0.214)
Cap. exp. 2.183*** 0.150 0.122 0.417 0.403(0.435) (0.492) (0.525) (0.524) (0.572)
log(Q) 0.199*** 0.064* 0.057 0.098** 0.085**(0.027) (0.033) (0.036) (0.038) (0.040)
Boardsize 0.009 0.019 -0.002 -0.014 -0.012(0.009) (0.014) (0.016) (0.015) (0.018)
log(sales/employee) -0.027 -0.063 -0.054 0.023 0.030(0.034) (0.072) (0.104) (0.120) (0.120)
ROA -0.357** -0.085 -0.062 -0.501* -0.515*(0.172) (0.232) (0.303) (0.293) (0.290)
Independent board 0.351*** 0.280*** 0.217*** 0.208** 0.199**(0.079) (0.080) (0.081) (0.088) (0.088)
Observations 6076 6076 4393 4393 4393R2 0.602 0.207 0.176 0.412 0.416Year fixed effects Yes Yes Yes Yes YesFirm fixed effects No Yes Yes Yes YesTrend control No No No Yes YesControls * post-SOX No No No No Yes
Notes: The dependent variable is the logarithm of one plus the no. of eventually granted patents.All explanatory variables are lagged by one period. Specification (a) includes untabulated 3-digitSIC industry dummies and a dummy that marks all treated firms. Independent board is a dummythat indicates firms after they switched from a minority of independent board members to a ma-jority of independent board members in 2001 or later. Control variables are defined in section 4.2.Heteroskedasticity-robust standard errors that account for autocorrelation at the firm level arereported in parentheses. Coefficients: *** Significant at 1%, ** Significant at 5% level, * Significantat 10% level.
42

Table 4: Independent boards and no. of cite-weighted patents
(a) (b) (c) (d) (e)b/se b/se b/se b/se b/se
log(total assets) 0.429*** 0.264*** 0.239** 0.310*** 0.429***(0.030) (0.088) (0.093) (0.112) (0.121)
R&D 0.522*** 0.002 -0.026 -0.066 -0.033(0.022) (0.053) (0.058) (0.067) (0.069)
log(age) 0.206*** 0.075 0.018 0.036 -0.050(0.037) (0.057) (0.059) (0.081) (0.091)
Leverage -0.106 0.159 0.296 0.100 -0.025(0.193) (0.267) (0.308) (0.311) (0.400)
Cap. exp. 3.319*** 0.265 0.399 0.889 0.864(0.740) (0.835) (0.891) (1.007) (1.142)
log(Q) 0.363*** 0.211*** 0.241*** 0.265*** 0.306***(0.047) (0.057) (0.062) (0.076) (0.085)
Boardsize -0.008 0.001 -0.024 -0.041 -0.047(0.015) (0.021) (0.027) (0.028) (0.033)
log(sales/employee) -0.127** 0.007 0.072 0.071 0.065(0.055) (0.106) (0.153) (0.189) (0.187)
ROA -0.515 0.028 -0.384 -0.783 -0.683(0.326) (0.385) (0.523) (0.592) (0.581)
Independent board 0.665*** 0.665*** 0.556*** 0.437*** 0.432***(0.121) (0.114) (0.118) (0.137) (0.140)
Observations 6076 6076 4393 4393 4393R2 0.536 0.316 0.284 0.444 0.450Year fixed effects Yes Yes Yes Yes YesFirm fixed effects No Yes Yes Yes YesTrend control No No No Yes YesControls * post-SOX No No No No Yes
Notes: The dependent variable is the logarithm of one plus the no. of citation-weighted patents.All explanatory variables are lagged by one period. Specification (a) includes untabulated 3-digitSIC industry dummies and a dummy that marks all treated firms. Independent board is a dummythat indicates firms after they switched from a minority of independent board members to a ma-jority of independent board members in 2001 or later. Control variables are defined in section 4.2.Heteroskedasticity-robust standard errors that account for autocorrelation at the firm level arereported in parentheses. Coefficients: *** Significant at 1%, ** Significant at 5% level, * Significantat 10% level.
43

Table 5: Independent boards and Top 1% patents
(a) (b) (c) (d) (e)b/se b/se b/se b/se b/se
log(total assets) 0.099*** 0.039** 0.057*** 0.059*** 0.045**(0.007) (0.017) (0.017) (0.022) (0.023)
R&D 0.071*** 0.008 0.012* 0.008 0.006(0.004) (0.006) (0.007) (0.008) (0.009)
log(age) 0.046*** 0.013 0.005 0.000 -0.004(0.007) (0.010) (0.008) (0.011) (0.013)
Leverage -0.148*** -0.056 -0.123*** -0.160*** -0.128*(0.035) (0.045) (0.044) (0.060) (0.071)
Cap. exp. 0.579*** -0.122 -0.070 -0.049 -0.006(0.148) (0.120) (0.106) (0.133) (0.153)
log(Q) 0.019** 0.003 -0.007 -0.009 -0.013(0.008) (0.011) (0.013) (0.015) (0.015)
Boardsize -0.001 0.004 0.001 -0.002 0.002(0.003) (0.003) (0.004) (0.005) (0.005)
log(sales/employee) 0.030** -0.017 -0.034 -0.033 -0.029(0.012) (0.018) (0.026) (0.037) (0.036)
ROA -0.042 -0.025 -0.096 -0.182 -0.186(0.053) (0.063) (0.092) (0.127) (0.128)
Independent board 0.031 0.044* 0.031 0.045* 0.040(0.027) (0.024) (0.025) (0.027) (0.027)
Observations 6076 6076 4393 4393 4393R2 0.337 0.010 0.017 0.184 0.186Year fixed effects Yes Yes Yes Yes YesFirm fixed effects No Yes Yes Yes YesTrend control No No No Yes YesControls * post-SOX No No No No Yes
Notes: The dependent variable is the logarithm of one plus the number of patents that fall inthe top 1% percentile of the citation distribution within patent class and application year. All ex-planatory variables are lagged by one period. Specification (a) includes untabulated 3-digit SICindustry dummies and a dummy that marks all treated firms. Independent board is a dummythat indicates firms after they switched from a minority of independent board members to a ma-jority of independent board members in 2001 or later. Control variables are defined in section 4.2.Heteroskedasticity-robust standard errors that account for autocorrelation at the firm level arereported in parentheses. Coefficients: *** Significant at 1%, ** Significant at 5% level, * Significantat 10% level.
44

Table 6: Independent boards and Top 10% patents
(a) (b) (c) (d) (e)b/se b/se b/se b/se b/se
log(total assets) 0.210*** 0.095*** 0.116*** 0.121*** 0.077**(0.012) (0.030) (0.032) (0.036) (0.038)
R&D 0.192*** 0.019 0.010 0.003 -0.002(0.008) (0.012) (0.013) (0.018) (0.021)
log(age) 0.098*** 0.042** 0.031** 0.034* 0.039*(0.015) (0.017) (0.014) (0.020) (0.023)
Leverage -0.179** 0.034 -0.057 -0.096 -0.090(0.074) (0.073) (0.082) (0.096) (0.112)
Cap. exp. 1.258*** -0.208 -0.207 -0.183 -0.042(0.317) (0.204) (0.219) (0.226) (0.279)
log(Q) 0.083*** 0.039** 0.033 0.049* 0.042(0.018) (0.018) (0.021) (0.028) (0.026)
Boardsize -0.001 0.004 -0.004 -0.007 -0.001(0.006) (0.006) (0.007) (0.008) (0.009)
log(sales/employee) 0.044* -0.002 -0.004 -0.000 0.004(0.025) (0.033) (0.042) (0.052) (0.051)
ROA -0.182 -0.191* -0.178 -0.333* -0.348*(0.113) (0.114) (0.151) (0.180) (0.182)
Independent board 0.095* 0.070* 0.056 0.066 0.065(0.052) (0.039) (0.041) (0.056) (0.054)
Observations 6076 6076 4393 4393 4393R2 0.441 0.019 0.023 0.211 0.217Year fixed effects Yes Yes Yes Yes YesFirm fixed effects No Yes Yes Yes YesTrend control No No No Yes YesControls * post-SOX No No No No Yes
Notes: The dependent variable is the logarithm of one plus the number of patents that fall inthe top 10% centile of the citation distribution within patent class and application year. All ex-planatory variables are lagged by one period. Specification (a) includes untabulated 3-digit SICindustry dummies and a dummy that marks all treated firms. Independent board is a dummythat indicates firms after they switched from a minority of independent board members to a ma-jority of independent board members in 2001 or later. Control variables are defined in section 4.2.Heteroskedasticity-robust standard errors that account for autocorrelation at the firm level arereported in parentheses. Coefficients: *** Significant at 1%, ** Significant at 5% level, * Significantat 10% level.
45

Table 7: Independent boards and cited patents, not in top 10%
(a) (b) (c) (d) (e)b/se b/se b/se b/se b/se
log(total assets) 0.354*** 0.240*** 0.217*** 0.260*** 0.307***(0.018) (0.052) (0.054) (0.059) (0.066)
R&D 0.346*** 0.028 0.005 -0.018 -0.019(0.012) (0.025) (0.025) (0.028) (0.030)
log(age) 0.140*** 0.046 0.003 0.009 -0.021(0.023) (0.035) (0.032) (0.042) (0.049)
Leverage -0.237** -0.050 -0.044 -0.136 -0.119(0.110) (0.150) (0.159) (0.162) (0.191)
Cap. exp. 2.539*** 0.347 0.433 0.662 0.649(0.431) (0.409) (0.430) (0.468) (0.536)
log(Q) 0.177*** 0.100*** 0.105*** 0.111*** 0.108***(0.026) (0.031) (0.032) (0.035) (0.038)
Boardsize -0.001 0.010 -0.001 -0.014 -0.013(0.009) (0.012) (0.015) (0.014) (0.016)
log(sales/employee) -0.045 -0.063 0.016 0.057 0.061(0.032) (0.062) (0.088) (0.098) (0.098)
ROA -0.284* -0.108 -0.173 -0.460* -0.450*(0.165) (0.197) (0.260) (0.272) (0.270)
Independent board 0.390*** 0.357*** 0.271*** 0.236*** 0.228***(0.071) (0.065) (0.066) (0.072) (0.073)
Observations 6076 6076 4393 4393 4393R2 0.571 0.247 0.205 0.417 0.421Year fixed effects Yes Yes Yes Yes YesFirm fixed effects No Yes Yes Yes YesTrend control No No No Yes YesControls * post-SOX No No No No Yes
Notes: The dependent variable is the logarithm of one plus the number of patents that are cited butdo not fall in the top 10% of the citation distribution. All explanatory variables are lagged by oneperiod. Specification (a) includes untabulated 3-digit SIC industry dummies and a dummy thatmarks all treated firms. Independent board is a dummy that indicates firms after they switchedfrom a minority of independent board members to a majority of independent board membersin 2001 or later. Control variables are defined in section 4.2. Heteroskedasticity-robust standarderrors that account for autocorrelation at the firm level are reported in parentheses. Coefficients:*** Significant at 1%, ** Significant at 5% level, * Significant at 10% level.
46
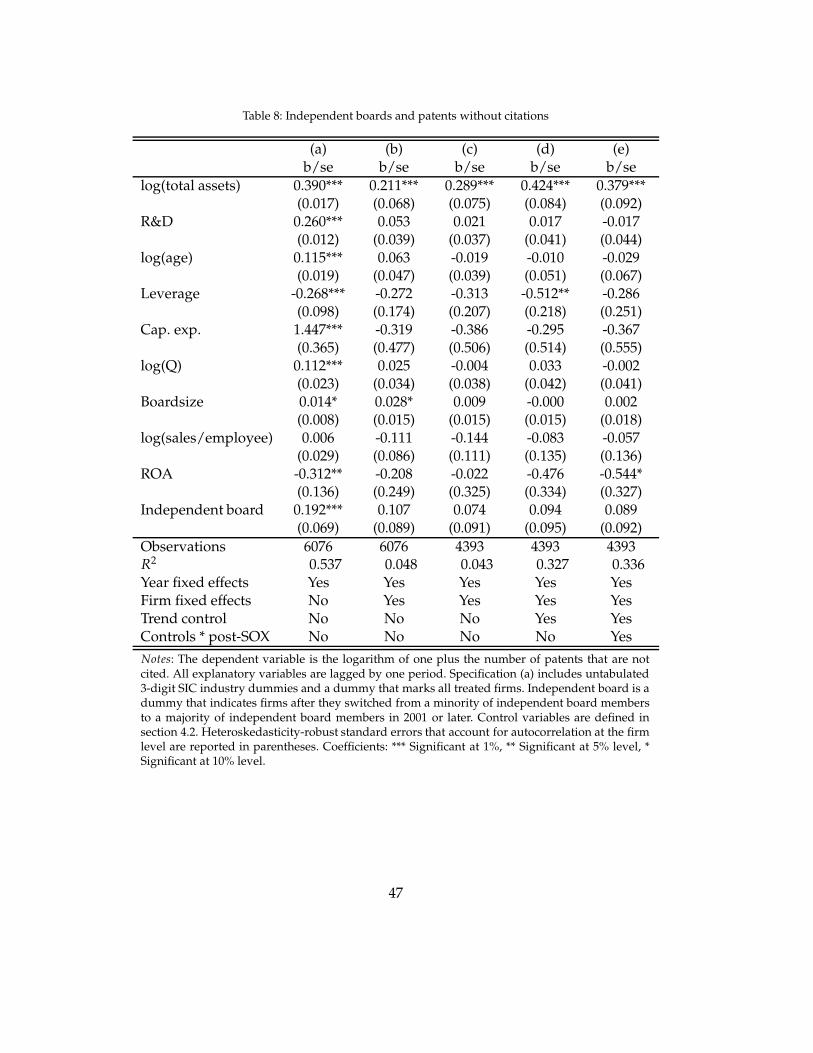
Table 8: Independent boards and patents without citations
(a) (b) (c) (d) (e)b/se b/se b/se b/se b/se
log(total assets) 0.390*** 0.211*** 0.289*** 0.424*** 0.379***(0.017) (0.068) (0.075) (0.084) (0.092)
R&D 0.260*** 0.053 0.021 0.017 -0.017(0.012) (0.039) (0.037) (0.041) (0.044)
log(age) 0.115*** 0.063 -0.019 -0.010 -0.029(0.019) (0.047) (0.039) (0.051) (0.067)
Leverage -0.268*** -0.272 -0.313 -0.512** -0.286(0.098) (0.174) (0.207) (0.218) (0.251)
Cap. exp. 1.447*** -0.319 -0.386 -0.295 -0.367(0.365) (0.477) (0.506) (0.514) (0.555)
log(Q) 0.112*** 0.025 -0.004 0.033 -0.002(0.023) (0.034) (0.038) (0.042) (0.041)
Boardsize 0.014* 0.028* 0.009 -0.000 0.002(0.008) (0.015) (0.015) (0.015) (0.018)
log(sales/employee) 0.006 -0.111 -0.144 -0.083 -0.057(0.029) (0.086) (0.111) (0.135) (0.136)
ROA -0.312** -0.208 -0.022 -0.476 -0.544*(0.136) (0.249) (0.325) (0.334) (0.327)
Independent board 0.192*** 0.107 0.074 0.094 0.089(0.069) (0.089) (0.091) (0.095) (0.092)
Observations 6076 6076 4393 4393 4393R2 0.537 0.048 0.043 0.327 0.336Year fixed effects Yes Yes Yes Yes YesFirm fixed effects No Yes Yes Yes YesTrend control No No No Yes YesControls * post-SOX No No No No Yes
Notes: The dependent variable is the logarithm of one plus the number of patents that are notcited. All explanatory variables are lagged by one period. Specification (a) includes untabulated3-digit SIC industry dummies and a dummy that marks all treated firms. Independent board is adummy that indicates firms after they switched from a minority of independent board membersto a majority of independent board members in 2001 or later. Control variables are defined insection 4.2. Heteroskedasticity-robust standard errors that account for autocorrelation at the firmlevel are reported in parentheses. Coefficients: *** Significant at 1%, ** Significant at 5% level, *Significant at 10% level.
47

Table 9: Independent boards and backward citations
(a) (b) (c) (d) (e)b/se b/se b/se b/se b/se
log(total assets) 0.464*** 0.373*** 0.390*** 0.588*** 0.610***(0.036) (0.108) (0.113) (0.129) (0.142)
R&D 0.611*** 0.013 -0.041 -0.066 -0.116(0.026) (0.059) (0.056) (0.075) (0.080)
log(age) 0.204*** 0.017 -0.022 0.009 -0.109(0.045) (0.065) (0.077) (0.096) (0.109)
Leverage 0.116 0.209 0.219 -0.225 -0.153(0.232) (0.306) (0.360) (0.369) (0.437)
Cap. exp. 2.515*** 0.078 0.086 0.602 0.670(0.821) (0.979) (1.044) (1.128) (1.259)
log(Q) 0.285*** 0.124* 0.153** 0.202** 0.200**(0.052) (0.065) (0.071) (0.084) (0.092)
Boardsize -0.008 -0.001 -0.021 -0.041 -0.044(0.018) (0.023) (0.029) (0.030) (0.035)
log(sales/employee) -0.194*** -0.069 -0.075 0.074 0.119(0.064) (0.120) (0.171) (0.196) (0.196)
ROA -0.110 0.063 0.022 -0.622 -0.664(0.350) (0.440) (0.570) (0.613) (0.603)
Independent board 0.581*** 0.486*** 0.482*** 0.389** 0.384**(0.151) (0.135) (0.141) (0.176) (0.176)
Observations 6076 6076 4393 4393 4393R2 0.484 0.115 0.105 0.296 0.300Year fixed effects Yes Yes Yes Yes YesFirm fixed effects No Yes Yes Yes YesTrend control No No No Yes YesControls * post-SOX No No No No Yes
Notes: The dependent variable is the logarithm of one plus the number of backward citations. Allexplanatory variables are lagged by one period. Specification (a) includes untabulated 3-digit SICindustry dummies and a dummy that marks all treated firms. Independent board is a dummythat indicates firms after they switched from a minority of independent board members to a ma-jority of independent board members in 2001 or later. Control variables are defined in section 4.2.Heteroskedasticity-robust standard errors that account for autocorrelation at the firm level arereported in parentheses. Coefficients: *** Significant at 1%, ** Significant at 5% level, * Significantat 10% level.
48

Table 10: Independent boards and self-cites
(a) (b) (c) (d) (e)b/se b/se b/se b/se b/se
log(total assets) 0.432*** 0.189*** 0.162** 0.266*** 0.281***(0.024) (0.072) (0.069) (0.085) (0.099)
R&D 0.440*** 0.037 0.008 -0.007 -0.023(0.017) (0.038) (0.035) (0.049) (0.054)
log(age) 0.210*** 0.073 0.014 0.030 -0.002(0.031) (0.048) (0.046) (0.061) (0.072)
Leverage -0.108 -0.039 -0.045 -0.322 -0.205(0.164) (0.228) (0.259) (0.266) (0.350)
Cap. exp. 3.964*** 0.973* 0.840 1.241* 1.400*(0.616) (0.588) (0.610) (0.707) (0.831)
log(Q) 0.266*** 0.059 0.052 0.086* 0.097*(0.038) (0.042) (0.043) (0.046) (0.052)
Boardsize 0.009 0.024 0.010 -0.013 -0.016(0.013) (0.016) (0.018) (0.018) (0.022)
log(sales/employee) -0.130*** 0.002 0.078 0.158 0.171(0.046) (0.083) (0.118) (0.137) (0.138)
ROA -0.321 -0.452 -0.488 -0.812** -0.802**(0.245) (0.277) (0.344) (0.352) (0.351)
Independent board 0.442*** 0.365*** 0.284*** 0.254*** 0.253***(0.104) (0.080) (0.081) (0.095) (0.095)
Observations 6076 6076 4393 4393 4393R2 0.504 0.089 0.061 0.288 0.290Year fixed effects Yes Yes Yes Yes YesFirm fixed effects No Yes Yes Yes YesTrend control No No No Yes YesControls * post-SOX No No No No Yes
Notes: The dependent variable is the logarithm of one plus the number of backward citations. Allexplanatory variables are lagged by one period. Specification (a) includes untabulated 3-digit SICindustry dummies and a dummy that marks all treated firms. Independent board is a dummythat indicates firms after they switched from a minority of independent board members to a ma-jority of independent board members in 2001 or later. Control variables are defined in section 4.2.Heteroskedasticity-robust standard errors that account for autocorrelation at the firm level arereported in parentheses. Coefficients: *** Significant at 1%, ** Significant at 5% level, * Significantat 10% level.
49

Table 11: Independent boards and patents in known classes
(a) (b) (c) (d) (e)b/se b/se b/se b/se b/se
log(total assets) 0.427*** 0.250*** 0.283*** 0.384*** 0.448***(0.019) (0.058) (0.061) (0.065) (0.076)
R&D 0.372*** 0.028 0.003 -0.011 -0.025(0.013) (0.033) (0.030) (0.035) (0.037)
log(age) 0.151*** 0.059 -0.021 -0.021 -0.042(0.023) (0.046) (0.040) (0.051) (0.060)
Leverage -0.312*** -0.215 -0.229 -0.412** -0.439*(0.116) (0.180) (0.200) (0.192) (0.224)
Cap. exp. 2.198*** 0.009 0.046 0.191 0.216(0.443) (0.480) (0.517) (0.500) (0.558)
log(Q) 0.216*** 0.068** 0.065* 0.108*** 0.099**(0.027) (0.034) (0.037) (0.038) (0.040)
Boardsize 0.011 0.025* 0.007 -0.004 -0.000(0.009) (0.014) (0.016) (0.015) (0.017)
log(sales/employee) -0.028 -0.061 -0.045 0.002 0.007(0.034) (0.072) (0.103) (0.118) (0.119)
ROA -0.398** -0.124 -0.097 -0.450 -0.458(0.170) (0.228) (0.298) (0.288) (0.287)
Independent board 0.365*** 0.298*** 0.233*** 0.208** 0.197**(0.079) (0.079) (0.080) (0.083) (0.083)
Observations 6076 6076 4393 4393 4393R2 0.604 0.185 0.154 0.404 0.409Year fixed effects Yes Yes Yes Yes YesFirm fixed effects No Yes Yes Yes YesTrend control No No No Yes YesControls * post-SOX No No No No Yes
Notes: The dependent variable is the logarithm of one plus the number of patents filed in classeswhere the given firm had already at least on other patent filed any previous year. All explana-tory variables are lagged by one period. Specification (a) includes untabulated 3-digit SIC indus-try dummies and a dummy that marks all treated firms. Independent board is a dummy thatindicates firms after they switched from a minority of independent board members to a major-ity of independent board members in 2001 or later. Control variables are defined in section 4.2.Heteroskedasticity-robust standard errors that account for autocorrelation at the firm level arereported in parentheses. Coefficients: *** Significant at 1%, ** Significant at 5% level, * Significantat 10% level.
50

Table 12: Independent boards and patents in unknown classes
(a) (b) (c) (d) (e)b/se b/se b/se b/se b/se
log(total assets) 0.101*** 0.087*** 0.090** 0.095** 0.144***(0.009) (0.032) (0.035) (0.039) (0.044)
R&D 0.066*** -0.003 0.002 -0.002 0.010(0.007) (0.018) (0.019) (0.028) (0.030)
log(age) 0.006 0.017 0.024 0.035 0.021(0.010) (0.019) (0.020) (0.025) (0.029)
Leverage -0.014 0.120 0.103 0.090 -0.018(0.057) (0.087) (0.097) (0.115) (0.135)
Cap. exp. 1.031*** 0.841*** 0.739** 0.862** 0.986**(0.236) (0.304) (0.323) (0.391) (0.449)
log(Q) 0.052*** 0.056*** 0.043** 0.023 0.012(0.013) (0.018) (0.020) (0.026) (0.028)
Boardsize 0.003 0.005 -0.004 -0.009 -0.012(0.005) (0.008) (0.011) (0.012) (0.012)
log(sales/employee) 0.035** 0.012 0.077 0.094 0.085(0.017) (0.040) (0.055) (0.067) (0.066)
ROA 0.098 0.157 0.009 -0.105 -0.085(0.084) (0.140) (0.176) (0.205) (0.205)
Independent board 0.110*** 0.065 0.027 0.047 0.046(0.035) (0.044) (0.045) (0.053) (0.053)
Observations 6076 6076 4393 4393 4393R2 0.329 0.134 0.114 0.284 0.289Year fixed effects Yes Yes Yes Yes YesFirm fixed effects No Yes Yes Yes YesTrend control No No No Yes YesControls * post-SOX No No No No Yes
Notes: The dependent variable is the logarithm of one plus the number of patents filed in classeswhere the given firm had no other patent filed in any previous year. All explanatory variables arelagged by one period. Specification (a) includes untabulated 3-digit SIC industry dummies anda dummy that marks all treated firms. Independent board is a dummy that indicates firms afterthey switched from a minority of independent board members to a majority of independent boardmembers in 2001 or later. Control variables are defined in section 4.2. Heteroskedasticity-robuststandard errors that account for autocorrelation at the firm level are reported in parentheses.Coefficients: *** Significant at 1%, ** Significant at 5% level, * Significant at 10% level.
51

Table 13: Independent boards and technological proximity
(a) (b) (c) (d) (e)b/se b/se b/se b/se b/se
log(total assets) 0.039 0.208** 0.269*** 0.447*** 0.441***(0.029) (0.090) (0.098) (0.115) (0.123)
R&D 0.246*** -0.083 -0.101 -0.132* -0.187**(0.022) (0.059) (0.063) (0.077) (0.080)
log(age) 0.068** -0.004 -0.024 -0.024 -0.052(0.030) (0.052) (0.063) (0.077) (0.082)
Leverage 0.382** -0.122 -0.096 -0.518 -0.586(0.168) (0.264) (0.314) (0.350) (0.427)
Cap. exp. 0.456 -0.200 -0.344 -0.192 -0.092(0.701) (0.884) (0.979) (0.963) (1.079)
log(Q) 0.191*** 0.019 0.048 0.098 0.106(0.037) (0.051) (0.058) (0.069) (0.076)
Boardsize -0.007 0.026 0.012 0.013 0.023(0.013) (0.018) (0.022) (0.025) (0.030)
log(sales/employee) -0.085 0.025 -0.124 -0.161 -0.133(0.052) (0.092) (0.141) (0.182) (0.183)
ROA 0.204 0.137 0.249 0.030 -0.034(0.274) (0.369) (0.486) (0.508) (0.510)
Independent board 0.294** 0.244** 0.279** 0.168 0.158(0.123) (0.122) (0.129) (0.140) (0.141)
Observations 6076 6076 4393 4393 4393R2 0.260 0.118 0.114 0.295 0.298Year fixed effects Yes Yes Yes Yes YesFirm fixed effects No Yes Yes Yes YesTrend control No No No Yes YesControls * post-SOX No No No No Yes
Notes: The dependent variable is the technological proximity between the patents filed in year tto the existing patent portfolio held by the same firm up to year t-1, and is calculated accordingto Jaffe (1989). All explanatory variables are lagged by one period. Specification (a) includes unt-abulated 3-digit SIC industry dummies and a dummy that marks all treated firms. Independentboard is a dummy that indicates firms after they switched from a minority of independent boardmembers to a majority of independent board members in 2001 or later. Control variables are de-fined in section 4.2. Heteroskedasticity-robust standard errors that account for autocorrelation atthe firm level are reported in parentheses. Coefficients: *** Significant at 1%, ** Significant at 5%level, * Significant at 10% level.
52

8.2 Average no. of backward citations and self citations
Table 14: Independent boards and average no. of backward cites
(a) (b) (c) (d) (e)b/se b/se b/se b/se b/se
log(total assets) 0.041** 0.054 0.021 0.002 -0.008(0.017) (0.050) (0.065) (0.082) (0.088)
R&D 0.012 -0.025 -0.281 -0.230 -0.443(0.378) (0.486) (0.710) (0.877) (0.873)
log(age) -0.038 -0.004 -0.007 0.053 0.002(0.025) (0.035) (0.040) (0.052) (0.062)
Leverage 0.220* 0.041 0.025 -0.163 -0.267(0.130) (0.143) (0.175) (0.224) (0.259)
Cap. exp. 1.068* 0.623 0.527 -0.144 -0.175(0.545) (0.464) (0.512) (0.737) (0.774)
log(Q) 0.093*** 0.028 0.036 0.033 0.043(0.027) (0.029) (0.035) (0.042) (0.047)
Boardsize -0.017 -0.005 -0.004 -0.014 -0.020(0.010) (0.011) (0.016) (0.019) (0.025)
Independent board 0.217** 0.154* 0.197** 0.179* 0.181*(0.104) (0.082) (0.084) (0.102) (0.105)
Observations 3888 3888 2630 2630 2630R2 0.214 0.022 0.018 0.269 0.273Year fixed effects Yes Yes Yes Yes YesFirm fixed effects No Yes Yes Yes YesTrend control No No No Yes YesControls * post-SOX No No No No Yes
Notes: The dependent variable is the logarithm of one plus the average number of backward ci-tations per patent. All explanatory variables are lagged by one period. Specification (a) includesuntabulated 3-digit SIC industry dummies and a dummy that marks all treated firms. Indepen-dent board is a dummy that indicates firms after they switched from a minority of independentboard members to a majority of independent board members in 2001 or later. Control variablesare defined in section 4.2. Heteroskedasticity-robust standard errors that account for autocorrela-tion at the firm level are reported in parentheses. Coefficients: *** Significant at 1%, ** Significantat 5% level, * Significant at 10% level.
53

Table 15: Independent boards and average no. of self-cites
(a) (b) (c) (d) (e)b/se b/se b/se b/se b/se
log(total assets) 0.086*** -0.046 -0.041 0.009 0.005(0.011) (0.036) (0.047) (0.063) (0.067)
R&D 0.654** -0.347 -0.514 -0.641 -0.841(0.254) (0.313) (0.493) (0.597) (0.526)
log(age) 0.035** 0.024 0.009 0.007 0.007(0.015) (0.022) (0.027) (0.034) (0.035)
Leverage 0.160* -0.039 -0.144 -0.241 -0.165(0.086) (0.119) (0.149) (0.194) (0.245)
Cap. exp. 1.356*** 0.488 0.464 0.419 0.504(0.331) (0.350) (0.403) (0.582) (0.616)
log(Q) 0.105*** -0.009 -0.028 -0.001 0.017(0.016) (0.018) (0.022) (0.030) (0.035)
Boardsize 0.007 0.014** 0.011 0.001 -0.008(0.006) (0.007) (0.009) (0.011) (0.013)
Independent board 0.156** 0.166*** 0.167*** 0.143** 0.144**(0.065) (0.049) (0.051) (0.067) (0.066)
Observations 3888 3888 2630 2630 2630R2 0.228 0.023 0.027 0.237 0.240Year fixed effects Yes Yes Yes Yes YesFirm fixed effects No Yes Yes Yes YesTrend control No No No Yes YesControls * post-SOX No No No No Yes
Notes: The dependent variable is the logarithm of one plus the average number of self-citationsper patent. All explanatory variables are lagged by one period. Specification (a) includes untab-ulated 3-digit SIC industry dummies and a dummy that marks all treated firms. Independentboard is a dummy that indicates firms after they switched from a minority of independent boardmembers to a majority of independent board members in 2001 or later. Control variables are de-fined in section 4.2. Heteroskedasticity-robust standard errors that account for autocorrelation atthe firm level are reported in parentheses. Coefficients: *** Significant at 1%, ** Significant at 5%level, * Significant at 10% level.
54