can boards restrain overconfident ceos - rutgers …raw.rutgers.edu/docs/seminars/fall11/... ·...
TRANSCRIPT

Can strong boards and trading experience help CEOs make better
decisions? Evidence from acquisitions by overconfident CEOs
By
Adam C. Kolasinski
The Michael G. Foster School of Business
University of Washington
Seattle, WA 98105
Xu Li
College of Business and Economics
Lehigh University
Bethlehem, PA 18015
Oct, 2011
_____________________________
We are grateful to, Jarrad Harford, S.P. Kothari, Jonathan Karpoff, Emek Bascar,
Somnath Das, Jere Francis, Inder Khurana, Michael Kirschenheiter, Ram Ramakrishnan
and workshop participants at the University of Washington at Seattle, University of
Missouri at Columbia and University of Illinois at Chicago for their helpful discussions
and comments.

Can strong boards and trading experience help CEOs make better
decisions?
Evidence from acquisitions by overconfident CEOs
Abstract
While there is much evidence on corporate boards mitigating agency problems, there is
little on whether boards help managers make better decisions. We provide evidence that
strong and independent boards help overconfident CEOs avoid honest mistakes when
they seek to acquire other companies. In addition, we find that once-overconfident CEOs
make better acquisition decisions after they experience personal stock trading losses,
providing evidence that a manager's recent personal experience, and not just educational
and early career experience, influences firm investment policy. Finally, we develop and
validate a new CEO overconfidence measure that is easily constructed from machine-
readable insider trading data, unlike previously-used measures.

1
In theory, corporate boards exist to mitigate agency problems, select managers,
and help managers make better strategic decisions. Empirical research on boards,
however, largely focuses on their agency mitigation and managerial selection roles. 1
As
Helland and Sykuta (2004) point out, there is little evidence on their role in improving
strategic decision-making.2 In this study, we find evidence that strong, independent
boards help managers avoid honest mistakes when they seek to acquire other companies.
We also find that managers’ recent stock trading experience improves their corporate
acquisition policy. Hence we demonstrate that firm investment policy can be impacted by
a manager’s recent experience, in addition to the formative educational and early career
experience studied in prior literature (eg., Bertrand and Schoar, 2003, Graham and
Narasimhan, 2004, Xuan, 2009).
Prior research finds that overconfident CEOs destroy a significant amount of
shareholder value through poor acquisition decisions (eg., Billet and Qian, 2011,
Malmendier and Tate, 2008). As Roll (1986) points out, however, overconfidence is not
an agency problem, since overconfident CEOs honestly believe they are creating
shareholder value as they are destroying it. Malmendier and Tate (2008) conjecture that
preventing overconfidence-driven acquisitions could be a way that independent directors
add value beyond simply reducing agency problems or selecting managers. We test and
confirm this conjecture, finding that outsider-dominated boards that are not large
(henceforth “strong and independent boards”), attenuate the effect of CEO
overconfidence on firm acquisitiveness. The effect is stronger for diversifying
acquisitions, which are more likely to result from CEO overconfidence (Malmendier and
1 See Hermalin and Weisbach (2002) and Adams, Hermalin and Weisbach (2010) for literature surveys.
2 Evidence on this role, in addition to Helland and Sekuta (2004), includes Agrawal and Knoeber (2001),
Booth and Deli (1996), Coles, Daniel, and Naveen (2008), and Graham, Hazarika, and Narasimhan (2009)

2
Tate, 2008). Our results imply that strong and independent boards indeed help managers
avoid making honest mistakes in their acquisition decisions, providing some of the first
evidence that the destructive effects of CEO overconfidence can be mitigated.
It is well-established empirically that a CEO’s personal experience impacts firm
investment policy. However, the extant evidence is largely limited to formative
educational and early career experience, which affects a CEO’s future corporate decisions
by creating a fixed character trait, such as conservatism (Bertrand and Schoar, 2003, and
Graham and Narasimhan, 2004), or favoritism for a division in which the CEO spent her
early career (Xuan, 2009). In contrast, we find that when overconfident CEOs are
chastened by a recent personal trading loss in their own firm’s stock, they display less
overconfidence in their subsequent acquisition decisions. Hence we show that even recent
CEO experience, not just formative experience, affects firm investment policy. Our
results also imply that, though prior literature finds CEO overconfidence is often
persistent (e.g., Billet and Quian, 2011, Goel and Thakor, 2008, Malmendier and Tate,
2005b), overconfidence can be overcome if the CEO directly and unambiguously feels its
negative consequences in a timely manner.
We also provide a new measure of CEO overconfidence based on widely-
available, machine-readable data. The option and press-based measures that Malmendier
and Tate (2005a, 2008) use require extensive, costly hand collection. As a result, prior
empirical research on CEO overconfidence is largely limited to a relatively small sample
of less than 500 large firms that ends in 1994. In contrast, our measure can be easily
constructed for nearly the entire CRSP universe from 1986 to the present. We identify as
overconfident those CEOs who are about to purchase their own company’s stock and

3
earn a negative abnormal return on the trade, thereby revealing that they mistakenly
believe their own firm’s stock is undervalued, fitting precisely the definition of
overconfidence in the theoretical literature (Hackbarth 2007, Heaton 2002, Malmendier
and Tate, 2005a, and Roll, 1986). Our measure is similar in spirit to Malmendier and
Tate’s (2008) “Longholder: should have exercised” measure, which classifies CEOs
holding options until expiration as overconfident only when this strategy results in
negative abnormal returns. Our measure is thus consistent with both theory and prior
empirical measures. Its low cost will allow researchers to study CEO overconfidence in a
broader sample of firms and for more recent time periods. In addition, it will make it less
costly for researchers investigating other finance topics to control for CEO
overconfidence.
To ensure that we are capturing the effect of CEO overconfidence and not just
CEO buying, we also consider CEOs who appear justifiably confident, that is, CEOs who
are about to buy stock in their own firm and earn a positive abnormal return. We find
that, like overconfident CEOs, justifiably confident CEOs are more acquisitive. However,
while overconfident CEOs are more likely to make diversifying acquisitions, this is not
true of justifiably confident CEOs. Furthermore, while we find that the announcement
returns for mergers conducted by overconfident CEOs are significantly more negative
than that of the average merger, the same is not true for mergers conducted by justifiably
confident CEOs. Finally, while we find that outsider-dominated boards that are not too
large restrain the acquisitiveness of overconfident CEOs, they do not affect the
acquisitiveness of CEOs who are justifiably confident. Hence strong and independent
boards restrain overconfident CEOs, but not the justifiably confident.

4
Ours is not the only new overconfidence measure that can be constructed with
machine-readable data. Campbell, Johnson, Rutherford, and Stanley (2010) use
Execucomp to classify CEOs as overconfident when they hold vested options with high
average moneyness. Unlike our measure, and the aforementioned refined measure of
Malmendier and Tate, that of Campbell et al ignores the returns CEOs earn from their
trading strategy. Hence their measure misclassifies as overconfident rational CEOs who
profit from delaying exercise. This shortcoming is likely important in the M&A context,
as Malmendier and Tate (2008) show that the link between mergers and delayed CEO
option exercise is only significant when the CEO earns negative abnormal returns from
the exercise strategy.3 Further, we find the Campbell et al measure is positively related to
merger announcement returns, suggesting it is unreliable in the M&A context. Finally,
our measure is available for the entire CRSP-COMPUSTAT universe, whereas the
Campbell et al measure is limited to the S&P 1500.
Since prior research shows that board structure is not random, we consider the
possibility that endogeneity is driving our finding that strong, independent boards
attenuate the effect of CEO overconfidence on acquisitiveness. We believe this
possibility to be unlikely for two reasons. First, Hermalin and Weisbach (2003) argue that
endogeneity is unlikely to confound researchers’ inferences when studying the relation
between board structure and board performance on particular tasks, such as vetting
acquisitions. Hence we follow many recent studies that treat board structure as exogenous
when examining its impact on specific board tasks.4 Second, we study not the direct
impact of board structure on any dependent variable, but rather an interactive effect. That
3 See Table 7 on p. 37 of Malmendier and Tate (2008).
4 See Cornett, Millon and Tehranian (2008), Fich and Shivdasani (2006), Khorana, Tufano and Wedge
(2007), and Paul (2007)

5
is, we study not how board structure impacts acquisitiveness, but rather, how board
structure attenuates the effect of CEO overconfidence on acquisitiveness. Hence, for
endogeneity to be driving our results, there would have to be some variable correlated
with board structure that is itself not related to acquisitiveness, but merely attenuates the
effect of CEO overconfidence on acquisitiveness.5 To our knowledge, economic theory
provides no reason to believe such an omitted variable exists. Nevertheless, in robustness
checks we control for various firm characteristics shown in prior literature to be related to
board structure, and allow for these characteristics to have an attenuating impact on the
effect of CEO overconfidence on acquisitiveness. Our point estimates of the extent to
which board structure attenuates the effect of overconfidence on acquisitiveness are
statistically and economically unchanged when we add these extra variables and
interaction terms. Hence we can rule out the proposition that any of these observable
variables, as well as any unobservable variables correlated with them, is driving our
results, making it extremely unlikely that endogeneity is an issue in our context.
The issue of CEO overconfidence has gained considerable attention in the
literature. Hackbarth (2007), Heaton (2002), Malmendier and Tate (2005a) and Roll
(1986) develop theoretical models that analyze the effect of CEO overconfidence on
corporate policies. Malmendier and Tate (2005a & 2008), who provide the first empirical
validation of these models, have generated a high level of interest in both the academic
literature6 and the financial press.
7 However, few studies examine how the destructive
5 We focus on endogeniety in the form of omitted variable bias because reverse causality, if it were present,
would bias our tests against our findings, for reasons discussed below. 6 Other empirical work on the effect of overconfidence on financing and investment policy include
Deshmukh, Goel and Howe (2009), Hietala, Kaplan and Robinson (2002), Hribar and Yang (2010), and
Malmendier, Tate and Yan (2007) 7 See Hulbert (2005), Meehan (2004), Business Mexico (2004) and Varian (2005).

6
effects of CEO overconfidence can be mitigated. Therefore, our finding that strong and
independent boards effectively attenuate the effects of CEO overconfidence should be of
considerable interest to practitioners, academics and policymakers. Our results
complement that of Campbell et al. (2010), who find that overconfident CEOs are more
likely to be fired when the board is independent.
The rest of this study is organized as follows. In the next section we describe our
empirical predictions and hypotheses. In section II, we discuss our measures, including
our overconfidence measure, in greater detail, as well as elaborate on our data. In section
III, we discuss our empirical analysis and present results. Section IV concludes.
I. Hypothesis development
A. Overconfidence and Acquisitions
Malmendier and Tate (2008) find that CEOs who fail to exercise vested, highly
in-the-money options are more likely to engage in acquisitions, and those acquisitions are
more likely to be value-destroying. Appealing to modern portfolio theory, they argue that
failure to exercise such options is irrational because CEOs have their wealth concentrated
in one firm. Thus failure to exercise highly in-the-money options is a signal of
overconfidence, and a correlation of this signal with acquisitions implies that
overconfidence is related to acquisition behavior. As Malmendier and Tate (2008) note,
however, a rational manager with sufficiently bullish inside information would delay
exercise of even highly in-the-money options, diversification concerns notwithstanding.
Hence Malmendier and Tate (2008) also run tests with a refined version of their measure,
which only classifies as overconfident those managers who earn negative abnormal
returns from their delayed exercise strategy. They find that the link between mergers and

7
CEO delayed option exercise is only significant when the abnormal returns from the
CEO’s strategy are negative. Hence, when inferring overconfidence from a CEO’s
personal trading decisions, it is important to take into account the returns.
Malmendier and Tate’s use of option exercise behavior as a measure of
overconfidence has a limitation, however: it is not possible to construct using any
publicly available machine-readable database. This limits their sample to approximately
500 large firms over a sample period ranging from only 1980-1994 and makes it costly
for other researchers to study the effects of overconfidence in other contexts.
Furthermore, this short period makes it difficult to study how governance interacts with
overconfidence, as the publicly available corporate governance databases, such as
RiskMetrics (formerly IRRC), start from the mid-1990s.
Our first task is to construct a new measure consistent with the definition of
overconfidence in the behavioral corporate finance theory literature, is easily constructed
for a large sample of firms and merged with board data, and then examine whether it is
associated with acquisition activity in a manner similar to the measures used by
Malemndier and Tate. Our insider-trading-based overconfidence measure meets these
challenges. We classify a firm-year as having an overconfident CEO if the latter on
average losses money from open-market purchases of his own company’s stock in the
next two years. We classify the period just before, rather than after, the purchase as the
overconfident period because CEOs could plausibly cease being overconfident once they
realize they made a bad trading decision, and we actually find evidence that this is the
case. A CEO who buys stock in his own firm, and then loses money on the trade, reveals
he has overestimated the value of the stock. Such a mistaken belief in undervaluation fits

8
precisely the definition of CEO overconfidence in the theory literature (c.f. Hackbarth,
2007, Heaton, 2002, and Malmendier and Tate, 2005a and Roll, 1986). It is also similar
in spirit to the refined option-based measure used in Malmendier and Tate (2008).
Finally, in contrast to the option-based measures, our measure of overconfidence is easily
constructed from a public machine-readable insider trading data available for virtually the
entire CRSP universe for an extended period of time, 1986-2006.
In addition to being easier to construct and more widely-available, our measure
has another advantage, as well as a disadvantage, relative to Malmendier and Tate’s
measure. We identify CEO overconfidence by examining positive CEO actions, their
poorly timed insider purchases, whereas Malmendier and Tate identify overconfident
CEO’s by examining CEO inaction, their failure to rebalance of their portfolios in a
timely manner. Hence our measure potentially fails to identify CEOs who display their
overconfidence not by buying at the wrong time, but by failing to reduce their portfolio
exposure to their own firm when given the opportunity. However, it is not obvious that
overconfidence always drives such irrational inaction. There is a large behavioral
economics literature showing that procrastination, rather than some other behavioral bias,
can explain many individuals’ failure to take timely savings or investment-related actions
that are clearly in their best interests.8 Hence it is reasonable to suspect that Malmendier
and Tate wrongly classify as overconfident CEOs who are mere procrastinators. In
contrast, our overconfidence measure, by relying on positive CEO action, rather than
inaction, has the advantage of not being contaminated by procrastination. At the same
time, it has the disadvantage of failing to identify some CEOs who only display
8 See Akerlof (1991), Choi, Laibson, and Madrian (2006), Choi, Laibson, Madrian, and Metrick (2004),
Madrian and Shea (2001) for a taste of this literature.

9
overconfidence through inaction. We leave to future research whether the advantage or
disadvantage dominates.
While Campbell et al (2010) also present a new overconfidence measure that can
be constructed from machine-readable data for the S&P 1500, we believe ours is more
appropriate in the M&A context. Campbell et al (2010) classify as overconfident those
CEO’s who hold vested options which are, on average, as of the end of the fiscal year, at
least 100% in the money. Note that unlike our measure and the refined measure of
Malmendier and Tate (2008), the Campbell et al measure ignores the returns the CEO
earns from the delayed exercise strategy. This omission is fatal in the merger context
because Malmendier and Tate (2008) find that merger behavior is only linked to a CEO’s
delayed option exercise strategy when the abnormal returns from the latter are negative.
Further indicating that the Campbell et al measure is problematic in the M&A context,
we find, in untabulated results, that it is positively and significantly related to merger
announcement returns in a multivariate analysis, the opposite of what is expected of a
valid overconfidence measure.9
Similar to Malmendier and Tate (2008), we use data from future years to
construct an overconfidence measure that we then relate to merger behavior in the current
year. Hence if we were using our measure to construct a merger prediction or trading
model, the latter would be subject to look-ahead bias, and any inferences draw from it
would be suspect. However, we are not employing our measure for this purpose. Rather,
we are merely using trading behavior in the next two years to infer a CEO’s
9 Campbell et al (2010) attempt to validate their measure by showing it is related to higher investment-
cashflow sensitivity, just as the Malmendier and Tate (2005a) measures. However, as Malmendier and Tate
point out, investment-cashflow sensitivity is also higher in firms whose CEOs rationally delay option
exercise in order to exploit bullish inside information.
10
psychological state in the current year, which presumably independent directors have
more direct means of observing ex ante.
As all measures of overconfidence, we recognize that ours is imperfect. For
example, it is possible that bad luck, rather than overconfidence, could cause a CEO to
earn a negative abnormal return. To filter out cases where an unforeseeable broad-market
decline is responsible for the CEO’s poor return, we subtract the return on the firm’s
CRSP size-decile portfolio when the computing CEO’s abnormal return. Nevertheless,
this adjustment does not eliminate the possibility that unforeseeable idiosyncratic events
caused the CEO’s poor return, so our measure is still flawed. However, unless
unforeseeable future idiosyncratic events are correlated with mergers and other control
variables, and their unforeseeable nature suggests they are not, this flaw will only bias
our tests against finding a relation between overconfidence and merger activity. We do,
however, recognize that there are other plausible alternative interpretations of our
overconfidence measure that might cause us to draw spurious inferences about the effect
of overconfidence on acquisition activity. We address them below in section III.C.
Applying our new measure, we test the following hypotheses:
H1: CEOs about to buy their own stock and lose on the trade are more likely to engage in
acquisitions.
H2: Acquisitions made by CEOs who are about to buy their own stock and lose are more
likely to be value-destroying. There should be no comparable effect for CEOs who are
about to buy their own stock and win.
Once the CEO has realized the losses from his/her personal stock purchase, it is
possible that he/she learns from the experience and ceases to be overconfident. Hence a
third hypothesis:

11
H3: CEOs who buy their own stock and lose are no more likely to engage in value-
destroying acquisitions than other CEOs after the losses on the stock trade are revealed
B. CEO overconfidence and board structure
Malmendier and Tate (2008) conjecture that the adverse effects of CEO
overconfidence might be mitigated if independent directors “play a more active role in
project assessment and selection.” Independent directors are likely to be more effective if
they constitute a majority on the board. Furthermore, prior research suggests that
independent directors are more powerful, and hence better able to prevent
overconfidence-driven acquisitions, when the board is not too large (eg. Yermack, 1996,
and Eisenberg, Sundgren and Wells, 1998). Following Malmendier and Tate (2008), we
define a board as “not too large” if it has between four and 12 directors. Hence our
fourth hypothesis:
H4: The effect of CEO overconfidence on firm acquisitiveness is attenuated when a firm
has a board between four and 12 members, the majority of whom are independent. Board
structure should not have similar effect on justifiably confident CEOs.
We expect this effect to be stronger for diversifying acquisitions, since Malmendier and
Tate’s (2008) results show that overconfidence is more associated with them. We note
that our prediction on board size differs from that of some prior studies on the advisory
role of the board (Coles et al., 2008, Graham et. al, 2009). These studies envision
directors providing the CEO with suggestive expert advice on strategic decisions. Hence
a larger board, with greater diversity if director expertise, is more effective along this
dimension. In contrast, we examine independent directors who intervene to prevent the
CEO from making an honest strategic error. Hence a board that is not large, wherein
directors are more powerful, is likely to be more effective in our context.
II. Data sources, proxy for overconfidence, and descriptive statistics

12
A. Sample selection and data sources
We obtain our merger sample from SDC. We include all mergers and
acquisitions, deemed material for financial reporting purposes, initiated by public
acquirers between 1988 and 2006. We include both completed and withdrawn deals. For
each deal, we compute the acquirer’s abnormal buy-and-hold announcement return over
the five-day trading day window around the announcement date. We define the abnormal
return as the acquirer’s raw buy-and-hold return, taken from CRSP, less the buy-and-hold
return of the corresponding CRSP size decile portfolio. Because the resulting return
distribution is so skewed, we add one and take the natural log. We then multiply it by 100
to make the interpretation of our results easier.
In addition, we obtain several deal and firm level control variables based on the
findings in prior literature. We define dummy variables stock, tpublic, mbidder, hostile
and tender to indicate, respectively, whether stock was used acquisition currency, the
target was public, there were multiple bidders on the deal, the deal was hostile, and
whether it was executed as a tender offer. If the target and the acquirer share the same 3-
digit NAICS industry code, we set the indicator variable, focus, equal to one, and zero
otherwise. From CRSP, we obtain the acquirer’s equity market capitalization as of one
week before the merger, in billions, and label it size. We use log(size) in our tests because
raw size is highly skewed. We also use the natural log of the transaction value,
log(dealvalue), from SDC, as a control. We define the acquirer’s stock price runup as the
natural logarithm of the acquirer’s gross buy-and-hold stock return, from CRSP, over the
365 day period ending one week before the merger. We include runup because Harford
(2005) and others find that recent stock price performance matters. We use the log gross

13
return because the untransformed net return distribution is highly skewed. Since Harford
(1999) shows an acquirer’s cash holdings are important, from COMPUSTAT, we obtain
the amount of cash and cash equivalents from the acquirer’s beginning-of-year balance
sheet as a percent of total assets, bscash. We use log(bscash) in our tests because the raw
distribution is highly skewed. We take the previous year’s return on assets, or roa, as our
proxy for financial performance during the previous year, since virtually every study in
this literature includes some measure of past acquirer operating performance. We define
roa as operating income before depreciation, scaled by total assets. From Compustat, we
compute leverage as of the beginning of the year, defined as total debt plus minimum
operating lease commitments over the next five years scaled by total assets. We include a
proxy for Tobin’s Q since many prior papers find it to be important (eg., Rhodes-Kropf,
Robinson, and Viswanathan, 2004), we compute the ratio of market value of common
equity plus total liabilities to book assets, as of the beginning of the year. Since the
literature on the Q theory of mergers finds that both firm Q and industry Q matter (e.g.,
Jovanovic and Rousseau, 2002), we include the median Q of all standalone firms in the
acquirer’s 3-digit NAICS industry (indq). Flowing Gorton, Khal, and Rosen (2011), we
use Compustat to compute the growth in acquirer total assets over the prior two years,
assetgrowth. We use log(1+assetgrowth) in our tests because untransformed assetgrowth
is highly skewed. Finally, in order to control for the CEO’s prior merger experience, we
include a dummy indicating whether the acquiring firm conducted another acquisition
within the past two years.
In light of some of more recent literature, we also include as controls some
characteristics of the acquirer’s industry. Similar to Moeller, Schlinegen and Stulz

14
(2004), we include a variable called dealliquidity, which proxies for the amount of
merger activity in the acquirer’s 3-digit NAICS industry. We compute it by taking the
total value of M&A transactions conducted by acquirers in the industry in the current
year, divided by total beginning-of-year industry market capitalization. Following
Gorton, Khal and Rosen (2011), we include, as of the end of the prior year, the
percentage of medium sized firms (between 5% and 30% of the size of the largest firm)
in the industry (pctmed), the natural log of the ratio of market capitalization of the two
largest firms in the industry (logtoptwo), and the Herfindahl index of market share of
sales within the industry (herf), computed from the Compustat Segments data file.
Our proxy for whether an acquirer has an overconfident CEO is related to post-
merger returns. Since acquirer announcement returns are plausibly correlated with long-
run post-merger returns, there might be a spurious correlation between our
overconfidence proxy and announcement returns, which would bias our tests. We thus
construct a variable that controls for post-merger acquirer returns during the time in
which overconfident CEOs tend to be earning returns on their insider purchases. For each
acquirer classified as having an overconfident CEO, we compute the median number of
days between the merger announcement and the date the CEO makes his/her insider
purchases within the subsequent two years, and we find it to be 570. Next, for every
merger, we compute the size-adjusted six-month buy-and-hold abnormal return that
begins 570 days after the merger announcement date. Since this variable is highly
skewed, we add one and take the natural logarithm, and we designate it as log(1+postret)
and include it in all of our tests that use the merger sample.

15
After requiring all of the above variables to be available, we have 25,514__ deals
in our merger sample.
In our tests of the hypotheses related to the effect of CEO overconfidence on
acquisitiveness, we use a sample based on the COMPUSTAT universe of annual data
over the 1988-2006 period. For each firm-year observation, we construct a dummy
variable that takes on a value of one if a firm completed a merger or acquisition, as an
acquirer, in current year and zero otherwise. We define another dummy variable that
takes a value of one if the firm engaged in at least one diversifying acquisition, defined as
target and acquirer in different 3-digit NAICS codes, and is zero otherwise.We use the
same firm and industry level control variables in this sample as we use for our merger
sample, except in cases where, in the merger sample, a variable was computed just before
the merger, we compute it as of the beginning of the year (or end of the previous year).
See our Data Definitions Appendix for more details.
We obtain our board measures from RiskMetrics (formerly IRRC). We construct
a dummy variable for a strong and independent board (siboard). This variable takes a one
if a board corresponding to a given firm-year contains between four and 12 members and
has a majority of outsiders. Otherwise, siboard is equal to zero. We have a total of 15,219
firm-year observations where data on board size, as well as annual data on
overconfidence and firm characteristics are available.
B. Proxy for overconfidence
To construct our proxy of CEO overconfidence, we obtain data on CEO insider
purchases from the Thomson Reuters Ownership database, which spans from 1986-2006.
We begin our merger and firm-panel samples in 1988 because we wish to examine the

16
acquisition behavior of CEOs who bought and lost during the two year period after, as
well as before, they experience trading losses. We compute the 180 day, size-adjusted
buy-and-hold abnormal return to each purchase using CRSP. We use the market-cap-
weighted return of the size decile portfolio to which the CEO’s firm belongs to make the
size adjustment. We classify a firm-year observation having an overconfident CEO if,
within the next two years, the CEO makes insider purchases that have a negative
abnormal return on average.10
We ignore the period during which the CEO is making the
purchases in order to avoid a mechanical association between our overconfidence
measure and acquisition activity. To test whether CEOs learn from their experience of
buying overvalued stock, we define a variable, postoverconfidence, that takes the value of
one if a CEO’s insider purchases over the past two years had a negative abnormal return
on average, and takes a value of zero otherwise.
When computing abnormal returns to CEO purchases, we use a 180 period
because it is the minimum holding period for which a CEO can realize trading profits
under insider trading law. 11
We thus emphasize that our choice of holding period is not
arbitrary, but motivated by insider trading laws.
CEOs are not forced to sell on day 181, so it is possible for a CEO purchase that
resulted in a negative 180 abnormal return to turn around and result in a positive realized
return should the CEO sell later. However, a CEO’s portfolio of human and financial
wealth is inherently under-diversified and concentrated in her own firm. Rational CEOs
purchasing stock in order to profit from insider knowledge, therefore, will hold that
position for as short a time period as possible, which is legally 180 days. For this reason,
10
The two-year window is an empirical choice. Our results are unchanged if we use a three year window. 11
The law does not actually prohibit round-trip transactions for holding periods under 6-months, but it
requires any profits realized from trades with such short holding periods to be forfeited.

17
the act of a CEO buying and holding a stock for 180 days, earning a negative return, and
then continuing to hold it even longer is likely to be a signal of overconfidence.
Nevertheless, in robustness checks we try a one year holding period and find similar
results. We note that a large insider trading literature consistently finds that the
overwhelming majority of insider purchases earn positive abnormal for a variety of
holding periods (see Seyhun (1988, 1990); Cheng, Nagar and Rajan (2007); and Givoly
and Palmon (1985)); so our overconfident CEOs are clearly bucking the trend.
Our measure of CEO overconfidence does not utilize CEO sales transactions
because they are less informative than purchase transactions. Insiders have at least two
reasons to sell unrelated to their beliefs about valuation: liquidity and diversification..
In order to determine whether money-losing CEO purchases or purchases in
general are driving our results, we also construct two variables, confidence and
postconfidence, identical to overconfidence and postoverconfidence, except they are
based on CEO purchases that earn non-negative abnormal returns.
C. Descriptive statistics
We report descriptive statistics for our firm-year panel (Table I) and for our
sample of M&A deals (Table II). The statistics for the panel are broken down into the
following subsamples: observations for the firms used in the Malmendier and Tate
studies (2005a, 2005b and 2008), firm-year observations for which data on the board of
directors are available(S&P 1500, 1996-2006 in Panel B), and the full CRSP-Compustat
universe from 1988-2006 (Panel C). Variable descriptions are in the Appendix. We
present statistics for each subsample since we later run empirical tests separately on each.
18
We note that only a small minority, less than 7%, of firm-year observations are
classified as having overconfident CEOs in any of the samples. The number is
approximately the same for both the full sample and the S&P 1500, and a little bit smaller
for the Malmendier and Tate firms. We also note that a large majority of firms have a
small and independent board. While most firm-year observations do not have an
acquisition, we note that both acquisition dummies have a value of one more than 4% of
the time in the full sample. Combined with a large sample sizes in excess of 90,000
observations, this figure indicates that our acquisition dummy is not so sparse as to
induce bias in our logistic regressions for the full sample. The incidence of mergers is
much larger in the S&P 1500 and Malmendier and Tate subsamples, so sparseness bias is
not a concern. The descriptive statistics on our other firm-level variables are largely
consistent with prior literature.
Turning to descriptive statistics on deals in Table II, note that for the full CRSP-
Compustat sample (Panel C), the acquirer abnormal announcement return (Return) has
high skewness, as well extremely high kurtosis of nearly 350! The minimum and
maximum values are reasonable, so the high kurtosis is unlikely due to data error.
Nevertheless, when a dependent variable distribution has extreme maximum values, such
as 524% in this case, statistical tests are likely to have low power. Therefore, we use a
monotonic transformation of the return, 100*log(1+Return). By taking the natural log of
the gross return reduce skewness, we multiply by 100 to make our results eaiser to
interpret.
III. Empirical analysis & results
19
In this section we first demonstrate that our measure of CEO overconfidence is
associated with greater acquisitiveness, and that acquisitions conducted by overconfident
CEOs are more likely to be value-destroying. We also test whether CEOs continue
making value-destroying acquisitions after they have realized the negative returns on
their purchase (Section III.A). We then test whether strong, independent boards attenuate
the effect of overconfidence on acquisitiveness (Section III.B). In Section III.C, we
examine and rule out some alternative explanations. Finally, in Section III.D, we consider
and rule out the possibility that endogeneity might be causing us to draw spurious
inferences.
A. CEO overconfidence , acquisitiveness and value-destroying acquisitions
To test whether CEO overconfidence increases firm acquisitiveness (Hypothesis
H1), we estimate the following logistic regression:
P(Acquisition=1) = (t + 1overconfidence + 2postoverconfidence +
3confidence + 4postconfidence + ’controls) (1)
Where controls1
=<Q,indQ,leverage,roa,runup,log(size),log(bscash),log(1+assetgrowth),recentdeal, herf,
dealliquidity, pctmed, logtoptwo>
The dependent variable is a dummy that indicates whether the firm conducted at least one
acquisition during the calendar year. is the CDF of the logistic distribution,
overconfidence is a dummy indicating that a CEO insider purchase earned a negative
abnormal return over a six-month horizon within the next two calendar years.
Postoverconfidence is a dummy indicating that a CEO insider purchase earned a negative
abnormal return over a six-month horizon within the last two calendar years. We include
confidence and postconfidence, variables similar to overconfidence and
postoverconfidence, except they are based on insider purchases that earn non-negative

20
returns. We include them in order to determine whether it is insider buying and losing,
rather than buying in general, that drives our results. We discuss the variables in the
controls1 vector, as well as our reasons for including them, in Section II above. Finally,
we include calendar year fixed effects to control for merger waves (eg., Harford, 2005).
We use cluster-robust standard errors, where firms define the cluster, so our inferences
are robust to arbitrary heteroskedasticity and serial correlation in the residuals. The
results are in Table III.
We estimate Equation (1) for three samples: the Malmendeir and Tate firms,
firms-years which board data are available (S&P 1500, 1996-2006), and the CRSP-
Compustat universe of firms over 1988-2006. As can be seen in Table III, the coefficient
on overconfidence is positive and significant at the 5% level or better for all three
samples. To get a sense of economic significance, consider the value it takes in the
broadest sample, 0.295. This estimate implies an odds ratio of 1.34 [1.34=exp(0.295)].
Thus having an overconfident CEO increases the odds that a given firm will conduct an
acquisition by a factor 1.34. We conclude that CEO overconfidence, as we measure it, is
significantly increases firm acquisitiveness, validating hypothesis H1.
The coefficient on confidence is positive in all three samples, and it is statistically
significant at the 5% level or greater in the two larger samples. Thus we conclude that all
CEOs about to make insider purchases are more acquisitive, not just those who buy when
their stock is overvalued. However, since we are modeling the probability of all
acquistions, and not just bad ones, this result does not cast any doubt on the proposition
that overconfident CEOs are uniquely more likely to destroy value.
21
The coefficient on postoverconfidence is negative in both the M&T and S&P
1500 subsamples, significantly so in the latter. It is positive and statistically significant in
the broader sample. However, in all three samples, we run a Wald test and reject at the
5% level or better the null that postoverconfidence=overconfidence. Therefore, we
conclude the effect of overconfidence on acquisitiveness appears to dissipate after the
CEO experiences trading losses, supporting hypothesis H3.
Next, we test whether the above effects are stronger for diversifying acquisitions,
which are more likely to be value-destroying. We estimate an equation identical to
equation (1), except we use as the dependent variable a dummy indicating whether the
firm acquired a target in a different 3-digit NAICS industry. We use the same samples
and methods as before, and the results are in columns (4)-(6) of Table III.
The effect of overconfidence on the odds of a diversifying merger or acquisition
is positive and significant in all three samples at the 1% level or better. It is also
economically significant. In the broadest sample, our estimate of the coefficient on
overconfidence is 0.742, which implies an odds ratio of 2.1 [2.1= exp(0.742)]. Thus
having an overconfident CEO more than doubles odds that a firm will engage in a
diversifying acquisition. Note, however, that once-overconfident CEOs appear to learn
their lesson after they experience negative returns on their insider purchases. The
coefficient on postoverconfidence is negative and significant in all three subsamples,
indicating that once-overconfident CEOs are less likely than the average CEO to engage
in a diversifying acquisition after they have realized losses from an insider purchase.
Further, in all three samples, a Wald test rejects at the 1% level or better the null that
postoverconfidence=overconfidence, supporting hypothesis H3.

22
Providing further evidence that we are capturing the effect of overconfidence, the
coefficients on confidence are negative in all three samples, significant in two of three,
and the coefficients on postconfidence are statistically indistinguishable from zero in all
three samples. We conclude that it is CEO overconfidence, and not justifiable confidence,
driving diversifying acquisitions.
Next, we test whether mergers and acquisitions are more likely to be value-
destroying for the acquirer when the acquirer CEO is overconfident (Hypothesis H2). For
our sample of deals, as well as various subsamples, we regress abnormal announcement
returns on overconfidence and various control variables:
100*log(1+Return) = t + 1overconfidence + 2postoverconfidence
3confidence + 4postconfidence + ’controls2+ (2)
Where Return is the cumulative abnormal return to the acquirer stock during the five-
trading-day window around the merger announcement date. The vector controls2 contains
the same control variables as controls1, except it also contains the deal-specific variables,
such as log(dealvalue), stock, focus, hostile, tender, tpublic, mbidders, and
log(1+postret). The definitions of these control variables, along with our reasons for
including them, are stated above in Section II. See also the variable definitions appendix.
All specifications include calendar quarter fixed effects, and we cluster standard errors by
acquirer, ensuring they are robust to arbitrary heteroskedasticty and serial coerrelation.
The results are in Table IV.
Confirming Hypothesis H2, the coefficient on overconfidence is negative and
significant for all three subsamples: deals involving both the Malmendier and Tate firms
(column 1), deals involving firms for which board data are available (column 2), and the
full sample (column 3). The coefficients are also economically significant, implying that

23
acquisitions conducted by overconfident CEO result in announcement returns that are
1.745, 1.473, and 0.391 percentage points lower than that of other acquisitions.
We also find that the coefficient on postoverconfidence to be statistically
indistinguishable from zero, implying that the deals of once-overconfident CEOs are no
longer value more value destroying than that of the average CEO once they have earned
poor returns on their insider purchases. Furthermore, using a Wald test, we reject at the
10% level the null of overconfidence=postoverconfidence in the S&P 1500 sample.
Finally, we attempt to refine our overconfidence measure by taking into
consideration CEO underdiversification. A CEO buying his own firm’s stock at a bad
time is likely to be a greater signal of overconfidence when the CEO is more
underdiversified. Hence we define a new variable, underdiversification, which is our
estimate for the ratio of the value of a CEO’s current securities holdings in the firm to
total his wealth. For the value current CEO securities holdings, we use the total value of a
CEO’s share holdings plus the exercise value his options, as of the date of the firm’s
proxy statement in the current year, as given in Execucomp. To estimate how much
wealth the CEO accumulated over his career as an executive, we the total value of current
year compensation and multiply by the CEO’s age less 40. The variable
underdiversification is the ratio of these to estimates. Descriptive statistics are in Table I,
Panel D.
We recognize our proxy for CEO underdiversification is very rough. Our estimate
of the value of CEO securities holdings is likely too low; it wrongly assumes options are
worth no more than their current exercise value. We are also likely overestimating CEO
wealth, as we assume CEOs have been earning their current income, and saving it all,

24
since age 40. Nevertheless, as far as we can tell, this proxy is the best that can be
obtained given the publicly available databases to which we can access. At the very least,
it is likely to be correlated with the CEO’s true underdiversification.
In Table V we present the results from estimating logit and OLS models similar to
those discussed above, except we also include underdiversification and its interaction
with overconfidence. In columns (1) and (2), respectively, we present results from logit
regressions in which we model the log-odds of a firm undertaking any acquisition in a
year, as well as a diversifying acquisition. Overconfidence is positive, and its interaction
with underdiversified is also positive and significant, implying that our measure of
overconfidence is an even more strongly associated with acquisitiveness when CEOs are
underdiversified. In Column (3) we estimate an OLS model of announcement returns, in
which we include underdiversified and its interaction term. The coefficient on
overconfidence is negative, as in OLS models above, and the interaction term is also
negative. The latter implies that announcement returns are even worse for CEO’s we
designate as overconfident when they are underdiversified. However, the effect is not
statistically significant in this particular sample.
In sum, we find that overconfident CEOs are more acquisitive, tend to make more
diversifying acquisitions, and that the acquisitions they do take tend to be more value
destroying than those of other CEOs. We also find evidence that this tendency to make
value-destroying acquisitions, is reduced after a once-overconfident CEO realizes losses
on his poorly-timed insider purchases, and that this effect is stronger for diversifying
acquistions. Finally, we find that our proxy for overconfidence is more strongly

25
associated with acquisitiveness and negative announcement returns when the CEO is
more underdiversified.
B. Governance and Overconfidence
In this section, we examine whether a strong, independent board attenuates the
effect of CEO overconfidence on acquisitiveness. In our first test, we estimate the
following logistic regression model:
P(Acquisition=1) = ( + 1overconfidence + 2siboard*overconfidence + 3siboard
4confidence + ’controls1) (3)
Where siboard is a dummy variable that takes a value of one if the board has a majority
of independent directors and has between 4 and 12 members. As before, we cluster our
standard errors by firm to ensure they are robust to heterskedasticity and serial
correlation. We also include year fixed effects. The results are in column 1 of Table VI.
As predicted by Hypothesis H4, the interaction between overconfidence an
siboard is negative and, and with a p-value of 0.051, just barely misses being significant
at the 5% level. 12
To get a sense of economic significance, consider the effect of
overconfidence with and without a strong, independent board. The coefficient of 0.405 on
overconfidence implies that when the board is either large or outsider-dominated or both,
overconfidence increases the odds of an acquisition by a factor of 1.5 [1.5= exp(0.405)].
However, a coefficient on the interaction equal to -0.301 implies that when the board is
both not large and independent, overconfidence only increases the odds of an acquisition
by a factor of 1.11.[exp(0.405-301) =1.11 ]. Thus board structure significantly attenuates
the effect of overconfidence on acquisitiveness.
12
In a heavily-cited recent paper, Ai and Norton (2003) argue it is incorrect to draw inferences from
interaction term coefficients in logit regressions. Kolasinski and Siegel (2010), however, show that Ai and
Norton’s logic is flawed, and it is appropriate to draw inferences from the interaction term coefficients.

26
We also examine whether boards are able to distinguish between overconfident
CEOs from those who are justifiably confident. We estimate a logistic regression model
identical to equation (3), except we interact siboard with confidence rather than
overconfidence. The results, in column (2) Table VI, show that the coefficient on the
interaction term is positive, economically tiny (taking a value of only 0.094) and
statistically indistinguishable from zero. We conclude boards only restrain the
acquisitiveness of CEOs who are overconfident, and not those justifiably confident. We
also include a specification in which we use a dummy for a majority of outsiders on the
board (bo_indep) in place of siboard. The results are in column (3) Table VI. Consistent
with Hypothesis H4, the coefficient on the interaction term is negative, but it is not
statistically significant, consistent with the proposition that bo_indep is a noisier measure
of board effectiveness than is siboard.
Next, we examine whether board structure attenuates the effect of overconfidence
on diversifying acquisitions. We estimate another equation, identical to (3), except we
use as the dependent variable a dummy indicating that the firm engaged in a diversifying
acquisition in a given year. The results are in Column (4) of Table VI. Consistent with
hypothesis H4, the coefficient on the interaction between siboard and overconfidence is
negative and significant and the 5% level, while the coefficient on overconfidence
remains strongly positive and significant. Thus having both a strong and independent
board significantly attenuates the effect of overconfidence on the odds that a firm will
undertake a diversifying acquisition. This effect is economically significant as well. The
coefficient on overconfidence is 0.806. This implies that when a firm does not have a
board that is both small and independent, the presence of an overconfident CEO increases

27
the odds of a diversifying acquisition by factor of 2.24 [2.24 = exp(0.806)]. Thus
overconfidence more than doubles the odds of a diversifying acquisition. However, an
interaction coefficient of -0.404 implies that, when overseen by a strontg and independent
board, an overconfident CEO only increases the odds of a diversifying acquisition by a
factor of 1.49. As before, we also examine whether a strong and independent board
reduces the tendency of justifiably confident CEOs to conduct diversifying acquisitions
by interacting confidence with siboard. The results are in Column (5). We find an effect
that is economically negligible as well as statistically indistinguishable from zero.
Finally, as a robustness check, in Column (6), we examine the effect of bo_indep
interacted with overconfidence. The interaction term in this specification is negative but,
as before, not statistically significant.
Since Hermalin and Weisbach (1998) suggest that board independence and CEO
entrenchment are inversely correlated, we run specifications identical to equation (4)
above, except we also include other governance variables potentially related to CEO
entrenchment, whose descriptive statistics we present in Table I, panel D. We use the
Gindex of Gompers, Ishii and Metrick (2003), which is an index of anti-takeover
protections in the firm, duality, a dummy indicating the chairman of the board is neither
the CEO nor other executive of the firm, and blockdummy, a dummy indicating the
presence of at least one outside blockholder, which we define as an institution that owns
more then 5% of shares outstanding. The results of adding these variables and their
interactions to our acquisitiveness regressions are in Table VII, and they show that the
interaction on siboard and overconfidence is unchanged when we introduce these new
other governance variables. Hence we conclude it is the independence of the board, and

28
not some other governance variable, that is attenuating the effect of CEO overconfidence
on firm acquisitiveness.
In untabulated results, we test and fail to find evidence that the effect of CEO
overconfidence on deal announcement returns is attenuated when the firm has a strong
and independent board. We conclude that while strong, outsider-dominated boards reduce
the overall quantity of acquisitions overconfident CEOs make, they do not affect the
quality. Merely reducing the quantity, however, still adds value since the typical deal
conducted by an overconfident CEO tends to be value-destroying.
C. Alternative hypotheses
In this section, we examine three possible alternative hypotheses that postulate
that something other than overconfidence might explain our results. The first relates to
CEO learning, the second to CEO signaling, the third to agency problems, and the fourth
to CEO incompetence.
CEO Learning. Our results show that CEOs become less acquisitive, and the
acquisitions they do make are less value-destructive, after, but not before, they
experience average negative abnormal returns on insider purchases. While we attribute
this to CEO learning from personal trading, it is possible the CEO is really just learning
from past M&A deals. To rule out this alternative hypothesis, we control for past deal
experience with our recentdeal dummy. That our results do not change with the addition
of this control suggests CEOs are learning from their trades, not past deals.
Signaling. Our results in Table IV imply that CEOs tend to initiate poorly-timed
insider purchases shortly after conducting acquisitions to which the market reacted
poorly. While this finding is consistent with the hypothesis that CEO overconfidence

29
causes CEOs to make both poor personal portfolio and corporate acquisition decisions, it
is also consistent with a signaling hypothesis. Suppose the market reacts poorly to some
acquisitions not because they are objectively bad, but because they only look bad without
some private information the CEO possesses and cannot credibly communicate. Thus it
is possible that CEOs buy their own their firm’s stock after a poorly-received acquisition
not because they are overconfident, but because they wish to signal this positive
information to the market, potentially explaining the negative coefficient on
overconfidence in Table IV. Note, however, that the signaling hypothesis says nothing
about the returns to CEO trades after acquisitions. In contrast, the overconfidence
hypothesis only predicts negative deal announcement returns in years leading up to CEO
purchases with negative abnormal returns. Since the coefficient on overconfidence, is
negative and significant in Table IV, and the coefficient on confidence is statistically
indistinguishable from zero, our results clearly favor the overconfidence hypothesis.
Reduction in agency problems. After an insider purchase, a CEO increases the
proportion of his wealth invested in his own firm, possibly reducing agency problems.
This might account for our finding that CEOs make fewer poor acquisition decisions after
they experience losses on personal stock purchases. Note, however, the reduction in
agency problems is unrelated to the return on the CEO’s purchase. Hence if this agency-
reduction hypothesis were true, we would expect both postoverconfidence and
postconfidence to be negative and significant in our regressions in Table IV. However,
postconfidence is always either positive or statistically indistinguishable from zero.
Incompetent CEOs. It is plausible that incompetent CEOs make both poor
strategic acquisition decisions and poor personal trading decisions. One could argue,

30
therefore, CEO incompetence rather than overconfidence drives our findings. However,
that overconfidence is a kind of incompetence, one relating to the CEO’s judgment of the
value of his firm and projects. Since our measure is directly related to CEO misjudgment
of firm value, it is a closer proxy of overconfidence than anything else.
D. Is Endogenity driving our board results?
A large literature, both empirical and theoretical, argues that board structure is
endogenously determined.13
We thus need to ensure that endogeneity is not driving our
results. As noted above, we have good reason to believe, a priori, that endogenity is not a
concern in our context. As Hermalin and Weisbach (2003) argue, endogenity is not likely
to be a problem when studying the link between board structure and board performance
of particular tasks, such as preventing overconfident CEOs from making acquisitons.
Nevertheless, we carefully consider here the two forms of endogeneity bias, namely,
reverse causality and omitted variable bias.
1. Reverse causality
First consider reverse causality. It is plausible that shareholders of firms that are
more acquisitive for exogenous reasons might want stronger, more independent boards
because agency problems may be worse in acquisitive firms. However, since our main
inferences are about an interactive effect, and not a direct effect, the relevant reverse
causality story in our context must be about the effect of acquisitiveness on the
coincidence of strong, independent boards with CEO overconfidence. We submit such a
story, if true, would bias our board structure tests against our findings. Since CEO
overconfidence is likely, if anything, more destructive for acquisitive firms, shareholders
of exogenously acquisitive firms should demand even greater board strength and
13
See Adams, Hermalin and Weisbach (2010) for a survey.

31
independence when the firm is run by an overconfident CEO. Hence reverse causality
would tend to make board strength and independence appear to magnify, rather than
attenuate, the relation between CEO overconfidence and acquisitiveness in our logistic
models, contrary to what we find. Thus, if anything, reverse causality, if real, is causing
us to underestimate the extent to which board strength and independence attenuates the
effect of overconfidence on acquisitiveness.
Now consider reverse causality from the perspective of the board’s hiring
decision. It is probable that CEO overconfidence is more destructive for exogenously
acquisitive firms. Hence strong, independent boards of acquisitive firms would more
likely exert greater effort to avoid hiring overconfident CEOs than similar boards of less
acquisitive firms. It is also reasonable to assume that strong and independent boards of
exogenously acquisitive firms are likely to exert greater effort to avoid hiring
overconfident CEOs than would weak boards of similar firms. As a result, we would see
the association between CEO overconfidence and acquisitiveness decline when the board
is strong an independent. Hence this alternative reverse causality story could potentially
explain the negative interaction term coefficient in model (1) of Table VI. However, this
story, if true, would support hypothesis H4, the proposition that strong, independent
boards attenuate the effect of CEO overconfidence on acquisitiveness. If strong and
independent boards are knowledgeable enough about the destructive effects of CEO
overconfidence in order to count the psychological trait against CEO candidates, then it
follows they would take steps to mitigate the destructive effects of overconfidence, such
as giving greater scrutiny to acquisitions, should they nevertheless end up hiring an

32
overconfident CEO for some reason (e.g., the overconfident CEO possesses other
desirable traits).
2. Omitted variable bias
Now consider the other form of endogeneity: omitted variable bias. First, note that
in our context, it is not the direct effect of board composition on firm acquisitiveness that
is of interest, but rather its interaction with CEO overconfidence. Hence, for omitted
variable bias to be salient, there would have to be some omitted variable that is correlated
with board structure, is not directly correlated with acquisitiveness, but merely attenuates
the effect of CEO overconfidence on determining firm acquisitiveness. Economic theory,
as far as we see, gives no reason to believe such a variable exists.
Nevertheless, to ensure omitted variable bias is not driving our results, we re-
estimate equation (3), except we add various variables shown in prior literature to be
correlated with board structure, as well as their interactions with CEO overconfidence.
Prior literature finds that board size and structure is related to firm complexity, past
operating performance, and the power of its CEO. To proxy for firm complexity we use
the following: ratio of R&D to total assets (R&D), industry Q (indQ), defined as before,
the natural log of the number of 4-digit industries in which a firm has business or
operating segments (nsegs), leverage, defined as before, the log of the number of years
the firm has been public to proxy for age (log(firmage)), and the volatility of monthly
returns over the past year (retvol). We use the firm’s roa, defined as before, to proxy for
financial performance. CEO power variables, taken from Riskmetrics, include the
percentage of voting shares owned by the CEO (ceovotepower), the CEO’s age, the
natural log of CEO tenure, log(ceotenure), which we define as the log of one plus the

33
number of years that have elapsed since the CEO was first appointed to the firm’s board,
and the square of the log CEO’s tenure. Where CEO power variables are not available in
Riskmetrics, we take them from Execucomp.14
We also include as a CEO power variable
duality, which, as defined before, is a dummy indicating the chairman of the board is not
an executive of the firm. Descriptive statistics for all of the above new variables are in
Panel D of Table I.
In Table VIII, we have results from specifications identical to equation (), except
we add all the firm complexity and financial performance variables and interact them
with overconfidence one at a time. The coefficient on the interaction between
overconfidence and siboard is qualitatively unchanged in all cases. Furthermore, we run a
Chow test of whether the coefficients on overconfidence*siboard are equal across
specifications in Table VIII, and whether they are equal to the interaction term coefficient
in model (1) of Table VI. We find the test resoundingly fails to reject, with a pvalue of
approximately 0.93. Also, a cursory glance at the economic magnitudes reveals there is
no economically meaningful difference among any of the 13 interaction term coefficient
estimates. This finding implies that neither the specific CEO power and firm complexity
variables we observe, nor any unobserved variables correlated with them, are driving our
result that board structure attenuates the effect overconfidence on acquisitiveness. We
conclude that it is extremely unlikely that an omitted variable is biasing our tests.
IV. Conclusion
14
The variables are slightly different if we take them from Execucomp: CEO tenure consists of the natural
log of one plus the number of years the CEO has held his current position, and votepower consists of the
number of shares the CEO owns relative to total shares outstanding. However Execucomp and Riskmetrics
variables are closely correlated for the sample in which their availability overlaps.
34
Our results demonstrate that independent directors do more than merely mitigate
agency problems. The classic models of corporate governance envision rational managers
whose pursuit of self-interest can at times harm shareholders. The main purpose of
independent directors, in this view, is to prevent managers from taking self-interested
actions that harm shareholders. Our results suggest a broader role. By showing that more
powerful, independent boards restrain acquisitions driven by CEO overconfidence, we
show independent directors help managers avoid honest mistakes.
In addition, we demonstrate that even a CEO’s recent personal experience, and
not just early career and educational experience, impacts firm investment policy. Once-
overconfident CEOs become less acquisitive after they experience losses on their poorly-
timed insider purchases, and the acquisitions they do make no longer tend to be more
value-destroying than that of other CEOs. They also become less likely to make
diversifying acquisitions. We thus provide some of the first evidence that CEO
overconfidence can be overcome in certain circumstances.
Finally, we introduce and validate a new proxy of CEO overconfidence based on
widely available machine-readable data on insider trading available from 1986 to the
present for essentially the entire CRSP universe. Most pervious measures of
overconfidence are limited to a sample of 500 firms that ends in 1994. Our study
promises to make future research on CEO overconfidence less costly, more
comprehensive, and more up-to-date.

35
References
Adams, R., B. Hermalin and M. Weisbach, 2010. The role of boards of directors in corporate
governance: a conceptual framework and survey. Journal of Economic Literature 48,
58-107.
Akerlof, George A., Procrastination and Obedience, American Economics Review Papers
and Proceedigns 81, 1-19.
Agrawal, A. and C. Knoeber, 2001. Do some outside directors play a political role? Journal
of Law and Economics 64, 179-198.
Ai, C, Norton, E., 2003. Interaction terms in logit and probit models. Economics Letters 80,
123-129.
Bretrand, M., and A. Schoar, 2003. Managing with style: The effect of managers on firm
policies. The Quarterly Journal of Economics 118 (4), 1169-1208
Billet, Matthew and Yiming Quian, 2011. Are overconfident CEOs born or made?
Evidence of self-attribution bias from frequent acquirers. Management Science,
forthcoming.
Booth, J. and D. Deli, 1996. On executives of financial institutions as outside directors.
Journal of Corporate Finance 5, 227-250.
Business Mexico, 2004. Hawkish CEOs Have the Urge to Merge. Business Mexico,
March 1, 2004.
Cheng, S, V. Nagar and M. Rajan, 2007. Insider trades and private information: The
special case of delayed-disclosure trades. The Review of Financial Studies 20,
1833-1864..
Campbell, T.C., S.A. Johnson, and J. Rutherford and B.W. Stanley, 2010. CEO
Overconfidence and Turnover. Working Paper, Texas A&M.
Choi, James, David Laibson, Brigitte Madrian, 2006, Reducing the complexity costs of
401K participation and enrollment, NBER working paper #11979.
Choi, James, David Laibson, Brigitte Madrian, and Andrew Metrick, 2004. “For Better or
For Worse: Default Effects and 401(k) Savings Behavior,” In David Wise, ed.,
Perspectives in the Economics of Aging, Chicago: University of Chicago Press,
81-121
Coles, J., N. Daniel and L. Naveen, 2008. Boards: does one size fit all? Journal of
Financial Economics 87, 329-356.
Cornett, M., Al., Marcus, H., Tehranian, 2008. Corporate governance and pay -for-
performance: the impact of earnings management. Journal of Financial
Economics 87, 357-73.

36
Deshmukh, S., A.M. Goel and K.M. Howe, 2009. CEO Overconfidence and Dividend
Policy: Theory and Evidence. Working Paper, DePaul University.
Eisenberg, T., S. Sundgren and M.T. Wells, 1998. Larger Board Size and Decreasing
Firm Value in Small Firms. Journal of Financial Economics 48, 35-54.
Fich, E. and Shivdasani, A., 2006. Are busy boards effective monitors? Journal of
Finacne 61, 689-724.
Graham, J., Hazarika, S. and K. Narasimhan, 2009. Corporate governance, debt, and
investment policy during the great depression. Working paper, Duke University.
Graham, J., and K. Narasimhan, 2004, Corporate survival and managerial experiences
during the Great Depression, Working Paper, Duke University.
Givoly, D. and D. Palmon, 1985, Insider trading and the exploitation of inside
information: Some empirical evidence, Journal of Business 58, 69-87
Goel, Anand M. and Anjan V. Thakor, 2008. Overconfidence, CEO Selection, and
Corporate Governance. Journal of Finance 63, 2737-2784.
Gompers, P., J.L. Ishii, and A. Metrick, 2003. Corporate Governance and Equity Prices.
Quarterly Journal of Economics, Vol. 118, No. 1, 107-155.
Hackbarth, D., 2007. Managerial Traits and Capital Structure Decisions. Working Paper,
University of Illinois and Urbana Champaign.
Harford, J, 1999. Corporate Cash Reserves and Acquisitions. Journal of Finance 54,
1969-97.
Harford, J., 2005. What drives merger waves? Journal of Financial Economics 77, 529-
560.
Heaton, J.B, 2002. Managerial Optimism and Corporate Finance. Financial Management
31, 33-45.
Helland, E. and S. Sykuta, 2004. Regulation and the evolution of corporate boards:
monitoring, advising, or window dressing. Journal of Law and Economics 74,
167-192.
Hermalin, B. and M. Weisbach, 1998. Endogenously chosen boards of directors and their
monitoring of the CEO. The American Economic Review 88, 96-118.
Hermalin, B. and M. Weisbach, 2003. Boards of directors as an endogenously determined
institution: a survey of the economic literature. Federal Reserve Bank of New
York Economic Policy Review (April), 7-26.

37
Hietala, Pekka, Steven N. Kaplan and David T. Robinson, 2002. What is the Price of
Hubris? Using Takeover Battles to Infer Overpayments and Synergies. NBER
working paper #W9264.
Hribar, Paul and Holly Yang, 2010. Does CEO overconfidence affect management
forecasting and subsequent earnings announcements? Working paper, University
of Iowa.
Hulbert, Mark, 2005. Measuring C.E.O.'s On the Hubris Index. New York Times, May
22, 2005.
Jovanovic, B., Rousseau, P., 2002. The Q theory of mergers. American Economic
Review 92, 198-204.
Khorana, A., Tufano, P., Wedge, L. Board structure, mergers, and shareholder wealth: a
study of the mutual fund industry. Journal of Financial Economics 85, 572-98.
Kolasinski, A., Siegel, A., 2010. On the economic meaning of interaction terms in logit
and probit models. Working paper, University of Washington.
Madrian, Brigitte C. and Dennis F. Shea, 2001, The power of suggestion: inertia in 401
participation and savings behavior, Quarterly Journal of Economics 66, 1149-
1188.
Malmendier, Urlike and Geoffrey Tate, 2005a. CEO Overconfidence and Corporate
Invesment. Journal of Finance 60, 2661-2700.
Malmendier, Urlike and Geoffrey Tate, 2005b. Does CEO Overconfidence Affect
Corporate Investment? CEO Overconfidence Measures Revisited. European
Financial Management 11, 649-659.
Malmendier, Urlike and Geoffrey Tate, 2008. Who makes acquisitions? CEO
Overconfidence and the market’s reaction. Journal of Financial Economics 89,
20-43.
Malmendier, Urlike, Geoffrey Tate and Jonathan Yan, 2007. Corporate Financial Policies
with Overconfident Mangers. NBER working paper #W13570.
Meehan, Caroline, 2004. Bullish executives may harm companies, Financial News, Feb.
22, 2004.
Moeller, Sara B., Frederik P. Schlingemann, and René M. Stulz, 2004. Firm size and the
gains from acquisitions, Journal of Financial Economics 73, 201-228
Paul, D., 2007. Board composition and corrective action: evidence from corporate responses
to bad acquisition bids. Journal of Financial and Quantitative Analysis 42, 759-784.
Rhods-Kropf, M., D., Robinson, and S., Viswanathan, 2004. Valuation waves and merger
activity: the empirical evidence. Journal of Financial Economics 77, 561-603.

38
Roll, Richard, 1986. The Hubris Hypothesis of Corporate Takeovers. Journal of Business 59,
197-216.
Seyhun, N., 1988, The information content of aggregate insider trading, Journal of
Business 61, 1-24.
Seyhun, N., 1990, Overreaction or fundamentals: Some lessons from insiders' response to
the market crash of 1987, Journal of Finance 45, 1363-1368.
Varian, H., 2005. What Can We Learn From How a Manager Invests His Own Money?
New York Times, Dec. 15, 2005.
Xuan, Y.H., 2009. Empire building or bridge-building? Evidence from new CEOs
internal capital market allocation decisions. Review of Financial Studies 22,
4919-4948.
Yermack, D, 1996. Higher Market Valuation of Companies with a Small Board of
Directors. Journal of Financial Economics 40, 185-211.

39
Appendix: Variable Definitions
Panel D
Variables used in all tests Acquisition A dummy indicating at least one acquisition in the calendar year, from SDC
Diversifying Acquisition A dummy indicating at least one diversifying acquisition in the calendar year, , from SDC
overconfidence A dummy indicating that a CEO insider purchase earned a negative abnormal return over a
six-month horizon within the next two calendar years
postoverconfidence A dummy indicating that a CEO insider purchase earned a negative abnormal return over a
six-month horizon within the last two calendar years
confidence A dummy indicating that a CEO insider purchase earned a non-negative abnormal return
over a six month horizon within the next two calendar years
postconfidence A dummy indicating that a CEO insider purchase earned a non-negative abnormal return
over a six month horizon within the last two calendar years
Q The beginning of year ratio of market capitalization plus book liabilities to book assets,
based on Compustat.
indQ The median Tobin’s Q for all standalone firms in same 3-digit NAICS industry as of the
beginning of the year, based on Compustat.
leverage The ratio of the firm’s total debt plus minimum non-capitalized lease commitments over
the next five years to total assets, as of the beginning of the year, based on Compustat.
roa The ratio of operating income before depreciation to total assets over the previous year. Of
operating income before depreciation is not available, we use earnings before taxes, interest
depreciation and amortization, based on Compustat.
runup In the firm-year panel, the natural log of the firm’s gross buy-and-hold stock return over
the previous year. In the merger sample, the natural log of the firm’s gross buy-and-hold
return over the 365 day period ending five business days before the merger announcement,
computed from CRSP.
log(size) In the firm-year panel, the natural log of equity market capitalization at the beginning of
year. In the merger sample, the natural log of equity market capitalization as of five
business days before the deal is announced, from CRSP.
log(bscash) The natural log of beginning of year acquirer cash & cash equivalents, normalized by totoal
assets, from Compustat.
log(1+assetgrowth) The natural log of one plus the growth rate in book assets over the previous two years, from
Compustat.
recentdeal A dummy indicating the firm has engaged in at least one acquisition within the past two
years, based on SDC.
herf The Herfindahl index of the firm’s 3-digit NAICS industry based on market share of sales
for the current year reported in the Compustat segments files. If a firm is not in the
Segments file, it is assumed to have a single segment in its primary NAICS industry.
dealliquidity The natural log of one plus the ratio of the aggregate value of all successful mergers and
acquisitions conducted by acquirers in the firm’s 3-digit NAICS industry in the current
year to aggregate industry market capitalization as of the beginning of the year. Based on
SDC & Compustat.
pctmed The percentage of market capitalization that represents medium size firms in the firm’s 3-
digit NAICS industry as of the beginning of the year. Firms are classified as “medium-
sized” when they
logtoptwo The natural log of the ratio of the market capitalizations of the two largest firms by market
capitalization in the industry as of the beginning of the year, based on Compustat data.
siboard A dummy indicating a strong and independent board, which consists of between 5 and 12
directors, the majority of whom are independent, as of the current year. From Riskmetrics.
bo_indep A dummy indicating that a majority of directors are outsiders as of the current year. From
Riskmetrics.

40
Variables used only in OLS regressions run on the merger sample (Table IV & V) Announcement Return 100*log(1+ret), where ret is the cumulative, size-adjusted abnormal return during the five
business day window around the merger announcement date.
log(dealvalue) The natural log of the total disclosed value, in millions, of the merger; only mergers with
disclosed values are included in the merger sample. From SDC.
stock A dummy indicating that some acquirer stock was used as acquisition currency. From
SDC.
tpublic A dummy indicating that the target was publicly traded prior to the deal. From SDC.
focus A dummy indicating that a merger is is focusing, i.e. the acquirer and target share the same
3-digit NAICS industry. From SDC.
hostile A dummy indicating that SDC classifies the merger as hostile
mbidders A dummy indicating that the target had multiple bidders. From SDC.
tenderdum A dummy indicating that the transaction was executed as a tender offer. From SDC.
log(1+postret) The natural log of the gross, size-adjusted buy-and-hold abnormal return during the six
month period that begins 570 days after the merger announcement. From CRSP.
Variables used in robustness tests (Tables V, VII & VIII) underdiversificaion The log of one plus the ratio of the total value of a CEO’s total equity holdings in the
firm to the CEO’s wealth as of the prior year. We approximate the value of equity
holdings by summing the actual value of the CEO’s stock holdings and the exercise
value of his in-the-money options, obtained from Execucomp. CEO wealth is
approximated by taking total value of compensation in the year and multiplying it by the
CEO’s age, less 40.
Gindex The Gompers, Isshi, Metrick governance index for the current year, as given in
Riskmetrics.
duality A dummy indicating that the chairman of the board is not the CEO or other firm
employee as of the current year, as given in Riskmetrics
blockdum A dummy indicating that at least one institution owns 5% or more of shares outstanding
for at least one quarter during the current year, from Thompson.
retvol The volatility of the monthly return of the firm’s stock over the past year, from CRSP
log(nsegs) The natural log of the number of distinct industry segments, based on NAICS codes,
with positive sales the firm has in the Compustat Segments database. Multiple segments
with the same industry code are treated as one. If the firm has no segments listed in the
segments file, it is treated as having only one segment.
r&d The ratio of research and development expenses to total assets, from Compustat
log(firmage) One plus the natural log of the number of years the firm has appeared in CRSP.
log(ceoage) The natural of the CEO’s age as given in RiskMetrics, or if not available in RiskMetrics,
in Execucomp
log(ceotenure) The natural log of one plus the number of years the current CEO has been on the firm’s
board of directors, as given in RiskMetrics. If this data item is unavailable in
Riskmetrics, we use the number of years the CEO has been CEO according to
Execucomp.
ceovotepower The fraction of total common share votes controlled by the CEO, as given in
RiskMetrics. If this number is unavailable, we use the fraction of shares the CEO owns
as given in Execucomp.

41
Table I
Descriptive Statistics by Firm-Year Observation
Panel A
Malmendier & Tate firms, 1980-1994
#Observations = 4,637 Mean Std. Dev. Min Median Max Skewness Kurtosis
Acquisition 0.229 0.420 0.000 0.000 1.000 1.292 -0.332
Diversifying Acquisition 0.088 0.284 0.000 0.000 1.000 2.900 6.415
overconfidence 0.049 0.215 0.000 0.000 1.000 4.193 15.587
postoverconfidence 0.041 0.198 0.000 0.000 1.000 4.647 19.599
confidence 0.052 0.221 0.000 0.000 1.000 4.058 14.473
postconfidence 0.607 0.894 0.000 0.000 2.000 0.855 -1.202
Q 1.643 1.115 0.725 1.241 8.554 3.209 12.989
indQ 1.440 0.477 0.809 1.263 6.797 2.308 9.070
leverage 0.327 0.195 0.000 0.316 1.249 0.861 1.467
roa 0.138 0.078 -0.471 0.131 0.408 0.444 1.736
runup 0.086 0.335 -2.911 0.107 1.565 -1.146 7.457
log(size) 8.059 1.352 1.980 7.931 13.041 0.260 0.875
log(bscash) 1.137 1.446 -4.840 1.218 4.390 -0.551 0.766
log(1+assetgrowth) 0.077 0.193 -0.752 0.054 1.911 2.029 16.162
recentdeal 0.356 0.479 0.000 0.000 1.000 0.603 -1.637
herf 0.116 0.126 0.020 0.073 0.898 2.979 11.767
dealliquidity 0.035 0.063 0.000 0.016 0.976 6.225 59.576
pctmed 0.199 0.115 0.000 0.182 0.556 0.568 -0.167
logtoptwo 0.563 0.547 0.000 0.387 2.769 1.639 2.962
Panel B
Firm-year observations with board data (S&P 1500, 1996-2006)
#Observations = 15,204
Mean Std. Dev. Min Median Max Skewness Kurtosis
Acquisition 0.273 0.446 0.000 0.000 1.000 1.018 -0.965
Diversifying Acquisition 0.109 0.311 0.000 0.000 1.000 2.513 4.316
overconfidence 0.076 0.266 0.000 0.000 1.000 3.191 8.181
postoverconfidence 0.081 0.273 0.000 0.000 1.000 3.073 7.442
confidence 0.101 0.302 0.000 0.000 1.000 2.646 5.000
postconfidence 0.724 0.904 0.000 0.000 2.000 0.571 -1.532
siboard 0.735 0.441 0.000 1.000 1.000 -1.067 -0.862
bo_indep 0.818 0.386 0.000 1.000 1.000 -1.651 0.727
Q 2.015 1.462 0.725 1.506 8.554 2.502 6.930
indQ 1.614 0.604 0.809 1.414 8.510 2.460 11.897
leverage 0.305 0.213 0.000 0.292 1.249 0.995 1.696
roa 0.136 0.099 -0.895 0.133 0.408 -1.389 12.328
runup 0.074 0.468 -3.586 0.116 3.303 -0.740 4.800
log(size) 7.381 1.529 1.612 7.231 13.139 0.444 0.274
log(bscash) 1.600 1.638 -4.840 1.708 4.470 -0.666 0.742
log(1+assetgrowth) 0.132 0.267 -0.752 0.081 1.911 2.369 11.213
recentdeal 0.421 0.494 0.000 0.000 1.000 0.318 -1.899
herf 0.142 0.155 0.020 0.085 0.898 2.763 8.927
dealliquidity 0.054 0.104 0.000 0.026 0.976 5.976 44.496
pctmed 0.182 0.126 0.000 0.149 0.556 0.890 0.268
logtoptwo 0.687 0.663 0.000 0.440 2.769 1.322 1.022

42
Panel C
Firm year observations from the CRSP-Compustat Universe, 1988-2006
#Observations = 93,908
Mean Std. Dev. Min Median Max Skewness Kurtosis
Acquisition 0.154 0.361 0.000 0.000 1.000 1.917 1.674
Diversifying Acquisition 0.060 0.238 0.000 0.000 1.000 3.694 11.645
overconfidence 0.069 0.254 0.000 0.000 1.000 3.394 9.518
postoverconfidence 0.061 0.239 0.000 0.000 1.000 3.671 11.477
confidence 0.072 0.258 0.000 0.000 1.000 3.325 9.058
postconfidence 0.581 0.870 0.000 0.000 2.000 0.922 -1.044
Q 1.945 1.564 0.725 1.365 8.554 2.509 6.613
indQ 1.571 0.554 0.696 1.409 8.510 2.496 13.011
leverage 0.320 0.255 0.000 0.281 1.249 1.093 1.332
roa 0.065 0.196 -0.895 0.103 0.408 -2.384 7.887
runup -0.009 0.612 -5.119 0.042 3.912 -0.640 3.752
log(size) 5.036 2.238 -3.740 4.911 13.139 0.239 -0.229
log(bscash) 1.816 1.767 -4.840 2.050 4.470 -0.923 1.204
log(1+assetgrowth) 0.148 0.385 -0.752 0.076 1.911 1.808 5.862
recentdeal 0.222 0.416 0.000 0.000 1.000 1.337 -0.213
herf 0.151 0.162 0.020 0.090 0.898 2.445 6.819
dealliquidity 0.059 0.129 0.000 0.024 0.976 5.188 30.258
pctmed 0.171 0.126 0.000 0.143 0.556 0.985 0.504
logtoptwo 0.671 0.666 0.000 0.436 2.769 1.415 1.379
Panel D
Variables used in robustness tests
N Mean Std. Dev. Min Median Max Skewness Kurtosis
underdiversification 19,808 0.560 0.968 0.000 0.142 5.173 2.758 8.027
retvol 14,605 0.125 0.064 0.010 0.110 1.123 2.369 16.313
log(nsegs) 14,605 0.487 0.540 0.000 0.000 2.303 0.588 -0.918
log(firmage) 14,605 2.812 0.913 0.000 2.890 4.394 -0.427 -0.215
r&d 14,605 0.028 0.059 0.000 0.000 0.942 4.485 36.700
log(ceoage) 14,605 4.000 0.139 3.434 4.007 4.522 -0.283 0.521
log(ceotenure) 14,605 2.031 0.880 0.000 2.079 3.871 -0.321 -0.434
ceovotepower 14,605 4.192 10.496 0.000 1.000 100.000 4.663 25.860

43
Table II
Descriptive Statistics by M&A Deal
Panel A: Deals for Malmendier & Tate firms, 1988-2006
#observations = 1894 Mean Std. Dev. Min Median Max Skewness Kurtosis
Announcement Return -0.189 5.299 -36.157 -0.037 21.434 -0.726 4.950
overconfidence 0.059 0.236 0.000 0.000 1.000 3.741 12.008
postoverconfidence 0.031 0.172 0.000 0.000 1.000 5.453 27.763
confidence 0.058 0.233 0.000 0.000 1.000 3.803 12.473
postconfidence 0.046 0.209 0.000 0.000 1.000 4.341 16.866
Q 2.110 1.576 0.950 1.542 8.760 2.616 7.238
indQ 1.556 0.489 1.000 1.392 2.850 1.087 0.306
leverage 0.248 0.150 0.000 0.239 0.846 0.642 0.735
roa 0.153 0.082 -0.100 0.147 0.778 0.634 1.851
runup 0.140 0.321 -2.150 0.138 1.693 -0.250 4.249
log(size) 8.773 1.530 3.559 8.595 13.136 0.406 -0.134
log(bscash) 1.447 1.325 -4.470 1.498 4.277 -0.207 -0.154
log(1+assetgrowth) 0.129 0.236 -1.020 0.086 1.753 2.180 10.400
recentdeal 0.637 0.481 0.000 1.000 1.000 -0.569 -1.678
herf 0.121 0.127 0.018 0.072 1.000 2.800 10.251
dealliquidity 0.067 0.174 0.000 0.034 3.707 15.487 307.106
pctmed 0.174 0.112 0.000 0.147 0.600 0.819 0.094
logtoptwo 0.532 0.524 0.000 0.340 2.993 1.887 4.319
log(dealvalue) 4.999 1.908 -2.048 5.011 11.192 0.020 0.333
stock 0.229 0.420 0.000 0.000 1.000 1.294 -0.327
focus 0.558 0.497 0.000 1.000 1.000 -0.232 -1.948
hostile 0.022 0.146 0.000 0.000 1.000 6.579 41.329
mbidder 0.056 0.231 0.000 0.000 1.000 3.845 12.798
tender 0.107 0.309 0.000 0.000 1.000 2.542 4.465
tpublic 0.322 0.467 0.000 0.000 1.000 0.762 -1.421
log(1+postret) -0.021 0.234 -1.848 -0.008 1.198 -0.868 5.894

44
Panel B: Deals for firms for which board data are available (S&P 1500, 1996-2006)
#observations = 4831 Mean Std. Dev. Min Median Max Skewness Kurtosis
Announcement Return 0.034 7.259 -89.372 0.125 58.921 -1.238 12.113
overconfidence 0.117 0.321 0.000 0.000 1.000 2.391 3.718
postoverconfidence 0.020 0.140 0.000 0.000 1.000 6.845 44.872
confidence 0.077 0.267 0.000 0.000 1.000 3.163 8.011
postconfidence 0.101 0.301 0.000 0.000 1.000 2.653 5.038
Q 2.595 2.023 0.950 1.821 8.760 1.948 2.997
indQ 1.693 0.532 1.000 1.584 2.850 0.635 -0.606
leverage 0.218 0.178 0.000 0.203 1.262 0.912 1.248
roa 0.141 0.099 -1.170 0.140 0.918 -0.771 15.914
runup 0.179 0.445 -3.558 0.176 2.857 0.070 6.583
log(size) 8.276 1.683 3.729 8.099 13.219 0.398 -0.110
log(bscash) 1.846 1.445 -5.641 1.914 4.341 -0.326 -0.612
log(1+assetgrowth) 0.210 0.350 -1.405 0.125 4.030 3.587 22.714
recentdeal 0.727 0.446 0.000 1.000 1.000 -1.019 -0.962
herf 0.107 0.097 0.019 0.068 1.000 2.502 9.775
dealliquidity 0.086 0.190 0.000 0.040 3.775 7.927 95.568
pctmed 0.144 0.114 0.000 0.111 0.833 1.361 1.798
logtoptwo 0.589 0.628 0.000 0.329 6.140 1.784 3.452
log(dealvalue) 4.644 1.862 -4.200 4.615 11.641 0.135 0.396
stock 0.287 0.452 0.000 0.000 1.000 0.941 -1.114
focus 0.540 0.498 0.000 1.000 1.000 -0.162 -1.975
hostile 0.015 0.122 0.000 0.000 1.000 7.952 61.258
mbidder 0.036 0.185 0.000 0.000 1.000 5.014 23.149
tender 0.065 0.246 0.000 0.000 1.000 3.537 10.516
tpublic 0.270 0.444 0.000 0.000 1.000 1.037 -0.925
log(1+postret) -0.059 0.415 -9.210 -0.009 1.198 -8.028 154.549
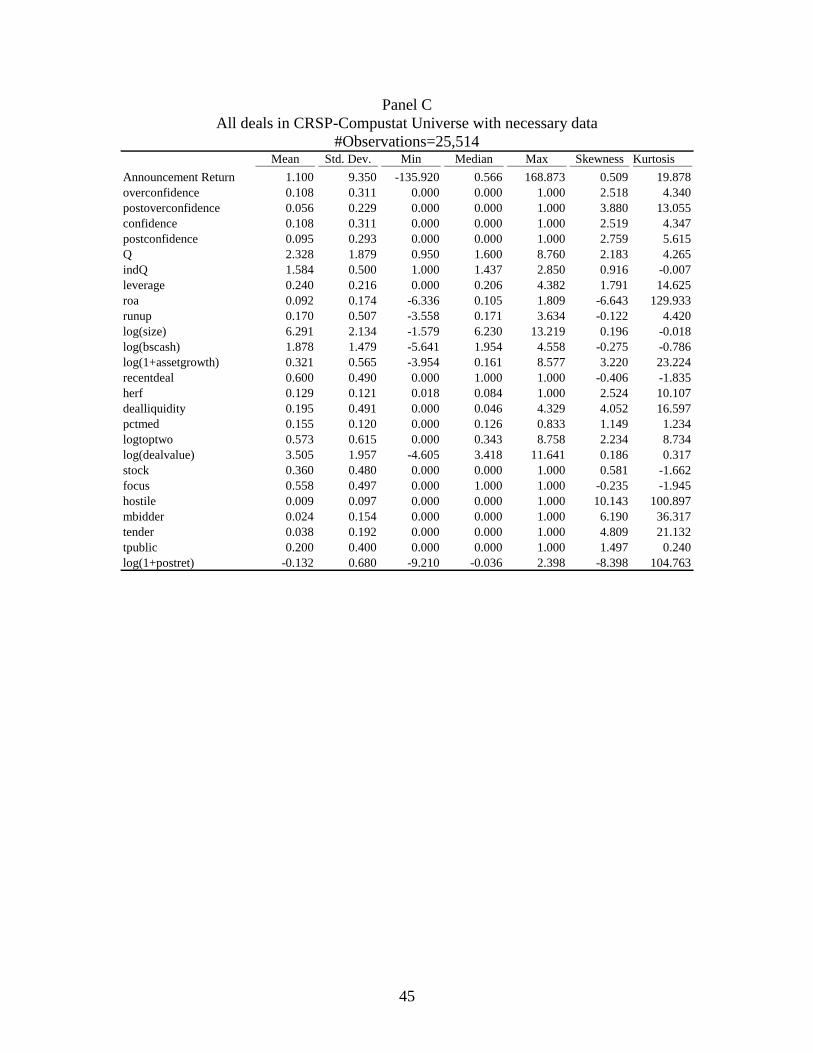
45
Panel C
All deals in CRSP-Compustat Universe with necessary data
#Observations=25,514 Mean Std. Dev. Min Median Max Skewness Kurtosis
Announcement Return 1.100 9.350 -135.920 0.566 168.873 0.509 19.878
overconfidence 0.108 0.311 0.000 0.000 1.000 2.518 4.340
postoverconfidence 0.056 0.229 0.000 0.000 1.000 3.880 13.055
confidence 0.108 0.311 0.000 0.000 1.000 2.519 4.347
postconfidence 0.095 0.293 0.000 0.000 1.000 2.759 5.615
Q 2.328 1.879 0.950 1.600 8.760 2.183 4.265
indQ 1.584 0.500 1.000 1.437 2.850 0.916 -0.007
leverage 0.240 0.216 0.000 0.206 4.382 1.791 14.625
roa 0.092 0.174 -6.336 0.105 1.809 -6.643 129.933
runup 0.170 0.507 -3.558 0.171 3.634 -0.122 4.420
log(size) 6.291 2.134 -1.579 6.230 13.219 0.196 -0.018
log(bscash) 1.878 1.479 -5.641 1.954 4.558 -0.275 -0.786
log(1+assetgrowth) 0.321 0.565 -3.954 0.161 8.577 3.220 23.224
recentdeal 0.600 0.490 0.000 1.000 1.000 -0.406 -1.835
herf 0.129 0.121 0.018 0.084 1.000 2.524 10.107
dealliquidity 0.195 0.491 0.000 0.046 4.329 4.052 16.597
pctmed 0.155 0.120 0.000 0.126 0.833 1.149 1.234
logtoptwo 0.573 0.615 0.000 0.343 8.758 2.234 8.734
log(dealvalue) 3.505 1.957 -4.605 3.418 11.641 0.186 0.317
stock 0.360 0.480 0.000 0.000 1.000 0.581 -1.662
focus 0.558 0.497 0.000 1.000 1.000 -0.235 -1.945
hostile 0.009 0.097 0.000 0.000 1.000 10.143 100.897
mbidder 0.024 0.154 0.000 0.000 1.000 6.190 36.317
tender 0.038 0.192 0.000 0.000 1.000 4.809 21.132
tpublic 0.200 0.400 0.000 0.000 1.000 1.497 0.240
log(1+postret) -0.132 0.680 -9.210 -0.036 2.398 -8.398 104.763

46
Table III
Logistic panel data regressions modeling the log-odds that a firm will conduct at least one
acquisition in a given year as a function of our CEO overconfidence measure, a dummy
indicating the CEO has experienced recent trading losses (postoverconfidence), and
various control variables defined in Table 1. All regressions include year fixed effects,
which are not reported. The samples of M&T firms and the Compustat Universe run from
1988 to 2006. The sample of S&P 1500 firms with board data runs from 1996 to 2006.
Robust standard errors, clustered by firm, are in parentheses. Significance levels of 1%,
5% and 10% are indicated by ***, **, and *, respectively. (1) (2) (3) (4) (5) (6)
All Acquisitions Diversifying Acquisitions
M&T Firms
S&P 1500 w/
Board Data
Compustat
Universe
M&T
Firms
S&P 1500 w/
Board Data
Compustat
Universe
overconfidence 0.372** 0.195** 0.295*** 0.785*** 0.622*** 0.742***
(0.168) (0.076) (0.036) (0.214) (0.102) (0.050)
postoverconfidence -0.169 -0.153* 0.086** -1.589*** -1.558*** -0.934***
(0.193) (0.080) (0.043) (0.511) (0.209) (0.091)
confidence 0.238 0.164** 0.287*** -0.227 -0.202* -0.140**
(0.176) (0.065) (0.034) (0.363) (0.110) (0.063)
postconfidence 0.155 0.090 0.261*** -0.175 -0.094 0.035
(0.174) (0.063) (0.037) (0.266) (0.096) (0.057)
Q -0.093 -0.008 0.018** -0.028 -0.000 0.012
(0.058) (0.019) (0.008) (0.084) (0.029) (0.012)
indq -0.064 0.099*** 0.077*** -0.285* 0.047 0.108***
(0.093) (0.038) (0.021) (0.169) (0.055) (0.032)
leverage -0.749*** -0.586*** -0.227*** -0.855** -0.833*** -0.512***
(0.279) (0.113) (0.048) (0.428) (0.182) (0.086)
roa 2.006** 0.572** 0.623*** -0.010 -0.092 0.364***
(0.830) (0.254) (0.072) (1.214) (0.340) (0.109)
runup 0.214 0.347*** 0.269*** 0.102 0.219*** 0.181***
(0.136) (0.049) (0.020) (0.201) (0.066) (0.030)
log(size) 0.332*** 0.198*** 0.136*** 0.292*** 0.209*** 0.122***
(0.042) (0.016) (0.006) (0.070) (0.025) (0.011)
log(bscash) 0.093*** 0.033** 0.032*** 0.138** 0.049* 0.051***
(0.034) (0.016) (0.008) (0.054) (0.027) (0.013)
log(assetgrowth+1) -0.149 0.141* 0.473*** -0.097 0.096 0.495***
(0.228) (0.079) (0.027) (0.299) (0.109) (0.037)
recentdeal 1.156*** 1.168*** 1.443*** 1.061*** 1.054*** 1.183***
(0.094) (0.050) (0.026) (0.117) (0.066) (0.034)
herf 0.287 0.203 0.419*** 0.472 0.282 0.567***
(0.380) (0.141) (0.069) (0.508) (0.202) (0.109)
dealliquidity 0.869 0.755*** 0.430*** 0.321 0.070 0.045
(0.623) (0.194) (0.070) (0.956) (0.309) (0.121)
pctmed -1.381*** -1.290*** -0.553*** -1.211* -1.173*** -0.181
(0.397) (0.188) (0.090) (0.640) (0.293) (0.150)
logtoptwo 0.070 0.031 0.060*** 0.061 0.069 0.057**
(0.083) (0.032) (0.016) (0.123) (0.049) (0.027)
Observations 4637 15204 93908 4637 15204 93908
Pseudo-R2 0.13 0.10 0.13 0.11 0.10 0.10

47
Table IV
Results from OLS regressions where in the dependent variable is the log gross cumulative
abnormal return, times 100, during the five year window around the merger announcement.
Independent variables include our overconfidence proxy, a dummy indicating the CEO has
experienced recent trading losses (postoverconfidence), and various control variables
defined in the Appendix. Robust standard errors, clustered by firm, in parentheses.
Significance levels of 1%, 5% and 10% are indicated by ***, **, and *, respectively.
(1) (2) (3)
M&T Firms S&P 1500 w/ Board Data Compustat Universe
overconfidence -1.745** -1.473*** -0.391*
(0.807) (0.409) (0.236)
postoverconfidence -0.122 0.333 -0.316
(0.668) (0.899) (0.313)
confidence -0.057 -0.591 -0.285
(0.614) (0.476) (0.236)
postconfidence -0.179 0.385 -0.164
(0.866) (0.424) (0.232)
Q 0.191 0.207* 0.224***
(0.150) (0.114) (0.072)
indq -0.718* -0.344 -0.313*
(0.397) (0.231) (0.184)
leverage 0.537 1.079 0.831**
(1.088) (0.851) (0.395)
roa -1.709 -1.726 -0.597
(2.391) (1.896) (0.650)
runup 1.141 -0.164 -0.531**
(0.740) (0.535) (0.232)
log(size) 0.053 -0.081 -0.722***
(0.120) (0.085) (0.050)
log(bscash) 0.054 -0.082 0.001
(0.128) (0.098) (0.058)
log(assetgrowth+1) -0.737 -0.109 -0.962***
(0.711) (0.696) (0.236)
recentdeal -0.006 0.018 -0.074
(0.265) (0.241) (0.131)
herf 0.763 0.711 0.213
(1.127) (1.372) (0.623)
dealliquidity -1.312** -1.069*** -0.504***
(0.586) (0.409) (0.123)
pctmed -0.298 0.010 0.957*
(1.334) (1.061) (0.577)
logtoptwo -0.158 -0.051 -0.007
(0.303) (0.209) (0.121)

48
log(dealvalue) -0.089 -0.147* 0.357***
(0.091) (0.077) (0.049)
stock -0.700* -0.754** -0.010
(0.376) (0.317) (0.157)
focus 0.038 0.238 -0.478***
(0.267) (0.211) (0.128)
hostile 0.667 -0.317 -1.244**
(0.843) (0.745) (0.557)
mbidders -1.377* -0.529 -0.110
(0.715) (0.639) (0.638)
tender 0.398 0.818 2.240***
(0.542) (0.510) (0.502)
tpublic -1.101*** -1.633*** -3.017***
(0.357) (0.354) (0.221)
log(1+postret) -1.374** -0.754** -0.089
(0.626) (0.303) (0.115)
Observations 1894 4831 25514
R-squared 0.10 0.04 0.05

49
Table V
Columns (1) and (2) contain, respectively, results of logistic regressions modeling the
log-odds of any acquisition or a diversifying acquisition in a given year as a function of
overconfidence, our proxy for CEO underdiversification, their interaction, and control
variables defined in the Appendix. Column (3) contains results of an OLS model of
merger announcement returns including the independent variables used in the other
columns, as well as deal-specific control variables defined the Appendix. Columns (1)
and (2) used year fixed effects, and column (3) uses calendar quarter fixed effects. Robust
standard errors, clustered by firm, are in parentheses. Two-sided significance levels of
1%, 5% and 10% are indicated by ***, **, and *, respectively. (1) (2) (3)
Acquistion Diversifying Acquisition 100*log(1+Return)
overconfidence 0.095 0.453*** -0.506
(0.075) (0.106) (0.352)
overconfidence*underdiversification 0.206*** 0.157** -0.078
(0.063) (0.065) (0.285)
underdiversification -0.033 0.021 0.065
(0.023) (0.034) (0.093)
Q -0.013 -0.018 0.218
(0.017) (0.025) (0.137)
indq 0.084** 0.099* -0.454**
(0.036) (0.051) (0.222)
leverage -0.467*** -0.792*** 0.832
(0.101) (0.168) (0.646)
roa 0.796*** 0.170 -1.172
(0.203) (0.288) (1.447)
runup 0.351*** 0.272*** 0.440
(0.043) (0.059) (0.368)
log(size) 0.158*** 0.190*** -0.200***
(0.014) (0.024) (0.064)
log(bscash) 0.036** 0.053** -0.033
(0.015) (0.025) (0.078)
log(1+assegrowth) 0.312*** 0.331*** -0.286
(0.069) (0.090) (0.363)
recentdeal 1.191*** 0.982*** -0.401**
(0.044) (0.059) (0.187)
herf 0.275** 0.450** -0.561
(0.138) (0.199) (0.969)
dealliquidity2 0.753*** 0.054 -0.652**
(0.207) (0.320) (0.298)
pctmed -1.105*** -0.745*** 1.300*
(0.166) (0.264) (0.785)
logtoptwo 0.052* 0.048 0.329**
(0.030) (0.047) (0.156)

50
logdealvalue -0.029
(0.054)
stock -0.383*
(0.208)
focus -0.026
(0.161)
hostile -1.959***
(0.741)
mbidders 1.125
(0.815)
tenderdum 2.076***
(0.585)
tpublic -2.301***
(0.277)
log(1+postret) -0.590***
(0.197)
Observations 19808 19808 9176
Pseudo-R2 or R-squared 0.10 0.08 0.05

51
Table VI
Logistic panel data regressions modeling the log-odds of the firm conducting any
acquisition (Columns 1-3) or a diversifying acquisition (Columns 4-6) in a given year.
Independent variables are defined in Table 1. All columns use year fixed effects. Robust
standard errors, clustered by firm, are in parentheses. Significance levels of 1%, 5% and
10% are indicated by ***, **, and *, respectively. (1) (2) (3) (4) (5) (6)
All Acquisitions Diversifying Acquisitions
overconfidence 0.405*** 0.192** 0.384** 0.806*** 0.523*** 0.792***
(0.137) (0.076) (0.165) (0.167) (0.101) (0.204)
overconfidence*siboard -0.301* -0.404**
(0.157) (0.200)
confidence*siboard 0.094 0.106
(0.135) (0.249)
overconfidence*bo_indep -0.241 -0.339
(0.179) (0.224)
confidence 0.163** 0.095 0.163** -0.259** -0.337 -0.262**
(0.065) (0.118) (0.065) (0.111) (0.218) (0.111)
siboard 0.045 0.009 0.234*** 0.179**
(0.051) (0.051) (0.084) (0.078)
bo_indep 0.017 0.147
(0.060) (0.095)
Q -0.009 -0.009 -0.009 -0.002 -0.002 0.002
(0.019) (0.019) (0.019) (0.029) (0.029) (0.029)
indq 0.099*** 0.098*** 0.099*** 0.044 0.043 0.045
(0.038) (0.038) (0.038) (0.055) (0.055) (0.055)
leverage -0.589*** -0.589*** -0.591*** -0.846*** -0.844*** -0.849***
(0.113) (0.114) (0.113) (0.183) (0.183) (0.184)
roa 0.576** 0.576** 0.576** -0.001 -0.002 0.005
(0.255) (0.255) (0.255) (0.343) (0.343) (0.342)
runup 0.364*** 0.364*** 0.364*** 0.270*** 0.270*** 0.272***
(0.049) (0.049) (0.049) (0.064) (0.064) (0.064)
log(size) 0.199*** 0.199*** 0.198*** 0.230*** 0.230*** 0.217***
(0.016) (0.016) (0.016) (0.026) (0.026) (0.025)
log(bscash) 0.033** 0.034** 0.033** 0.053** 0.054** 0.055**
(0.016) (0.016) (0.016) (0.027) (0.027) (0.027)
log(1+assetgrowth) 0.147* 0.147* 0.145* 0.147 0.144 0.141
(0.079) (0.079) (0.079) (0.109) (0.109) (0.109)
recendeal 1.165*** 1.166*** 1.165*** 1.035*** 1.037*** 1.034***
(0.050) (0.050) (0.050) (0.066) (0.066) (0.066)
herf 0.204 0.201 0.198 0.310 0.309 0.304
(0.140) (0.141) (0.141) (0.203) (0.203) (0.202)
dealliquidity 0.734*** 0.742*** 0.738*** -0.058 -0.040 -0.037
(0.194) (0.193) (0.193) (0.311) (0.310) (0.308)
pctmed -1.297*** -1.295*** -1.298*** -1.163*** -1.160*** -1.172***
(0.188) (0.189) (0.189) (0.295) (0.295) (0.295)
logtoptwo 0.032 0.032 0.032 0.074 0.074 0.073
(0.032) (0.032) (0.032) (0.050) (0.050) (0.050)
Observations 15204 15204 15204 15204 15204 15204
Pseudo-R2 0.10 0.10 0.10 0.09 0.09 0.09
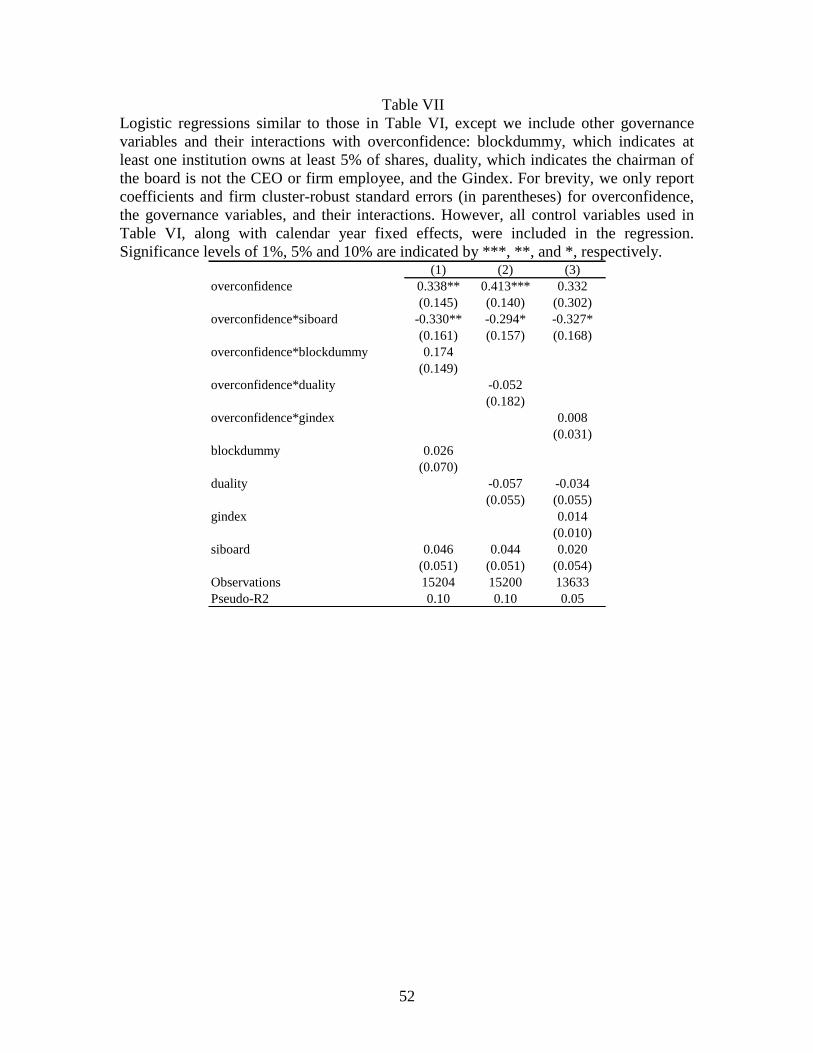
52
Table VII
Logistic regressions similar to those in Table VI, except we include other governance
variables and their interactions with overconfidence: blockdummy, which indicates at
least one institution owns at least 5% of shares, duality, which indicates the chairman of
the board is not the CEO or firm employee, and the Gindex. For brevity, we only report
coefficients and firm cluster-robust standard errors (in parentheses) for overconfidence,
the governance variables, and their interactions. However, all control variables used in
Table VI, along with calendar year fixed effects, were included in the regression.
Significance levels of 1%, 5% and 10% are indicated by ***, **, and *, respectively. (1) (2) (3)
overconfidence 0.338** 0.413*** 0.332
(0.145) (0.140) (0.302)
overconfidence*siboard -0.330** -0.294* -0.327*
(0.161) (0.157) (0.168)
overconfidence*blockdummy 0.174
(0.149)
overconfidence*duality -0.052
(0.182)
overconfidence*gindex 0.008
(0.031)
blockdummy 0.026
(0.070)
duality -0.057 -0.034
(0.055) (0.055)
gindex 0.014
(0.010)
siboard 0.046 0.044 0.020
(0.051) (0.051) (0.054)
Observations 15204 15200 13633
Pseudo-R2 0.10 0.10 0.05
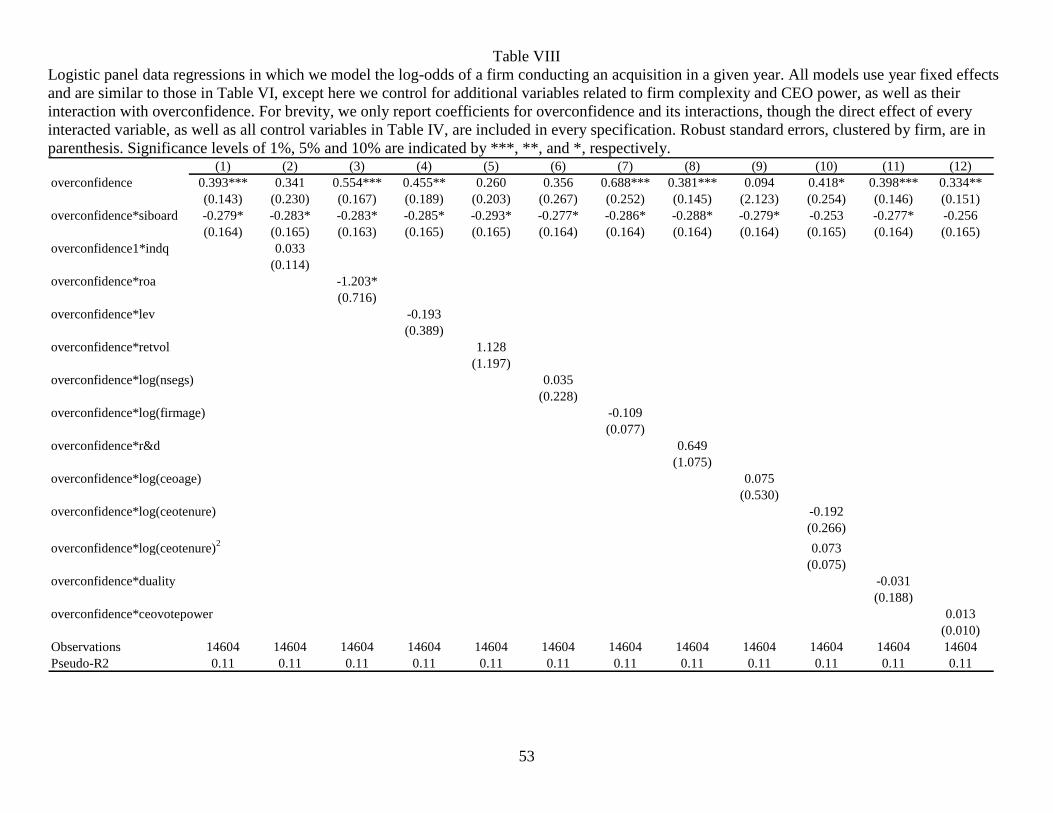
53
Table VIII
Logistic panel data regressions in which we model the log-odds of a firm conducting an acquisition in a given year. All models use year fixed effects
and are similar to those in Table VI, except here we control for additional variables related to firm complexity and CEO power, as well as their
interaction with overconfidence. For brevity, we only report coefficients for overconfidence and its interactions, though the direct effect of every
interacted variable, as well as all control variables in Table IV, are included in every specification. Robust standard errors, clustered by firm, are in
parenthesis. Significance levels of 1%, 5% and 10% are indicated by ***, **, and *, respectively. (1) (2) (3) (4) (5) (6) (7) (8) (9) (10) (11) (12)
overconfidence 0.393*** 0.341 0.554*** 0.455** 0.260 0.356 0.688*** 0.381*** 0.094 0.418* 0.398*** 0.334**
(0.143) (0.230) (0.167) (0.189) (0.203) (0.267) (0.252) (0.145) (2.123) (0.254) (0.146) (0.151)
overconfidence*siboard -0.279* -0.283* -0.283* -0.285* -0.293* -0.277* -0.286* -0.288* -0.279* -0.253 -0.277* -0.256
(0.164) (0.165) (0.163) (0.165) (0.165) (0.164) (0.164) (0.164) (0.164) (0.165) (0.164) (0.165)
overconfidence1*indq 0.033
(0.114)
overconfidence*roa -1.203*
(0.716)
overconfidence*lev -0.193
(0.389)
overconfidence*retvol 1.128
(1.197)
overconfidence*log(nsegs) 0.035
(0.228)
overconfidence*log(firmage) -0.109
(0.077)
overconfidence*r&d 0.649
(1.075)
overconfidence*log(ceoage) 0.075
(0.530)
overconfidence*log(ceotenure) -0.192
(0.266)
overconfidence*log(ceotenure)2
0.073
(0.075)
overconfidence*duality -0.031
(0.188)
overconfidence*ceovotepower 0.013
(0.010)
Observations 14604 14604 14604 14604 14604 14604 14604 14604 14604 14604 14604 14604
Pseudo-R2 0.11 0.11 0.11 0.11 0.11 0.11 0.11 0.11 0.11 0.11 0.11 0.11