increase profitability using data mining
TRANSCRIPT

WHITE PAPER
Increase Customer Profitability Using Data Mining and Advanced Analytics
Increase Customer Profitability Using Data Mining and Advanced Analytics
Table of Contents
Executive Summary 1Three Key Trends Affecting ABM 2
The Suppliersrsquo Shift from Product-Centric to Customer-Centric 2The Availability of Detailed Data 3Declining Emphasis on Process and Productivity Improvement as a Way to Improve the Bottom Line 3Whither ABM 4
What So What Then What 4From Seeing Costs to Understanding Them 5What Differentiates More-Profitable From Less-Profitable Customers 5How Can a Supplier Determine Differentiating Drivers of Its Profits from Customers 7The Explanatory Investigation Continues hellip and Continues 7Letrsquos Try a Different Approach 9Applying the Computing Power of Data Mining and Advanced Analytics 10Where Does the Analyst Go from Here 11And Therersquos More hellip 12
Conclusion 14APPENDIX 1 15
The Importance of Ratios 15APPENDIX 2 17
Risk Incidents Accounting for Occasional Events in Profitability Analyses 17
APPENDIX 3 18Risk Incidents Better Understanding the Impact of Process Failures 18
APPENDIX 4 19Profitable Customer Acquisition 19
APPENDIX 5 20Customer Equity Analysis 20
APPENDIX 6 21Customer Strategy 21
About SAS 23
Increase Customer Profitability Using Data Mining and Advanced Analytics
ii
This white paper was written by Gary Cokins and Charles Randall Gary Cokins is an internationally recognized expert speaker and author on the subject of advanced cost management and performance management systems He is a Principal in Global Business Advisory Services with SAS a leading provider of business intelligence and analytic software headquartered in Cary NC Cokins received a BS in industrial engineeringoperations research from Cornell University and an MBA from Northwestern Universityrsquos Kellogg School of Management Cokins began his career at FMC Corporation and he also served as a management consultant with Deloitte KPMG Peat Marwick and Electronic Data Systems (EDS) His latest book is Performance Management Integrating Strategy Execution Methodologies Risk and Analytics He can be reached at garycokinssascom Charles Randall has built his career in strategy and marketing analytics Randallrsquos career encompassed both telecommunications and management consultancy before joining SAS as a Principal Business Consultant In his current role as Solutions Marketing Manager he draws from 15 years of experience in these fields to share deep expertise and insight in numerous articles and papers Randall received a BSc in economics and a PhD in econometrics from the University of Wales His latest research study is titled Pleased to Meet You How Different Customers Prefer Very Different Channels The study is a joint project with Professor Hugh Wilson of Cranfield School of Management Randall can be reached at charlesrandallsuksascom
Increase Customer Profitability Using Data Mining and Advanced Analytics
Executive Summary
There is a trend for customers to increasingly view suppliersrsquo products and standard service lines as commodities As a result what customers now seek from suppliers are special services ideas innovation and thought leadership Many suppliers have actively shifted their sales and marketing functions from product-centric to customer-centric through the use of data mining and business intelligence1 tools to understand their customersrsquo behavior ndash their preferences purchasing habits and customer affinity groups In some companies the accounting function has supported this shift by reporting customer profitability information (including product gross profit margins) using activity-based costing (ABC) principles However is this enough
It is progressive for the accounting function to provide marketing and sales with reliable and accurate visibility of which customers are more and less profitable Often sales and marketing people are surprised to discover that due to special services their largest customers in sales are not their most profitable ones and that a larger subset of customers than believed are only marginally profitable ndash or worse yet unprofitable But a ranking of profit from each customer does not provide all the information as to why That is where data mining and analytical techniques can help
The use of ABC data leads to activity-based management (ABM) There are some low-hanging fruit insights from ABC data For example one can see relative magnitudes of activity costs consumed among customers There is also visibility into the quantity of activity drivers ndash such as the number of deliveries ndash that cause activity costs to be high or low But this does not provide sufficient insight to differentiate relatively highly profitable customers from lower-profit or unprofitable customers
One can speculate what the differentiating characteristics or traits might be such as sales magnitude or location but hypothesizing (although an important analytics practice) can be time-consuming It is like finding a diamond in a coal mine One cannot flog the data until it confesses In attempting to identify the differentiating traits between more and less profitable customers the major traits may not be intuitively obvious to an analyst A more progressive technique is to use data mining and advanced statistical analytics techniques
This paper describes in particular the use of segmentation analysis based on decision trees and recursive partitioning These techniques can give the sales and marketing functions insights into what actions deals services unbundled pricing and other decisions can elicit profit lift from customers
1 Data mining is the process of extracting patterns from large amounts of stored data by combining methods from statistics and database management systems It is seen as an increasingly important tool for transforming unprecedented quantities of digital data into meaningful information (nicknamed ldquobusiness intelligencerdquo) to give organizations an informational advantage It is used in a wide range of profiling practices such as marketing surveillance fraud detection and scientific discovery
1
Business users of activity-based
costing information gain valuable
insights as to which products
service lines channels and
customers are relatively more
or less profitable They also see
why ndash by observing the visibility
and transparency of the internal
process and activity costs that
yield each customerrsquos contribution
profit margin layers But the pricing
marketing and sales functions often
struggle with determining which
actions to take to create increasing
profit lift for customers This paper
describes analytical techniques
that can identify which drivers best
explain the differences between
high-profit and low-profit (or
negative-profit) customers Knowing
these drivers can lead to the most
profit-lifting actions
Increase Customer Profitability Using Data Mining and Advanced Analytics
The goal is to accelerate the identification of the differentiating drivers so that actions ndash or interventions ndash can be made to achieve that high-payback profit lift from customers Analysts using ABM have benefited from applying online analytical processing (OLAP) multidimensional cubes to slice and dice data Even greater benefits and better decisions can come from applying data mining and advanced analytics
Three Key Trends Affecting ABM
Activity-based management involves calculating how expenses (eg salaries or supplies) are converted into the costs of work activities that in turn are traced into the costs of outputs such as products services channels and customers The calculation method is activity-based costing and it is done with modeling ABM then exploits the ABC information for insights analysis and decisions
The three current trends affecting ABM are
bull Theshiftinattentionfromproduct-centrictocustomer-centriccosts
bull Theexplosionofavailabledata
bull Diminishingreturnsfromprocessandproductivityimprovements
The Suppliersrsquo Shift from Product-Centric to Customer-Centric
Before diving deep into the role that data mining and analytics can play when combined with managerial accounting letrsquos first get some context to help us better appreciate the problem suppliers face in increasing profitability from various customers
A primary reason that companies are increasingly calculating and measuring customer profitability is because of a shift in the sales marketing and operations functions from being product-centric to being customer-centric This shift results from customers increasingly viewing all suppliersrsquo products and standard service lines as commodities (ie having little differentiation) In response to this trend suppliers are shifting their attention toward differentiating services for different types of customers That is rather than mass selling giving the sales force incentives to ldquopushrdquo products suppliers are working backward by starting with their customers and tailoring unique offers and deals based on the distinctive preferences and tastes of customer microsegments (and even individual consumers at the extreme)
But what deal discount special service etc should potentially be offered to which type of customer in order to get the maximum profit lift
2
Increase Customer Profitability Using Data Mining and Advanced Analytics
Answering that question is a challenge Customers should be viewed as investments rather than as something a supplier spends money to serve With this ldquocustomers as investments in a portfoliordquo view the challenge becomes determining which deals offers special services etc will maximize the return on investment (ROI) for each customer microsegment (and potentially for each individual customer) That is how do we determine which actions will yield the largest financial profit lift ndash and from which individual customers
The Availability of Detailed Data
The progression toward transactional ABC models has been fostered by the availability of systematic processes technologies and customer data now that most major organizations have introduced enterprise resource planning (ERP) and customer relationship management (CRM) systems This has meant that it is more practical to define work activities at a more detailed level and provide direct cost driver data to support translating the activity costs into outputs This has inevitably led to an increase in the number and sophistication of work activities and activity cost drivers in the model presenting even more candidates to investigate to understand what is and is not important
Historically it was very difficult to build models of a scale that could produce individual customer profitability models so models tended to stop at a segment level (eg all customers from a given standard industry code geographic area or other arbitrary category) We have tended to rely on the traditional rather than arbitrary groupings used within a business and this potentially disguises important information on trends that cross customer segment boundaries Todayrsquos software computing power particularly transactional costing for individual customers removes that restriction
However when more product variations than ever before are factored in including more distribution channels the complexity of costing models is beyond the level at which basic reporting or even OLAP can be applied to find the most important insights
Declining Emphasis on Process and Productivity Improvement as a Way to Improve the Bottom Line
In the early days activity-based cost management (ABCM) was very much focused on process improvement and could be seen as part of the whole BPRSix SigmaTQM movement After 25 years of these improvement initiatives it is probably fair to assume that most companies have reasonably efficient processes While there may still be productivity gains to be made in this area they are unlikely to be substantial
3
Increase Customer Profitability Using Data Mining and Advanced Analytics
In other words ABCM literature has largely focused on the internal efficiency of business processes as a whole It has yet to really address how processes relate to individual customers and how their varying applications affect profitability Yet this is where we are now more likely to find the opportunity for dramatic gains in profitability of the firm
Whither ABM
With these points in mind a strong business case can be made that the major benefit from applying the principles of activity-based costing is not just from product profitability reporting but also from the more encompassing customer profitability reporting The latter profitability reporting is inclusive of product and standard service-line costs and it also includes the ldquobelow the gross profit margin line expensesrdquo such as distribution channel customer service selling and marketing-related expenses These nonproduct and nonstandard service-line expenses are commonly called costs-to-serve ABC (combined with direct costing) solves the problem of not reliably knowing which products or service lines make or lose profits or which customers are more or less profitable ndash and by how much ABC also measures the cost elements for each customer that yield the level of profit
But as with many other fields solving one problem creates a new problem In the case of ABC the new problem for a company is to understand what actions to take to improve profit generation from customers
What So What Then What
The three trends affecting ABM reveal moving beyond just knowing what outputs cost to understanding the relevance of what causes those costs (so what) ndash and then investigating testing and validating what the financial consequence (then what) will be from decisions based on insights gleaned from the ABC information This is also a good reason for the ABC reporting to be a permanent repeatable and reliable production reporting system This is in contrast to its use as only a one-time study or project to learn an answer and be done Effective ABM creates benefits through frequent short-interval refreshing of the ABC data to monitor progress and see emerging insights for further investigations
4
Increase Customer Profitability Using Data Mining and Advanced Analytics
From Seeing Costs to Understanding Them
Companies that have successfully implemented ABC and can successfully report customer profitability as a permanent and repeatable production system deserve to congratulate themselves and celebrate They have provided better visibility transparency and accuracy for reporting profit margin contribution layers of their customers With this information the pricing sales and marketing functions can see things they previously could only speculate or guess about And much of what they might see may not be pretty or may come as a surprise For example they may realize that their highest-sales-volume customer may not be a very profitable customer due to the substantial extra services that customer requires and associated high-maintenance behavior Under certain conditions some customers may be outright unprofitable But the celebration of this robust reporting should be temporary There is much more to do to increase the customersrsquo profitability to the company
With customer profitability reporting companies can gain insights of all kinds But there is eventually a limit As mentioned before in the grand scheme of decision making good ABC information reporting only answers the first of three critical questions ldquoWhatrdquo That is what do things cost What products service lines channels and customers are more or less profitable But that is only reporting More is needed to increase profits
Analysis and decision making requires answers to two more questions ldquoSo whatrdquo and ldquoThen whatrdquo The ldquoso whatrdquo question begs to know what about the profit margin information is relevant and could be acted upon The ldquothen whatrdquo question begs to know ndash to validate ndash if an action is taken what will be the likely financial effect
What Differentiates More-Profitable From Less-Profitable Customers
Figure 1 displays a popular profit contribution-ranked deciles histogram that groups customers by measuring and viewing them The source of the data is the profit generated by ABC for each customer
5
Increase Customer Profitability Using Data Mining and Advanced Analytics
Figure 1 Customer profit contribution deciles
Profitability reports like that in Figure 1 are often shocking and disturbing to executives and managers when they are seen for the first time This is because the reports reveal their misconceptions ndash that there are substantially higher financial profit and greater losses in certain customers than they suspected (ABC reporting overcomes these misconceptions by replacing accuracy-suppressing cost allocations that use broadly averaged overhead expense allocation factors with cause-and-effect cost-driver tracing assignments)
To answer the ldquoso whatrdquo question related to determining how to increase a customersrsquo profitability a supplier could look at its customer profit contribution-ranked histogram decile diagram (as in Figure 1) and ask this question ldquoExcluding the obvious profit effect from sales volume what one characteristic trait behavior or transaction of a customer differentiates highly profitable customers from the restrdquo That is what is the most
prominent and explanatory driver among all those that are possible
There are challenges to answering this question How should the analysts determine
what and where to investigate Is it with guesswork luck speculation
This is where data mining statistics and analytics play a role to reveal what dominant and secondary drivers explain the differentiation between high- and low-profit customers What most drives profitability across an organization If this were known could pricing
marketing and sales actions be more focused and yield greater certainty
6
Increase Customer Profitability Using Data Mining and Advanced Analytics
7
How Can a Supplier Determine Differentiating Drivers of Its Profits from Customers
Letrsquos start simple Imagine the supplierrsquos business analysts speculate that the residential location of a customer may be a major driver explaining the differentiation between high- and low-profit customers ndash the first and last profit contribution decile in Figure 1rsquos histogram Since the analysts have access to both of these data items (ie profit and home address) a correlation2 (ie the explanatory value level) can be measured
With a very simple examination of just the most and least profitable (10 percent) customer histogram deciles the correlation measure may confirm the analystsrsquo hypotheses that the most profitable customers live in affluent neighborhoods and the unprofitable customers reside in low-income neighborhoods There is however a remaining question ndash how strongly do these newfound facts support the conclusion If the correlation is extremely high then potential ldquoso whatrdquo actions ndash like knowing where to advertise and where not to ndash become obvious But letrsquos imagine that in this case the correlation measure is relatively low ndash meaning that residential location does not strongly support the analystsrsquo hypothesis
What next Which other driver might explain the customer profit differentiation
The Explanatory Investigation Continues hellip and Continues
Imagine the supplierrsquos analysts next speculate that it is the customerrsquos age not their residential location that may be a major explanatory driver differentiating high-profit from low-profit customers Again both data records for all customers are accessible (ie profit age) The correlation is again measured A possible outcome might reveal that older customers (eg senior citizens) are much more profitable and younger customers (eg teenagers) are much less profitable
However the outcome could have been the reverse with young people (eg spendthrifts) being most profitable and older people (eg frugal) not But similar to the residential location hypothesis letrsquos imagine that the strength of the correlation measure is again low ndash meaning there is not clear evidence that age is a differentiating driver
How about the product mixes that customers purchase Figure 2 displays what the analyst could see However imagine again that the correlation score does not demonstrate sufficient evidence that this is a differentiating driver
2 In statistics dependence refers to any statistical relationship between two random variables or two sets of data Correlation refers to any of a broad class of statistical relationships involving dependence
Familiar examples of dependent phenomena include the correlation between the physical statures of parents and their offspring and the correlation between the demand for a product and its price Correlations are useful because they can indicate a predictive relationship that can be exploited in practice For example an electrical utility may produce less power on a mild day based on the correlation between electricity demand and weather In this example there is a causal relationship because extreme weather causes people to use more electricity for heating or cooling however statistical dependence is not sufficient to demonstrate the presence of such a causal relationship
8
Increase Customer Profitability Using Data Mining and Advanced Analytics
Figure 2 Product mix deciles
How about the region of the country the customer lives in rather than the type of neighborhood within a metropolitan area as the analyst first speculated Figure 3 displays this view But again letrsquos imagine that this driver does not provide clear or sufficient evidence
Figure 3 Region decile
Increase Customer Profitability Using Data Mining and Advanced Analytics
9
Where do the analysts go next What other driver or trait could they test That is what other customer driver or trait could the supplierrsquos analysts consider as the high versus low customer-profit-level differentiator Customer weight Hair color Type of credit card Number of brothers and sisters Sibling age rank (eg oldest youngest) Model year of their car Car manufacturer and model Which traits can you think of
The point here is that the possibilities appear to be unlimited especially if you have a big imagination Does the pursuit need to continue to be somewhat trial-and-error as in the examples above Possibly ndash however experienced analysts do apply some common sense in speculating which drivers to consider But in a complex world even experienced analysts need some assistance to shorten their investigation time and help them quickly focus on what matters most
In reality the number of single customer behaviors or traits that is ldquomost explanatoryrdquo is not limitless It is restricted by the amount of data a supplier has about each of its customers But with the massive amount of customer information in storage the list of driver choices could be fairly extensive
So what driver should the supplierrsquos analysts test next Selecting the first few traits may be relatively easy ndash as with the residential location and age However as in our example assume that the correlation values are low Then do you test other traits that are less obvious and may be more challenging to hypothesize What should the analysts do to reduce the time and effort of this investigation This research should not be like looking for the single needle in a haystack or the single diamond in a coal mine
Letrsquos Try a Different Approach
At this point it is clear that customer profitability reporting is not the same thing as customer profitability analysis What is needed is an approach that will crystallize insights gained from customer profitability reporting ndash and generate meaningful insight into which characteristics and behaviors of customers and products separate the relatively more- and less-profitable customers
Analyzing large-scale customer-profitability models is the sort of challenge ideally suited to SASreg softwarersquos advanced data mining and analytical capabilities These techniques allow a business analyst to increase the value of the model by
bull Simplifyingcomplexityandidentifyingwhatismostimportantforthebusinesstofocus on
bull Discoveringhiddenpatternsthatcrossarbitrarycustomersegmentboundaries
bull Allowingthebusinesstopredicthowprofitableacustomerislikelytobenowandin the future
Applying data mining and analytics to cost and profitability reporting will enable the business analyst to answer the ldquoso whatrdquo question Performance management methodology modeling can solve the ldquothen whatrdquo question
10
Increase Customer Profitability Using Data Mining and Advanced Analytics
The next section shows how data mining solved that earlier problem of finding which drivers were critical ones in our model
Applying the Computing Power of Data Mining and Advanced Analytics
Letrsquos discard the hypothetical supplier analystsrsquo quest and get more directly to the point By combining data mining and advanced analytics (in this case a statistical technique called a decision tree) with todayrsquos enormous computing power and its access to massive amounts of stored data about customers one can gain tremendous insight Decision trees are a simple but powerful form of multiple variable analysis Produced by algorithms that split data into branch-like partitions decision trees are developed and presented incrementally as a collection of one-cause one-effect relationships calculated in a recursive form The appeal of decision trees lies in their relative power ease of use robustness with a variety of data types and ease with which they can be understood by non-experts
Figure 4 displays the initial ldquobranchingrdquo of the most statistically significant explanatory differentiating driver For this particular supplierrsquos 22161 customersrsquo profit rank ordered for 2010 the correlation analysis calculated ldquoaverage transaction quantityrdquo as the most explanatory driver
Figure 4 Decision tree - the average transaction quantity
Increase Customer Profitability Using Data Mining and Advanced Analytics
11
The figure displays other potentially useful information
bull Itcalculatesthat53istheaveragetransactionquantitythatdividesthemore-and less-profitable customers into two subsets of the whole population of 22161 customers
bull Itcalculatesthat6551customersaretheldquolessprofitablerdquo(withtheirownaveragetransaction quantity of 108) ndash and that 15610 customers are in the ldquomore profitablerdquo subset (with their own average transaction quantity of 707)
bull Itcalculatesthat1469isthedividingamountwithcustomersabovethatnumberbeing x and those below it being y
OK So what
Where Does the Analyst Go from Here
Based on the initial partition the marketing and sales functions can begin to brainstorm how to alter the behavior of customers in the ldquoless profitablerdquo segment so that they move in the direction of customers in the ldquomore profitablerdquo segment For example the supplier could provide customers with a menu of service-level prices to encourage them to increase or decrease transaction quantities with offered price levels derived from the ABC information by assuring that an incremental change in price (up or down) will always exceed the incremental change in cost to deliver that service level This way the supplier gains a higher profit by altering the behavior of the customer to select a service-level offer in either direction
But while that brainstorming is occurring the analysts can delve deeper After the average transaction quantity is revealed as the most prominent factor each ldquomoreless profitablerdquo segment will be recursively partitioned Following one branch of the decision tree down Figure 5 reveals that the factor that most differentiates the ldquomore profitablerdquo customers is ldquo cashrdquo and subsequently further down the tree a third critical factor ndash ldquodays with a negative balancerdquo ndash applies
At this point an uncomfortable fact is uncovered Within the ldquohigh average transaction quantity customersrdquo there exists a distinct microsegment who use a lot of cash and frequently run overdrafts Consequently they are the least-profitable customers Now the marketing and sales functions can focus on this particular microsegment and brainstorm ideas to change this customer segmentrsquos behavior or their commercial terms and move them toward profitability Figure 5 displays the expanding the decision tree diagram
12
Increase Customer Profitability Using Data Mining and Advanced Analytics
Figure 5 Three-level tree diagram
You get the idea Why speculate when the computer can do the heavy lifting
And Therersquos More hellip
Does this mean that the analystsrsquo work is done By no means This is just one technique that can be applied to a model to solve one particular question What are the typical behaviors that distinguish our most and least profitable customers Advanced data mining and analytical techniques give the business analyst both the time and capability to gain ever more insight into their customers The analyst plays a critical role in this process defining the business problem understanding how it can be answered (and therefore which analytical technique to use) and finally how to structure the analysis3 This enables a business to tackle a range of other issues that include using analytics to
bull Betterunderstandtheimplicationofnonrecurringevents
bull Understandthenatureofprocessfailure
bull Predictwhichprospectsarelikelytobemostprofitable
bull Understandcustomerlifetimevalue
bull Developcustomerstrategybasedonprofitablebehaviors
3 Appendix 1 The Importance of Ratios
Increase Customer Profitability Using Data Mining and Advanced Analytics
13
Using analytics to better understand the implication of occasional (intermittent) events4
When customer segments are disaggregated down to an individual level one may encounter occasional (ie intermittent) activities associated with a customer (what we might call ldquoriskrdquo incidents) that are unlikely to reoccur on a regular basis but still have a dramatic impact on the potential profitability of that customer An example of this is a customer moving to a new home which is a significant expense for an energy company but one that probably does not happen frequently for the majority of customers For a correct appreciation of the profitability of a customer one needs to not just understand what it costs to process this incident but also the likely probability of it occurring in any given period
Using analytics to understand the nature of process failure5
Any ABM model makes the immediate costs of failure in internal processes extremely visible But in addition to the direct impact of the cost of recovery activities there may be secondary impacts that are less visible in an ABM model These can still be identified and the implications can be quantified These secondary impacts can materialize in a number of ways over time including increased cancellation rates selection of more costly but less risky business channels reduced reorder frequencies and volumes and elevated customer churn rates
Predicting which prospects are likely to be most profitable6
Once an existing customerrsquos behavior is known it becomes relatively easy to predict whether that customer is likely to be profitable even without a detailed profit model Of course the potential behavior of prospective customers is an unknown ndash but it is not necessarily unpredictable An analysis linking customer profitability to geo-demographic characteristics allows an analyst to identify prospects with certain determining characteristics We can theorize that these customers are likely to behave in a similar fashion to similar existing customers and become similarly profitable
4 Appendix 2 Risk Incidents Accounting for Occasional Events in Profitability Analyses5 Appendix 3 Risk Incidents Better Understanding the Impact of Process Failures6 Appendix 4 Profitable Customer Acquisition
14
Increase Customer Profitability Using Data Mining and Advanced Analytics
Using analytics to understand customer lifetime value7
One of the significant insights discovered early when customer profitability models are data mined is that customer profitability does not tend to follow a nice smooth incremental path Instead it tends to cluster around customers at different life stages and steps of their relationship with a business To provide a real picture of the potential long-term value of a customer ndash showing the customerrsquos longevity and their likely future ndash analytics incorporates the possibility of significant life-stage changes
Using analytics to develop customer strategy based on profitable behaviors8
Where ABM has been applied to strategy it has typically been focused on structural issues such as how to organize departments to achieve economies of scale or what markets to continue pursuing But for a marketer thinking about customer strategy customer profitability and behavioral analysis should be foundation stones This calls on two aspects previously discussed ndash the characteristics of profitable customers and where a business can find more customers like them However strategy will tend to focus less on the small and unusual customers and more on large groups of customers with similar characteristics
Conclusion
All things considered why speculate and guess at the rank-ordered drivers that differentiate between relatively more- and less-profitable customers Why not apply computer power to do the heavy lifting An additional message is to not perform the analysis as a one-time study but to produce the information at frequent time intervals as a permanent repeatable and reliable production information system
It is true that experienced analysts typically suspect and hypothesize that two or more things are related or that some underlying behavior is driving behavior seen in the data They then search for confirmation and understanding of the relationships In other words the application of analytics is usually more confirmatory than exploratory It is not like finding diamonds in a coal mine One does not simply flog the data until it confesses However in the case of attempting to identify the differentiating traits between more- and less-profitable customers the major traits may not be intuitively obvious to an analyst
The goal is to accelerate the identification of the differentiating drivers so that actions ndash interventions ndash can be considered as a way to get high-payback profit lift from customers The analysts using ABM have benefited from applying online analytical processing (OLAP) multidimension cubes to slice-and-dice data Even greater benefits and better decisions can come from applying data mining and advanced analytics
7 Appendix 5 Customer Equity Analysis
8 Appendix 6 Customer Strategy
Increase Customer Profitability Using Data Mining and Advanced Analytics
15
APPENDIX 1
The Importance of Ratios
One of the critical first steps when analyzing an ABC model is to understand the data and how it needs to be transformed to correctly answer your questions The biggest issue we face is the impact of volume effects (the amount a customer buys) on our analysis and how they can override any other potentially more important analyses This is why one of the first actions often taken is to ldquonormalize the datardquo through the derivation of key ratios that remove the size effects and allow deeper insights to be surfaced
To illustrate this we will use the case of a wholesale business that has some large and some small customers with varying return rates We could consider four customers ndash two large (A and B) and two small (C and D) ndash with two of the customers having high return rates (A and C) and two of the customers having low return rates (B and D) See the table for an illustration
If we then plot this data on two charts one showing net total contribution versus number of returns and the other showing percent of contribution versus percent of return rates we see a dramatically different picture The volume effect overwhelms the return rate effect in the first graph where we plot absolute values giving a potentially misleading message that the number of returns has a positive correlation to profit In the key ratios analysis with the size effects removed the rate of returns can be correctly seen to have a negative impact on profitability
16
Increase Customer Profitability Using Data Mining and Advanced Analytics
Indeed the beloved whale curve diagram (more properly called the profit margin cliff curve) has a tendency to provide a relatively false picture of profitability Because it orders customers on the basis of absolute profit it tends to group all the small customers in the center and place large customers at each end This over-emphasizes these few significant but anomalous customers and leads us to miss potentially critical trends and patterns that can be found in the population at large and which can have a
dramatic impact on profitability
By sizing and ordering our customers based on revenue and by showing profit versus revenue we can transform a relatively benign-looking whale curve into a much more dramatic hook curve As shown below we can now see that we have a whole set of customers who are in fact more profitable than our largest customer even though they generate the most absolute profit And similarly we have a host of customers who are significantly less profitable than our customer who generates the greatest loss It is also quite clear that clearing out our unprofitable customers will not have a dramatic impact on our top line so we will feel free to attack them without worrying too much about the impact on the share price
Increase Customer Profitability Using Data Mining and Advanced Analytics
17
APPENDIX 2
Risk Incidents Accounting for Occasional Events in Profitability Analyses
One of the unfortunate side effects of the periodic nature of an ABC model is that it captures occasional events against a customer in the period that they happen then registers the impact on profitability in that period but provides us with little information about whether that event is likely to recur frequently or infrequently
Examples include things as varied as home moves for energy companies insurance claims warranty claims issuing of new credit cards or mobile handset renewals
When designing our data exploration model we need to adopt a different strategy for these sorts of costs Specifically we need to replace the occasional event or behavior with a marker indicating the probability of the event occurring Typically this would be a direct calculation of the probability of the event occurring for each customer in the period This may be calculated using a number of techniques including logistic regressions neural networks or a decision tree
18
Increase Customer Profitability Using Data Mining and Advanced Analytics
Alternatively we may find a proxy indicator for the risk of the occasional event These are typically geo-demographic indicators but they could also include products (for example car model affecting the probability of a warranty claim) or channel (returns are more likely for mail order than store-purchased products)
Exact choice of approach depends very much upon
bull Theneedsoftheanalysis
bull Theavailabilityofdata
bull Thetoolsavailable
APPENDIX 3
Risk Incidents Better Understanding the Impact of Process Failures
One class of occasional events often has to do with process failures One of the huge benefits of an ABM model is that it makes the true costs of such failures extremely visible But in addition to making the cost visible analytics also gives us the ability to better understand the impact of such failures from the likelihood of them occurring to the long-term impact on customer retention
One example of this occurred at a classified advertising company where a segment of customers were identified who had many advertisement amendment costs but also unusually low revenue due to cancellations
Increase Customer Profitability Using Data Mining and Advanced Analytics
19
Beyond the initial identification of this unusual set of behaviors a technique called survival analysis was applied to the problem This clearly revealed that there was a critical turning point in the customersrsquo relationship with the business at which point they became frustrated enough to cancel their advertisement (See the diagram for more information) With this insight we knew when to set a warning marker on transactions allowing us to review them and determine if a recovery effort was worth engaging in
APPENDIX 4
Profitable Customer Acquisition
While much of this paper has been focused on how we identify which behaviors customers exhibit that make them profitable or not it is not possible to understand how a prospect will behave if we acquire them and therefore whether they are likely to be worth the effort Much work has gone on in sophisticated companies to review expected sales revenues for different demographics But these analyses can be improved even further by moving from analyzing and segmenting based on expected revenue to applying the additional insight available from a customer profitability model This type of model not only has the potential to tell a company what level of profit they may expect from a particular prospect segment but it can also show
bull Howthatgroupislikelytobehave
bull Theproductmixtheymayprefer
bull Thechannelstheymayprefertopurchasethrough
bull Theirtypicalordersizes
bull Whethertheyarelikelytohavepaymentproblemswhichwouldcausepotential impact on the companyrsquos resources (call centers order processing warehouses etc)
20
Increase Customer Profitability Using Data Mining and Advanced Analytics
To achieve this analysis a decision tree is often the most useful tool But rather than applying behaviors to segment the customers we apply demographic indicators ndash and once a segment is identified we overlay that initial analysis with a behavioral analysis
APPENDIX 5
Customer Equity Analysis
The final stage in this process is to move to some form of lifetime value analysis Much of the literature assumes that customers advance on an incremental basis gradually growing over time to buy more and newer products right up to the point at which they leave
However with the much greater depth of knowledge we have on customer behaviors and which ones are significant one of the clear findings is that customers are not generally incremental in nature Instead they tend to be relatively static until they go through some form of state change transformation (such as leaving school getting married or losing a job) With our ability to identify how customers typically behave in each of these states and the propensity of them to move between states we can develop a more realistic approach That approach would be to not look at individual customer lifetime value but to look at the potential value of a particular segment ndash including how it will change over time as new customers are acquired through transfer or acquisition and how they are lost either through transfer or churn The diagram below shows this more realistic model of customer equity analysis
Increase Customer Profitability Using Data Mining and Advanced Analytics
21
APPENDIX 6
Customer Strategy
Where ABM has been applied to strategy it has typically been focused on structural issues how to organize departments to achieve economies of scale and what markets to continue pursuing But for a marketer thinking about their customer strategy customer profitability and behavioral analysis should be foundation stones However this need differs from that of the person looking to identify and understand the sorts of unusual customers who are identified by a decision tree
To understand customers itrsquos important to understand a broad sweep of customer behaviors and to identify large segments of customers with similar patterns of behavior for which they need to develop a strategy For this purpose a technique called cluster analysis becomes invaluable In cluster analysis all business drivers are considered equally important for the segmentation This is unlike a decision tree where there is a clear target variable (typically profitability) and explanatory variables (the key ratios) In cluster analysis all variables are tested and the significant ones that indicate customers with similar patterns of behavior (including things like profitability) are identified and used to segment the customers
With the members of each cluster identified other information can be overlaid on the analysis to deepen the picture and appropriate strategies can be developed In the case of a technology wholesaler six clusters were identified of this four represented the core of the business for which strategies were deployed
22
Increase Customer Profitability Using Data Mining and Advanced Analytics
The first group (PG) was happy to pay for a relatively high service level and consequently was very profitable so a strategy of ldquocuddlerdquo was developed The UNeg group was very similar to the PG group in many ways but a significant portion of their purchase mix involved redundant technology that was sold at a loss but should probably never have still been in stock The strategy here was to ldquocurerdquo this stock management problem and return these customers to profit The core of the business came from those in the PNorm group low-effort customers with an OK margin who we needed to ldquokeeprdquo as customers Finally there was a class of customers called UNorm who asked for the earth but did not want to pay and for those an active ldquocullrdquo strategy was developed Under this strategy they were offered terms that would make them profitable if accepted ndash but if the terms were rejected the wholesaler would no longer supply them
Increase Customer Profitability Using Data Mining and Advanced Analytics
23
About SAS
SAS is the leader in business analytics software and services and the largest independent vendor in the business intelligence market Through innovative solutions delivered within an integrated framework SAS helps customers at more than 50000 sites improve performance and deliver value by making better decisions faster Since 1976SAShasbeengivingcustomersaroundtheworldTHEPOWERTOKNOWreg
SAS Institute Inc World Headquarters +1 919 677 8000To contact your local SAS office please visit wwwsascomoffices
SAS and all other SAS Institute Inc product or service names are registered trademarks or trademarks of SAS Institute Inc in the USA and other countries reg indicates USA registration Other brand and product names are trademarks of their respective companies Copyright copy 2011 SAS Institute Inc All rights reserved 105300_649310811
- Executive Summary
- Three Key Trends Affecting ABM
-
- The Suppliersrsquo Shift from Product-Centric to Customer-Centric
- The Availability of Detailed Data
- Declining Emphasis on Process and Productivity Improvement as a Way to Improve the Bottom Line
- Whither ABM
-
- What So What Then What
-
- From Seeing Costs to Understanding Them
- What Differentiates More-Profitable From Less-Profitable Customers
- How Can a Supplier Determine Differentiating Drivers of Its Profits from Customers
- The Explanatory Investigation Continues hellip and Continues
- Letrsquos Try a Different Approach
- Applying the Computing Power of Data Mining and Advanced Analytics
- Where Does the Analyst Go from Here
- And Therersquos Morehellip
-
- Conclusion
- APPENDIX 1
-
- The Importance of Ratios
-
- APPENDIX 2
-
- Risk Incidents Accounting for Occasional Events in Profitability Analyses
-
- APPENDIX 3
-
- Risk Incidents Better Understanding the Impact of Process Failures
-
- APPENDIX 4
-
- Profitable Customer Acquisition
-
- APPENDIX 5
-
- Customer Equity Analysis
-
- APPENDIX 6
-
- Customer Strategy
-
- About SAS
-

Increase Customer Profitability Using Data Mining and Advanced Analytics
Table of Contents
Executive Summary 1Three Key Trends Affecting ABM 2
The Suppliersrsquo Shift from Product-Centric to Customer-Centric 2The Availability of Detailed Data 3Declining Emphasis on Process and Productivity Improvement as a Way to Improve the Bottom Line 3Whither ABM 4
What So What Then What 4From Seeing Costs to Understanding Them 5What Differentiates More-Profitable From Less-Profitable Customers 5How Can a Supplier Determine Differentiating Drivers of Its Profits from Customers 7The Explanatory Investigation Continues hellip and Continues 7Letrsquos Try a Different Approach 9Applying the Computing Power of Data Mining and Advanced Analytics 10Where Does the Analyst Go from Here 11And Therersquos More hellip 12
Conclusion 14APPENDIX 1 15
The Importance of Ratios 15APPENDIX 2 17
Risk Incidents Accounting for Occasional Events in Profitability Analyses 17
APPENDIX 3 18Risk Incidents Better Understanding the Impact of Process Failures 18
APPENDIX 4 19Profitable Customer Acquisition 19
APPENDIX 5 20Customer Equity Analysis 20
APPENDIX 6 21Customer Strategy 21
About SAS 23
Increase Customer Profitability Using Data Mining and Advanced Analytics
ii
This white paper was written by Gary Cokins and Charles Randall Gary Cokins is an internationally recognized expert speaker and author on the subject of advanced cost management and performance management systems He is a Principal in Global Business Advisory Services with SAS a leading provider of business intelligence and analytic software headquartered in Cary NC Cokins received a BS in industrial engineeringoperations research from Cornell University and an MBA from Northwestern Universityrsquos Kellogg School of Management Cokins began his career at FMC Corporation and he also served as a management consultant with Deloitte KPMG Peat Marwick and Electronic Data Systems (EDS) His latest book is Performance Management Integrating Strategy Execution Methodologies Risk and Analytics He can be reached at garycokinssascom Charles Randall has built his career in strategy and marketing analytics Randallrsquos career encompassed both telecommunications and management consultancy before joining SAS as a Principal Business Consultant In his current role as Solutions Marketing Manager he draws from 15 years of experience in these fields to share deep expertise and insight in numerous articles and papers Randall received a BSc in economics and a PhD in econometrics from the University of Wales His latest research study is titled Pleased to Meet You How Different Customers Prefer Very Different Channels The study is a joint project with Professor Hugh Wilson of Cranfield School of Management Randall can be reached at charlesrandallsuksascom
Increase Customer Profitability Using Data Mining and Advanced Analytics
Executive Summary
There is a trend for customers to increasingly view suppliersrsquo products and standard service lines as commodities As a result what customers now seek from suppliers are special services ideas innovation and thought leadership Many suppliers have actively shifted their sales and marketing functions from product-centric to customer-centric through the use of data mining and business intelligence1 tools to understand their customersrsquo behavior ndash their preferences purchasing habits and customer affinity groups In some companies the accounting function has supported this shift by reporting customer profitability information (including product gross profit margins) using activity-based costing (ABC) principles However is this enough
It is progressive for the accounting function to provide marketing and sales with reliable and accurate visibility of which customers are more and less profitable Often sales and marketing people are surprised to discover that due to special services their largest customers in sales are not their most profitable ones and that a larger subset of customers than believed are only marginally profitable ndash or worse yet unprofitable But a ranking of profit from each customer does not provide all the information as to why That is where data mining and analytical techniques can help
The use of ABC data leads to activity-based management (ABM) There are some low-hanging fruit insights from ABC data For example one can see relative magnitudes of activity costs consumed among customers There is also visibility into the quantity of activity drivers ndash such as the number of deliveries ndash that cause activity costs to be high or low But this does not provide sufficient insight to differentiate relatively highly profitable customers from lower-profit or unprofitable customers
One can speculate what the differentiating characteristics or traits might be such as sales magnitude or location but hypothesizing (although an important analytics practice) can be time-consuming It is like finding a diamond in a coal mine One cannot flog the data until it confesses In attempting to identify the differentiating traits between more and less profitable customers the major traits may not be intuitively obvious to an analyst A more progressive technique is to use data mining and advanced statistical analytics techniques
This paper describes in particular the use of segmentation analysis based on decision trees and recursive partitioning These techniques can give the sales and marketing functions insights into what actions deals services unbundled pricing and other decisions can elicit profit lift from customers
1 Data mining is the process of extracting patterns from large amounts of stored data by combining methods from statistics and database management systems It is seen as an increasingly important tool for transforming unprecedented quantities of digital data into meaningful information (nicknamed ldquobusiness intelligencerdquo) to give organizations an informational advantage It is used in a wide range of profiling practices such as marketing surveillance fraud detection and scientific discovery
1
Business users of activity-based
costing information gain valuable
insights as to which products
service lines channels and
customers are relatively more
or less profitable They also see
why ndash by observing the visibility
and transparency of the internal
process and activity costs that
yield each customerrsquos contribution
profit margin layers But the pricing
marketing and sales functions often
struggle with determining which
actions to take to create increasing
profit lift for customers This paper
describes analytical techniques
that can identify which drivers best
explain the differences between
high-profit and low-profit (or
negative-profit) customers Knowing
these drivers can lead to the most
profit-lifting actions
Increase Customer Profitability Using Data Mining and Advanced Analytics
The goal is to accelerate the identification of the differentiating drivers so that actions ndash or interventions ndash can be made to achieve that high-payback profit lift from customers Analysts using ABM have benefited from applying online analytical processing (OLAP) multidimensional cubes to slice and dice data Even greater benefits and better decisions can come from applying data mining and advanced analytics
Three Key Trends Affecting ABM
Activity-based management involves calculating how expenses (eg salaries or supplies) are converted into the costs of work activities that in turn are traced into the costs of outputs such as products services channels and customers The calculation method is activity-based costing and it is done with modeling ABM then exploits the ABC information for insights analysis and decisions
The three current trends affecting ABM are
bull Theshiftinattentionfromproduct-centrictocustomer-centriccosts
bull Theexplosionofavailabledata
bull Diminishingreturnsfromprocessandproductivityimprovements
The Suppliersrsquo Shift from Product-Centric to Customer-Centric
Before diving deep into the role that data mining and analytics can play when combined with managerial accounting letrsquos first get some context to help us better appreciate the problem suppliers face in increasing profitability from various customers
A primary reason that companies are increasingly calculating and measuring customer profitability is because of a shift in the sales marketing and operations functions from being product-centric to being customer-centric This shift results from customers increasingly viewing all suppliersrsquo products and standard service lines as commodities (ie having little differentiation) In response to this trend suppliers are shifting their attention toward differentiating services for different types of customers That is rather than mass selling giving the sales force incentives to ldquopushrdquo products suppliers are working backward by starting with their customers and tailoring unique offers and deals based on the distinctive preferences and tastes of customer microsegments (and even individual consumers at the extreme)
But what deal discount special service etc should potentially be offered to which type of customer in order to get the maximum profit lift
2
Increase Customer Profitability Using Data Mining and Advanced Analytics
Answering that question is a challenge Customers should be viewed as investments rather than as something a supplier spends money to serve With this ldquocustomers as investments in a portfoliordquo view the challenge becomes determining which deals offers special services etc will maximize the return on investment (ROI) for each customer microsegment (and potentially for each individual customer) That is how do we determine which actions will yield the largest financial profit lift ndash and from which individual customers
The Availability of Detailed Data
The progression toward transactional ABC models has been fostered by the availability of systematic processes technologies and customer data now that most major organizations have introduced enterprise resource planning (ERP) and customer relationship management (CRM) systems This has meant that it is more practical to define work activities at a more detailed level and provide direct cost driver data to support translating the activity costs into outputs This has inevitably led to an increase in the number and sophistication of work activities and activity cost drivers in the model presenting even more candidates to investigate to understand what is and is not important
Historically it was very difficult to build models of a scale that could produce individual customer profitability models so models tended to stop at a segment level (eg all customers from a given standard industry code geographic area or other arbitrary category) We have tended to rely on the traditional rather than arbitrary groupings used within a business and this potentially disguises important information on trends that cross customer segment boundaries Todayrsquos software computing power particularly transactional costing for individual customers removes that restriction
However when more product variations than ever before are factored in including more distribution channels the complexity of costing models is beyond the level at which basic reporting or even OLAP can be applied to find the most important insights
Declining Emphasis on Process and Productivity Improvement as a Way to Improve the Bottom Line
In the early days activity-based cost management (ABCM) was very much focused on process improvement and could be seen as part of the whole BPRSix SigmaTQM movement After 25 years of these improvement initiatives it is probably fair to assume that most companies have reasonably efficient processes While there may still be productivity gains to be made in this area they are unlikely to be substantial
3
Increase Customer Profitability Using Data Mining and Advanced Analytics
In other words ABCM literature has largely focused on the internal efficiency of business processes as a whole It has yet to really address how processes relate to individual customers and how their varying applications affect profitability Yet this is where we are now more likely to find the opportunity for dramatic gains in profitability of the firm
Whither ABM
With these points in mind a strong business case can be made that the major benefit from applying the principles of activity-based costing is not just from product profitability reporting but also from the more encompassing customer profitability reporting The latter profitability reporting is inclusive of product and standard service-line costs and it also includes the ldquobelow the gross profit margin line expensesrdquo such as distribution channel customer service selling and marketing-related expenses These nonproduct and nonstandard service-line expenses are commonly called costs-to-serve ABC (combined with direct costing) solves the problem of not reliably knowing which products or service lines make or lose profits or which customers are more or less profitable ndash and by how much ABC also measures the cost elements for each customer that yield the level of profit
But as with many other fields solving one problem creates a new problem In the case of ABC the new problem for a company is to understand what actions to take to improve profit generation from customers
What So What Then What
The three trends affecting ABM reveal moving beyond just knowing what outputs cost to understanding the relevance of what causes those costs (so what) ndash and then investigating testing and validating what the financial consequence (then what) will be from decisions based on insights gleaned from the ABC information This is also a good reason for the ABC reporting to be a permanent repeatable and reliable production reporting system This is in contrast to its use as only a one-time study or project to learn an answer and be done Effective ABM creates benefits through frequent short-interval refreshing of the ABC data to monitor progress and see emerging insights for further investigations
4
Increase Customer Profitability Using Data Mining and Advanced Analytics
From Seeing Costs to Understanding Them
Companies that have successfully implemented ABC and can successfully report customer profitability as a permanent and repeatable production system deserve to congratulate themselves and celebrate They have provided better visibility transparency and accuracy for reporting profit margin contribution layers of their customers With this information the pricing sales and marketing functions can see things they previously could only speculate or guess about And much of what they might see may not be pretty or may come as a surprise For example they may realize that their highest-sales-volume customer may not be a very profitable customer due to the substantial extra services that customer requires and associated high-maintenance behavior Under certain conditions some customers may be outright unprofitable But the celebration of this robust reporting should be temporary There is much more to do to increase the customersrsquo profitability to the company
With customer profitability reporting companies can gain insights of all kinds But there is eventually a limit As mentioned before in the grand scheme of decision making good ABC information reporting only answers the first of three critical questions ldquoWhatrdquo That is what do things cost What products service lines channels and customers are more or less profitable But that is only reporting More is needed to increase profits
Analysis and decision making requires answers to two more questions ldquoSo whatrdquo and ldquoThen whatrdquo The ldquoso whatrdquo question begs to know what about the profit margin information is relevant and could be acted upon The ldquothen whatrdquo question begs to know ndash to validate ndash if an action is taken what will be the likely financial effect
What Differentiates More-Profitable From Less-Profitable Customers
Figure 1 displays a popular profit contribution-ranked deciles histogram that groups customers by measuring and viewing them The source of the data is the profit generated by ABC for each customer
5
Increase Customer Profitability Using Data Mining and Advanced Analytics
Figure 1 Customer profit contribution deciles
Profitability reports like that in Figure 1 are often shocking and disturbing to executives and managers when they are seen for the first time This is because the reports reveal their misconceptions ndash that there are substantially higher financial profit and greater losses in certain customers than they suspected (ABC reporting overcomes these misconceptions by replacing accuracy-suppressing cost allocations that use broadly averaged overhead expense allocation factors with cause-and-effect cost-driver tracing assignments)
To answer the ldquoso whatrdquo question related to determining how to increase a customersrsquo profitability a supplier could look at its customer profit contribution-ranked histogram decile diagram (as in Figure 1) and ask this question ldquoExcluding the obvious profit effect from sales volume what one characteristic trait behavior or transaction of a customer differentiates highly profitable customers from the restrdquo That is what is the most
prominent and explanatory driver among all those that are possible
There are challenges to answering this question How should the analysts determine
what and where to investigate Is it with guesswork luck speculation
This is where data mining statistics and analytics play a role to reveal what dominant and secondary drivers explain the differentiation between high- and low-profit customers What most drives profitability across an organization If this were known could pricing
marketing and sales actions be more focused and yield greater certainty
6
Increase Customer Profitability Using Data Mining and Advanced Analytics
7
How Can a Supplier Determine Differentiating Drivers of Its Profits from Customers
Letrsquos start simple Imagine the supplierrsquos business analysts speculate that the residential location of a customer may be a major driver explaining the differentiation between high- and low-profit customers ndash the first and last profit contribution decile in Figure 1rsquos histogram Since the analysts have access to both of these data items (ie profit and home address) a correlation2 (ie the explanatory value level) can be measured
With a very simple examination of just the most and least profitable (10 percent) customer histogram deciles the correlation measure may confirm the analystsrsquo hypotheses that the most profitable customers live in affluent neighborhoods and the unprofitable customers reside in low-income neighborhoods There is however a remaining question ndash how strongly do these newfound facts support the conclusion If the correlation is extremely high then potential ldquoso whatrdquo actions ndash like knowing where to advertise and where not to ndash become obvious But letrsquos imagine that in this case the correlation measure is relatively low ndash meaning that residential location does not strongly support the analystsrsquo hypothesis
What next Which other driver might explain the customer profit differentiation
The Explanatory Investigation Continues hellip and Continues
Imagine the supplierrsquos analysts next speculate that it is the customerrsquos age not their residential location that may be a major explanatory driver differentiating high-profit from low-profit customers Again both data records for all customers are accessible (ie profit age) The correlation is again measured A possible outcome might reveal that older customers (eg senior citizens) are much more profitable and younger customers (eg teenagers) are much less profitable
However the outcome could have been the reverse with young people (eg spendthrifts) being most profitable and older people (eg frugal) not But similar to the residential location hypothesis letrsquos imagine that the strength of the correlation measure is again low ndash meaning there is not clear evidence that age is a differentiating driver
How about the product mixes that customers purchase Figure 2 displays what the analyst could see However imagine again that the correlation score does not demonstrate sufficient evidence that this is a differentiating driver
2 In statistics dependence refers to any statistical relationship between two random variables or two sets of data Correlation refers to any of a broad class of statistical relationships involving dependence
Familiar examples of dependent phenomena include the correlation between the physical statures of parents and their offspring and the correlation between the demand for a product and its price Correlations are useful because they can indicate a predictive relationship that can be exploited in practice For example an electrical utility may produce less power on a mild day based on the correlation between electricity demand and weather In this example there is a causal relationship because extreme weather causes people to use more electricity for heating or cooling however statistical dependence is not sufficient to demonstrate the presence of such a causal relationship
8
Increase Customer Profitability Using Data Mining and Advanced Analytics
Figure 2 Product mix deciles
How about the region of the country the customer lives in rather than the type of neighborhood within a metropolitan area as the analyst first speculated Figure 3 displays this view But again letrsquos imagine that this driver does not provide clear or sufficient evidence
Figure 3 Region decile
Increase Customer Profitability Using Data Mining and Advanced Analytics
9
Where do the analysts go next What other driver or trait could they test That is what other customer driver or trait could the supplierrsquos analysts consider as the high versus low customer-profit-level differentiator Customer weight Hair color Type of credit card Number of brothers and sisters Sibling age rank (eg oldest youngest) Model year of their car Car manufacturer and model Which traits can you think of
The point here is that the possibilities appear to be unlimited especially if you have a big imagination Does the pursuit need to continue to be somewhat trial-and-error as in the examples above Possibly ndash however experienced analysts do apply some common sense in speculating which drivers to consider But in a complex world even experienced analysts need some assistance to shorten their investigation time and help them quickly focus on what matters most
In reality the number of single customer behaviors or traits that is ldquomost explanatoryrdquo is not limitless It is restricted by the amount of data a supplier has about each of its customers But with the massive amount of customer information in storage the list of driver choices could be fairly extensive
So what driver should the supplierrsquos analysts test next Selecting the first few traits may be relatively easy ndash as with the residential location and age However as in our example assume that the correlation values are low Then do you test other traits that are less obvious and may be more challenging to hypothesize What should the analysts do to reduce the time and effort of this investigation This research should not be like looking for the single needle in a haystack or the single diamond in a coal mine
Letrsquos Try a Different Approach
At this point it is clear that customer profitability reporting is not the same thing as customer profitability analysis What is needed is an approach that will crystallize insights gained from customer profitability reporting ndash and generate meaningful insight into which characteristics and behaviors of customers and products separate the relatively more- and less-profitable customers
Analyzing large-scale customer-profitability models is the sort of challenge ideally suited to SASreg softwarersquos advanced data mining and analytical capabilities These techniques allow a business analyst to increase the value of the model by
bull Simplifyingcomplexityandidentifyingwhatismostimportantforthebusinesstofocus on
bull Discoveringhiddenpatternsthatcrossarbitrarycustomersegmentboundaries
bull Allowingthebusinesstopredicthowprofitableacustomerislikelytobenowandin the future
Applying data mining and analytics to cost and profitability reporting will enable the business analyst to answer the ldquoso whatrdquo question Performance management methodology modeling can solve the ldquothen whatrdquo question
10
Increase Customer Profitability Using Data Mining and Advanced Analytics
The next section shows how data mining solved that earlier problem of finding which drivers were critical ones in our model
Applying the Computing Power of Data Mining and Advanced Analytics
Letrsquos discard the hypothetical supplier analystsrsquo quest and get more directly to the point By combining data mining and advanced analytics (in this case a statistical technique called a decision tree) with todayrsquos enormous computing power and its access to massive amounts of stored data about customers one can gain tremendous insight Decision trees are a simple but powerful form of multiple variable analysis Produced by algorithms that split data into branch-like partitions decision trees are developed and presented incrementally as a collection of one-cause one-effect relationships calculated in a recursive form The appeal of decision trees lies in their relative power ease of use robustness with a variety of data types and ease with which they can be understood by non-experts
Figure 4 displays the initial ldquobranchingrdquo of the most statistically significant explanatory differentiating driver For this particular supplierrsquos 22161 customersrsquo profit rank ordered for 2010 the correlation analysis calculated ldquoaverage transaction quantityrdquo as the most explanatory driver
Figure 4 Decision tree - the average transaction quantity
Increase Customer Profitability Using Data Mining and Advanced Analytics
11
The figure displays other potentially useful information
bull Itcalculatesthat53istheaveragetransactionquantitythatdividesthemore-and less-profitable customers into two subsets of the whole population of 22161 customers
bull Itcalculatesthat6551customersaretheldquolessprofitablerdquo(withtheirownaveragetransaction quantity of 108) ndash and that 15610 customers are in the ldquomore profitablerdquo subset (with their own average transaction quantity of 707)
bull Itcalculatesthat1469isthedividingamountwithcustomersabovethatnumberbeing x and those below it being y
OK So what
Where Does the Analyst Go from Here
Based on the initial partition the marketing and sales functions can begin to brainstorm how to alter the behavior of customers in the ldquoless profitablerdquo segment so that they move in the direction of customers in the ldquomore profitablerdquo segment For example the supplier could provide customers with a menu of service-level prices to encourage them to increase or decrease transaction quantities with offered price levels derived from the ABC information by assuring that an incremental change in price (up or down) will always exceed the incremental change in cost to deliver that service level This way the supplier gains a higher profit by altering the behavior of the customer to select a service-level offer in either direction
But while that brainstorming is occurring the analysts can delve deeper After the average transaction quantity is revealed as the most prominent factor each ldquomoreless profitablerdquo segment will be recursively partitioned Following one branch of the decision tree down Figure 5 reveals that the factor that most differentiates the ldquomore profitablerdquo customers is ldquo cashrdquo and subsequently further down the tree a third critical factor ndash ldquodays with a negative balancerdquo ndash applies
At this point an uncomfortable fact is uncovered Within the ldquohigh average transaction quantity customersrdquo there exists a distinct microsegment who use a lot of cash and frequently run overdrafts Consequently they are the least-profitable customers Now the marketing and sales functions can focus on this particular microsegment and brainstorm ideas to change this customer segmentrsquos behavior or their commercial terms and move them toward profitability Figure 5 displays the expanding the decision tree diagram
12
Increase Customer Profitability Using Data Mining and Advanced Analytics
Figure 5 Three-level tree diagram
You get the idea Why speculate when the computer can do the heavy lifting
And Therersquos More hellip
Does this mean that the analystsrsquo work is done By no means This is just one technique that can be applied to a model to solve one particular question What are the typical behaviors that distinguish our most and least profitable customers Advanced data mining and analytical techniques give the business analyst both the time and capability to gain ever more insight into their customers The analyst plays a critical role in this process defining the business problem understanding how it can be answered (and therefore which analytical technique to use) and finally how to structure the analysis3 This enables a business to tackle a range of other issues that include using analytics to
bull Betterunderstandtheimplicationofnonrecurringevents
bull Understandthenatureofprocessfailure
bull Predictwhichprospectsarelikelytobemostprofitable
bull Understandcustomerlifetimevalue
bull Developcustomerstrategybasedonprofitablebehaviors
3 Appendix 1 The Importance of Ratios
Increase Customer Profitability Using Data Mining and Advanced Analytics
13
Using analytics to better understand the implication of occasional (intermittent) events4
When customer segments are disaggregated down to an individual level one may encounter occasional (ie intermittent) activities associated with a customer (what we might call ldquoriskrdquo incidents) that are unlikely to reoccur on a regular basis but still have a dramatic impact on the potential profitability of that customer An example of this is a customer moving to a new home which is a significant expense for an energy company but one that probably does not happen frequently for the majority of customers For a correct appreciation of the profitability of a customer one needs to not just understand what it costs to process this incident but also the likely probability of it occurring in any given period
Using analytics to understand the nature of process failure5
Any ABM model makes the immediate costs of failure in internal processes extremely visible But in addition to the direct impact of the cost of recovery activities there may be secondary impacts that are less visible in an ABM model These can still be identified and the implications can be quantified These secondary impacts can materialize in a number of ways over time including increased cancellation rates selection of more costly but less risky business channels reduced reorder frequencies and volumes and elevated customer churn rates
Predicting which prospects are likely to be most profitable6
Once an existing customerrsquos behavior is known it becomes relatively easy to predict whether that customer is likely to be profitable even without a detailed profit model Of course the potential behavior of prospective customers is an unknown ndash but it is not necessarily unpredictable An analysis linking customer profitability to geo-demographic characteristics allows an analyst to identify prospects with certain determining characteristics We can theorize that these customers are likely to behave in a similar fashion to similar existing customers and become similarly profitable
4 Appendix 2 Risk Incidents Accounting for Occasional Events in Profitability Analyses5 Appendix 3 Risk Incidents Better Understanding the Impact of Process Failures6 Appendix 4 Profitable Customer Acquisition
14
Increase Customer Profitability Using Data Mining and Advanced Analytics
Using analytics to understand customer lifetime value7
One of the significant insights discovered early when customer profitability models are data mined is that customer profitability does not tend to follow a nice smooth incremental path Instead it tends to cluster around customers at different life stages and steps of their relationship with a business To provide a real picture of the potential long-term value of a customer ndash showing the customerrsquos longevity and their likely future ndash analytics incorporates the possibility of significant life-stage changes
Using analytics to develop customer strategy based on profitable behaviors8
Where ABM has been applied to strategy it has typically been focused on structural issues such as how to organize departments to achieve economies of scale or what markets to continue pursuing But for a marketer thinking about customer strategy customer profitability and behavioral analysis should be foundation stones This calls on two aspects previously discussed ndash the characteristics of profitable customers and where a business can find more customers like them However strategy will tend to focus less on the small and unusual customers and more on large groups of customers with similar characteristics
Conclusion
All things considered why speculate and guess at the rank-ordered drivers that differentiate between relatively more- and less-profitable customers Why not apply computer power to do the heavy lifting An additional message is to not perform the analysis as a one-time study but to produce the information at frequent time intervals as a permanent repeatable and reliable production information system
It is true that experienced analysts typically suspect and hypothesize that two or more things are related or that some underlying behavior is driving behavior seen in the data They then search for confirmation and understanding of the relationships In other words the application of analytics is usually more confirmatory than exploratory It is not like finding diamonds in a coal mine One does not simply flog the data until it confesses However in the case of attempting to identify the differentiating traits between more- and less-profitable customers the major traits may not be intuitively obvious to an analyst
The goal is to accelerate the identification of the differentiating drivers so that actions ndash interventions ndash can be considered as a way to get high-payback profit lift from customers The analysts using ABM have benefited from applying online analytical processing (OLAP) multidimension cubes to slice-and-dice data Even greater benefits and better decisions can come from applying data mining and advanced analytics
7 Appendix 5 Customer Equity Analysis
8 Appendix 6 Customer Strategy
Increase Customer Profitability Using Data Mining and Advanced Analytics
15
APPENDIX 1
The Importance of Ratios
One of the critical first steps when analyzing an ABC model is to understand the data and how it needs to be transformed to correctly answer your questions The biggest issue we face is the impact of volume effects (the amount a customer buys) on our analysis and how they can override any other potentially more important analyses This is why one of the first actions often taken is to ldquonormalize the datardquo through the derivation of key ratios that remove the size effects and allow deeper insights to be surfaced
To illustrate this we will use the case of a wholesale business that has some large and some small customers with varying return rates We could consider four customers ndash two large (A and B) and two small (C and D) ndash with two of the customers having high return rates (A and C) and two of the customers having low return rates (B and D) See the table for an illustration
If we then plot this data on two charts one showing net total contribution versus number of returns and the other showing percent of contribution versus percent of return rates we see a dramatically different picture The volume effect overwhelms the return rate effect in the first graph where we plot absolute values giving a potentially misleading message that the number of returns has a positive correlation to profit In the key ratios analysis with the size effects removed the rate of returns can be correctly seen to have a negative impact on profitability
16
Increase Customer Profitability Using Data Mining and Advanced Analytics
Indeed the beloved whale curve diagram (more properly called the profit margin cliff curve) has a tendency to provide a relatively false picture of profitability Because it orders customers on the basis of absolute profit it tends to group all the small customers in the center and place large customers at each end This over-emphasizes these few significant but anomalous customers and leads us to miss potentially critical trends and patterns that can be found in the population at large and which can have a
dramatic impact on profitability
By sizing and ordering our customers based on revenue and by showing profit versus revenue we can transform a relatively benign-looking whale curve into a much more dramatic hook curve As shown below we can now see that we have a whole set of customers who are in fact more profitable than our largest customer even though they generate the most absolute profit And similarly we have a host of customers who are significantly less profitable than our customer who generates the greatest loss It is also quite clear that clearing out our unprofitable customers will not have a dramatic impact on our top line so we will feel free to attack them without worrying too much about the impact on the share price
Increase Customer Profitability Using Data Mining and Advanced Analytics
17
APPENDIX 2
Risk Incidents Accounting for Occasional Events in Profitability Analyses
One of the unfortunate side effects of the periodic nature of an ABC model is that it captures occasional events against a customer in the period that they happen then registers the impact on profitability in that period but provides us with little information about whether that event is likely to recur frequently or infrequently
Examples include things as varied as home moves for energy companies insurance claims warranty claims issuing of new credit cards or mobile handset renewals
When designing our data exploration model we need to adopt a different strategy for these sorts of costs Specifically we need to replace the occasional event or behavior with a marker indicating the probability of the event occurring Typically this would be a direct calculation of the probability of the event occurring for each customer in the period This may be calculated using a number of techniques including logistic regressions neural networks or a decision tree
18
Increase Customer Profitability Using Data Mining and Advanced Analytics
Alternatively we may find a proxy indicator for the risk of the occasional event These are typically geo-demographic indicators but they could also include products (for example car model affecting the probability of a warranty claim) or channel (returns are more likely for mail order than store-purchased products)
Exact choice of approach depends very much upon
bull Theneedsoftheanalysis
bull Theavailabilityofdata
bull Thetoolsavailable
APPENDIX 3
Risk Incidents Better Understanding the Impact of Process Failures
One class of occasional events often has to do with process failures One of the huge benefits of an ABM model is that it makes the true costs of such failures extremely visible But in addition to making the cost visible analytics also gives us the ability to better understand the impact of such failures from the likelihood of them occurring to the long-term impact on customer retention
One example of this occurred at a classified advertising company where a segment of customers were identified who had many advertisement amendment costs but also unusually low revenue due to cancellations
Increase Customer Profitability Using Data Mining and Advanced Analytics
19
Beyond the initial identification of this unusual set of behaviors a technique called survival analysis was applied to the problem This clearly revealed that there was a critical turning point in the customersrsquo relationship with the business at which point they became frustrated enough to cancel their advertisement (See the diagram for more information) With this insight we knew when to set a warning marker on transactions allowing us to review them and determine if a recovery effort was worth engaging in
APPENDIX 4
Profitable Customer Acquisition
While much of this paper has been focused on how we identify which behaviors customers exhibit that make them profitable or not it is not possible to understand how a prospect will behave if we acquire them and therefore whether they are likely to be worth the effort Much work has gone on in sophisticated companies to review expected sales revenues for different demographics But these analyses can be improved even further by moving from analyzing and segmenting based on expected revenue to applying the additional insight available from a customer profitability model This type of model not only has the potential to tell a company what level of profit they may expect from a particular prospect segment but it can also show
bull Howthatgroupislikelytobehave
bull Theproductmixtheymayprefer
bull Thechannelstheymayprefertopurchasethrough
bull Theirtypicalordersizes
bull Whethertheyarelikelytohavepaymentproblemswhichwouldcausepotential impact on the companyrsquos resources (call centers order processing warehouses etc)
20
Increase Customer Profitability Using Data Mining and Advanced Analytics
To achieve this analysis a decision tree is often the most useful tool But rather than applying behaviors to segment the customers we apply demographic indicators ndash and once a segment is identified we overlay that initial analysis with a behavioral analysis
APPENDIX 5
Customer Equity Analysis
The final stage in this process is to move to some form of lifetime value analysis Much of the literature assumes that customers advance on an incremental basis gradually growing over time to buy more and newer products right up to the point at which they leave
However with the much greater depth of knowledge we have on customer behaviors and which ones are significant one of the clear findings is that customers are not generally incremental in nature Instead they tend to be relatively static until they go through some form of state change transformation (such as leaving school getting married or losing a job) With our ability to identify how customers typically behave in each of these states and the propensity of them to move between states we can develop a more realistic approach That approach would be to not look at individual customer lifetime value but to look at the potential value of a particular segment ndash including how it will change over time as new customers are acquired through transfer or acquisition and how they are lost either through transfer or churn The diagram below shows this more realistic model of customer equity analysis
Increase Customer Profitability Using Data Mining and Advanced Analytics
21
APPENDIX 6
Customer Strategy
Where ABM has been applied to strategy it has typically been focused on structural issues how to organize departments to achieve economies of scale and what markets to continue pursuing But for a marketer thinking about their customer strategy customer profitability and behavioral analysis should be foundation stones However this need differs from that of the person looking to identify and understand the sorts of unusual customers who are identified by a decision tree
To understand customers itrsquos important to understand a broad sweep of customer behaviors and to identify large segments of customers with similar patterns of behavior for which they need to develop a strategy For this purpose a technique called cluster analysis becomes invaluable In cluster analysis all business drivers are considered equally important for the segmentation This is unlike a decision tree where there is a clear target variable (typically profitability) and explanatory variables (the key ratios) In cluster analysis all variables are tested and the significant ones that indicate customers with similar patterns of behavior (including things like profitability) are identified and used to segment the customers
With the members of each cluster identified other information can be overlaid on the analysis to deepen the picture and appropriate strategies can be developed In the case of a technology wholesaler six clusters were identified of this four represented the core of the business for which strategies were deployed
22
Increase Customer Profitability Using Data Mining and Advanced Analytics
The first group (PG) was happy to pay for a relatively high service level and consequently was very profitable so a strategy of ldquocuddlerdquo was developed The UNeg group was very similar to the PG group in many ways but a significant portion of their purchase mix involved redundant technology that was sold at a loss but should probably never have still been in stock The strategy here was to ldquocurerdquo this stock management problem and return these customers to profit The core of the business came from those in the PNorm group low-effort customers with an OK margin who we needed to ldquokeeprdquo as customers Finally there was a class of customers called UNorm who asked for the earth but did not want to pay and for those an active ldquocullrdquo strategy was developed Under this strategy they were offered terms that would make them profitable if accepted ndash but if the terms were rejected the wholesaler would no longer supply them
Increase Customer Profitability Using Data Mining and Advanced Analytics
23
About SAS
SAS is the leader in business analytics software and services and the largest independent vendor in the business intelligence market Through innovative solutions delivered within an integrated framework SAS helps customers at more than 50000 sites improve performance and deliver value by making better decisions faster Since 1976SAShasbeengivingcustomersaroundtheworldTHEPOWERTOKNOWreg
SAS Institute Inc World Headquarters +1 919 677 8000To contact your local SAS office please visit wwwsascomoffices
SAS and all other SAS Institute Inc product or service names are registered trademarks or trademarks of SAS Institute Inc in the USA and other countries reg indicates USA registration Other brand and product names are trademarks of their respective companies Copyright copy 2011 SAS Institute Inc All rights reserved 105300_649310811
- Executive Summary
- Three Key Trends Affecting ABM
-
- The Suppliersrsquo Shift from Product-Centric to Customer-Centric
- The Availability of Detailed Data
- Declining Emphasis on Process and Productivity Improvement as a Way to Improve the Bottom Line
- Whither ABM
-
- What So What Then What
-
- From Seeing Costs to Understanding Them
- What Differentiates More-Profitable From Less-Profitable Customers
- How Can a Supplier Determine Differentiating Drivers of Its Profits from Customers
- The Explanatory Investigation Continues hellip and Continues
- Letrsquos Try a Different Approach
- Applying the Computing Power of Data Mining and Advanced Analytics
- Where Does the Analyst Go from Here
- And Therersquos Morehellip
-
- Conclusion
- APPENDIX 1
-
- The Importance of Ratios
-
- APPENDIX 2
-
- Risk Incidents Accounting for Occasional Events in Profitability Analyses
-
- APPENDIX 3
-
- Risk Incidents Better Understanding the Impact of Process Failures
-
- APPENDIX 4
-
- Profitable Customer Acquisition
-
- APPENDIX 5
-
- Customer Equity Analysis
-
- APPENDIX 6
-
- Customer Strategy
-
- About SAS
-
Increase Customer Profitability Using Data Mining and Advanced Analytics
ii
This white paper was written by Gary Cokins and Charles Randall Gary Cokins is an internationally recognized expert speaker and author on the subject of advanced cost management and performance management systems He is a Principal in Global Business Advisory Services with SAS a leading provider of business intelligence and analytic software headquartered in Cary NC Cokins received a BS in industrial engineeringoperations research from Cornell University and an MBA from Northwestern Universityrsquos Kellogg School of Management Cokins began his career at FMC Corporation and he also served as a management consultant with Deloitte KPMG Peat Marwick and Electronic Data Systems (EDS) His latest book is Performance Management Integrating Strategy Execution Methodologies Risk and Analytics He can be reached at garycokinssascom Charles Randall has built his career in strategy and marketing analytics Randallrsquos career encompassed both telecommunications and management consultancy before joining SAS as a Principal Business Consultant In his current role as Solutions Marketing Manager he draws from 15 years of experience in these fields to share deep expertise and insight in numerous articles and papers Randall received a BSc in economics and a PhD in econometrics from the University of Wales His latest research study is titled Pleased to Meet You How Different Customers Prefer Very Different Channels The study is a joint project with Professor Hugh Wilson of Cranfield School of Management Randall can be reached at charlesrandallsuksascom
Increase Customer Profitability Using Data Mining and Advanced Analytics
Executive Summary
There is a trend for customers to increasingly view suppliersrsquo products and standard service lines as commodities As a result what customers now seek from suppliers are special services ideas innovation and thought leadership Many suppliers have actively shifted their sales and marketing functions from product-centric to customer-centric through the use of data mining and business intelligence1 tools to understand their customersrsquo behavior ndash their preferences purchasing habits and customer affinity groups In some companies the accounting function has supported this shift by reporting customer profitability information (including product gross profit margins) using activity-based costing (ABC) principles However is this enough
It is progressive for the accounting function to provide marketing and sales with reliable and accurate visibility of which customers are more and less profitable Often sales and marketing people are surprised to discover that due to special services their largest customers in sales are not their most profitable ones and that a larger subset of customers than believed are only marginally profitable ndash or worse yet unprofitable But a ranking of profit from each customer does not provide all the information as to why That is where data mining and analytical techniques can help
The use of ABC data leads to activity-based management (ABM) There are some low-hanging fruit insights from ABC data For example one can see relative magnitudes of activity costs consumed among customers There is also visibility into the quantity of activity drivers ndash such as the number of deliveries ndash that cause activity costs to be high or low But this does not provide sufficient insight to differentiate relatively highly profitable customers from lower-profit or unprofitable customers
One can speculate what the differentiating characteristics or traits might be such as sales magnitude or location but hypothesizing (although an important analytics practice) can be time-consuming It is like finding a diamond in a coal mine One cannot flog the data until it confesses In attempting to identify the differentiating traits between more and less profitable customers the major traits may not be intuitively obvious to an analyst A more progressive technique is to use data mining and advanced statistical analytics techniques
This paper describes in particular the use of segmentation analysis based on decision trees and recursive partitioning These techniques can give the sales and marketing functions insights into what actions deals services unbundled pricing and other decisions can elicit profit lift from customers
1 Data mining is the process of extracting patterns from large amounts of stored data by combining methods from statistics and database management systems It is seen as an increasingly important tool for transforming unprecedented quantities of digital data into meaningful information (nicknamed ldquobusiness intelligencerdquo) to give organizations an informational advantage It is used in a wide range of profiling practices such as marketing surveillance fraud detection and scientific discovery
1
Business users of activity-based
costing information gain valuable
insights as to which products
service lines channels and
customers are relatively more
or less profitable They also see
why ndash by observing the visibility
and transparency of the internal
process and activity costs that
yield each customerrsquos contribution
profit margin layers But the pricing
marketing and sales functions often
struggle with determining which
actions to take to create increasing
profit lift for customers This paper
describes analytical techniques
that can identify which drivers best
explain the differences between
high-profit and low-profit (or
negative-profit) customers Knowing
these drivers can lead to the most
profit-lifting actions
Increase Customer Profitability Using Data Mining and Advanced Analytics
The goal is to accelerate the identification of the differentiating drivers so that actions ndash or interventions ndash can be made to achieve that high-payback profit lift from customers Analysts using ABM have benefited from applying online analytical processing (OLAP) multidimensional cubes to slice and dice data Even greater benefits and better decisions can come from applying data mining and advanced analytics
Three Key Trends Affecting ABM
Activity-based management involves calculating how expenses (eg salaries or supplies) are converted into the costs of work activities that in turn are traced into the costs of outputs such as products services channels and customers The calculation method is activity-based costing and it is done with modeling ABM then exploits the ABC information for insights analysis and decisions
The three current trends affecting ABM are
bull Theshiftinattentionfromproduct-centrictocustomer-centriccosts
bull Theexplosionofavailabledata
bull Diminishingreturnsfromprocessandproductivityimprovements
The Suppliersrsquo Shift from Product-Centric to Customer-Centric
Before diving deep into the role that data mining and analytics can play when combined with managerial accounting letrsquos first get some context to help us better appreciate the problem suppliers face in increasing profitability from various customers
A primary reason that companies are increasingly calculating and measuring customer profitability is because of a shift in the sales marketing and operations functions from being product-centric to being customer-centric This shift results from customers increasingly viewing all suppliersrsquo products and standard service lines as commodities (ie having little differentiation) In response to this trend suppliers are shifting their attention toward differentiating services for different types of customers That is rather than mass selling giving the sales force incentives to ldquopushrdquo products suppliers are working backward by starting with their customers and tailoring unique offers and deals based on the distinctive preferences and tastes of customer microsegments (and even individual consumers at the extreme)
But what deal discount special service etc should potentially be offered to which type of customer in order to get the maximum profit lift
2
Increase Customer Profitability Using Data Mining and Advanced Analytics
Answering that question is a challenge Customers should be viewed as investments rather than as something a supplier spends money to serve With this ldquocustomers as investments in a portfoliordquo view the challenge becomes determining which deals offers special services etc will maximize the return on investment (ROI) for each customer microsegment (and potentially for each individual customer) That is how do we determine which actions will yield the largest financial profit lift ndash and from which individual customers
The Availability of Detailed Data
The progression toward transactional ABC models has been fostered by the availability of systematic processes technologies and customer data now that most major organizations have introduced enterprise resource planning (ERP) and customer relationship management (CRM) systems This has meant that it is more practical to define work activities at a more detailed level and provide direct cost driver data to support translating the activity costs into outputs This has inevitably led to an increase in the number and sophistication of work activities and activity cost drivers in the model presenting even more candidates to investigate to understand what is and is not important
Historically it was very difficult to build models of a scale that could produce individual customer profitability models so models tended to stop at a segment level (eg all customers from a given standard industry code geographic area or other arbitrary category) We have tended to rely on the traditional rather than arbitrary groupings used within a business and this potentially disguises important information on trends that cross customer segment boundaries Todayrsquos software computing power particularly transactional costing for individual customers removes that restriction
However when more product variations than ever before are factored in including more distribution channels the complexity of costing models is beyond the level at which basic reporting or even OLAP can be applied to find the most important insights
Declining Emphasis on Process and Productivity Improvement as a Way to Improve the Bottom Line
In the early days activity-based cost management (ABCM) was very much focused on process improvement and could be seen as part of the whole BPRSix SigmaTQM movement After 25 years of these improvement initiatives it is probably fair to assume that most companies have reasonably efficient processes While there may still be productivity gains to be made in this area they are unlikely to be substantial
3
Increase Customer Profitability Using Data Mining and Advanced Analytics
In other words ABCM literature has largely focused on the internal efficiency of business processes as a whole It has yet to really address how processes relate to individual customers and how their varying applications affect profitability Yet this is where we are now more likely to find the opportunity for dramatic gains in profitability of the firm
Whither ABM
With these points in mind a strong business case can be made that the major benefit from applying the principles of activity-based costing is not just from product profitability reporting but also from the more encompassing customer profitability reporting The latter profitability reporting is inclusive of product and standard service-line costs and it also includes the ldquobelow the gross profit margin line expensesrdquo such as distribution channel customer service selling and marketing-related expenses These nonproduct and nonstandard service-line expenses are commonly called costs-to-serve ABC (combined with direct costing) solves the problem of not reliably knowing which products or service lines make or lose profits or which customers are more or less profitable ndash and by how much ABC also measures the cost elements for each customer that yield the level of profit
But as with many other fields solving one problem creates a new problem In the case of ABC the new problem for a company is to understand what actions to take to improve profit generation from customers
What So What Then What
The three trends affecting ABM reveal moving beyond just knowing what outputs cost to understanding the relevance of what causes those costs (so what) ndash and then investigating testing and validating what the financial consequence (then what) will be from decisions based on insights gleaned from the ABC information This is also a good reason for the ABC reporting to be a permanent repeatable and reliable production reporting system This is in contrast to its use as only a one-time study or project to learn an answer and be done Effective ABM creates benefits through frequent short-interval refreshing of the ABC data to monitor progress and see emerging insights for further investigations
4
Increase Customer Profitability Using Data Mining and Advanced Analytics
From Seeing Costs to Understanding Them
Companies that have successfully implemented ABC and can successfully report customer profitability as a permanent and repeatable production system deserve to congratulate themselves and celebrate They have provided better visibility transparency and accuracy for reporting profit margin contribution layers of their customers With this information the pricing sales and marketing functions can see things they previously could only speculate or guess about And much of what they might see may not be pretty or may come as a surprise For example they may realize that their highest-sales-volume customer may not be a very profitable customer due to the substantial extra services that customer requires and associated high-maintenance behavior Under certain conditions some customers may be outright unprofitable But the celebration of this robust reporting should be temporary There is much more to do to increase the customersrsquo profitability to the company
With customer profitability reporting companies can gain insights of all kinds But there is eventually a limit As mentioned before in the grand scheme of decision making good ABC information reporting only answers the first of three critical questions ldquoWhatrdquo That is what do things cost What products service lines channels and customers are more or less profitable But that is only reporting More is needed to increase profits
Analysis and decision making requires answers to two more questions ldquoSo whatrdquo and ldquoThen whatrdquo The ldquoso whatrdquo question begs to know what about the profit margin information is relevant and could be acted upon The ldquothen whatrdquo question begs to know ndash to validate ndash if an action is taken what will be the likely financial effect
What Differentiates More-Profitable From Less-Profitable Customers
Figure 1 displays a popular profit contribution-ranked deciles histogram that groups customers by measuring and viewing them The source of the data is the profit generated by ABC for each customer
5
Increase Customer Profitability Using Data Mining and Advanced Analytics
Figure 1 Customer profit contribution deciles
Profitability reports like that in Figure 1 are often shocking and disturbing to executives and managers when they are seen for the first time This is because the reports reveal their misconceptions ndash that there are substantially higher financial profit and greater losses in certain customers than they suspected (ABC reporting overcomes these misconceptions by replacing accuracy-suppressing cost allocations that use broadly averaged overhead expense allocation factors with cause-and-effect cost-driver tracing assignments)
To answer the ldquoso whatrdquo question related to determining how to increase a customersrsquo profitability a supplier could look at its customer profit contribution-ranked histogram decile diagram (as in Figure 1) and ask this question ldquoExcluding the obvious profit effect from sales volume what one characteristic trait behavior or transaction of a customer differentiates highly profitable customers from the restrdquo That is what is the most
prominent and explanatory driver among all those that are possible
There are challenges to answering this question How should the analysts determine
what and where to investigate Is it with guesswork luck speculation
This is where data mining statistics and analytics play a role to reveal what dominant and secondary drivers explain the differentiation between high- and low-profit customers What most drives profitability across an organization If this were known could pricing
marketing and sales actions be more focused and yield greater certainty
6
Increase Customer Profitability Using Data Mining and Advanced Analytics
7
How Can a Supplier Determine Differentiating Drivers of Its Profits from Customers
Letrsquos start simple Imagine the supplierrsquos business analysts speculate that the residential location of a customer may be a major driver explaining the differentiation between high- and low-profit customers ndash the first and last profit contribution decile in Figure 1rsquos histogram Since the analysts have access to both of these data items (ie profit and home address) a correlation2 (ie the explanatory value level) can be measured
With a very simple examination of just the most and least profitable (10 percent) customer histogram deciles the correlation measure may confirm the analystsrsquo hypotheses that the most profitable customers live in affluent neighborhoods and the unprofitable customers reside in low-income neighborhoods There is however a remaining question ndash how strongly do these newfound facts support the conclusion If the correlation is extremely high then potential ldquoso whatrdquo actions ndash like knowing where to advertise and where not to ndash become obvious But letrsquos imagine that in this case the correlation measure is relatively low ndash meaning that residential location does not strongly support the analystsrsquo hypothesis
What next Which other driver might explain the customer profit differentiation
The Explanatory Investigation Continues hellip and Continues
Imagine the supplierrsquos analysts next speculate that it is the customerrsquos age not their residential location that may be a major explanatory driver differentiating high-profit from low-profit customers Again both data records for all customers are accessible (ie profit age) The correlation is again measured A possible outcome might reveal that older customers (eg senior citizens) are much more profitable and younger customers (eg teenagers) are much less profitable
However the outcome could have been the reverse with young people (eg spendthrifts) being most profitable and older people (eg frugal) not But similar to the residential location hypothesis letrsquos imagine that the strength of the correlation measure is again low ndash meaning there is not clear evidence that age is a differentiating driver
How about the product mixes that customers purchase Figure 2 displays what the analyst could see However imagine again that the correlation score does not demonstrate sufficient evidence that this is a differentiating driver
2 In statistics dependence refers to any statistical relationship between two random variables or two sets of data Correlation refers to any of a broad class of statistical relationships involving dependence
Familiar examples of dependent phenomena include the correlation between the physical statures of parents and their offspring and the correlation between the demand for a product and its price Correlations are useful because they can indicate a predictive relationship that can be exploited in practice For example an electrical utility may produce less power on a mild day based on the correlation between electricity demand and weather In this example there is a causal relationship because extreme weather causes people to use more electricity for heating or cooling however statistical dependence is not sufficient to demonstrate the presence of such a causal relationship
8
Increase Customer Profitability Using Data Mining and Advanced Analytics
Figure 2 Product mix deciles
How about the region of the country the customer lives in rather than the type of neighborhood within a metropolitan area as the analyst first speculated Figure 3 displays this view But again letrsquos imagine that this driver does not provide clear or sufficient evidence
Figure 3 Region decile
Increase Customer Profitability Using Data Mining and Advanced Analytics
9
Where do the analysts go next What other driver or trait could they test That is what other customer driver or trait could the supplierrsquos analysts consider as the high versus low customer-profit-level differentiator Customer weight Hair color Type of credit card Number of brothers and sisters Sibling age rank (eg oldest youngest) Model year of their car Car manufacturer and model Which traits can you think of
The point here is that the possibilities appear to be unlimited especially if you have a big imagination Does the pursuit need to continue to be somewhat trial-and-error as in the examples above Possibly ndash however experienced analysts do apply some common sense in speculating which drivers to consider But in a complex world even experienced analysts need some assistance to shorten their investigation time and help them quickly focus on what matters most
In reality the number of single customer behaviors or traits that is ldquomost explanatoryrdquo is not limitless It is restricted by the amount of data a supplier has about each of its customers But with the massive amount of customer information in storage the list of driver choices could be fairly extensive
So what driver should the supplierrsquos analysts test next Selecting the first few traits may be relatively easy ndash as with the residential location and age However as in our example assume that the correlation values are low Then do you test other traits that are less obvious and may be more challenging to hypothesize What should the analysts do to reduce the time and effort of this investigation This research should not be like looking for the single needle in a haystack or the single diamond in a coal mine
Letrsquos Try a Different Approach
At this point it is clear that customer profitability reporting is not the same thing as customer profitability analysis What is needed is an approach that will crystallize insights gained from customer profitability reporting ndash and generate meaningful insight into which characteristics and behaviors of customers and products separate the relatively more- and less-profitable customers
Analyzing large-scale customer-profitability models is the sort of challenge ideally suited to SASreg softwarersquos advanced data mining and analytical capabilities These techniques allow a business analyst to increase the value of the model by
bull Simplifyingcomplexityandidentifyingwhatismostimportantforthebusinesstofocus on
bull Discoveringhiddenpatternsthatcrossarbitrarycustomersegmentboundaries
bull Allowingthebusinesstopredicthowprofitableacustomerislikelytobenowandin the future
Applying data mining and analytics to cost and profitability reporting will enable the business analyst to answer the ldquoso whatrdquo question Performance management methodology modeling can solve the ldquothen whatrdquo question
10
Increase Customer Profitability Using Data Mining and Advanced Analytics
The next section shows how data mining solved that earlier problem of finding which drivers were critical ones in our model
Applying the Computing Power of Data Mining and Advanced Analytics
Letrsquos discard the hypothetical supplier analystsrsquo quest and get more directly to the point By combining data mining and advanced analytics (in this case a statistical technique called a decision tree) with todayrsquos enormous computing power and its access to massive amounts of stored data about customers one can gain tremendous insight Decision trees are a simple but powerful form of multiple variable analysis Produced by algorithms that split data into branch-like partitions decision trees are developed and presented incrementally as a collection of one-cause one-effect relationships calculated in a recursive form The appeal of decision trees lies in their relative power ease of use robustness with a variety of data types and ease with which they can be understood by non-experts
Figure 4 displays the initial ldquobranchingrdquo of the most statistically significant explanatory differentiating driver For this particular supplierrsquos 22161 customersrsquo profit rank ordered for 2010 the correlation analysis calculated ldquoaverage transaction quantityrdquo as the most explanatory driver
Figure 4 Decision tree - the average transaction quantity
Increase Customer Profitability Using Data Mining and Advanced Analytics
11
The figure displays other potentially useful information
bull Itcalculatesthat53istheaveragetransactionquantitythatdividesthemore-and less-profitable customers into two subsets of the whole population of 22161 customers
bull Itcalculatesthat6551customersaretheldquolessprofitablerdquo(withtheirownaveragetransaction quantity of 108) ndash and that 15610 customers are in the ldquomore profitablerdquo subset (with their own average transaction quantity of 707)
bull Itcalculatesthat1469isthedividingamountwithcustomersabovethatnumberbeing x and those below it being y
OK So what
Where Does the Analyst Go from Here
Based on the initial partition the marketing and sales functions can begin to brainstorm how to alter the behavior of customers in the ldquoless profitablerdquo segment so that they move in the direction of customers in the ldquomore profitablerdquo segment For example the supplier could provide customers with a menu of service-level prices to encourage them to increase or decrease transaction quantities with offered price levels derived from the ABC information by assuring that an incremental change in price (up or down) will always exceed the incremental change in cost to deliver that service level This way the supplier gains a higher profit by altering the behavior of the customer to select a service-level offer in either direction
But while that brainstorming is occurring the analysts can delve deeper After the average transaction quantity is revealed as the most prominent factor each ldquomoreless profitablerdquo segment will be recursively partitioned Following one branch of the decision tree down Figure 5 reveals that the factor that most differentiates the ldquomore profitablerdquo customers is ldquo cashrdquo and subsequently further down the tree a third critical factor ndash ldquodays with a negative balancerdquo ndash applies
At this point an uncomfortable fact is uncovered Within the ldquohigh average transaction quantity customersrdquo there exists a distinct microsegment who use a lot of cash and frequently run overdrafts Consequently they are the least-profitable customers Now the marketing and sales functions can focus on this particular microsegment and brainstorm ideas to change this customer segmentrsquos behavior or their commercial terms and move them toward profitability Figure 5 displays the expanding the decision tree diagram
12
Increase Customer Profitability Using Data Mining and Advanced Analytics
Figure 5 Three-level tree diagram
You get the idea Why speculate when the computer can do the heavy lifting
And Therersquos More hellip
Does this mean that the analystsrsquo work is done By no means This is just one technique that can be applied to a model to solve one particular question What are the typical behaviors that distinguish our most and least profitable customers Advanced data mining and analytical techniques give the business analyst both the time and capability to gain ever more insight into their customers The analyst plays a critical role in this process defining the business problem understanding how it can be answered (and therefore which analytical technique to use) and finally how to structure the analysis3 This enables a business to tackle a range of other issues that include using analytics to
bull Betterunderstandtheimplicationofnonrecurringevents
bull Understandthenatureofprocessfailure
bull Predictwhichprospectsarelikelytobemostprofitable
bull Understandcustomerlifetimevalue
bull Developcustomerstrategybasedonprofitablebehaviors
3 Appendix 1 The Importance of Ratios
Increase Customer Profitability Using Data Mining and Advanced Analytics
13
Using analytics to better understand the implication of occasional (intermittent) events4
When customer segments are disaggregated down to an individual level one may encounter occasional (ie intermittent) activities associated with a customer (what we might call ldquoriskrdquo incidents) that are unlikely to reoccur on a regular basis but still have a dramatic impact on the potential profitability of that customer An example of this is a customer moving to a new home which is a significant expense for an energy company but one that probably does not happen frequently for the majority of customers For a correct appreciation of the profitability of a customer one needs to not just understand what it costs to process this incident but also the likely probability of it occurring in any given period
Using analytics to understand the nature of process failure5
Any ABM model makes the immediate costs of failure in internal processes extremely visible But in addition to the direct impact of the cost of recovery activities there may be secondary impacts that are less visible in an ABM model These can still be identified and the implications can be quantified These secondary impacts can materialize in a number of ways over time including increased cancellation rates selection of more costly but less risky business channels reduced reorder frequencies and volumes and elevated customer churn rates
Predicting which prospects are likely to be most profitable6
Once an existing customerrsquos behavior is known it becomes relatively easy to predict whether that customer is likely to be profitable even without a detailed profit model Of course the potential behavior of prospective customers is an unknown ndash but it is not necessarily unpredictable An analysis linking customer profitability to geo-demographic characteristics allows an analyst to identify prospects with certain determining characteristics We can theorize that these customers are likely to behave in a similar fashion to similar existing customers and become similarly profitable
4 Appendix 2 Risk Incidents Accounting for Occasional Events in Profitability Analyses5 Appendix 3 Risk Incidents Better Understanding the Impact of Process Failures6 Appendix 4 Profitable Customer Acquisition
14
Increase Customer Profitability Using Data Mining and Advanced Analytics
Using analytics to understand customer lifetime value7
One of the significant insights discovered early when customer profitability models are data mined is that customer profitability does not tend to follow a nice smooth incremental path Instead it tends to cluster around customers at different life stages and steps of their relationship with a business To provide a real picture of the potential long-term value of a customer ndash showing the customerrsquos longevity and their likely future ndash analytics incorporates the possibility of significant life-stage changes
Using analytics to develop customer strategy based on profitable behaviors8
Where ABM has been applied to strategy it has typically been focused on structural issues such as how to organize departments to achieve economies of scale or what markets to continue pursuing But for a marketer thinking about customer strategy customer profitability and behavioral analysis should be foundation stones This calls on two aspects previously discussed ndash the characteristics of profitable customers and where a business can find more customers like them However strategy will tend to focus less on the small and unusual customers and more on large groups of customers with similar characteristics
Conclusion
All things considered why speculate and guess at the rank-ordered drivers that differentiate between relatively more- and less-profitable customers Why not apply computer power to do the heavy lifting An additional message is to not perform the analysis as a one-time study but to produce the information at frequent time intervals as a permanent repeatable and reliable production information system
It is true that experienced analysts typically suspect and hypothesize that two or more things are related or that some underlying behavior is driving behavior seen in the data They then search for confirmation and understanding of the relationships In other words the application of analytics is usually more confirmatory than exploratory It is not like finding diamonds in a coal mine One does not simply flog the data until it confesses However in the case of attempting to identify the differentiating traits between more- and less-profitable customers the major traits may not be intuitively obvious to an analyst
The goal is to accelerate the identification of the differentiating drivers so that actions ndash interventions ndash can be considered as a way to get high-payback profit lift from customers The analysts using ABM have benefited from applying online analytical processing (OLAP) multidimension cubes to slice-and-dice data Even greater benefits and better decisions can come from applying data mining and advanced analytics
7 Appendix 5 Customer Equity Analysis
8 Appendix 6 Customer Strategy
Increase Customer Profitability Using Data Mining and Advanced Analytics
15
APPENDIX 1
The Importance of Ratios
One of the critical first steps when analyzing an ABC model is to understand the data and how it needs to be transformed to correctly answer your questions The biggest issue we face is the impact of volume effects (the amount a customer buys) on our analysis and how they can override any other potentially more important analyses This is why one of the first actions often taken is to ldquonormalize the datardquo through the derivation of key ratios that remove the size effects and allow deeper insights to be surfaced
To illustrate this we will use the case of a wholesale business that has some large and some small customers with varying return rates We could consider four customers ndash two large (A and B) and two small (C and D) ndash with two of the customers having high return rates (A and C) and two of the customers having low return rates (B and D) See the table for an illustration
If we then plot this data on two charts one showing net total contribution versus number of returns and the other showing percent of contribution versus percent of return rates we see a dramatically different picture The volume effect overwhelms the return rate effect in the first graph where we plot absolute values giving a potentially misleading message that the number of returns has a positive correlation to profit In the key ratios analysis with the size effects removed the rate of returns can be correctly seen to have a negative impact on profitability
16
Increase Customer Profitability Using Data Mining and Advanced Analytics
Indeed the beloved whale curve diagram (more properly called the profit margin cliff curve) has a tendency to provide a relatively false picture of profitability Because it orders customers on the basis of absolute profit it tends to group all the small customers in the center and place large customers at each end This over-emphasizes these few significant but anomalous customers and leads us to miss potentially critical trends and patterns that can be found in the population at large and which can have a
dramatic impact on profitability
By sizing and ordering our customers based on revenue and by showing profit versus revenue we can transform a relatively benign-looking whale curve into a much more dramatic hook curve As shown below we can now see that we have a whole set of customers who are in fact more profitable than our largest customer even though they generate the most absolute profit And similarly we have a host of customers who are significantly less profitable than our customer who generates the greatest loss It is also quite clear that clearing out our unprofitable customers will not have a dramatic impact on our top line so we will feel free to attack them without worrying too much about the impact on the share price
Increase Customer Profitability Using Data Mining and Advanced Analytics
17
APPENDIX 2
Risk Incidents Accounting for Occasional Events in Profitability Analyses
One of the unfortunate side effects of the periodic nature of an ABC model is that it captures occasional events against a customer in the period that they happen then registers the impact on profitability in that period but provides us with little information about whether that event is likely to recur frequently or infrequently
Examples include things as varied as home moves for energy companies insurance claims warranty claims issuing of new credit cards or mobile handset renewals
When designing our data exploration model we need to adopt a different strategy for these sorts of costs Specifically we need to replace the occasional event or behavior with a marker indicating the probability of the event occurring Typically this would be a direct calculation of the probability of the event occurring for each customer in the period This may be calculated using a number of techniques including logistic regressions neural networks or a decision tree
18
Increase Customer Profitability Using Data Mining and Advanced Analytics
Alternatively we may find a proxy indicator for the risk of the occasional event These are typically geo-demographic indicators but they could also include products (for example car model affecting the probability of a warranty claim) or channel (returns are more likely for mail order than store-purchased products)
Exact choice of approach depends very much upon
bull Theneedsoftheanalysis
bull Theavailabilityofdata
bull Thetoolsavailable
APPENDIX 3
Risk Incidents Better Understanding the Impact of Process Failures
One class of occasional events often has to do with process failures One of the huge benefits of an ABM model is that it makes the true costs of such failures extremely visible But in addition to making the cost visible analytics also gives us the ability to better understand the impact of such failures from the likelihood of them occurring to the long-term impact on customer retention
One example of this occurred at a classified advertising company where a segment of customers were identified who had many advertisement amendment costs but also unusually low revenue due to cancellations
Increase Customer Profitability Using Data Mining and Advanced Analytics
19
Beyond the initial identification of this unusual set of behaviors a technique called survival analysis was applied to the problem This clearly revealed that there was a critical turning point in the customersrsquo relationship with the business at which point they became frustrated enough to cancel their advertisement (See the diagram for more information) With this insight we knew when to set a warning marker on transactions allowing us to review them and determine if a recovery effort was worth engaging in
APPENDIX 4
Profitable Customer Acquisition
While much of this paper has been focused on how we identify which behaviors customers exhibit that make them profitable or not it is not possible to understand how a prospect will behave if we acquire them and therefore whether they are likely to be worth the effort Much work has gone on in sophisticated companies to review expected sales revenues for different demographics But these analyses can be improved even further by moving from analyzing and segmenting based on expected revenue to applying the additional insight available from a customer profitability model This type of model not only has the potential to tell a company what level of profit they may expect from a particular prospect segment but it can also show
bull Howthatgroupislikelytobehave
bull Theproductmixtheymayprefer
bull Thechannelstheymayprefertopurchasethrough
bull Theirtypicalordersizes
bull Whethertheyarelikelytohavepaymentproblemswhichwouldcausepotential impact on the companyrsquos resources (call centers order processing warehouses etc)
20
Increase Customer Profitability Using Data Mining and Advanced Analytics
To achieve this analysis a decision tree is often the most useful tool But rather than applying behaviors to segment the customers we apply demographic indicators ndash and once a segment is identified we overlay that initial analysis with a behavioral analysis
APPENDIX 5
Customer Equity Analysis
The final stage in this process is to move to some form of lifetime value analysis Much of the literature assumes that customers advance on an incremental basis gradually growing over time to buy more and newer products right up to the point at which they leave
However with the much greater depth of knowledge we have on customer behaviors and which ones are significant one of the clear findings is that customers are not generally incremental in nature Instead they tend to be relatively static until they go through some form of state change transformation (such as leaving school getting married or losing a job) With our ability to identify how customers typically behave in each of these states and the propensity of them to move between states we can develop a more realistic approach That approach would be to not look at individual customer lifetime value but to look at the potential value of a particular segment ndash including how it will change over time as new customers are acquired through transfer or acquisition and how they are lost either through transfer or churn The diagram below shows this more realistic model of customer equity analysis
Increase Customer Profitability Using Data Mining and Advanced Analytics
21
APPENDIX 6
Customer Strategy
Where ABM has been applied to strategy it has typically been focused on structural issues how to organize departments to achieve economies of scale and what markets to continue pursuing But for a marketer thinking about their customer strategy customer profitability and behavioral analysis should be foundation stones However this need differs from that of the person looking to identify and understand the sorts of unusual customers who are identified by a decision tree
To understand customers itrsquos important to understand a broad sweep of customer behaviors and to identify large segments of customers with similar patterns of behavior for which they need to develop a strategy For this purpose a technique called cluster analysis becomes invaluable In cluster analysis all business drivers are considered equally important for the segmentation This is unlike a decision tree where there is a clear target variable (typically profitability) and explanatory variables (the key ratios) In cluster analysis all variables are tested and the significant ones that indicate customers with similar patterns of behavior (including things like profitability) are identified and used to segment the customers
With the members of each cluster identified other information can be overlaid on the analysis to deepen the picture and appropriate strategies can be developed In the case of a technology wholesaler six clusters were identified of this four represented the core of the business for which strategies were deployed
22
Increase Customer Profitability Using Data Mining and Advanced Analytics
The first group (PG) was happy to pay for a relatively high service level and consequently was very profitable so a strategy of ldquocuddlerdquo was developed The UNeg group was very similar to the PG group in many ways but a significant portion of their purchase mix involved redundant technology that was sold at a loss but should probably never have still been in stock The strategy here was to ldquocurerdquo this stock management problem and return these customers to profit The core of the business came from those in the PNorm group low-effort customers with an OK margin who we needed to ldquokeeprdquo as customers Finally there was a class of customers called UNorm who asked for the earth but did not want to pay and for those an active ldquocullrdquo strategy was developed Under this strategy they were offered terms that would make them profitable if accepted ndash but if the terms were rejected the wholesaler would no longer supply them
Increase Customer Profitability Using Data Mining and Advanced Analytics
23
About SAS
SAS is the leader in business analytics software and services and the largest independent vendor in the business intelligence market Through innovative solutions delivered within an integrated framework SAS helps customers at more than 50000 sites improve performance and deliver value by making better decisions faster Since 1976SAShasbeengivingcustomersaroundtheworldTHEPOWERTOKNOWreg
SAS Institute Inc World Headquarters +1 919 677 8000To contact your local SAS office please visit wwwsascomoffices
SAS and all other SAS Institute Inc product or service names are registered trademarks or trademarks of SAS Institute Inc in the USA and other countries reg indicates USA registration Other brand and product names are trademarks of their respective companies Copyright copy 2011 SAS Institute Inc All rights reserved 105300_649310811
- Executive Summary
- Three Key Trends Affecting ABM
-
- The Suppliersrsquo Shift from Product-Centric to Customer-Centric
- The Availability of Detailed Data
- Declining Emphasis on Process and Productivity Improvement as a Way to Improve the Bottom Line
- Whither ABM
-
- What So What Then What
-
- From Seeing Costs to Understanding Them
- What Differentiates More-Profitable From Less-Profitable Customers
- How Can a Supplier Determine Differentiating Drivers of Its Profits from Customers
- The Explanatory Investigation Continues hellip and Continues
- Letrsquos Try a Different Approach
- Applying the Computing Power of Data Mining and Advanced Analytics
- Where Does the Analyst Go from Here
- And Therersquos Morehellip
-
- Conclusion
- APPENDIX 1
-
- The Importance of Ratios
-
- APPENDIX 2
-
- Risk Incidents Accounting for Occasional Events in Profitability Analyses
-
- APPENDIX 3
-
- Risk Incidents Better Understanding the Impact of Process Failures
-
- APPENDIX 4
-
- Profitable Customer Acquisition
-
- APPENDIX 5
-
- Customer Equity Analysis
-
- APPENDIX 6
-
- Customer Strategy
-
- About SAS
-

Increase Customer Profitability Using Data Mining and Advanced Analytics
7
How Can a Supplier Determine Differentiating Drivers of Its Profits from Customers
Letrsquos start simple Imagine the supplierrsquos business analysts speculate that the residential location of a customer may be a major driver explaining the differentiation between high- and low-profit customers ndash the first and last profit contribution decile in Figure 1rsquos histogram Since the analysts have access to both of these data items (ie profit and home address) a correlation2 (ie the explanatory value level) can be measured
With a very simple examination of just the most and least profitable (10 percent) customer histogram deciles the correlation measure may confirm the analystsrsquo hypotheses that the most profitable customers live in affluent neighborhoods and the unprofitable customers reside in low-income neighborhoods There is however a remaining question ndash how strongly do these newfound facts support the conclusion If the correlation is extremely high then potential ldquoso whatrdquo actions ndash like knowing where to advertise and where not to ndash become obvious But letrsquos imagine that in this case the correlation measure is relatively low ndash meaning that residential location does not strongly support the analystsrsquo hypothesis
What next Which other driver might explain the customer profit differentiation
The Explanatory Investigation Continues hellip and Continues
Imagine the supplierrsquos analysts next speculate that it is the customerrsquos age not their residential location that may be a major explanatory driver differentiating high-profit from low-profit customers Again both data records for all customers are accessible (ie profit age) The correlation is again measured A possible outcome might reveal that older customers (eg senior citizens) are much more profitable and younger customers (eg teenagers) are much less profitable
However the outcome could have been the reverse with young people (eg spendthrifts) being most profitable and older people (eg frugal) not But similar to the residential location hypothesis letrsquos imagine that the strength of the correlation measure is again low ndash meaning there is not clear evidence that age is a differentiating driver
How about the product mixes that customers purchase Figure 2 displays what the analyst could see However imagine again that the correlation score does not demonstrate sufficient evidence that this is a differentiating driver
2 In statistics dependence refers to any statistical relationship between two random variables or two sets of data Correlation refers to any of a broad class of statistical relationships involving dependence
Familiar examples of dependent phenomena include the correlation between the physical statures of parents and their offspring and the correlation between the demand for a product and its price Correlations are useful because they can indicate a predictive relationship that can be exploited in practice For example an electrical utility may produce less power on a mild day based on the correlation between electricity demand and weather In this example there is a causal relationship because extreme weather causes people to use more electricity for heating or cooling however statistical dependence is not sufficient to demonstrate the presence of such a causal relationship
8
Increase Customer Profitability Using Data Mining and Advanced Analytics
Figure 2 Product mix deciles
How about the region of the country the customer lives in rather than the type of neighborhood within a metropolitan area as the analyst first speculated Figure 3 displays this view But again letrsquos imagine that this driver does not provide clear or sufficient evidence
Figure 3 Region decile
Increase Customer Profitability Using Data Mining and Advanced Analytics
9
Where do the analysts go next What other driver or trait could they test That is what other customer driver or trait could the supplierrsquos analysts consider as the high versus low customer-profit-level differentiator Customer weight Hair color Type of credit card Number of brothers and sisters Sibling age rank (eg oldest youngest) Model year of their car Car manufacturer and model Which traits can you think of
The point here is that the possibilities appear to be unlimited especially if you have a big imagination Does the pursuit need to continue to be somewhat trial-and-error as in the examples above Possibly ndash however experienced analysts do apply some common sense in speculating which drivers to consider But in a complex world even experienced analysts need some assistance to shorten their investigation time and help them quickly focus on what matters most
In reality the number of single customer behaviors or traits that is ldquomost explanatoryrdquo is not limitless It is restricted by the amount of data a supplier has about each of its customers But with the massive amount of customer information in storage the list of driver choices could be fairly extensive
So what driver should the supplierrsquos analysts test next Selecting the first few traits may be relatively easy ndash as with the residential location and age However as in our example assume that the correlation values are low Then do you test other traits that are less obvious and may be more challenging to hypothesize What should the analysts do to reduce the time and effort of this investigation This research should not be like looking for the single needle in a haystack or the single diamond in a coal mine
Letrsquos Try a Different Approach
At this point it is clear that customer profitability reporting is not the same thing as customer profitability analysis What is needed is an approach that will crystallize insights gained from customer profitability reporting ndash and generate meaningful insight into which characteristics and behaviors of customers and products separate the relatively more- and less-profitable customers
Analyzing large-scale customer-profitability models is the sort of challenge ideally suited to SASreg softwarersquos advanced data mining and analytical capabilities These techniques allow a business analyst to increase the value of the model by
bull Simplifyingcomplexityandidentifyingwhatismostimportantforthebusinesstofocus on
bull Discoveringhiddenpatternsthatcrossarbitrarycustomersegmentboundaries
bull Allowingthebusinesstopredicthowprofitableacustomerislikelytobenowandin the future
Applying data mining and analytics to cost and profitability reporting will enable the business analyst to answer the ldquoso whatrdquo question Performance management methodology modeling can solve the ldquothen whatrdquo question
10
Increase Customer Profitability Using Data Mining and Advanced Analytics
The next section shows how data mining solved that earlier problem of finding which drivers were critical ones in our model
Applying the Computing Power of Data Mining and Advanced Analytics
Letrsquos discard the hypothetical supplier analystsrsquo quest and get more directly to the point By combining data mining and advanced analytics (in this case a statistical technique called a decision tree) with todayrsquos enormous computing power and its access to massive amounts of stored data about customers one can gain tremendous insight Decision trees are a simple but powerful form of multiple variable analysis Produced by algorithms that split data into branch-like partitions decision trees are developed and presented incrementally as a collection of one-cause one-effect relationships calculated in a recursive form The appeal of decision trees lies in their relative power ease of use robustness with a variety of data types and ease with which they can be understood by non-experts
Figure 4 displays the initial ldquobranchingrdquo of the most statistically significant explanatory differentiating driver For this particular supplierrsquos 22161 customersrsquo profit rank ordered for 2010 the correlation analysis calculated ldquoaverage transaction quantityrdquo as the most explanatory driver
Figure 4 Decision tree - the average transaction quantity
Increase Customer Profitability Using Data Mining and Advanced Analytics
11
The figure displays other potentially useful information
bull Itcalculatesthat53istheaveragetransactionquantitythatdividesthemore-and less-profitable customers into two subsets of the whole population of 22161 customers
bull Itcalculatesthat6551customersaretheldquolessprofitablerdquo(withtheirownaveragetransaction quantity of 108) ndash and that 15610 customers are in the ldquomore profitablerdquo subset (with their own average transaction quantity of 707)
bull Itcalculatesthat1469isthedividingamountwithcustomersabovethatnumberbeing x and those below it being y
OK So what
Where Does the Analyst Go from Here
Based on the initial partition the marketing and sales functions can begin to brainstorm how to alter the behavior of customers in the ldquoless profitablerdquo segment so that they move in the direction of customers in the ldquomore profitablerdquo segment For example the supplier could provide customers with a menu of service-level prices to encourage them to increase or decrease transaction quantities with offered price levels derived from the ABC information by assuring that an incremental change in price (up or down) will always exceed the incremental change in cost to deliver that service level This way the supplier gains a higher profit by altering the behavior of the customer to select a service-level offer in either direction
But while that brainstorming is occurring the analysts can delve deeper After the average transaction quantity is revealed as the most prominent factor each ldquomoreless profitablerdquo segment will be recursively partitioned Following one branch of the decision tree down Figure 5 reveals that the factor that most differentiates the ldquomore profitablerdquo customers is ldquo cashrdquo and subsequently further down the tree a third critical factor ndash ldquodays with a negative balancerdquo ndash applies
At this point an uncomfortable fact is uncovered Within the ldquohigh average transaction quantity customersrdquo there exists a distinct microsegment who use a lot of cash and frequently run overdrafts Consequently they are the least-profitable customers Now the marketing and sales functions can focus on this particular microsegment and brainstorm ideas to change this customer segmentrsquos behavior or their commercial terms and move them toward profitability Figure 5 displays the expanding the decision tree diagram
12
Increase Customer Profitability Using Data Mining and Advanced Analytics
Figure 5 Three-level tree diagram
You get the idea Why speculate when the computer can do the heavy lifting
And Therersquos More hellip
Does this mean that the analystsrsquo work is done By no means This is just one technique that can be applied to a model to solve one particular question What are the typical behaviors that distinguish our most and least profitable customers Advanced data mining and analytical techniques give the business analyst both the time and capability to gain ever more insight into their customers The analyst plays a critical role in this process defining the business problem understanding how it can be answered (and therefore which analytical technique to use) and finally how to structure the analysis3 This enables a business to tackle a range of other issues that include using analytics to
bull Betterunderstandtheimplicationofnonrecurringevents
bull Understandthenatureofprocessfailure
bull Predictwhichprospectsarelikelytobemostprofitable
bull Understandcustomerlifetimevalue
bull Developcustomerstrategybasedonprofitablebehaviors
3 Appendix 1 The Importance of Ratios
Increase Customer Profitability Using Data Mining and Advanced Analytics
13
Using analytics to better understand the implication of occasional (intermittent) events4
When customer segments are disaggregated down to an individual level one may encounter occasional (ie intermittent) activities associated with a customer (what we might call ldquoriskrdquo incidents) that are unlikely to reoccur on a regular basis but still have a dramatic impact on the potential profitability of that customer An example of this is a customer moving to a new home which is a significant expense for an energy company but one that probably does not happen frequently for the majority of customers For a correct appreciation of the profitability of a customer one needs to not just understand what it costs to process this incident but also the likely probability of it occurring in any given period
Using analytics to understand the nature of process failure5
Any ABM model makes the immediate costs of failure in internal processes extremely visible But in addition to the direct impact of the cost of recovery activities there may be secondary impacts that are less visible in an ABM model These can still be identified and the implications can be quantified These secondary impacts can materialize in a number of ways over time including increased cancellation rates selection of more costly but less risky business channels reduced reorder frequencies and volumes and elevated customer churn rates
Predicting which prospects are likely to be most profitable6
Once an existing customerrsquos behavior is known it becomes relatively easy to predict whether that customer is likely to be profitable even without a detailed profit model Of course the potential behavior of prospective customers is an unknown ndash but it is not necessarily unpredictable An analysis linking customer profitability to geo-demographic characteristics allows an analyst to identify prospects with certain determining characteristics We can theorize that these customers are likely to behave in a similar fashion to similar existing customers and become similarly profitable
4 Appendix 2 Risk Incidents Accounting for Occasional Events in Profitability Analyses5 Appendix 3 Risk Incidents Better Understanding the Impact of Process Failures6 Appendix 4 Profitable Customer Acquisition
14
Increase Customer Profitability Using Data Mining and Advanced Analytics
Using analytics to understand customer lifetime value7
One of the significant insights discovered early when customer profitability models are data mined is that customer profitability does not tend to follow a nice smooth incremental path Instead it tends to cluster around customers at different life stages and steps of their relationship with a business To provide a real picture of the potential long-term value of a customer ndash showing the customerrsquos longevity and their likely future ndash analytics incorporates the possibility of significant life-stage changes
Using analytics to develop customer strategy based on profitable behaviors8
Where ABM has been applied to strategy it has typically been focused on structural issues such as how to organize departments to achieve economies of scale or what markets to continue pursuing But for a marketer thinking about customer strategy customer profitability and behavioral analysis should be foundation stones This calls on two aspects previously discussed ndash the characteristics of profitable customers and where a business can find more customers like them However strategy will tend to focus less on the small and unusual customers and more on large groups of customers with similar characteristics
Conclusion
All things considered why speculate and guess at the rank-ordered drivers that differentiate between relatively more- and less-profitable customers Why not apply computer power to do the heavy lifting An additional message is to not perform the analysis as a one-time study but to produce the information at frequent time intervals as a permanent repeatable and reliable production information system
It is true that experienced analysts typically suspect and hypothesize that two or more things are related or that some underlying behavior is driving behavior seen in the data They then search for confirmation and understanding of the relationships In other words the application of analytics is usually more confirmatory than exploratory It is not like finding diamonds in a coal mine One does not simply flog the data until it confesses However in the case of attempting to identify the differentiating traits between more- and less-profitable customers the major traits may not be intuitively obvious to an analyst
The goal is to accelerate the identification of the differentiating drivers so that actions ndash interventions ndash can be considered as a way to get high-payback profit lift from customers The analysts using ABM have benefited from applying online analytical processing (OLAP) multidimension cubes to slice-and-dice data Even greater benefits and better decisions can come from applying data mining and advanced analytics
7 Appendix 5 Customer Equity Analysis
8 Appendix 6 Customer Strategy
Increase Customer Profitability Using Data Mining and Advanced Analytics
15
APPENDIX 1
The Importance of Ratios
One of the critical first steps when analyzing an ABC model is to understand the data and how it needs to be transformed to correctly answer your questions The biggest issue we face is the impact of volume effects (the amount a customer buys) on our analysis and how they can override any other potentially more important analyses This is why one of the first actions often taken is to ldquonormalize the datardquo through the derivation of key ratios that remove the size effects and allow deeper insights to be surfaced
To illustrate this we will use the case of a wholesale business that has some large and some small customers with varying return rates We could consider four customers ndash two large (A and B) and two small (C and D) ndash with two of the customers having high return rates (A and C) and two of the customers having low return rates (B and D) See the table for an illustration
If we then plot this data on two charts one showing net total contribution versus number of returns and the other showing percent of contribution versus percent of return rates we see a dramatically different picture The volume effect overwhelms the return rate effect in the first graph where we plot absolute values giving a potentially misleading message that the number of returns has a positive correlation to profit In the key ratios analysis with the size effects removed the rate of returns can be correctly seen to have a negative impact on profitability
16
Increase Customer Profitability Using Data Mining and Advanced Analytics
Indeed the beloved whale curve diagram (more properly called the profit margin cliff curve) has a tendency to provide a relatively false picture of profitability Because it orders customers on the basis of absolute profit it tends to group all the small customers in the center and place large customers at each end This over-emphasizes these few significant but anomalous customers and leads us to miss potentially critical trends and patterns that can be found in the population at large and which can have a
dramatic impact on profitability
By sizing and ordering our customers based on revenue and by showing profit versus revenue we can transform a relatively benign-looking whale curve into a much more dramatic hook curve As shown below we can now see that we have a whole set of customers who are in fact more profitable than our largest customer even though they generate the most absolute profit And similarly we have a host of customers who are significantly less profitable than our customer who generates the greatest loss It is also quite clear that clearing out our unprofitable customers will not have a dramatic impact on our top line so we will feel free to attack them without worrying too much about the impact on the share price
Increase Customer Profitability Using Data Mining and Advanced Analytics
17
APPENDIX 2
Risk Incidents Accounting for Occasional Events in Profitability Analyses
One of the unfortunate side effects of the periodic nature of an ABC model is that it captures occasional events against a customer in the period that they happen then registers the impact on profitability in that period but provides us with little information about whether that event is likely to recur frequently or infrequently
Examples include things as varied as home moves for energy companies insurance claims warranty claims issuing of new credit cards or mobile handset renewals
When designing our data exploration model we need to adopt a different strategy for these sorts of costs Specifically we need to replace the occasional event or behavior with a marker indicating the probability of the event occurring Typically this would be a direct calculation of the probability of the event occurring for each customer in the period This may be calculated using a number of techniques including logistic regressions neural networks or a decision tree
18
Increase Customer Profitability Using Data Mining and Advanced Analytics
Alternatively we may find a proxy indicator for the risk of the occasional event These are typically geo-demographic indicators but they could also include products (for example car model affecting the probability of a warranty claim) or channel (returns are more likely for mail order than store-purchased products)
Exact choice of approach depends very much upon
bull Theneedsoftheanalysis
bull Theavailabilityofdata
bull Thetoolsavailable
APPENDIX 3
Risk Incidents Better Understanding the Impact of Process Failures
One class of occasional events often has to do with process failures One of the huge benefits of an ABM model is that it makes the true costs of such failures extremely visible But in addition to making the cost visible analytics also gives us the ability to better understand the impact of such failures from the likelihood of them occurring to the long-term impact on customer retention
One example of this occurred at a classified advertising company where a segment of customers were identified who had many advertisement amendment costs but also unusually low revenue due to cancellations
Increase Customer Profitability Using Data Mining and Advanced Analytics
19
Beyond the initial identification of this unusual set of behaviors a technique called survival analysis was applied to the problem This clearly revealed that there was a critical turning point in the customersrsquo relationship with the business at which point they became frustrated enough to cancel their advertisement (See the diagram for more information) With this insight we knew when to set a warning marker on transactions allowing us to review them and determine if a recovery effort was worth engaging in
APPENDIX 4
Profitable Customer Acquisition
While much of this paper has been focused on how we identify which behaviors customers exhibit that make them profitable or not it is not possible to understand how a prospect will behave if we acquire them and therefore whether they are likely to be worth the effort Much work has gone on in sophisticated companies to review expected sales revenues for different demographics But these analyses can be improved even further by moving from analyzing and segmenting based on expected revenue to applying the additional insight available from a customer profitability model This type of model not only has the potential to tell a company what level of profit they may expect from a particular prospect segment but it can also show
bull Howthatgroupislikelytobehave
bull Theproductmixtheymayprefer
bull Thechannelstheymayprefertopurchasethrough
bull Theirtypicalordersizes
bull Whethertheyarelikelytohavepaymentproblemswhichwouldcausepotential impact on the companyrsquos resources (call centers order processing warehouses etc)
20
Increase Customer Profitability Using Data Mining and Advanced Analytics
To achieve this analysis a decision tree is often the most useful tool But rather than applying behaviors to segment the customers we apply demographic indicators ndash and once a segment is identified we overlay that initial analysis with a behavioral analysis
APPENDIX 5
Customer Equity Analysis
The final stage in this process is to move to some form of lifetime value analysis Much of the literature assumes that customers advance on an incremental basis gradually growing over time to buy more and newer products right up to the point at which they leave
However with the much greater depth of knowledge we have on customer behaviors and which ones are significant one of the clear findings is that customers are not generally incremental in nature Instead they tend to be relatively static until they go through some form of state change transformation (such as leaving school getting married or losing a job) With our ability to identify how customers typically behave in each of these states and the propensity of them to move between states we can develop a more realistic approach That approach would be to not look at individual customer lifetime value but to look at the potential value of a particular segment ndash including how it will change over time as new customers are acquired through transfer or acquisition and how they are lost either through transfer or churn The diagram below shows this more realistic model of customer equity analysis
Increase Customer Profitability Using Data Mining and Advanced Analytics
21
APPENDIX 6
Customer Strategy
Where ABM has been applied to strategy it has typically been focused on structural issues how to organize departments to achieve economies of scale and what markets to continue pursuing But for a marketer thinking about their customer strategy customer profitability and behavioral analysis should be foundation stones However this need differs from that of the person looking to identify and understand the sorts of unusual customers who are identified by a decision tree
To understand customers itrsquos important to understand a broad sweep of customer behaviors and to identify large segments of customers with similar patterns of behavior for which they need to develop a strategy For this purpose a technique called cluster analysis becomes invaluable In cluster analysis all business drivers are considered equally important for the segmentation This is unlike a decision tree where there is a clear target variable (typically profitability) and explanatory variables (the key ratios) In cluster analysis all variables are tested and the significant ones that indicate customers with similar patterns of behavior (including things like profitability) are identified and used to segment the customers
With the members of each cluster identified other information can be overlaid on the analysis to deepen the picture and appropriate strategies can be developed In the case of a technology wholesaler six clusters were identified of this four represented the core of the business for which strategies were deployed
22
Increase Customer Profitability Using Data Mining and Advanced Analytics
The first group (PG) was happy to pay for a relatively high service level and consequently was very profitable so a strategy of ldquocuddlerdquo was developed The UNeg group was very similar to the PG group in many ways but a significant portion of their purchase mix involved redundant technology that was sold at a loss but should probably never have still been in stock The strategy here was to ldquocurerdquo this stock management problem and return these customers to profit The core of the business came from those in the PNorm group low-effort customers with an OK margin who we needed to ldquokeeprdquo as customers Finally there was a class of customers called UNorm who asked for the earth but did not want to pay and for those an active ldquocullrdquo strategy was developed Under this strategy they were offered terms that would make them profitable if accepted ndash but if the terms were rejected the wholesaler would no longer supply them
Increase Customer Profitability Using Data Mining and Advanced Analytics
23
About SAS
SAS is the leader in business analytics software and services and the largest independent vendor in the business intelligence market Through innovative solutions delivered within an integrated framework SAS helps customers at more than 50000 sites improve performance and deliver value by making better decisions faster Since 1976SAShasbeengivingcustomersaroundtheworldTHEPOWERTOKNOWreg
SAS Institute Inc World Headquarters +1 919 677 8000To contact your local SAS office please visit wwwsascomoffices
SAS and all other SAS Institute Inc product or service names are registered trademarks or trademarks of SAS Institute Inc in the USA and other countries reg indicates USA registration Other brand and product names are trademarks of their respective companies Copyright copy 2011 SAS Institute Inc All rights reserved 105300_649310811
- Executive Summary
- Three Key Trends Affecting ABM
-
- The Suppliersrsquo Shift from Product-Centric to Customer-Centric
- The Availability of Detailed Data
- Declining Emphasis on Process and Productivity Improvement as a Way to Improve the Bottom Line
- Whither ABM
-
- What So What Then What
-
- From Seeing Costs to Understanding Them
- What Differentiates More-Profitable From Less-Profitable Customers
- How Can a Supplier Determine Differentiating Drivers of Its Profits from Customers
- The Explanatory Investigation Continues hellip and Continues
- Letrsquos Try a Different Approach
- Applying the Computing Power of Data Mining and Advanced Analytics
- Where Does the Analyst Go from Here
- And Therersquos Morehellip
-
- Conclusion
- APPENDIX 1
-
- The Importance of Ratios
-
- APPENDIX 2
-
- Risk Incidents Accounting for Occasional Events in Profitability Analyses
-
- APPENDIX 3
-
- Risk Incidents Better Understanding the Impact of Process Failures
-
- APPENDIX 4
-
- Profitable Customer Acquisition
-
- APPENDIX 5
-
- Customer Equity Analysis
-
- APPENDIX 6
-
- Customer Strategy
-
- About SAS
-
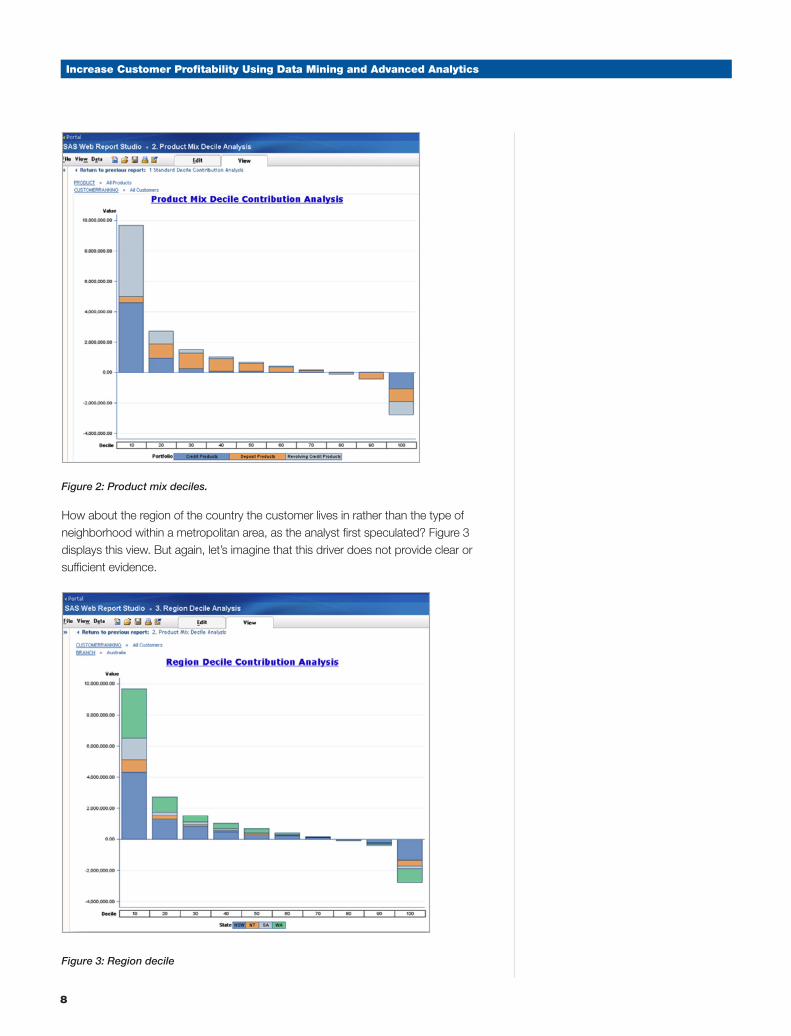

Increase Customer Profitability Using Data Mining and Advanced Analytics
9
Where do the analysts go next What other driver or trait could they test That is what other customer driver or trait could the supplierrsquos analysts consider as the high versus low customer-profit-level differentiator Customer weight Hair color Type of credit card Number of brothers and sisters Sibling age rank (eg oldest youngest) Model year of their car Car manufacturer and model Which traits can you think of
The point here is that the possibilities appear to be unlimited especially if you have a big imagination Does the pursuit need to continue to be somewhat trial-and-error as in the examples above Possibly ndash however experienced analysts do apply some common sense in speculating which drivers to consider But in a complex world even experienced analysts need some assistance to shorten their investigation time and help them quickly focus on what matters most
In reality the number of single customer behaviors or traits that is ldquomost explanatoryrdquo is not limitless It is restricted by the amount of data a supplier has about each of its customers But with the massive amount of customer information in storage the list of driver choices could be fairly extensive
So what driver should the supplierrsquos analysts test next Selecting the first few traits may be relatively easy ndash as with the residential location and age However as in our example assume that the correlation values are low Then do you test other traits that are less obvious and may be more challenging to hypothesize What should the analysts do to reduce the time and effort of this investigation This research should not be like looking for the single needle in a haystack or the single diamond in a coal mine
Letrsquos Try a Different Approach
At this point it is clear that customer profitability reporting is not the same thing as customer profitability analysis What is needed is an approach that will crystallize insights gained from customer profitability reporting ndash and generate meaningful insight into which characteristics and behaviors of customers and products separate the relatively more- and less-profitable customers
Analyzing large-scale customer-profitability models is the sort of challenge ideally suited to SASreg softwarersquos advanced data mining and analytical capabilities These techniques allow a business analyst to increase the value of the model by
bull Simplifyingcomplexityandidentifyingwhatismostimportantforthebusinesstofocus on
bull Discoveringhiddenpatternsthatcrossarbitrarycustomersegmentboundaries
bull Allowingthebusinesstopredicthowprofitableacustomerislikelytobenowandin the future
Applying data mining and analytics to cost and profitability reporting will enable the business analyst to answer the ldquoso whatrdquo question Performance management methodology modeling can solve the ldquothen whatrdquo question
10
Increase Customer Profitability Using Data Mining and Advanced Analytics
The next section shows how data mining solved that earlier problem of finding which drivers were critical ones in our model
Applying the Computing Power of Data Mining and Advanced Analytics
Letrsquos discard the hypothetical supplier analystsrsquo quest and get more directly to the point By combining data mining and advanced analytics (in this case a statistical technique called a decision tree) with todayrsquos enormous computing power and its access to massive amounts of stored data about customers one can gain tremendous insight Decision trees are a simple but powerful form of multiple variable analysis Produced by algorithms that split data into branch-like partitions decision trees are developed and presented incrementally as a collection of one-cause one-effect relationships calculated in a recursive form The appeal of decision trees lies in their relative power ease of use robustness with a variety of data types and ease with which they can be understood by non-experts
Figure 4 displays the initial ldquobranchingrdquo of the most statistically significant explanatory differentiating driver For this particular supplierrsquos 22161 customersrsquo profit rank ordered for 2010 the correlation analysis calculated ldquoaverage transaction quantityrdquo as the most explanatory driver
Figure 4 Decision tree - the average transaction quantity
Increase Customer Profitability Using Data Mining and Advanced Analytics
11
The figure displays other potentially useful information
bull Itcalculatesthat53istheaveragetransactionquantitythatdividesthemore-and less-profitable customers into two subsets of the whole population of 22161 customers
bull Itcalculatesthat6551customersaretheldquolessprofitablerdquo(withtheirownaveragetransaction quantity of 108) ndash and that 15610 customers are in the ldquomore profitablerdquo subset (with their own average transaction quantity of 707)
bull Itcalculatesthat1469isthedividingamountwithcustomersabovethatnumberbeing x and those below it being y
OK So what
Where Does the Analyst Go from Here
Based on the initial partition the marketing and sales functions can begin to brainstorm how to alter the behavior of customers in the ldquoless profitablerdquo segment so that they move in the direction of customers in the ldquomore profitablerdquo segment For example the supplier could provide customers with a menu of service-level prices to encourage them to increase or decrease transaction quantities with offered price levels derived from the ABC information by assuring that an incremental change in price (up or down) will always exceed the incremental change in cost to deliver that service level This way the supplier gains a higher profit by altering the behavior of the customer to select a service-level offer in either direction
But while that brainstorming is occurring the analysts can delve deeper After the average transaction quantity is revealed as the most prominent factor each ldquomoreless profitablerdquo segment will be recursively partitioned Following one branch of the decision tree down Figure 5 reveals that the factor that most differentiates the ldquomore profitablerdquo customers is ldquo cashrdquo and subsequently further down the tree a third critical factor ndash ldquodays with a negative balancerdquo ndash applies
At this point an uncomfortable fact is uncovered Within the ldquohigh average transaction quantity customersrdquo there exists a distinct microsegment who use a lot of cash and frequently run overdrafts Consequently they are the least-profitable customers Now the marketing and sales functions can focus on this particular microsegment and brainstorm ideas to change this customer segmentrsquos behavior or their commercial terms and move them toward profitability Figure 5 displays the expanding the decision tree diagram
12
Increase Customer Profitability Using Data Mining and Advanced Analytics
Figure 5 Three-level tree diagram
You get the idea Why speculate when the computer can do the heavy lifting
And Therersquos More hellip
Does this mean that the analystsrsquo work is done By no means This is just one technique that can be applied to a model to solve one particular question What are the typical behaviors that distinguish our most and least profitable customers Advanced data mining and analytical techniques give the business analyst both the time and capability to gain ever more insight into their customers The analyst plays a critical role in this process defining the business problem understanding how it can be answered (and therefore which analytical technique to use) and finally how to structure the analysis3 This enables a business to tackle a range of other issues that include using analytics to
bull Betterunderstandtheimplicationofnonrecurringevents
bull Understandthenatureofprocessfailure
bull Predictwhichprospectsarelikelytobemostprofitable
bull Understandcustomerlifetimevalue
bull Developcustomerstrategybasedonprofitablebehaviors
3 Appendix 1 The Importance of Ratios
Increase Customer Profitability Using Data Mining and Advanced Analytics
13
Using analytics to better understand the implication of occasional (intermittent) events4
When customer segments are disaggregated down to an individual level one may encounter occasional (ie intermittent) activities associated with a customer (what we might call ldquoriskrdquo incidents) that are unlikely to reoccur on a regular basis but still have a dramatic impact on the potential profitability of that customer An example of this is a customer moving to a new home which is a significant expense for an energy company but one that probably does not happen frequently for the majority of customers For a correct appreciation of the profitability of a customer one needs to not just understand what it costs to process this incident but also the likely probability of it occurring in any given period
Using analytics to understand the nature of process failure5
Any ABM model makes the immediate costs of failure in internal processes extremely visible But in addition to the direct impact of the cost of recovery activities there may be secondary impacts that are less visible in an ABM model These can still be identified and the implications can be quantified These secondary impacts can materialize in a number of ways over time including increased cancellation rates selection of more costly but less risky business channels reduced reorder frequencies and volumes and elevated customer churn rates
Predicting which prospects are likely to be most profitable6
Once an existing customerrsquos behavior is known it becomes relatively easy to predict whether that customer is likely to be profitable even without a detailed profit model Of course the potential behavior of prospective customers is an unknown ndash but it is not necessarily unpredictable An analysis linking customer profitability to geo-demographic characteristics allows an analyst to identify prospects with certain determining characteristics We can theorize that these customers are likely to behave in a similar fashion to similar existing customers and become similarly profitable
4 Appendix 2 Risk Incidents Accounting for Occasional Events in Profitability Analyses5 Appendix 3 Risk Incidents Better Understanding the Impact of Process Failures6 Appendix 4 Profitable Customer Acquisition
14
Increase Customer Profitability Using Data Mining and Advanced Analytics
Using analytics to understand customer lifetime value7
One of the significant insights discovered early when customer profitability models are data mined is that customer profitability does not tend to follow a nice smooth incremental path Instead it tends to cluster around customers at different life stages and steps of their relationship with a business To provide a real picture of the potential long-term value of a customer ndash showing the customerrsquos longevity and their likely future ndash analytics incorporates the possibility of significant life-stage changes
Using analytics to develop customer strategy based on profitable behaviors8
Where ABM has been applied to strategy it has typically been focused on structural issues such as how to organize departments to achieve economies of scale or what markets to continue pursuing But for a marketer thinking about customer strategy customer profitability and behavioral analysis should be foundation stones This calls on two aspects previously discussed ndash the characteristics of profitable customers and where a business can find more customers like them However strategy will tend to focus less on the small and unusual customers and more on large groups of customers with similar characteristics
Conclusion
All things considered why speculate and guess at the rank-ordered drivers that differentiate between relatively more- and less-profitable customers Why not apply computer power to do the heavy lifting An additional message is to not perform the analysis as a one-time study but to produce the information at frequent time intervals as a permanent repeatable and reliable production information system
It is true that experienced analysts typically suspect and hypothesize that two or more things are related or that some underlying behavior is driving behavior seen in the data They then search for confirmation and understanding of the relationships In other words the application of analytics is usually more confirmatory than exploratory It is not like finding diamonds in a coal mine One does not simply flog the data until it confesses However in the case of attempting to identify the differentiating traits between more- and less-profitable customers the major traits may not be intuitively obvious to an analyst
The goal is to accelerate the identification of the differentiating drivers so that actions ndash interventions ndash can be considered as a way to get high-payback profit lift from customers The analysts using ABM have benefited from applying online analytical processing (OLAP) multidimension cubes to slice-and-dice data Even greater benefits and better decisions can come from applying data mining and advanced analytics
7 Appendix 5 Customer Equity Analysis
8 Appendix 6 Customer Strategy
Increase Customer Profitability Using Data Mining and Advanced Analytics
15
APPENDIX 1
The Importance of Ratios
One of the critical first steps when analyzing an ABC model is to understand the data and how it needs to be transformed to correctly answer your questions The biggest issue we face is the impact of volume effects (the amount a customer buys) on our analysis and how they can override any other potentially more important analyses This is why one of the first actions often taken is to ldquonormalize the datardquo through the derivation of key ratios that remove the size effects and allow deeper insights to be surfaced
To illustrate this we will use the case of a wholesale business that has some large and some small customers with varying return rates We could consider four customers ndash two large (A and B) and two small (C and D) ndash with two of the customers having high return rates (A and C) and two of the customers having low return rates (B and D) See the table for an illustration
If we then plot this data on two charts one showing net total contribution versus number of returns and the other showing percent of contribution versus percent of return rates we see a dramatically different picture The volume effect overwhelms the return rate effect in the first graph where we plot absolute values giving a potentially misleading message that the number of returns has a positive correlation to profit In the key ratios analysis with the size effects removed the rate of returns can be correctly seen to have a negative impact on profitability
16
Increase Customer Profitability Using Data Mining and Advanced Analytics
Indeed the beloved whale curve diagram (more properly called the profit margin cliff curve) has a tendency to provide a relatively false picture of profitability Because it orders customers on the basis of absolute profit it tends to group all the small customers in the center and place large customers at each end This over-emphasizes these few significant but anomalous customers and leads us to miss potentially critical trends and patterns that can be found in the population at large and which can have a
dramatic impact on profitability
By sizing and ordering our customers based on revenue and by showing profit versus revenue we can transform a relatively benign-looking whale curve into a much more dramatic hook curve As shown below we can now see that we have a whole set of customers who are in fact more profitable than our largest customer even though they generate the most absolute profit And similarly we have a host of customers who are significantly less profitable than our customer who generates the greatest loss It is also quite clear that clearing out our unprofitable customers will not have a dramatic impact on our top line so we will feel free to attack them without worrying too much about the impact on the share price
Increase Customer Profitability Using Data Mining and Advanced Analytics
17
APPENDIX 2
Risk Incidents Accounting for Occasional Events in Profitability Analyses
One of the unfortunate side effects of the periodic nature of an ABC model is that it captures occasional events against a customer in the period that they happen then registers the impact on profitability in that period but provides us with little information about whether that event is likely to recur frequently or infrequently
Examples include things as varied as home moves for energy companies insurance claims warranty claims issuing of new credit cards or mobile handset renewals
When designing our data exploration model we need to adopt a different strategy for these sorts of costs Specifically we need to replace the occasional event or behavior with a marker indicating the probability of the event occurring Typically this would be a direct calculation of the probability of the event occurring for each customer in the period This may be calculated using a number of techniques including logistic regressions neural networks or a decision tree
18
Increase Customer Profitability Using Data Mining and Advanced Analytics
Alternatively we may find a proxy indicator for the risk of the occasional event These are typically geo-demographic indicators but they could also include products (for example car model affecting the probability of a warranty claim) or channel (returns are more likely for mail order than store-purchased products)
Exact choice of approach depends very much upon
bull Theneedsoftheanalysis
bull Theavailabilityofdata
bull Thetoolsavailable
APPENDIX 3
Risk Incidents Better Understanding the Impact of Process Failures
One class of occasional events often has to do with process failures One of the huge benefits of an ABM model is that it makes the true costs of such failures extremely visible But in addition to making the cost visible analytics also gives us the ability to better understand the impact of such failures from the likelihood of them occurring to the long-term impact on customer retention
One example of this occurred at a classified advertising company where a segment of customers were identified who had many advertisement amendment costs but also unusually low revenue due to cancellations
Increase Customer Profitability Using Data Mining and Advanced Analytics
19
Beyond the initial identification of this unusual set of behaviors a technique called survival analysis was applied to the problem This clearly revealed that there was a critical turning point in the customersrsquo relationship with the business at which point they became frustrated enough to cancel their advertisement (See the diagram for more information) With this insight we knew when to set a warning marker on transactions allowing us to review them and determine if a recovery effort was worth engaging in
APPENDIX 4
Profitable Customer Acquisition
While much of this paper has been focused on how we identify which behaviors customers exhibit that make them profitable or not it is not possible to understand how a prospect will behave if we acquire them and therefore whether they are likely to be worth the effort Much work has gone on in sophisticated companies to review expected sales revenues for different demographics But these analyses can be improved even further by moving from analyzing and segmenting based on expected revenue to applying the additional insight available from a customer profitability model This type of model not only has the potential to tell a company what level of profit they may expect from a particular prospect segment but it can also show
bull Howthatgroupislikelytobehave
bull Theproductmixtheymayprefer
bull Thechannelstheymayprefertopurchasethrough
bull Theirtypicalordersizes
bull Whethertheyarelikelytohavepaymentproblemswhichwouldcausepotential impact on the companyrsquos resources (call centers order processing warehouses etc)
20
Increase Customer Profitability Using Data Mining and Advanced Analytics
To achieve this analysis a decision tree is often the most useful tool But rather than applying behaviors to segment the customers we apply demographic indicators ndash and once a segment is identified we overlay that initial analysis with a behavioral analysis
APPENDIX 5
Customer Equity Analysis
The final stage in this process is to move to some form of lifetime value analysis Much of the literature assumes that customers advance on an incremental basis gradually growing over time to buy more and newer products right up to the point at which they leave
However with the much greater depth of knowledge we have on customer behaviors and which ones are significant one of the clear findings is that customers are not generally incremental in nature Instead they tend to be relatively static until they go through some form of state change transformation (such as leaving school getting married or losing a job) With our ability to identify how customers typically behave in each of these states and the propensity of them to move between states we can develop a more realistic approach That approach would be to not look at individual customer lifetime value but to look at the potential value of a particular segment ndash including how it will change over time as new customers are acquired through transfer or acquisition and how they are lost either through transfer or churn The diagram below shows this more realistic model of customer equity analysis
Increase Customer Profitability Using Data Mining and Advanced Analytics
21
APPENDIX 6
Customer Strategy
Where ABM has been applied to strategy it has typically been focused on structural issues how to organize departments to achieve economies of scale and what markets to continue pursuing But for a marketer thinking about their customer strategy customer profitability and behavioral analysis should be foundation stones However this need differs from that of the person looking to identify and understand the sorts of unusual customers who are identified by a decision tree
To understand customers itrsquos important to understand a broad sweep of customer behaviors and to identify large segments of customers with similar patterns of behavior for which they need to develop a strategy For this purpose a technique called cluster analysis becomes invaluable In cluster analysis all business drivers are considered equally important for the segmentation This is unlike a decision tree where there is a clear target variable (typically profitability) and explanatory variables (the key ratios) In cluster analysis all variables are tested and the significant ones that indicate customers with similar patterns of behavior (including things like profitability) are identified and used to segment the customers
With the members of each cluster identified other information can be overlaid on the analysis to deepen the picture and appropriate strategies can be developed In the case of a technology wholesaler six clusters were identified of this four represented the core of the business for which strategies were deployed
22
Increase Customer Profitability Using Data Mining and Advanced Analytics
The first group (PG) was happy to pay for a relatively high service level and consequently was very profitable so a strategy of ldquocuddlerdquo was developed The UNeg group was very similar to the PG group in many ways but a significant portion of their purchase mix involved redundant technology that was sold at a loss but should probably never have still been in stock The strategy here was to ldquocurerdquo this stock management problem and return these customers to profit The core of the business came from those in the PNorm group low-effort customers with an OK margin who we needed to ldquokeeprdquo as customers Finally there was a class of customers called UNorm who asked for the earth but did not want to pay and for those an active ldquocullrdquo strategy was developed Under this strategy they were offered terms that would make them profitable if accepted ndash but if the terms were rejected the wholesaler would no longer supply them
Increase Customer Profitability Using Data Mining and Advanced Analytics
23
About SAS
SAS is the leader in business analytics software and services and the largest independent vendor in the business intelligence market Through innovative solutions delivered within an integrated framework SAS helps customers at more than 50000 sites improve performance and deliver value by making better decisions faster Since 1976SAShasbeengivingcustomersaroundtheworldTHEPOWERTOKNOWreg
SAS Institute Inc World Headquarters +1 919 677 8000To contact your local SAS office please visit wwwsascomoffices
SAS and all other SAS Institute Inc product or service names are registered trademarks or trademarks of SAS Institute Inc in the USA and other countries reg indicates USA registration Other brand and product names are trademarks of their respective companies Copyright copy 2011 SAS Institute Inc All rights reserved 105300_649310811
- Executive Summary
- Three Key Trends Affecting ABM
-
- The Suppliersrsquo Shift from Product-Centric to Customer-Centric
- The Availability of Detailed Data
- Declining Emphasis on Process and Productivity Improvement as a Way to Improve the Bottom Line
- Whither ABM
-
- What So What Then What
-
- From Seeing Costs to Understanding Them
- What Differentiates More-Profitable From Less-Profitable Customers
- How Can a Supplier Determine Differentiating Drivers of Its Profits from Customers
- The Explanatory Investigation Continues hellip and Continues
- Letrsquos Try a Different Approach
- Applying the Computing Power of Data Mining and Advanced Analytics
- Where Does the Analyst Go from Here
- And Therersquos Morehellip
-
- Conclusion
- APPENDIX 1
-
- The Importance of Ratios
-
- APPENDIX 2
-
- Risk Incidents Accounting for Occasional Events in Profitability Analyses
-
- APPENDIX 3
-
- Risk Incidents Better Understanding the Impact of Process Failures
-
- APPENDIX 4
-
- Profitable Customer Acquisition
-
- APPENDIX 5
-
- Customer Equity Analysis
-
- APPENDIX 6
-
- Customer Strategy
-
- About SAS
-

Increase Customer Profitability Using Data Mining and Advanced Analytics
11
The figure displays other potentially useful information
bull Itcalculatesthat53istheaveragetransactionquantitythatdividesthemore-and less-profitable customers into two subsets of the whole population of 22161 customers
bull Itcalculatesthat6551customersaretheldquolessprofitablerdquo(withtheirownaveragetransaction quantity of 108) ndash and that 15610 customers are in the ldquomore profitablerdquo subset (with their own average transaction quantity of 707)
bull Itcalculatesthat1469isthedividingamountwithcustomersabovethatnumberbeing x and those below it being y
OK So what
Where Does the Analyst Go from Here
Based on the initial partition the marketing and sales functions can begin to brainstorm how to alter the behavior of customers in the ldquoless profitablerdquo segment so that they move in the direction of customers in the ldquomore profitablerdquo segment For example the supplier could provide customers with a menu of service-level prices to encourage them to increase or decrease transaction quantities with offered price levels derived from the ABC information by assuring that an incremental change in price (up or down) will always exceed the incremental change in cost to deliver that service level This way the supplier gains a higher profit by altering the behavior of the customer to select a service-level offer in either direction
But while that brainstorming is occurring the analysts can delve deeper After the average transaction quantity is revealed as the most prominent factor each ldquomoreless profitablerdquo segment will be recursively partitioned Following one branch of the decision tree down Figure 5 reveals that the factor that most differentiates the ldquomore profitablerdquo customers is ldquo cashrdquo and subsequently further down the tree a third critical factor ndash ldquodays with a negative balancerdquo ndash applies
At this point an uncomfortable fact is uncovered Within the ldquohigh average transaction quantity customersrdquo there exists a distinct microsegment who use a lot of cash and frequently run overdrafts Consequently they are the least-profitable customers Now the marketing and sales functions can focus on this particular microsegment and brainstorm ideas to change this customer segmentrsquos behavior or their commercial terms and move them toward profitability Figure 5 displays the expanding the decision tree diagram
12
Increase Customer Profitability Using Data Mining and Advanced Analytics
Figure 5 Three-level tree diagram
You get the idea Why speculate when the computer can do the heavy lifting
And Therersquos More hellip
Does this mean that the analystsrsquo work is done By no means This is just one technique that can be applied to a model to solve one particular question What are the typical behaviors that distinguish our most and least profitable customers Advanced data mining and analytical techniques give the business analyst both the time and capability to gain ever more insight into their customers The analyst plays a critical role in this process defining the business problem understanding how it can be answered (and therefore which analytical technique to use) and finally how to structure the analysis3 This enables a business to tackle a range of other issues that include using analytics to
bull Betterunderstandtheimplicationofnonrecurringevents
bull Understandthenatureofprocessfailure
bull Predictwhichprospectsarelikelytobemostprofitable
bull Understandcustomerlifetimevalue
bull Developcustomerstrategybasedonprofitablebehaviors
3 Appendix 1 The Importance of Ratios
Increase Customer Profitability Using Data Mining and Advanced Analytics
13
Using analytics to better understand the implication of occasional (intermittent) events4
When customer segments are disaggregated down to an individual level one may encounter occasional (ie intermittent) activities associated with a customer (what we might call ldquoriskrdquo incidents) that are unlikely to reoccur on a regular basis but still have a dramatic impact on the potential profitability of that customer An example of this is a customer moving to a new home which is a significant expense for an energy company but one that probably does not happen frequently for the majority of customers For a correct appreciation of the profitability of a customer one needs to not just understand what it costs to process this incident but also the likely probability of it occurring in any given period
Using analytics to understand the nature of process failure5
Any ABM model makes the immediate costs of failure in internal processes extremely visible But in addition to the direct impact of the cost of recovery activities there may be secondary impacts that are less visible in an ABM model These can still be identified and the implications can be quantified These secondary impacts can materialize in a number of ways over time including increased cancellation rates selection of more costly but less risky business channels reduced reorder frequencies and volumes and elevated customer churn rates
Predicting which prospects are likely to be most profitable6
Once an existing customerrsquos behavior is known it becomes relatively easy to predict whether that customer is likely to be profitable even without a detailed profit model Of course the potential behavior of prospective customers is an unknown ndash but it is not necessarily unpredictable An analysis linking customer profitability to geo-demographic characteristics allows an analyst to identify prospects with certain determining characteristics We can theorize that these customers are likely to behave in a similar fashion to similar existing customers and become similarly profitable
4 Appendix 2 Risk Incidents Accounting for Occasional Events in Profitability Analyses5 Appendix 3 Risk Incidents Better Understanding the Impact of Process Failures6 Appendix 4 Profitable Customer Acquisition
14
Increase Customer Profitability Using Data Mining and Advanced Analytics
Using analytics to understand customer lifetime value7
One of the significant insights discovered early when customer profitability models are data mined is that customer profitability does not tend to follow a nice smooth incremental path Instead it tends to cluster around customers at different life stages and steps of their relationship with a business To provide a real picture of the potential long-term value of a customer ndash showing the customerrsquos longevity and their likely future ndash analytics incorporates the possibility of significant life-stage changes
Using analytics to develop customer strategy based on profitable behaviors8
Where ABM has been applied to strategy it has typically been focused on structural issues such as how to organize departments to achieve economies of scale or what markets to continue pursuing But for a marketer thinking about customer strategy customer profitability and behavioral analysis should be foundation stones This calls on two aspects previously discussed ndash the characteristics of profitable customers and where a business can find more customers like them However strategy will tend to focus less on the small and unusual customers and more on large groups of customers with similar characteristics
Conclusion
All things considered why speculate and guess at the rank-ordered drivers that differentiate between relatively more- and less-profitable customers Why not apply computer power to do the heavy lifting An additional message is to not perform the analysis as a one-time study but to produce the information at frequent time intervals as a permanent repeatable and reliable production information system
It is true that experienced analysts typically suspect and hypothesize that two or more things are related or that some underlying behavior is driving behavior seen in the data They then search for confirmation and understanding of the relationships In other words the application of analytics is usually more confirmatory than exploratory It is not like finding diamonds in a coal mine One does not simply flog the data until it confesses However in the case of attempting to identify the differentiating traits between more- and less-profitable customers the major traits may not be intuitively obvious to an analyst
The goal is to accelerate the identification of the differentiating drivers so that actions ndash interventions ndash can be considered as a way to get high-payback profit lift from customers The analysts using ABM have benefited from applying online analytical processing (OLAP) multidimension cubes to slice-and-dice data Even greater benefits and better decisions can come from applying data mining and advanced analytics
7 Appendix 5 Customer Equity Analysis
8 Appendix 6 Customer Strategy
Increase Customer Profitability Using Data Mining and Advanced Analytics
15
APPENDIX 1
The Importance of Ratios
One of the critical first steps when analyzing an ABC model is to understand the data and how it needs to be transformed to correctly answer your questions The biggest issue we face is the impact of volume effects (the amount a customer buys) on our analysis and how they can override any other potentially more important analyses This is why one of the first actions often taken is to ldquonormalize the datardquo through the derivation of key ratios that remove the size effects and allow deeper insights to be surfaced
To illustrate this we will use the case of a wholesale business that has some large and some small customers with varying return rates We could consider four customers ndash two large (A and B) and two small (C and D) ndash with two of the customers having high return rates (A and C) and two of the customers having low return rates (B and D) See the table for an illustration
If we then plot this data on two charts one showing net total contribution versus number of returns and the other showing percent of contribution versus percent of return rates we see a dramatically different picture The volume effect overwhelms the return rate effect in the first graph where we plot absolute values giving a potentially misleading message that the number of returns has a positive correlation to profit In the key ratios analysis with the size effects removed the rate of returns can be correctly seen to have a negative impact on profitability
16
Increase Customer Profitability Using Data Mining and Advanced Analytics
Indeed the beloved whale curve diagram (more properly called the profit margin cliff curve) has a tendency to provide a relatively false picture of profitability Because it orders customers on the basis of absolute profit it tends to group all the small customers in the center and place large customers at each end This over-emphasizes these few significant but anomalous customers and leads us to miss potentially critical trends and patterns that can be found in the population at large and which can have a
dramatic impact on profitability
By sizing and ordering our customers based on revenue and by showing profit versus revenue we can transform a relatively benign-looking whale curve into a much more dramatic hook curve As shown below we can now see that we have a whole set of customers who are in fact more profitable than our largest customer even though they generate the most absolute profit And similarly we have a host of customers who are significantly less profitable than our customer who generates the greatest loss It is also quite clear that clearing out our unprofitable customers will not have a dramatic impact on our top line so we will feel free to attack them without worrying too much about the impact on the share price
Increase Customer Profitability Using Data Mining and Advanced Analytics
17
APPENDIX 2
Risk Incidents Accounting for Occasional Events in Profitability Analyses
One of the unfortunate side effects of the periodic nature of an ABC model is that it captures occasional events against a customer in the period that they happen then registers the impact on profitability in that period but provides us with little information about whether that event is likely to recur frequently or infrequently
Examples include things as varied as home moves for energy companies insurance claims warranty claims issuing of new credit cards or mobile handset renewals
When designing our data exploration model we need to adopt a different strategy for these sorts of costs Specifically we need to replace the occasional event or behavior with a marker indicating the probability of the event occurring Typically this would be a direct calculation of the probability of the event occurring for each customer in the period This may be calculated using a number of techniques including logistic regressions neural networks or a decision tree
18
Increase Customer Profitability Using Data Mining and Advanced Analytics
Alternatively we may find a proxy indicator for the risk of the occasional event These are typically geo-demographic indicators but they could also include products (for example car model affecting the probability of a warranty claim) or channel (returns are more likely for mail order than store-purchased products)
Exact choice of approach depends very much upon
bull Theneedsoftheanalysis
bull Theavailabilityofdata
bull Thetoolsavailable
APPENDIX 3
Risk Incidents Better Understanding the Impact of Process Failures
One class of occasional events often has to do with process failures One of the huge benefits of an ABM model is that it makes the true costs of such failures extremely visible But in addition to making the cost visible analytics also gives us the ability to better understand the impact of such failures from the likelihood of them occurring to the long-term impact on customer retention
One example of this occurred at a classified advertising company where a segment of customers were identified who had many advertisement amendment costs but also unusually low revenue due to cancellations
Increase Customer Profitability Using Data Mining and Advanced Analytics
19
Beyond the initial identification of this unusual set of behaviors a technique called survival analysis was applied to the problem This clearly revealed that there was a critical turning point in the customersrsquo relationship with the business at which point they became frustrated enough to cancel their advertisement (See the diagram for more information) With this insight we knew when to set a warning marker on transactions allowing us to review them and determine if a recovery effort was worth engaging in
APPENDIX 4
Profitable Customer Acquisition
While much of this paper has been focused on how we identify which behaviors customers exhibit that make them profitable or not it is not possible to understand how a prospect will behave if we acquire them and therefore whether they are likely to be worth the effort Much work has gone on in sophisticated companies to review expected sales revenues for different demographics But these analyses can be improved even further by moving from analyzing and segmenting based on expected revenue to applying the additional insight available from a customer profitability model This type of model not only has the potential to tell a company what level of profit they may expect from a particular prospect segment but it can also show
bull Howthatgroupislikelytobehave
bull Theproductmixtheymayprefer
bull Thechannelstheymayprefertopurchasethrough
bull Theirtypicalordersizes
bull Whethertheyarelikelytohavepaymentproblemswhichwouldcausepotential impact on the companyrsquos resources (call centers order processing warehouses etc)
20
Increase Customer Profitability Using Data Mining and Advanced Analytics
To achieve this analysis a decision tree is often the most useful tool But rather than applying behaviors to segment the customers we apply demographic indicators ndash and once a segment is identified we overlay that initial analysis with a behavioral analysis
APPENDIX 5
Customer Equity Analysis
The final stage in this process is to move to some form of lifetime value analysis Much of the literature assumes that customers advance on an incremental basis gradually growing over time to buy more and newer products right up to the point at which they leave
However with the much greater depth of knowledge we have on customer behaviors and which ones are significant one of the clear findings is that customers are not generally incremental in nature Instead they tend to be relatively static until they go through some form of state change transformation (such as leaving school getting married or losing a job) With our ability to identify how customers typically behave in each of these states and the propensity of them to move between states we can develop a more realistic approach That approach would be to not look at individual customer lifetime value but to look at the potential value of a particular segment ndash including how it will change over time as new customers are acquired through transfer or acquisition and how they are lost either through transfer or churn The diagram below shows this more realistic model of customer equity analysis
Increase Customer Profitability Using Data Mining and Advanced Analytics
21
APPENDIX 6
Customer Strategy
Where ABM has been applied to strategy it has typically been focused on structural issues how to organize departments to achieve economies of scale and what markets to continue pursuing But for a marketer thinking about their customer strategy customer profitability and behavioral analysis should be foundation stones However this need differs from that of the person looking to identify and understand the sorts of unusual customers who are identified by a decision tree
To understand customers itrsquos important to understand a broad sweep of customer behaviors and to identify large segments of customers with similar patterns of behavior for which they need to develop a strategy For this purpose a technique called cluster analysis becomes invaluable In cluster analysis all business drivers are considered equally important for the segmentation This is unlike a decision tree where there is a clear target variable (typically profitability) and explanatory variables (the key ratios) In cluster analysis all variables are tested and the significant ones that indicate customers with similar patterns of behavior (including things like profitability) are identified and used to segment the customers
With the members of each cluster identified other information can be overlaid on the analysis to deepen the picture and appropriate strategies can be developed In the case of a technology wholesaler six clusters were identified of this four represented the core of the business for which strategies were deployed
22
Increase Customer Profitability Using Data Mining and Advanced Analytics
The first group (PG) was happy to pay for a relatively high service level and consequently was very profitable so a strategy of ldquocuddlerdquo was developed The UNeg group was very similar to the PG group in many ways but a significant portion of their purchase mix involved redundant technology that was sold at a loss but should probably never have still been in stock The strategy here was to ldquocurerdquo this stock management problem and return these customers to profit The core of the business came from those in the PNorm group low-effort customers with an OK margin who we needed to ldquokeeprdquo as customers Finally there was a class of customers called UNorm who asked for the earth but did not want to pay and for those an active ldquocullrdquo strategy was developed Under this strategy they were offered terms that would make them profitable if accepted ndash but if the terms were rejected the wholesaler would no longer supply them
Increase Customer Profitability Using Data Mining and Advanced Analytics
23
About SAS
SAS is the leader in business analytics software and services and the largest independent vendor in the business intelligence market Through innovative solutions delivered within an integrated framework SAS helps customers at more than 50000 sites improve performance and deliver value by making better decisions faster Since 1976SAShasbeengivingcustomersaroundtheworldTHEPOWERTOKNOWreg
SAS Institute Inc World Headquarters +1 919 677 8000To contact your local SAS office please visit wwwsascomoffices
SAS and all other SAS Institute Inc product or service names are registered trademarks or trademarks of SAS Institute Inc in the USA and other countries reg indicates USA registration Other brand and product names are trademarks of their respective companies Copyright copy 2011 SAS Institute Inc All rights reserved 105300_649310811
- Executive Summary
- Three Key Trends Affecting ABM
-
- The Suppliersrsquo Shift from Product-Centric to Customer-Centric
- The Availability of Detailed Data
- Declining Emphasis on Process and Productivity Improvement as a Way to Improve the Bottom Line
- Whither ABM
-
- What So What Then What
-
- From Seeing Costs to Understanding Them
- What Differentiates More-Profitable From Less-Profitable Customers
- How Can a Supplier Determine Differentiating Drivers of Its Profits from Customers
- The Explanatory Investigation Continues hellip and Continues
- Letrsquos Try a Different Approach
- Applying the Computing Power of Data Mining and Advanced Analytics
- Where Does the Analyst Go from Here
- And Therersquos Morehellip
-
- Conclusion
- APPENDIX 1
-
- The Importance of Ratios
-
- APPENDIX 2
-
- Risk Incidents Accounting for Occasional Events in Profitability Analyses
-
- APPENDIX 3
-
- Risk Incidents Better Understanding the Impact of Process Failures
-
- APPENDIX 4
-
- Profitable Customer Acquisition
-
- APPENDIX 5
-
- Customer Equity Analysis
-
- APPENDIX 6
-
- Customer Strategy
-
- About SAS
-

Increase Customer Profitability Using Data Mining and Advanced Analytics
13
Using analytics to better understand the implication of occasional (intermittent) events4
When customer segments are disaggregated down to an individual level one may encounter occasional (ie intermittent) activities associated with a customer (what we might call ldquoriskrdquo incidents) that are unlikely to reoccur on a regular basis but still have a dramatic impact on the potential profitability of that customer An example of this is a customer moving to a new home which is a significant expense for an energy company but one that probably does not happen frequently for the majority of customers For a correct appreciation of the profitability of a customer one needs to not just understand what it costs to process this incident but also the likely probability of it occurring in any given period
Using analytics to understand the nature of process failure5
Any ABM model makes the immediate costs of failure in internal processes extremely visible But in addition to the direct impact of the cost of recovery activities there may be secondary impacts that are less visible in an ABM model These can still be identified and the implications can be quantified These secondary impacts can materialize in a number of ways over time including increased cancellation rates selection of more costly but less risky business channels reduced reorder frequencies and volumes and elevated customer churn rates
Predicting which prospects are likely to be most profitable6
Once an existing customerrsquos behavior is known it becomes relatively easy to predict whether that customer is likely to be profitable even without a detailed profit model Of course the potential behavior of prospective customers is an unknown ndash but it is not necessarily unpredictable An analysis linking customer profitability to geo-demographic characteristics allows an analyst to identify prospects with certain determining characteristics We can theorize that these customers are likely to behave in a similar fashion to similar existing customers and become similarly profitable
4 Appendix 2 Risk Incidents Accounting for Occasional Events in Profitability Analyses5 Appendix 3 Risk Incidents Better Understanding the Impact of Process Failures6 Appendix 4 Profitable Customer Acquisition
14
Increase Customer Profitability Using Data Mining and Advanced Analytics
Using analytics to understand customer lifetime value7
One of the significant insights discovered early when customer profitability models are data mined is that customer profitability does not tend to follow a nice smooth incremental path Instead it tends to cluster around customers at different life stages and steps of their relationship with a business To provide a real picture of the potential long-term value of a customer ndash showing the customerrsquos longevity and their likely future ndash analytics incorporates the possibility of significant life-stage changes
Using analytics to develop customer strategy based on profitable behaviors8
Where ABM has been applied to strategy it has typically been focused on structural issues such as how to organize departments to achieve economies of scale or what markets to continue pursuing But for a marketer thinking about customer strategy customer profitability and behavioral analysis should be foundation stones This calls on two aspects previously discussed ndash the characteristics of profitable customers and where a business can find more customers like them However strategy will tend to focus less on the small and unusual customers and more on large groups of customers with similar characteristics
Conclusion
All things considered why speculate and guess at the rank-ordered drivers that differentiate between relatively more- and less-profitable customers Why not apply computer power to do the heavy lifting An additional message is to not perform the analysis as a one-time study but to produce the information at frequent time intervals as a permanent repeatable and reliable production information system
It is true that experienced analysts typically suspect and hypothesize that two or more things are related or that some underlying behavior is driving behavior seen in the data They then search for confirmation and understanding of the relationships In other words the application of analytics is usually more confirmatory than exploratory It is not like finding diamonds in a coal mine One does not simply flog the data until it confesses However in the case of attempting to identify the differentiating traits between more- and less-profitable customers the major traits may not be intuitively obvious to an analyst
The goal is to accelerate the identification of the differentiating drivers so that actions ndash interventions ndash can be considered as a way to get high-payback profit lift from customers The analysts using ABM have benefited from applying online analytical processing (OLAP) multidimension cubes to slice-and-dice data Even greater benefits and better decisions can come from applying data mining and advanced analytics
7 Appendix 5 Customer Equity Analysis
8 Appendix 6 Customer Strategy
Increase Customer Profitability Using Data Mining and Advanced Analytics
15
APPENDIX 1
The Importance of Ratios
One of the critical first steps when analyzing an ABC model is to understand the data and how it needs to be transformed to correctly answer your questions The biggest issue we face is the impact of volume effects (the amount a customer buys) on our analysis and how they can override any other potentially more important analyses This is why one of the first actions often taken is to ldquonormalize the datardquo through the derivation of key ratios that remove the size effects and allow deeper insights to be surfaced
To illustrate this we will use the case of a wholesale business that has some large and some small customers with varying return rates We could consider four customers ndash two large (A and B) and two small (C and D) ndash with two of the customers having high return rates (A and C) and two of the customers having low return rates (B and D) See the table for an illustration
If we then plot this data on two charts one showing net total contribution versus number of returns and the other showing percent of contribution versus percent of return rates we see a dramatically different picture The volume effect overwhelms the return rate effect in the first graph where we plot absolute values giving a potentially misleading message that the number of returns has a positive correlation to profit In the key ratios analysis with the size effects removed the rate of returns can be correctly seen to have a negative impact on profitability
16
Increase Customer Profitability Using Data Mining and Advanced Analytics
Indeed the beloved whale curve diagram (more properly called the profit margin cliff curve) has a tendency to provide a relatively false picture of profitability Because it orders customers on the basis of absolute profit it tends to group all the small customers in the center and place large customers at each end This over-emphasizes these few significant but anomalous customers and leads us to miss potentially critical trends and patterns that can be found in the population at large and which can have a
dramatic impact on profitability
By sizing and ordering our customers based on revenue and by showing profit versus revenue we can transform a relatively benign-looking whale curve into a much more dramatic hook curve As shown below we can now see that we have a whole set of customers who are in fact more profitable than our largest customer even though they generate the most absolute profit And similarly we have a host of customers who are significantly less profitable than our customer who generates the greatest loss It is also quite clear that clearing out our unprofitable customers will not have a dramatic impact on our top line so we will feel free to attack them without worrying too much about the impact on the share price
Increase Customer Profitability Using Data Mining and Advanced Analytics
17
APPENDIX 2
Risk Incidents Accounting for Occasional Events in Profitability Analyses
One of the unfortunate side effects of the periodic nature of an ABC model is that it captures occasional events against a customer in the period that they happen then registers the impact on profitability in that period but provides us with little information about whether that event is likely to recur frequently or infrequently
Examples include things as varied as home moves for energy companies insurance claims warranty claims issuing of new credit cards or mobile handset renewals
When designing our data exploration model we need to adopt a different strategy for these sorts of costs Specifically we need to replace the occasional event or behavior with a marker indicating the probability of the event occurring Typically this would be a direct calculation of the probability of the event occurring for each customer in the period This may be calculated using a number of techniques including logistic regressions neural networks or a decision tree
18
Increase Customer Profitability Using Data Mining and Advanced Analytics
Alternatively we may find a proxy indicator for the risk of the occasional event These are typically geo-demographic indicators but they could also include products (for example car model affecting the probability of a warranty claim) or channel (returns are more likely for mail order than store-purchased products)
Exact choice of approach depends very much upon
bull Theneedsoftheanalysis
bull Theavailabilityofdata
bull Thetoolsavailable
APPENDIX 3
Risk Incidents Better Understanding the Impact of Process Failures
One class of occasional events often has to do with process failures One of the huge benefits of an ABM model is that it makes the true costs of such failures extremely visible But in addition to making the cost visible analytics also gives us the ability to better understand the impact of such failures from the likelihood of them occurring to the long-term impact on customer retention
One example of this occurred at a classified advertising company where a segment of customers were identified who had many advertisement amendment costs but also unusually low revenue due to cancellations
Increase Customer Profitability Using Data Mining and Advanced Analytics
19
Beyond the initial identification of this unusual set of behaviors a technique called survival analysis was applied to the problem This clearly revealed that there was a critical turning point in the customersrsquo relationship with the business at which point they became frustrated enough to cancel their advertisement (See the diagram for more information) With this insight we knew when to set a warning marker on transactions allowing us to review them and determine if a recovery effort was worth engaging in
APPENDIX 4
Profitable Customer Acquisition
While much of this paper has been focused on how we identify which behaviors customers exhibit that make them profitable or not it is not possible to understand how a prospect will behave if we acquire them and therefore whether they are likely to be worth the effort Much work has gone on in sophisticated companies to review expected sales revenues for different demographics But these analyses can be improved even further by moving from analyzing and segmenting based on expected revenue to applying the additional insight available from a customer profitability model This type of model not only has the potential to tell a company what level of profit they may expect from a particular prospect segment but it can also show
bull Howthatgroupislikelytobehave
bull Theproductmixtheymayprefer
bull Thechannelstheymayprefertopurchasethrough
bull Theirtypicalordersizes
bull Whethertheyarelikelytohavepaymentproblemswhichwouldcausepotential impact on the companyrsquos resources (call centers order processing warehouses etc)
20
Increase Customer Profitability Using Data Mining and Advanced Analytics
To achieve this analysis a decision tree is often the most useful tool But rather than applying behaviors to segment the customers we apply demographic indicators ndash and once a segment is identified we overlay that initial analysis with a behavioral analysis
APPENDIX 5
Customer Equity Analysis
The final stage in this process is to move to some form of lifetime value analysis Much of the literature assumes that customers advance on an incremental basis gradually growing over time to buy more and newer products right up to the point at which they leave
However with the much greater depth of knowledge we have on customer behaviors and which ones are significant one of the clear findings is that customers are not generally incremental in nature Instead they tend to be relatively static until they go through some form of state change transformation (such as leaving school getting married or losing a job) With our ability to identify how customers typically behave in each of these states and the propensity of them to move between states we can develop a more realistic approach That approach would be to not look at individual customer lifetime value but to look at the potential value of a particular segment ndash including how it will change over time as new customers are acquired through transfer or acquisition and how they are lost either through transfer or churn The diagram below shows this more realistic model of customer equity analysis
Increase Customer Profitability Using Data Mining and Advanced Analytics
21
APPENDIX 6
Customer Strategy
Where ABM has been applied to strategy it has typically been focused on structural issues how to organize departments to achieve economies of scale and what markets to continue pursuing But for a marketer thinking about their customer strategy customer profitability and behavioral analysis should be foundation stones However this need differs from that of the person looking to identify and understand the sorts of unusual customers who are identified by a decision tree
To understand customers itrsquos important to understand a broad sweep of customer behaviors and to identify large segments of customers with similar patterns of behavior for which they need to develop a strategy For this purpose a technique called cluster analysis becomes invaluable In cluster analysis all business drivers are considered equally important for the segmentation This is unlike a decision tree where there is a clear target variable (typically profitability) and explanatory variables (the key ratios) In cluster analysis all variables are tested and the significant ones that indicate customers with similar patterns of behavior (including things like profitability) are identified and used to segment the customers
With the members of each cluster identified other information can be overlaid on the analysis to deepen the picture and appropriate strategies can be developed In the case of a technology wholesaler six clusters were identified of this four represented the core of the business for which strategies were deployed
22
Increase Customer Profitability Using Data Mining and Advanced Analytics
The first group (PG) was happy to pay for a relatively high service level and consequently was very profitable so a strategy of ldquocuddlerdquo was developed The UNeg group was very similar to the PG group in many ways but a significant portion of their purchase mix involved redundant technology that was sold at a loss but should probably never have still been in stock The strategy here was to ldquocurerdquo this stock management problem and return these customers to profit The core of the business came from those in the PNorm group low-effort customers with an OK margin who we needed to ldquokeeprdquo as customers Finally there was a class of customers called UNorm who asked for the earth but did not want to pay and for those an active ldquocullrdquo strategy was developed Under this strategy they were offered terms that would make them profitable if accepted ndash but if the terms were rejected the wholesaler would no longer supply them
Increase Customer Profitability Using Data Mining and Advanced Analytics
23
About SAS
SAS is the leader in business analytics software and services and the largest independent vendor in the business intelligence market Through innovative solutions delivered within an integrated framework SAS helps customers at more than 50000 sites improve performance and deliver value by making better decisions faster Since 1976SAShasbeengivingcustomersaroundtheworldTHEPOWERTOKNOWreg
SAS Institute Inc World Headquarters +1 919 677 8000To contact your local SAS office please visit wwwsascomoffices
SAS and all other SAS Institute Inc product or service names are registered trademarks or trademarks of SAS Institute Inc in the USA and other countries reg indicates USA registration Other brand and product names are trademarks of their respective companies Copyright copy 2011 SAS Institute Inc All rights reserved 105300_649310811
- Executive Summary
- Three Key Trends Affecting ABM
-
- The Suppliersrsquo Shift from Product-Centric to Customer-Centric
- The Availability of Detailed Data
- Declining Emphasis on Process and Productivity Improvement as a Way to Improve the Bottom Line
- Whither ABM
-
- What So What Then What
-
- From Seeing Costs to Understanding Them
- What Differentiates More-Profitable From Less-Profitable Customers
- How Can a Supplier Determine Differentiating Drivers of Its Profits from Customers
- The Explanatory Investigation Continues hellip and Continues
- Letrsquos Try a Different Approach
- Applying the Computing Power of Data Mining and Advanced Analytics
- Where Does the Analyst Go from Here
- And Therersquos Morehellip
-
- Conclusion
- APPENDIX 1
-
- The Importance of Ratios
-
- APPENDIX 2
-
- Risk Incidents Accounting for Occasional Events in Profitability Analyses
-
- APPENDIX 3
-
- Risk Incidents Better Understanding the Impact of Process Failures
-
- APPENDIX 4
-
- Profitable Customer Acquisition
-
- APPENDIX 5
-
- Customer Equity Analysis
-
- APPENDIX 6
-
- Customer Strategy
-
- About SAS
-

Increase Customer Profitability Using Data Mining and Advanced Analytics
15
APPENDIX 1
The Importance of Ratios
One of the critical first steps when analyzing an ABC model is to understand the data and how it needs to be transformed to correctly answer your questions The biggest issue we face is the impact of volume effects (the amount a customer buys) on our analysis and how they can override any other potentially more important analyses This is why one of the first actions often taken is to ldquonormalize the datardquo through the derivation of key ratios that remove the size effects and allow deeper insights to be surfaced
To illustrate this we will use the case of a wholesale business that has some large and some small customers with varying return rates We could consider four customers ndash two large (A and B) and two small (C and D) ndash with two of the customers having high return rates (A and C) and two of the customers having low return rates (B and D) See the table for an illustration
If we then plot this data on two charts one showing net total contribution versus number of returns and the other showing percent of contribution versus percent of return rates we see a dramatically different picture The volume effect overwhelms the return rate effect in the first graph where we plot absolute values giving a potentially misleading message that the number of returns has a positive correlation to profit In the key ratios analysis with the size effects removed the rate of returns can be correctly seen to have a negative impact on profitability
16
Increase Customer Profitability Using Data Mining and Advanced Analytics
Indeed the beloved whale curve diagram (more properly called the profit margin cliff curve) has a tendency to provide a relatively false picture of profitability Because it orders customers on the basis of absolute profit it tends to group all the small customers in the center and place large customers at each end This over-emphasizes these few significant but anomalous customers and leads us to miss potentially critical trends and patterns that can be found in the population at large and which can have a
dramatic impact on profitability
By sizing and ordering our customers based on revenue and by showing profit versus revenue we can transform a relatively benign-looking whale curve into a much more dramatic hook curve As shown below we can now see that we have a whole set of customers who are in fact more profitable than our largest customer even though they generate the most absolute profit And similarly we have a host of customers who are significantly less profitable than our customer who generates the greatest loss It is also quite clear that clearing out our unprofitable customers will not have a dramatic impact on our top line so we will feel free to attack them without worrying too much about the impact on the share price
Increase Customer Profitability Using Data Mining and Advanced Analytics
17
APPENDIX 2
Risk Incidents Accounting for Occasional Events in Profitability Analyses
One of the unfortunate side effects of the periodic nature of an ABC model is that it captures occasional events against a customer in the period that they happen then registers the impact on profitability in that period but provides us with little information about whether that event is likely to recur frequently or infrequently
Examples include things as varied as home moves for energy companies insurance claims warranty claims issuing of new credit cards or mobile handset renewals
When designing our data exploration model we need to adopt a different strategy for these sorts of costs Specifically we need to replace the occasional event or behavior with a marker indicating the probability of the event occurring Typically this would be a direct calculation of the probability of the event occurring for each customer in the period This may be calculated using a number of techniques including logistic regressions neural networks or a decision tree
18
Increase Customer Profitability Using Data Mining and Advanced Analytics
Alternatively we may find a proxy indicator for the risk of the occasional event These are typically geo-demographic indicators but they could also include products (for example car model affecting the probability of a warranty claim) or channel (returns are more likely for mail order than store-purchased products)
Exact choice of approach depends very much upon
bull Theneedsoftheanalysis
bull Theavailabilityofdata
bull Thetoolsavailable
APPENDIX 3
Risk Incidents Better Understanding the Impact of Process Failures
One class of occasional events often has to do with process failures One of the huge benefits of an ABM model is that it makes the true costs of such failures extremely visible But in addition to making the cost visible analytics also gives us the ability to better understand the impact of such failures from the likelihood of them occurring to the long-term impact on customer retention
One example of this occurred at a classified advertising company where a segment of customers were identified who had many advertisement amendment costs but also unusually low revenue due to cancellations
Increase Customer Profitability Using Data Mining and Advanced Analytics
19
Beyond the initial identification of this unusual set of behaviors a technique called survival analysis was applied to the problem This clearly revealed that there was a critical turning point in the customersrsquo relationship with the business at which point they became frustrated enough to cancel their advertisement (See the diagram for more information) With this insight we knew when to set a warning marker on transactions allowing us to review them and determine if a recovery effort was worth engaging in
APPENDIX 4
Profitable Customer Acquisition
While much of this paper has been focused on how we identify which behaviors customers exhibit that make them profitable or not it is not possible to understand how a prospect will behave if we acquire them and therefore whether they are likely to be worth the effort Much work has gone on in sophisticated companies to review expected sales revenues for different demographics But these analyses can be improved even further by moving from analyzing and segmenting based on expected revenue to applying the additional insight available from a customer profitability model This type of model not only has the potential to tell a company what level of profit they may expect from a particular prospect segment but it can also show
bull Howthatgroupislikelytobehave
bull Theproductmixtheymayprefer
bull Thechannelstheymayprefertopurchasethrough
bull Theirtypicalordersizes
bull Whethertheyarelikelytohavepaymentproblemswhichwouldcausepotential impact on the companyrsquos resources (call centers order processing warehouses etc)
20
Increase Customer Profitability Using Data Mining and Advanced Analytics
To achieve this analysis a decision tree is often the most useful tool But rather than applying behaviors to segment the customers we apply demographic indicators ndash and once a segment is identified we overlay that initial analysis with a behavioral analysis
APPENDIX 5
Customer Equity Analysis
The final stage in this process is to move to some form of lifetime value analysis Much of the literature assumes that customers advance on an incremental basis gradually growing over time to buy more and newer products right up to the point at which they leave
However with the much greater depth of knowledge we have on customer behaviors and which ones are significant one of the clear findings is that customers are not generally incremental in nature Instead they tend to be relatively static until they go through some form of state change transformation (such as leaving school getting married or losing a job) With our ability to identify how customers typically behave in each of these states and the propensity of them to move between states we can develop a more realistic approach That approach would be to not look at individual customer lifetime value but to look at the potential value of a particular segment ndash including how it will change over time as new customers are acquired through transfer or acquisition and how they are lost either through transfer or churn The diagram below shows this more realistic model of customer equity analysis
Increase Customer Profitability Using Data Mining and Advanced Analytics
21
APPENDIX 6
Customer Strategy
Where ABM has been applied to strategy it has typically been focused on structural issues how to organize departments to achieve economies of scale and what markets to continue pursuing But for a marketer thinking about their customer strategy customer profitability and behavioral analysis should be foundation stones However this need differs from that of the person looking to identify and understand the sorts of unusual customers who are identified by a decision tree
To understand customers itrsquos important to understand a broad sweep of customer behaviors and to identify large segments of customers with similar patterns of behavior for which they need to develop a strategy For this purpose a technique called cluster analysis becomes invaluable In cluster analysis all business drivers are considered equally important for the segmentation This is unlike a decision tree where there is a clear target variable (typically profitability) and explanatory variables (the key ratios) In cluster analysis all variables are tested and the significant ones that indicate customers with similar patterns of behavior (including things like profitability) are identified and used to segment the customers
With the members of each cluster identified other information can be overlaid on the analysis to deepen the picture and appropriate strategies can be developed In the case of a technology wholesaler six clusters were identified of this four represented the core of the business for which strategies were deployed
22
Increase Customer Profitability Using Data Mining and Advanced Analytics
The first group (PG) was happy to pay for a relatively high service level and consequently was very profitable so a strategy of ldquocuddlerdquo was developed The UNeg group was very similar to the PG group in many ways but a significant portion of their purchase mix involved redundant technology that was sold at a loss but should probably never have still been in stock The strategy here was to ldquocurerdquo this stock management problem and return these customers to profit The core of the business came from those in the PNorm group low-effort customers with an OK margin who we needed to ldquokeeprdquo as customers Finally there was a class of customers called UNorm who asked for the earth but did not want to pay and for those an active ldquocullrdquo strategy was developed Under this strategy they were offered terms that would make them profitable if accepted ndash but if the terms were rejected the wholesaler would no longer supply them
Increase Customer Profitability Using Data Mining and Advanced Analytics
23
About SAS
SAS is the leader in business analytics software and services and the largest independent vendor in the business intelligence market Through innovative solutions delivered within an integrated framework SAS helps customers at more than 50000 sites improve performance and deliver value by making better decisions faster Since 1976SAShasbeengivingcustomersaroundtheworldTHEPOWERTOKNOWreg
SAS Institute Inc World Headquarters +1 919 677 8000To contact your local SAS office please visit wwwsascomoffices
SAS and all other SAS Institute Inc product or service names are registered trademarks or trademarks of SAS Institute Inc in the USA and other countries reg indicates USA registration Other brand and product names are trademarks of their respective companies Copyright copy 2011 SAS Institute Inc All rights reserved 105300_649310811
- Executive Summary
- Three Key Trends Affecting ABM
-
- The Suppliersrsquo Shift from Product-Centric to Customer-Centric
- The Availability of Detailed Data
- Declining Emphasis on Process and Productivity Improvement as a Way to Improve the Bottom Line
- Whither ABM
-
- What So What Then What
-
- From Seeing Costs to Understanding Them
- What Differentiates More-Profitable From Less-Profitable Customers
- How Can a Supplier Determine Differentiating Drivers of Its Profits from Customers
- The Explanatory Investigation Continues hellip and Continues
- Letrsquos Try a Different Approach
- Applying the Computing Power of Data Mining and Advanced Analytics
- Where Does the Analyst Go from Here
- And Therersquos Morehellip
-
- Conclusion
- APPENDIX 1
-
- The Importance of Ratios
-
- APPENDIX 2
-
- Risk Incidents Accounting for Occasional Events in Profitability Analyses
-
- APPENDIX 3
-
- Risk Incidents Better Understanding the Impact of Process Failures
-
- APPENDIX 4
-
- Profitable Customer Acquisition
-
- APPENDIX 5
-
- Customer Equity Analysis
-
- APPENDIX 6
-
- Customer Strategy
-
- About SAS
-

Increase Customer Profitability Using Data Mining and Advanced Analytics
17
APPENDIX 2
Risk Incidents Accounting for Occasional Events in Profitability Analyses
One of the unfortunate side effects of the periodic nature of an ABC model is that it captures occasional events against a customer in the period that they happen then registers the impact on profitability in that period but provides us with little information about whether that event is likely to recur frequently or infrequently
Examples include things as varied as home moves for energy companies insurance claims warranty claims issuing of new credit cards or mobile handset renewals
When designing our data exploration model we need to adopt a different strategy for these sorts of costs Specifically we need to replace the occasional event or behavior with a marker indicating the probability of the event occurring Typically this would be a direct calculation of the probability of the event occurring for each customer in the period This may be calculated using a number of techniques including logistic regressions neural networks or a decision tree
18
Increase Customer Profitability Using Data Mining and Advanced Analytics
Alternatively we may find a proxy indicator for the risk of the occasional event These are typically geo-demographic indicators but they could also include products (for example car model affecting the probability of a warranty claim) or channel (returns are more likely for mail order than store-purchased products)
Exact choice of approach depends very much upon
bull Theneedsoftheanalysis
bull Theavailabilityofdata
bull Thetoolsavailable
APPENDIX 3
Risk Incidents Better Understanding the Impact of Process Failures
One class of occasional events often has to do with process failures One of the huge benefits of an ABM model is that it makes the true costs of such failures extremely visible But in addition to making the cost visible analytics also gives us the ability to better understand the impact of such failures from the likelihood of them occurring to the long-term impact on customer retention
One example of this occurred at a classified advertising company where a segment of customers were identified who had many advertisement amendment costs but also unusually low revenue due to cancellations
Increase Customer Profitability Using Data Mining and Advanced Analytics
19
Beyond the initial identification of this unusual set of behaviors a technique called survival analysis was applied to the problem This clearly revealed that there was a critical turning point in the customersrsquo relationship with the business at which point they became frustrated enough to cancel their advertisement (See the diagram for more information) With this insight we knew when to set a warning marker on transactions allowing us to review them and determine if a recovery effort was worth engaging in
APPENDIX 4
Profitable Customer Acquisition
While much of this paper has been focused on how we identify which behaviors customers exhibit that make them profitable or not it is not possible to understand how a prospect will behave if we acquire them and therefore whether they are likely to be worth the effort Much work has gone on in sophisticated companies to review expected sales revenues for different demographics But these analyses can be improved even further by moving from analyzing and segmenting based on expected revenue to applying the additional insight available from a customer profitability model This type of model not only has the potential to tell a company what level of profit they may expect from a particular prospect segment but it can also show
bull Howthatgroupislikelytobehave
bull Theproductmixtheymayprefer
bull Thechannelstheymayprefertopurchasethrough
bull Theirtypicalordersizes
bull Whethertheyarelikelytohavepaymentproblemswhichwouldcausepotential impact on the companyrsquos resources (call centers order processing warehouses etc)
20
Increase Customer Profitability Using Data Mining and Advanced Analytics
To achieve this analysis a decision tree is often the most useful tool But rather than applying behaviors to segment the customers we apply demographic indicators ndash and once a segment is identified we overlay that initial analysis with a behavioral analysis
APPENDIX 5
Customer Equity Analysis
The final stage in this process is to move to some form of lifetime value analysis Much of the literature assumes that customers advance on an incremental basis gradually growing over time to buy more and newer products right up to the point at which they leave
However with the much greater depth of knowledge we have on customer behaviors and which ones are significant one of the clear findings is that customers are not generally incremental in nature Instead they tend to be relatively static until they go through some form of state change transformation (such as leaving school getting married or losing a job) With our ability to identify how customers typically behave in each of these states and the propensity of them to move between states we can develop a more realistic approach That approach would be to not look at individual customer lifetime value but to look at the potential value of a particular segment ndash including how it will change over time as new customers are acquired through transfer or acquisition and how they are lost either through transfer or churn The diagram below shows this more realistic model of customer equity analysis
Increase Customer Profitability Using Data Mining and Advanced Analytics
21
APPENDIX 6
Customer Strategy
Where ABM has been applied to strategy it has typically been focused on structural issues how to organize departments to achieve economies of scale and what markets to continue pursuing But for a marketer thinking about their customer strategy customer profitability and behavioral analysis should be foundation stones However this need differs from that of the person looking to identify and understand the sorts of unusual customers who are identified by a decision tree
To understand customers itrsquos important to understand a broad sweep of customer behaviors and to identify large segments of customers with similar patterns of behavior for which they need to develop a strategy For this purpose a technique called cluster analysis becomes invaluable In cluster analysis all business drivers are considered equally important for the segmentation This is unlike a decision tree where there is a clear target variable (typically profitability) and explanatory variables (the key ratios) In cluster analysis all variables are tested and the significant ones that indicate customers with similar patterns of behavior (including things like profitability) are identified and used to segment the customers
With the members of each cluster identified other information can be overlaid on the analysis to deepen the picture and appropriate strategies can be developed In the case of a technology wholesaler six clusters were identified of this four represented the core of the business for which strategies were deployed
22
Increase Customer Profitability Using Data Mining and Advanced Analytics
The first group (PG) was happy to pay for a relatively high service level and consequently was very profitable so a strategy of ldquocuddlerdquo was developed The UNeg group was very similar to the PG group in many ways but a significant portion of their purchase mix involved redundant technology that was sold at a loss but should probably never have still been in stock The strategy here was to ldquocurerdquo this stock management problem and return these customers to profit The core of the business came from those in the PNorm group low-effort customers with an OK margin who we needed to ldquokeeprdquo as customers Finally there was a class of customers called UNorm who asked for the earth but did not want to pay and for those an active ldquocullrdquo strategy was developed Under this strategy they were offered terms that would make them profitable if accepted ndash but if the terms were rejected the wholesaler would no longer supply them
Increase Customer Profitability Using Data Mining and Advanced Analytics
23
About SAS
SAS is the leader in business analytics software and services and the largest independent vendor in the business intelligence market Through innovative solutions delivered within an integrated framework SAS helps customers at more than 50000 sites improve performance and deliver value by making better decisions faster Since 1976SAShasbeengivingcustomersaroundtheworldTHEPOWERTOKNOWreg
SAS Institute Inc World Headquarters +1 919 677 8000To contact your local SAS office please visit wwwsascomoffices
SAS and all other SAS Institute Inc product or service names are registered trademarks or trademarks of SAS Institute Inc in the USA and other countries reg indicates USA registration Other brand and product names are trademarks of their respective companies Copyright copy 2011 SAS Institute Inc All rights reserved 105300_649310811
- Executive Summary
- Three Key Trends Affecting ABM
-
- The Suppliersrsquo Shift from Product-Centric to Customer-Centric
- The Availability of Detailed Data
- Declining Emphasis on Process and Productivity Improvement as a Way to Improve the Bottom Line
- Whither ABM
-
- What So What Then What
-
- From Seeing Costs to Understanding Them
- What Differentiates More-Profitable From Less-Profitable Customers
- How Can a Supplier Determine Differentiating Drivers of Its Profits from Customers
- The Explanatory Investigation Continues hellip and Continues
- Letrsquos Try a Different Approach
- Applying the Computing Power of Data Mining and Advanced Analytics
- Where Does the Analyst Go from Here
- And Therersquos Morehellip
-
- Conclusion
- APPENDIX 1
-
- The Importance of Ratios
-
- APPENDIX 2
-
- Risk Incidents Accounting for Occasional Events in Profitability Analyses
-
- APPENDIX 3
-
- Risk Incidents Better Understanding the Impact of Process Failures
-
- APPENDIX 4
-
- Profitable Customer Acquisition
-
- APPENDIX 5
-
- Customer Equity Analysis
-
- APPENDIX 6
-
- Customer Strategy
-
- About SAS
-
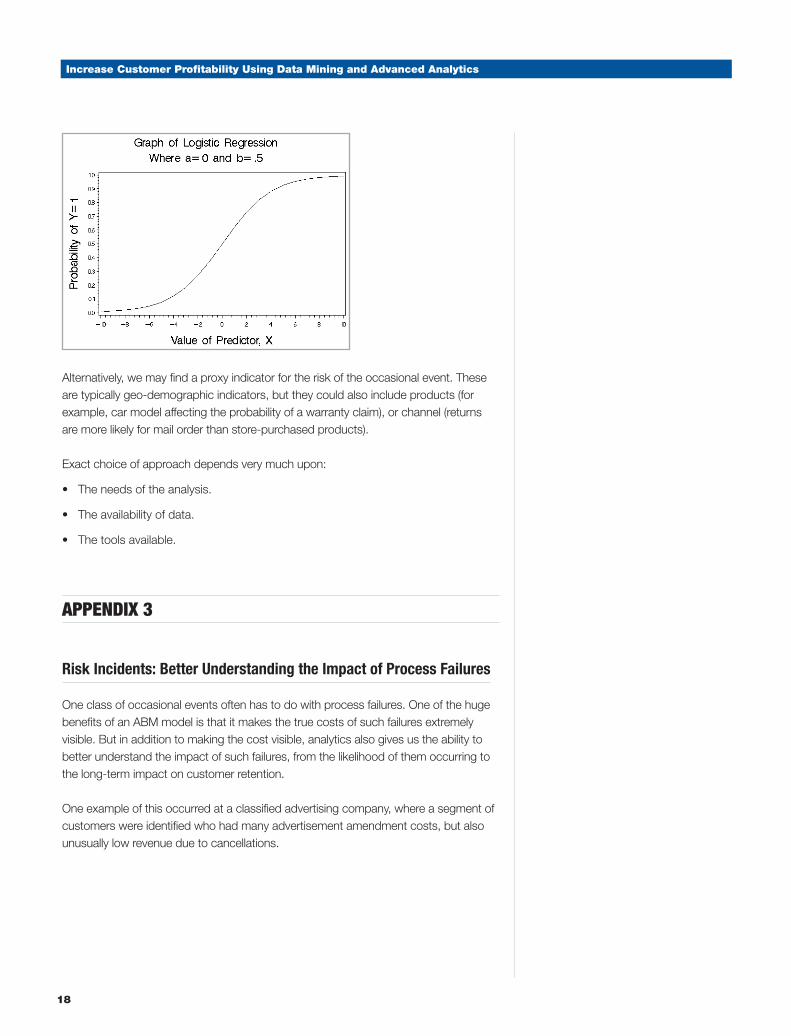

Increase Customer Profitability Using Data Mining and Advanced Analytics
19
Beyond the initial identification of this unusual set of behaviors a technique called survival analysis was applied to the problem This clearly revealed that there was a critical turning point in the customersrsquo relationship with the business at which point they became frustrated enough to cancel their advertisement (See the diagram for more information) With this insight we knew when to set a warning marker on transactions allowing us to review them and determine if a recovery effort was worth engaging in
APPENDIX 4
Profitable Customer Acquisition
While much of this paper has been focused on how we identify which behaviors customers exhibit that make them profitable or not it is not possible to understand how a prospect will behave if we acquire them and therefore whether they are likely to be worth the effort Much work has gone on in sophisticated companies to review expected sales revenues for different demographics But these analyses can be improved even further by moving from analyzing and segmenting based on expected revenue to applying the additional insight available from a customer profitability model This type of model not only has the potential to tell a company what level of profit they may expect from a particular prospect segment but it can also show
bull Howthatgroupislikelytobehave
bull Theproductmixtheymayprefer
bull Thechannelstheymayprefertopurchasethrough
bull Theirtypicalordersizes
bull Whethertheyarelikelytohavepaymentproblemswhichwouldcausepotential impact on the companyrsquos resources (call centers order processing warehouses etc)
20
Increase Customer Profitability Using Data Mining and Advanced Analytics
To achieve this analysis a decision tree is often the most useful tool But rather than applying behaviors to segment the customers we apply demographic indicators ndash and once a segment is identified we overlay that initial analysis with a behavioral analysis
APPENDIX 5
Customer Equity Analysis
The final stage in this process is to move to some form of lifetime value analysis Much of the literature assumes that customers advance on an incremental basis gradually growing over time to buy more and newer products right up to the point at which they leave
However with the much greater depth of knowledge we have on customer behaviors and which ones are significant one of the clear findings is that customers are not generally incremental in nature Instead they tend to be relatively static until they go through some form of state change transformation (such as leaving school getting married or losing a job) With our ability to identify how customers typically behave in each of these states and the propensity of them to move between states we can develop a more realistic approach That approach would be to not look at individual customer lifetime value but to look at the potential value of a particular segment ndash including how it will change over time as new customers are acquired through transfer or acquisition and how they are lost either through transfer or churn The diagram below shows this more realistic model of customer equity analysis
Increase Customer Profitability Using Data Mining and Advanced Analytics
21
APPENDIX 6
Customer Strategy
Where ABM has been applied to strategy it has typically been focused on structural issues how to organize departments to achieve economies of scale and what markets to continue pursuing But for a marketer thinking about their customer strategy customer profitability and behavioral analysis should be foundation stones However this need differs from that of the person looking to identify and understand the sorts of unusual customers who are identified by a decision tree
To understand customers itrsquos important to understand a broad sweep of customer behaviors and to identify large segments of customers with similar patterns of behavior for which they need to develop a strategy For this purpose a technique called cluster analysis becomes invaluable In cluster analysis all business drivers are considered equally important for the segmentation This is unlike a decision tree where there is a clear target variable (typically profitability) and explanatory variables (the key ratios) In cluster analysis all variables are tested and the significant ones that indicate customers with similar patterns of behavior (including things like profitability) are identified and used to segment the customers
With the members of each cluster identified other information can be overlaid on the analysis to deepen the picture and appropriate strategies can be developed In the case of a technology wholesaler six clusters were identified of this four represented the core of the business for which strategies were deployed
22
Increase Customer Profitability Using Data Mining and Advanced Analytics
The first group (PG) was happy to pay for a relatively high service level and consequently was very profitable so a strategy of ldquocuddlerdquo was developed The UNeg group was very similar to the PG group in many ways but a significant portion of their purchase mix involved redundant technology that was sold at a loss but should probably never have still been in stock The strategy here was to ldquocurerdquo this stock management problem and return these customers to profit The core of the business came from those in the PNorm group low-effort customers with an OK margin who we needed to ldquokeeprdquo as customers Finally there was a class of customers called UNorm who asked for the earth but did not want to pay and for those an active ldquocullrdquo strategy was developed Under this strategy they were offered terms that would make them profitable if accepted ndash but if the terms were rejected the wholesaler would no longer supply them
Increase Customer Profitability Using Data Mining and Advanced Analytics
23
About SAS
SAS is the leader in business analytics software and services and the largest independent vendor in the business intelligence market Through innovative solutions delivered within an integrated framework SAS helps customers at more than 50000 sites improve performance and deliver value by making better decisions faster Since 1976SAShasbeengivingcustomersaroundtheworldTHEPOWERTOKNOWreg
SAS Institute Inc World Headquarters +1 919 677 8000To contact your local SAS office please visit wwwsascomoffices
SAS and all other SAS Institute Inc product or service names are registered trademarks or trademarks of SAS Institute Inc in the USA and other countries reg indicates USA registration Other brand and product names are trademarks of their respective companies Copyright copy 2011 SAS Institute Inc All rights reserved 105300_649310811
- Executive Summary
- Three Key Trends Affecting ABM
-
- The Suppliersrsquo Shift from Product-Centric to Customer-Centric
- The Availability of Detailed Data
- Declining Emphasis on Process and Productivity Improvement as a Way to Improve the Bottom Line
- Whither ABM
-
- What So What Then What
-
- From Seeing Costs to Understanding Them
- What Differentiates More-Profitable From Less-Profitable Customers
- How Can a Supplier Determine Differentiating Drivers of Its Profits from Customers
- The Explanatory Investigation Continues hellip and Continues
- Letrsquos Try a Different Approach
- Applying the Computing Power of Data Mining and Advanced Analytics
- Where Does the Analyst Go from Here
- And Therersquos Morehellip
-
- Conclusion
- APPENDIX 1
-
- The Importance of Ratios
-
- APPENDIX 2
-
- Risk Incidents Accounting for Occasional Events in Profitability Analyses
-
- APPENDIX 3
-
- Risk Incidents Better Understanding the Impact of Process Failures
-
- APPENDIX 4
-
- Profitable Customer Acquisition
-
- APPENDIX 5
-
- Customer Equity Analysis
-
- APPENDIX 6
-
- Customer Strategy
-
- About SAS
-

Increase Customer Profitability Using Data Mining and Advanced Analytics
21
APPENDIX 6
Customer Strategy
Where ABM has been applied to strategy it has typically been focused on structural issues how to organize departments to achieve economies of scale and what markets to continue pursuing But for a marketer thinking about their customer strategy customer profitability and behavioral analysis should be foundation stones However this need differs from that of the person looking to identify and understand the sorts of unusual customers who are identified by a decision tree
To understand customers itrsquos important to understand a broad sweep of customer behaviors and to identify large segments of customers with similar patterns of behavior for which they need to develop a strategy For this purpose a technique called cluster analysis becomes invaluable In cluster analysis all business drivers are considered equally important for the segmentation This is unlike a decision tree where there is a clear target variable (typically profitability) and explanatory variables (the key ratios) In cluster analysis all variables are tested and the significant ones that indicate customers with similar patterns of behavior (including things like profitability) are identified and used to segment the customers
With the members of each cluster identified other information can be overlaid on the analysis to deepen the picture and appropriate strategies can be developed In the case of a technology wholesaler six clusters were identified of this four represented the core of the business for which strategies were deployed
22
Increase Customer Profitability Using Data Mining and Advanced Analytics
The first group (PG) was happy to pay for a relatively high service level and consequently was very profitable so a strategy of ldquocuddlerdquo was developed The UNeg group was very similar to the PG group in many ways but a significant portion of their purchase mix involved redundant technology that was sold at a loss but should probably never have still been in stock The strategy here was to ldquocurerdquo this stock management problem and return these customers to profit The core of the business came from those in the PNorm group low-effort customers with an OK margin who we needed to ldquokeeprdquo as customers Finally there was a class of customers called UNorm who asked for the earth but did not want to pay and for those an active ldquocullrdquo strategy was developed Under this strategy they were offered terms that would make them profitable if accepted ndash but if the terms were rejected the wholesaler would no longer supply them
Increase Customer Profitability Using Data Mining and Advanced Analytics
23
About SAS
SAS is the leader in business analytics software and services and the largest independent vendor in the business intelligence market Through innovative solutions delivered within an integrated framework SAS helps customers at more than 50000 sites improve performance and deliver value by making better decisions faster Since 1976SAShasbeengivingcustomersaroundtheworldTHEPOWERTOKNOWreg
SAS Institute Inc World Headquarters +1 919 677 8000To contact your local SAS office please visit wwwsascomoffices
SAS and all other SAS Institute Inc product or service names are registered trademarks or trademarks of SAS Institute Inc in the USA and other countries reg indicates USA registration Other brand and product names are trademarks of their respective companies Copyright copy 2011 SAS Institute Inc All rights reserved 105300_649310811
- Executive Summary
- Three Key Trends Affecting ABM
-
- The Suppliersrsquo Shift from Product-Centric to Customer-Centric
- The Availability of Detailed Data
- Declining Emphasis on Process and Productivity Improvement as a Way to Improve the Bottom Line
- Whither ABM
-
- What So What Then What
-
- From Seeing Costs to Understanding Them
- What Differentiates More-Profitable From Less-Profitable Customers
- How Can a Supplier Determine Differentiating Drivers of Its Profits from Customers
- The Explanatory Investigation Continues hellip and Continues
- Letrsquos Try a Different Approach
- Applying the Computing Power of Data Mining and Advanced Analytics
- Where Does the Analyst Go from Here
- And Therersquos Morehellip
-
- Conclusion
- APPENDIX 1
-
- The Importance of Ratios
-
- APPENDIX 2
-
- Risk Incidents Accounting for Occasional Events in Profitability Analyses
-
- APPENDIX 3
-
- Risk Incidents Better Understanding the Impact of Process Failures
-
- APPENDIX 4
-
- Profitable Customer Acquisition
-
- APPENDIX 5
-
- Customer Equity Analysis
-
- APPENDIX 6
-
- Customer Strategy
-
- About SAS
-