a model to increase profitability by ensuring a reliable
TRANSCRIPT

Degree project
A model to increase profitability by
ensuring a reliable flow of information
within the product development process:
A case study
En modell för ökad lönsamhet genom säkerställande av
tillförlitliga informationsflöden i produktutvecklingsprocessen:
En fallstudie
Author: Henric Sjörén, Erik Thun
Supervisor: Anders Ingwald
Examiner: Basim Al-Najjar
External Supervisor: Bo Larsson,
Gemba Consulting AB
Date: 2014-05-28
Course Code: 2SE09E, 15 credits
Subject: Terotechnology
Level: Bachelor
Department of Mechanical Engineering

SAMMANFATTNING
II
Sammanfattning
This section contains a summary of the thesis written in Swedish.
Studier har visat att det är viktigt för företag, aktiva i olika branscher, att
kontinuerligt förbättra sina produktutvecklingsprocesser på ett
kostnadseffektivt sätt, för att bibehålla sin konkurrenskraft samt öka
lönsamhet. Tillgängliga förbättringsmodeller, t.ex. Plan Do Study Act
(PDSA), Define Measure Analyse Improve Control (DMAIC) and Identify
Define Develop Optimize Verify (IDDOV), är antingen för generella eller
för specifika, och ingen av dem tar hänsyn till informationsflöden. Således
är ingen av dessa lämplig att använda för förbättring av en
produktutvecklingsprocess med avseende på ett tillförlitligt
informationsflöde. Varpå, är syftet med denna studie att utveckla en modell
för att systematiskt säkerställa ett tillförlitligt informationsflöde genom att
identifiera och åtgärda rotorsaker till problem i informationsflödet, vilket
säkerställer tillfredsställda kunder, minskade kostnader och ökade intäkter.
Resultatet av studien är en modell och ett verktyg, som har testats empiriskt
i ett fallföretag och visat sig lämplig för att effektivisera
produktutvecklingsprocesser genom att säkerställa ett tillförlitligt
informationsflöde. Applicering av modellen identifierade tre problem i
informationsflödet: språkbarriärer, vertikal organisering samt bristande
media för kommunikation. Lösningar till problemen har tagits fram genom
logiska resonemang och tillsammans med rekommendationer ger de en god
indikation om den positiva effekt på lönsamhet som ett tillförlitligt
informationsflöde i produktutvecklingsprocessen kan ha.

SUMMARY
III
Summary
This section contains a summary of the thesis written in English.
Studies have shown it is necessary for companies active in various industries
to continuously, and cost-effectively, improve their product development
process, in order to stay competitive and increase profitability. Existing
improvement models, e.g. Plan Do Study Act (PDSA), Define Measure
Analyse Improve Control (DMAIC), Identify Define Develop Optimize
Verify (IDDOV), are either too general or too specific, and none
incorporates improvement of information flows. Consequently, none is
suitable for improving a product development process with respect to
reliable information flows. Hence, the purpose of this study is to develop a
model for systematically ensuring a reliable flow of information, by
identifying and solving problem root-causes in the information flow. This
ensures satisfied customers, reduced costs, and increased profits. Result of
the study is a model and tool, tested empirically in a case company, proved
suitable for streamlining product development processes, by ensuring a
reliable flow of information. Application of the model identified three
problems within the information flow: language barriers, vertical
organization, and lack of suitable media for communication. Solutions to the
problems has been concluded on through logical reasoning and together with
recommendations provides a good indication of the positive effect on
profitability, which a reliable flow of information within the product
development process can have.
ACKNOWLEDGEMENT
IV
Acknowledgement
In this section, the authors thank contributors to the thesis.
We who are the authors, two Terotechnology-students at Linnaeus
University, Växjö, have written this bachelor’s thesis as our final work
before graduating from the Human Resource and Industrial Management
programme.
However, a work of such magnitude is not a two-man job. We have had
tremendous help from a number of persons and organizations, both inside
and outside of the university, to whom we now would like to extend our
appreciation. Order of appearance is without importance.
Our sincerest gratitude towards:
− Our tutor, Anders Ingwald at Linnaeus University, for his guidance,
inspiration, and tireless positive spirit through both ups and downs.
− Our company tutor, Bo Larsson at Gemba Consulting, for his
commitment and making this study possible.
− Anna Hammarstedt at Emballator Växjöplast and Roland Engnell
at Emballator Lagan Plast, for their commitment and sharing
invaluable time, information, and knowledge with us.
− Members of corporate network Polymernet, for participating in
interesting seminars and presentations.
− Our examiner and tutor of the first chapter, Prof. Basim Al-Najjar
at Linnaeus University, for sharing his experiences and knowledge
with us.
− Employees of Emballator Växjöplast and Emballator Lagan Plast
participating in interviews and providing insights.
− Teachers and students who have reviewed and provided feedback
of the thesis.
Växjö, 2014-05-28.
Henric Sjörén Erik Thun

KEY DEFINITIONS
V
Key definitions
In the following list, definitions to terms frequently used in the thesis are
presented. Some terms may have different meaning depending on context and it
is therefore important to state which definition is used.
Communication – “two-way process of reaching mutual understanding, in
which participants not only exchange (encode-decode) information, news,
ideas and feelings but also create and share meaning” (Business Dictionary,
2014)
Continuous improvement – the idea that development of a product or
service is never finished and can always be better (Bergman & Klefsjö,
2010)
Cost-effectiveness – “Relationship between monetary inputs and the desired
outcome” (Business Dictionary, 2014)
Customer – “a party that receives or consumes products (goods or
services)” (Business Dictionary, 2014)
Data – a collection of values of e.g. different events, activities, or
transactions, which are stored without a context (Pearlson & Saunders,
2010)
Function – “an action performed by a device, department, or person that
produces a result” (Business Dictionary, 2014)
Information – processed data, used in a context in which it provides value
for the data consumer (Pearlson & Saunders, 2010)
Organization – “[…] a social system that is deliberately designed to
achieve set goals” (Jacobsen & Thorsvik, 2008, p. 13)
Process – “[…] a network of repeated activities with the purpose of creating
value for an external or internal customer” (Bergman & Klefsjö, 2012, p.
457)
Product development process – procedures, extending from initial idea to
finished prototype of a product (Hill, 2005)
Profitability – an indicator of financial success in a company (Keramidou,
et al., 2013)
Quality – ability to satisfy, and preferably exceed, the customer’s needs and
expectations (Bergman & Klefsjö, 2012)
KEY DEFINITIONS
VI
Reliability – the ability of an item to perform its intended function on
demand without failures (Business Dictionary, 2014)
Supplier – “a party that supplies goods or services” (Business Dictionary,
2014)
ABBREVIATIONS
VII
Abbreviations
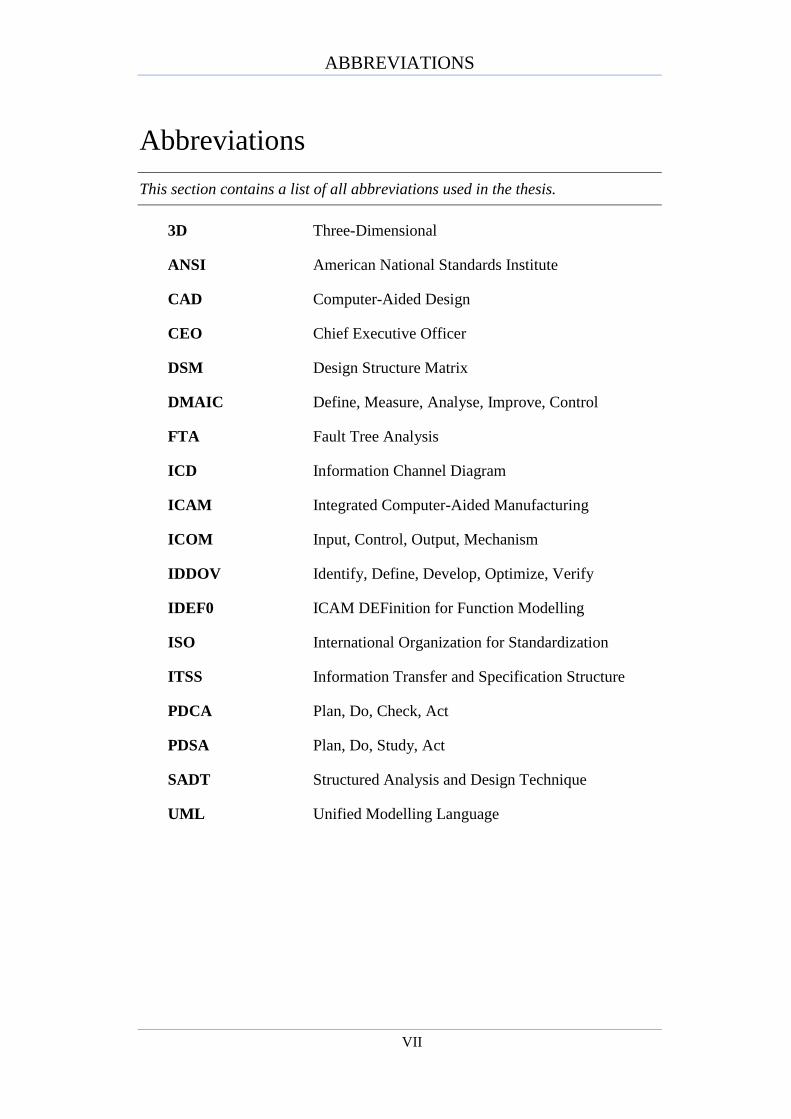
This section contains a list of all abbreviations used in the thesis.
3D Three-Dimensional
ANSI American National Standards Institute
CAD Computer-Aided Design
CEO Chief Executive Officer
DSM Design Structure Matrix
DMAIC Define, Measure, Analyse, Improve, Control
FTA Fault Tree Analysis
ICD Information Channel Diagram
ICAM Integrated Computer-Aided Manufacturing
ICOM Input, Control, Output, Mechanism
IDDOV Identify, Define, Develop, Optimize, Verify
IDEF0 ICAM DEFinition for Function Modelling
ISO International Organization for Standardization
ITSS Information Transfer and Specification Structure
PDCA Plan, Do, Check, Act
PDSA Plan, Do, Study, Act
SADT Structured Analysis and Design Technique
UML Unified Modelling Language

TABLE OF CONTENTS
VIII
Table of Contents
1 Introduction .................................................................................................... 1 1.1 Background ...................................................................................................... 1 1.2 Problem discussion .......................................................................................... 2 1.3 Problem presentation ....................................................................................... 3 1.4 Problem formulation ........................................................................................ 3 1.5 Purpose ............................................................................................................ 3 1.6 Relevance......................................................................................................... 4 1.7 Delimitation/Limitations ................................................................................. 4 1.8 Time frame ...................................................................................................... 5
2 Methodology ................................................................................................... 6 2.1 Scientific perspective ....................................................................................... 6 2.2 Scientific approach .......................................................................................... 7 2.3 Scientific methodologies ................................................................................. 8 2.4 Scientific strategies .......................................................................................... 9 2.5 Primary and secondary data ........................................................................... 10 2.6 Data gathering ................................................................................................ 11 2.7 Data verification ............................................................................................ 12 2.8 Our research ................................................................................................... 13
3 Theory ........................................................................................................... 15 3.1 Process: Theoretical description .................................................................... 15 3.1.1 Process flowchart ........................................................................................... 15 3.1.2 The customer/supplier model ........................................................................ 16 3.1.3 Product development process ........................................................................ 16 3.2 Plan Do Study Act ......................................................................................... 18 3.3 Information quality & flow ............................................................................ 19 3.4 Tools for modelling function relationships .................................................... 21 3.4.1 ICAM Definition for Function Modelling ..................................................... 21 3.4.2 Design Structure Matrix ................................................................................ 22 3.5 Cost-effectiveness and profitability ............................................................... 23 3.6 Fault Tree Analysis ........................................................................................ 24 3.7 Checklists: Theoretical description ................................................................ 25 3.8 Organization: Theoretical description ........................................................... 25 3.8.1 Organizational goals, visions and strategies .................................................. 26 3.8.2 Organizational structures ............................................................................... 27
4 Model development ...................................................................................... 29 4.1 Model introduction and theoretical inspiration .............................................. 29 4.2 Model presentation ........................................................................................ 30 4.3 Information Transfer and Specification Structure ......................................... 33 4.4 Approach for model application .................................................................... 35
TABLE OF CONTENTS
IX
5 Empirical findings ........................................................................................ 38 5.1 Emballator ..................................................................................................... 38 5.2 Lagan Plast .................................................................................................... 38 5.2.1 Goals and vision ............................................................................................ 38 5.2.2 Product development at Laganplast ............................................................... 39 5.3 Växjöplast ...................................................................................................... 41 5.3.1 Goals and vision ............................................................................................ 42 5.3.2 Product development at Växjöplast ............................................................... 42
6 Model testing ................................................................................................ 45 6.1 Step 1. Plan and document process ................................................................ 45 6.2 Step 2. Observation of product development process .................................... 45 6.3 Step 3. Evaluation of information flow ......................................................... 46 6.4 Step 4. Identification of problem root-causes ................................................ 47 6.5 Step 5. Determination of suitable improvements........................................... 51 6.6 Step 6. Implementation of improvements in next process ............................. 54
7 Results ........................................................................................................... 55 7.1 General study results ..................................................................................... 55 7.2 Results of model application ......................................................................... 55
8 Conclusions and Recommendations ........................................................... 59 8.1 Conclusions: Solving the formulated problem .............................................. 59 8.2 Criticism of the model ................................................................................... 60 8.3 Future research .............................................................................................. 60 8.4 Comparison of case companies ..................................................................... 61 8.5 Recommendations ......................................................................................... 62
9 References ..................................................................................................... 63
Appendix I : Literature review
Appendix II : Lagan Plast Product development process
Appendix III : Växjöplast Product development process

LIST OF FIGURES
X
List of Figures FIGURE 2.1. OUR RESEARCH.................................................................................................. 14 FIGURE 3.1. PROCESS FLOWCHART ..................................................................................... 16 FIGURE 3.2. CUSTOMER/SUPPLIER MODEL........................................................................ 16 FIGURE 3.3. PRODUCT DEVELOPMENT PROCESS (JESPERSEN, 2012) .......................... 17 FIGURE 3.4. COST OF CHANGES DURING A PRODUCT DEVELOPMENT PROCESS ... 17 FIGURE 3.5. PLAN DO STUDY ACT CYCLE ......................................................................... 18 FIGURE 3.6. ICAM DEFINITION FOR FUNCTION MODELLING ....................................... 22 FIGURE 3.7. ACTIVITY RELATIONS (CRONEMYR, ET AL., 2001, P. 179) ........................ 22 FIGURE 3.8. FAULT TREE ANALYSIS ................................................................................... 24 FIGURE 3.9. GOAL HIERARCHY (JACOBSEN & THORSVIK, 2008) .................................. 26 FIGURE 3.10. LINE STRUCTURE FOR A FUNCTIONAL ORGANIZATION ...................... 27 FIGURE 3.11. MATRIX STRUCTURE OF A PROJECT ORGANIZATION ........................... 28 FIGURE 4.1. MODEL FOR ENSURING A RELIABLE INFORMATION FLOW ................... 30 FIGURE 4.2. INFORMATION TRANSFER AND SPECIFICATION STRUCTURE .............. 34 FIGURE 4.3. SUGGESTED APPROACH FOR MODEL APPLICATION ............................... 35 FIGURE 5.1. DOCUMENTED PRODUCT DEVELOPMENT PROCESS, LAGAN PLAST ... 39 FIGURE 5.2. DOCUMENTED PRODUCT DEVELOPMENT PROCESS, VÄXJÖPLAST ..... 42 FIGURE 6.1. FAULT-TREE ANALYSIS OF PROBLEM ROOT-CAUSES ............................. 48 FIGURE 6.2. FAULT-TREE ANALYSIS OF PROBLEM ROOT-CAUSES ............................. 49 FIGURE 6.3. FAULT-TREE ANALYSIS OF PROBLEM ROOT-CAUSES ............................. 50 FIGURE 6.4. FAULT-TREE ANALYSIS OF HOW TO ERASE LANGUAGE BARRIERS ... 52 FIGURE 6.5. FAULT-TREE ANALYSIS OF DISCARD VERTICAL ORGANIZATION ....... 53
List of Tables TABLE 1.1. TIME FRAME ........................................................................................................... 5 TABLE 3.1. DESIGN STRUCTURE MATRIX (EPPINGER, 2001, P. 151) ............................. 23 TABLE 5.1. DESIGN STRUCTURE MATRIX DOCUMENTED PROCESS LAGAN PLAST41 TABLE 5.2. DESIGN STRUCTURE MATRIX DOCUMENTED PROCESS VÄXJÖPLAST . 44 TABLE 6.1. CHECKLIST OF INFORMATION FLOW EXPERIENCES ................................. 46 TABLE 6.2. DESIGN STRUCTURE MATRIX ACTUAL PROCESS VÄXJÖPLAST ............ 47 TABLE 7.1. SIGNIFICANT ROOT-CAUSES ............................................................................ 55 TABLE 7.2. SOLUTIONS TO ERASE LANGUAGE BARRIERS ............................................ 56 TABLE 7.3. SOLUTIONS TO DISCARD VERTICAL ORGANIZATION ............................... 57 TABLE 8.1. DESIGN STRUCTURE MATRIX, RECOMMENDED IMPROVEMENTS ........ 62
List of Equations EQUATION 3.1. PROFITABILITY ............................................................................................ 23 EQUATION 3.2. COST-EFFECTIVENESS (AL-NAJJAR, 1997, P. 21) ................................... 24

INTRODUCTION
1
1 Introduction
This section contains a discussion and presentation of the problem and the
underlying background information. Practical and theoretical relevance is
presented, as is the purpose and delimitations. The section also contains a
preliminary time frame for the study.
1.1 Background
Economic profits, or profitability, is a usual measurement of financial
success amongst companies in today’s business environment and describes
the relationship between revenue and expenses (Keramidou, et al., 2013). A
high level of profitability can be achieved by increasing revenues,
decreasing expenses or by combining the both (Bergman & Klefsjö, 2012).
Companies active in today’s age of globalisation, characterised by intense
competition, are forced to find new ways of diminishing inefficiencies in
order to retain their competitive position in the market (Keramidou, et al.,
2013). There are according to Alsyouf (2007) two types of competitive
advantages; value and cost. Preferably, a company should possess both in
order to be in the most advantageous position and such advantages can be
gained in different ways. Reducing cost for utilized resources, by
minimizing failures and shortages, is a possible route and can be achieved
by running different kinds of process improvement projects (Bergman &
Klefsjö, 2012). Enhancing customer satisfaction is also a possible way.
Staying competitive is key for company survival and an organization’s
success or failure is dependent on its ability to attract new and keep existing
customers (Sharma & Gadenne, 2008). It is highly dependable on a
company’s ability to satisfy customer needs regarding multiple factors, e.g.
costs and quality (Sharma & Gadenne, 2008). Studies have shown strong
correlations between high quality products, services and profitability
(Sharma & Gadenne, 2008). Furthermore, Griffin & Page (1996) states
customer satisfaction can be achieved by introducing new products.
McNally et al. (2011) identifies product innovation as an important
component for ensuring sustainable growth in companies and it is said by
Nolsøe Grünbaum & Stenger (2013) that innovation is a prerequisite for
retaining competitive advantages. Griffin & Page (1996) states that
repeatedly commercializing successful new products is essential for staying
competitive in the market. The concept of developing new products can be
identified as a process, as defined by Bergman & Klefsjö (2012, p. 457) “a
network of activities, repeated in time, with the purpose of creating value for
internal and external customers”. As with any other concept, it is possible to
adjust and tune the product development process to reduce costs and better
utilize resources. According to McNally, et al. (2011) product development
is associated with high risks and failure rates, thus putting more emphasizes
INTRODUCTION
2
on improving the product development process and ensuring its quality. By
identifying success factors for development of new products, company
management can ensure good financial and market performance and it
allows them to venture into previously unknown business opportunities
(McNally, et al., 2011).
Product development is a complex process, which can serve many purposes
and achieve many goals. Even though hardships and difficulties may be
encountered and the process is complex, Griffin & Page (1996, p. 480)
states, “when revenue growth is desired, product development may be used
as the vehicle to attract a new customer or market segment”.
1.2 Problem discussion
The importance of product development is considered to form the basis for
sustainable growth and competitive advantage in companies. Still, the
product development process is hard for companies to perform with
successful results (Nolsøe Grünbaum & Stenger, 2013); (McNally, et al.,
2011). According to Graner & Mißler-Behr (2012) the success rate of
processes for new product development remains low and failure rates for
newly launched products exceed 60%. Such alarming figures, combined
with the amount of required venture capital, are considered a major risk for
companies when conducting product development projects (McNally, et al.,
2011). Consequently, it is of vital managerial concern to identify different
factors e.g. time, quality and expense, contributing to successful launch of a
product (McNally, et al., 2011).
Majava et al. (2013) states that product development is a cross-functional
effort in which most company functions participate, not only design,
marketing and manufacturing, which is a common misconception. For new
products to be successful, it is important that all functions maintain high
quality communication. Jespersen (2012) describes new products as a
function of its development process. The process is described as a path
created based on information provided in each step of the process. The
impact of communication on product quality is further strengthened by
McNally et al. (2011) who states information integration exhibits both direct
and indirect effects on improved product quality. Information integration is
explained as sharing, paying attention to, and challenging information and
perspectives between team-members to generate new product insights
(McNally, et al., 2011).
In order to maintain successful communication within a company there has
to be a will to communicate among the different functions. Lu & Botha
(2006) explain an example on how product engineers are unwilling of
sharing preliminary information to process engineers due to negative
feedback on their fuzzy designs. Consequently, the degree of segregation
between the two functions will increase. A two-way communication is
INTRODUCTION
3
described as essential for a continuously updated development phase with
respect to solving problems as early as possible. The reverse information
flow provides feedback to product designers, which in turn will evolve the
product design information (Lu & Botha, 2006). However, there is a risk of
distancing the final product from the original idea without dependencies in
the information (Jespersen, 2012). Information permeates the entire business
and is a vital part of all company processes.
There are several different models for process improvement, which main
purpose is to enhance and streamline processes. Some methods can be
considered general, are applicable in several different situations, and are
more of philosophical nature, which advocates an approach or way of work.
Other models consist of more specified stages with clearly specified tools to
use within the different steps of the process (Bergman & Klefsjö, 2012).
Information is an essential part of a process, regardless of which kind of
process improvement model that is used. Every model relies on that the flow
of information is working in order to achieve a successful outcome of the
process (Durugbo, et al., 2013). However, it is not specified in any existing
model how the flow of information should be handled for the entire process.
1.3 Problem presentation
There is no perfect product development process and there are always
possibilities for improvement. It is therefore important to find suitable ways
of conducting improvements. Models used for process improvement may be
either general or specific but regardless the reliability and flow of
information are essential factors to consider. Using an improvement model
that disregards information may lead to sub-optimized results, as it does not
account for one of the most important factors information flow and
reliability. Lacking information quality may distance the product from what
was intended and having a sub-optimized product development processes
will negatively affect customer satisfaction, which affects profitability.
1.4 Problem formulation
How to streamline product development processes with respect to a reliable
information flow?
1.5 Purpose
To develop a model for systematically ensuring a reliable flow of
information within product development processes in order to satisfy
customer needs and demands, streamline the process, reduce costs, and
increase profitability.

INTRODUCTION
4
1.6 Relevance
Durugbo, et al. (2013) state that information is as vital for organizations as
oxygen is for human life, and it is a critical factor in determining growth of
companies. Flow of information is according to Durugbo, et al. (2013) the
core of the product development process. Accordingly, it is relevant to find
ways for cost-effectively ensuring a reliable flow of information within in
the product development process, in order to satisfy customer needs and
demands, increases profitability.
Existing models for process improvement, e.g. PDSA, DMAIC and IDDOV,
create a good foundation for improvement work (Bergman & Klefsjö, 2012).
Some are however too general while others too specific and very few, if any,
takes information flow and information reliability into consideration,
resulting in repudiation of a key component. E.g., Information Channel
Diagrams (ICD) developed by Durugbo, et al. (2013) provides a tool for
modelling information flows but it does not consider different information
parameters or reliability. It is therefore relevant to develop a model that from
a holistic perspective of the product development process can describe how
reliable information should flow through the process.
A literature review, available in Appendix I, was conducted to see if there
has been previous research regarding reliable information flows in product
development processes. No articles addressing the subject of reliable
information and information flows within the entire product development
process were found, which strengthens the relevance of this study as it
addresses a previously un-researched area.
During this project a set of actions relevant to an industrial company, e.g.
process mapping and identification of deficiencies in communication, will
be performed. The developed model will allow the company to streamline
the process by ensuring a reliable flow of information, which positively
affects profitability. The model will be susceptible to modifications, making
it applicable in other cases with similar or identical traits, which further
consolidates the relevance.
1.7 Delimitation/Limitations
The result will consist of improvement suggestions in order to streamline the
model further. The study will be delimited to gathering empirical data from
two companies with associated product development processes. The model
will be limited and adjusted to one company and analysed accordingly.
However, the design of the model will be in such a way so that other
companies can adjust it to fit their product development process.
INTRODUCTION
5
The study will focus on the product development process and flow of
information, and will be limited to cover the steps between identification of
customer needs to complete prototype.
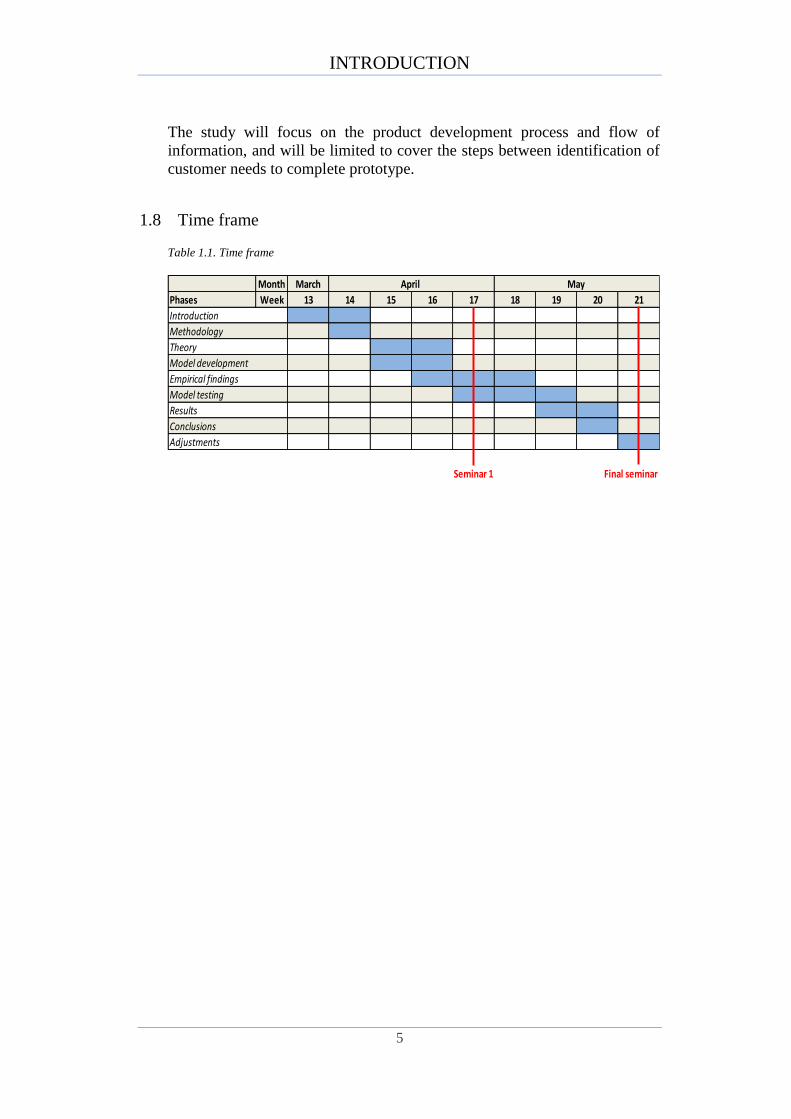
1.8 Time frame
Table 1.1. Time frame
Month March
Phases Week 13 14 15 16 17 18 19 20 21
Seminar 1 Final seminar
Model development
Empirical findings
April May
Introduction
Methodology
Theory
Model testing
Results
Conclusions
Adjustments
METHODOLOGY
6
2 Methodology
This section contains information about different scientific perspectives,
approaches, methodologies, and strategies. It also includes information about
data gathering and verification.
2.1 Scientific perspective
According to Patel & Davidson (2011) a scientific study can be conducted
from different perspectives, depending on which scientific area a researcher
is active within. Knowledge about which perspective is used is essential
when taking part of and criticising produced knowledge, with regard to
chosen scientific approach. Positivism and hermeneutics are two such
perspectives.
Positivism
According to Patel & Davidson (2011) positivism has its origins in an
empirical and natural scientific tradition. Positivistic researchers strive to
generate knowledge positive, enriching to humanity, and receptive to human
mind and senses. Positive knowledge is useful and can improve society.
Patel & Davidson (2011); Bryman & Bell (2011) states positive knowledge
should be based on observations and gathered facts logically provable.
Positivism supports a homogenous view of science advocating all science
should fundamentally be built in the same way, so called scientific monism.
Knowledge should consist of general laws formed in a formal, logical, and
neutral way, describing interactive relationships of causes and effects.
Accordingly, positivistic hypotheses and theories are often expressed in
mathematic formulas (Patel & Davidson, 2011).
Hermeneutics
Hermeneutics is by Patel & Davidson (2011) stated to be the complete
opposite of positivism. A scientific perspective and interpretation where
researchers study interpret and gain understanding of the founding
prerequisites for human existence. It is the predominant perspective within
cultural, human and social science. Hermeneutic researchers strive to gain
understanding about humans and their life situations through interpreting
how human existence is expressed in written and spoken language as well as
in actions and manifestations. Hermeneutics is often associated with
qualitative models whilst positivism is associated to quantitative models
(Patel & Davidson, 2011).
This thesis aims to produce both new knowledge and understanding within
and about the subject, resulting in a perspective between hermeneutic and
positivistic.

METHODOLOGY
7
2.2 Scientific approach
Researchers seek to produce theories that give as accurate knowledge about
reality as possible. Accordingly, data and information about the studied part
of reality is used as foundation. In science, the foundation is identified as
empirical information and a researcher’s mission is to relate theories and
empirical information to each other. When conducting a study there are three
different approaches applicable for relating theoretical and empirical
information (Patel & Davidson, 2011), deduction, induction and abduction,
which will be described more thoroughly in the following sections.
Deduction
According to Patel & Davidson (2011); Jacobsen (2002) the deductive
approach uses available theory to draw conclusions about a specific
phenomenon. Previous research determines necessary relevant information
and hypothesis are derived from existing theory empirically examined in a
specific case. A deductive approach enhances objectivity and is to a low
degree influenced by the subjective apprehensions of the individual author.
A disadvantage is that use of existing theories will implicate the study in a
way that created theories disregards, or does not discover new findings.
(Patel & Davidson, 2011).
Induction
An inductive approach is according to Patel & Davidson (2011) exploratory
and empirical information is gathered without regard to expectations or
hypothesis. The information is systematised and used as foundation for
creating a theory. The objective of the inductive approach is for the
individual researcher to be able to gather any data without constrictions. A
negative aspect is the lack of generalisation as theories are based on findings
from one specific case with certain parameters, e.g. a certain group of people
or within a certain time frame. Furthermore, researchers working inductively
have own conceptions influencing the theories created, regardless the effort
to be unbiased (Patel & Davidson, 2011).
Abduction
The abductive approach is essentially a combination of deductive and
inductive approaches. Initially a hypothetic pattern explaining a specific case
is formulated. This step has inductive characteristics. Following, the
researcher works deductively and the hypothesis is tested in other cases.
Accordingly, further development, of the original hypothesis to be more
generally applicable, is possible. The abductive approach does not constrict
researchers as much as other approaches, which is advantageous. A risk is
however, that researchers will unconsciously study cases and formulate
hypotheses based on experience, excluding alternative interpretations (Patel
& Davidson, 2011).

METHODOLOGY
8
This thesis will have an abductive approach as it uses existing theories and
empirical information as basis for developing a model, which later is tested
empirically.
2.3 Scientific methodologies
In order to achieve desired results from research there has to be a choice of
which method to use when conducting the study. According to Holme &
Solvang (1997) methods consists of qualitative and quantitative research,
and a combination of the two. The choice of which method to use shall be
strategically decided upon based on purpose, problem formulation and
resources of the study. Previous research experience could also be
considered. Each method has advantages and disadvantages making them
suitable for different kinds of studies. However, it is not common both
methods could be applicable for the specific study. In order to choose which
method to use it is necessary to identify what the desired result of the
research is (Holme & Solvang, 1997).
The different scientific methodologies are explained more thoroughly in the
following sections.
Quantitative research
Quantitative research is described by Bryman (1997) as a method for
gathering quantifiable information presented as a numerical value.
Quantitative research is often associated with survey studies, where
quantifiable data is gathered from a significant amount of individuals in
order to find results representing the whole group. Another example of
quantitative research is structured observations where researchers quantify
information according to a set scheme (Bryman, 1997). The result of
quantitative research is a conversion of given information into numbers and
quantities from which statistical analysis are conducted (Holme & Solvang,
1997).
Qualitative research
The qualitative research method is characterized by being conducted close to
the object of research, studying it from an inside perspective. The researcher
is required to be acquainted with the situation in order to understand it from
the object’s point of view (Holme & Solvang, 1997). The philosophical
assumption of qualitative research methods is stated by Merriam (1998, p. 6)
as “[…] reality is constructed by individuals interacting with their social
worlds”. This is described as a contrast to the quantitative research method
by studying experience, as different individuals perceive it, and not only
numbers.
METHODOLOGY
9
The main method for conducting qualitative research is participating
observations in which the researcher gets a profound picture of the research
area and its actors. Another example is unstructured interviews in which
researchers has minimum amount of involvement in order to give more
space to respondents (Bryman, 1997).
Combination of quantitative and qualitative research methodologies
It is stated by Holme & Solvang (1997) that no right research method can be
used for all situations. Different methods should be considered as equal tools
to gain better understanding of a specific situation, where the advantages and
disadvantages of each method cancel each other out.
The combination of quantitative and qualitative research methods can be
conducted in several different ways. Holme & Solvang (1997) describes two
of these combinations. One combination uses qualitative research as
preparation for quantitative research, where the qualitative part acts as a
phase of understanding the situation. A second combination uses
quantitative research as preliminary investigation to find factors to focus on
for qualitative research.
The thesis will use qualitative research, based on observations and
interviews, in order to analyse relationships and gain understanding
regarding the current situation within the organisation.
2.4 Scientific strategies
Good research is not achievable by persistently following a set of rules.
Researchers face many choices and alternatives where strategic decisions
have to be made. There is no correct way but there are strategies more
suitable to handle certain issues than others. A strategy should be chosen
based on its suitability in solving certain problems or answer certain
questions (Denscombe, 2009).
Case study
Case studies are according to Denscombe (2009) focused around the
occurrence of certain phenomena with purpose of providing in-depth
information about actions, relationships, experiences and processes existing
in a certain case. Case studies allow researchers to study objects in detail,
making it suitable when studying complex processes and relationships,
enabling researchers to deal with a case in its entirety. The true value of case
studies is, according to Denscombe (2009), the explanation as to why certain
results have developed, rather than concluding which results have
developed. One advantage of case studies is versatility. It allows researchers
to use different types of sources, data and methods for data gathering,
observations, interviews and questionnaire, making use of both quantitative
METHODOLOGY
10
and qualitative methods. It is however hard to generalise results achieved in
case studies, as they are only applicable to the specific case or cases with
very similar characteristics (Denscombe, 2009).
Experiment
Experiment is an empirical analysis designed to examine the properties and
condition of specific factors in controlled environment. Experiments are
according to Denscombe (2009) the basic principle for research within
natural science. Experiments are conducted in order to isolate individual
factors and study them and their effects in detail with the purpose of
discovering new conditions and properties or to test existing theories.
Successful experiments rely on three key factors; identifying cause factors,
control key variables, careful meticulous observation and measuring
(Denscombe, 2009).
Survey study
Survey-based studies are according to Denscombe (2009) multifaceted, can
be conducted in many ways and make use of multiple research methods e.g.
interviews, questionnaires and observations. Surveys aim to obtain
information from samples of a population and present results representative
to the entire population. It is important to carefully choose sample in order
to ensure results conforms to the entire population. Surveys aim to depict
conditions and relations of the present in an instantaneous picture and are
due to their nature suitable for both quantitative and qualitative research,
however slightly more attractive to quantitative researchers (Denscombe,
2009).
The thesis will use a case study as it enables gaining in-depth information
about the studied phenomena and promotes understanding of why a result
has develop rather than concluding on what result has developed.
2.5 Primary and secondary data
According to Holme & Solvang (1997) sources of data can be described as
historical documents of researchers’ knowledge and perception derived from
the origin of a specific situation. Sources for data gathering are divided into
primary and secondary sources. Primary sources are experiences
documented directly by the researcher, e.g. through observations or
interviews. Secondary sources refer to situations where data is gathered or
documented by someone else and further utilized by the researcher.
Examples of secondary data are information gathered from literature reviews
(Holme & Solvang, 1997); (Patel & Davidson, 2011).

METHODOLOGY
11
2.6 Data gathering
There are several different techniques for gathering data and information.
The purpose of data gathering is to gain knowledge in the field of research,
enabling performance of a study (Patel & Davidson, 2011). In following
sections three techniques for data gathering will be explained.
Observation
Merriam (1998); Patel & Davidson (2011) describe observations as a natural
behaviour of humans, performed in their everyday life. For observations to
be considered a research tool it has to fulfil a purpose and not be performed
on random. Merriam (1998) further explains that observations offers a first-
hand experience of situations, which, combined with other data gathering
techniques, offers a holistic interpretation of the research area. A participant
observation, referred to as fieldwork, allows researchers to study situations
and their actors in natural environment and provides information based on
reality (Merriam, 1998) (Patel & Davidson, 2011).
Interview
Interviews are a technique for gathering data based on questions. According
to Patel & Davidson (2011) an interview is normally referred to as personal
meetings where researchers and respondents meet face to face while the
respondent answer questions from the researcher. The purpose of interviews
is to obtain information known by somebody else. In order to obtain
satisfying results it is important that researchers conduct interviews with
focus on the respondent so that they are able and willing to share knowledge.
Important factors to focus on could be; anonymity for the respondent,
correct formulated questions for desired results, and general motivation for
the respondent to answer questions (Merriam, 1998).
Literature review
Researchers perform literature reviews in order to gain knowledge about
previous research in the field; to secure the study is unique. Further, authors
can gain experience in methods suitable and not suitable for a specific
research area (Merriam, 1998).
Patel & Davidson (2011) describes literature as the most common source of
knowledge. Examples of literature are books, published articles, documents
and reports, which have suitable characteristics for different situations. E.g.,
books often consist of authors’ attempts to compile known information
about a specific topic based on previous research in the specific area.
Studying books is considered the easiest way to find fully developed
theories and models. Published articles contain the latest research on the
market as they are published faster than a book, making them suitable for
METHODOLOGY
12
finding new and possibly untested models or theories (Patel & Davidson,
2011).
The thesis will incorporate observations, interviews and a literature review
as measures for empirical and theoretical data gathering. Interviews and
observations are suitable due to the investigative nature of the study and the
literature review provides a theoretical foundation.
2.7 Data verification
According to Denscombe (2009) verification of data is of outmost
importance. A researcher must be able to prove achieved results are ‘right’
and veracious. The quality of results should not be taken for granted and to
be trustworthy, research has to prove that it conform to methods and
approaches identified as basis for proper research. According to Denscombe
(2009) there are four basic factors to consider when determining quality of
research, validity, reliability, generalizability, and objectivity.
Validity
Validity refers to accuracy and precision of data and its suitability with
regard to investigated research questions. According to Lincoln & Guba
(1985) there is no way for qualitative researchers to prove that their results
are authentic. However, there are measures that can be taken to convince the
audience that results with reasonable trustworthiness are exact and precise:
− Triangulation by using and comparing multiple contrasting sources
regarding the same data allows confirmation of trustworthiness.
− Validation of respondents allows researchers to revisit respondents
with data and results as a way of controlling validity of results.
− Using established data and base results on empirical data gives solid
foundation for drawing trustworthy conclusions.
It is not possible to give guarantees regarding validity of a study, but it is
possible to ensure data has been produced and controlled following good
practice (Denscombe, 2009).
Reliability
According to Merriam (1998) research reliability refers to what extent a
report could be repeated with identical results, based on assumptions that
there is only one existing reality with one correct answer. Accordingly, it is
possible to identify studies with high reliability based on studies in the same
research, by comparing if results are similar. To compare reliability between
quantitative studies is easy as results often consist of numbers (Merriam,
1998). Qualitative studies are considered harder to compare as their results
are affected by human behaviour, which change over time. To identify

METHODOLOGY
13
reliability when conducting qualitative studies it is required to analyse
provided information with respect to background of a specific situation,
during the time of study. Consequently, it is more interesting the answer to a
question is reflecting the unique situation rather than the answer being the
same as last time (Patel & Davidson, 2011).
Objectivity
Objectivity refers to of what degree qualitative researchers can produce
results without affecting them. It is a complex question, as research cannot
be conducted without influence from its facilitator. Qualitative data is
according to Denscombe (2009) always the product of an interpretation
process. It is important for qualitative researchers to have an open mind and
rather try to falsify their results than verifying them. This can be done by
accepting data not conforming to analysis and by controlling contradicting
explanations or solutions (Denscombe, 2009).
Generalizability
According to Bryman & Bell (2011) quantitative researchers often want to
state results can be generalized, thus not being confined to the particular
studied case. It is said by Denscombe (2009) that such statements often are
met with doubt and questions how it is possible to make generalisations
based on small amounts. Another term for generalizability is external
validity, which is defined by Lincoln & Guba (1985, p. 291) as “the
approximate validity with which we infer that the presumed causal
relationship can be generalized to and across alternate measures of the cause
and effect and across different types of persons, settings and times”.
Accordingly, a study made form a sample would be general to an entire
population (Lincoln & Guba, 1985).
According to Lincoln & Guba (1985) there are problems when studies
consider both validity and generalizability as they are in a trade-off situation.
Controls implemented to ensure validity are opposed by generalization.
Lincoln & Guba (1985) argues that due to contradictions the question should
be re-focused from generalizability to transferability. Transferability
requires knowledge about context regarding the studied object and the object
on which result will be applied. In order for transferability to be possible, it
is necessary to consider the representativeness of objects and identify their
defining factors in order to compare and see if they conform to each other
(Lincoln & Guba, 1985).
2.8 Our research
The thesis will have its foundation in a case study with abductive research
approach made from a perspective between positivistic and hermeneutic.
The developed model will be based on existing theories and empirical
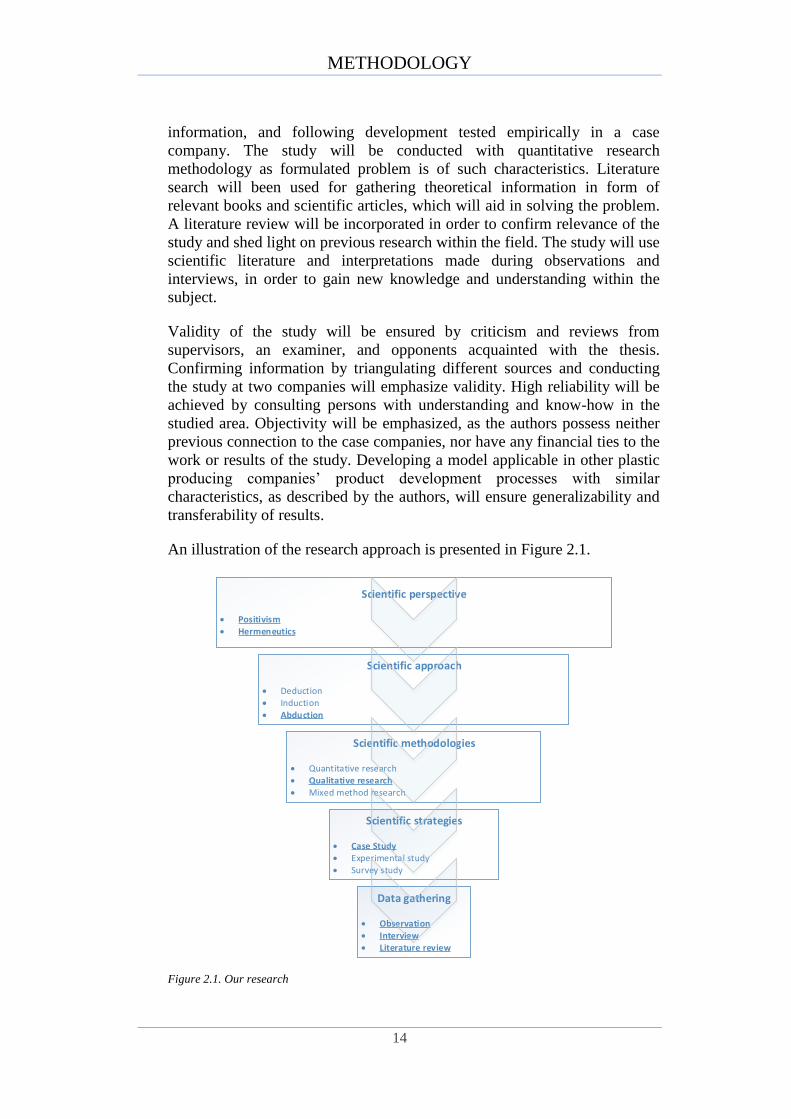
METHODOLOGY
14
information, and following development tested empirically in a case
company. The study will be conducted with quantitative research
methodology as formulated problem is of such characteristics. Literature
search will been used for gathering theoretical information in form of
relevant books and scientific articles, which will aid in solving the problem.
A literature review will be incorporated in order to confirm relevance of the
study and shed light on previous research within the field. The study will use
scientific literature and interpretations made during observations and
interviews, in order to gain new knowledge and understanding within the
subject.
Validity of the study will be ensured by criticism and reviews from
supervisors, an examiner, and opponents acquainted with the thesis.
Confirming information by triangulating different sources and conducting
the study at two companies will emphasize validity. High reliability will be
achieved by consulting persons with understanding and know-how in the
studied area. Objectivity will be emphasized, as the authors possess neither
previous connection to the case companies, nor have any financial ties to the
work or results of the study. Developing a model applicable in other plastic
producing companies’ product development processes with similar
characteristics, as described by the authors, will ensure generalizability and
transferability of results.
An illustration of the research approach is presented in Figure 2.1.
Scientific perspective
Positivism Hermeneutics
Scientific approach
Deduction Induction Abduction
Scientific methodologies
Quantitative research Qualitative research Mixed method research
Scientific strategies
Case Study Experimental study Survey study
Data gathering
Observation Interview Literature review
Figure 2.1. Our research

THEORY
15
3 Theory
This section presents necessary theoretical concepts and methods used in the
thesis in order to solve the formulated problem.
3.1 Process: Theoretical description
According to Rentzhog (1998) processes refine objects into results and are
defined by Bergman & Klefsjö (2012, p. 457) as “[…] a network of repeated
activities with the purpose of creating value for an external or internal
customer”, e.g. manufacturing of products. Raw material is acquired and
transformed into a result, through a series of activities and mechanisms. A
number of factors can characterize a process. It has beginning and end,
customer and supplier, it consists of a chain of ingoing activities, it produces
value-adding results, and it is repeated in time (Rentzhog, 1998; Bergman &
Klefsjö, 2012). The purpose of each activity is to satisfy its customer with
minimal use of resources e.g. time, energy and information. Within
companies, processes are often divided into three categories: main, support
and management processes. Product development is an example of a main
process, which purpose is to create value for customers in order to create
revenues for the company (Bergman & Klefsjö, 2012). Processes are often
depicted as mechanical but according to Bergman & Klefsjö (2012) it is a
question of teamwork and collaboration between humans, including
exchange of information, which should be emphasized as most improvement
opportunities exist within administrative work (Bergman & Klefsjö, 2012).
Process owners are appointed by management in order to facilitate process
improvement, development, and has strategic responsibility of the process
and making sure the process flows with as little friction as possible
(Bergman & Klefsjö, 2012).
3.1.1 Process flowchart
Understanding of processes is important before attempting to improve them
and can be gained by using flowcharts (Bergman & Klefsjö, 2012).
Flowcharts provide graphical description of the process flow that is easy to
understand, even for complex processes (Rentzhog, 1998). Flowcharts allow
users to define and map processes and are of great value in improvement
work as it provides participants with a common platform to work from
(Bergman & Klefsjö, 2012). Flowcharts can be depicted different ways and
shapes. Rentzhog (1998) advocates use of the American National Standards
Institute-standard (ANSI), as it provides a common language and facilitates
communication. A graphical description of some of the most common
shapes and their meaning is presented in Figure 3.1.

THEORY
16
Start Activity Decision
No
Activity
Yes Activity Control End
Activity
Figure 3.1. Process flowchart
3.1.2 The customer/supplier model
The customer/supplier model presented by Rentzhog (1998) advocates
customer focus, i.e. customers legitimatize the process and consequently
should be affecting its contents and results. “To understand the actual needs
of the customer, how these can be satisfied and to what degree you are
successful are necessary questions in order to succeed with process
management” (Rentzhog, 1998, p. 27). To gain understanding about
customer needs it is rarely enough to just ask. Active collaboration with
customers should be established where both parties discuss results and what
the customers hopes to achieve. Continuous feedback enables process
improvement and further satisfaction of customer needs (Rentzhog, 1998).
The model is presented in Figure 3.2.
Supplier Process Customer
FeedbackFeedback
Collaboration Collaboration
Figure 3.2. Customer/Supplier model
3.1.3 Product development process
Hill (2005) explains product development processes as procedures,
extending from initial idea to finished prototype of a product. Successful
product development processes consists of seven steps before the final
product can be produced: generating ideas, screening ideas, feasibility study,
preliminary design and development, testing prototypes, market sensing and
testing target markets, and final design. The process is described as
sequential, but still contains reiteration as each stage of the process generates
questions and feedback to one or multiple previous stages. Feedback is
important in order to clarify and resolve newly detected issues within
product development (Hill, 2005).

THEORY
17
Handfield & Lawson (2007) presents a similar description of the product
development process, consisting of five stages: idea generation,
business/technical assessment, concept development, engineering and
design, and prototype testing. Handfield & Lawson (2007) also include full-
scale production as final activity, which is not considered a separate stage.
Jespersen (2012) also describes product development as sequential but
simplifies the process by using the five stages: idea, concept, design, test,
and launch. This process is presented in Figure 3.3.
Figure 3.3. Product development process (Jespersen, 2012)
Product development processes can include parallel processes and are then
referred to as integrated product development or simultaneous engineering.
It is a cross-functional view based on ideas where marketing, product
development, and production, act as separate actors within product
development processes. Each actor is connected to specific functions
performed in parallel with functions for other actors. E.g. during design
phase, marketing actors conduct market research, product development
actors produce a preliminary product design, and production actors decide
on production principles (Bergman & Klefsjö, 2012).
According to Bergman & Klefsjö (2012) product development creates
opportunities for achieving higher product and process quality to lower cost.
It is described that cost of changes in products is a function of time, i.e. the
cost of changes in a product increase the longer the product development
process progresses. This is illustrated in Figure 3.4.
Figure 3.4. Cost of changes during a product development process
Idea Concept Design Test Launch
Feedback
Idea Concept Design Test Launch
Co
st o
f ch
an
ge
s
Stages in product development process

THEORY
18
In addition to the benefits of cost reduction, Bergman & Klefsjö (2012) also
emphasize the importance of product development processes due to shorter
lifecycles in modern products. Shorter lifecycles limit the possibility of
making successive improvements for already launched products, unless
modified products are launched as new products. Products need to be tested
more thoroughly before entering the market in order to be profitable already
from the launch (Bergman & Klefsjö, 2012).
3.2 Plan Do Study Act
Bergman & Klefsjö (2010, p. 43) states “anyone who stops improving soon
stops being good”. The reason is explained as a consequence to customers
increasing demands along with new technological solutions and business
activities. Continuous improvement involves the idea that development of a
product or service is never finished and can always be better. However, It is
not necessarily quality of the improvement object that should be increased.
Other improvement factors could be reduced price, increased availability or
reduced resources used for production (Bergman & Klefsjö, 2010). A
common symbol of continuous improvement is the PDSA cycle, which is
illustrated in Figure 3.5.
Figure 3.5. Plan Do Study Act cycle
The Plan Do Study Act (PDSA) cycle, also known as the Deming cycle, is
an approach for continuous improvement work. According to Hill (2005) the
approach uses a series of linked activities to identify opportunities. The
model was developed by W. Edwards Deming, based on the Shewhart cycle,
as a tool for continuous improvement within processes. It describes how
work in all kinds of processes should be performed with the steps Plan, Do,
Study and Act. The cycle was previously referred to as the PDCA cycle
where the C stands for Check, but Deming changed this in 1990 as he
Plan
DoStudy
Act

THEORY
19
considered Study to be a more suitable description of the step (Evans &
Lindsay, 2001).
The cycle starts with Plan, which involves studying of the current situation
and describing the process with its associated factors, e.g. inputs, outputs,
customers and suppliers. It also contains identification of problems and
development of solutions. The plan is implemented in the Do stage, first
conducted at a trial basis in order to secure that it provides satisfying results.
In the Study stage it is determined if the trial plan is sufficient and if it
contains deficiencies, which results in recommendation of new solutions for
the Do stage. In the final stage, Act, changes becomes standardized and
implemented as the new current best practice. However, the cycle is never-
ending and should be conducted over again in order to find new deficiencies
within the process (Evans & Lindsay, 2001; Bergman & Klefsjö, 2010).
3.3 Information quality & flow
To describe the importance and use of information it is necessary to
understand the concept of data and its connection to information. According
to Pearlson & Saunders (2010) data is described as a collection of values of
e.g. different events, activities, or transactions, stored without context.
Information is created data is processed and used in context in which it
provides value for the data consumer. Wang et al. (1995) describes data as
raw material for producing information.
Information quality
Information quality is defined by Kenett & Shmueli (2014, p. 3) as “the
potential of a data set to achieve a specific (scientific or practical) goal by
using a given empirical analysis method”. The definition is based on the
connection between data and information described in the previous section,
i.e. the quality of information is a direct reflection of the data from which it
has been produced. Furthermore, Strong et al. (1997) states information
quality and data quality can be used synonymously due to that deficiencies
in data will result in information shortcomings. However, high quality data
does not guarantee high quality information, as it is a matter of context.
With this clarification, Strong et al. (1997, p. 104) defines high-quality data
as “data that is fit for use by data consumers”. The definition is further
explained in four different categories: intrinsic, accessibility, contextual, and
representational. Intrinsic data quality refers to the accuracy, objectivity and
believability of the data. Accessibility in data quality refers to make it
accessible to the right person with the desired security. The contextual
category refers to data that is relevant, complete, value adding and delivered
on time with a correct amount. Representational refers to the interpretability
of data and its ease of understanding, as well as having a concise and
consistent representation (Strong, et al., 1997).
THEORY
20
Information flow
Information flow is described as the main core of all processes, e.g. product
development, and flows between multiple connected or related actors by a
set of structural and behavioural rules (Durugbo, et al., 2013). Information
flow refers to communication of information between different actors,
dependent on accessibility of information resources and occurs in verbal,
written, or electronic form. Organizational information flow involves four
kinds of actors: individuals in an organization, organizational departments,
other organizations, and the environment of an organization (Durugbo, et al.,
2013). According to Petkova et al. (2005) the function of an information
flow is to deliver required information to the right person at the right time.
The flow can be fed forward and backward depending on what information
it contains, e.g. feedback is described as an essential tool for product
improvement (Petkova, et al., 2005). Information is stated to be a critical
factor for growth and prosperity in profit-driven organizations.
Reliability in information and information flows
The term reliability refers to the ability of an item to perform its intended
function on demand without failures (Business Dictionary, 2014). Thus,
reliability with respect to information seeks to retain high quality
information. As stated by Pearlson & Saunders (2010) the intended function
of information is to increase the knowledge for a data consumer, which
demands high information quality. If the information is not complete,
contains deficiencies, or is not accessible on time it is not considered to be
high quality and consequently cannot perform its intended function (Strong,
et al., 1997).
Information systems and the human role in information flows
Information systems are defined Murthy, et al. (2010, p. 3) as”[…] a set of
organised procedures that, when executed provide information for decision-
making, communications, and/or control of the organisation”. Information
systems use hardware, software and people as resources to process input and
output, for storage and control of data transforming activities. Information is
a vital resource to any firm and information systems are designed to satisfy
information needs within organisations. Its purpose is to make sure
information fulfils requirements of quality, timeliness, completeness and
relevance (Murthy, et al., 2010). Information flows through the organisation
in different forms, e.g. verbal, electronic or written, and is an interaction
between sender and receiver. Within organisations, information is often
exchanged between individuals, departments, and organisations or between
organisations and its operating environment (Durugbo, et al., 2013).
Information can be exchanged in different ways, through different media
and be supported by different tools. Information systems can act as media
and support the exchange of information within organisations (Murthy, et
al., 2010).

THEORY
21
3.4 Tools for modelling function relationships
According to Dorador & Young (2000) concurrent engineering have intense
exchange of information in early stages of product design, e.g. regarding
resources, products and processes. To evaluate and improve information
exchanges, it is important to model and present them (Dorador & Young,
2000). Two modelling tools available are Integrated Computer-Aided
Manufacturing Definition for Functional Modelling (IDEF0) and Design
Structure Matrix (DSM), presented in Sections 3.4.1 and 0.
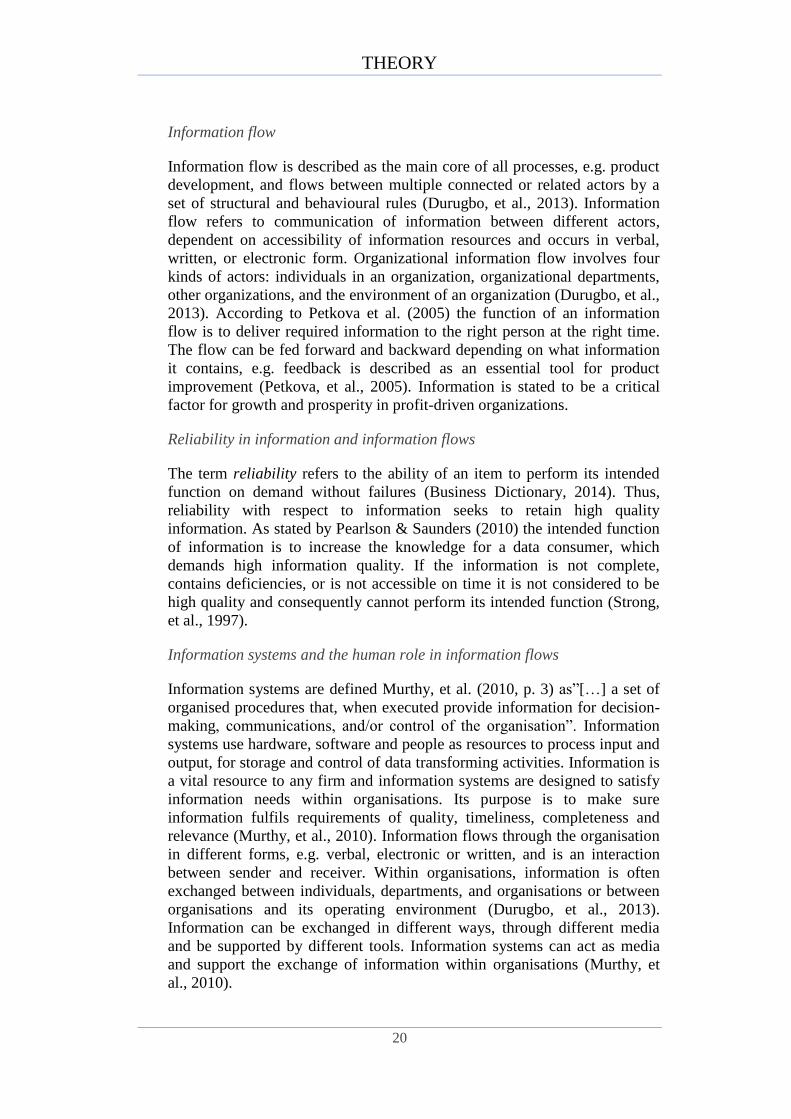
3.4.1 ICAM Definition for Function Modelling
ICAM Definition for Function Modelling (IDEF0) was derived from the
graphical language SADT (Structured Analysis and Design Technique)
(Kim & Jang, 2002). The model was presented in the 1970s as ICAM
(Integrated Computer-Aided Manufacturing) and developed a suit of
different definitions. One of these definitions is the IDEF0, where 0 stands
for activity or function modelling (Sturdy, 2010; Dorador & Young, 2000).
Sturdy (2010, p. 50) defines IDEF0 as “a method designed to model the
decisions, actions, and activities of an organisation or system”. It works on
the principle of transforming process activities by using some function.
According to Dorador & Young (2000) it can be conducted in two different
embodiments: ˙as is˙ or ˙as should be˙. The ˙as is˙ model is used for
analysing the current state of the system while the ˙as should be˙ model
present a model of the desired state. The later could be used for setting up
strategies for improvement work.
Each step of the model consists of one activity, or function, along with four
different interfaces: inputs, outputs, controls, and mechanisms (ICOMs)
(Ang, et al., 1997). Inputs are described as “parameters that are altered by
the activity”, e.g. data or material; Controls refer to “factors that constrain
the activity”; Outputs are the “results of the activity” and Mechanisms refer
to the resources or “means used to perform the activity”, e.g. people or
machines (Kim & Jang, 2002, p. 123). The graphical elements of IDEF0
consist of boxes and arrows, where boxes represent the activities while
arrows represent the ICOMs (Sturdy, 2010). An example of IDEF0 is
presented in Figure 3.6.
THEORY
22
A1
Function 1
A2
Function 2
Input
Mechanisms
Output
Input
Controls
Mechanisms
Controls
Figure 3.6. ICAM Definition for Function Modelling
3.4.2 Design Structure Matrix
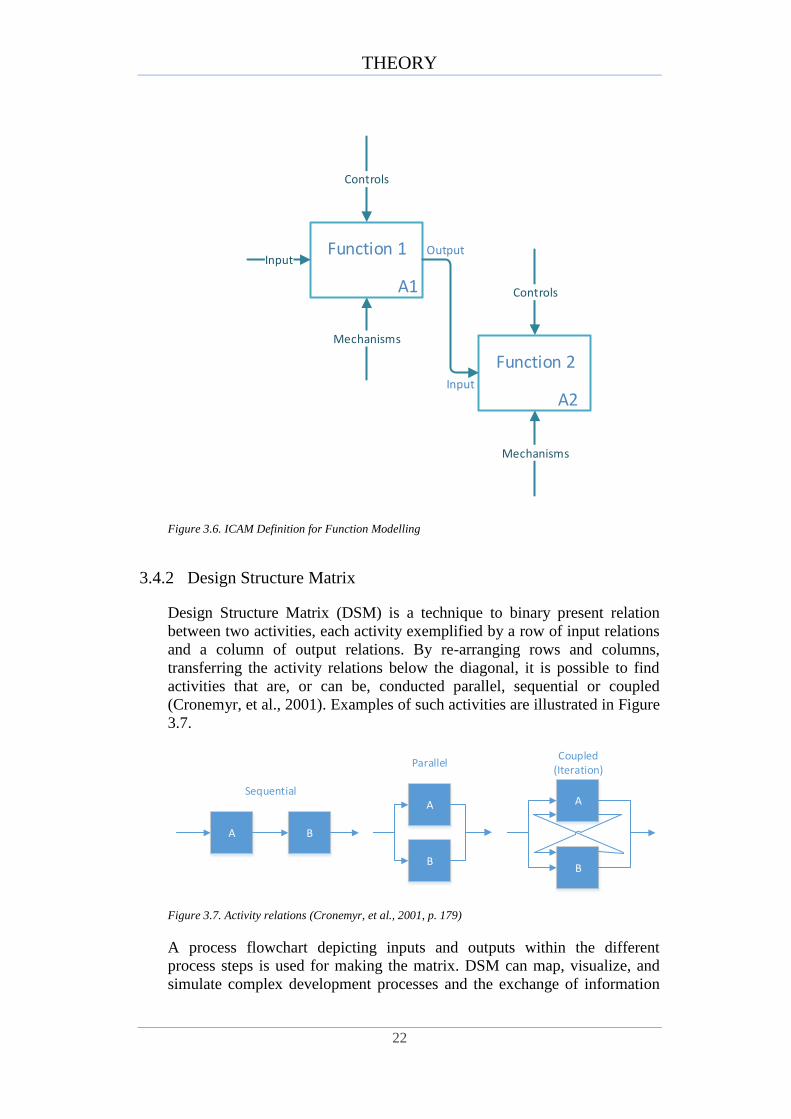
Design Structure Matrix (DSM) is a technique to binary present relation
between two activities, each activity exemplified by a row of input relations
and a column of output relations. By re-arranging rows and columns,
transferring the activity relations below the diagonal, it is possible to find
activities that are, or can be, conducted parallel, sequential or coupled
(Cronemyr, et al., 2001). Examples of such activities are illustrated in Figure
3.7.
A B
A
B
A
B
Sequential
ParallelCoupled
(Iteration)
Figure 3.7. Activity relations (Cronemyr, et al., 2001, p. 179)
A process flowchart depicting inputs and outputs within the different
process steps is used for making the matrix. DSM can map, visualize, and
simulate complex development processes and the exchange of information

THEORY
23
within the process from a holistic perspective. X’s in the matrix indicates
what output of an activity is necessary as input to other activities, boxes
indicates planned iterations the company recognizes as repeating and O’s are
unplanned iterations (Cronemyr, et al., 2001). It is possible to assign weights
to indicate strength and dependency between different activities (Cronemyr,
et al., 2001; Eppinger, 2001; Yang, et al., 2014). An example DSM is
presented in Table 3.1.
Table 3.1. Design Structure Matrix (Eppinger, 2001, p. 151)
It is said by Cronemyr, et al. (2001; Eppinger, 2001; Maheswari, et al.,
2006; Yang, et al., 2014) DSM can be used successfully for simulating and
quantifying results of process development and improvement, as a technique
for evaluating the impact of different process improvement alternatives.
3.5 Cost-effectiveness and profitability
Keramidou, et al. (2013) identifies economic profits as an indicator of
financial success in a company, being profitable denotes that incomes
exceed expenses. However, being profitable alone does not show level of
financial performance. In order to measure and evaluate performance it is
necessary to compare results to investment. This gives comparability over
time and it is possible to financially evaluate projects and investments
regardless of their nature. Profitability is often defined as:
Equation 3.1. Profitability
𝑃𝑟𝑜𝑓𝑖𝑡𝑎𝑏𝑖𝑙𝑖𝑡𝑦 =𝑅𝑒𝑠𝑢𝑙𝑡𝑠
𝐼𝑛𝑣𝑒𝑠𝑡𝑒𝑑 𝑐𝑎𝑝𝑖𝑡𝑎𝑙
Sullivan, et al. (2012) states that since financial patterns can differ widely
between projects and companies there is no one method for performing
profitability analysis. Consequently, multiple methods are accepted for
A B C D E F G H I J
A
B X O O
C X
D X X X Information flows
E X X X X Planned iterations
F X O Unplanned iterations
G X O
H X X X O
I X X X X X
J X X X X X
THEORY
24
calculating profitability, e.g. Present Worth, Future Worth, and Internal Rate
of Return. Key performance indexes applicable for showing profitability in
companies are Return on Equity and Return on Investment. A term closely
knit to profitability is cost-effectiveness, described by Al-Najjar (1997, p.
21) as “cost-effectiveness, Ce, of each improvement may be examined by
using the proportion of the difference between the long run average cost per
unit time before, (B)b and that after the improvement (B)a , to the (B)b , i.e.
Equation 3.2. Cost-effectiveness (Al-Najjar, 1997, p. 21)
𝐶𝑒 = 1 −(𝐵)𝑎
(𝐵)𝑏
[…] Thus, Ce, can be considered as a measure of the cost-effectiveness of
improvements”.
3.6 Fault Tree Analysis
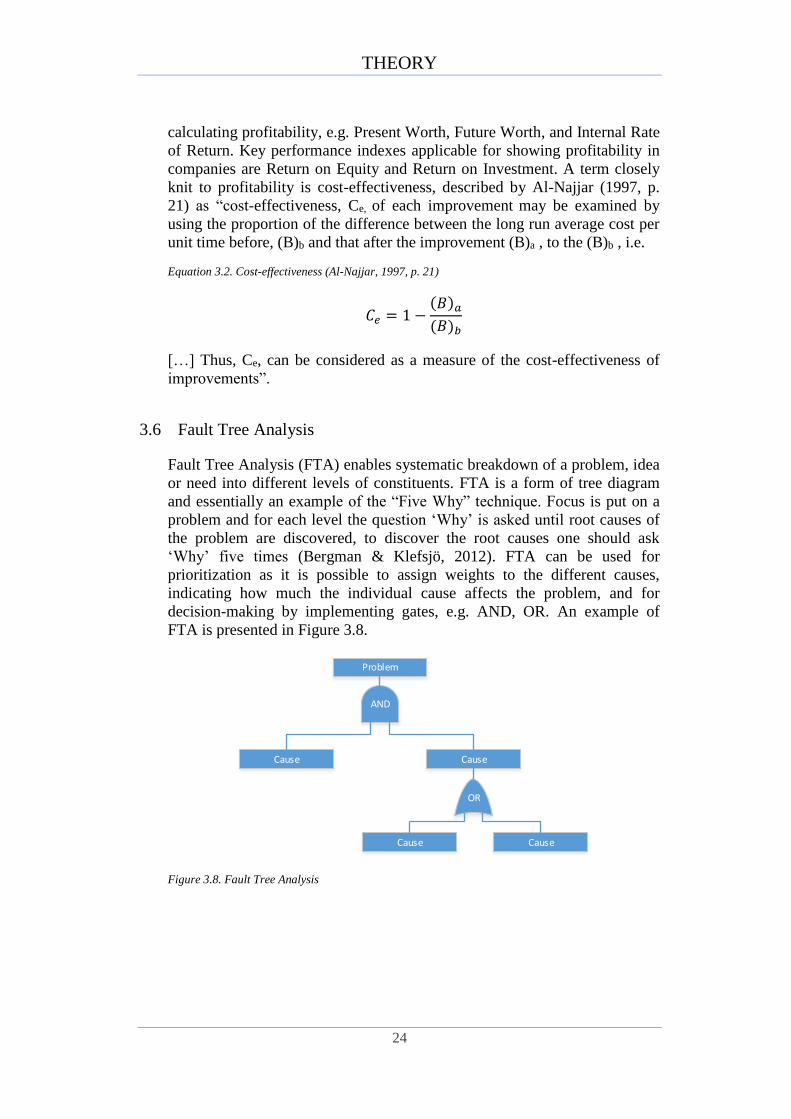
Fault Tree Analysis (FTA) enables systematic breakdown of a problem, idea
or need into different levels of constituents. FTA is a form of tree diagram
and essentially an example of the “Five Why” technique. Focus is put on a
problem and for each level the question ‘Why’ is asked until root causes of
the problem are discovered, to discover the root causes one should ask
‘Why’ five times (Bergman & Klefsjö, 2012). FTA can be used for
prioritization as it is possible to assign weights to the different causes,
indicating how much the individual cause affects the problem, and for
decision-making by implementing gates, e.g. AND, OR. An example of
FTA is presented in Figure 3.8.
Problem
Cause Cause
Cause Cause
AND
OR
Figure 3.8. Fault Tree Analysis

THEORY
25
FTA is according to Bergman & Klefsjö (2012) applicable for:
− Breaking down customer needs of a product.
− Investigating problem root-causes.
− Investigating milestones that have to be achieved for achieving
greater goals.
− Decision-making.
3.7 Checklists: Theoretical description
Wilson (2013, p. 2) defines checklists as ”predefined lists of guidelines,
tasks, questions, or other items against which products, processes,
behaviours, tasks […] are compared”. Checklists may be used for different
reasons e.g.:
− Evaluating products or processes against predefined criteria.
− Verifying if steps within a process has been completed properly.
− For defining requirements and design in development processes.
Checklists are often easy to use and require very little training, output is
immediately useable and does not require further interpretation, and are also
easily customized depending on which parameters the user wants to
incorporate. Simplicity may however be negative in some cases as checklists
can be argued to be too general and lack context. It is also hard to create
checklists that account for all possible or necessary parameters (Wilson,
2013).
3.8 Organization: Theoretical description
Most people have a perception of organizations as companies, hospitals, or
schools. The essential factor for groups to be considered as organizations is
that participants strive towards common goals with set procedures or
guidelines for achieving them (Jacobsen & Thorsvik, 2008). The term
organization has its origin in the Greek word organon, which translates as a
tool or an instrument. With regard to the word’s origin Jäverberg &
Taravosh (1997, p. 72) define an organization as “[…] a tool to reach set
goals”. A more specified definition is given by Jacobsen & Thorsvik (2008,
p. 13) who define an organization as “[…] a social system that is
deliberately designed to achieve set goals”. The definition consists of four
central parts: social, system, deliberate design, and reach goals. Social refers
to that organizations consist of people acting together. System refers to the
organizations dependence of external resources and dependence of
customer’s willing to pay for its products or services. Deliberate design
means that organizations are intentionally designed to solve problems in the
most effective way. Reach goals refers to the fundamental part of the

THEORY
26
organization, to solve the underlying problems for which the organization
originally was founded.
3.8.1 Organizational goals, visions and strategies
Stated purpose of organizations is solving specific problems or fulfilling
some kind of function. To achieve this it is necessary to clarify where to
focus and how this should be obtained. Goals, visions and strategies are used
to fulfil the organizations purpose. (Jacobsen & Thorsvik, 2008).
Organizational goals are described as desired outcomes of what to be
achieved in the future. Goals should be tangible and realistic with associated
time frame in which they should be obtained. The origin of organizational
goals should be directly connected to the organizations purpose. Purpose is a
description of the fundamental existence of the organization, e.g. in which
social functions the organization should fulfil or what differentiate them
from other organizations (Jacobsen & Thorsvik, 2008).
The organizational vision is located in between organizational goals and
purpose. A vision is described as the ideal future situation for the
organization. It should be conducted as a long-term idea and do not have to
be as realistic or obtainable as an organizational goal. An example of a
vision is the Vision Zero, which is a Nordic road traffic safety project that
strives for zero casualties in road accidents (Jacobsen & Thorsvik, 2008).
The connection between organizational goals, visions and purpose is
illustrated with a goal hierarchy in Figure 3.9.
Figure 3.9. Goal hierarchy (Jacobsen & Thorsvik, 2008)
Purpose
Vision
Goal
Subgoal Subgoal Subgoal
Goal
Subgoal
Goal
Subgoal Subgoal Subgoal

THEORY
27
Organizational strategies are a description of how to obtain specified goals.
There are two kinds of strategy categories: generic and resource-based
strategies. The generic strategy focuses on how an organization positions
itself in comparison to its surroundings and the resource-based strategy
focuses on internal factors within the organization (Jacobsen & Thorsvik,
2008).
3.8.2 Organizational structures
Organizations can be structured in various ways but the most common
organizational structures are line and matrix organizations.
Line organizations
A line organization is considered to be the oldest organizational structure
and can be constructed in different ways based on, e.g. function, market, or
division organizations. Content varies depending structure but basic
principles are the same. The structure is a hierarchical pyramid where
business management, generally the CEO, is positioned on top. Underlying
positions reflect degree of authority on personnel within the organization.
Breakdown of these steps depend on how it is constructed, e.g. in a function
organization business management is followed by different function
managers within the organization, e.g. sales, human resource, economy, and
construction (Jäverberg & Taravosh, 1997). An example of a line
organization is presented in Figure 3.10.
Figure 3.10. Line structure for a functional organization
Matrix organisations
The matrix structure of organizations were created for combining
advantages of both functional and division organization structures, joining
effectiveness of functional structures with flexibility and sensitivity of
divisional structures (Hatch, 2002). Matrix structures are not limited to a
combination of functional and divisional structures; combinations can be
made in any way that is desired (Jäverberg & Taravosh, 1997).
CEO
SalesHuman
ResourceEconomy Construction
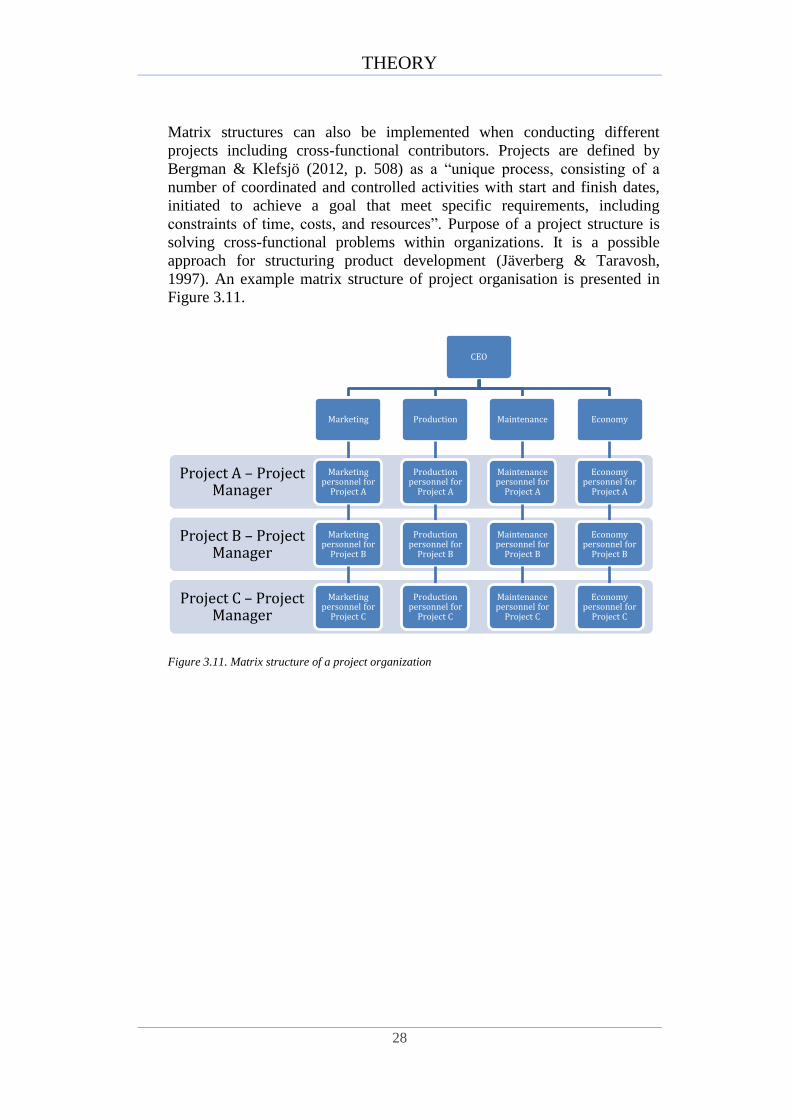
THEORY
28
Matrix structures can also be implemented when conducting different
projects including cross-functional contributors. Projects are defined by
Bergman & Klefsjö (2012, p. 508) as a “unique process, consisting of a
number of coordinated and controlled activities with start and finish dates,
initiated to achieve a goal that meet specific requirements, including
constraints of time, costs, and resources”. Purpose of a project structure is
solving cross-functional problems within organizations. It is a possible
approach for structuring product development (Jäverberg & Taravosh,
1997). An example matrix structure of project organisation is presented in
Figure 3.11.
Figure 3.11. Matrix structure of a project organization
Project C – Project Manager
Project B – Project Manager
Project A – Project Manager
CEO
Marketing
Marketing personnel for
Project A
Marketing personnel for
Project B
Marketing personnel for
Project C
Production
Production personnel for
Project A
Production personnel for
Project B
Production personnel for
Project C
Maintenance
Maintenance personnel for
Project A
Maintenance personnel for
Project B
Maintenance personnel for
Project C
Economy
Economy personnel for
Project A
Economy personnel for
Project B
Economy personnel for
Project C

MODEL DEVELOPMENT
29
4 Model development
In this section, the developed model and tool are presented, containing
information about theoretical inspiration, an in-depth explanation of the model
and a suggested approach for model application.
4.1 Model introduction and theoretical inspiration
Problem formulation of this study focus on improving product development
processes by ensuring reliable flow of information. Information is stated to
be an essential part of processes and every process improvement model
relies on well-functioning flow of information. Regardless, previous models
do not cover how a reliable flow of information should be structured, e.g. the
PDSA cycle is a general model of how to work with continuous
improvement, but it only defines which stages that should be included in a
process. DMAIC takes it one step further by adding a stage and defining
how each stage can be implemented. The IDDOV model breaks it down
even further by splitting stages into smaller steps. Still, these models lack
specifications on how to ensure a reliable flow of information between the
different steps.
The developed model strives to streamline a product development process
from an information flow perspective, in order to ensure a reliable flow of
information. Product development processes tends to differ from project to
project within a company or between companies. Consequently, the model
has been designed with a general layout to make it applicable for a higher
number of companies and processes. Companies are able to adjust the
model, as to which tools to use, in order to make it suitable to their specific
process.
As stated by Bergman & Klefsjö (2011) cost-effective continuous
improvements are critical for companies in order to remain competitive.
However, product development processes are defined as sequential, ending
when final design of the product is specified. The developed model
approaches this by implementing cost-effective continuous improvement
between different product development projects. By identifying deficiencies
and obstacles within the information flow of a process, it is possible to
improve these for upcoming development of future products. The developed
model is described further in Section 4.2, and illustrated in Figure 4.1.
A tool has been developed in order for companies to make fully use of the
model. The tool strives to facilitate structuring and specifying information
transfers within product development processes. It is designed in a way that
makes it easy to both use and understand to make it applicable for as many
companies as possible. A further presentation of this tool is provided in
Section 4.3, and illustrated in Figure 4.2.

MODEL DEVELOPMENT
30
4.2 Model presentation
Product development is conducted through projects and is consequently not
a continuous process, e.g. the production process. Regardless if a process is
continuous or recurring it requires improvement to maintain effectiveness.
The traditional improvement model PDSA has been incorporated with the
developed model to allow improvement of the product development process,
from project to project. The model is used as an improvement process
alongside the product development process, thus some steps may be shared.
The model is presented in Figure 4.1 below.
Step 1Plan and document
process
Step 2Observation of
product development
process
Step 3Evaluation of
information flow
Step 4Identification of problem root-
causes
Step 6Implemention of
improvement(s) in next process
Step 5Determination of
suitable improvement(s)
Figure 4.1. Model for ensuring a reliable information flow

MODEL DEVELOPMENT
31
Step 1: Plan and document process
The product development process is general and has predefined steps that
are always present. Nevertheless, no product is the other alike and
accordingly there is need of process adjustment in each individual
development project. First step of the model is to plan and document the
product development process, including information flow, for the individual
project. This step could be included in the improvement and product
development process, to ensure all actors and functions has their information
needs satisfied. Taking into consideration external factors e.g. management
decisions, demands of information security, information in external systems,
company goals and policies etc. It is vital planned information flow
considers previous improvement suggestions. Clear documentation and
planning of processes and information flows provide structured and
systematic ways of working, necessary in complex cross-functional
processes.
There are different functions within product development processes e.g.
sales, maintenance, construction, operation etc., represented in companies as
departments or individual persons. Within product development processes,
they form a chain of functions, placed sequentially or in parallel. In the
chain, functions act as suppliers, customers or both, meaning they receive
information from previous function(s) and transmits information to
following one(s).
Supplier outputs, transmitted information, should fulfil information needs of
receiving function(s), which enables them to perform their tasks with highest
performance possible and in the most effective way. This type of
relationship should be present between all functions active within the
product development process, it is important in- and outputs are clearly
specified and documented in the process plan. It is important the planned
information flow is available in a visual format.
Step 1 is the foundation for how to structure information flow in the product
development process and foundation of what to strive for in the
improvement process.
Step 2: Observation of product development process
First step provide plan and structure for how information should be
transferred within the product development process. Information parameters
are defined and information flow specified. Thus, second step of the
improvement model is observing the actual information flow within the
product development process. The purpose is to keep track of the
information flow with regard to how it was planned and if information was
up to par with needs and requirements, which is documented and used for
evaluating the process. Observation of the process in reality sheds light on
MODEL DEVELOPMENT
32
aspects or factors, which may have been overlooked when forming the
original process and information plan.
Observations are made by all functions participating in the product
development process, regarding individual function’s experience of the
information flow and if received information was according to specification.
It is done in a clear and easy to understand format, which can be composed
and interpreted quickly. It is important observations exclude experiences and
perceptions of transmitted information as it may cause a wrongful
assessment of reality.
All observations regarding the actual information flow are compiled and
documented.
Step 3: Evaluation of information flow
Documentation gathered during observation is analysed in order to visualize
the actual information flow during the process, illustrating the information
flow in reality. After observing the process, the information flow is
evaluated in order to discover flaws or miscommunication between
functions.
The planned and actual states of the information flow are compared so that
any deviations or problems within information flow and quality are
identified. Doing visual comparisons provides clear and easy way of
identifying and highlighting problematic areas. The visualization technique
used shall be easy to work with in order to keep time spent to a minimum.
One person, preferably project manager, using the function’s observations
and planned flow as foundation, shall perform evaluation. Observations
concurring with the planned flow and specifications shall be communicated
back to the affected functions as positive feedback. Observations not
concurring shall be investigated further.
Step 4: Identification of problem root-causes
When problems are identified it is necessary to investigate the root-causes
behind the problems. This is crucial in order to see where focus shall be
placed and where improvements can be implemented as problems may have
multiple underlying root-causes. When all root-causes has been identified it
is important to assign weights or numerical values to them to see which of
them is of highest importance or has the most impact on the problem.
Problem root-cause investigation shall be conducted in a structured way by
all involved functions and it is important that all root-causes are fully
investigated. The investigation shall also include prioritisation of the root-
causes showing which has the highest impact on the problem.

MODEL DEVELOPMENT
33
Simplicity, usability, and speed are key and therefore it is advocated to take
a visual approach to this step.
Step 5: Determination of suitable improvement(s)
Based on identified root-causes there shall be suggestion of suitable
improvements, considering identified information needs of affected
function(s), cost-effectiveness, and profitability. If investment is needed,
benefits have to be cost-effective and conform to company goals. A plan for
improvement implementation should also be concluded upon.
Suitable improvements shall be decided upon by discussion between
involved functions. It is important to have collaboration between all
involved functions so that improvement covers the entirety of the problem.
Improvements that are suggest for implementation shall be documented in a
comprehensive way, including a plan for how improvements can be
implemented in coming projects, and made available to future project
groups.
Step 6: Implementation of improvement(s) in next process
As the process is recurring and not continuous, suggested improvements are
implemented during the next product development project. Following the
plan and implementing the identified improvements into Step 1 of the new
project enhance areas that were previously lacking. In this way it is possible
to work with improvements continuously, even with a non-continuous
process.
The implementation plan shall be available to all new project groups and be
used in the process and information flow planning in future projects.
4.3 Information Transfer and Specification Structure
Information Transfer and Specification Structure (ITSS) is incorporated in
the first step of the improvement model. It is a tool, developed by the
authors, applicable for specifying and transferring information in a
structured format. The tool has been created with inspiration from the
customer/supplier model and IDEF0. IDEF0 is used due to its simplicity in
illustrating in- and outputs and external factors. However, it does not
consider relations between functions, which is crucial. ITSS utilizes strong
points of IDEF0 together with the relationship advocated by the
customer/supplier model. This creates a tool suitable for structuring and
specifying information flows, considering needs and requirements of
individual functions, within the product development process. An
illustration of the ITSS is presented in Figure 4.2.

MODEL DEVELOPMENT
34
First process function
Mechanisms Personnel External
information Improvements
Controls Demands Decisions
Second process function
Final process function
Information Output/Input
Information feedback
Product development process
Information Output/Input
Information feedback
Figure 4.2. Information Transfer and Specification Structure
ITSS is applicable for the entire product development process, structuring
information transfer for individual process functions. Number of functions
and feedback iterations within processes can vary; however, there is always
a first and a final process function. Each process function has one of three
roles: customer, supplier, or both, i.e. receiving information, transmitting
information, or both. The functions communicate by transferring
information trough in- and outputs, specified by four parameters:
− What – should the transfer contain, e.g. requirement specifications, cost
calculations etc.
− How – to transfer, electronically, verbally, written. Different file formats
etc.
− Where – to transfer, person, department, company etc.
− When – to transfer, at a specific time, when a certain condition is fulfilled
etc.
It is advocated by the authors that supplier information outputs be specified
in collaboration with customers.
Information is also affected by external Controls, e.g. demands on
information security and quality, decisions made by the board or
management and also conformity to company goals and policies. It is also
affected by Mechanisms, e.g. personnel, external information as in
blueprints or sales information available in different systems and
improvements decided upon after previous processes.
Each time customers receive information from a supplier, feedback
regarding information is sent back to the supplier. The feedback states if

MODEL DEVELOPMENT
35
received information fulfilled the customer’s needs regarding the specified
parameters, what, how where and when.
4.4 Approach for model application
A suggested approach for use of the model within a product development
project is presented as support for incorporating suitable tools and work
methods. By making use of adequate tools for each step of the model it is
ensured work will be conducted systematically and each step will produce a
beneficial foundation for following steps to work on. A suggested approach
for model application is illustrated in Figure 4.3.
Step1Plan and document
process
Step 2Observation
product development
process
Step 3Evaluation of
information flow
Step 4Identification of problem root-
causes
Step 6Implemention of
improvement(s) in next process
Step 5Determination of
suitable improvement(s)
ITSS
Checklist
DSM
FTA
FTA
Figure 4.3. Suggested approach for model application

MODEL DEVELOPMENT
36
Step 1: Plan and document process
A suitable tool for planning and documenting a process is Information
Transfer and Specification Structure (ITSS). It provides a systematic
approach for identifying and specifying four parameters crucial for
information transfer: Where, When, How and What. The tool is
implementable for all functions within the product development process and
it incorporates factors e.g. external information sources, previous
experience, corporate goals and policies. ITSS also makes use of feedback
loops between functions during the process. During observations it has been
identified that a tool advocating a horizontal way working is needed.
There are multiple ways for visualising the planned information flow, e.g.
Unified Modelling Language (UML), Flowcharts and DSM. However, DSM
is the only one showing what functions should iterate with each other and in
what way, receiving or transmitting information. It also shows if iterations
are planned or unplanned, using a simple interface.
Step 2: Observation of product development process
Second step is observation of the information flow within the product
development process and documenting if it performs as intended. Checklists
provide an easy and fast way to document whether information fulfil needs
and requirements or not with regard to defined parameters. Checklists
should be distributed to and filled in by each function within the product
development process.
Checklists should be designed as a series of Yes/No question based on a set
of parameters decided upon in Step 1, followed by a short space for
additional comments if necessary. Questions should be based on
documentation from the planning step and only take into consideration
experience of received information for an individual function.
Step 3: Evaluation of information flow
Checklists are compiled and analysed in order to show how the information
flow has been in reality, then compared to how the information flow was
planned originally, highlighting discrepancies or faults in the flow. DSM is a
tool applicable for visualizing the information flow in a clear way. By
compiling data from checklists into a DSM it is possible to in a clear way
see how the information flow looked like throughout the process.
Comparing a planned DSM to one reflecting the actual information flow
gives good indication of miscommunication and problems in the information
flow.
MODEL DEVELOPMENT
37
Step 4: Identification of problem root-causes
Identified problems must be investigated further to identify root-causes. A
good way to work with identification of root-causes in a structured way is
tree diagrams. It provides a structured approach to breaking down problems
into smaller constituents and allows for prioritization and rating of impact
for each root-cause. This is essential for picking the root-cause with most
potential of improvement.
Step 5: Determination of suitable improvement(s)
When root-causes are identified, it is possible to determine suitable
improvements. Improvements should be concluded on by cross-functional
discussions with all involved functions in order to come up with a solution
fulfilling the needs of all stakeholders.
A plan for implementation of the chosen improvement should be formed
including information about the underlying root-cause, where it was
identified, the affected functions and how it could be solved. The plan
should be short and concise, but depending on nature of the improvement a
more in-depth plan may be necessary. Improvements should be formed in a
general manner, for applicability in other projects.
Step 6: Implementation of improvement(s) in next process
The implementation documentation is used as external input during the
information flow planning of future projects.

EMPIRICAL FINDINGS
38
5 Empirical findings
This section contains a brief description of the two case companies and their
product development processes.
5.1 Emballator
The Emballator Group has its main core in packaging and consists of seven
companies within different industries. The business concept is to offer
packaging solutions with added value in knowledge, experience, innovation,
and service. All companies within the Emballator Group are independent
with separated operations, but all strive towards a common goal: To become
the leading family-owned packaging group in Northern Europe. The
companies’ joint core values are summarized as durability, development,
dedication, and simplicity.
The Emballator Group is owned by Herenco, which is a family-owned
company with an annual turnover of about 3 billion SEK and has a total of
1700 employees. Besides Emballator, Herenco has business operations in
five areas, including publishing of local newspapers and development of
graphic services. Herenco’s core values include ethics, local presence,
economic efficiency and entrepreneurship, and long-term customer relations.
5.2 Lagan Plast
Lagan Plast develop, produce, and market plastic buckets and cans for food
and chemical products. Lagan Plast has one plant located in Ljungby,
centrally in southern Sweden, and three sales offices located in Finland,
Norway and England. The plant in Ljungby is certified according to ISO
9001, 14001, and 22000 (quality, environment, and food safety).
Furthermore Lagan Plast also meet the requirements of Normpack, which is
a system for self-monitoring of products and material intended for use in
contact with food. Empirical information at Lagan Plast has been gathered
through a discussion-like interview with the Chief of Development and
observations.
5.2.1 Goals and vision
The company conducts continuous improvement in their everyday work
with ambition to supply the market’s best packaging solution. Focus is on
quality and environment, which are explained as equally important and one
cannot exclude the other. E.g. a product with high quality but bad
environmental impact is considered unapproved, and vice versa.

EMPIRICAL FINDINGS
39
Lagan Plast operate with a Lean philosophy to achieve maximum cost-
effectiveness in production. As a step the collected knowledge of all
employees is utilized for eliminating all types of waste and problems. The
purpose is to increase production using the same amount of resources by
implementing smarter ways of working.
5.2.2 Product development at Laganplast
Lagan Plast has an in-house product development department that allows
developing of packaging solutions in close collaboration with the customers.
Regular meetings with designers, engineers and product designers are
conducted along with product developers representing the customer’s
organization. The purpose of product development is both to improve the
quality of existing products, as well as develop new products. Some
products are customer-specific, but Lagan Plast still owns the design, i.e. all
product specifications belong to the company. Lagan Plast uses both internal
and external product designers, and work in a 3D CAD environment.
Necessary tools for manufacturing are built in-house, which shortens the
development of new products significantly.
5.2.2.1 Product development process
Emballator Lagan Plast performs product development in projects or works
depending on magnitude of time and monetary investment needed. Missions
have timeframes shorter than 8 weeks and costs below 100 000 SEK.
Projects have timeframes longer than 8 weeks and costs 100 000 SEK or
above. Working methods for development projects are standardised in order
to ensure high quality performance regarding precision, cost-effectiveness,
and delivery security. A flowchart describing the general product
development process is presented in Figure 5.1.
Pre-study Plan Perform Phase-out
Develop prototype & Verification
Develop & Construct
Zero-series production
Hand over to production
Create time and resource
plan
Create project organisation
Establish budget
Plan communication
Create risk analysis
Change management
Identify stakeholders
Current situation analysis
Pre-calculation & business
benefits
Requirement analysis
Figure 5.1. Documented product development process, Lagan Plast

EMPIRICAL FINDINGS
40
Pre-study
Chief of Development or management group initiate pre-studies by
conducting current state analysis, a simply way to see differences between
actual and desired state. Stakeholders affected by the project or its result, are
identified, and classified as Core, Primary, or Secondary stakeholder for
easier mapping of information dependencies. Furthermore, business benefits
are surveyed and pre-calculations are made concerning project effects on
corporate results. Lastly, requirement analysis is performed, and combined
with previous steps produces a documented requirement specification, which
is the pre-study’s end result.
Plan
Chief of Development or management group creates a temporary project
organization, project group and assigns project manager. If needed, a
reference group of project stakeholders are also appointed. Furthermore, a
time and resource plan is created, budget is calculated and determined. A
communication plan with set appointments is created and if needed,
communication schedules can be established as well. Additionally, a risk
analysis is conducted and a plan for changes is established, to better
facilitate changes during the project. Lastly, a documented project plan is
formed as end result.
Perform
The perform step consists of four phases, each followed by a tollgate for
deciding to continue or terminate the project. Each phase has sub-processes
and is iterative, last step in each phase is evaluation. If not approved, and
depending on failing aspects, sub-processes are repeated until approval is
reached.
Phase-out
Upon completion results of the project are delivered to customer, on time.
Project evaluation is initiated by comparing requirement specification with
result and pre-calculations are compared to post-calculations to determine
actual costs. The project method is evaluated to facilitate internal
improvement of the method in future projects. The project manager
composes an end report as a final activity before the project organization is
disbanded.
EMPIRICAL FINDINGS
41
5.2.2.2 Information flow in documented product development process
DSM has been used to depict information flow present in the documented
product development process, presented in Appendix II. Table 5.1 shows the
exchange of information between different steps in the process.
Table 5.1. Design Structure Matrix documented process Lagan Plast
5.3 Växjöplast
Växjöplast develop and produce caps and enclosures for leading brands in
the world, with focus on the Nordic countries. The plant is located in Växjö,
in southern Sweden. The production premises have classifications for both
food and medical supplies and the plant is further certified according to ISO
9001, 14001 and 22000 (quality, environment, and food safety). Växjöplast
have a yearly turnover on about 100 MSEK and about 50 employees.
Empirical findings at Växjöplast has been gathered through multiple
discussion-like interviews with Account Manager, Development Engineer
and the Chief of Development and Construction and observations. The
authors have proposed a subject for the interview and then held a discussion
between the participants.
ACTIVITY 1 2 3 4 5 6 7 8 9 10 11 12 13 14 15 16 17 18 19 20
Create current-situation analysis 1Identify stakeholders 2 XPre-calculation & business benefits 3 XRequirement analysis 4 XCreate pre-study report 5 X X X X FeedbackCreate projet organization 6 X XCreate time and resource plan 7 X XEstablish budget 8 X XPlan communication 9 X XCreate risk analysis 10 X XChange management 11 X XCreate project plan 12 X X X X X XDesign 13 X XConstruction 14 X XTest construction 15 X XEvaluate 16 Feed forward X X XDevelop prototype 17 X XPlan testing 18 X XVerification 19 X XEvaluation 20 X X X
Planned iterations
X Information flows
Pre-study phase
Planning phase
Develop & Construction phase
Develop prototype & Verification phases

EMPIRICAL FINDINGS
42
5.3.1 Goals and vision
Växjöplast strives to produce products that attract new customers for their
clients. The company seeks long-term customer relationships through
innovative thinking and close collaboration with customers. These
collaborations expect to result in smart, user-friendly, and appealing
designed caps & enclosures for all sectors of the market. Växjöplast strives
to keep growing and remain one of the greatest Nordic suppliers of
enclosures. Focus lies on customer needs with security and quality as the
number one priority.
5.3.2 Product development at Växjöplast
Växjöplast holds the longest experience in the Nordic countries for
development of caps. The work extends from concept ideas to finished
product. The product development process is divided in two parts. The form,
functionality, and user-friendliness must be guaranteed first in order for the
product to be attractive for the consumers. The next step is making the
production process cost-effective, repeatable, and safe. To attain a high
quality product development process, Växjöplast has a construction unit
with experience of how to succeed in designing and developing caps and
enclosures. A successful product development process will result in a
product that fulfils requirements in identity, functionality, and sales.
5.3.2.1 Product development process
Plan Perform Phase-out
Series production
Hand over to production
Project evaluation
External/Internal construction
review
Construction of product
Project activities
Tool/assembly
testing
Zero-series production
Brief new product
ProspectProject
planningPreparation Calculation
Project launch
Pre quotation
Quotation
Pre Testing
Figure 5.2. Documented product development process, Växjöplast
The flowchart presented in Figure 5.2 is a simplification of the product
development process described in Appendix III. Following below is an
explanation of the flow.

EMPIRICAL FINDINGS
43
Plan
Received prospects or identified possibilities are examined and approved or
declined. Upon approval Sales has a briefing of the new product, which is
the foundation of the project. Sales also create project plan specifying
requirements, activities, and responsibilities. Following is preparation work
in the different departments, also including preliminary product design:
− Product development, 3-D model is created to show design.
− Purchasing of third-party material
− Quality
− Production
Preparation work and product development are examined and used as basis
for calculating and concluding on final quotation. If customer approves
quotation, an order is placed and project starts.
Perform
Projects are initiated by establishing the previously created project plan
during launch meetings. Construction of the product is finalized, then
reviewed, and approved by customer and also reviewed internally. Further,
the four previously mentioned departments perform different project
activities. Assembly and tool testing is performed through process test order
and later tested in zero-series production.
Phase-out
Upon successful zero-series involved department chiefs in the project group
turns the project over to production, which starts series production. Lastly,
projects are evaluated internally and externally.

EMPIRICAL FINDINGS
44
5.3.2.2 Information flow in documented product development process
DSM has been used to depict information flow present in the documented
product development process, presented in Appendix III. Table 5.2 shows
the exchange of information between different steps in the process.
Table 5.2. Design Structure Matrix documented process Växjöplast
ACTIVITY 1 2 3 4 5 6 7 8 9 10 11 12 13 14 15 16 17
Prospect 1Briefing new product 2 XCreate project plan 3 XPreparation work 4 X X FeedbackPre quotation 5 XCalculations 6 XFinal quotation 7 XProject launch 8 X XConstruction of product 9 X XExternal & internal construction review 10 XProject activities 11 X XPre Testing 12 X XTool & Assembly testing 13 XZero-series production 14 Feed forward XHand over to production 15 XSeries production 16 XProject evaluation 17 X
X Information flowsPlanned iterations
Planning phase
Performing phase
Termination phase

MODEL TESTING
45
6 Model testing
In this section, the model is empirically tested in a case company according to
the different model steps. The model is applied in a previously performed
product development case, conducted by the case company. Step 6.1 is not
performed by the authors as the case company has already performed this step.
6.1 Step 1. Plan and document process
The general process used in product development projects is illustrated in a
process flowchart presented in Appendix III. However, documents regarding
the specific case will not be presented, as it is ongoing and thus kept secret.
Ideally, all documentation regarding the project and its information, e.g.
plans, flowcharts, structures, specifications, and communication, is available
in the improvement process. Documentation is compiled and presented
visually, to enable comparison in following steps by using DSM.
Due to lack of documentation and the incorporation of general process
flowchart, it may be assumed that results will be improvement suggestions
in general, rather than for the specific case.
6.2 Step 2. Observation of product development process
Regardless how well documented and planned information flows are it is
necessary to observe and experience them in reality, to map actual
information flows and find areas of improvement. For the specific case,
interviews has been conducted with project members as the authors could
not participate during the project. Interviews reflects the members’ general
experience of received information during the project. To cover the entirety
of the product development process interviews has been conducted with
persons presented in different stages and with different areas of expertise,
including account manager, development engineer, and chief of construction
& development. Each interviewee stated stages of the product development
project in which they were involved and how they experienced the
information. Interview results are presented as a checklist in Table 6.1.
Interviewees were asked questions regarding four information parameters.
− What – Was received information the needed information?
− How – Was received information delivered in a desired way?
− When – Was information received at the desired time?
− Where – Was received information delivered to the correct person?
MODEL TESTING
46
Table 6.1. Checklist of information flow experiences
‘Yes’ indicates information fulfilled needs and requirements, ‘No’ indicates
lack in the specific parameter. As can be seen Sales has one No-answer,
Construction none and Development two. However, answers only consider
internally transferred information and neglects external customer
interactions.
Ideally, checklists should be filled in after each step of the product
development process to form a sound foundation to base improvements on.
Unfortunately, it was not possible in this case as most steps had already been
performed. Consequently, modifications were made and checklist of the
general information flow in addition with results of more investigative
interviews were used to illustrate the actual information flow presented in
Section 6.3.
6.3 Step 3. Evaluation of information flow
The actual flow of information within the specific case project, chosen for
this study, has been mapped through interviews with personnel involved
within the project. Interviewees representing the company were the chief of
construction & development, accounting manager, and development
engineer.
Interviews were conducted based on the documented process presented in
Section 5.3.2.1. The original activities were adjusted to reflect the
interviewees’ perception of the actual case project, i.e. activities conducted
during the case project, not included within the documented process, were
added to the information flow. Accordingly, the original 17 activities were
increased to 27, including an individual entry for the chief of construction &
development. It was concluded by the authors that the role held by the chief
of construction & development pervades all phases and are of such
significance that it required an individual entry. All added activities are
listed below:
− Pre-study report
− Intern brief of project
− Extern project start-up
− Create time plan
− Create blueprint
− Test-tool
Position What How When Where
Sales Yes Yes No Yes
Construction Yes Yes Yes Yes
Development No No Yes Yes
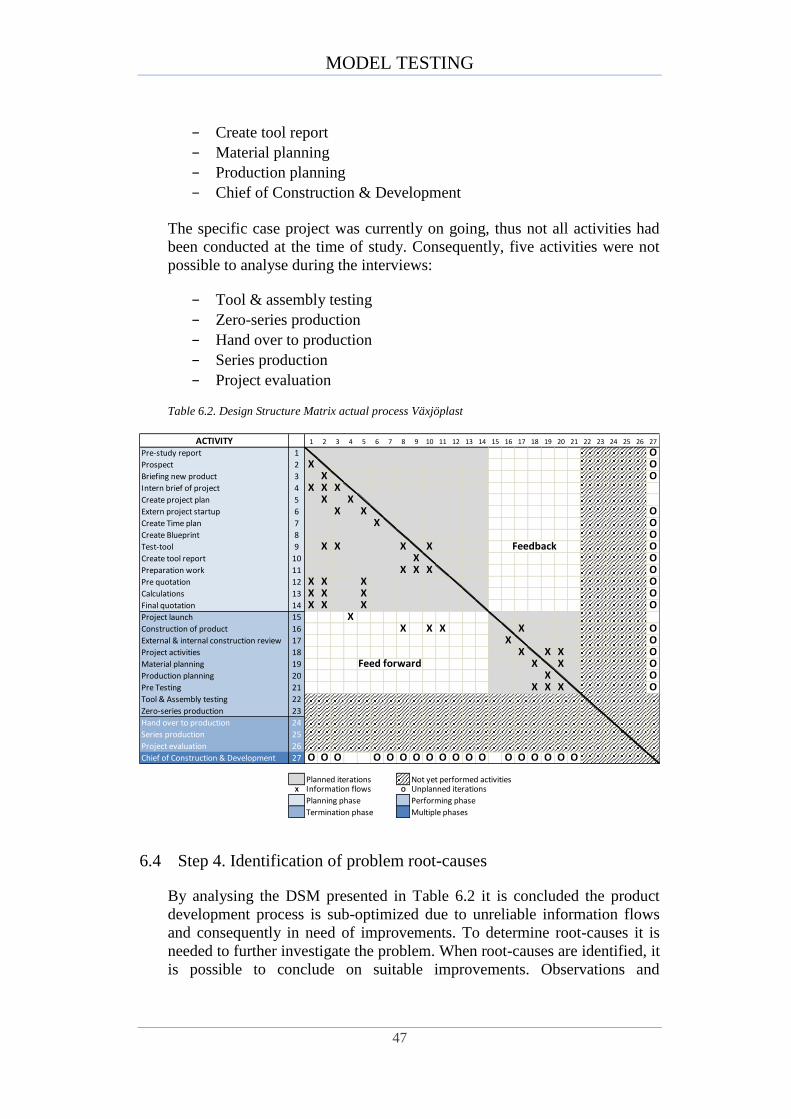
MODEL TESTING
47
− Create tool report
− Material planning
− Production planning
− Chief of Construction & Development
The specific case project was currently on going, thus not all activities had
been conducted at the time of study. Consequently, five activities were not
possible to analyse during the interviews:
− Tool & assembly testing
− Zero-series production
− Hand over to production
− Series production
− Project evaluation
Table 6.2. Design Structure Matrix actual process Växjöplast
6.4 Step 4. Identification of problem root-causes
By analysing the DSM presented in Table 6.2 it is concluded the product
development process is sub-optimized due to unreliable information flows
and consequently in need of improvements. To determine root-causes it is
needed to further investigate the problem. When root-causes are identified, it
is possible to conclude on suitable improvements. Observations and
ACTIVITY 1 2 3 4 5 6 7 8 9 10 11 12 13 14 15 16 17 18 19 20 21 22 23 24 25 26 27
Pre-study report 1 OProspect 2 X OBriefing new product 3 X OIntern brief of project 4 X X XCreate project plan 5 X XExtern project startup 6 X X OCreate Time plan 7 X OCreate Blueprint 8 OTest-tool 9 X X X X Feedback OCreate tool report 10 X OPreparation work 11 X X X OPre quotation 12 X X X OCalculations 13 X X X OFinal quotation 14 X X X OProject launch 15 XConstruction of product 16 X X X X OExternal & internal construction review 17 X OProject activities 18 X X X OMaterial planning 19 Feed forward X X OProduction planning 20 X OPre Testing 21 X X X OTool & Assembly testing 22
Zero-series production 23
Hand over to production 24
Series production 25
Project evaluation 26
Chief of Construction & Development 27 O O O O O O O O O O O O O O O O O O
Planned iterations Not yet performed activitiesX Information flows O Unplanned iterations
Planning phase Performing phase
Termination phase Multiple phases
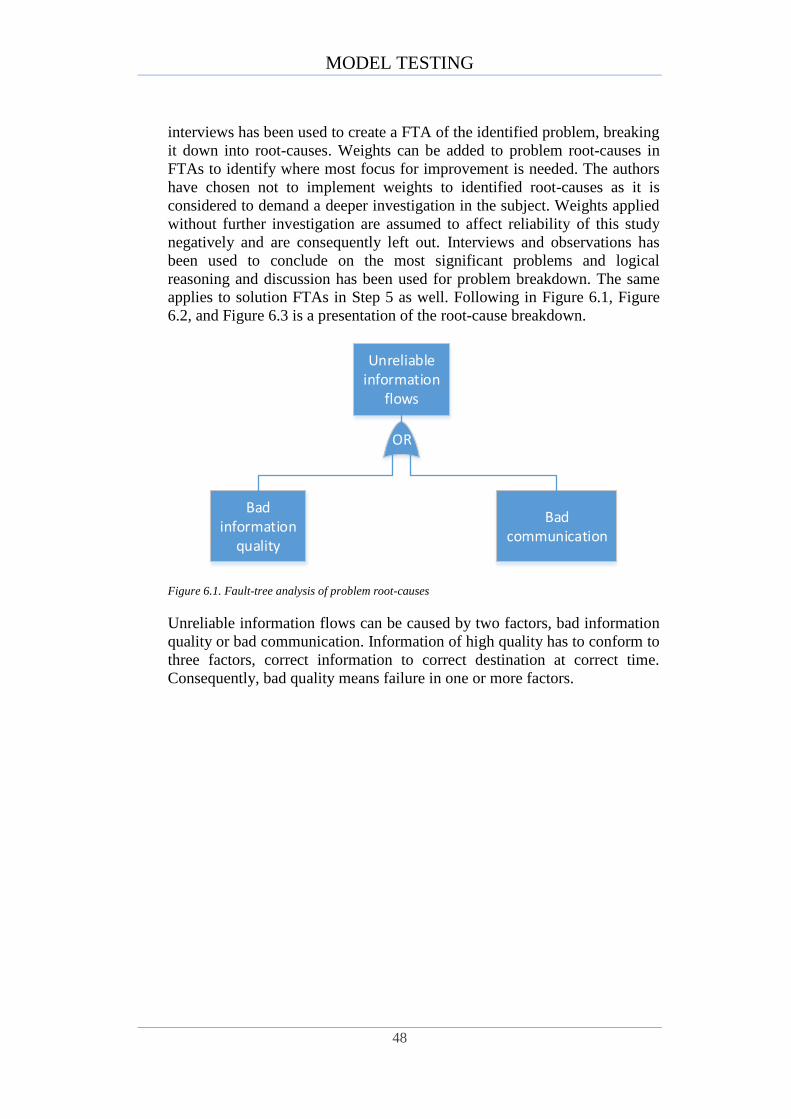
MODEL TESTING
48
interviews has been used to create a FTA of the identified problem, breaking
it down into root-causes. Weights can be added to problem root-causes in
FTAs to identify where most focus for improvement is needed. The authors
have chosen not to implement weights to identified root-causes as it is
considered to demand a deeper investigation in the subject. Weights applied
without further investigation are assumed to affect reliability of this study
negatively and are consequently left out. Interviews and observations has
been used to conclude on the most significant problems and logical
reasoning and discussion has been used for problem breakdown. The same
applies to solution FTAs in Step 5 as well. Following in Figure 6.1, Figure
6.2, and Figure 6.3 is a presentation of the root-cause breakdown.
Unreliable information
flows
OR
Bad communication
Bad information
quality
Figure 6.1. Fault-tree analysis of problem root-causes
Unreliable information flows can be caused by two factors, bad information
quality or bad communication. Information of high quality has to conform to
three factors, correct information to correct destination at correct time.
Consequently, bad quality means failure in one or more factors.

MODEL TESTING
49
Bad information
quality
OR
Incorrect information
Incorrect destination
Not on time
Incorrect external information
Incorrect internal
information
Insufficient customer
documentation
Language barriers
Lack of knowledge
OR
OR
OR
OR
Tight time schedule
External approval
High workload
Unclear specification
Unclear roles & authorities
OR
Figure 6.2. Fault-tree analysis of problem root-causes
Incorrect information
Customer or developer supplies information used in the product
development process either externally or internally. Documentation supplied
by the customer, e.g. requirement specification, technical blueprints, may be
incorrect or insufficient leading to high costs, if changes has to be made later
in the product development process. Another factor affecting information
correctness is language barriers, between customer and developer or
internally in the developing company. A factor related to internal language
barriers is lack of knowledge, or differences in knowledge, in different
company departments, e.g. sales, construction, production, quality, and
environment. Sales and environment departments may not be acquainted
with terms used by construction, and vice versa.
Not on time
Regardless if information is correct or not it needs to be available on time.
Not having information on time slows down the process and may cause
unnecessary costs. Information may be delivered late due to lack of time
caused by tight time schedules or high workloads. It may also be the case
customer must approve before the process can go further.
Incorrect destination
Information may be correct and on time but it does not matter if delivered to
wrong destination, e.g. person, department, organization. Unclear
specifications, roles, or authorities may cause wrongful deliveries.

MODEL TESTING
50
Bad communication refers to deficiencies in transferring information
between actors within processes. Underlying reasons for unreliable
information flows due to bad communication are identified in three
categories: lack of cross-functional understanding, lack of communication
policies and protocols, and insufficient media for communication, and
presented in Figure 6.3.
Bad communication
Lack of cross-functional
understanding
OR
Insufficient media for
communication
Lack of communication
policies and protocols
OR
Lack of collaboration
between functions
Vertical organization
OR
Lack of coordination
Lack of feedback
Lack of evaluations
Professional pride
OR
Lack of suitable
information systems
Insufficient meetings
OR
Too big project groups
Lack of time
OR
OR
High workload
Tight time schedule
Figure 6.3. Fault-tree analysis of problem root-causes
Lack of cross-functional understanding
Personnel working in cross-functional processes must understand how their
individual function contributes to the final result. Processes are chains of
functions connected to some extent, i.e. changes in individual functions
might affect others as well. Thus, improvement changes in functions within
processes must be made with consideration to potential effects on other
functions. Lack of collaboration between functions lead to vertical
organizations with multiple individual functions, which acts on their own.
As a result of lacking cross-functional coordination, changes are made
regardless of potential effects in other functions, causing problems
previously non-existing. Furthermore, miscommunication can be a result
from lack of feedback. Improvements cannot be performed if processes are
not evaluated and problems identified. However, feedback can be given but
neglected by the receiver due to professional pride.

MODEL TESTING
51
Lack of communication policies and protocols
Structured policies and protocols for communication within a company are
used for having unified ways of working. Lack of communication policies
and protocols might lead to several individual solutions in structuring
information and consequently, hampering information absorption.
Insufficient media for communication
Communication must be transferred through some kind of media or event,
e.g. information system or meeting. Communication is performed in several
ways and the media used must be suitable to its purpose. Using an
information system not suitable for the specific information transfer could
result in deficiencies in communication. Meetings are common events for
communication but are time consuming. Arranging meetings for big project
groups are hard, as the schedule must consider all involved actors. High
workloads and tight time schedules complicates the coordination of
meetings further more.
6.5 Step 5. Determination of suitable improvements
FTA of two root-causes is created to determine suitable improvements;
observations and interviews have been used to conclude which root-causes
to focus on. Often, one root-cause is enough to identify improvements but
language barriers and vertical organization permeates each other, thus both
were chosen. However, improvements for language barriers does only
account for internal issues. In addition, the authors want to emphasize the
importance of using suitable media for communication. This suggestion will
not be broken down in a FTA as it is deemed superfluous.
Erasing language barriers in the organization can be done in two ways:
increasing personnel’s knowledge in other functions or establishing clear
rules for communication. FTA of how to erase internal language barriers is
presented in Figure 6.4, and how to discard vertical organizations is
presented in Figure 6.5.
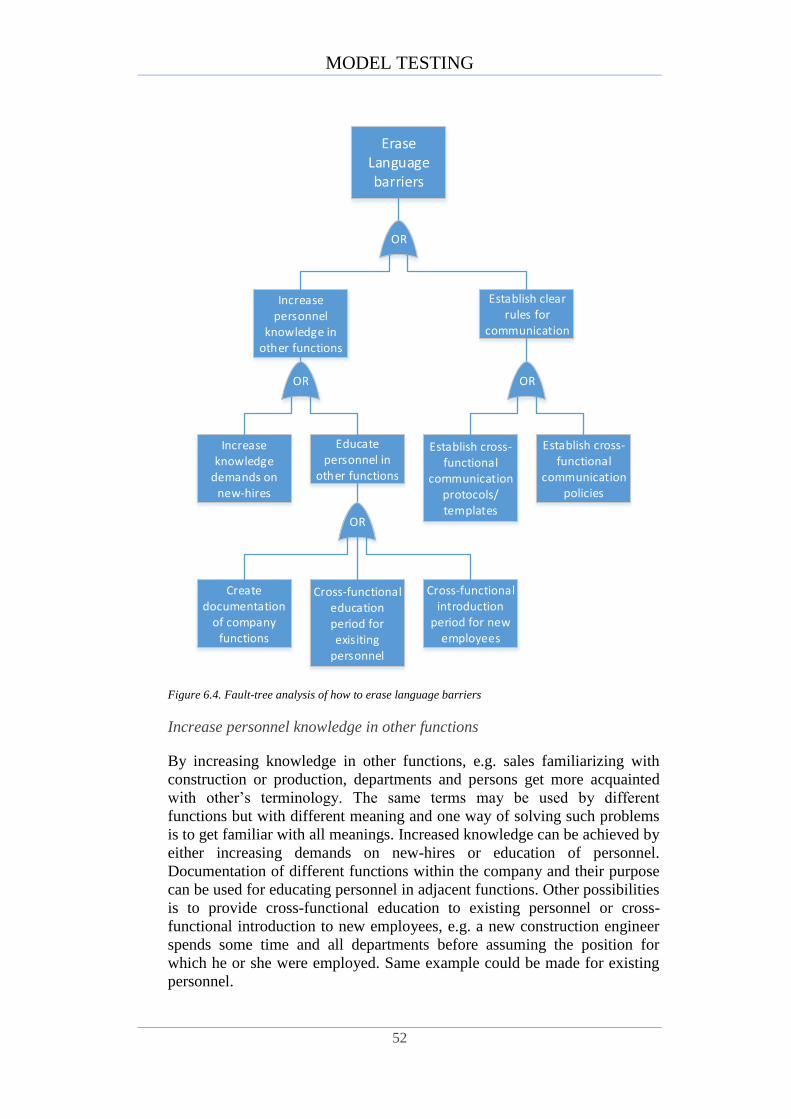
MODEL TESTING
52
Erase Language barriers
OR
Establish clear rules for
communication
Increase personnel
knowledge in other functions
OR
Establish cross-functional
communication policies
Establish cross-functional
communication protocols/templates
OR
Educate personnel in
other functions
Increase knowledge
demands on new-hires
OR
Create documentation
of company functions
Cross-functional education period for exisiting
personnel
Cross-functional introduction
period for new employees
Figure 6.4. Fault-tree analysis of how to erase language barriers
Increase personnel knowledge in other functions
By increasing knowledge in other functions, e.g. sales familiarizing with
construction or production, departments and persons get more acquainted
with other’s terminology. The same terms may be used by different
functions but with different meaning and one way of solving such problems
is to get familiar with all meanings. Increased knowledge can be achieved by
either increasing demands on new-hires or education of personnel.
Documentation of different functions within the company and their purpose
can be used for educating personnel in adjacent functions. Other possibilities
is to provide cross-functional education to existing personnel or cross-
functional introduction to new employees, e.g. a new construction engineer
spends some time and all departments before assuming the position for
which he or she were employed. Same example could be made for existing
personnel.

MODEL TESTING
53
Establish clear rules for communication
By establishing clear rules for communication it is possible to steer the way
personnel interact, thus avoiding misinterpretations or miscommunication
caused by language barriers. Protocols, templates and policies, defining and
describing how communication should be conducted cross-functionally in
organizations, are possible ways for controlling how personnel interact
across functions and ensuring it is done correctly.
Discard vertical organization and working towards a horizontal is the other
advocated solution, it too has two possible routes. Vertical and horizontal, or
line and matrix, organizations are described in Section 3.8.2. FTA for this
solution is presented in Figure 6.5.
Discard vertical organization
OR
Conduct projects cross-
functionally
Increase cross-functional
collaboration
Co-ordinate projects
Make resources
available to projects
OR
Educate personnel in
other functions
Implement internal customer/supplier
philosophy
OR
Create documentation
of company functions
Cross-functional education period for exisiting
personnel
Cross-functional introduction
period for new employees
AND
AND
Identify required
resources
Plan the use of resources
OR
Create cross-functional
project teams
Appoint designated
project manager
Figure 6.5. Fault-tree analysis of discard vertical organization
Increase cross-functional collaboration
To increase cross-functional collaboration it is important personnel learn
they are part of a chain of functions and should not identify themselves as
individuals. Each link is related to and affects the chain and as always, a
chain is not stronger than its weakest link. To ensure employees grasp this
concept it is advocated to implement an internal customer/supplier
philosophy as presented in Section 3.1.2.
Another possible solution is to educate personnel in adjacent functions,
showing how functions are connected to others. By doing or observing work
MODEL TESTING
54
done by other functions, information received and transmitted, making them
aware of how they affect the result of others. There are three ways advocated
for educating personnel, documentation of company functions, cross-
functional education for existing personnel, and cross-functional
introduction period for new personnel.
Conduct projects cross-functionally
Product development is a cross-functional matter, thus it is important to
conduct product development projects as such. For successful product
development projects it is important to make resources available and co-
ordinate them. Before making resources available it is necessary to identify
needed resources for the specific project, e.g. amount of time needed,
personnel, and costs. The identified resources then needs to be planned and
made available at the appointed time. Cross-functional projects require co-
ordination of resources to ensure success. Accordingly, organizations should
appoint cross-functional project teams and appoint a designated project
manager.
6.6 Step 6. Implementation of improvements in next process
The model application has been conducted with Step 1 based on a general
product development process. Consequently, some identified problem root-
causes, and associated solutions, are general and too extensive to be
applicable in a single process. Suitable solutions for implementation at the
case company needs to be more specified and detailed before they can be
applicable. The subject requires more investigation and the result of this
model testing should be seen as a guide for the company, providing
information on potential areas of improvement. Identified improvement
areas are: language barriers, vertical organization, and insufficient media for
communication.

RESULTS
55
7 Results
This section contains the results from both model application and general results
of the study.
7.1 General study results
Main result of this study is the developed model, which has been tested for
improving reliability of information flows in a product development process.
Application of the model has shown possibility of streamlining a product
development process by systematical breakdown of information flow
problems into root-causes. Solutions to identified root-causes leads to
increased customer satisfaction and profitability in projects. The developed
tool, ITSS, incorporated in Step 1 of the model has shown proficiency in
structuring information transfer, even though it was not implemented as
intended. Other tools suggested have proven suitable and has contributed to
the model with simplicity and visualization, as intended. Purpose of the
study was to develop a model for systematically ensuring a reliable flow of
information within product development processes in order to satisfy
customer needs and demands, streamline the process, reduce costs, and
increase profitability. This has been proven possible, though costs and
profitability has not been possible to present in monetary values.
7.2 Results of model application
Model application showed the case company has problems with unreliable
information flows in their product development process. Further
investigation showed it could be contributed by two factors: bad information
quality and bad communication. These factors were broken down further to
identify multiple problem root-causes, from which language barriers and
vertical organization was been identified as most significant. In addition to
the identified root-causes an additional problem were recognized as suitable
improvement area: insufficient media for communication. The significance
of each improvement area, on the information flow, was identified through
observations and interviews with personnel in different functions of the
product development process. The result is presented below, in Table 7.1.
Table 7.1. Significant root-causes
Sales Construction Development
Language barriers Low Medium Medium High
Vertical organization High High High High
Insufficient media for communication High High High None
Root-cause ObservationsInterviews

RESULTS
56
Different solutions to the identified root-cause were determined through
logical reasoning based on knowledge from observations and interviews,
and are presented in Table 7.2 and Table 7.3, including possible benefits and
downsides.
Erase language barriers
Table 7.2. Solutions to erase language barriers
Solution Possible benefits Possible downsides
1. Increase knowledge
demands on new-
hires
No monetary
investment needed and
will increase personnel
competence in long-
term
Hard to find competent
personnel and may
bring demands on
higher salary
2. Create
documentation of
company functions
Increased cross-
functional awareness in
personnel
Requires monetary
investment and there is
no guarantee personnel
will read the
information
3. Cross-functional
education period for
existing personnel
Increased cross-
functional awareness in
personnel and increased
competence without
needing to hire new
people
Time consuming and
requires that personnel
have a willingness to
learn
4. Cross-functional
introduction period
for new employees
Increased cross-
functional awareness in
personnel and increased
competence
Requires longer
introduction period for
new personnel
5. Establish cross-
functional
communication
protocols/templates
Unified structure for
communication
between functions and
reduces chance of
misconceptions
Time consuming and
reduces freedom of
employees
6. Establish cross-
functional
communication
policies
Shared rules for
communication
between functions
Reduces freedom of
employees and no
guarantee personnel
will conform to policy

RESULTS
57
Discard vertical organization
Table 7.3. Solutions to discard vertical organization
Solution Possible benefits Possible downsides
1. Create
documentation of
company functions
Increased cross-
functional awareness in
personnel
Requires monetary
investment and there is
no guarantee personnel
will read the
information
2. Cross-functional
education period
for existing
personnel
Increased cross-
functional awareness in
personnel and increased
competence without
needing to hire new
people
Time consuming and
requires that personnel
have a willingness to
learn
3. Cross-functional
introduction period
for new employees
Increased cross-
functional awareness in
personnel and increased
competence
Requires longer
introduction period for
new personnel
4. Implement internal
customer/supplier
philosophy
Requires no monetary
investment and
enhances in/outputs
between functions.
Cross-functional
awareness is also
improved
Requires commitment
from all personnel,
which may be hard to
achieve
5. Identify required
resources & plan
use of resources
Optimized use of
resources and reduced
risk of overburdening
personnel
Requires extra
planning
6. Create cross-
functional project
teams
Easier planning
personnel and increased
cross-functional
collaboration
Requires re-structuring
the organization
7. Appoint designated
project manager
Increased project co-
ordination and
increases efficiency in
resources used
Cost of hiring new
personnel
RESULTS
58
Usage of suitable media for communication
Large project groups and many projects conducted simultaneously require
suitable media for communication. During model application it can be seen
that meetings is the only planned point for information exchange. This
requires physical presence and is hard to co-ordinate with larger project
groups, which results in fragmented meetings and wry spreading of
information. Persons who lack this information seek to compensate by
interacting with others who has it, thus disturbing them in their work. This
problem can be avoided by relying on other media for information
transference, e.g. various information systems, e-mail, intranet
communication. However, this is associated with sizeable monetary
investment.
Summarized results of model application
Application of the model has resulted in multiple possible solutions. Some
have direct effect on reliability in information flows whilst others have an
indirect effect as they concern the organization. Majority of suggested
improvements extend beyond project limits but some improvements are
directly affecting the investigated case project, e.g. Solution 6 & 7 in
discarding vertical organization, and are believed to greatly affect
profitability and required time of the project. A reliable information flow
will streamline the product development process, enhancing product quality,
reducing required time for development, and reducing costs. These factors
have a positive influence on the profitability of the company.
Neither benefits nor downsides have been associated with costs or financial
gains. It is recommended the case company conducts cost analysis of the
possible solutions before implementing them.

CONCLUSIONS AND RECOMMENDATIONS
59
8 Conclusions and Recommendations
This section contains conclusions of the study and an answer to the formulated
problem question. Criticism towards the developed model, suggestions for future
research and recommendations to the case companies based on the results, will
be presented.
8.1 Conclusions: Solving the formulated problem
The formulated problem for this thesis is How to streamline product
development processes with respect to a reliable information flow? The
problem is solved by developing a model for systematically ensuring a
reliable information flow while satisfying customer needs and demands,
streamlining the process, reducing costs, and increasing profitability.
To identify underlying root-causes for problems in information within
product development processes it is important to have a clear view of how
an optimal process would proceed. Striving to achieve the optimal state of
information flows will in theory result in improvements and elimination of
problems. Accordingly, the model has its basis in planning and structuring
information within processes. Identifying desired information flows, for
specific cases, provide foundations for conducting improvement work within
processes.
Planning and structuring information within product development processes
is facilitated by the authors with the developed tool ITSS. It is a tool
developed to visualize and simplify structuring of information
specifications. In combination to the developed model it is a powerful, yet
user-friendly, tool for providing a clear view of a desired process
information flow.
Structured plans must be followed up in practice to get a result of
differences between theory and actual process flow. By adding checklists
between functions answering Yes or No if planned state of information is
achieved, the model identifies areas of deficiencies within the process. It
further provides holistic views of information flows within processes,
clearly visualizing potential problems.
Problems identified within companies may be superficial and caused by
underlying reasons concealed to companies. Approaching problems without
knowing its cause is ineffective and costly. The model systematically breaks
down problems into root-causes to identify focus areas for improvement. As
problems often can be solved in multiple ways, the model systematically
breaks down solutions as well to find solutions suitable for both specific
cases and different companies.

CONCLUSIONS AND RECOMMENDATIONS
60
Continuous improvements are stated as the foundation for successful
companies. Sequential non-repeating processes, e.g. product development,
needs continuous improvements as well but require a different approach.
Consequently, the model approach this by documenting improvements for
usage in future projects, i.e. learn from previous experiences of similar
processes.
In conclusion, the model provide a user-friendly step by step approach,
which can be used by most companies for structuring information flows
within product development process. Following the steps using suitable
tools will provide a clear view on the information flow within a specific
process with identified problem areas. Implementation of identified
solutions to problem root-causes will result in reliable information flows,
and further reducing costs and increased profitability.
8.2 Criticism of the model
Regardless of its many strong and positive characteristics, the developed
model has some weaknesses that users has to be aware of and consider.
Suggested tools may have alternatives with similar functions, which may be
more suitable for some certain areas or factors. By choosing these tools for
this thesis the authors aim to maintain high generalizability of model
application amongst organizations within the specific area.
Lastly, reliability of data used for evaluation may be questioned. Evaluation
is based on personal experience, thus it may be biased depending on
personal relationships or preconceptions. Consequently, interviews
conducted in this thesis have been done separately so that interviewees does
not affect each other’s answers.
8.3 Future research
Suggestions for future research is to further investigate possibilities for
ensuring reliability in data used for evaluation. In addition, investigation of
other tools possible to use in the model could be done. However, the model
should be tested in its entirety before making any bigger changes,
implementing it in full scale may shed light on other possibilities of future
research.
It may also be interesting to investigate how use of information systems
affect information flow quality and reliability in product development
processes.

CONCLUSIONS AND RECOMMENDATIONS
61
8.4 Comparison of case companies
The study has been performed abductively based on observations at two case
companies with many similarities, but also differences. This section contains
declaration of aforementioned similarities and differences, to enable
comparison of the two companies.
The companies are active in the vicinity of each other, both geographically
and production wise, but products differ quite a lot even though production
techniques are similar. One company produces a majority of standardized
products whilst the other produce customer unique, which result in some
differences between their product development processes, as can be seen in
Figure 5.1 and Figure 5.2.
Regardless, the biggest difference is in the approach to product
development. Emballator Lagan Plast executes product development in a
seemingly methodical and structured manner. Each step of the process is
meticulously specified and visualized in flowcharts etc. They have adopted
the LEAN-philosophy and it permeates the product development process as
well.
Växjöplast is quite the opposite. They are seemingly unstructured and relies
heavily on individual competences to solve situations as they arise.
Documentation of the product development process is scarce.
Despite their differences, they are both successful companies and strong
competitors in their markets. The developed model were tested at Växjöplast
and a full-scale implementation of the model is believed to result in a
streamlined product development process much like the documented process
at Lagan Plast.

CONCLUSIONS AND RECOMMENDATIONS
62
8.5 Recommendations
Our recommendation to the case company, Växjöplast, to erase language
barriers, discard their vertical organization structure, and use a suitable
media for communication, by implementing the solutions presented in
Section 7.1. However, it is advocated to perform a cost-analysis before
implementation to make sure solutions are cost-effective. The authors
recommend the company to fully implement the model in upcoming product
development projects.
Following in Table 8.1, is a DSM of how information flow in a project could
look like with all solutions implemented, based on a combination of
processes at Växjöplast, Lagan Plast, and existing theories.
Table 8.1. Design Structure Matrix, recommended improvements
Each phase during the process has a corresponding team, which is
responsible for the quality of work in their activities, handing over the best
quality possible to next team. Teams consist of people with competence in
activities of their specific phase and co-ordinated by a project manager
whose task is to make the project flow with as little friction as possible. The
project manager is present throughout the entire product development
project until it is handed over to the production phase, where the
industrialization & production team starts their work. Upon hand over, the
entire product development project is evaluated and possible improvements
are identified, to be implemented in upcoming projects.
ACTIVITY 1 2 3 4 5 6 7 8 9 10 11 12 13 14 15 16 17 18 19 20 21 22 23 24 25 26
Pre-study report 1 X XCreate blueprint 2 X X XPre quotation 3 X X X XCalculations 4 X X Feedback XProspect 5 X X X X XProject launch 6 X XCreate project organization 7 X X XCreate time and resource plan 8 X X X XPlan communication 9 X X XEstablish budget 10 X X XCreate test tool 11 X X X XCreate risk analysis 12 X X X XChange management 13 X X XCreate project plan 14 X X X X X X X XFinal quotation 15 X XPreparation work 16 X X XConstruction of product 17 X XExternal & internal construction review 18 X XHand over to production 19 Feed forward X XProject evaluation 20 X XMaterial planning 21 X XProduction planning 22 X XPre Testing 23 X XTool & Assembly testing 24 X XZero-series production 25 XSeries production 26 X X
Planned iterations O Unplanned iterationsX Information flows Planning team
Pre-study team Industrialization & production team
Construction team
REFERENCES
63
9 References
Books:
Al-Najjar, B., 1997. Condition-based maintenance : selection and
improvement of a cost-effective vibration-based policy for rolling element
bearings. Lund: KFS AB.
Bergman, B. & Klefsjö, B., 2010. Quality: from customer needs to customer
satisfaction. 3 ed. Lund: Studentlitteratur.
Bergman, B. & Klefsjö, B., 2012. Kvalitet från behov till användning. 5th
ed. Lund: Studentlitteratur.
Bryman, A., 1997. Kvantitet och kvalitet i samhällsvetenskaplig forskning.
Lund: Studentlitteratur.
Bryman, A. & Bell, E., 2011. Business research methods. 3rd ed. Oxford:
Oxford University Press.
Evans, J. R. & Lindsay, W. M., 2001. The management and control of
quality. 5 ed. Cincinnati(Ohio): South-Western.
Denscombe, M., 2009. Forskningshandboken : för småskaliga
forskningsprojekt inom samhällsvetenskaperna. 2nd ed. Lund:
Studentlitteratur.
Hatch, M. J., 2002. Organisationsteori: moderna, symboliska och
postmoderna perspektiv. Lund: Studentlitteratur.
Hill, T., 2005. Operations Management. 2 ed. Basingstoke: Palgrave
Macmillan.
Holme, I. M. & Solvang, B. K., 1997. Forskningsmetodik: om kvalitativa
och kvantitativa metoder. 2:13 ed. Lund: Studentlitteratur.
Jacobsen, D. I., 2002. Vad, hur och varför : om metodval i företagsekonomi
och andra samhällsvetenskapliga ämnen. 1st ed. Lund: Studentlitteratur.
Jacobsen, D. I. & Thorsvik, J., 2008. Hur moderna organisationer fungerar.
3 ed. Lund: Studentlitteratur.
Jäverberg, K. & Taravosh, Z., 1997. Organisation och ledarskap. Lund:
Studentlitteratur.
Lincoln, Y. S. & Guba, E. G., 1985. Naturalistic inquiry. 1st ed. Beverly
Hills CA: Sage Publications.

REFERENCES
64
Merriam, S. B., 1998. Qualitative Research and Case Study Applications in
Education. 2 ed. San Francisco: Jossey-Bass.
Murthy, C., Bhat, M. & Murthy, M. R., 2010. Information systems
[electronic resource] : theory and applications. Rev. ed. ed. Mumbai:
Himalaya Pub. House.
Patel, R. & Davidson, B., 2011. Forskningsmetodikens grunder: Att planera,
genomföra och rapportera en undersökning. 4:1 ed. Lund: Studentlitteratur.
Pearlson, K. & Saunders, C. S., 2010. Managing and Using Information
Systems: A Strategic Approach. 4 ed. Hoboken: Wiley.
Pyzdek, T. & Keller, P. A., 2010. The Six Sigma Handbook: A Complete
Guide for Green Belts, Black Belts, and Managers at All Levels. 3 ed. New
York: McGraw-Hill Companies.
Rentzhog, O., 1998. Processorientering : en grund för morgondagens
organisationer. 1st ed. Lund: Studentlitteratur.
Sturdy, G. R., 2010. Business Process Reengineering: Strategies for
Occupational Health and Safety. Newcastle: Cambridge Scholars
Publishing.
Sullivan, W. G., Wicks, E. M. & Koelling, C. P., 2012. Engineering
Economy. 15th ed. Harlow: Pearson .
Wilson, C., 2013. Credible checklists and quality questionnaires : a user-
centered design method. 1st ed. Waltham: Morgan Kaufmann.
REFERENCES
65
Articles:
Alsyouf, I., 2007. The role of maintenance in improving companies'
productivity and profitability. International Journal of Production
Economics, 105(1), pp. 70-78.
Ang, C. L., Luo, M., Khoo, L. P. & Gay, R. K. L., 1997. A knowledge-based
approach to the generation of IDEF0 models. International Journal of
Production Research, May, 35(5), pp. 1385-1412.
Cronemyr, P., Öhrwall Rönnbäck, A. & Eppinger, S. D., 2001. A decision
support tool for predicting the impact of development process
improvements.. Journal of Engineering Design, 12(3), pp. 177-199.
Dorador, J. M. & Young, R. I. M., 2000. Application of IDEF0, IDEF3 and
UML methodologies in the creation of information models. International
Journal of Computer Integrated Manufacturing, September, 13(5), pp. 430-
445.
Durugbo, C., Tiwari, A. & Alcock, J. R., 2013. Modelling information flow
for organisations: A review of approaches and future challenges..
International Journal of Information Management, 33(3), pp. 597-610.
Eppinger, S. D., 2001. Innovation at the speed of information. Harvard
Business Review, 10 January, pp. 149-158.
Graner, M. & Mißler-Behr, M., 2012. The use of methods in new product
development - a review of empirical literature.. International Journal of
Product Development., 16(2), pp. 158-184.
Griffin, A. & Page, A., 1996. PDMA success measurement project:
Recommended measures for product development success and failure.
JOURNAL OF PRODUCT INNOVATION MANAGEMENT, Volume 13, pp.
478-496.
Handfield, R. B. & Lawson, B., 2007. Integrating suppliers into new product
development. Research Technology Management, Sep-Oct, 50(5), pp. 44-51.
Jespersen, K. R., 2012. Stage-to-Stage Information Dependency in the NPD
Process: Effective Learning or a Potential Entrapment of NPD Gates?.
Journal of Product Innovation Management., 29(2), pp. 257-274.
Kenett, R. S. & Shmueli, G., 2014. On information quality. Journal of the
Royal Statistical Society: Series A (Statistics in Society), January, 177(1),
pp. 3-38.
Keramidou, I., Mimis, A., Fotinopoulou, A. & Tassis, C. D., 2013.
Exploring the relationship between efficiency and profitability.
Benchmarking: An International Journal, 20(5), pp. 647-680.

REFERENCES
66
Kim, S.-H. & Jang, K.-J., 2002. Designing performance analysis and IDEF0
for enterprise modelling in BPR. International Journal of Production
Economics, 21 March, 76(2), pp. 121-133.
Lu, Q. & Botha, B., 2006. Process development: a theoretical framework..
International Journal of Production Research, 44(15), pp. 2977-2996.
Maheswari, J. U., Varghese, K. & Sridharan, T., 2006. Application of
Dependency Structure Matrix for Activity Sequencing in Concurrent
Engineering Projects.. Journal of Construction Engineering &
Management., 132(5), pp. 482-490.
Majava, J., Haapasato, H., Belt, P. & Mottonen, M., 2013. Product
development drivers in literature and practice.. International Journal of
Product Development., 18(6), pp. 512-530.
McNally, R. C., Akdeniz, M. B. & Calantone, R. J., 2011. New Product
Development Processes and New Product Profitability: Exploring the
Mediating Role of Speed to Market and Product Quality.. Journal of
Product Innovation Management., Issue 1, pp. 63-77.
Nolsøe Grünbaum, N. & Stenger, M., 2013. Dynamic Capabilities: Do They
Lead to Innovation Performance and Profitability?. IUP Journal of Business
Strategy, 10(4), pp. 68-85.
Petkova, V. T., Yuan, L., Ion, R. A. & Sander, P. C., 2005. Designing
reliability information flows. Reliability Engineering & System Safety, May,
88(2), pp. 147-155.
Patil, R. J., 2010. Due date management to improve customer satisfaction
and profitability.. International Journal of Logistics: Research &
Applications., 13(4), pp. 273-289.
Sharma, B. & Gadenne, D., 2008. An Empirical Investigation of the
Relationship between Quality Management Factors and Customer
Satisfaction, Improved Competitive Position and Overall Business
Performance.. Journal of Strategic Marketing, 16(4), pp. 301-314.
Strong, D. M., Lee, Y. W. & Wang, R. Y., 1997. Data Quality in Context.
Communications of the ACM, May, 40(5), pp. 103-110.
Wang, R. Y., Storey, V. C. & Firth, C. P., 1995. A Framework for Analysis
of Data Quality Research. IEEE Transactions in Knowledge and Data
Engineering, August, 7(4), pp. 623-640.
REFERENCES
67
Yang, Q., Yao, T., Lu, T. & Zhang, B., 2014. An Overlapping-Based
Decision Structure Matrix for Measuring Interaction Streangth and
Clustering Analysis in Product Development Project. IEEE Transactions on
Engineering Management, 61(1), pp. 159-169.
REFERENCES
68
Websites:
Business Dictionary, 2014. Definition: Communication. [Online]
Available at:
http://www.businessdictionary.com/definition/communication.html
[Accessed 12 May 2014].
Business Dictionary, 2014. Definition: Cost-effectiveness. [Online]
Available at: http://www.businessdictionary.com/definition/cost-
effectiveness.html
[Accessed 14 April 2014].
Business Dictionary, 2014. Definition: Customer. [Online]
Available at: http://www.businessdictionary.com/definition/customer.html
[Accessed 12 May 2014].
Business Dictionary, 2014. Definition: Function. [Online]
Available at: http://www.businessdictionary.com/definition/function.html
[Accessed 12 May 2014].
Business Dictionary, 2014. Definition: Reliability. [Online]
Available at: http://www.businessdictionary.com/definition/reliability.html
[Accessed 28 April 2014].
Business Dictionary, 2014. Definition: Supplier. [Online]
Available at: http://www.businessdictionary.com/definition/supplier.html
[Accessed 12 May 2014].
APPENDIX
I-1
Appendix I: Literature review
Keyword Database No. of hits Filtering methods Additional keywordsHits after
refined
Number of
relevant articlesProduct development
process effectivenessEmerald 23 703
Published last five
years & Abstract only Information flow 1 0
Science Direct 234 811
Published last five
years, Abstract, Title
& Keyword Information flow 1 0
IEEE Xplore 461
Published last five
years Information flow 0 0
Information reliability Emerald 32 302
Published last five
years & Abstract only Modeling 5 0
Science Direct 448 719
Published last five
years & Abstract only
Modeling,
Improvement 15 0
IEEE Xplore 22 996
Published last five
years & Abstract only
Product development
process 31 0
Improvement models Emerald 24 923
Published last five
years & Abstract only Information flow 1 0
Science Direct 1 107 046
Published last five
years & Abstract only
Information flow
reliability 4 0
IEEE Xplore 38 483
Published last five
years & Abstract only
Information flow
reliability 4 0

APPENDIX
II-1
Appendix II: Lagan Plast Product development process
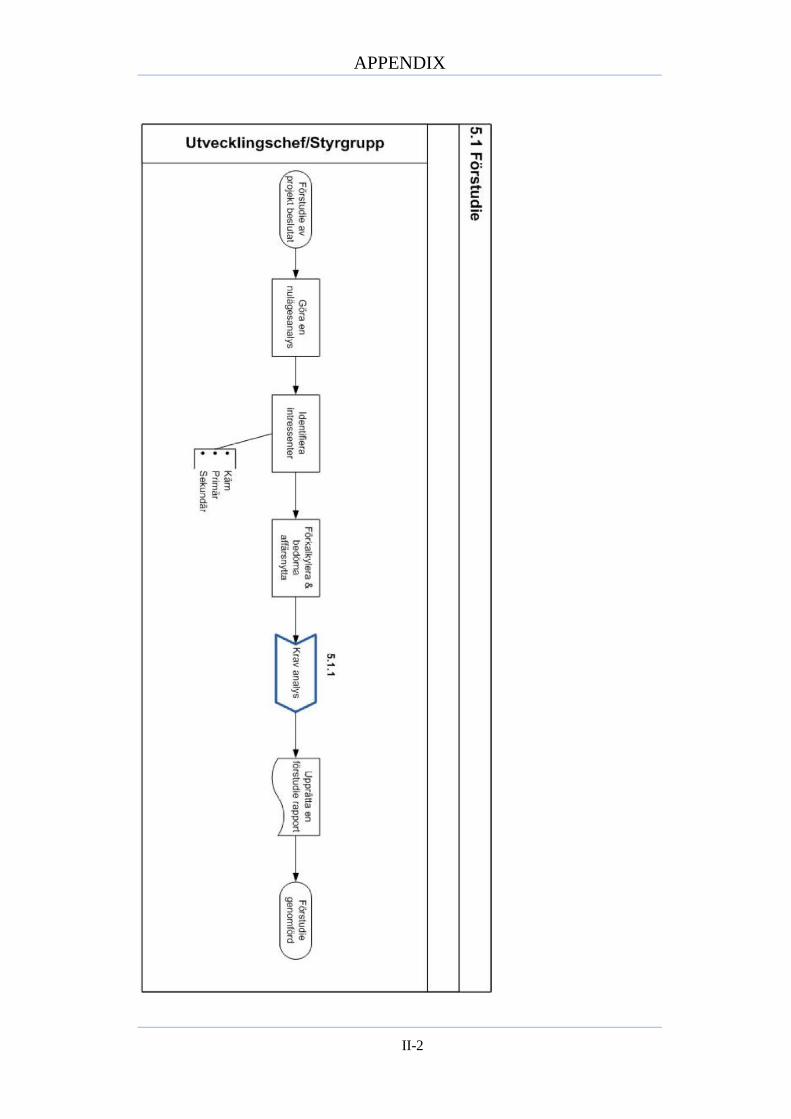
APPENDIX
II-2
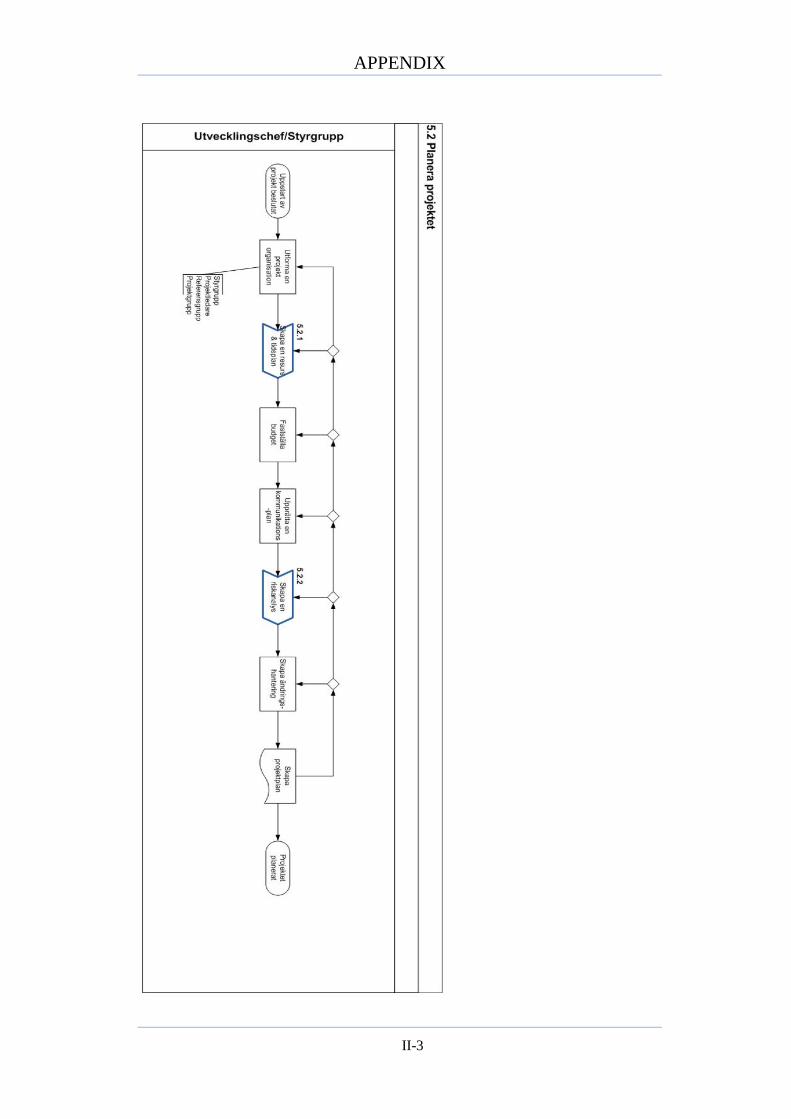
APPENDIX
II-3
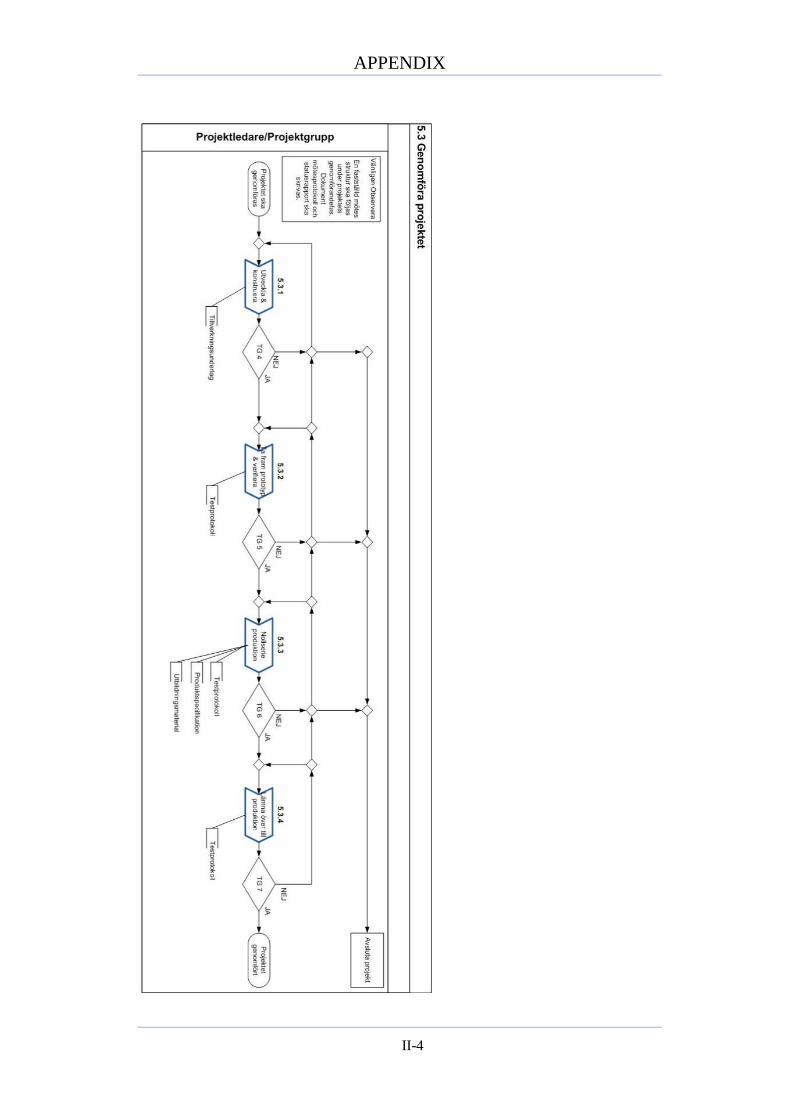
APPENDIX
II-4

APPENDIX
II-5

APPENDIX
III-1
Appendix III: Växjöplast Product development process
Faculty of Technology
SE-391 82 Kalmar | SE-351 95 Växjö
Phone +46 (0)772-28 80 00
Lnu.se/fakulteten-for-teknik