income property analysis introduction. income property analysis acquisition cash flows
Post on 19-Dec-2015
222 views
TRANSCRIPT

INCOME PROPERTY ANALYSISIntroduction
Why Invest in Income Producing Properties?
1) Income derived from rents
2) Expected captial gains
3) Diversification benefits
4) Tax benefits

INCOME PROPERTY ANALYSISIntroduction
1) Compute expected after tax cash flowsa) Acquisitionb) Holding Periodc) Reversion
2) Discount expected after tax cash flows@ required return
3) Decision rules:a) Invest if expected after tax net present value > 0
(Reject if expected ATNPV < 0); OR
b) Invest if expected ATIRR > required return(Reject if expected ATIRR < required return)

INCOME PROPERTY ANALYSISIntroduction
Where does the required return come from?
1) The (after tax) required return is the expected (after tax)return on alternative investments of comparable risk.
Examples of comparable investments?
2) Sometimes computed by adding an equity risk premium(300 to 500 basis points) to the after tax return on the(cost of) the debt.
Equity investments more risky than debt.

INCOME PROPERTY ANALYSISAcquisition Cash Flows
1) Down Payment = Purchase Price - Loan Amount
2) Financing Costs (amortized over the life of the loan):a) loan origination feesb) discount pointsc) appraisalsd) fees for other services/documentation required
by the lender and paid by the investor
We will assume financing costs are paid by the equity investor(e.g. are not financed).
Equity = Down Payment + Financing Costs

INCOME PROPERTY ANALYSISCash Flows from Operations
Effective Gross Income
Gross Rental Revenue: Maximum rental income (assumes the property is 100% occupied)
+ Non Rental Income: Any additional income received bythe property owner (e.g. laundrymat,parking fees, etc.)
= Potential Gross Income
- Vacancy and Collection Losses: uncollected rents
= Effective Gross Income

INCOME PROPERTY ANALYSISCash Flows from Operations
Operating Expenses
Fixed Expenses: expenses that do not vary (much) withoccupancy
1) property taxes2) property insurance (hazard and liability)3) scheduled repairs and maintenance (e.g. painting,
maintenance/repair of electrical and plumbingsystems, HVAC systems and elevator service)
4) general and other administrative expenses:expenses directly related to buildingadministration (e.g. legal and audit fees, generaloffice expenses)

INCOME PROPERTY ANALYSISCash Flows from Operations
Operating Expenses
Variable Expenses: expenses that tend to vary with occupancy
1) Utilities (e.g. water, electricity, gas, heating oil)2) Management: fees paid to property managers for
leasing the property, collecting rents, overseeingmaintenance (usually 5% of effective gross)
3) Janitorial/cleaning (e.g. contract labor, cleaningsupplies, trash removal, etc.)
4) Garage/Grounds/Security

INCOME PROPERTY ANALYSISCash Flows from Operations
Dallas Average psf Office Operating Expenses (June 1990)
Fixed Expenses Downtown Suburbs
Repairs/Maintenance $ 0.86 $ 0.86Security/Grounds 0.39 0.44Other Fixed 1.72 1.27
(Taxes and Insurance)
SOURCE: Dallas Building Owners and Managers AssociationOther source: Institute of Real Estate Management of the
National Association of Realtors

INCOME PROPERTY ANALYSISCash Flows from Operations
Dallas Average psf Office Operating Expenses (June 1990)
Variable Expenses Downtown Suburbs
Janitorial $ 0.63 $ 0.63Utilities 1.33 1.58Administration 1.01 0.82
SOURCE: Dallas Building Owners and Managers AssociationOther source: Institute of Real Estate Management of the
National Association of Realtors
INCOME PROPERTY ANALYSISCash Flows from Operations
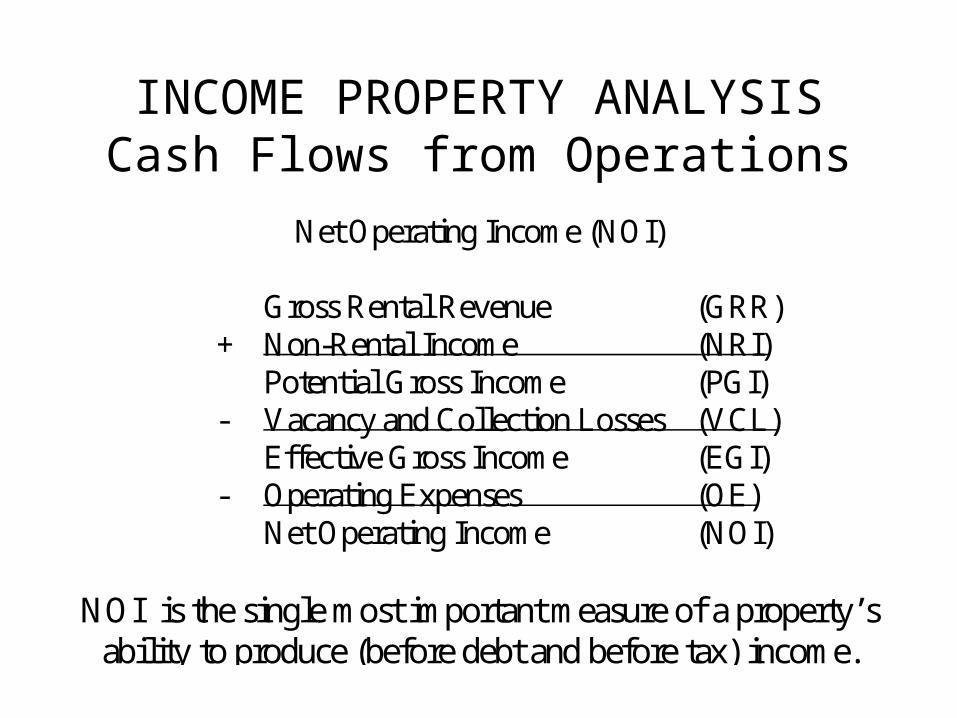
Net Operating Income (NOI)
Gross Rental Revenue (GRR)+ Non-Rental Income (NRI)
Potential Gross Income (PGI)- Vacancy and Collection Losses (VCL)
Effective Gross Income (EGI)- Operating Expenses (OE)
Net Operating Income (NOI)
NOI is the single most important measure of a property’sability to produce (before debt and before tax) income.
INCOME PROPERTY ANALYSISCash Flows from Operations
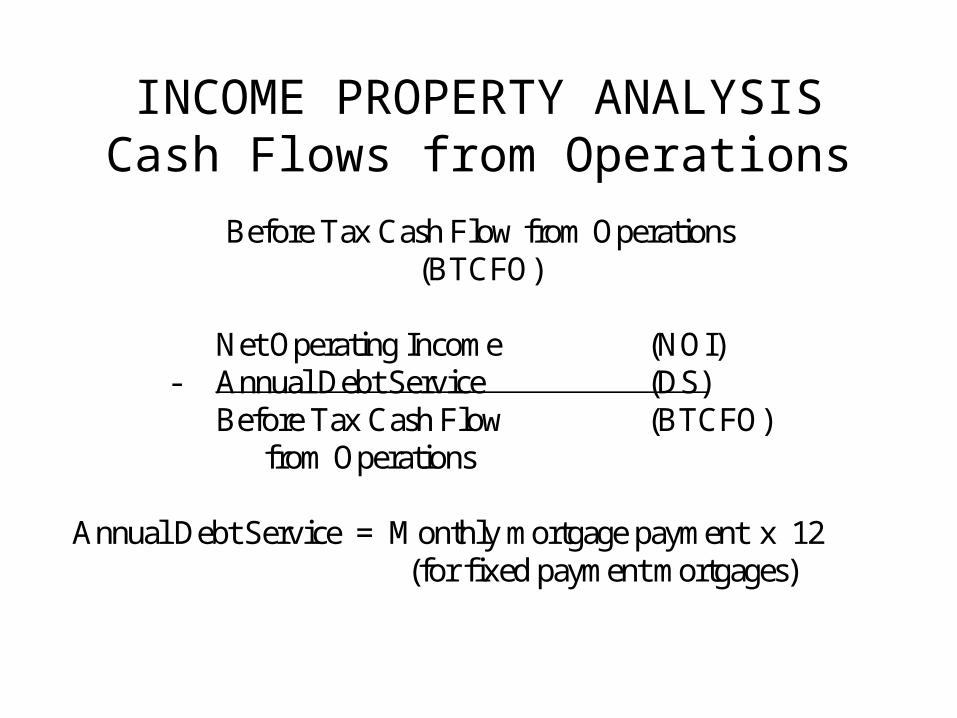
Before Tax Cash Flow from Operations(BTCFO)
Net Operating Income (NOI)- Annual Debt Service (DS)
Before Tax Cash Flow (BTCFO)from Operations
Annual Debt Service = Monthly mortgage payment x 12(for fixed payment mortgages)

INCOME PROPERTY ANALYSISCash Flows from Operations
B u s i n e s s E x p e n s e s
1 ) M o r t g a g e I n t e r e s t
2 ) ( S t r a i g h t L i n e ) D e p r e c i a t i o n
a . D e p r e c i a b l e b a s i s = i m p r o v e m e n t v a l u e
b .
c . U s e f u l L i f e :i ) 2 7 . 5 y e a r s f o r r e s i d e n t i a l p r o p e r t i e si i ) 3 9 . 0 y e a r s f o r n o n - r e s i d e n t i a l p r o p e r t i e s
3 )
S t r a i g h t L i n e R a t eU s e f u l L i f e
1
A m o r t i z a t i o n o f L o a n F e e sL o a n F e e s
L o a n M a t u r i t y

INCOME PROPERTY ANALYSISCash Flows from Operations
Taxable Income & Tax Liability
Net Operating Income (NOI)- Mortgage Interest (I)- Depreciation (D)- Amortization of Loan Fees (A)
Taxable Income (TI)x Ordinary Income Tax Rate (t)
Tax Liability (TAX)

INCOME PROPERTY ANALYSISCash Flows from Operations
Taxable Income & Tax Liability
1996 Tax Rate Schedule- Married Filing Jointly -
Taxable Income Taxable Income Marginal More Than Less Than Tax Rate
0 40,100 15% 40,100 96,900 28% 96,900 147,700 31% 147,700 263,000 36% 263,000 ....... 39.6%

INCOME PROPERTY ANALYSISCash Flows from Operations
After Tax Cash Flows from Operations(ATCFO)
Before Tax Cash Flow from Operations (BTCFO)
- Tax Liability (TAX)
After Tax Cash Flow From Operations (ATCFO)

INCOME PROPERTY ANALYSISSummary: After Tax Cash Flows from Operations
CASH INCOME Gross Rental Revenue Net Operating Income + Non-Rental Income - Interest Potential Gross Income - Depreciation - Vacancy and Collection - Fee Amortization Effective Gross Income Taxable Income - Operating Expenses x Tax Rate Net Operating Income Tax Liability - Debt Service
Before Tax Cash Flow from Operations ATCF
Before Tax Cash Flow from Operations - Tax Liability After Tax Cash Flow from Operations

INCOME PROPERTY ANALYSIS Cash Flows from Reversion
E s t im a te F u tu re S e l l in g P r ic e
T w o c o m m o n te c h n iq u e s(e x . p u rc h a s e p r ic e = $ 1 ,0 0 0 ,0 0 0 a n d h e ld fo r 5 y e a rs ) :
1 ) A p p re c ia te p u rc h a s e p r ic e
e x . $ 1 ,2 1 6 ,6 5 3 = $ 1 ,0 0 0 ,0 0 0 x ( 1 + 0 .0 4 ) 5
2 ) w h e re R = c a p i ta l iz a t io n ra te
e x . $ 1 ,2 1 5 ,7 8 9 = $ 1 1 5 ,5 0 0 /0 .0 9 5
V a lu eN O I
R

INCOME PROPERTY ANALYSIS Cash Flows from Reversion
Before Tax Cash Flow from Reversion
Expected Selling Price (SP)- Selling Commission (usually 4%) (SC)
Sales Proceeds- Mortgage Balance (MB)- Prepayment Penalty ( % of MB ) (PP)
Before Tax Cash Flow from Reversion (BTCFR)

INCOME PROPERTY ANALYSIS Cash Flows from Reversion
Capital Gain Tax Liability
Sales Proceeds- Original Cost (Purchase Price)+ Accumulated Depreciation
Capital Gainx Capital Gain Tax Rate
Capital Gain Tax Liability
CG Tax Rate = Ordinary Income Rate with 28% Maximum

INCOME PROPERTY ANALYSIS Cash Flows from Reversion
Ordinary Income Credit
Unamortized Loan Fee+ Prepayment Penalty
Reversion Expensesx Ordinary Income Tax Rate
Ordinary Income Credit

INCOME PROPERTY ANALYSIS Cash Flows from Reversion
After Tax Cash Flow from Reversion
Before Tax Cash Flow from Reversion- Capital Gain Tax+ Ordinary Income Credit
After Tax Cash Flow from Reversion

INCOME PROPERTY ANALYSISThe Investment Decision: NPV and IRR
1 . T h e a f t e r t a x n e t p r e s e n t v a l u e ( A T N P V ) o f t h e i n v e s t m e n t :
w h e r e T = e x p e c t e d h o l d i n g p e r i o d i n y e a r s ,d = a f t e r t a x r e q u i r e d r e t u r n .
2 . T h e a f t e r t a x i n t e r n a l r a t e o f r e t u r n ( A T I R R ) i s t h a t v a l u e o ft h e d i s c o u n t r a t e , d , t h a t s e t s t h e A T N P V = 0 .
A T N P V E q u i t yA T C F O
d
A T C F R
dt
tt
TT
T
( ) ( )1 11
E q u i t yA T C F O
A T I R R
A T C F R
A T I R Rt
tt
TT
T
( ) ( )1 11

INCOME PROPERTY ANALYSISThe Investment Decision: NPV and IRR
Decision Rules
Invest if expected after tax net present value > 0(Reject if expected ATNPV < 0);
OR
Invest if expected ATIRR > required return(Reject if expected ATIRR < required return)

INCOME PROPERTY ANALYSISThe Investment Decision: NPV and IRR
P r o f i t a b i l i t y I n d e x ( P I )
D e c i s i o n R u l e : I n v e s t i f P I > 1
P IP V o f C a s h I n f l o w s q u i r e d t u r n
I n i t i a l E q u i t y
@ R e R e

INCOME PROPERTY ANALYSISFinancial Statistics: Ratios, Multipliers, Rates of Return
F i n a n c i a l R a t i o s
1 . L o a n t o V a l u e ( L / V ) =
2 . D e b t C o v e r a g e ( D C R ) =
L o a n A m o u n t
M a r k e t V a l u e
N e t O p e r a t i n g I n c o m e
D e b t S e r v i c e

INCOME PROPERTY ANALYSISFinancial Statistics: Ratios, Multipliers, Rates of Return
F i n a n c i a l R a t i o s
3 . O p e r a t i n g E x p e n s e ( O E ) =
4 . B r e a k e v e n O c c u p a n c y L e v e l
=
O p e r a t i n g E x p e n s e s
E f f e c t i v e G r o s s I n c o m e
O p e r a t i n g E x p e n s e s D e b t S e r v i c e
P o t e n t i a l G r o s s I n c o m e

INCOME PROPERTY ANALYSISFinancial Statistics: Ratios, Multipliers, Rates of Return
Multipliers
Income multipliers express the relationship between propertyincome and property value (e.g. value is ten times income):
Multiplier =Market Value
Income

INCOME PROPERTY ANALYSISFinancial Statistics: Ratios, Multipliers, Rates of Return
Multipliers
Since there are five different incomes associated with propertyoperations, there are five multipliers:
1. Potential Gross Income Multiplier2. Effective Gross Income Multiplier3. Net Operating Income Multiplier4. Before Tax Cash Flow Multiplier5. After Tax Cash Flow Multiplier
The NOI multiplier is the most frequently used.

INCOME PROPERTY ANALYSISFinancial Statistics: Ratios, Multipliers, Rates of Return
Rates of Return
1. On the property:
Overall Rate of Return (OAR) =
2. On equity (initial and current)a. before tax equity:
Equity Dividend RateBTROE =Cash on cash return
NOI
MarketValue
BTCFO
Equity

INCOME PROPERTY ANALYSISFinancial Statistics: Ratios, Multipliers, Rates of Return
R a t e s o f R e t u r n
2 . O n e q u i t yb . a f t e r t a x e q u i t y :
A T R O E =
3 . O n d e b t :
A n n u a l m o r t g a g e c o n s t a n t =
A T C F O
E q u i t y
A n n u a l D e b t S e r v i c e
L o a n A m o u n t
INCOME PROPERTY ANALYSISApartment Property Example
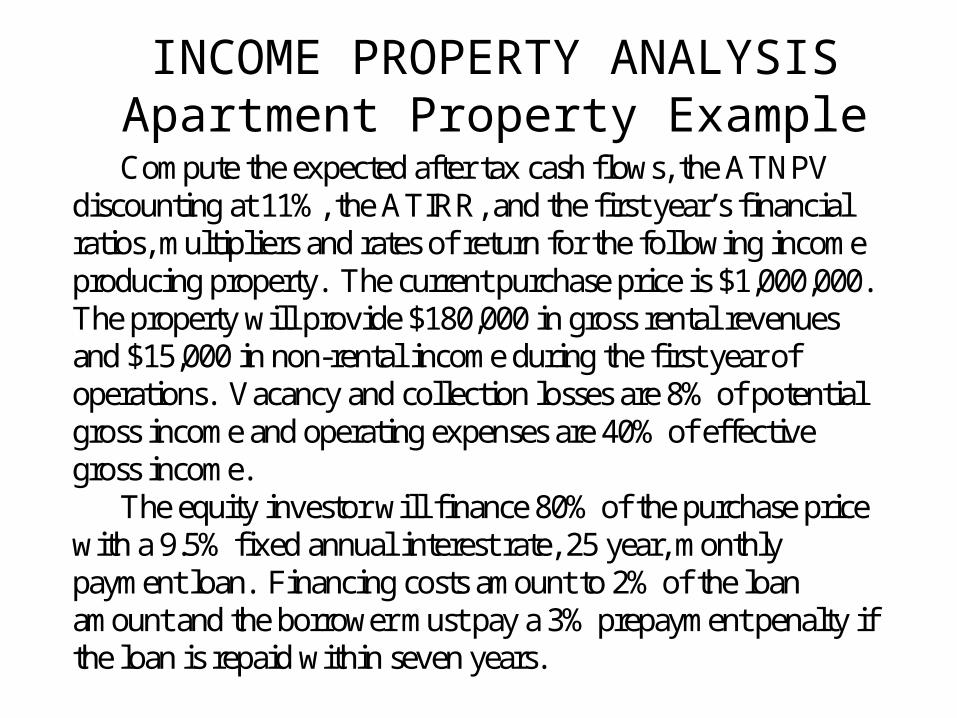
Compute the expected after tax cash flows, the ATNPVdiscounting at 11%, the ATIRR, and the first year’s financialratios, multipliers and rates of return for the following incomeproducing property. The current purchase price is $1,000,000.The property will provide $180,000 in gross rental revenuesand $15,000 in non-rental income during the first year ofoperations. Vacancy and collection losses are 8% of potentialgross income and operating expenses are 40% of effectivegross income.
The equity investor will finance 80% of the purchase pricewith a 9.5% fixed annual interest rate, 25 year, monthlypayment loan. Financing costs amount to 2% of the loanamount and the borrower must pay a 3% prepayment penalty ifthe loan is repaid within seven years.

INCOME PROPERTY ANALYSISApartment Property Example
The investor expects to hold the property for five years.During this period, potential gross income is expected toincrease 4% per year and the market value of the property isexpected to increase 3% per year. The investor will have topay a 4% sales commission at the time of sale in five years.
For tax purposes, 25% of the purchase price is payment forland. The improvement is depreciated using the straight linemethod over 27.5 years. The investor’s ordinary income istaxed at the 36% marginal rate and capital gain income is taxedat the statutory ceiling rate of 28%. The investor has sufficientpassive income to take any passive losses generated by thisproperty.

INCOME PROPERTY ANALYSISApartment Property Example
Initial (After Tax) Equity
1) Down Payment = Purchase Price - Loan Amount= $1,000,000 - $800,000= $200,000
2) Financing Costs = 0.02 x $800,000= $16,000
3) (After Tax) Equity= Down Payment + Financing Costs= $200,000 + $16,000= $216,000

INCOME PROPERTY ANALYSISApartment Property Example
Financing Cash Flows
Purchase Price = $1,000,000Loan Amount = $ 800,000Annual Rate = 9.5%Loan Term = 25 years; constant monthly payments
Monthly PMT = $ 6,989.57Annual Debt Service = $ 83,875
Amortization of Fee = $ 16,000/25 = $ 640Unamortized Fees = $ 16,000 - 5 x $640 = $ 12,800

INCOME PROPERTY ANALYSISApartment Property Example
Amortization Schedule($800,000 loan; 9.5% interest; 25 years)
Year Interest Principal EndingReduction Balance
1 $ 75,647.89 $ 8,226.95 $ 791,773.05 2 $ 74,831.40 $ 9,043.44 $ 782,729.61 3 $ 73,933.86 $ 9,940.98 $ 772,788.63 4 $ 72,947.24 $ 10,927.60 $ 761,861.03 5 $ 71,862.71 $ 12,012.13 $ 749,848.90

INCOME PROPERTY ANALYSISApartment Property Example
Depreciation Calculations
Depreciable Basis = 0.75 x $1,000,000 = $750,000
Annual deduction = $750,000/27.5 = $ 27,272.73
Accumulated Depreciation = 5 x $ 27,272.73 = $136,363.64

INCOME PROPERTY ANALYSISApartment Property Example
Before Tax Cash Flows from Operations
YEAR: 1 2 3 4 5
PGI 195,000 202,800 210,912 219,348 228,122 less VCL - 15,600 - 16,224 - 16,873 - 17,548 - 18250EGI 179,400 186,576 194,039 201,801 209,873 less OE - 71,760 - 74,630 - 77,616 - 80,720 - 83,949NOI 107,640 111,946 116,423 121,080 125,924 less DS - 83,875 - 83,875 - 83,875 - 83,875 - 83,875BTCFO 23,765 28,071 32,549 37,205 42,049

INCOME PROPERTY ANALYSISApartment Property Example
After Tax Cash Flows from Operations
YEAR: 1 2 3 4 5
NOI 107,640 111,946 116,423 121,080 125,924 less I - 75,648 - 74,831 - 73,934 - 72,947 - 71,863 less D - 27,273 - 27,273 - 27,273 - 27,273 - 27,273 less A - 640 - 640 - 640 - 640 - 640TI 4,079 9,201 14,577 20,220 26,148 x 0.36TAX - 1,469 - 3,313 - 5,248 - 7,279 - 9,413
BTCFO 23,765 28,071 32,549 37,205 42,049 less TAX - 1,469 - 3,313 - 5,248 - 7,279 - 9,413ATCFO 22,297 24,758 27,301 29,926 32,635

INCOME PROPERTY ANALYSISApartment Property Example
Before Tax Cash Flow from Reversion(in 5 years)
Estimated Selling Price $ 1,159,274 less Selling Cost - 46,371Sales Proceeds 1,112,903
less Mortgage Balance - 749,849 less Prepayment Penalty - 22,495BTCF from Reversion 340,559

INCOME PROPERTY ANALYSISApartment Property Example
Capital Gain Income
Sales Proceeds $ 1,112,903 less Original Cost - 1,000,000 plus Accumulated Depreciation 136,364Capital Gain 249,267 x 0.28 x 0.28Capital Gain Tax Liability - 69,795

INCOME PROPERTY ANALYSISApartment Property ExampleOrdinary Business Expenses at Reversion
Unamortized loan fee $ 12,800+ Prepayment penalty 22,495
= Total ordinary expenses 35,295x 0.36 x 0.36
Ordinary Income Credit 12,706

INCOME PROPERTY ANALYSISApartment Property Example
After Tax Cash Flow from Reversion
Before Tax Cash Flow from Reversion $ 340,559 less Capital Gain Tax Liability - 69,795 plus Ordinary Income Credit + 12,706After Tax Cash Flow from Reversion 283,471

INCOME PROPERTY ANALYSISApartment Property Example
A T N P V
= + $ 5 1 , 4 5 0
A T N P V
2 1 6 0 0 02 2 2 9 7
1 1 1
2 4 7 5 8
1 1 1
2 7 3 0 1
1 1 1
2 9 9 2 6
1 1 1
3 2 6 3 5 2 8 3 4 7 1
1 1 1
2 3
4 5
,,
.
,
.
,
.
,
. .
, ,
.

INCOME PROPERTY ANALYSISApartment Property Example
A T IR R
A T IR R = d = 1 6 .7 8 %
2 1 6 0 0 02 2 2 9 7
1
2 4 7 5 8
1
2 7 3 0 1
1
2 9 9 2 6
1
3 2 6 3 5 2 8 3 4 7 1
1
2 3
4 5
,, ,
( )
,
( )
,
( )
, ,
( )
d d d
d d

INCOME PROPERTY ANALYSISApartment Property Example
P r o f i t a b i l i t y I n d e x
2 1 6 , 0 0 0
= 2 6 7 , 4 5 0 / 2 1 6 , 0 0 0
= 1 . 2 3 8 2
P I
2 2 2 9 7
1 1 1
2 4 7 5 8
1 1 1
2 7 3 0 1
1 1 1
2 9 9 2 6
1 1 1
3 2 6 3 5 2 8 3 4 7 1
1 1 12 3 4 5
,
.
,
.
,
.
,
. .
, ,
.
INCOME PROPERTY ANALYSISApartment Property Example
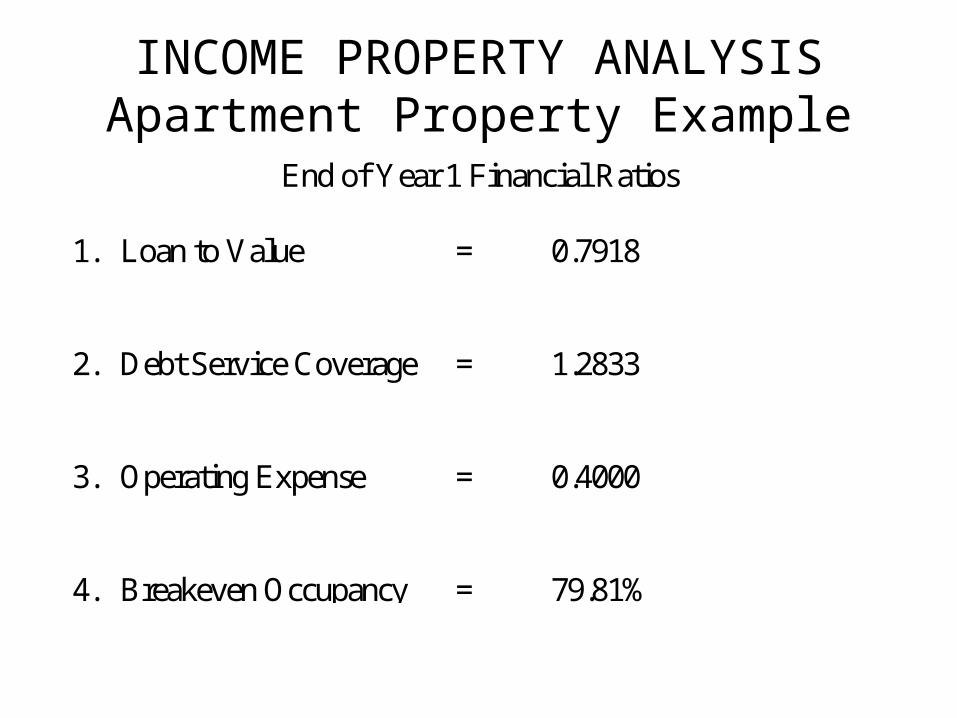
End of Year 1 Financial Ratios
1. Loan to Value = 0.7918
2. Debt Service Coverage = 1.2833
3. Operating Expense = 0.4000
4. Breakeven Occupancy = 79.81%

INCOME PROPERTY ANALYSISApartment Property Example
End of Year 1 Multipliers
1. Potential Gross Income = 5.28
2. Effective Gross Income = 5.74
3. Net Operating Income = 9.57
4. Before Tax Cash Flow = 43.34
5. After Tax Cash Flow = 46.20

INCOME PROPERTY ANALYSISApartment Property Example
Year 1 Rates of Return
Overall Rate of Return = 10.45%
BTROE = 11.00%
ATROE = 10.32%
Annual Mortgage Constant = 10.48%

Insert INCOME1 Spreadsheet Here

INCOME PROPERTY ANALYSISFinancial Leverage
FINANCIAL LEVERAGE describes the relationship betweenthe investment return and the amount of debt used tofinance the acquisition
Leverage is POSITIVE when the IRR increases with debt;
leverage is NEGATIVE when the IRR decreases with debt;
and leverage is NEUTRAL when the IRR doesn’t changewith debt.
LEVERAGE can be examined using before or after tax returns

INCOME PROPERTY ANALYSISFinancial LeverageApartment Property Example
Loan Option BTIRR ATIRR
Cash 13.28% 9.11%
70% L/V; 9.25% i; 2 points 19.15% 14.20%
80% L/V; 9.50% i; 2 points 21.81% 16.78%
85% L/V; 10.5% i; 3 points 19.18% 15.55%

INCOME PROPERTY ANALYSISSensitivity Analysis
SENSITIVITY ANALYSIS: examines how sensitive expectedinvestment returns are to changes in one variable.
What are the major uncertainties for income producing properties?

INCOME PROPERTY ANALYSISSensitivity Analysis
Appreciation ATIRR ATNPVRate
@ 5% 21.23% $ 99,446
@ 3% 16.78% $ 51,450
no change 9.18% ($13,883)
@ 3% - 0.41% ($71,829)