income distribution in intellectual property rights
TRANSCRIPT

INCOME DISTRIBUTION IN INTELLECTUAL PROPERTY RIGHTS PROTECTION
Aisling Winston
A dissertation submitted to the faculty at the University of North Carolina at Chapel Hill inpartial fulfillment of the requirements for the degree of Doctor of Philosophy in the Department
of Economics.
Chapel Hill2018
Approved by:
Gary Biglaiser
Simon Alder
Timothy J. McKeown
Kyle L. Woodward
Andrew J. Yates

c© 2018Aisling Winston
ALL RIGHTS RESERVED
ii

ABSTRACT
Aisling Winston: Income Distribution in Intellectual Property Rights Protection(Under the direction of Gary Biglaiser)
This paper proposes a general model of the government’s choice of intellectual property
rights protection given the structure of the import market and the distribution of consumers’
incomes. The model shows that the optimal level of protection chosen by the government, while
most heavily influenced by institutional structures, differs depending on whether there is a
competitive domestic fringe or a single domestic firm and on whether consumers’ incomes are
relatively equally or unequally distributed. Measures of de facto and de jure intellectual property
rights protection are used to test the implications of the models.
The model is then extended to include local governments in trying to explain the divergence
between the formal level of protection and the reality of protection in different localities.
Localities, in response to their constituents and their preferences for foreign actors, will choose to
deviate from the federal level of protection, subject to the level of autonomy. The federal
government will take the chosen deviations and international obligations into consideration when
choosing the federal level of protection. These deviations are affected by the objective of domestic
production: local consumption or export.
Finally, the models are complemented by a country study of Jordan which examines more
closely the effect of specific institutional structures in understanding one government’s choice of
protection. The pharmaceutical industry in Jordan provides a compelling case study, as it is
dependent upon intellectual property rights protection. The level of protection increased markedly
in 2000, following a distinct change in government policy in favor of foreign firms, moving Jordan
from one of the worst to one of the best protectors of intellectual property rights protection in its
region. The country study uses the model to explain the levels of protection before and after this
change in Jordan as compared to protection in institutionally similar countries.
iii

TABLE OF CONTENTS
List of Tables . . . . . . . . . . . . . . . . . . . . . . . . . . . . . . . . . . . . . . . . . . . . vi
List of Figures . . . . . . . . . . . . . . . . . . . . . . . . . . . . . . . . . . . . . . . . . . . vii
List of Abbreviations . . . . . . . . . . . . . . . . . . . . . . . . . . . . . . . . . . . . . . . ix
1 Introduction . . . . . . . . . . . . . . . . . . . . . . . . . . . . . . . . . . . . . . . . . . 1
1.1 Introduction . . . . . . . . . . . . . . . . . . . . . . . . . . . . . . . . . . . . . . . . . 1
1.2 Literature Review . . . . . . . . . . . . . . . . . . . . . . . . . . . . . . . . . . . . . 3
1.2.1 IPR Protection as a Determinant of Growth, Innovation, and Investment . . 4
1.2.2 Other Related Literature . . . . . . . . . . . . . . . . . . . . . . . . . . . . . 5
2 A Model of the Choice of Intellectual Property Rights Protection . . . . . . . . 7
2.1 A Basic Model of Consumers and Firms in a Country with IPR Protection . . . . . 8
2.1.1 Set-Up . . . . . . . . . . . . . . . . . . . . . . . . . . . . . . . . . . . . . . . . 8
2.1.2 Competitive Domestic Fringe . . . . . . . . . . . . . . . . . . . . . . . . . . . 11
2.1.3 Single Domestic Firm . . . . . . . . . . . . . . . . . . . . . . . . . . . . . . . 12
2.1.4 Comparing the Cases of the General Model . . . . . . . . . . . . . . . . . . . 15
2.2 Applications of the Model to Specific Distributions . . . . . . . . . . . . . . . . . . . 17
2.2.1 Triangular Distribution . . . . . . . . . . . . . . . . . . . . . . . . . . . . . . 18
2.2.2 Weibull Distribution . . . . . . . . . . . . . . . . . . . . . . . . . . . . . . . . 21
2.3 Empirical Analysis . . . . . . . . . . . . . . . . . . . . . . . . . . . . . . . . . . . . . 24
2.3.1 Data . . . . . . . . . . . . . . . . . . . . . . . . . . . . . . . . . . . . . . . . . 25
2.3.2 Descriptive Statistics . . . . . . . . . . . . . . . . . . . . . . . . . . . . . . . . 29
2.3.3 Results . . . . . . . . . . . . . . . . . . . . . . . . . . . . . . . . . . . . . . . 31
2.4 Conclusion . . . . . . . . . . . . . . . . . . . . . . . . . . . . . . . . . . . . . . . . . 36
iv

3 Extension - Local Governments . . . . . . . . . . . . . . . . . . . . . . . . . . . . . . 37
3.1 Consumers . . . . . . . . . . . . . . . . . . . . . . . . . . . . . . . . . . . . . . . . . 38
3.2 Firms . . . . . . . . . . . . . . . . . . . . . . . . . . . . . . . . . . . . . . . . . . . . 38
3.2.1 Competitive Domestic Fringe . . . . . . . . . . . . . . . . . . . . . . . . . . . 39
3.2.2 Single Domestic Firm . . . . . . . . . . . . . . . . . . . . . . . . . . . . . . . 40
3.3 Local Governments . . . . . . . . . . . . . . . . . . . . . . . . . . . . . . . . . . . . . 41
3.3.1 Competitive Domestic Fringe . . . . . . . . . . . . . . . . . . . . . . . . . . . 41
3.3.2 Single Domestic Firm . . . . . . . . . . . . . . . . . . . . . . . . . . . . . . . 42
3.4 Federal Government . . . . . . . . . . . . . . . . . . . . . . . . . . . . . . . . . . . . 43
3.4.1 Competitive Domestic Fringe . . . . . . . . . . . . . . . . . . . . . . . . . . . 43
3.4.2 Single Domestic Firm . . . . . . . . . . . . . . . . . . . . . . . . . . . . . . . 44
3.5 Discussion . . . . . . . . . . . . . . . . . . . . . . . . . . . . . . . . . . . . . . . . . . 44
3.6 Conclusion . . . . . . . . . . . . . . . . . . . . . . . . . . . . . . . . . . . . . . . . . 46
4 Country Study - Jordan . . . . . . . . . . . . . . . . . . . . . . . . . . . . . . . . . . . 48
4.1 History of Intellectual Property Rights Protection in Jordan . . . . . . . . . . . . . . 50
4.1.1 IPR Protection before 2000 . . . . . . . . . . . . . . . . . . . . . . . . . . . . 51
4.1.2 Increase in IPR Protection . . . . . . . . . . . . . . . . . . . . . . . . . . . . 52
4.1.3 IPR Protection after 2000 . . . . . . . . . . . . . . . . . . . . . . . . . . . . . 53
4.1.4 Discussion of the Increase in Protection . . . . . . . . . . . . . . . . . . . . . 54
4.2 IPR Protection in Comparison Countries . . . . . . . . . . . . . . . . . . . . . . . . . 58
4.2.1 Egypt . . . . . . . . . . . . . . . . . . . . . . . . . . . . . . . . . . . . . . . . 58
4.2.2 Iraq . . . . . . . . . . . . . . . . . . . . . . . . . . . . . . . . . . . . . . . . . 59
4.2.3 Lebanon . . . . . . . . . . . . . . . . . . . . . . . . . . . . . . . . . . . . . . . 61
4.2.4 Morocco . . . . . . . . . . . . . . . . . . . . . . . . . . . . . . . . . . . . . . . 61
4.2.5 Syria . . . . . . . . . . . . . . . . . . . . . . . . . . . . . . . . . . . . . . . . . 62
4.2.6 Tunisia . . . . . . . . . . . . . . . . . . . . . . . . . . . . . . . . . . . . . . . 63
4.2.7 Yemen . . . . . . . . . . . . . . . . . . . . . . . . . . . . . . . . . . . . . . . . 63
4.3 Brief Economic Overview of Comparison Countries . . . . . . . . . . . . . . . . . . . 64
4.4 Relating the Jordanian Experience to the Model . . . . . . . . . . . . . . . . . . . . 66
v

4.4.1 Market Structure . . . . . . . . . . . . . . . . . . . . . . . . . . . . . . . . . . 67
4.4.2 Distribution of Income . . . . . . . . . . . . . . . . . . . . . . . . . . . . . . . 71
4.4.3 Local Government . . . . . . . . . . . . . . . . . . . . . . . . . . . . . . . . . 73
4.5 Conclusion . . . . . . . . . . . . . . . . . . . . . . . . . . . . . . . . . . . . . . . . . 74
5 Conclusion . . . . . . . . . . . . . . . . . . . . . . . . . . . . . . . . . . . . . . . . . . . 76
A Explanation of Model Results . . . . . . . . . . . . . . . . . . . . . . . . . . . . . . . 78
A.1 General Model . . . . . . . . . . . . . . . . . . . . . . . . . . . . . . . . . . . . . . . 78
A.1.1 Competitive Domestic Fringe . . . . . . . . . . . . . . . . . . . . . . . . . . . 78
A.1.2 Single Domestic Firm . . . . . . . . . . . . . . . . . . . . . . . . . . . . . . . 81
A.2 Application: Triangular Distribution . . . . . . . . . . . . . . . . . . . . . . . . . . . 85
A.2.1 Competitive Domestic Fringe . . . . . . . . . . . . . . . . . . . . . . . . . . . 86
A.3 Application: Weibull Distribution . . . . . . . . . . . . . . . . . . . . . . . . . . . . . 88
A.3.1 Competitive Domestic Fringe . . . . . . . . . . . . . . . . . . . . . . . . . . . 88
A.3.2 Single Domestic Firm . . . . . . . . . . . . . . . . . . . . . . . . . . . . . . . 91
B Additional Tables . . . . . . . . . . . . . . . . . . . . . . . . . . . . . . . . . . . . . . . 94
References . . . . . . . . . . . . . . . . . . . . . . . . . . . . . . . . . . . . . . . . . . . . . . 101
vi

LIST OF TABLES
2.1 General Model - Key Results . . . . . . . . . . . . . . . . . . . . . . . . . . . . . . . 15
2.2 General Model - Responses to Changes in Protection . . . . . . . . . . . . . . . . . . 16
2.3 Triangular Distribution with Competitive Domestic Fringe . . . . . . . . . . . . . . . 20
2.4 Triangular Distribution with Single Domestic Firm . . . . . . . . . . . . . . . . . . . 21
2.5 Weibull Distribution with Competitive Domestic Fringe . . . . . . . . . . . . . . . . 23
2.6 Weibull Distribution with Single Domestic Firm . . . . . . . . . . . . . . . . . . . . . 24
2.7 Descriptive Statistics by Income Classification . . . . . . . . . . . . . . . . . . . . . . 30
2.8 Descriptive Statistics by Government Type . . . . . . . . . . . . . . . . . . . . . . . 30
2.9 Descriptive Statistics before and after TRIPS . . . . . . . . . . . . . . . . . . . . . . 31
2.10 Regressions on Formal IPR Protection . . . . . . . . . . . . . . . . . . . . . . . . . . 32
2.11 Regressions on De Facto IPR Protection . . . . . . . . . . . . . . . . . . . . . . . . . 32
2.12 Regressions on De Facto IPR Protection . . . . . . . . . . . . . . . . . . . . . . . . . 34
2.13 Regressions on Formal IPR Protection . . . . . . . . . . . . . . . . . . . . . . . . . . 35
B.1 Regressions on Formal and De Facto IPR Protection . . . . . . . . . . . . . . . . . . 94
B.2 Regressions on Formal and De Facto IPR Protection . . . . . . . . . . . . . . . . . . 95
B.3 Regressions on Formal IPR Protection in Developing Economies . . . . . . . . . . . 95
B.4 Regressions on De Facto IPR Protection in Developing Economies . . . . . . . . . . 96
B.5 Regressions on De Facto IPR Protection in Developing Economies . . . . . . . . . . 97
B.6 List of Included Countries . . . . . . . . . . . . . . . . . . . . . . . . . . . . . . . . . 98
B.7 Deviation of De Facto IPR Protection from Formal IPR Protection . . . . . . . . . . 99
B.8 Selected Jordanian IPR Protection Data . . . . . . . . . . . . . . . . . . . . . . . . . 100
vii
LIST OF FIGURES
4.1 Formal IPR Protection in MENA . . . . . . . . . . . . . . . . . . . . . . . . . . . . . 50
4.2 De Facto IPR Protection in MENA . . . . . . . . . . . . . . . . . . . . . . . . . . . . 51
4.3 Formal IPR Protection in Comparison Countries . . . . . . . . . . . . . . . . . . . . 68
4.4 De Facto IPR Protection in Comparison Countries . . . . . . . . . . . . . . . . . . . 68
4.5 Intensity of Local Competition in Comparison Countries . . . . . . . . . . . . . . . . 69
4.6 Extent of Market Dominance in Comparison Countries . . . . . . . . . . . . . . . . . 70
4.7 Gini in Comparison Countries . . . . . . . . . . . . . . . . . . . . . . . . . . . . . . . 72
viii
LIST OF ABBREVIATIONS
GDP Gross Domestic Product
GNI Gross National Income
GP Index Ginarte and Park Index
IPR Intellectual Property Rights
TRIPS Agreement on Trade-Related Aspects of Intellectual Property Rights
WEF World Economic Forum
WTO World Trade Organization
ix

CHAPTER 1: INTRODUCTION
1.1 Introduction
Despite the international community’s demand for ever increasing protection of intellectual
property rights (IPR), divergence in the protection of IPR persists. While a number of countries
have continued to strengthen protection over time, mandating IPR protection clauses in bilateral
and multilateral agreements and instituting and strictly enforcing patent laws, others have been
persistent in their non-protection, both within the formal legal sphere and in terms of actual
enforcement. Given the recent emphasis in international agreements on increased and somewhat
homogenized enforcement of IPR protection, it is interesting to examine why governments persist
in choosing low levels of IPR enforcement, even in the face of potential retaliation from trading
partners or potential loss of investment. This paper argues that governments, especially those in
developing economies, take into consideration the structures of their import markets, levels of
inequality, and institutions in determining their optimal levels of IPR protection.
The model introduced in this paper assumes a developing country importing a good with
exogenously-determined quality from a developed country. The general form of this model has
two cases: 1) the import sector has a competitive domestic fringe attempting to imitate and sell
their own versions of the foreign good, and 2) the import sector has a single domestic firm
attempting to imitate and sell its own version of the good. In both cases, the timeline is as
follows: first, the government chooses the level of IPR protection, then the firms choose their
prices (the domestic price will be equal to the marginal cost, assumed to be zero, in the case of
the competitive domestic fringe), and finally consumers choose to purchase 0 or 1 unit of the good
(either the domestic or the foreign). The government’s choice of IPR protection will ultimately
depend on institutions—in this model, institutions specifically refer to how much weight the
government places on the interests of domestic actors versus the weight it places on the interests
of the foreign producer—but the application of the model to two different income distributions
1

will help to elucidate incentives to raise or lower protection despite the influence of institutions.
The general model takes institutions as exogenously determined. The case in which the
institutions are determined by the consumers and firms themselves is left for a later extension.
The model shows that, in the case of the competitive domestic fringe, higher levels of
protection benefit only the foreign firm and hurt all consumers (the domestic firms are ultimately
unaffected). In the case of a duopoly, higher levels of protection benefit the foreign firm and the
consumers of the foreign good but hurt the consumers of the domestic good. Higher protection
first benefits then hurts the domestic firm. It is also shown that more inequality (specifically a
majority of consumers of the poorest type) encourages the government to choose a lower level of
protection, all else equal.
The model in its current form is inherently simplistic in its conception of the government
with the intention of highlighting the role of the distribution of income in influencing the
government’s behavior. It cannot, therefore, fully explain why governments deviate from the
optimal level of protection. An extension of the model explored in Chapter 3 introduces one
reason for this deviation: local governments. The extension considers the impact of local
governments with objectives that might either align with or contradict those of the federal
government in explaining the deviation between the formal and de facto levels of protection. The
chosen deviation of the local government is dependent upon the interests of the domestic actors
and the local government’s preferences for domestic versus foreign actors. It is further affected by
whether the foreign and domestic firms are producing for consumption in the locality,
consumption in other localities, or export. Local governments are constrained in their deviations
by the level of autonomy. The federal government chooses its level of protection by weighing the
chosen levels of deviation and international obligations.
Finally these models are complemented by a country study of Jordan which examines more
closely the effect of specific institutional structures in understanding one government’s choice of
protection in comparison to policies in similar countries. The pharmaceutical industry in Jordan
provides a compelling case study, as it is dependent upon intellectual property rights protection.
The level of protection increased markedly in 2000, following a distinct change in government
policy in favor of foreign firms. This change moved Jordan from one of the worst to one of the
best protectors of IPR protection among similar countries. The country study uses the model to
2

explain the levels of protection in Jordan before and after this change as compared to a group of
countries with similar religious make-up, colonial and legal history, per capita incomes, and
cultures.
The order of this paper is as follows: Chapter 1 introduces the model and looks at the related
literature, Chapter 2 lays out the base model, Chapter 3 gives the extension with local
governments, Chapter 4 examines the case of Jordan, and Chapter 5 concludes.
1.2 Literature Review
Very little of the economic literature on IPR protection tries to predict protection itself. The
most closely-related attempts to explain IPR protection in the economic literature are those of
Ginarte and Park (1997), in the same article in which they introduce their measure of IPR
protection, and that of Chen and Puttitanun (2005). While both look at the role of per capita
income on predicting IPR, neither looks at the distribution of income.
Ginarte and Park attempt to explain the level of IPR protection by looking at per capita
GDP, openness to trade, political and market freedom, and investment in innovation. They
predicted that increases in all of the aforementioned factors would increase the incentive to
protect IPR. They found that different factors were more or less important depending upon the
per capita GDP. For example, investment in innovation was only an important driver of
protection if the country was sufficiently wealthy to be creating new technologies when investing,
and openness was only an important driver of protection in the poorer countries, ostensibly
because most of the wealthier countries were already relatively open. An alternative explanation
to the co-occurrence is that poorer countries are more vulnerable to outside pressures to adopt
neo-liberal policies, including openness to trade.
Chen and Puttitanun attempt to explain the government’s choice of IPR protection by
examining the trade-off between allowing firms to imitate foreign technology and promoting
domestic innovation as avenues for growth. The authors conclude that innovation in a country
increases IPR protection, but that this protection is U-shaped in development, as defined by per
capita income. As Ginarte and Park (1997) concluded, much of the variation in IPR protection in
the data seems to be explained by the per capita GDP, and the interaction between per capita
3

GDP and other explanatory variables is important. It is possible that GDP per capita is
obscuring or reflecting the importance of other institutions, as there appears to be a relatively
strong link between colonial and institutional history and GDP per capita.
Instead of trying to predict IPR protection, much of the related literature looks at the
impact of IPR protection on growth, innovation, and foreign investment. The below sections
consider some of the literature that uses IPR as a determinant of other measures of development
and related literature that is not specific to IPR protection.
1.2.1 IPR Protection as a Determinant of Growth, Innovation, and Investment
Until recently, conventional wisdom, reflected in the stance of the World Trade Organization
and other international organizations, has dictated that stronger enforcement of IPR should lead
to an increased level of international investment in a country. In contrast, however, we have seen
foreign investment grow in countries with relatively weak enforcement of IPR (Zhao 2006). Zhao
argues that companies that are able to effectively protect their valuable intellectual property
through internal structures are likely to continue to invest abroad to take advantage of lower
costs, despite low protection of IPR. If companies are able to use their internal structures to
provide the protection a country cannot or will not provide, then the necessity of strong formal
protection is alleviated, encouraging foreign investment.
Additionally, many economists have argued that strict IPR enforcement may have quite
negative short-term consequences for developing countries, including the suppression of innovation
(Glass 2004), a reduction in technology and knowledge transmission (Helpman 1993, Lai 1998,
Parello 2008), and a decrease in current consumption (Kwan and Lai 2003). Others have argued
that, for lower levels of development, relatively weak IPR protection might be more conducive to
growth as the imitation effect dominates the innovation effect. That is, countries with low levels
of development are unable to innovate on a par with core countries and so could benefit more
from imitating current technology. As a country’s level of development rises, it can benefit more
instead from the efficiencies that accompany innovation (Acemoglu 2006, Chen 2005, Maskus
2000, Parello 2008). Despite this, strict IPR enforcement remains an effective tool for attracting
foreign investment, and so countries often endeavor to provide adequate protection of IPR,
through both formal and informal channels (Parello 2008). This idea of the innovation and
4

imitation effects supports the frequently seen argument of a quadratic relationship between
development, as illustrated by GDP per capita, and IPR protection.
Other literature in the field examines the relationship between patents, their enforcement,
and innovation. Again, conventional wisdom dictates that stronger IPR protection promotes
innovation. Moser (2013) showed that the historical record does not necessarily support this view.
The ability to keep trade secrets, not effective legal IPR protection, has mattered more
historically to innovation. However, Moser did note that IPR protection has had a notable impact
on the direction of technological change. Countries with effective IPR regimes have a wider
breadth of innovation, especially in manufacturing industries. This being said, Moser shows,
based on a survey of firms, that most sectors do not perceive patents as an effective means of IPR
protection, preferring secrecy. The notable exceptions to this are the chemical and
pharmaceutical sectors. Lerner (2009) found a striking relationship between patents and IPR
protection, namely that while foreign patent applications in a country increased steeply following
an increase in IPR protection, patent applications by the residents of that country decreased
following the same increase in protection. This lends support to the idea that better protection
encourages foreign involvement in a country, but certainly also casts doubt on the idea that better
protection fosters innovation. The experience of countries such as Lebanon and Jordan have
demonstrated that increased protection at least correlates with additional foreign investment and
confidence, and while rhetoric in both countries extols the potential benefits of increased
protection for domestic innovation, it is still too early to see if that benefit has been realized.
1.2.2 Other Related Literature
A common theme throughout the literature is that institutions matter and that these
institutions often behave differently depending upon the level of development. Persson and
Tabellini (1994) take a dynamic model approach in examining the relationship between democracy
and growth, showing a non-monotonic relationship seemingly dependent on income inequality, and
argue that democracies might intentionally curtail innovation in favor of redistribution of wealth,
slowing their growth. Easterly (2007) argues that agricultural endowments lead to inequality,
which shapes institutions, which further shapes economic growth. Rodrik, et al. (2004), in
analyzing claims made by Acemoglu et al. (2001) conclude that the quality of institutions is the
5

most important determinant on modern levels of development. Geographical variables, such as
distance to the equator and settler mortality rates, as posited by Acemoglu et al. (2001),
influence modern GDP per capita through their influence on the development of institutions.
Literature on contract enforcement in the presence of international trade, international
investment, and domestic innovation also provides useful insight into the optimal choice of IPR
protection. Markusen (2001) explores the demand for strong contract law on the part of
multinational firms, federal governments, and local agents. He argues that while multinational
firms tend to favor strong contract law, country governments tend to oppose protection. He
incorporates imitation, in that his local agents are able to learn technology then start local rival
firms. Markusen concludes that contract enforcement makes multinational firms better off, but
that enforcement has more complicated implications for the country. If enforcement causes the
multinational to prefer local production over export, welfare improves. If, however, local
production was already occurring, enforcement resulted in loss to local agents and reduced
welfare.
6

CHAPTER 2: A MODEL OF THE CHOICE OF INTELLECTUAL PROPERTY
RIGHTS PROTECTION
This model of the choice of the level of IPR protection assumes a developing country
importing a good with exogenously-determined quality from a developed country. The general
form of this model has two cases: 1) the import sector has a competitive domestic fringe
attempting to imitate and sell their own versions of the foreign good, and 2) the import sector has
a single domestic firm attempting to imitate and sell its own version of the good. In both cases,
the timeline is as follows: first, the government chooses the level of IPR protection, then the firms
choose their prices (the domestic price will be equal to the marginal cost, assumed to be zero, in
the case of the competitive domestic fringe), and finally consumers choose to purchase 0 or 1 unit
of the good (either the domestic or the foreign). The government’s choice of IPR protection will
ultimately depend on institutions, but the application of the model to two income different
distributions will help to elucidate other elements affecting the choice of IPR.
The model shows that, in the case of the competitive domestic fringe, higher levels of
protection benefit only the foreign firm and hurt all consumers (the domestic firms are ultimately
unaffected). In the case of a duopoly, higher levels of protection benefit the foreign firm and the
consumers of the foreign good but hurt the consumers of the domestic good. The utility of the
domestic firm is first increasing then decreasing in protection. The model also shows that more
inequality (specifically a majority of consumers of the poorest type) encourages the government to
choose a lower level of protection, all else equal.
The model in its current form is inherently simplistic in its conception of the government
with the intention of highlighting the role of the distribution of income in influencing the
government’s behavior. It cannot, therefore, fully explain why governments deviate from the
optimal level of protection.
This chapter is organized as follows: Section 1 lays out the general model, Section 2 applies
the model to two specific distributions to better illustrate the effects of the consumer distribution,
7

Section 3 uses data to test the implications of the model, and Section 4 concludes.
2.1 A Basic Model of Consumers and Firms in a Country with IPR Protection
This model aims to explain the impact on a government’s optimal choice of IPR protection of
a country’s distribution of consumer incomes, market structure, and government preferences. The
model is of vertically differentiated goods in which consumers purchase either 0 or 1 units.
2.1.1 Set-Up
In this model, a foreign firm and a single domestic firm or competitive domestic fringe sell a
product. The foreign firm creates the product outside the country of interest, and the domestic
firm or firms attempt to imitate the product. The government first chooses the level of IPR
protection. The foreign firm and the domestic firm or firms then choose their prices. Finally,
consumers make their purchasing decisions.
For ease of exposition, both the lowest consumer type (consumer income) and the costs of
production are assumed to be zero.
Firms
The model assumes vertically differentiated goods produced by a foreign firm that has
created a product outside the country and a single domestic firm or competitive fringe that
attempts to imitate the foreign good. The quality of the foreign good, µF , is determined
exogenously; that is, the quality of the foreign good sold in the country of interest is taken to be
the same as the quality of that same good in any other market. It is assumed that the foreign
firm will not intentionally reduce (or raise) the quality of the good.
The quality of the domestic good, µD, is determined wholly by the inability of the domestic
firm or firms to imitate the foreign good, α, in which α ∈ [0, 1] represents the government’s choice
of IPR protection. The domestic firm’s ability to imitate is therefore given by 1− α. While it is
reasonable to assume that under strict IPR protection a domestic firm might prefer to innovate,
existing research makes it difficult to argue that domestic firms do in fact respond this way.
Therefore, the quality of the domestic good is taken to depend only upon the level of IPR
8

protection.
With any positive level of intellectual property rights protection, the domestic firm can
produce a good of quality equal to, at most, µD = (1− α)µF . With no intellectual property rights
protection, the domestic firm can, at best, produce a good of the same quality as the foreign firm.
Therefore, µD ∈ [0, µF ]. It is assumed that the domestic firm’s inability to imitate is increasing in
intellectual property rights protection.
For ease of exposition, domestic and foreign firms are assumed to face the same fixed cost of
entry, and this cost is taken to be zero. In the case with the competitive domestic fringe,
therefore, the market will be covered as the domestic firms will compete, driving prices to equal
marginal cost, which is also assumed to be zero. In the case with a single domestic firm, the
market will not be covered.
Consumers
In this model, the “type” of the consumer is assumed to be the consumer’s income. The
assumption here is that consumers with higher incomes have more utility from the consumption
of the good, especially the foreign good, as they are more quality-conscious than are lower-income
consumers. The distribution of utilities obtained from consumption therefore resembles that of
the income distribution. Henceforth, “the distribution of consumers” will refer to the distribution
of consumer incomes. The distributions of consumer incomes are assumed to be log-concave,
distributed according to h(x) along [0, b]. This is consistent with research on income distribution.
Consumers purchase either 0 or 1 unit of a good. If consumers do not purchase either the
foreign or the domestic good, they receive zero utility. If a consumer purchases a unit of the good,
she receives a utility of µix− pi, where µi is the quality of the good, pi is the price of the good,
i ∈ {F,D} represents the firm (foreign or domestic), and x is the consumer’s type.
A consumer will only purchase a good if x ≥ pi
µi. Since the model assumes that the quality of
the foreign good is higher than the quality of the domestic good, this implies that the lowest type
consumer, xL, will only purchase the good if xL ≥ pD
µDand that every consumer x ≥ pD
µDwill
purchase one unit of a good. All else equal, a consumer who receives zero utility from purchasing
would prefer to have the good to not having the good, so consumers of type x = pD
µDwill purchase
the domestic good despite receiving zero utility from purchasing.
9

The “indifferent consumer” is the consumer who is indifferent between the purchase of the
foreign good and the purchase of the domestic good. The indifferent consumer is characterized as
having type x̂ such that x̂ = pF−pDµF−µD > xL. All else equal, consumers prefer the foreign good to the
domestic good due to its higher quality. Therefore, every consumer with type x ≥ pF−pDµF−µD will
purchase the foreign good.
Government
The government chooses the level of IPR protection, α, to maximize its own welfare function,
G:
G = ρ(CUF + CUD + πD) + (1− ρ)πF ,
in which ρ represents the government’s preference for domestic actors, CU i represents the
consumer surplus from consumption of the domestic or foreign good, and πi represents the profit
earned by the domestic or foreign firm.
The government’s preference for domestic actors can be thought of as illustrative of the
government type - democratic governments may be more responsive to voters and therefore may
be more likely to respond to the interests of domestic consumers and firms, whereas autocratic
governments may benefit more from deals made with foreign firms and may therefore be more
likely to respond to the interests of foreign firms. The government therefore faces a trade-off
between the well-being of domestic actors and the well-being of the foreign actor.
Structuring the government’s welfare function such that it faces a trade-off between
consumers and firms (both domestic and foreign) to examine differences between governments
more and less responsive to the needs of its domestic consumers affects the size of the incentives it
faces to increase or decrease protection but not the general conclusions of the model. The form of
this welfare function would be:
G = ρ(CUF + CUD) + (1− ρ)(πD + πF )
10

2.1.2 Competitive Domestic Fringe
In this first case, there is a competitive domestic fringe. Because the domestic fringe is
competitive, the domestic firms will compete until profits are zero and prices are equal to
marginal cost, that is, pD = 0. The quality of the domestic good is given by µD = (1− α)µF .
Because the domestic price is 0, in this case, the market will be covered. The identity of the
type of the indifferent consumer is given by x̂ = pF
αµF.
Without specifying a distribution, it is impossible to explicitly state the foreign price, as the
identity of the type of the indifferent consumer is itself a function of the foreign price. However,
the foreign price is unique and can be expressed as pF = 1−H(x̂)h(x̂) αµF , and it is possible to show
that for all log-concave distributions the foreign price is everywhere increasing in α. The resulting
condition is ∂pF
∂α = λ(x̂)µF > 0, in which λ(x) represents the reciprocal of the hazard function,
1−H(x)h(x) . Given this characterization of the foreign price, it can be shown that for all distributions
the indifferent consumer is characterized by x̂ = λ(x̂). The demand for the foreign good is given
by 1−H(x̂) and the demand for the domestic good is given by H(x̂). The type of the indifferent
consumer is not changing in protection; therefore, the demands for the foreign and domestic
goods are not changing in protection.
Due to the increasing price and constant demand, the consumer surplus from the
consumption of the foreign good is falling in protection:
∂CUF
∂α= −µFλ(x̂)(1−H(x̂)) < 0
The consumer surplus from the consumption of the domestic good is also falling in protection
due to the worsening quality of the domestic good under increased protection:
∂CUD
∂α= µF [
∫ x̂
0H(x)dx− λ(x̂)H(x̂)] < 0
Therefore, the total consumer surplus from the consumption of both goods is everywhere
falling in protection in the case of a competitive domestic fringe.
11

The foreign profit, however, is everywhere increasing in protection:
∂πF
∂α= λ(x̂)µF (1−H(x̂)) > 0
The government choice of IPR protection leads to a trade-off between the well-being of
consumers and that of the foreign firm. Its optimal level of protection depends upon how much it
cares for each set of actors. In the case of a competitive domestic fringe, a government will choose
to either protect completely or not protect at all depending on its institutions. If the government
cares primarily for the well-being of the domestic actors, the government’s objective function will
be everywhere decreasing in α, and it will want to minimize its level of protection, choosing a
complete lack of protection of IPR. If the government cares primarily for the well-being of the
foreign firms, the government’s objective function will be everywhere increasing in α, and it will
want to maximize its level of protection, choosing to protect completely.
∂G
∂α= (1− 2ρ)µFλ(1−H(x̂))
2.1.3 Single Domestic Firm
Now assume that, instead of a competitive domestic fringe, there is a single domestic firm
with the ability to choose its price, pD, and its quality, µD ≤ (1− α)µF . Because the domestic
price might not be zero (and it will be demonstrated that in this scenario it will not be), the
market will not necessarily be covered.
The identity of the type of the indifferent consumer is given by x̂ = pF−pDµF−µD . The identity of
the lowest-type consumer who consumes a good is given by xL = pD
µD≥ 0. Any consumer with
type below xL will consume zero units. Consumers with types between xL, inclusive, and x̂ will
consume one unit of the domestic good. Consumers with types between x̂ and b inclusive will
consume one unit of the foreign good.
The domestic firm maximizes its profit by choosing pD and µD subject to µD ≤ (1− α)µF :
maxpD,µD
∫ x̂
xL
pDh(x)dx st µD ≤ (1− α)µF
12

If the constraint were not to bind, then it would be the case that either pD = 0, which requires
x̂ = xL, or h(x̂)x̂µF−µD = −h(xL)xL
µD. The latter is only possible if both prices equal zero, given that the
price of the domestic good must be less than or equal to the price of the foreign good and that
both prices must be non-negative. Both preclude the possibility of two firms participating in the
market. Therefore, it is assumed that the constraint binds, µD = (1− α)µF , and that the
domestic firm will choose the following price:
pD =H(x̂)−H(xL)
(1− α)h(x̂) + αh(xL)α(1− α)µF
As before, the foreign firm’s problem is to maximize its profit by choosing pF :
maxpF
∫ b
x̂pFh(x)dx
resulting in:
pF =1−H(x̂)
h(x̂)(µF − µD)
Given this, the two prices can be given by the following:
pF = αλ(x̂)µF
pD = α(1− α)Λ(x̂, xL)µF
Where λ(x̂) = 1−H(x̂)h(x̂) and Λ(x̂, xL) = H(x̂)−H(xL)
(1−α)h(x̂)+αh(xL) . This gives x̂ = λ(x̂)− (1− α)Λ(x̂, xL) and
xL = αΛ(x̂, xL), and thus, since x̂ > xL, λ(x̂) > Λ(x̂, xL).
The type of the indifferent consumer is not changing in protection; however, the type of the
lowest-type consumer is increasing in protection. Therefore, both the foreign and domestic prices
are increasing in protection:
∂pF
∂α= µFλ(x̂) > 0
∂pD
∂α= (1− α)µFΛ(x̂, xL) > 0
Although the demand for the foreign good is not changing in protection, the demand for the
domestic good is falling in protection. The quality of the domestic good is also falling in
13

protection. As a result, the consumer surplus from the consumption of the foreign good and the
consumer surplus from the consumption of the domestic good are both falling in protection:
∂CUF
∂α= −µFλ(x̂)(1−H(x̂)) < 0
∂CUD
∂α= µF [
∫ x̂
xL
H(x)dx+ Λ(x̂, xL)H(xL)− λ(x̂)H(x̂)] < 0
At the same time, the constant demand for the foreign good and the rising price of the
foreign good mean that the profit earned by the foreign firm is increasing in protection:
∂πF
∂α= µFλ(x̂)(1−H(x̂)) > 0
The impact on the domestic profit of a change in protection is less straightforward. On the
one hand, the domestic firm can charge higher prices as protection increases, putting upward
pressure on its profits. On the other hand, the demand for the domestic good is decreasing in
protection, putting downward pressure on its profits. Domestic profit is therefore first increasing
then decreasing in protection:
∂πD
∂α= µFΛ(−αΛh(xL) + (1− α)(H(x̂)−H(xL))) ≷ 0
As in the case of a competitive domestic fringe, the government’s choice of IPR protection
leads to a trade-off between the well-being of consumers and the domestic firm and that of the
foreign firm. Its choice of the optimal level of protection will therefore depend primarily upon the
relative weights on the domestic and foreign actors, bearing in mind that domestic profit is first
rising then falling in protection. The government will choose α such that the following equals
zero, given ρ:
∂G
∂α= ρµF [
∫ x̂
xL
H(x)dx− λ(x̂) + Λ(x̂, xL)((1 − α)H(x̂) + αH(xL)) − αΛ(x̂, xL)h(xL)] + (1 − ρ)µFλ(x̂)(1 −H(x̂))
This α is given by:
α =ρ[∫ x̂xLH(x)dx− λ(x̂) + Λ(x̂, xL)H(x̂)] + (1− ρ)λ(x̂)(1−H(x̂))
ρΛ(x̂, xL)[(H(x̂)−H(xL)) + h(xL)]
For ρ sufficiently close to zero, that is, for sufficient weight placed on the foreign firm, the
14

government’s objective function will be everywhere increasing in α, so the government will choose
to maximize its protection. More specifically, the government will always choose a positive level of
protection if 1−ρρ <
λ(x̂)−Λ(x̂,xL)H(x̂)−∫ x̂xL
H(x)dx
λ(x̂)(1−H(x̂)) . For ρ sufficiently close to one, that is, for sufficient
weight placed on the domestic actors, the government’s objective function will be everywhere
decreasing in α, so the government will choose to minimize its protection.
2.1.4 Comparing the Cases of the General Model
Table 2.1 shows the results from the two models, side-by-side.
Table 2.1: General Model - Key Results
Competitive Domestic Fringe Single Domestic Firm
x̂ = λ(x̂) x̂ = λ(x̂) − (1 − α)Λ(x̂, xL)xL = 0 xL = αΛ(x̂, xL)
foreign demand = 1 −H(x̂) foreign demand = 1 −H(x̂)domestic demand = H(x̂) domestic demand = H(x̂) −H(xL)pF = αµFλ(x̂) pF = αµFλ(x̂)pD = 0 pD = α(1 − α)µFΛ(x̂, xL)
πF = αµFλ(x̂)(1 −H(x̂)) πF = αµFλ(x̂)(1 −H(x̂))πD = 0 πD = α(1 − α)µFΛ(x̂, xL)(H(x̂) −H(xL)))
CUF = (1 − α)µFλ(1 −H(x̂)) + µF∫ bx̂
(1 −H(x))dx CUF = (1 − α)µFλ(1 −H(x̂)) + µF∫ bx̂
(1 −H(x))dx
CUD = (1 − α)µFλH(x̂) − (1 − α)µF∫ x̂
0H(x)dx CUD = (1 − α)µF (λ− Λ)H(x̂) − (1 − α)µF
∫ x̂xLH(x)dx
As can be seen in Table 2.1, while the forms of the foreign demand, foreign price, foreign
profit, and consumer surplus from the consumption of the foreign good are the same in both
models, the form of the type of the indifferent consumer differs between the two models. The
impact on foreign variables depends only upon the value of the indifferent consumer’s type.
Much of the difference between the two models is driven by the domestic firm. The type of
the lowest-type consumer is higher under a single domestic firm, so, whereas under a competitive
domestic fringe the market is covered, the market is not covered with a single domestic firm
(unless there is no protection of IPR). Under a single domestic firm, the demand for the domestic
good is smaller, but the price is higher, so the domestic firm earns some profit and, for sufficiently
low levels of protection, has incentive to pressure the government to increase protection. As a
result of this increased domestic profit, the consumer surplus from the consumption of the
domestic good under a single domestic firm is lower.
Table 2.2 shows the responses of key variables to changes in protection for the two models,
side-by-side.
15

Table 2.2: General Model - Responses to Changes in Protection
Competitive Domestic Fringe Single Domestic Firm∂x̂∂α = 0 ∂x̂
∂α = 0∂λ(x̂)∂α = 0 ∂λ(x̂)
∂α = 0∂xL∂α = 0 ∂xL
∂α = Λ(x̂,xL)1−α > 0
∂Λ(x̂,xL)∂α = Λ(x̂,xL)
1−α > 0∂∂α(foreign demand) = 0 ∂
∂α(foreign demand) = 0∂∂α(domestic demand) = 0 ∂
∂α(domestic demand) = −h(xL)( Λ1−α) < 0
∂pF
∂α = µFλ > 0 ∂pF
∂α = µFλ > 0∂pD
∂α = 0 ∂pD
∂α = (1− α)µFΛ > 0∂πF
∂α = µFλ(1−H(x̂)) > 0 ∂πF
∂α = µFλ(1−H(x̂)) > 0∂πD
∂α = 0 ∂πD
∂α = µFΛ(−αΛh(xL) + (1− α)(H(x̂)−H(xL)))∂CUF
∂α = −µFλ(1−H(x̂)) < 0 ∂CUF
∂α = −µFλ(1−H(x̂)) < 0∂CUD
∂α = µF [∫ x̂
0 H(x)dx− λH(x̂)] < 0 ∂CUD
∂α = µF [∫ x̂xLH(x)dx+ ΛH(xL)− λH(x̂)] < 0
As can be seen in Table 2.2, the impacts on the foreign variables of an increase in protection
are the same for the two cases (the relative sizes of x̂ and λ(x̂) not withstanding). The variation
comes from the domestic variables. The type of the lowest-type consumer under a single domestic
firm is increasing in protection, causing the size of the demand for the domestic good to decrease
in protection. Additionally, the price of the domestic good in a single domestic firm is increasing
in protection. Both the type of the lowest-type consumer and the domestic price are unchanging
in protection under a competitive domestic fringe.
In the case of the competitive domestic fringe, the consumer surplus from the consumption of
the domestic good is falling in protection due only to the decreasing quality of the domestic good
as protection rises, as neither the domestic price nor the size of demand for the domestic good is
changing in protection. However, in the case of a single domestic firm, the domestic price is rising
and the size of the demand for the domestic good is falling, in addition to the quality of the
domestic good falling. The fact that the consumer surplus from the consumption of the domestic
good is necessarily falling in both cases gives the following two conditions.
For the competitive domestic fringe,
λH(x̂) >
∫ x̂
0H(x)dx
16

For the single domestic firm,
λH(x̂) >
∫ x̂
xL
H(x)dx+ ΛH(xL)
With a competitive domestic fringe, domestic firm profits are zero, and this is not changing
with protection. However, the domestic firm profits under a single domestic firm are positive.
When protection is low, the domestic firm has a low price and high demand. The impact of an
increase in protection is therefore an increase in profit, as the benefit of an increase in price
outweighs the detriment of a decrease in demand. When protection is already high, the demand
for the domestic good is much smaller. Therefore, the detrimental impact of a decrease in demand
that results from a further increase in protection outweighs the beneficial impact of an increase in
price, and the profit decreases in protection.
The impact on the government surplus of an increase in protection differs between cases in
three ways (the relative sizes of x̂ and λ(x̂) notwithstanding): 1) the expected type of the
consumer of either good, 2) the impact on the consumer surplus from the domestic good, and 3)
the impact on the domestic profit.
∂GCDF
∂α= ρµF [
∫ x̂
0H(x)dx− λ] + (1− ρ)µFλ(1−H(x̂))
∂GSDF
∂α= ρµF [
∫ x̂
xL
H(x)dx− λ+ Λ(((1−α)H(x̂) +αH(xL))−αΛh(xL)
)] + (1− ρ)µFλ(1−H(x̂))
In the case of the competitive domestic fringe, the government chooses either complete protection
or a complete lack of protection. The presence of the domestic firm and the uncovered market
adds additional complexity in the case of the single domestic firm, complexity that allows for the
possibility of an interior solution for ρ insufficiently extreme.
2.2 Applications of the Model to Specific Distributions
The analysis of the general model does not allow for an easy understanding of how a change
in the shape of the distribution affects the government’s choice of optimal IPR protection. To do
this, it is easier to look at specific distributions. The two distributions used are the triangular
17

distribution and the Weibull distribution. The shape of the triangular distribution moves from
uniform at one extreme to linearly decreasing to a mass of zero on the highest-type consumer at
the other extreme. The shape of the Weibull distribution moves from everywhere decreasing at
one extreme to an increasing concentration about a mode located away from the lower bound as
the shape parameter increases.
Inequality varies with the shape parameter in both cases, though the extent of the variety is
much more pronounced in the case of the Weibull distribution. Inequality here refers to the
relative proportions of income and population. Perfect equality therefore means that 10% of the
population accounts for 10% of the income and 90% of the population accounts for 90% of the
income, etc. Perfect inequality means that no one but the highest-type consumer accounts for any
income, and the highest-type consumer accounts for 100% of the income.
In the case of the triangular distribution, the difference in inequality between the two
extremes is quite small, so the main effect of an increase in the shape parameter is a shift of
consumers toward the lower bound. In the case of the Weibull distribution, the effect of an
increase in the shape parameter is a concentration of consumers about the mode, away from the
lower bound. Therefore, the results suggested by the model for the different distributions are
somewhat different. As the shape parameter for the Weibull distribution falls, it begins to look
more like the triangular distribution with the shape parameter at its maximum. Looking at these
two distributions therefore paints two different pictures describing two different behaviors.
2.2.1 Triangular Distribution
This example uses a triangular distribution with a parameter, c, that allows it to vary from
uniform to downward-sloping with no weight on the highest-type consumer. The triangular
distribution does not accurately depict the reality of distributions of consumer incomes; however,
much of the theoretical literature assumes uniform distributions of consumers. Using this
distribution therefore allows for an analysis of the impact of changes in the distribution of
incomes in this context. Additionally, using this distribution allows for an analysis of the impact
of an increasing concentration of consumers at the bottom of the income distribution.
18

The pdf for the triangular distribution is as below:
h(x) =2
b2(1− c)x+
c
b
for which the support is [0, b] and b is the highest-type consumer. The parameter c ∈ (1, 2]
controls the slope, with c = 1 representing a uniform distribution. It is important to note that
there is a discontinuity at c = 1 in the characterization of the indifferent consumer, so the
distribution can never be perfectly uniform.
As c increases, the weight on the lowest-type consumer is increased and inequality increases.
As b increases, the type of the highest-type consumer increases, reducing the slope of the
distribution.
Competitive Domestic Fringe
Under a competitive domestic fringe, the indifferent consumer is decreasing in c. As a
country becomes relatively more unequal, as consumers become increasingly concentrated at the
bottom of the income distribution, the price chosen by the foreign firm falls, and so the type of
the indifferent consumer decreases.
At the same time, as type of the indifferent consumer falls, the domestic demand falls and
the foreign demand rises. However, the decrease in foreign price dominates the increase in
demand for the foreign good, so the foreign firm sees its profits fall as inequality rises. The drop
in foreign price and increase in demand for the foreign good mean that consumer surplus from the
consumption of the foreign good is rising in c. The consumer surplus from the consumption of the
domestic good is falling in c as the domestic demand falls.
For c sufficiently close to 1 or 2, that is, for perfect uniformity or if there is a sufficient mass
of consumers of the lowest type, the government will always choose not to protect IPR. However,
as c approaches 32 , such that there is enough weight on the highest-type consumers that the utility
earned from the consumption of the foreign good is an important driver of the government’s
objective function, a government’s choice to fully protect or not protect will depend upon the
value of ρ, its institutions.
As c increases, the value of the government’s objective function increases, driven in large part
19

Table 2.3: Triangular Distribution with Competitive Domestic Fringe
Variables Responses to Changing Parameters
x̂ = λ(x) = bc−b√c2+3−3c
3(c−1)∂x̂∂c < 0∂x̂∂b > 0
xL = 0
1−H(x̂) = c(6+√c2+3−3c)−c2−6
9(c−1)∂(1−H(x̂))
∂c = −h(x̂)∂x̂∂c > 0∂(1−H(x̂))
∂b = −h(x̂)∂x̂∂b < 0
H(x̂) = c2+c(3−√c2+3−3c)−3
9(c−1)∂H(x̂)∂c = h(x̂)∂x̂∂c < 0
∂H(x̂)∂b = h(x̂)∂x̂∂b > 0
pF = αµF ( bc−b√c2+3−3c
3(c−1) ) ∂pF
∂c = αµF ∂x̂∂c < 0∂pF
∂b = αµF ∂x̂∂b > 0pD = 0
πF = αµF ( bc−b√c2+3−3c
3(c−1) )( c(6+√c2+3−3c)−c2−6
9(c−1) ) ∂πF
∂c < 0∂πF
∂b > 0πD = 0
∂CUF
∂c > 0∂CUF
∂b < 0∂CUD
∂c < 0∂CUD
∂b > 0
by the benefit to those consuming the foreign good. As a result, as consumers are increasingly
concentrated at the bottom of the income distribution, the incentive for the government to
protect IPR increases, even if it’s final decision is still not to protect at all.
As b increases, all else equal, the slope of the distribution is reduced, and so the effect is
similar to reducing c. Therefore, the impact on the variables of an increase in b is opposite that of
an increase in c.
Single Domestic Firm
In the case of a single domestic firm, an increase in c, an increase in inequality as consumers
are increasingly concentrated at the bottom of the income distribution, or a decrease in b causes
the prices of both goods to fall, causing the types of the indifferent and low-type consumers to
decrease. The difference between the indifferent and low-type consumers falls as c increases or b
decreases. Therefore, demand for the foreign good increases in inequality while demand for the
domestic good decreases in inequality.
Foreign profits increase when the change in demand more than offsets the fall in price, and
20

Table 2.4: Triangular Distribution with Single Domestic Firm
Change in Slope (c) Change in Top Type (b)∂x̂∂c < 0 ∂x̂
∂b > 0∂xL∂c < 0 ∂xL
∂b > 0∂pF
∂c < 0 ∂pF
∂b > 0∂pD
∂c < 0 ∂pD
∂b > 0∂πF
∂c ≷ 0 ∂πF
∂b ≶ 0∂πD
∂c < 0 ∂πD
∂b > 0∂CUF
∂c > 0 ∂CUF
∂b < 0∂CUD
∂c ≷ 0 ∂CUD
∂b ≶ 0
decrease when the it does not. Domestic profits fall in inequality. Consumer utility from the
consumption of the foreign good increases, but consumer utility from the consumption of the
domestic good first increases then decreases in inequality. Incentives for the government to raise
or lower IPR protection therefore depend both upon c itself and upon the weights placed on the
domestic and foreign actors.
2.2.2 Weibull Distribution
The Weibull distribution is a more accurate representation of the distribution of consumer
incomes than is the triangular distribution. Indeed, Bandourian, et al. (2003) show that the
Weibull distribution is the best-fitting two-parameter distribution among the countries in their
sample. This example uses a Weibull distribution with a scale parameter, b ∈ (0,∞), and a shape
parameter, c ∈ (1, e). The PDF and CDF for this distribution are (for x ≥ 0):
h(x) =c
b(x
b)c−1 exp[−(
x
b)c]
H(x) = 1− exp[−(x
b)c]
The shape parameter, c, represents how tightly clustered around the mode the distribution
is. As c increases, the distribution becomes more tightly clustered, away from both the highest
and lowest types. An increase in c can therefore be understood as a decrease in inequality. The
scale parameter, b, spreads the distribution out as it increases and moves the mode to the right.
Responses of key variables to changes in c when using the Weibull distribution change sign based
21

upon the size of c, specifically, its relation to Euler’s constant. Since most estimates of the shape
parameters of income distributions using the Weibull distribution are less than 2.5, the
assumption will be that c is less than Euler’s constant. The Weibull distribution is only
log-concave for values of the shape parameter greater than 1. Most estimates of the shape
parameters of income distributions using the Weibull distribution are greater than 1, so the
assumption will be that c is also greater than 1.
Competitive Domestic Fringe
Under a competitive domestic fringe, the foreign price is decreasing in c, that is, as
consumers are more concentrated about the mode and inequality is decreasing, the price of the
foreign good falls. Since the price of the domestic good is zero, this means that the type of the
indifferent consumer is also falling in c. As a result, the demand for the foreign good is rising in c,
and the demand for the domestic good is falling.
The profit earned by the foreign firm is falling in c, that is, it falls as inequality falls, as the
drop in price has a larger impact than the increase in demand for the foreign good. The increase
in demand combined with the drop in price means that the utility from the consumption of the
foreign good is increasing as inequality decreases. The decreasing demand for the domestic good
means that the utility from the consumption of the domestic good is decreasing as consumers are
more concentrated about the mode.
For sufficient weight placed on the domestic actors, that is, for ρ1−ρ >
− ln c1−ln c , the government
objective function is increasing in c, and vice versa. The optimal choice of IPR protection follows
the same pattern. For sufficient weight placed on the domestic actors, the incentive to increase
protection is increasing as consumers are more clustered about the mean since the utility from the
consumption of the foreign good is increasing.
As the scale parameter, b, increases, the distribution spreads out. This reduces the
concentration about the mode, and so the impact of an increase in b is analogous to a decrease in
c. However, b does not influence the sizes of the demands for the foreign and domestic goods. All
of the impact on the foreign profit and utility from the consumption of the foreign good of a
change in b therefore comes from the change in the domestic price. Since the domestic variables
are not impacted by b, the impacts on the government’s objective function and its choice of IPR
22

protection of a change in b is much more straightforward, depending only upon the changes in the
foreign variables. For sufficient weight on the domestic actors, that is, for ρ > 12 , the government’s
objective function and its incentive to protect IPR are decreasing in b, and vice versa.
Table 2.5: Weibull Distribution with Competitive Domestic Fringe
Variables Responses to Changing Parameters
x̂ = λ(x) = b
c1c
∂x̂∂c = bc
−1c−2(ln c− 1) < 0
∂x̂∂b = (1
c )1c > 0
xL = 0
1−H(x̂) = exp[−1c ]
∂(1−H(x̂))∂c = 1
c2exp[−1
c ] > 0∂(1−H(x̂))
∂b = 0
H(x̂) = 1− exp[−1c ]
∂H(x̂)∂c = − 1
c2exp[−1
c ] < 0∂H(x̂)∂b = 0
pF = αµF b
c1c
∂pF
∂c = αµF bc−1c−2(ln c− 1) < 0
∂pF
∂b = αµF (1c )
1c > 0
pD = 0
πF = αµF b(1c )
1c exp[−1
c ]∂πF
∂c = αµF bc−1c−2 exp[−1
c ] ln c < 0∂πF
∂b = αµF (1c )
1c exp[−1
c ] > 0πD = 0
∂CUF
∂c > 0∂CUF
∂b < 0∂CUD
∂c < 0∂CUD
∂b = 0
Single Domestic Firm
In the case of a single domestic firm, an increase in c, which represents a decrease in
inequality as consumers are increasingly concentrated about the mode, causes the types of both
the indifferent and the low-type consumers to fall. The difference between the indifferent and
low-type consumers is decreasing in c, that is, the type of the indifferent consumer is falling faster
than is the type of the low-type consumer. An increase in b, the scale parameter, both increases
the mode and spreads out the distribution. Therefore, the types of the indifferent and low-type
consumers respond in the opposite direction to an increase in b: both increase.
Both the foreign and domestic prices fall as inequality decreases and rise as the mode and
inequality increase. Demand for the foreign good is increasing as inequality decreases, but
demand for the domestic good is falling. Therefore, consumer utility from the consumption of the
23

Table 2.6: Weibull Distribution with Single Domestic Firm
Change in Shape (c) Change in Scale (b)∂x̂∂c < 0 ∂x̂
∂b > 0∂xL∂c < 0 ∂xL
∂b > 0∂pF
∂c < 0 ∂pF
∂b > 0∂pD
∂c < 0 ∂pD
∂b > 0∂πF
∂c ≷ 0 ∂πF
∂b ≶ 0∂πD
∂c < 0 ∂πD
∂b > 0∂CUF
∂c > 0 ∂CUF
∂b < 0∂CUD
∂c ≷ 0 ∂CUD
∂b ≶ 0
foreign good is increasing and domestic profits are decreasing as inequality decreases.
While at first glance it appears that these two applications give opposite predictions about
the relationship between inequality and pressures for IPR protection, they are actually telling
different stories entirely. The Triangular distribution is demonstrating the response of actors to
an increasing mass of consumers at the bottom of the income distribution, with a relatively (when
compared to the Weibull distribution) small loss of consumers higher along the income
distribution. The Weibull distribution demonstrates the response of actors to an increasing mass
of consumers at some income away from the bottom of the distribution, with a relatively (when
compared to the Triangular distribution) large loss of consumers at both the bottom and the top
of the income distribution. Since the changes in the shape parameters of these two distributions
tell different stories, it is reasonable that the responses to ”increased inequality” in the two cases
be different.
2.3 Empirical Analysis
This section aims to test the central claims of the model, namely that IPR protection is
changing in income distribution, market structure, and institutions, taking into consideration the
importance of development, as defined by GDP per capita.
This section includes a description of the data and an explanation of regression results.
24

2.3.1 Data
Quantitative measures of IPR protection, income distribution, development, and political
institutions are notoriously fraught with controversy. While it is possible to measure components
for each of these, it is often argued that these components provide an incomplete or potentially
misleading picture. However, including a number of countries from different income classes and
with different government types necessitated the use of these more frequently used, though
potentially incomplete, measures, even if more holistic metrics existed.
Intellectual Property Rights Protection
Two measures of IPR protection were used for this analysis. The Ginarte and Park (GP)
Index was used to represent formal protection of IPR, while the World Economic Forum IPR
score was used to represent de facto protection of IPR.
The GP Index measures a country’s formal IPR protection. This index was developed by
Ginarte and Park in 1997 and then updated by Park in 2008, with data through 2010 available on
his website. The GP Index includes information on 130 countries for the period 1960-2010. An
index measure is given every five years.
The index is created by summing the weighted averages of indicators in five categories: the
extent of patent coverage, membership in international agreements, provisions for loss of
protection, enforcement mechanisms, and duration of protection. The index ranges from 0 to 5,
with higher values representing stronger levels of protection.
In the literature, the biggest complaint about the GP Index, common to many measures of
IPR protection, is that it is a better measure of formal, legal protection than of actual enforced
protection. Since there are certainly instances in which governments have laws on the books
which are inconsistently enforced, it is not clear that the behavior seen in the GP Index is the
same behavior demonstrated by the model, nor is it clear that the GP Index is actually an
accurate representation of protection. It is therefore prudent to examine a different measure of de
facto IPR protection.
The World Economic Forum (WEF) measure of intellectual property protection provides a
better measure of de facto protection. It exists for 148 countries from 2006-2009 and 2011-2017,
25

with some exceptions. The measure was created as part of the WEF’s Executive Opinion Survey.
The question asked was, ”In your country, to what extent is intellectual property protected?” A
score of 1 represents no protection. A score of 7 represents exceptional protection.
This measure is somewhat more volatile than the GP Index. However, it arguably provides a
more realistic measure of de facto protection than does a measure that is based on the existence
of IPR protection laws.
A comparison between the two measures is only possible between 2005 and 2010. To do this,
data for the missing years was linearly interpolated for both measures. This interpolated data was
used when attempting to directly compare the two measures, not when running regressions on the
measures independently. A list of countries included in each measure can be found in Appendix B.
Income Distribution
Income distribution was measured using the Gini coefficient. The Gini coefficient ranges from
0 to 1, with 0 representing perfect income equality and 1 representing perfect income inequality.
As it is derived from the shape parameter of income distributions, it is independent of the mean
or median income. Changes in the Gini coefficient, therefore, are analogous to changes in the
shape of the income distributions and do not illustrate the impacts of increases in income.
The primary concern with using the Gini coefficient is that datat is not available for all
countries in all years. To address this, a linearly-interpolated measure of the Gini coefficient was
used in regressions.
Institutions
In order to get a sense of how incentives differ across rough institutional lines, institutions
are represented by government type. It should be expected that the broad government type is an
imperfect representation of institutions, especially as there is so much variation of institutions
within each of these government types between countries.
The Polity IV dataset was used to measure government type. This dataset covers almost 170
countries beginning in 1800. The Polity IV dataset gives each country a score from 0 to 10 on
each of two scales, a democracy scale and an autocracy scale. The autocracy score is then
subtracted from the democracy score to yield a score from -10 to 10, with -10 representing a
26

hereditary monarchy and 10 representing a consolidated democracy. Based on the suggested
classifications, countries receiving scores of 6 or higher was classified as democracies, countries
receiving scores between 1 and 5 were classified as open anocracies, countries receiving scores
between -5 and 0 were classified as closed anocracies, and countries receiving scores of -6 or lower
were classified as autocracies.
The Polity IV process, like other oft-used measures of democracy such as the ones put forth
by the Economist Intelligence Unit and Freedom House, looks primarily at the executive branch.
It takes into consideration executive recruitment, constraints on executive authority, and the
presence or lack of political competition. Other measures, such as the Democracy and
Dictatorship data put forth by Cheibub, Gandhi, and Vreeland (2009), are somewhat more full,
including information on legislative selection and power in addition to the information about the
executive. However, the Democracy and Dictatorship dataset ended in 2008 and did not cover all
countries for the time period. That being said, the correlation between the Democracy and
Dictatorship classification and the Polity IV classification was fairly high, 0.81, suggesting that
not much was lost in using the Polity IV classification instead.
In addition to Polity IV, Political Constraints data was used for supplemental regressions.
This index aims to measure the extent to which changes in the preferences of single political
actors lead to changes in government policy. The index ranges from 0 to 1, with higher scores
representing more constraint, and thus a smaller likelihood of policy change due to the preferences
of a single actor. The index takes into consideration the number of independent branches of the
government with veto power, the extent of party alignment across branches of the government,
and the extent to which preferences within branches of government are aligned. Regressions using
this data can be found in Appendix B.
To examine the impact of a trade-off between consumers and producers (as opposed to the
trade-off between domestic actors and foreign actors), two measures from the World Development
Indicators were used: a measure of taxes on goods and services as a percent of total revenue and a
measure of taxes on income, profits, and capital gains as a percent of total revenue. The former is
used to represent the preference for consumers, and the latter is used to represent the preference
for firms. This data is only regularly available over the years covered by the WEF measure of
IPR. Using taxes to represent the government’s preference for consumers and producers is a
27

different way to conceptualize institutions. Representing institutions with Polity IV assumes that
preferences are based on executive (and legislative) power derived from voting. Using taxes,
however, assumes that preferences are based on sources of revenue. These two ways of
conceptualizing institutions should be interpreted as substitutes for each other. They are two
different ways of understanding how the government makes decisions.
Other measures of institutions used include the origin of the legal structure and colonizing
country, both of which from the Quality of Government Institute Standard Dataset. Countries
were also grouped according to their regions, as there can be religious and institutional
similarities between countries in the same region. Regional groupings were according to the World
Bank regional groupings, and include East Asia and Pacific, Europe and Central Asia, Latin
America and Caribbean, Middle East and North Africa, North America, South Asia, and
Sub-Saharan Africa.
Market Structure
For the years covered by the WEF measure of IPR, the WEF also provided two measures of
market structure. The first is a measure of local competition: respondents were asked to rate the
intensity of local competition, in which 1 represents local competition that was not intense at all
and 7 represents local competition that was extremely intense. The second is a measure of the
extent of market dominance, in which 1 represents a market dominated by a few businesses and 7
represents a market spread among many firms. The question for the first was, “In your country,
how intense is competition in the local markets?” The question asked for the second was, “In
your country, how do you characterize corporate activity?” Unsurprisingly, these two measures
are closely correlated.
Income
GDP per capita was used to measure the level of development, with its natural log used in
regressions. GDP per capita data was available for all countries for each year, making it a more
ideal measure of development than GNI per capita, which had a few missing observations. The
correlation between GDP per capita and GNI per capita was quite strong, however, so not much
is lost by using GDP per capita. The only concern is that differences between GDP and GNI per
28

capita may be larger in developing economies, the same economies with the higher instances of
missing GNI per capita data, but also the same economies which are the focus of this model.
Countries were grouped into four development classes: low income, lower-middle income,
upper-middle income, and high income. Low income is defined as a GNI per capita less than
$1006. Lower-middle income is defined as a GNI per capita between $1006 and $3955.
Upper-middle income is defined as a GNI per capita between $3956 and $12235. High income is
defined as a GNI per capita above $12235.
There is a question of reverse-causality when using GDP per capita in regressions, as it may
be argued that the level of IPR protection is a driver of GDP per capita. To address this
question, the distance from the equator was used instead of GDP per capita in some regressions.
Acemoglu et al. (2001) and Rodrik et al (2004), among others, have used this measure as well as
a measure of European settler deaths in trying to determine current levels of GDP per capita.
Both appear to be closely tied to current levels of GDP per capita through other institutions,
including legal origins and colonizing power. These measures were used in regressions on average
levels of protection prior to 1990.
2.3.2 Descriptive Statistics
Descriptive statistics for the variables used in regressions can be seen in Tables 2.7-2.9.
Observations are country-year.
Income distribution was quite similar across development groups, with high income
economies demonstrating slightly more equal income distribution than the rest of the
development groups. Formal IPR protection is quite similar for the middle two income groups,
notably lower in the lowest income group, and notably higher in the highest income group. De
facto IPR protection appears to increase as income increases. In each development group, at least
a few countries had higher de facto protection than formal protection, but most had higher formal
protection than de facto protection. This tendency to have formal protection in excess of de facto
protection increases, predictably, in formal protection. Despite this, formal and de facto
protection are quite positively correlated.
Income distribution is slightly lower for autocracies, but fairly similar across other
government types. Formal protection is noticeably higher for democracies than for autocracies,
29

Table 2.7: Descriptive Statistics by Income Classification
Observations Mean Standard Deviation Minimum Maximum
Low Income EconomiesGinarte and Park Index 532 1.76 0.67 0.13 3.92World Economic Forum IPR Score 171 2.97 0.64 1.57 4.85Gini Coefficient 272 0.41 0.09 0.16 0.66
Lower-Middle Income EconomiesGinarte and Park Index 295 2.27 0.82 0.58 4.83World Economic Forum IPR Score 263 3.04 0.59 1.70 4.74Gini Coefficient 435 0.43 0.11 0.17 0.65
Upper-Middle Income EconomiesGinarte and Park Index 150 3.04 0.82 0.92 4.92World Economic Forum IPR Score 259 3.36 0.76 1.64 5.46Gini Coefficient 274 0.42 0.09 0.26 0.65
High Income EconomiesGinarte and Park Index 157 4.04 0.69 1.33 4.88World Economic Forum IPR Score 370 4.87 0.93 1.70 6.48Gini Coefficient 264 0.32 0.05 0.24 0.51
Table 2.8: Descriptive Statistics by Government Type
Observations Mean Standard Deviation Minimum Maximum
AutocracyGinarte and Park Index 320 1.67 0.64 0.13 4.83World Economic Forum IPR Score 101 3.98 0.94 1.96 5.98Gini Coefficient 101 0.36 0.09 0.16 0.61
Closed AnocracyGinarte and Park Index 163 2.01 0.81 0.20 4.83World Economic Forum IPR Score 132 3.37 1.05 1.57 6.28Gini Coefficient 98 0.41 0.09 0.23 0.61
Open AnocracyGinarte and Park Index 108 2.15 0.81 0.20 3.76World Economic Forum IPR Score 110 2.86 0.63 1.63 5.20Gini Coefficient 128 0.41 0.08 0.24 0.60
DemocracyGinarte and Park Index 535 2.90 1.11 0.13 4.92World Economic Forum IPR Score 670 3.89 1.17 1.70 6.48Gini Coefficient 856 0.40 0.10 0.22 0.66
but de facto protection is similar. However, de facto protection and formal protection move in
opposite directions for the mixed government types. As with the development groups, at least a
few countries had higher de facto protection than formal protection, but most had higher formal
protection than de facto protection.
Finally, it is worth noting that there was a sizable jump in formal IPR protection for most
countries between 1995 and 2005, the period during which TRIPS was enacted and adopted. This
can be seen quite clearly in the GP Index. The data from the WEF survey only exists after most
countries had adopted TRIPS.
30

Table 2.9: Descriptive Statistics before and after TRIPS
Observations Mean Standard Deviation Minimum Maximum
Before TRIPSGinarte and Park Index 737 1.85 0.80 0.13 4.92World Economic Forum IPR Score N/AGini Coefficient 201 0.42 0.12 0.19 0.63
After TRIPSGinarte and Park Index 122 3.35 0.87 0.20 4.88World Economic Forum IPR Score 1067 3.74 1.14 1.57 6.48Gini Coefficient 578 0.38 0.09 0.24 0.65
2.3.3 Results
Regressions were run on formal protection (the GP Index) and de facto protection (the WEF
IPR score). Standard errors have been clustered by country. In all regressions, income, as
measured by GDP per capita, seemed to be the most important determinant of IPR protection.
However, it is possible that the GDP per capita is absorbing some of the explanatory power of the
shape of the distribution of income, as measured by the Gini coefficient. Finally, there are
potential endogeneity and reverse causality issues with GDP per capita. To address this, distance
from the equator is used instead of GDP per capita in one set of regressions.
It is interesting to note that while the distribution of income, as measured by the Gini
Coefficient, is important in the determination of the formal level of protection, it is not as
important in the determination the de facto level of protection. It is possible that this decreased
importance of the Gini Coefficient for the WEF IPR years is due to the increasing international
pressure to maintain a level of IPR protection consistent with the requirements of TRIPS, of
which most of the countries are signatories in most of the later years covered by the WEF IPR
measure. The GP Index covers years before TRIPS, and so it may be that considerations such as
the distribution of income mattered more during this time when determining the appropriate level
of IPR protection. Since having a certain standard of IPR protection is increasingly necessary to
facilitate international interactions, this necessity may be overshadowing the impact of income
distributions. It is also possible that including developed economies has obscured the impact of
the shape of the income distribution, as there may be norms of protection that matter more than
other concerns, norms that may not exist to the same extent in developing economies. Appendix
B includes regressions run only on developing economies.
31

Table 2.10: Regressions on Formal IPR Protection
(1) (2) (3) (4)GP Index GP Index GP Index GP Index
Log GDP per Capita 0.346∗∗∗ 0.365∗∗∗ 0.00505 0.299∗∗∗
(0.0430) (0.0392) (0.268) (0.0482)
Gini Coefficient -2.479∗∗∗ -1.682∗∗ -1.333 -0.554(0.625) (0.516) (1.153) (0.612)
Polity Score 0.0332∗∗ 0.0132 -0.0106 -0.00306(0.0101) (0.00970) (0.0103) (0.00909)
Constant 0.948 -0.246 2.241 -0.273(0.529) (0.537) (2.157) (0.590)
Year FE No Yes No Yes
Region FE No No No YesCountry FE No No Yes No
Observations 372 372 372 372Adjusted R2 0.481 0.698 0.684 0.756
Standard errors in parentheses∗ p < 0.05, ∗∗ p < 0.01, ∗∗∗ p < 0.001
Table 2.11: Regressions on De Facto IPR Protection
(1) (2) (3) (4)WEF IPR WEF IPR WEF IPR WEF IPR
Log GDP per Capita 0.603∗∗∗ 0.606∗∗∗ 1.650∗∗∗ 0.781∗∗∗
(0.0563) (0.0566) (0.270) (0.0635)
Gini Coefficient -0.472 -0.549 0.854 -0.766(0.811) (0.821) (1.298) (1.135)
Polity Score -0.0160 -0.0157 -0.0150 -0.00714(0.0164) (0.0165) (0.0237) (0.0176)
Constant -1.262∗ -1.368∗ -10.83∗∗∗ -2.580∗∗∗
(0.594) (0.600) (2.492) (0.666)
Year FE No Yes No Yes
Region FE No No No YesCountry FE No No Yes No
Observations 721 721 721 721Adjusted R2 0.584 0.587 0.286 0.693
Standard errors in parentheses∗ p < 0.05, ∗∗ p < 0.01, ∗∗∗ p < 0.001
32

The negative coefficient on the Gini coefficient indicates that as countries become relatively
less equal, IPR protection decreases. This is consistent with the incentives described by the
application of the Weibull distribution.
In both cases, the Polity measure does not seem to play a very important role, though again
it is possible that GDP per capita and/or the region indicator is absorbing some of the
explanatory power of this as well. It also suggests that although government preferences are
important, the style of government does not do a great job of elucidating these preferences.
It should be noted that the year and region are often significant. The former supports the
conclusion that as time has progressed, international pressure to increase protection has become
increasingly important in understanding why protection has risen and suggests that the model
may be better at explaining differences between countries than changes over time. The second
supports the conclusion that there are regionally-similar institutions that help to explain
differences in protection, perhaps better than the style of government, and that other
considerations, such as regional trading agreements, might have an impact on the choice of level
of protection.
The second set of regressions on the de facto measure of IPR (Table 2.12) introduces the
alternative conception of institutions and measures of market structure. Since this data is not
available prior to 2006, these regressions cannot be run on the GP Index. Using this data
constitutes a different interpretation of institutions, one in which the government’s preference for
actors is dependent upon the revenue they generate rather than the influence they hold. In this
case, the tax on consumers is used to represent a preference for consumers, as traded off with a
preference for firms, both domestic and foreign. This variable was derived by taking the income
from taxes on consumers divided by the sum of the incomes from consumers and producers. An
increase in the tax on consumers is analogous to increasing weight placed on the consumers, as it
means that a greater portion of the government revenue is derived from consumers. The negative
coefficient suggests that as the weight on consumers increases, the level of protection decreases,
which is consistent with the model.
The Local Competition and Market Dominance variables are measures of market structure.
They are positively correlated (more intense local competition would occur in markets spread
among many firms and vice versa), and an increase in both indicates a move from a market
33

Table 2.12: Regressions on De Facto IPR Protection
(1) (2) (3) (4) (5) (6)WEF IPR WEF IPR WEF IPR WEF IPR WEF IPR WEF IPR
Log GDP per Capita 0.606∗∗∗ 0.579∗∗∗ 0.407∗∗∗ 0.441∗∗∗ 0.270∗∗∗ 0.360∗∗∗
(0.0566) (0.0586) (0.0611) (0.0672) (0.0473) (0.0589)
Gini Coefficient -0.549 -1.533 -0.755 -1.494 -0.0991 -0.749(0.821) (0.843) (0.763) (0.822) (0.649) (0.771)
Polity Score -0.0157 -0.0151 0.00118(0.0165) (0.0130) (0.0109)
Consumer Tax -1.588∗∗∗ -1.179∗∗ -0.762∗
(0.420) (0.372) (0.377)
Local Competition 0.644∗∗∗ 0.522∗∗∗
(0.0997) (0.123)
Market Dominance 0.770∗∗∗ 0.592∗∗∗
(0.0624) (0.0791)
Constant -1.368∗ 0.0611 -2.736∗∗∗ -1.579 -1.568∗∗∗ -0.993(0.600) (0.834) (0.548) (0.840) (0.425) (0.690)
Year FE Yes Yes Yes Yes Yes YesObservations 721 591 721 591 721 591Adjusted R2 0.587 0.662 0.666 0.702 0.759 0.756
Standard errors in parentheses∗ p < 0.05, ∗∗ p < 0.01, ∗∗∗ p < 0.001
described by a single domestic firm toward one described by a competitive domestic fringe. The
positive coefficient suggests that protection is higher in the case of a competitive domestic fringe.
However, it is possible that including developed economies in these regressions has obscured
somewhat the impact of market structure. These regressions can be found in Table 2.12.
Regressions run just on developing countries are included in Appendix B.
Finally, alternatives to GDP per capita were used to try to explain average formal protection
between 1960 and 1990. Distance to the equator was used instead of GDP per capita. Polity IV,
regions, identity of the colonial power, and legal origins were used to describe institutions.
Average Gini coefficient was used to describe the income distribution. While the effects are much
more significant in this set-up, most are close to zero. These regressions can be found in Table
2.13.
34

Table 2.13: Regressions on Formal IPR Protection
(1) (2) (3) (4) (5)GP Index GP Index GP Index GP Index GP Index
Distance to Equator 0.000810∗∗∗ 0.00198∗∗∗ 0.00152∗∗∗ 0.00234∗∗∗ 0.00223∗∗∗
(0.000187) (0.000237) (0.000263) (0.000232) (0.000273)
Gini Coefficient -0.00135∗∗∗ -0.00128∗∗∗ 0.00157∗∗∗ -0.00141∗∗∗ 0.00000664(0.000273) (0.000225) (0.000304) (0.000314) (0.000294)
Polity Score 0.00635∗∗∗ 0.00967∗∗∗ 0.0108∗∗∗ 0.00411∗∗∗ 0.00975∗∗∗
(0.000627) (0.000625) (0.000692) (0.000536) (0.000729)
Constant 0.355∗∗∗ 0.329∗∗∗ 0.212∗∗∗ 0.410∗∗∗ 0.275∗∗∗
(0.0130) (0.0125) (0.0191) (0.0142) (0.0198)
Region FE No Yes No No Yes
Colonial FE No No Yes No Yes
Legal FE No No No Yes Yes
Observations 2100 2100 2100 2001 2001Adjusted R2 0.103 0.457 0.249 0.281 0.583
Standard errors in parentheses∗ p < 0.05, ∗∗ p < 0.01, ∗∗∗ p < 0.001
35

2.4 Conclusion
The relationship between IPR protection and income inequality and market structure is
difficult to disentangle. Institutions and the level of development play large roles in determining
the level of protection, and the impacts of income distribution and market structure are often
altered or masked by the effects of these. Still, they do seem to play an important role, especially
in determining the level of formal protection.
The model in this section demonstrates that changes in income inequality change the size of
incentives to increase or decrease protection. As the demand for improved IPR protection
increases internationally, understanding these incentives can help to explain why countries,
especially developing countries, fail to protect at their contracted levels or resist improvements to
their existing standards and why this behavior is not consistent among all countries.
36

CHAPTER 3: EXTENSION - LOCAL GOVERNMENTS
In this extension, there are local governments with different preferences for foreign firms.
This can be understood as a desire for the benefits of production undertaken by foreign firms,
such as job creation and infrastructure development. Depending on the firm, these benefits may
be substantial or non-existent. Because of this, de facto protection of IPR may differ from the
formal level of protection.
In this scenario, there are N localities, each with a local government that cares about
consumer utility from consumption and the profits of the foreign and domestic firms. In each
locality, a single foreign firm is producing a good of exogenous quality µF . A competitive
domestic fringe or single domestic firm sells an imitation of the foreign good. The ability of the
domestic firm(s) to imitate the foreign good depends on the final level of IPR protection, which is
a deviation, determined by the local government, from a standard set by the federal government.
The ability of the local government to deviate from the federally-determined standard depends
upon the level of decentralization in the country. The local governments incur a cost of deviating
below the federal standard. If there is no decentralization, then local governments are unable to
set levels of protection that deviate from the federal standard. If there is complete
decentralization, local governments have the power to set any standard of protection.
The order is as follows:
1. The federal government chooses the formal level of IPR protection.
2. The N localities each choose their own de facto levels of protection as deviations from the
standard, subject to the level of decentralization.
3. Firms in each locality set their prices.
4. Consumers in each locality purchase either the foreign or the domestic good.
For simplicity, localities are assumed to be the same size, distributions of consumers in each
37
locality are the same, foreign firms in each locality are the same, and consumers can only
purchase from the firms in their locality.
3.1 Consumers
Consumers in each locality are distributed according to h(x) along [0, b], assumed to be
log-concave. Each can purchase either 0 or 1 unit of a good. If consumers do not purchase either
the foreign or the domestic good, they receive zero utility. If a consumer purchases a unit of the
good, she receives a utility of µinx− pin, where µin is the quality of the good, pin is the price of the
good, i ∈ {F,D} represents the firm (foreign or domestic), n ∈ {1, ..., N} indicates the locality,
and x is the consumer’s type.
A consumer will only purchase if x ≥ pDnµin
. Since the model assumes that the quality of the
foreign good is higher than the quality of the domestic good, this implies that the lowest type
consumer, xL, will only purchase the good if xL ≥ pDnµDn
and that every consumer x ≥ pDnµDn
will
purchase one unit of a good. In the case of a competitive domestic fringe, in every locality
pDn = 0, so every consumer will purchase one unit of a good, and the market is covered. In the
case of a single domestic firm, the market will not be covered.
The indifferent consumer is characterized as having type x̂ such that x̂ = pFn−pDnµFn−µDn
> xL. Every
consumer with type x ≥ pFn−pDnµFn−µDn
will purchase the foreign good.
3.2 Firms
The model assumes vertically differentiated goods produced by a foreign firm that has
created a product outside the country and a competitive domestic fringe or single domestic firm
that attempts to imitate the foreign good. The quality of the foreign good, µFn , is determined
exogenously. It is assumed that the foreign firm will not intentionally reduce (or raise) the quality
of the good.
The quality of the domestic good, µDn , is determined wholly by the inability of the domestic
firm(s) to imitate the foreign good, α+ γn, in which α ∈ [0, 1] represents the federal government’s
choice of IPR protection and γn represents the deviation from the federal standard chosen by the
local government. The domestic firm’s ability to imitate is therefore given by 1− (α+ γn). While
38

it is reasonable to assume that under strict IPR protection domestic firms might prefer to
innovate, existing research makes it difficult to argue that domestic firms do in fact respond this
way. Therefore, the qualities of the domestic goods are taken to depend only upon the level of
IPR protection.
With any positive level of IPR protection, the domestic firms can produce a good of quality
equal to, at most, µDn = (1− (α+ γn))µFn . With no IPR protection, the domestic firm can, at
best, produce a good of the same quality as the foreign firm. Therefore, µDn ∈ [0, µFn ]. It is
assumed that the domestic firm’s inability to imitate is increasing in IPR protection.
All firms, both foreign and domestic, face the same costs of entry and marginal costs,
assumed to be zero.
3.2.1 Competitive Domestic Fringe
In the case of a competitive domestic fringe, the foreign firm chooses its price, pFn to
maximize its profit:
πFn =
∫ bn
x̂n
pFn h(x)dx
The foreign price is therefore pFn = (α+ γn)µFnλn, where λn = 1−Hn(x̂n)hn(x̂n) .
The domestic firms compete profits down to zero, which, assuming a marginal cost of zero,
yields a domestic price of pDn = 0. The domestic firms choose the highest possible quality given
the level of protection. This, the domestic price, and the foreign price characterize the indifferent
consumer as x̂n = λn. Since the domestic price is zero, the market is covered. The low-type
consumer is thus xLn = 0.
The demand for the foreign good is 1−H(x̂n). The demand for the domestic good is H(x̂n).
The profit for the foreign firm is:
πFn = αµFnλn(1−H(x̂n))
The profit for the domestic firms is zero. The utility from the consumption of the foreign good is:
CUFn = µFn [(1− (α+ γn))λn(1−H(x̂n)) +
∫ bn
x̂n
(1−H(x))dx]
39

The utility from the consumption of the domestic good is:
CUDn = (1− (α+ γn))[λnH(x̂n)−∫ x̂n
0H(x)dx]
3.2.2 Single Domestic Firm
In the case of a single domestic firm, the foreign firm chooses its price, pFn to maximize its
profit:
πFn =
∫ bn
x̂n
pFn h(x)dx
The foreign price is therefore pFn = (α+ γn)µFnλn, where λn = 1−Hn(x̂n)hn(x̂n) .
The domestic firm chooses its price, pDn to maximize its profit:
πDn =
∫ x̂n
xLnpDn h(x)dx
The domestic price is therefore pDn = (α+ γn)(1− (α+ γn))µFnΛn, where
Λn = H(x̂n)−H(xLn)(1−(α+γn))h(x̂n)+(α+γn)h(xLn) . The domestic firm will choose the highest quality possible
given the level of protection. This then means that the indifferent consumer is described by
x̂n = λn − (1− (α+ γn))Λn and the low-type consumer is described by xLn = (α+ γn)Λn.
The demand for the foreign good is 1−H(x̂n). The demand for the domestic good is
H(x̂n)−H(xLn). The profit for the foreign firm is:
πFn = (α+ γn)µFnλn(1−H(x̂n))
The profit for the domestic firm is:
πDn = (α+ γn)(1− (α+ γn))µFnΛn(H(x̂n)−H(xLn))
The utility from the consumption of the foreign good is:
CUFn = µFn [(1− (α+ γn))λn(1−H(x̂n)) +
∫ bn
x̂n
(1−H(x))dx]
40

The utility from the consumption of the domestic good is:
CUDn = (1− (α+ γn))µFn [(λn − Λn)H(x̂n)−∫ x̂n
xLnH(x)dx]
3.3 Local Governments
Local governments care for the utility of their consumers, the profits of the domestic firms,
the profits of the foreign firm, weighted by σn. This weight represents the extent to which foreign
activity benefits a locality or, alternatively, the extent of a local government’s desire to attract the
foreign firm. Local governments are responsible for choosing an optimal deviation from the
federal standard of IPR protection, γn, subject to the level of decentralization, τ . A local
government that chooses to deviate pays a penalty for deviation, ϕ(γn). The more autonomy
enjoyed by a local government, the more it is able to deviate. Increased downward deviation
incurs an increased penalty. Upward deviation does not incur any penalty.
The local government’s available range of deviation is determined by the level of autonomy,
τ ∈ [0, 1]. Complete centralization is represented by τ = 0. Complete decentralization is τ = 1.
The available range of deviation is therefore γn ∈ [−τα, τ(1− α)].
3.3.1 Competitive Domestic Fringe
The local government chooses γn to maximize its objective function:
GLGn = σLGn πFn + CUFn + CUDn − ϕ(γn)
subject to γn ∈ [−τα, τ(1− α)].
Interior Solution
If the constraints on γn are non-binding, then the local governments choose γ∗n such that:
−ϕ′(γ∗n) = µFnλn[σLGn (1−H(x̂n))− (1− 1
λn
∫ x̂n
0H(x)dx)]
41

The first term represents the additional benefit to the local government of the increased profit
enjoyed by the foreign firm with higher protection. This puts upward pressure on the deviation.
The second term represents the negative impact on the consumers due to the increased foreign
price and the decreased quality of the domestic good. The relative sizes of these will determine
the size of the deviation.
Corner Solution
If the optimal size of the deviation is less than −τα, then the local government will choose
γ∗n = −τα. If the optimal size of the deviation is greater than τ(1− α), then the local government
will choose γ∗n = τ(1− α).
3.3.2 Single Domestic Firm
The local government chooses γn to maximize its objective function:
GLGn = σLGn πFn + CUFn + CUDn + πDn − ϕ(γn)
subject to γn ∈ [−τα, τ(1− α)].
Interior Solution
If the constraints on γn are non-binding then the local government chooses γ∗n such that:
γ∗n =−(λn −
∫ x̂nxLn
H(x)dx− ΛnH(xLn) + αΛ2nh(xLn)) + Λn(1− (α+ γn))(H(x̂n)−H(xLn)) + λnσLGn (1−H(x̂n))− ϕ′(γ∗n)
Λ2nh(xLn) + Λn(H(x̂n)−H(xLn))
The first term is negative and represents the negative impact on consumers of increased foreign
and domestic prices due to an increase in protection as well as the decreased quality experienced
by consumers of the domestic good. The second term is positive and represents the profit of the
domestic firm. The third term is positive and represents the profit of the foreign firm. The final
term is negative and reflects the penalty paid for deviation.
42

Corner Solution
If the optimal size of the deviation is less than −τα, then the local government will choose
γ∗n = −τα. If the optimal size of the deviation is greater than τ(1− α), then the local government
will choose γ∗n = τ(1− α).
3.4 Federal Government
The federal government maximizes the utility from the consumption of the foreign and
domestic goods in each locality and the benefit earned by each local government, scaled by its
preference for that locality, and some benefit from each of the foreign firms. It is responsible for
choosing a standard level of IPR protection, α, from which localities may choose to deviate,
subject to the level of decentralization.
For ease of solving and exposition, the consumer distribution, market structure, and quality
of the foreign good are the same in each locality. This means that x̂n, xLn, H(x̂n), and H(xLn)
are the same in each locality. The only difference between localities, therefore, is σLGn , the local
government preferences for the foreign firms, which will lead to different choices of deviations
from the formal level of protection, γ∗n.
3.4.1 Competitive Domestic Fringe
The federal government chooses the formal protection, α, to maximize its objective function:
GFG =N∑n=1
δn(GLGn ) +N∑n=1
σFGπFn
The optimal choice of α will be such that the weighted sum of the deviations (or, more
specifically, the weighted sum of the penalties paid due to the deviations) is offset by the benefits
to the local and federal governments from foreign profits, balanced by the harm to consumers:
−τN∑n=1
δnϕ′(γn) = −(1−H(x̂))
N∑n=1
(σFG + (δn − τ)σLGn ) + (1− τ)(1− 1
λ
∫ x̂
0H(x)dx)
In general, the federal government will prefer a higher level of protection than that of localities
43

due to the gain it gets from the foreign firm (this could also be interpreted as international
pressure to protect). However, since the government is balancing the weighted average of the
interests of localities, it is possible that individual localities might wish to have protection in
excess of the standard set by the federal government. Additionally, the federal government’s
decision is influenced by the amount of autonomy enjoyed by the localities. If there is complete
centralization, the government will put considerable weight on the interests of the consumers and
choose either complete protection or complete lack of protection, as in the base model. If there is
full autonomy, the federal government will not put any weight on the interests of consumers, and
instead choose its standard of protection to balance the benefits accrued from the foreign profits.
3.4.2 Single Domestic Firm
The federal government chooses α to maximize its objective function:
GFG =
N∑n=1
δn(σLGn πFn + CUFn + CUDn + πDn ) +
N∑n=1
σFGπFn
The optimal choice of α is given by:
α∗
=−λ +
∫ x̂xL
H(x)dx + ΛH(x̂) + λ(1−H(x̂))∑N
n=1 δnσLGn
Λ(Λh(xL) +H(x̂) +H(xL))+
NσFG(1−H(x̂))
(1− τ)(Λh(xL) +H(x̂) +H(xL))−
N∑n=1
δnγ∗n+
τ∑N
n=1 δnϕ′(γ∗n)
(1− τ)Λ2µF (Λh(xL) +H(x̂) +H(xL))
The complexity of the result obscures somewhat the interpretation, which does not differ
substantially from that of the result with a competitive domestic fringe: the government balances
the weighted averages of the interests of local governments and its own benefit, constrained by the
level of autonomy.
3.5 Discussion
This model is most appropriate for developing economies in which there is no existing norms
of IPR protection. In more developed economies, the norms of protection may prevent local
governments from deviating in their level of protection in response to economic objectives.
However, in developing economies, this limitation may not exist. Jordan is a good example of this
- between 1995 and 2005 it increased its level of IPR protection substantially, moving from one of
44

the lowest levels of IPR protection in the region to one of the highest. This was in response to a
desire for growth driven by foreign investment. This control over the level of protection, both de
jure and de facto, is possible in a country where the norm is not to protect. As a result, this
model of incentives is more appropriate for explaining behavior in developing countries.
The local governments are constrained in their deviation by the level of autonomy. Especially
in cases in which there is very little local autonomy, the limits of deviation are likely to bind. All
else equal, as equality increases (Gini decreases), the deviation is pushed downward (that is, the
local government will choose to protect below the federal level) toward the lower bound. For local
preferences for the local firm sufficiently low, the lower constraint will always bind. As the quality
of the foreign good increases or the preference for the foreign firm increases, the deviation will be
pushed upward (that is, the local government will choose to protect more than the federal level)
toward the upper bound. For consumer distribution sufficiently unequal, the upper constraint will
always bind.
Relaxing the assumption that the distribution of consumers is the same across localities
introduces more heterogeneity in the desire to deviate. The federal government sees this through
the chosen deviations of the local governments and chooses its federal standard in response.
Relaxing the assumption that firms only sell their goods in the localities in which they are
located introduces additional interesting heterogeneity. It is possible that firms locate in a specific
locality to take advantage of protection while also selling their goods elsewhere within the country
(and outside the country). In this case, the price chosen by the foreign firm (and single domestic
firm) reflects the level of protection in the locality and the distribution of consumers throughout
the entire country. This could lead to one of three outcomes: 1) the prices are higher than those
chosen in the extension without export, 2) the prices are lower than those chosen in the extension
without export, or 3) the prices are the same. In each case, the local government sees additional
incentives to either increase or decrease deviation. In all cases, the foreign profit is increased.
Contingent upon the size of the preference for the foreign firm and the size of the increased
foreign profit being sufficiently large, the benefit from increasing protection will outweigh the
detrimental impact on local consumer utility, putting upward pressure on the chosen level of de
facto local protection. If prices are lower than in the extension without trade, there will also be
an increase in consumer utility from the consumption of the foreign good. This could reduce the
45

pressure to reduce protection, allowing the local government to increase protection to benefit from
the increase in the foreign profit that would result. Trade within a country would affect the local
government’s decision both through the impact on domestic actors and through the increased
foreign profit. It would also likely lead to a concentration of foreign firms in those localities with
higher protection. As a result, other localities might intentionally keep their levels of protection
low to the benefit of their citizens, with the understanding that their citizens would still have
access to the foreign goods produced in other localities. This would be more likely in localities
with extreme levels of inequality and relatively low preference for foreign actors.
Trade with other countries would impact the local government’s decision through the foreign
profit, assuming that the price chosen for the exported good does not directly affect the local
price, and vice versa. Successful exporting to foreign countries would put upward pressure on
protection in order to increase the profit through the increased price so long as doing so does not
crowd out profit from selling the foreign good domestically and reduce consumer utility more than
the international gain. Increased preference for the foreign firm would magnify the incentive to
increase protection. As this preference can be interpreted in ways other than profit-sharing
agreements, such as local employment, this suggests that local governments that benefit from
increased local employment due to foreign production would have increased incentive to protect
IPR, even if foreign production is destined for export.
If domestic firms are also able to produce for export to other countries, this would put
downward pressure on protection, as these firms would benefit from producing a quality of good
as close to that of the foreign firm as possible and being able to sell at a price below the prices of
firms in other countries. The local government’s level of protection would depend, therefore, on
the relative sizes of demands for the foreign and domestic goods both within and outside the
country, in addition to benefits accruing from foreign production.
3.6 Conclusion
This extension looks at the incentives leading to a difference between the federal standard of
IPR protection and the reality of protection at the local level. Local governments respond to the
needs of the domestic actors, including consumers of the domestic and foreign goods and the
46

domestic firms trying to imitate the foreign firms, and the profits of the foreign firms. Depending
on the preferences of the local governments, they will have incentive to either protect in excess of
the federal standard or less than the federal standard, with this deviation being constrained by
the level of autonomy enjoyed by the local government and chosen based on the cost of deviation.
The federal government then chooses its federal standard based on a weighted average of the
desired deviations of the local governments, constrained by the level of autonomy, and their
international obligations or benefits from the foreign firm. Allowing firms to sell within the
country and outside their localities further impacts the local government’s chosen level of
deviation, possibly increasing the spread of chosen levels of deviation. International trade puts
further upward pressure on protection until doing so crowds out domestic consumers.
This model is best applied to countries without existing norms preventing local governments
from responding to economic incentives. As a result, while it can help explain differences in
protection in developing economies, it does a poor job of doing the same in developed economies.
47

CHAPTER 4: COUNTRY STUDY - JORDAN
Much literature regarding the role of IPR protection concludes that countries, in order to
court foreign investment, should increase their IPR protection. This tendency towards the
increase in IPR protection has been quite noticeable since the early 1990s, with the signing of the
Agreement on Trade-Related Aspects of Intellectual Property Rights (TRIPS). Since then, any
country wishing to become part of the World Trade Organization (WTO) must bring its IPR
standards up to those of TRIPS. Developing countries especially have been changing their laws to
bring themselves into accordance with TRIPS since that moment, often to encourage
international confidence and attract foreign investment.
Jordan has followed this trend, with a notable uptick in its IPR protection since the early
2000s. Prior to this change, Jordan had one of the lowest levels of protection among Middle
Eastern and North African countries and among Lower-Middle Income countries. Since 2000,
however, Jordan has maintained one of the higher levels of protection among Middle Eastern and
North African and Lower-Middle Income countries. Additionally, concurrently with its increase in
protection, Jordan has formed itself into a major strategic partner for Western countries and
launching pad for Western countries investing elsewhere in the Middle East.
A government’s choice of its appropriate level of IPR protection is influenced by the
country’s level of development. Also contributing to this decision, though, is the historical
strength of institutions and the interests of strong parties. IPR protection is not implemented
without significant trade-offs. Much of the current research agrees that while IPR protection
might encourage foreign direct investment, it does so at the expense of current consumption and
potentially domestic innovation, especially in those countries with relatively poor human capital
when compared to the investing country. IPR protection, while providing an attractive safety net
for foreign companies, often stems the flow of technical knowledge transfer to domestic companies.
Despite the potential negative impacts of increased IPR protection for developing countries,
the Western treaties that Jordan has joined and aspires to join, as demonstrated by the actions of
48
its government, consistently extol the virtues of IPR protection. Jordan has taken substantial
steps towards adopting these policies, not only by signing TRIPS, but also by enacting laws
designed to bring its legal standards and enforcement standards more in line with TRIPS and the
requirements of its free trade agreements and other international agreements. In doing so, Jordan
has moved from having one of the lowest levels of protection in the region to having one of the
highest.
This paper will utilize a model of government choice of intellectual property rights to shed
light on the incentives facing the Jordanian government in its decision. The paper will focus on
three primary questions: 1) Why was Jordan’s level of protection so low prior to 2000? 2) Why
did Jordan’s level of IPR protection jump so significantly in 2000? and 3) Why has Jordan’s level
of protection been so (relatively) high since 2000? Recognizing that culture, colonial history, legal
systems, and religion play an important role in influencing the choice of IPR protection, this
analysis will be conducted in comparison to seven countries in the region: Egypt, Iraq, Lebanon,
Morocco, Syria, Tunisia, and Yemen. These countries have similar colonial and legal histories and
religious makeup, controlling for the importance of these influences in determining the level of
protection. They are all lower-middle and upper-middle income countries and have similar levels
of development. They differ in their distributions of income and preferences for foreign firms,
however, and these differences will help shed light on the incentives compelling Jordan to keep its
protection relatively low prior to 2000 and relatively high following 2000.
This chapter will look at the distribution of incomes, dominant industries, strengths of local
or tribal governments, and participation in international agreements in these eight countries to
help elucidate Jordanian behavior. It will proceed in the following order: Section 1 will give an
overview of IPR protection in Jordan, Section 2 will give brief overviews of the state of IPR
protection in the rest of the comparison countries, Section 3 will apply the model, and Section 4
concludes.
Much research into IPR protection in developing countries is biased in favor of stricter
protection of intellectual property. This paper will attempt to analyze forces for and against the
implementation of IPR regimes without this normative assumption. However, it should be noted
that much of the recent regulation in both countries has been heavily influenced by Western
governments, and so this bias is increasingly present in discussions surrounding this topic.
49

Figure 4.1: Formal IPR Protection in MENA
4.1 History of Intellectual Property Rights Protection in Jordan
Jordan as an independent state has only existed since 1946, following recognition by the
United Nations and the later withdrawal of British troops. Prior to that, Trans-Jordan existed as
a British protectorate beginning in 1921. Jordan is a hereditary monarchy, and so it has had a
very slow succession of leadership. Under the current king’s rule, there has been an emphasis on
political and economic liberalization. Though the US has been involved in Jordan for its entire
history, it became increasingly involved in the mid-1990s, both through a USAID partnership and
through the UN and World Bank. During this time, the Jordanian government actively sought
membership in the WTO and, in order to support its bid for membership, enacted a series of
economic and political reforms, including many related to IPR protection. As a result, it is useful
to compare protection before 1995-2000 to protection after.
A number of legal scholars have provided fairly comprehensive analyses of the state of
Jordanian IPR laws before and after the change, including Al Dajani (2007) and Nesheiwat
(2012). Additionally, the USAID has maintained a presence in Jordan since the mid-1990s, and
regularly released reports detailing the state of IPR laws (1995, 2004, 2007). A summary of the
state of the IPR legal landscape as described by these authors follows.
50

Figure 4.2: De Facto IPR Protection in MENA
4.1.1 IPR Protection before 2000
Prior to the late-1990s, Jordan had very limited IPR protection. Few laws existed that
supported protection, and, as a result, few intellectual property cases were brought before
Jordanian courts. Despite the soundness of the few existing laws, the paucity of cases left judges
and lawyers with little experience (Nesheiwat 2012).
This lack of experience and a culture that often neither recognized the importance of IPR
protection nor considered imitation to be theft meant that Jordan had a reputation as a country
with very little protection for IPR (USAID 1995). Piracy of software and multimedia was (and
still is) abundant, and music artists tended to make their recordings in Cairo, Egypt, where there
was more protection for the artists’ work. Jordanian technology innovators first published their
discoveries in other countries to take advantage of international copyright treaties, fearing that
publishing first in Jordan would mean that their discoveries would not be protected (USAID
1995). There is still no good mechanism for preventing pirating videos or software, and it is quite
common to find pirated movies being sold in full view on the street.
Foreign companies enjoyed some protection and a somewhat facilitated copyright and
trademark registration processes in Jordan prior to the changes. The Patent Office gave some
51

protection to famous trademarks without registration, and foreign patent applicants tended to
have their applications registered without much examination (USAID 1995). While Jordan did
not at that time have external copyright relations, the Jordanian courts were required to abide by
the statutes of international treaties without first needing to ratify additional legislation. However,
this alone was insufficient to indicate to other countries or foreign firms that their intellectual
property would be protected in Jordan. To do that, Jordan would need to ratify and implement
bilateral or multilateral IPR treaties or sign on to international agreements (USAID 1995).
Though the level of Jordanian IPR protection was very low, WTO accession talks began to
reverse this trend. Jordan’s membership application stalled in 1994, but when King Abdullah II
took over the throne in February of 1999, he set an ambitious deadline of December 1999 for
completing the process of bringing the Jordanian IP landscape more closely into line with what
would be required for WTO admission. During this process, Jordan drafted, amended, or enacted
more than 25 laws regarding trade, investment, customs, and IPR, leading to the acceptance of
Jordan’s WTO application in December 1999 and its accession in April 2000.
4.1.2 Increase in IPR Protection
The rapid increase in protection between 1994 and 2000 was done with the support of such
agencies as the USAID and the UN as part of Jordan’s attempt to bring its laws into compliance
with TRIPS to facilitate WTO accession. The Jordanian and US governments both stated that
adopting more stringent IPR protection would be beneficial for Jordan, and this is especially true
for the pharmaceutical industry. Jordan is a small country with little in the way of natural
resources. It does, however, have a relatively well-educated population and is relatively politically
stable. Jordan’s main export markets include potash and pharmaceuticals, the latter of which is
dependent upon IPR protection. In order to facilitate economic growth, it appeared that the
Jordanian government took steps to make the country more attractive to investment by foreign
firms, especially those that could benefit from relatively less expensive and more skilled labor in
industries that might prefer improved IPR protection. To do this, it pursued WTO membership as
well as free trade agreements with the US and EU, all of which required substantial legal reform.
The process of becoming a member of the WTO was begun in 1994 under King Hussein, but
the process was accelerated considerably under his son and successor, King Abdullah II, who took
52
the throne in February 1999. During this period, in addition to the new laws on trade and
investment, eight new IPR laws were added to the four already in existence, with more being
added after accession, for a total of 15 new IPR laws added. The pace of reform was rapid;
however, many of the changes were passed while Parliament was not in session and without much,
if any, feedback from citizen groups in the country (Nesheiwat 2012). This unilateral action,
possible in a hereditary monarchy, undoubtedly enabled the rapid changes in the legal landscape.
However, it also may have led to a gap between the laws themselves and their local understanding
and enactment (Nesheiwat 2012, Al Dajani 2007, USAID 2004). This being said, policymakers in
Jordan wished to take advantage of the potential opportunities provided by WTO membership
and make the transition from a consumer of intellectual property to a producer of intellectual
property. This necessitated bringing its laws and economic environment into compliance with
WTO standards, educating the citizenry, and signaling to foreign companies that it is an
attractive market for investment and development.
4.1.3 IPR Protection after 2000
WTO accession and the adoption of the new IPR legislation has helped Jordan to improve its
reputation with regard to IPR protection. By 2004, the IPR reforms resulted in Jordan’s removal
from the International Intellectual Property Association watch list. Customs had improved its
identification of shipments of counterfeit goods. The number of IPR cases brought in front of
Jordanian courts increased markedly, as can be seen in Table B.8 (Nesheiwat 2012, USAID 2004,
USAID 2007). Additionally, in 2000 Jordan became the fourth country to sign a bilateral free
trade agreement with the US, and in 2002 it signed a free trade agreement with the EU. Both of
these agreements further increased the protection of IPR. They also served as indicators of
Jordan’s desire to liberalize its domestic and foreign economic policies and commitment to
creating an attractive market for foreign investment and involvement.
By 2007, despite a considerable increase in the extent of protection and enforcement, Jordan
was still not in full compliance with either the US or the EU free trade agreements. Multimedia
and software piracy remained high, and while the number of raids and copyright cases had
increased, decisions made by the judiciary were not as successful at deterring infringement cases
as was hoped by various international and domestic agencies. Very little legal action had been
53

taken against pirates or shops selling goods known to be pirated. Additionally, goods discovered
to be pirated had received approval for sale from the Jordanian Audiovisual Commission. Judicial
decisions in IPR cases demonstrated a lack of full comprehension of the new laws and did not
appear to be providing an effective deterrent to counterfeiting behavior (USAID 2007).
The Government of Jordan, with the assistance of the US, continues to train members of its
own judiciary and members of other governments in the region in the prosecution of IPR cases
(for example, according to the US Trade and Patent Office, Jordan hosted a Regional Workshop
for Legislators, Judges, and Government Representatives in Amman in February 2011). It also
continues to invest in campaigns to discover and prosecute cases of copyright infringement. The
number of domestic and international patent and other applications has substantially increased,
as has the number of cases brought before courts. Table B.8 shows these increases.
While it is clear that Jordan has gone a long way toward demonstrating to potential trading
partners that it has improved its ability to protect IPR, the impact on the domestic market,
especially in terms of poverty and unemployment, is not yet clear.
4.1.4 Discussion of the Increase in Protection
The question of whether or not a country, especially a developing country, should increase its
IPR protection has been well debated in the literature. Supporters of the adoption of increased
IPR protection point to its many potential benefits. Increased protection increases the
attractiveness of a country to foreign investors, especially in those instances when foreign firms
are looking to relocate some of their production processes. As noted by Parello (2008), when costs
of production are low and local skill is high, foreign companies wishing to move production to a
cheaper location are more likely to move their production to a country with higher protection
than to a similar alternative. Rhetoric among world leaders and international institutions extol
the virtues of strengthened IPR protection, arguing that improved protection leads to gains from
international cooperation and improved domestic innovation. They also provide incentives to
innovate, as the promise of protection, perhaps even that enacted for the benefit of foreign
companies, might entice domestic innovators who hope to benefit from the short-term monopoly
power offered by increased protection. Foreign companies also tend to prefer environments in
which intellectual property is well-protected, despite in general relying on internal structures to
54

reduce their risk. Despite having fairly good trade-secrets protection, improved IPR regulations
signals to foreign companies that Jordan is serious about protecting their intellectual property
should internal structures fail (USAID 1995, 2004, 2007).
On the other hand, many authors argue that increased IPR protection could have potential
detrimental impacts for developing countries. Braga (1989) argues that in developing countries,
IPR protection sacrifices the interests of society at large in favor of small, private interests. Often,
these societal interests are lower prices and sometimes, though less often, the increased quality of
certain goods that result from better protection. Chen (2005), summarizing Helpman (1993),
argues that, in developing countries, IPR protection has detrimental effects through adverse
terms-of-trade effects and a dependence upon the rate of innovation in the more developed
countries. Maskus (2000) and Acemoglu (2006) argue that for very low levels of development,
high IPR protection is beneficial, but, as a country begins to develop, high IPR protection
becomes potentially harmful. There is also a large subset of literature devoted to the debate
about the appropriateness of tying policies that advance the interests of developed economies to
aid and support given to developing economies. Many in this debate believe that it is harmful to
developing countries to impose a developed country-style growth model or to expect a similar
pattern of growth.
In Jordan, proponents of both viewpoints abound. There is also the further consideration of
the role that culture and religion play in the views toward the adoption of increased levels of IPR
protection.
Supporters of increased IPR protection in Jordan believe that it will help prevent brain drain
and turn Jordan into a center of technological innovation. Other governments in MENA have
found that foreign investment was stymied by their reputations as piracy havens. Similarly,
Jordan was viewed as a weak protector of IPR, undermining its efforts to attract foreign
investment. By bringing Jordans IPR standards up to the international norm, supporters hope to
make the country much more attractive to foreign investors (USAID 1995, 2004, 2007).
However, support for IPR protection in Jordan is neither entirely new nor uniquely Western.
In the 1991 National Charter, Jordanian political forces express a belief in the importance of IPR
protection, stating: “Copyright must be respected. Legislation protecting copyright and patents
must be updated (VI.1.8).” Even before its push for WTO membership, Jordan was looking to
55

improve the level of protection. Reasons for this can also be found in the National Charter, which
indicates a desire for Jordan to become an innovative hub:
“There must be a clear and well-defined development strategy based on the concept of
self-reliance, release of the innovating spirit in society...development of the national productive
base... (IV.1.2)”
“Science and technology have a central role in the development of society, as well as in
solving social and economic problems, strengthening Jordanian and Arab security, enabling
society to deal with changing conditions, and contributing to world civilization (VI.3).”
“A clear political decision and national will must exist to acquire, transfer, develop, and
utilize technology to meet the country’s needs on the basis of careful planning which relies on
indigenous institutions and on an advanced system of education (VI.3.1).”
“The Jordanian economy must be based on respect for private ownership and encouragement
of private enterprise (IV.1.1).”
The changes in protection that have already been implemented have catapulted Jordan from
the bottom to the top of the IPR rankings in the region. Whereas Jordan used to have one of the
lowest levels of IPR protection in the region, they are now regarded as a regional leader in
protection, according to the USAID (2004). Within Jordan’s own government, the perception of
IPR is often positive: “‘Jordan is now regarded as a regional leader in the enforcement of
intellectual property laws.’ - Mamoun Th. Talhouni, Director General, Department of the
National Liberty, Jordan (USAID 2004).”
“‘Jordan’s success in promoting intellectual property rights has helped legitimate businesses
capitalize on their IP assets and operate without fear of illegal competition,’ says Murad
Bushnaq, chairman of [Jordan Intellectual Property Association] (USAID 2004).”
These changes, and the better business environment they endeavor to create, are seen as
solutions for many of the economic issues Jordan has been struggling under for the last twenty
years, including unemployment, stagnant macroeconomic growth, and inflation. Additionally,
consumers of goods, while hurt by the higher prices experienced due to reduced access to
counterfeited goods, should also benefit from the elimination of potentially harmful counterfeited
goods, especially in the case of the pharmaceutical industry.
Despite the stated benefits of increased IPR protection, there are still forces against the
56

increase in protection. As USAID points out (1995), in recent history, Jordan has been a
consumer of intellectual property, not a producer. As a result, much of Jordanian society views
IPR protection as a benefit accruing only to those who create the intellectual property, the
foreign firms. These firms then remove revenue from Jordan, but do not necessarily invest or
provide new products. This view certainly undermines efforts to educate the population on
potential benefits of protection.
Additionally, as Dajani (2007) and Nesheiwat (2012) note, many in Jordan do not believe
piracy to be theft, and many more believe that piracy is essential to their livelihoods. This can be
seen in the prevalence of shops and stalls selling pirated software and multimedia, even on main
streets in the large cities. There is a religious element, too. Both Dajani and Nesheiwat argue
that many interpretations in Islam view property as communal, and so intellectual property
should also be communal. Additionally, much Islamic law is interpreted to allow an activity
unless it is expressly forbidden, and no one legal opinion is seen to be superior to another opinion.
As a result, as piracy is not everywhere expressly forbidden, there is no real consistency to belief
about piracy as theft, and different areas might have different approaches.
Within the National Charter of Jordan, despite its express promotion of increased protection,
it also explicitly states that “...natural resources and strategic projects must be the property of
the state (IV.1.1).”
Nesheiwat (2012) argues that Jordan should only expect to see foreign investment gains
related to increased IPR protection if the investment is sensitive to IPR. Since much of the FDI
into Jordan comes from Arab countries that find themselves in similar situations with regard to
their intellectual property protection, it would be reasonable to assume that more stringent IPR
laws would have a negligible effect on these flows (Nesheiwat 2010). Additionally, Nesheiwat
argues that since Jordanian imports are not very dependent upon intellectual property, it is not
clear that the benefits are as considerable as claimed (Nesheiwat 2010).
A 2010 survey of students at the University of Jordan conducted by Ferris Nesheiwat (2012)
reveals more about local perceptions of IPR protection, at least among educated young adults in
Amman. 90% of survey respondents admit to purchasing counterfeit products, with 53%
admitting to being willing to continue buying counterfeit products. However, this appears to be
motivated more by price than by religious beliefs or other social norms, as 64% said that they
57

would not purchase counterfeited products if they could afford to purchase an original and 72%
believe that counterfeit products are ethical because they allow individuals with limited incomes
access to goods. However, only 29% believe that counterfeit products are prohibited by religion,
and while price seems to be the primary motivator, religious edicts appear to be a stronger
deterrent than state law: 17% of respondents would continue purchasing counterfeit products if
counterfeits were prohibited by religion, compared to 35% who would continue to purchase if
counterfeits were prohibited by state law. Despite this, 75% believe that counterfeit products
intrude on the rights of companies (though 64% claim not to care about those companies’ losses),
49% feel uncomfortable when buying counterfeit products, and 54% believe that counterfeit
products harm people. It should be noted that this survey does not include older consumers or
consumers in less populated areas. It also focused primarily on products such as software and
books rather than pharmaceutical goods. It does seem to demonstrate, however, that while social
and religious norms help to explain the historical aversion to IPR protection in Jordan and
neighboring countries, the decision to purchase a copy instead of an original is driven by price.
Similar surveys of business owners in Lebanon demonstrate that younger respondents are more
likely to view IPR protection as important (CRI 2009).
While the implications of Jordan’s rapid increase in protection are not yet fully known, the
international community and Jordanian government appear to believe that the move was and will
continue to be beneficial for Jordan’s growth. As a result, the Jordanian government is continuing
to invest in improving understanding of the laws and training in proper enforcement.
4.2 IPR Protection in Comparison Countries
4.2.1 Egypt
Egypt has had a longer history of IPR protection than many of the other countries in the
region, signing the Berne Convention in 1997, and becoming part of the WTO and a TRIPS
signatory in 1995. Historically, its level of protection has exceeded that of Jordan, attracting
musicians from Jordan who wish to have protection of their art not traditionally offered in
Jordan. Despite this legislation and well-publicized seizures of counterfeit goods, Egypt’s record
of enforcement is poor, and much of the international community does not trust that it will
58

consistently enforce IPR protection laws (USAID 1995).
Egypt’s protection of IPR was more substantial to that of Jordan’s prior to 2000. Like
Jordan, however, Egypt also began to increase the number of IPR protection laws in accordance
with TRIPS between 1995 and 2002. Following this, like in Jordan, Egypt saw a noticeable
increase in the number of patents and trademarks filed. The international consensus seems to be
that, like in much of the rest of the Middle East, the laws are sound, but the enforcement is
lacking. As evidence of this, Egypt was placed on the Priority Watch List of the US Trade
Representative in 2003, remaining on the list until 2005 (Al Dajani 2007, Lewis 2008).
Egypt’s decision to increase its protection to bring it in line with international standards also
appears to have been in response to a political desire to remain an attractive trading and
investment partner for Western countries, particularly the US. Its IPR protection prior to this
change, while not as high as that of Iraq, seemed to be sufficient for the needs and preferences of
its residents. However, as Egypt tried (and tries) to become a more important international
player, it felt that increasing its standards served as an important signal of its potential to be so.
That being said, Egypt has fallen behind many of the other countries in the region with regard to
its IPR protection. Confounded by domestic tensions, Egypt began to fall in the international
rankings for IPR protection between 2010 and 2015. As it has stabilized, its level of protection
has begun to improve again. As with many of the other countries in the region, awareness and
enforcement of IPR laws continue to be an area of complaint for many foreign companies,
including and especially pharmaceutical companies, trying to do business in Egypt (USEBC 2011,
US Dept of Commerce 2017).
4.2.2 Iraq
While Jordan, and many of the rest of the MENA countries, has followed the trend of
increasing IPR protection, Iraq has followed a much different trajectory, with a drastic downturn
in its protection of IPR since the early 2000s. Iraq and Jordan have much in common, including
their historical timeline and culture, but they also differ quite substantially in terms of their
resource endowments. Jordan’s history has been much more stable than Iraqs. These economic
differences may have driven institutional divergence that can be used as a framework with which
to view this unexpected difference in IPR protection.
59

Between 1960 and 1995, Iraq had a noticeably higher IPR protection index than Jordan (on a
scale from 0-5, Iraq averaged 2.3 from 1960-1995, whereas Jordan averaged just 1.6). However,
beginning in 2000, when the US ramped up its interest in both countries, Iraq experienced a
falling IPR protection level, from 2.12 to 1.78 in 2005 and continuing this trend through 2011,
and Jordan experienced a rapid jump in IPR protection, from 1.08 to 3.43 in 2005. This
divergence in trajectory for the two countries might be due to a number of different factors. The
companies entering Iraq and the local Iraqi tribes might find it in their mutual best interest to
arrange their own protection in contracts without the intervention of the government.
Alternatively, it might be the case that the financial hurdle that must be overcome to enter into
the oil market in Iraq is such that the companies do not face threats to their intellectual property
and so do not demand a higher level of protection. The government of Iraq has also been very
involved in the oil sector, and so unofficial arrangements with the government may trump official
law in many cases. Finally, the war in Iraq certainly had a detrimental impact on the level of IPR
protection and enforcement.
The current Iraqi constitution, put in place by the Coalition Provisional Authority in 2003,
was constructed with little input from Iraqi law-makers. It aimed to mediate some of the
sectarian violence predating the constitution by redistributing power, often towards the Shia and
politically powerful Kurds. Clauses regarding the ownership of oil fields were vague, allowing
Kurdistan additional power and providing an avenue for local leadership to operate independently
of and often in direct opposition to the federal government. The IPR laws put in place by the
Coalition Provisional Authority were designed to help bring Iraq into compliance with TRIPS and
facilitate its bid for WTO membership. These laws have not been repealed, so, legally, foreigners
are treated the same as Iraqi citizens in their business dealings and are allowed to file for IPR
protection, a notable change from the law prior to 2003, which only offered protection to Iraqi
citizens. However, these laws are not often utilized, with the preexisting laws being enforced more
often than not. Historically, there has been an overall lack of respect for and confidence in the
Iraqi laws on the part of the Iraqi populace due to their limited staying-power and to the speed
with which they were dissolved by the US. For much of Iraq’s recent history, laws were suspended
due to states of emergency, so the population has been disenfranchised and retains little regard
for legal statutes. Implementing Western politicized laws is unlikely to change behavior among
60

the population. In Iraq, the powerful players are not necessarily in the federal government. The
government put in place by the US in the early 2000s has very little local legitimacy, and so
companies wanting to enter into Iraq must court those with local power as well as federal power.
While many in Iraq feel as if the federal government lacks some level of legitimacy, it is the federal
government that enters into profit-sharing agreements with and awards no-bid contracts to oil
companies. However, regional governments can enter into agreements with foreign entities, too,
and these agreements are often seen as stronger than the federal ones (Al Dajani 2007, ITA 2015).
4.2.3 Lebanon
Surveys of individuals involved in law and business in Lebanon indicate that perceptions of
IPR in Lebanon are favorable, especially among younger demographics. 95% of those surveyed
believed that IPR protection was important for promoting investment in Lebanon, with higher
agreement in the younger age brackets. However, a similarly high percentage, 97%, believe that
knowledge of IPR laws in Lebanon is average or below average, with 45% believing that the
population often or always resists enforcement of IPR laws. That being said, most respondents
believed that IPR infringement leads to moderate to substantial economic losses. In general,
respondents believed that government policies were slightly ineffective, and satisfaction with
government policies is low. Finally, most respondents believed that implementing IPR laws with
the purpose of facilitating WTO participation benefited Lebanon and other countries equally, that
joining the WTO is important for Lebanons growth and development, and that improving IPR
protection is essential for joining the WTO (CRI 2009).
As of today, Lebanon is not a member of the WTO. However, its IPR laws are generally
consistent with TRIPS standards. Despite the adequacy of the laws, enforcement and
understanding of the laws is poor, including and especially with regard to multimedia, software,
and pharmaceuticals. Lebanon has spent considerable time on the US Trade Representative
Priority Watch List (US Dept of Commerce 2017, Al Dajani 2007).
4.2.4 Morocco
Like many of the other countries in the region and developmentally similar countries
throughout the world, Morocco’s protection of IPR prior to 1995 was relatively low when
61

compared to that of more developed economies. However, with the passing of TRIPS in 1995,
Morocco increased its standards, earlier than many of the other countries in the region. In June
2004, Morocco signed a Free Trade Agreement with the US. As part of this agreement, Morocco
further increased its standards of protection, beyond that required by TRIPS. This increase in
protection was encouraged by the US as a means of supporting economic development in
Morocco. In Morocco, these increases were, at first, often seen as obligatory. However, many
business and government leaders in Morocco now see the costs of increasing protection as
transitory and worth the potential benefits that can accrue (Aloui 2009).
Despite the increasingly positive perception of IPR protection, enforcement of IPR standards
in Morocco is poor and inconsistent. US pharmaceutical companies have been supportive of the
increased laws in the pharmaceutical sector but remain concerned about the length of time it has
taken to implement the new laws. US businesses also argue that the extent of coverage is not as
complete as it could be. However, while foreign businesses frequently list IPR protection of an
area of interest when deciding whether or not to invest in Morocco, they often list it as a
secondary concern. The biggest complaint about the standards in Morocco is that enforcement is
lax or inadequate. With a few exceptions, the extent of legal coverage appears to be suitable for
most foreign businesses (UNICJRI 2014, US ITC 2004, Aloui 2007).
4.2.5 Syria
Various trade and other restrictions have been levied against Syria by the US and other
countries since 1974. The US has had sanctions in place against Syria since 2004. These economic
restrictions have prevented Syria from effectively using international trade as a development tool
and have almost certainly contributed to the lack of IPR enforcement in the country. While US
and EU firms are not prohibited from protecting and enforcing their IPR in Syria, they are
required to abide by the constraints of the sanctions.
The level of protection in Syria has been and continues to be minimal. Between 2002 and
2011, Syria joined a series of international agreements and enacted a series of laws designed to
improve protection, including ensuring protection for well-known trademarks and removing the
requirement that firms boycott Israel. With the support of the UN Development Project, Syria
became an observer in the World Intellectual Property Organization. However, despite
62

international support, Syria has not been able to develop its legal infrastructure such that it is
able to enforce the new laws, and protection remains almost non-existent. In light of the recent
sanctions and violence, improving IPR protection is a low priority for Syria today (US State Dept
2011, Balloch et al 2015).
4.2.6 Tunisia
As a member of the WTO, Tunisia signed TRIPS in 1995, though it has a signatory of a
number of international IPR treaties as early as the Berne Convention in 1887, the Lisbon
Agreement in 1958, and the Patent Cooperation Treaty in 1970 (UNICRI 2014). The Tunisian
government has taken more active steps to increase protection since 2005, reflecting shifting
opinions in the country with regard to IPR. Increasingly, as in other countries in the region,
businesses and governmental agencies consider IPR more than a legal requirement of continued
international participation; they are beginning to view it as an incentive to foster domestic
innovation and economic development. As a result, there has been improvement in understanding
and enforcement of the IPR laws (Abdel-Latif 2014).
In 2014, Tunisia adopted a new constitution. This new constitution explicitly guarantees the
protection of intellectual property, reflecting the increasingly common belief in the country that
doing so will foster innovation and development. While enforcement is still somewhat weak in
comparison to that of more developed economies, it is notable in its improvement (Abdel-Latif
2014).
4.2.7 Yemen
Protection of IPR in Yemen is very weak. While it has acceded to a number of international
treaties (the Paris Convention in 2006 and the Berne Convention in 2008), its existing laws and
standards as of 2012 were not considered sufficient to be in compliance with TRIPS. Since 2012,
Yemen has instituted additional changes and became a WTO, and thus TRIPS, signatory in
2014. However, the number of IPR cases heard by courts in Yemen is very low, and enforcement
is poor and lagging (US Dept of State 2012).
Despite the few laws and poor enforcement, it appears that elements of the Yemeni
government recognize improved protection of IPR as a worthwhile endeavor. Mahmoud
63

Al-Naqeeb, the 2016 Ministry Advisor of Intellectual Property and Consumer Protection Affairs,
argued in a 2012 study that improved domestic protection of IPR would encourage innovation
and production, and that this protection of ownership would lead to economic growth. He noted
that Yemen’s accession to international agreements would increase confidence among
international investors. Finally, he stated that Yemen has a wealth of cultural knowledge, and
protection of IPR was necessary not only for economic development, but also for social
development (Al-Arashi 2012).
Yemen’s recent and ongoing political instability has made questions of IPR protection of
secondary importance, however.
4.3 Brief Economic Overview of Comparison Countries
Jordan has little in the way of natural resources, and is energy, food, and water poor. Its
biggest imports are oil and petroleum, with sizable imports of grain. Its biggest exports are
textiles, potash, and pharmaceuticals, among others. Services and tourism comprise the greatest
component of its domestic economy, which is also marked by relatively large government
expenditure and significant remittances. Despite 14% of the population living below the poverty
rate and a Gini coefficient of 0.39, Jordan is regarded as having some of the least inequality in the
region. Jordan is a small country of a little over 10 million people (including refugees), 84% of
whom live in urban areas, and 17% of whom are unemployed (though unofficial estimates are
much higher, at 30%).
Egypt is significantly larger than Jordan, with a little over 97 million people, 43% of whom
live in urban areas and 95% of whom live within 20 kilometers of the Nile River, and an
unemployment rate of 12%. Egypt is much better endowed with natural resources, and
agriculture (in addition to hydrocarbons, tourism, and pharmaceuticals) is one of its main
industries. Egypt’s primary exports are crude oil and petroleum products, fruits and vegetables,
and textiles. Its primary imports are machinery and foodstuffs. Poverty and unemployment have
been major economic issues of late. Its inequality, as measured by a Gini coefficient of 0.30, is
relatively low, however.
Iraq’s recent history, like much of that of the rest of the region, has been defined by war.
64

Despite this, Iraq has ample petroleum and natural gas deposits and uses those deposits to its
advantage, though this also means that it is subject to the volatility of the oil market. The Iraqi
economy is primarily state-run, in contrast to the mostly market-driven economies of the rest of
the comparison countries, and almost entirely dependent upon oil. The vast majority of its
exports is crude oil. Its primary imports are food and medicine. Iraq has a population of a little
over 39 million, 70% of whom live in urban areas and 16% of whom are unemployed.
Lebanon’s history, while punctuated by periods of political turmoil, has been one of relative
prosperity due to its position as a regional trading post on the Mediterranean Sea and financial
center. Lebanon is small, with a population of a little more than 6 million, but it has natural
resources, arable land, and easily accessible ports. 88% of the population lives in urban areas,
many of whom live along the coast. The market economy is open to investment, though restricted
by corruption. The main sectors include banking and tourism. Commodity exports include
metals, chemicals, and fruit and vegetables. Commodity imports include petroleum products,
cars, medicine, and textiles.
Morocco, while small in geographic size, has a population of just under 34 million, 61% of
whom live in urban areas, with an unemployment rate of 9% and a Gini coefficient of 0.41. Like
in Jordan, remittances are substantial. Agriculture, tourism, and textiles are among the most
important sectors of the economy. Dominant exports include textiles, automobiles, petroleum
products, and fruits and vegetables. Dominant imports include crude oil, textiles, and grains.
Syria’s recent history has been marked by violence, and it is currently embroiled in a
humanitarian crisis. Syria has a population of a little over 18 million, 59% of whom live in urban
areas. Despite the economic turmoil resulting from its current crisis, Syria exports crude oil,
minerals, and fruits and vegetables and imports machinery, foodstuffs, and chemicals.
Tunisia is a small country with a population of over 11 million, 67% of whom live in urban
areas and 13% of whom are unemployed, with a Gini coefficient of 0.40. The economy is relatively
diverse, with textiles, food products, and petroleum products the dominant exports and textiles
and machinery the dominant imports.
Yemen has a population of a little more than 28 million, 36% of whom live in urban areas
and 34% of whom are unemployed. Yemen is also experiencing a severe humanitarian crisis,
limiting imports and damaging productive capacity. Oil and gas were essential components of the
65

Yemeni economy prior to the crisis, and still make up the largest portion of exports. Yemen’s
primary imports are food and live animals.
4.4 Relating the Jordanian Experience to the Model
The general model looks at the importance of the market structure, distribution of consumer
incomes, and institutions in understanding incentives to increase or decrease the level of
protection. It assumes a single foreign firm entering a market and either a single domestic firm or
a competitive domestic fringe attempting to imitate that product. The quality of the imitated
product is determined by the level of IPR protection. Consumers choose to purchase either the
foreign or the domestic good (or, in the case of the single domestic firm, no good at all)
depending upon their level of income. As the distribution of income changes, so do the relative
sizes of the demands for the foreign and domestic goods. The government then balances the
utilities earned by the consumers of the goods and the profits earned by the firms depending upon
the institutions and preferences of the country. If the preference for domestic actors is sufficiently
high, then the government will always choose the level of protection that most benefits them,
pushing protection down towards its minimum. If the preference for foreign actors is sufficiently
high, then the incentive to protect will be magnified, encouraging the government to push its level
of protection upward.
The extension allows for the federal government and local governments to respond to slightly
different incentives. The local governments balance the interests of the consumers and firms in
their own localities. The federal government balances the interests of the local governments with
its external obligations or interests. This allows for local deviation in the level of protection,
limited by the amount of autonomy enjoyed by the local governments.
The incentives to increase (or decrease) protection as described by the model are most easily
seen by looking at the Jordanian pharmaceuticals industry. Pharmaceuticals are sensitive to
intellectual property, and the quality of pharmaceutical goods is differentiated by the ability of an
imitating firm to effectively copy the good. Additionally, pharmaceuticals are one of Jordan’s most
important industries, and so the effect of changes in preferences will have a noticeable impact on
the government’s objective function. This is therefore a market in which the quality of goods is
66

vertically differentiated, a foreign firm is introducing a good with intellectual property, and
domestic firms are imitating to the best of their abilities, limited by the level of IPR protection.
It should be noted that many of the foreign firms entering the market appear to be doing so
in order to take advantage of the distributional networks maintained by the domestic firms rather
than producing their proprietary goods in Jordan (Nesheiwat 2010). According to Amwal Invest
(2010), 70% of sales in the pharmaceutical sector in Jordan are designated for export. As
discussed in Chapter 3, this puts additional upward pressure on protection, beyond that called for
by the domestic market, due to the interests of the foreign firm and the potential benefits, such as
local employment, that come from foreign firms choosing to locate in Jordan. However, as
domestic firms also export, this puts downward pressure on protection, as decreasing protection
can have benefits for the domestic firms.
Much of Jordan’s GDP is derived from remittances, often from oil-rich countries. These
remittances are variable as they are linked to the health of the oil industry. Additionally, Jordan
has no oil and very little in the way of other exportable resources of its own. The pharmaceutical
industry is strong relative to both other domestic industries and pharmaceutical industries
elsewhere in the region. Therefore, Jordan has put emphasis on it, and on other high-skill
industries, in forming its development and growth policies.
Figure 4.3 shows Jordan’s formal IPR protection (as described by the GP Index), and Figure
4.4 shows Jordan’s de facto IPR protection (as described by the WEF measure of IPR) as
compared to the group of comparison countries. Jordan is depicted in red while the other
countries are depicted in blue. The depiction of formal protection clearly shows Jordan as the
lowest protector prior to 2000. Beginning in 2000, however, Jordan swiftly adopts one of the
highest levels of protection in the group, becoming, and remaining, the highest protector in 2008,
both for formal and for de facto protection.
4.4.1 Market Structure
The pharmaceutical industry in Jordan consists of about a dozen firms, almost all of which
are headquartered or fully located in the Amman governorate. Of these firms, very few, only two
or three, have any capacity for research and development. Most of the companies in this sector
produce generics. In the last few years, there has been some consolidation of the Jordanian
67

Figure 4.3: Formal IPR Protection in Comparison Countries
Figure 4.4: De Facto IPR Protection in Comparison Countries
68
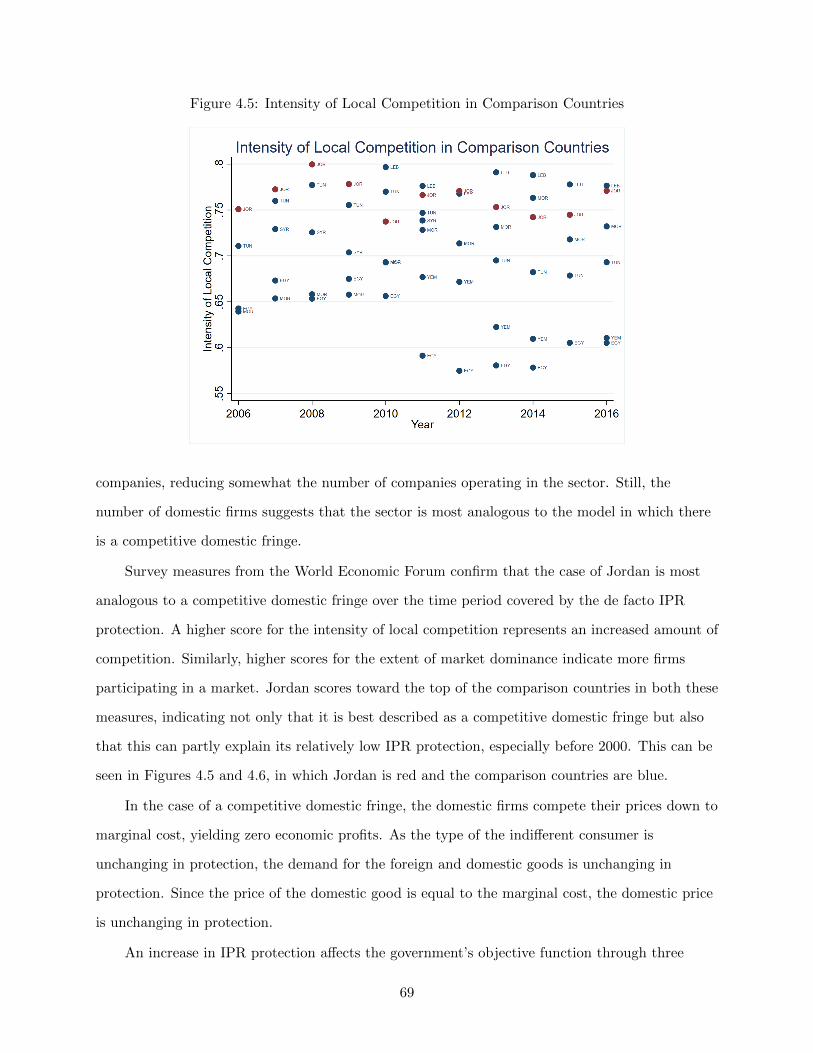
Figure 4.5: Intensity of Local Competition in Comparison Countries
companies, reducing somewhat the number of companies operating in the sector. Still, the
number of domestic firms suggests that the sector is most analogous to the model in which there
is a competitive domestic fringe.
Survey measures from the World Economic Forum confirm that the case of Jordan is most
analogous to a competitive domestic fringe over the time period covered by the de facto IPR
protection. A higher score for the intensity of local competition represents an increased amount of
competition. Similarly, higher scores for the extent of market dominance indicate more firms
participating in a market. Jordan scores toward the top of the comparison countries in both these
measures, indicating not only that it is best described as a competitive domestic fringe but also
that this can partly explain its relatively low IPR protection, especially before 2000. This can be
seen in Figures 4.5 and 4.6, in which Jordan is red and the comparison countries are blue.
In the case of a competitive domestic fringe, the domestic firms compete their prices down to
marginal cost, yielding zero economic profits. As the type of the indifferent consumer is
unchanging in protection, the demand for the foreign and domestic goods is unchanging in
protection. Since the price of the domestic good is equal to the marginal cost, the domestic price
is unchanging in protection.
An increase in IPR protection affects the government’s objective function through three
69

Figure 4.6: Extent of Market Dominance in Comparison Countries
avenues: it decreases surplus from the consumption of the domestic good, it decreases surplus
from the consumption of the foreign good, and it increases the profit of the foreign firm. Because
the ability of domestic firms to imitate is decreasing in protection, as protection rises, the quality
of the domestic good falls, decreasing surplus from the consumption of the domestic good. The
price of the foreign good rises in protection, which transfers surplus from the consumers of the
foreign good to the foreign firm.
The diminished consumer surplus from increased protection provides incentive for
governments to reduce protection, whereas the increased foreign profit from increased protection
provides incentive for governments to increase protection. The final decision will therefore depend
upon the institutions, upon how much the government cares for the needs of the consumers
traded-off with the needs of the foreign firm. Before 2000, the Jordanian government cared
relatively less for the needs of the foreign firms, so the incentive to reduce protection coming from
the consumers of both the foreign and domestic goods dominated the incentive to increase
protection coming from the foreign firm. This helps to explain the low protection prior to 2000 -
the Jordanian government was responding to the interests of the consumers made worse off by
high protection. After 2000, the Jordanian government had increased preference for the foreign
firms, and thus there was increased incentive to raise protection.
70

In the case of a single domestic firm, the domestic firm prices above marginal cost, and as a
result, the market is not covered. A portion of consumers chooses not to purchase either the
foreign or the domestic good. This both reduces the size of the demand for the domestic good and
increases the profit of the domestic firm. As a result, the detrimental impact on consumers of the
domestic good of an increase in protection is diminished. At the same time, for sufficiently low
levels of protection, small increases in protection lead to increases in the foreign price, which
allows the domestic firm to increase its price by a higher percent than its loss in consumers. This
benefit accruing to the domestic firm puts upward pressure on the level of protection. For those
comparison countries with more monopolized markets, this suggests that the level of protection
should be higher than that in more competitive markets, especially if the overall level of
protection is already relatively low.
4.4.2 Distribution of Income
Though Jordan’s Gini coefficient has vacillated somewhat over time, it tends to be low
relative to international standards, indicative of relatively low income inequality. Compared to
other countries in the region, Jordan has relatively similar consumption and living conditions
across income brackets, and access to water and healthcare is relatively consistent (UNDP 2015).
A measure of a Gini coefficient is not available for every year in the analysis, but using other
qualitative descriptions, it would appear that Jordan has relatively low inequality when compared
to other countries in the region, especially countries with oil or other exportable resources
controlled by a small percentage of the population. Additionally, Jordan sees very little difference
in inequality between urban and rural centers, and inequality when measured by consumption is
lower than inequality when measured by income (UNDP 2015). All of this suggests that there is
very little income-based difference in consumption patterns.
Figure 4.7 shows not only that Jordan’s Gini coefficient has vacillated, but also that the Gini
coefficients for the comparison countries have vacillated. It also shows the inconsistency with
which Gini has been recorded for these countries. These two things together suggest that the Gini
coefficient may not be the best measure of inequality for the region, despite its usefulness in
measuring the shape of the income distribution.
In the model, inequality is described by a distribution of income, assumed to be Weibull. The
71

Figure 4.7: Gini in Comparison Countries
Weibull distribution can be used to obtain a Gini coefficient, but the impact of inequality is
examined by changing its shape parameter. As the shape parameter increases, the distribution
becomes increasingly concentrated about the mode, reducing the Gini coefficient (decreasing
inequality).
In a competitive domestic fringe, as inequality falls, so too does the type of the indifferent
consumer. This means that the size of the demand for the foreign good rises. It also puts
downward pressure on the price of the foreign good. As a result, the size of the utility from the
consumption of the foreign good rises. Because the type of the indifferent consumer falls and the
market is assumed to be covered, the size of the demand for the domestic good falls. Therefore,
the importance of the consumers of the domestic good in the government’s objective function falls
relative to that of the consumers of the foreign good.
Given this, as inequality decreases, an increase in protection will have a larger negative
impact on consumer utility than it would under higher income inequality. The more equal the
income distribution, therefore, the more substantial the incentive to keep protection low in the
case of a competitive domestic fringe. In the case of Jordan, because it has relatively low
inequality, there is much pressure to keep protection low. Prior to 2000, when there was less
weight on the interests of the foreign firms, Jordan’s regionally low level of protection reflected
72

this. After 2000, when there was much more weight placed on the foreign firms, there was an
incentive to increase protection despite relatively large benefit to domestic consumers of low
protection, reflected in the higher level of protection.
In the case of a single domestic firm, as inequality decreases, more of the market is covered,
and more of the market consumes the foreign good. The price of both goods falls, but this fall in
price and the increased portion of the market consuming the foreign good mean that the profit of
the domestic firm also falls as inequality decreases. So when inequality is relatively low under a
single domestic firm, consumer welfare from the consumption of both goods is somewhat larger,
putting downward pressure on IPR protection, but the damage to the domestic firm of reducing
protection is also larger, putting upward pressure on protection. When inequality is relatively
high under a single domestic firm, the benefits to the domestic firm are more substantial and the
costs to the consumers of the domestic good are less substantial, putting upward pressure on the
level of protection.
4.4.3 Local Government
When the model is extended to local governments, it helps to explain some of the difference
between formal protection and the reality of protection. In the extension with local governments,
the local governments are responsive to consumers of the domestic and foreign goods, as in the
base model. Unlike the base model, however, they do not trade off the well-being of foreign and
domestic actors. Instead, they obtain some benefit from the foreign firm, which can be
understood to be smaller than the size of the foreign profit, like taxes or a profit-sharing
agreement, or larger than the size of the foreign profit, like benefit from improved infrastructure
or employment. The local governments then choose their deviation from the federal standard
based on these interests and their ability to deviate, which is limited by the level of autonomy.
Local governments incur a cost for deviating downward.
The federal governments determine their standard by looking at the desired deviations of the
localities and the benefit the federal government gets from the foreign firms. This can be
perceived as taxes, profit-sharing agreements, or internationally-required standards. The interests
of the localities are weighed based on preferences for each of the localities. The choice of federal
standard is also impacted by the level of local autonomy. If local governments have no freedom to
73

deviate in their formation or enforcement of policies, then the federal government will choose the
level of protection that minimizes the weighted average of deviations. If the local governments
have complete autonomy, the federal government will choose a higher level of protection,
influenced by its own interests and the ability of local governments to deviate optimally.
Jordan’s governorates are governed by appointment, so there is little ability to deviate from
the federal standard. However, its population is concentrated in the north, and governorates have
very different dominant industries. The governorates of Irbid and Amman are arguably the most
sensitive to issues of intellectual property. Irbid is home to qualified industrial zones, which receive
preferential treatment in international trade to facilitate trade with Jordan. Amman’s largest
industries include medical tourism, commerce, and pharmaceuticals. The federal government is
also seated in Amman. Many of the western and southern governorates are dominated by tourism
and agriculture, neither of which is particularly sensitive to intellectual property. On the whole,
Jordan’s biggest industries are tourism, clothing, potash, and pharmaceuticals.
The relative lack of autonomy means that the federal standard more closely reflects the
interests of the federal government vis-a-vis its international obligations and the interests of the
localities with the largest concentration of people and IPR-sensitive industries. As a result, it is
reasonable to expect that the needs of the firms in Amman have provided incentive to increase
protection, with this incentive intensifying after 2000.
4.5 Conclusion
Jordan provides an interesting study of the incentives facing the government to either increase
or decrease IPR protection. Prior to 2000, Jordan had one of the lowest levels of IPR protection
in MENA and among countries with similar legal and religious institutions. Between 1995 and
2005, its level of protection jumped markedly. While all countries in the region that signed on to
TRIPS had a similar jump in protection, Jordan’s was notable in its size. Additionally, during
this period, Jordan moved from one of the lowest protectors of IPR to one of the highest.
A model of incentives facing the government helps to answer three questions: 1) Why was
Jordan’s level of protection so low prior to 2000? 2) Why did Jordan’s level of IPR protection
jump so significantly in 2000? and 3) Why has Jordan’s level of protection been so (relatively)
74
high since 2000? Jordan fits the version of the model with a competitive domestic fringe and has
consistently low inequality, relative to the rest of the region. Prior to 2000, these two things,
combined with relatively low emphasis placed on the interests of foreign firms help to explain why
the pressure to reduce protection was so low. Between 1994 and 2000, the government actively
changed its preferences toward the interests of foreign firms in order to encourage economic
growth. This helps to explain why the jump in protection was so high - in addition to the
necessary legal changes that accompany accession to WTO, Jordan placed increased weight on
the foreign firms, increasing the incentive to protect. This persistent preference for the interests of
foreign firms helps to explain why Jordan has remained one of the stronger protectors of IPR
since 2000.
75

CHAPTER 5: CONCLUSION
This paper has laid out a model for understanding the incentives facing governments in
determining their optimal levels of IPR protection. Understanding that international pressure and
historical institutions play a dominant role in determining the level of IPR protection, this paper
attempts to understand the importance of market structure, institutions, and the shape of the
consumer income distribution.
The model introduced in this paper shows that, in the case of the competitive domestic fringe,
higher levels of protection benefit only the foreign firm and hurt all consumers (the domestic firms
are ultimately unaffected). In the case of a single domestic firm, higher levels of protection benefit
the foreign firm and the consumers of the foreign good but hurt the consumers of the domestic
good. Higher protection first benefits then hurts the domestic firm. The government then faces a
trade-off between the domestic and foreign actors, and it chooses its level of protection based on
this trade-off. As the distribution of income changes to become more unequal, that is, as there is
increasing weight on the consumers of the poorest type, the model shows that the government
faces increased downward pressure on the level of protection, all else equal.
Additionally, there appears to be some divergence between formal and de facto protection.
One possible explanation for this divergence is the autonomy of local governments. While the
federal government must take into account the interests of all its localities as well as its
international obligations, local governments are better able to respond to the needs of their own
citizens only. It may be the case, therefore, that some localities may prefer relatively high levels of
protection while others prefer relatively low. If local authorities have sufficient autonomy to
enforce IPR laws, then it may be the case that they diverge from the federal government
standard, either above or below. The extension to the model demonstrates the impact that this
has on the federally-chosen standard. As the level of autonomy increases, the federal government
becomes more responsive to outside influences. With less autonomy, it chooses a standard that
better minimizes the weighted average of the chosen deviations of the localities. As the norm in
76

developed economies is to protect, this extension paints a better picture of an avenue for
explaining the divergence between formal and de facto protection in developing economies.
Finally, the pharmaceutical sector in Jordan provides a compelling case study for the model.
Jordanian governorates have little real autonomy, so the federal government acts in lieu of the
local governments, choosing a standard that balances the (weighted) interests of its localities and
its international objectives. The drastic increase in protection around 2000 comes from a clear
shift in priorities on the part of the government, analogous to the shift in weight from the
domestic interests to the foreign interests in the model. The distribution of income and market
structure help to explain why protection in Jordan was relatively low prior to 2000, and the
persistent preference for foreign actors helps to explain why the protection has been so high after
2000. For a country with few other means of economic growth, IPR protection has been wielded
as a tool for creating continued growth through policies designed to favor foreign companies,
despite historical aversion to IPR protection.
The model in its current form is inherently simplistic in its conception of the choice of IPR
protection. It is this way with the intention of highlighting the role of very specific influences on
government behavior in order to better understand the incentives facing governments. In an
international system pushing for homogenized and stringent IPR legislation, understanding these
incentives can better help policymakers understand failure to adopt or enforce certain laws and
pressures to relax IPR requirements.
77

APPENDIX A: EXPLANATION OF MODEL RESULTS
A.1 General Model
Consumers are distributed according to h(x) along [0, b], and the distribution of consumers is
assumed to be log-concave. Assuming that the quality of the foreign good is determined
exogenously and that the quality of the domestic good is determined by the level of IPR
protection, α, the quality of the domestic good is given by µD = (1− α)µF and the indifferent
consumer is given by:
x̂ =pF − pD
µF − µD=pF − pD
αµF
The functions λ(x̂) = 1−H(x̂)h(x̂) and Λ(x̂, xL) = H(x̂)−H(xL)
(1−α)h(x̂)+αh(xL) will be suppressed to λ and Λ
throughout the appendix for ease of reading.
A.1.1 Competitive Domestic Fringe
Levels
In the competitive domestic fringe, domestic firms compete prices down to marginal cost.
Since marginal cost is assumed to be zero, pD = 0. Therefore,
x̂ =pF
αµF
and
dx̂
dpF=
1
αµF> 0
The indifferent type, xL is given by xL = pD
µD= 0
(1−α)µF= 0. The market is covered in the
case of a competitive domestic fringe with marginal cost zero.
The demand for the foreign firm is 1−H(x̂) and the demand for the domestic firm is H(x̂).
The foreign firm solves:
maxpF
∫ b
x̂pFh(x)dx = (1−H(x̂))pF
78

0 = (1−H(x̂)) + pF (−h(x̂)dx̂
dpF)
pF =1−H(x̂)
h(x̂)αµF = αµFλ
This gives x̂ = pF
αµF= αµFλ
αµF= λ.
Following this, the profit of the domestic firm is πD = 0 and the profit of the foreign firm is
πF = αµFλ(1−H(x̂)).
The consumer utility from the consumption of the domestic good is given by (using
integration by parts):
CUD =
∫ x̂
0(xµD − pD)h(x)dx =
∫ x̂
0(1− α)µFxh(x)dx
CUD = (1− α)µF [λH(x̂)−∫ x̂
0H(x)dx]
where the integral term is the expected type of the consumer given that the consumer purchases
the domestic good. Consumer utility from the consumption of the domestic good must be greater
than or equal to zero (otherwise the consumers would choose not to purchase), therefore,
λH(x̂) ≥∫ x̂
0 H(x)dx.
The consumer utility from the consumption of the foreign good is given by (using integration
by parts):
CUF =
∫ b
x̂(xµF − pF )h(x)dx = µF
∫ b
x̂xh(x)dx− pF
∫ b
x̂h(x)dx
CUF = µF [b− λH(x̂)−∫ b
x̂H(x)dx]− pF (1−H(x̂))
CUF = µF [
∫ x̂
01dx− x̂H(x̂) +
∫ b
x̂(1−H(x))dx]− αµFλ(1−H(x̂))
CUF = µF [(1− α)λ(1−H(x̂)) +
∫ b
x̂(1−H(x))dx]
where the integral term is the expected type of the consumer given that the consumer purchases
the foreign good.
79

Comparative Statics
Given that λ(x) = 1−H(x)h(x) and that, for log-concave functions, f(x)f”(x)− (f ′(x))2 ≤ 0:
dλ(x)
dx=−h(x)h(x)− (1−H(x))h′(x)
(h(x))2=H(x)h′(x)− (h(x))2 − h′(x)
(h(x))2< 0
Given this,
∂x̂
∂α=dλ
dx̂
∂x̂
∂α
and so ∂x̂∂α = 0 and ∂λ
∂α = 0.
The sizes of the demands for the foreign and domestic goods are unchanging in protection:
∂(1−H(x̂))
∂α= −h(x̂)
∂x̂
∂α= 0
∂H(x̂)
∂α= h(x̂)
∂x̂
∂α= 0
The foreign price is increasing in protection, and so the foreign profit is also increasing in
protection:
dpF
dα= µFλ+ αµF
∂λ
∂α= µFλ > 0
∂πF
∂α= αµFλ(−h(x̂)
∂x̂
∂α) + µF (1−H(x̂))[λ+ α
∂λ
∂α] = µFλ(1−H(x̂)) > 0
Intuitively, the utility from the consumption of the domestic good should not vary with
protection, as the neither the domestic demand nor the domestic price varies with protection.
This then refines the condition from earlier, ∂CUD
∂α = 0, and requires that the two terms be equal:
λH(x̂) =∫ x̂
0 H(x)dx.
∂CUD
∂α= 0 = −µF (λH(x̂)−
∫ x̂
0H(x)dx) + (1− α)µF (
∂λ
∂αH(x̂) + λh(x̂)
∂x̂
∂α−H(x̂)
∂x̂
∂α)
∂CUD
∂α= 0 = −µF (λH(x̂)−
∫ x̂
0H(x)dx)
Therefore, λH(x̂) =∫ x̂
0 H(x)dx.
Intuitively, the utility from the consumption of the foreign good should fall by the same
80

amount as the profit of the foreign firm rises when the level of protection changes:
∂CUF
∂α= µF [−λ(1−H(x̂)) + (1− α)(
∂λ
∂α(1−H(x̂))− λh(x̂)
∂x̂
∂α)− (1−H(x̂))
∂x̂
∂α]
∂CUF
∂α= −µλ(1−H(x̂)) < 0
The government’s optimal choice of protection therefore depends wholly upon the
institutions:
∂G
∂α= ρ[
∂CUD
∂α+∂CUF
∂α+∂πD
∂α] + (1− ρ)[
∂πF
∂α]
∂G
∂α= ρ(−µFλ(1−H(x̂))) + (1− ρ)µFλ(1−H(x̂)) = (1− 2ρ)µFλ(1−H(x̂))
Therefore, if ρ > 12 , the government will choose a complete lack of protection of IPR, and, for
ρ < 12 , the government will choose to protect IPR completely.
A.1.2 Single Domestic Firm
Levels
In the case of the duopoly, both the foreign and domestic firms choose their prices, and the
domestic firm chooses its quality. The quality of the foreign good is taken to be exogenous. As
before, the indifferent consumer is given by x̂ = pF−pDµF−µD and the low-type consumer is given by
xL = pD
µD≥ 0. The timing is as follows: the government chooses the level of protection, the foreign
firm chooses its price taking its quality as exogenous, the domestic firm chooses its price and
quality, and then consumers choose to purchase the foreign good, the domestic good, or neither
good.
The domestic firm takes pF , µF , and α as given and chooses pD and µD:
maxpD,µD
∫ x̂
xL
pDh(x)dx st µD ≤ (1− α)µF
0 = (H(x̂)−H(xL)) + pD(h(x̂)(−1
µF − µD)− h(xL)(
1
µD))
0 = pD(h(x̂)(pF − pD
(µF − µD)2)− h(xL)(
−pD
(µD)2)) + γ
81

0 ≥ µD − (1− α)µF
If the constraint does not bind, then γ = 0. For this to be true, either pD = 0 or
h(x̂)(pF − pD
(µF − µD)2) = −h(xL)(
−pD
(µD)2)
If pD = 0, then it must be true that, from the first of the first order conditions, H(x̂) = H(xL),
which would require that x̂ = xL, meaning only one firm would participate in the market. The
second option is impossible - both h(x̂) and h(xL) must be positive, the second term on the right
hand side must be positive if pD 6= 0, and the second term on the left hand side must be positive
or zero. Therefore, in order to have two firms in the market, it must be assumed that the
constraint must bind and µD = (1− α)µF .
Assuming that the constraint binds and that two firms participate in the market,
pD =H(x̂)−H(xL)
(1− α)h(x̂) + αh(xL)α(1− α)µF = α(1− α)µFΛ
The foreign firm solves:
maxpF
∫ b
x̂pFh(x)dx
0 = (1−H(x̂)) + pF (−h(x̂)1
µF − (1− α)µF)
pF =1−H(x̂)
h(x̂)αµF = αµFλ
The indifferent consumer can therefore be characterized as x̂ = λ− (1− α)Λ and the
low-type consumer can be characterized as xL = αΛ. The indifferent consumer is of a higher type
than the low-type consumer, so x̂ > xL and therefore λ > Λ. This also means that
H(x̂) > H(xL), so Λ > 0, and the market is not covered.
The demand for the foreign good is given by 1−H(x̂) and the demand for the domestic good
is given by H(x̂)−H(xL). The profit earned by the foreign firm is therefore πF = αµFλ(1−H(x̂))
and the profit earned by the domestic firm is πD = α(1− α)µFΛ(H(x̂)−H(xL)).
The consumer utility from the consumption of the foreign good is given by (using integration
82

by parts, as before):
CUF =
∫ b
x̂(xµF − pF )h(x)dx = µF [(1− α)(λ− Λ)(1−H(x̂)) +
∫ b
x̂(1−H(x))dx]
The consumer utility from the consumption of the domestic good is given by (using integration by
parts, as before):
CUD =
∫ x̂
xL
(xµD − pD)h(x)dx = (1− α)µF [(λ− Λ)H(x̂)−∫ x̂
xL
H(x)dx]
where the integral terms are the expected types of the consumers purchasing the good.
Comparative Statics
Gaussian elimination was used to solve for ∂x̂∂α , ∂xL
∂α , ∂λ∂α , and ∂Λ
∂α . The four equations used
were:
(1)∂x̂
∂α=∂λ
∂α+ Λ− (1− α)
∂Λ
∂α→ ∂x̂
∂α− ∂λ
∂α+ (1− α)
∂Λ
∂α= Λ
(2)∂xL∂α
= Λ + α∂Λ
∂α→ ∂xL
∂α− α∂Λ
∂α= Λ
(3)∂λ
∂α= A
∂x̂
∂α→ −A∂x̂
∂α+∂λ
∂α= 0
(4)∂Λ
∂α=
1
D2[N +B
∂x̂
∂α+ C
∂xL∂α
]→ −B ∂x̂∂α− C∂xL
∂α+D2∂Λ
∂α= N
where
A =H(x̂)h′(x̂)− (h(x̂))2 − 1
(h(x̂))2
D = (1− α)h(x̂) + αh(xL)
N = [H(x̂)−H(xL)][h(x̂)− h(xL)]
B = (1− α)((h(x̂))2 −H(x̂)h′(x̂)) + (1− α)H(xL)h′(x̂) + αh(x̂)h(xL)
C = α(H(x̂)h′(x̂)− (h(xL))2)− αH(x̂)h′(xL)− (1− α)h(x̂)h(xL)
83

Gaussian elimination yielded either A = A1−A or ∂x̂
∂α = ∂λ∂α = 0. Since A 6= 0, the latter must be
true. This gives:
∂x̂
∂α= 0
∂λ
∂α= 0
∂xL∂α
=Λ
1− α> 0
∂Λ
∂α=
Λ
1− α> 0
From here, it can be seen that the size of the demand for the foreign good does not change in
protection:
∂(1−H(x̂))
∂α= −h(x̂)
∂x̂
∂α= 0
and that the size of the demand for the domestic good is falling in protection:
∂(H(x̂)−H(xL))
∂α= h(x̂)
∂x̂
∂α− h(xL)
∂xL∂α
= −h(xL)Λ
1− α< 0
Both prices are rising in protection:
∂pF
∂α= µFλ+ αµF
∂λ
∂α= µFλ > 0
∂pD
∂α= (1− 2α)µΛ + α(1− α)µF
∂Λ
∂α= (1− α)µFΛ > 0
Foreign profit is, predictably, rising in protection, and the utility from the consumption of
the foreign good is falling. These two changes directly offset each other, as in the case of the
competitive domestic fringe:
∂πF
∂α= µF [(λ+ α
∂λ
∂α)(1−H(x̂))− αλh(x̂)
∂x̂
∂α] = µFλ(1−H(x̂)) > 0
∂CUF
∂α= µF [(1−H(x̂))(−(λ−Λ)+(1−α)(
∂λ
∂α− ∂Λ
∂α))+(1−α)(λ−Λ)(−h(x̂)
∂x̂
∂α)−(1−H(x̂))
∂x̂
∂α]
∂CUF
∂α= −µFλ(1−H(x̂)) < 0
84

Domestic profit is first increasing then decreasing in protection:
∂πD
∂α= α(1− α)µΛ(h(x̂)
∂x̂
∂α− h(xL)
∂xL∂α
) + (1− α)µFΛ(H(x̂)−H(xL))
∂πD
∂α= µFΛ[−αΛh(xL) + (1− α)(H(x̂)−H(xL))]
Intuitively, the utility from the consumption of the domestic good is falling in protection, as the
domestic price is rising, the quality of the domestic good is falling, and the demand for the
domestic good is falling. The impact on the utility from the consumption of the domestic good of
an increase in protection is given by:
∂CUD
∂α= µF [−((λ−Λ)H(x̂)−
∫ x̂
xL
H(x)dx)+(1−α)((∂λ
∂α−∂Λ
∂α)H(x̂)+(λ−Λ)h(x̂)
∂x̂
∂α−H(xL)(
∂x̂
∂α−∂xL∂α
))]
∂CUD
∂α= µF [−λH(x̂) + ΛH(xL) +
∫ x̂
xL
H(x)dx)] < 0
Since H(x̂) > H(xL) and λ > Λ, −λH(x̂) + ΛH(xL) < 0. By the intuition, therefore,
λH(x̂) > ΛH(xL) +∫ x̂xLH(x)dx.
The government’s optimal choice of protection is found by setting the following to zero:
∂G
∂α= ρ[
∂CUD
∂α+∂CUF
∂α+∂πD
∂α] + (1− ρ)[
∂πF
∂α]
∂G
∂α= ρµF [−λ+ΛH(xL)+
∫ x̂
xL
H(x)dx+Λ((1−α)(H(x̂)−H(xL))−αΛh(xL))]+(1−ρ)µFλ(1−H(x̂))
A.2 Application: Triangular Distribution
The PDF and CDF for the triangular distribution are:
h(x) =2
b2(1− c)x+
c
b
H(x) =1
b2(1− c)x2 +
c
bx
for which the support is [0, b]. The parameter c ∈ (1, 2] controls the slope, with c = 1 representing
a uniform distribution.
85

A.2.1 Competitive Domestic Fringe
Indifferent type, x̂, and its comparative statics:
x̂ = λ =1−H(x̂)
h(x̂)
x̂ =1− 1
b2(1− c)x̂2 − c
b x̂2b2
(1− c)x̂+ cb
x̂ =−bc± b
√c2 + 3− 3c
3(1− c)
On the domain of c, c ∈ (1, 2], the radical term is always positive. The radical term is maximized
at c = 2 and minimized at c = 32 . Since b is analogous to the highest-type consumer, it must be
the case that x̂ < b. Therefore, it is enough to test c = 32 and c = 2 to find the sign preceding the
radical term. For both c = 32 and c = 2, adding the radical term gave x̂ > b. Therefore, the
radical term must be subtracted. Therefore:
x̂ =b
3(c− 1)(c−
√c2 + 3− 3c)
To see how the type of the indifferent consumer changes with c, the same trick can be used.
∂x̂
∂c=∂λ
∂c=
b
3(c− 1)[c−√c2 + 3− 3c
1− c+ 1− 2c− 3
2√c2 + 3− 3c
]
At c = 32 , ∂x̂
∂c < 0. At c = 2, ∂x̂∂c < 0. As c increases from 1 to 2, ∂x̂
∂c first decreases then increases
but is always negative.
∂x̂
∂b> 0
Foreign and domestic demands, 1−H(x̂) and H(x̂), comparative statics:
∂(1−H(x̂))
∂c= −h(x̂)
∂x̂
∂c> 0
∂(1−H(x̂))
∂b= −h(x̂)
∂x̂
∂b< 0
∂H(x̂)
∂c= h(x̂)
∂x̂
∂c< 0
86

∂H(x̂)
∂b= h(x̂)
∂x̂
∂b> 0
Foreign and domestic prices, pF and pD, comparative statics:
∂pF
∂c= αµF
∂λ
∂c< 0
∂pF
∂b= αµF
∂λ
∂b> 0
pD = 0
Foreign and domestic profits, πF and πD, and comparative statics:
πF = αµF (1−H(x̂))
πF = αµFb(c−
√c2 + 3− 3c)
27(c− 1)2(−c2 + 6c− 6 + c
√c2 + 3− 3c)
∂πF
∂c< 0
∂πF
∂b> 0
πD = 0
Consumer utility from the consumption of the foreign and domestic goods, CUF and CUD,
comparative statics:
∂CUF
∂c= (1− α)µF [λ
∂(1−H(x̂))
∂c+ (1−H(x̂))
∂λ
∂c]− µF (1−H(x̂))
∂λ
∂c> 0
∂CUF
∂b< 0
∂CUD
∂c= (1− α)µF [λh(x̂)
∂x̂
∂c−H(x̂)
∂x̂
∂c+H(x̂)
∂λ
∂c] < 0
∂CUD
∂b> 0
87

The government objective function comparative statics:
∂G
∂c= −αµFρ(1−H(x̂))
∂x̂
∂c> 0
∂G
∂b= −αµFρ(1−H(x̂))
∂x̂
∂b< 0
∂2G
∂α∂c= −µFρ(1−H(x̂))
∂x̂
∂c> 0
∂2G
∂α∂b= −µFρ(1−H(x̂))
∂x̂
∂b< 0
A.3 Application: Weibull Distribution
The PDF and CDF for the Weibull distribution are:
h(x) =c
b(x
b)c−1 exp[−(
x
b)c]
H(x) = 1− exp[−(x
b)c]
for x ≥ 0. The parameter b ∈ (0,∞) controls the scale, and the parameter c ∈ (0,∞) controls the
shape. The PDF of the Weibull distribution is only log-concave for c ≥ 1; however, the CDF is
log-concave for all c, so the Weibull distribution can be used.
Since the estimate of c for most countries is below Euler’s constant, comparative statics will
assume that c is below Euler’s constant.
A.3.1 Competitive Domestic Fringe
Indifferent type, x̂, and its comparative statics:
x̂ = λ =1−H(x̂)
h(x̂)=
exp[−( x̂b )c]cb(x̂b )c−1 exp[−( x̂b )c]
=b
c(x̂
b)1−c
x̂ =bc
cx̂1−c → x̂ =
b
c1c
= λ
∂x̂
∂c= bc−
1c−2(ln c− 1) < 0 for c < e
88

∂x̂
∂b= (
1
c)
1c > 0
Foreign demand, 1−H(x̂), and its comparative statics:
1−H(x̂) = exp[−(x̂
b)c] = exp[−1
c]
∂(1−H(x̂))
∂c=
1
c2exp[−1
c] > 0
∂(1−H(x̂))
∂b= 0
Domestic demand, H(x̂), and its comparative statics:
H(x̂) = 1− exp[−(x̂
b)c] = − exp[−1
c]
∂H(x̂)
∂c= − 1
c2exp[−1
c] < 0
∂H(x̂)
∂b= 0
Foreign and domestic prices, pF and pD, and their comparative statics:
pF = αµFλ = αµF bc−frac1c
∂pF
∂c= αµF bc−
1c−2(ln c− 1) for c < e
∂pF
∂b= αµF c−
1c > 0
pD = 0
Foreign and domestic profits, πF and πD, and their comparative statics:
πF = αµFλ(1−H(x̂)) = αµF b(1
c)
1c exp[−1
c]
∂πF
∂c= αµF bc−
1c−2 exp[−1
c] ln c < 0 for c < e
∂πF
∂b= αµF (
1
c)
1c exp[−1
c] > 0
89

πD = 0
Utility from the consumption of the foreign good, CUF , and its comparative statics (t
represents the top type consumer):
CUF = µF [(1− α)λ(1−H(x̂)) +
∫ t
x̂(1−H(x))dx]
CUF = µF [(1− α)b(1
c)
1c exp[−1
c] +
∫ t
x̂exp[−(
x
b)c]dx]
∂CUF
∂c= µF bc−
1c−2 exp[−1
c](1− α ln c) > 0 for c < e
∂CUF
∂b= −αµF (
1
c)
1c exp[−1
c] < 0
Utility from the consumption of the domestic good, CUD, and its comparative statics:
CUD = (1− α)µF [λH(x̂)−∫ x̂
0H(x)dx]
CUD = (1− α)µF [b(1
c)
1c (1− exp[−1
c])−
∫ x̂
0(1− exp[−(
x
b)c])dx]
∂CUD
∂c= −(1− α)µF bc−
1c−2 exp[−1
c] < 0
∂CUD
∂b= 0
The impact on the government objective function of an increase in c (assuming c < e)
depends on institutions:
∂G
∂c= αµF bc−
1c−2 exp[−1
c](ρ(1− ln c) + (1− ρ) ln c)
For ρ1−ρ >
− ln c1−ln c , the government objective function is increasing in c, and vice versa. The
optimal choice of protection follows a similar pattern: for ρ1−ρ >
− ln c1−ln c , the incentive to protect is
increasing in c, and vice versa.
The impact on the government objective function of an increase in b is similarly dependent
upon institutions, but the relationship is more straightforward as only the consumer utility from
90

the consumption of the foreign good and the foreign firm’s profits are impacted by b:
∂G
∂b= (1− 2ρ)αµF (
1
c)
1c exp[−1
c]
For ρ < 12 , the government objective function is increasing in b, and vice versa. That is, if the
government cares more for the foreign actor than for the domestic actors, its objective function
rises in b. The optimal choice of protection follows a similar pattern: if the government cares
more for the foreign actor than the domestic actors, ρ < 12 , then the incentive to protect is
increasing in b.
A.3.2 Single Domestic Firm
Solving for x̂, xL, λ(x̂), and Λ(x̂, x) explicitly is not possible; however, solving for the
comparative statics is. To solve for the impacts of a change in c, the following equations were used:
(1)∂x̂
∂c− ∂λ
∂c+ (1− α)
∂Λ
∂c= 0
(2)∂xL∂c− α∂Λ
∂c= 0
(3)1
c(x̂
b)1−c ln(
x̂
b)∂x̂
∂c+∂λ
∂c= − b
c2(x̂
b)1−c
(4) (NA−DE)∂x̂
∂c+ (NB +DF )
∂xL∂c
+D2∂Λ
∂c= −1
cND
In which:
N = x̂xL(exp[(x̂
b)c]− exp[(
xLb
)c])
D = c((1− α)(x̂
b)cxL exp[(
xLb
)c] + α(xLb
)cx̂ exp[(x̂
b)c])
A = (1− α)(xLb
)(x̂
b)c exp[(
xLb
)c] ln(x̂
b) + α(
xLb
)c exp[(x̂
b)c](1 + (
x̂
b)c+1 ln(
x̂
b))
B = α(x̂
b)(xLb
)c exp[(x̂
b)c] ln(
xLb
) + (1− α)(x̂
b)c exp[(
xLb
)c](1 + (xLb
)c+1 ln(xLb
))
E = xL(exp[(x̂
b)c](1 + (
x̂
b)c+1 ln(
x̂
b))− exp[(
xLb
)c])
F = x̂(exp[(xLb
)c](1 + (xLb
)c+1 ln(xLb
))− exp[(x̂
b)c])
91

In the case of a single domestic firm, x̂ = λ− (1− α)Λ, therefore, since Λ > 0, x̂ < λ = bc(x̂b )1−c.
This gives an upper bound for x̂: x̂ < b(1c )
1c . If c < 1, there is a mass of consumers at x = 0.
Therefore, it is assumed that c ∈ (1, e]. This assumption is supported by the data, as all but a
very few observations have a shape parameter in this range. Assuming c ∈ (1, e] leads to
xL < x̂ < b. This makes it possible to sign the partial derivatives with respect to c:
∂x̂
∂c< 0,
∂xL∂c
< 0,∂λ
∂c< 0,
∂Λ
∂c< 0
The same process was used to solve for the impacts of a change in b:
(1)∂x̂
∂b− ∂λ
∂b+ (1− α)
∂Λ
∂b= 0
(2)∂xL∂b− α∂Λ
∂b= 0
(3) − 1− cc
(x̂
b)−c
∂x̂
∂b+∂λ
∂b= (
x̂
b)1−c
(4) (NJ −DE)∂x̂
∂b+ (NK +DF )
∂xL∂b
+D2∂Λ
∂c= −DG−NI
In which:
N = x̂xL(exp[(x̂
b)c]− exp[(
xLb
)c])
D = c((1− α)(x̂
b)cxL exp[(
xLb
)c] + α(xLb
)cx̂ exp[(x̂
b)c])
E = xL(exp[(x̂
b)c](1 + c(
x̂
b)c)− exp[(
xLb
)c])
F = x̂(exp[(xLb
)c](c(x̂
b)c − 1) + exp[(
x̂
b)c])
G =c
bx̂xL((
x̂
b)c − (
xLb
)c)
I = −c2
b[(1− α)(
x̂
b)cxL exp[(
xLb
)c](1 + (xLb
)c) + α(xLb
)cx̂ exp[(x̂
b)c](1 + (
x̂
b)c)]
J = c[(1− α)c(xLx̂
)(x̂
b)c exp[(
xLb
)c] + α(xLb
)c exp[(x̂
b)c](1 + (
x̂
b)c)]
K = c[(1− α)(x̂
b)c exp[(
xLb
)c](1 + (xLb
)c) + αc(x̂
xL)(xLb
)c exp[(x̂
b)c]]
92
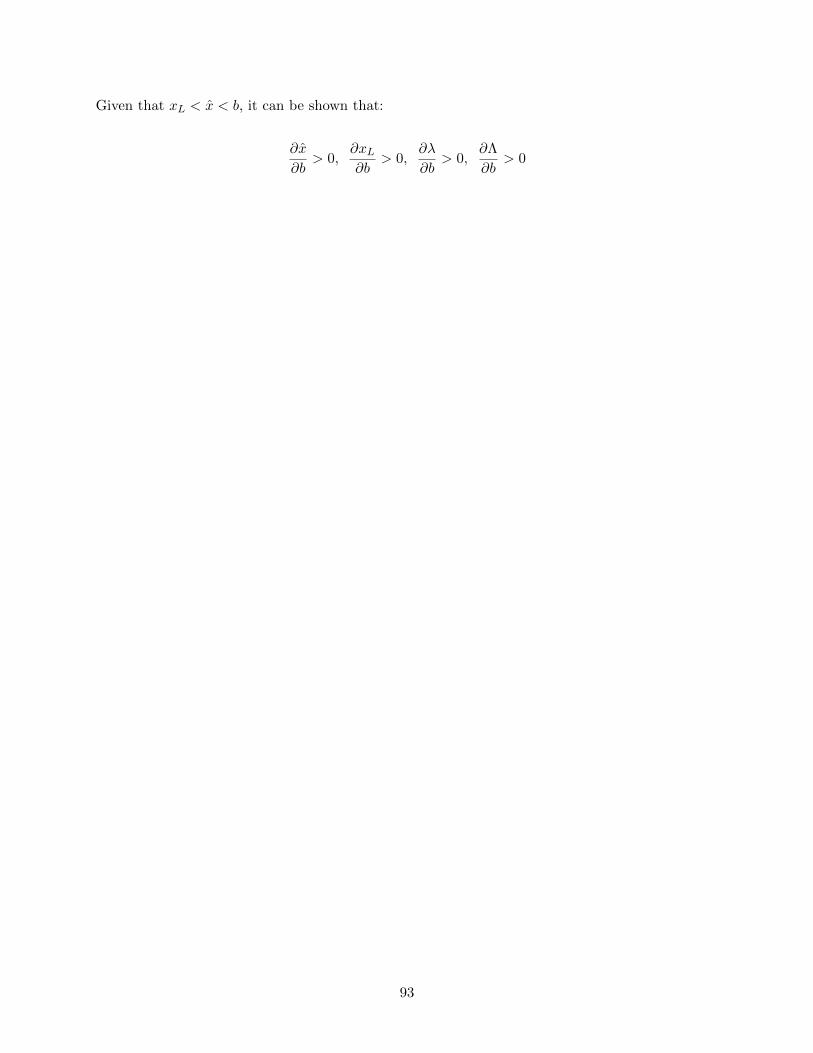
Given that xL < x̂ < b, it can be shown that:
∂x̂
∂b> 0,
∂xL∂b
> 0,∂λ
∂b> 0,
∂Λ
∂b> 0
93

APPENDIX B: ADDITIONAL TABLES
Table B.1: Regressions on Formal and De Facto IPR Protection
(1) (2) (3) (4) (5) (6)GP Index GP Index GP Index WEF IPR WEF IPR WEF IPR
Log GDP per capita 0.374∗∗∗ 0.372∗∗∗ 0.330∗∗∗ 0.550∗∗∗ 0.553∗∗∗ 0.768∗∗∗
(0.0426) (0.0364) (0.0472) (0.0530) (0.0536) (0.0671)
Gini Coefficient -2.133∗∗∗ -1.526∗∗ -0.445 -0.654 -0.724 -1.134(0.627) (0.516) (0.597) (0.804) (0.812) (1.113)
Political Constraints 0.332 0.147 -0.145 0.281 0.297 0.0271(0.215) (0.182) (0.169) (0.248) (0.247) (0.216)
Constant 0.552 -0.550 -0.409 -0.981 -0.750 -1.906∗∗
(0.496) (0.411) (0.507) (0.575) (0.590) (0.657)
Year FE No Yes Yes No Yes Yes
Region FE No No Yes No No Yes
Observations 380 380 380 718 718 718Adjusted R2 0.461 0.699 0.753 0.592 0.594 0.694
Standard errors in parentheses∗ p < 0.05, ∗∗ p < 0.01, ∗∗∗ p < 0.001
94

Table B.2: Regressions on Formal and De Facto IPR Protection
(1) (2) (3) (4) (5) (6)GP Index GP Index GP Index WEF IPR WEF IPR WEF IPR
Log GDP per capita 0.374∗∗∗ 0.372∗∗∗ 0.330∗∗∗ 0.550∗∗∗ 0.553∗∗∗ 0.768∗∗∗
(0.0426) (0.0364) (0.0472) (0.0530) (0.0536) (0.0671)
Gini Coefficient -2.133∗∗∗ -1.526∗∗ -0.445 -0.654 -0.724 -1.134(0.627) (0.516) (0.597) (0.804) (0.812) (1.113)
Political Constraints 0.332 0.147 -0.145 0.281 0.297 0.0271(0.215) (0.182) (0.169) (0.248) (0.247) (0.216)
Constant 0.552 -0.550 -0.409 -0.981 -0.750 -1.906∗∗
(0.496) (0.411) (0.507) (0.575) (0.590) (0.657)
Year FE No Yes Yes No Yes Yes
Region FE No No Yes No No Yes
Observations 380 380 380 718 718 718Adjusted R2 0.461 0.699 0.753 0.592 0.594 0.694
Standard errors in parentheses∗ p < 0.05, ∗∗ p < 0.01, ∗∗∗ p < 0.001
Table B.3: Regressions on Formal IPR Protection in Developing Economies
(1) (2) (3) (4)GP Index GP Index GP Index GP Index
Log GDP per Capita 0.302∗∗ 0.238∗ -0.878∗ 0.188∗
(0.111) (0.102) (0.379) (0.0865)
Gini Coefficient -1.917∗ -1.122 -0.00657 -0.369(0.907) (0.782) (1.348) (0.870)
Polity Score 0.0326∗ 0.0146 -0.0202 0.00231(0.0135) (0.0120) (0.0129) (0.0130)
Constant 0.939 -0.00312 8.048∗ 0.251(1.020) (1.026) (3.163) (0.800)
Year FE No Yes No Yes
Region FE No No No YesCountry FE No No Yes No
Observations 221 221 221 221Adjusted R2 0.129 0.543 0.717 0.609
Standard errors in parentheses∗ p < 0.05, ∗∗ p < 0.01, ∗∗∗ p < 0.001
95

Table B.4: Regressions on De Facto IPR Protection in Developing Economies
(1) (2) (3) (4)WEF IPR WEF IPR WEF IPR WEF IPR
Log GDP per Capita 0.284∗∗∗ 0.281∗∗∗ 1.266∗∗ 0.374∗∗∗
(0.0769) (0.0791) (0.394) (0.0933)
Gini Coefficient 1.852∗ 1.855∗ 1.896 2.809∗
(0.702) (0.717) (1.922) (1.133)
Polity Score -0.0289∗ -0.0293∗ -0.0238 -0.0146(0.0116) (0.0116) (0.0244) (0.0119)
Constant 0.209 0.292 -7.891∗ -0.607(0.683) (0.710) (3.260) (0.848)
Year FE No Yes No Yes
Region FE No No No YesCountry FE No No Yes No
Observations 405 405 405 405Adjusted R2 0.183 0.210 0.325 0.350
Standard errors in parentheses∗ p < 0.05, ∗∗ p < 0.01, ∗∗∗ p < 0.001
96

Table B.5: Regressions on De Facto IPR Protection in Developing Economies
(1) (2) (3) (4) (5) (6)WEF IPR WEF IPR WEF IPR WEF IPR WEF IPR WEF IPR
Log GDP per Capita 0.281∗∗∗ 0.330∗∗∗ 0.191∗ 0.266∗∗ 0.135 0.193(0.0791) (0.0909) (0.0747) (0.0923) (0.0700) (0.0976)
Gini Coefficient 1.855∗ 0.827 1.173 0.459 1.084 0.742(0.717) (0.799) (0.714) (0.817) (0.644) (0.770)
Polity Score -0.0293∗ -0.0224∗ -0.00530(0.0116) (0.0101) (0.00970)
Consumer Tax -1.191∗∗ -0.925∗ -0.711(0.438) (0.392) (0.385)
Local Competition 0.437∗∗∗ 0.396∗∗
(0.103) (0.130)
Market Dominance 0.595∗∗∗ 0.497∗∗∗
(0.0945) (0.106)
Constant 0.292 0.812 -0.818 -0.589 -0.419 -0.0390(0.710) (0.810) (0.715) (0.940) (0.611) (0.817)
Year FE Yes Yes Yes Yes Yes Yes
Observations 405 300 405 300 405 300Adjusted R2 0.210 0.247 0.321 0.328 0.438 0.421
Standard errors in parentheses∗ p < 0.05, ∗∗ p < 0.01, ∗∗∗ p < 0.001
97

Tab
leB
.6:
Lis
tof
Incl
ud
edC
ountr
ies
Both
Form
al
an
dD
eF
act
oM
easu
res
Form
al
Mea
sure
On
lyD
eF
act
oM
easu
reO
nly
1.
Alg
eria
46.
Iran
91.
Spain
1.
Cen
tral
Afr
ican
Rep
ub
lic
1.
Alb
an
ia2.
An
gola
47.
Irel
an
d92.
Sri
Lan
ka
2.
Con
go,
Rep
.2.
Arm
enia
3.
Arg
enti
na
48.
Isra
el93.
Sw
azi
lan
d3.
Fij
i3.
Aze
rbaij
an
4.
Au
stra
lia
49.
Italy
94.
Sw
eden
4.
Gre
nad
a4.
Bah
rain
5.
Au
stri
a50.
Jam
aic
a95.
Sw
itze
rlan
d5.
Iraq
5.
Barb
ad
os
6.
Ban
gla
des
h51.
Jap
an
96.
Syri
a6.
Ivory
Coast
6.
Bel
ize
7.
Bel
giu
m52.
Jord
an
97.
Taiw
an
7.
Nig
er7.
Bhu
tan
8.
Ben
in53.
Ken
ya
98.
Tan
zan
ia8.
Pap
ua
New
Gu
inea
8.
Bosn
iaan
dH
erze
govin
a9.
Bolivia
54.
Lib
eria
99.
Th
ailan
d9.
Som
alia
9.
Bru
nei
Daru
ssala
m10.
Bots
wan
a55.
Lit
hu
an
ia100.
Tri
nid
ad
an
dT
ob
ago
10.
Su
dan
10.
Cam
bod
ia11.
Bra
zil
56.
Lu
xem
bou
rg101.
Tu
nis
ia11.
Togo
11.
Cap
eV
erd
e12.
Bu
lgari
a57.
Mad
agasc
ar
102.
Tu
rkey
12.
US
SR
12.
Cote
d’I
voir
e13.
Bu
rkin
aF
aso
58.
Mala
wi
103.
Ugan
da
13.
Cro
ati
a14.
Bu
run
di
59.
Mala
ysi
a104.
Ukra
ine
14.
Tim
or-
Les
te15.
Cam
eroon
60.
Mali
105.
Un
ited
Kin
gd
om
15.
Est
on
ia16.
Can
ad
a61.
Malt
a106.
Un
ited
Sta
tes
16.
Gam
bia
17.
Ch
ad
62.
Mau
rita
nia
107.
Uru
gu
ay
17.
Geo
rgia
18.
Ch
ile
63.
Mau
riti
us
108.
Ven
ezu
ela
18.
Gu
inea
19.
Ch
ina
64.
Mex
ico
109.
Vie
tnam
19.
Kaza
kh
stan
20.
Colo
mb
ia65.
Moro
cco
110.
Zam
bia
20.
Kuw
ait
21.
Con
go,
Dem
.R
ep.
66.
Moza
mb
iqu
e111.
Zim
babw
e21.
Kyrg
yzs
tan
22.
Cost
aR
ica
67.
Myan
mar
22.
Laos
23.
Cyp
rus
68.
Nep
al
23.
Latv
ia24.
Cze
chR
epu
blic
69.
Net
her
lan
ds
24.
Leb
an
on
25.
Den
mark
70.
New
Zea
lan
d25.
Les
oth
o26.
Dom
inic
an
Rep
ub
lic
71.
Nic
ara
gu
a26.
Lib
ya
27.
Ecu
ad
or
72.
Nig
eria
27.
Mace
don
ia28.
Egyp
t73.
Norw
ay
28.
Mold
ova
29.
El
Salv
ad
or
74.
Pakis
tan
29.
Mon
golia
30.
Eth
iop
ia75.
Pan
am
a30.
Monte
neg
ro31.
Fin
lan
d76.
Para
gu
ay
31.
Nam
ibia
32.
Fra
nce
77.
Per
u32.
Om
an
33.
Gab
on
78.
Ph
ilip
pin
es33.
Pu
erto
Ric
o34.
Ger
many
79.
Pola
nd
34.
Qata
r35.
Gh
an
a80.
Port
ugal
35.
Ser
bia
36.
Gre
ece
81.
Rom
an
ia36.
Sey
chel
les
37.
Gu
ate
mala
82.
Ru
ssia
37.
Slo
ven
ia38.
Gu
yan
a83.
Rw
an
da
38.
Su
rin
am
e39.
Hait
i84.
Sau
di
Ara
bia
39.
Ta
jikis
tan
40.
Hon
du
ras
84.
Sen
egal
40.
Un
ited
Ara
bE
mir
ate
s41.
Hon
gK
on
g86.
Sie
rra
Leo
ne
41.
Yem
en42.
Hu
ngary
87.
Sin
gap
ore
43.
Icel
an
d88.
Slo
vak
Rep
ub
lic
44.
Ind
ia89.
Sou
thA
fric
a45.
Ind
on
esia
90.
Sou
thK
ore
a
98

Table B.7: Deviation of De Facto IPR Protection from Formal IPR Protection
Country GPI WEF IPR Deviation Gini Decentralization Min γ Max γ γ out of bounds?Australia 4.33 5.855 -0.02957 0.35285 0.367504 -0.31826 0.049245Austria 4.33 5.9275 -0.01921 0.301817 0.149384 -0.12937 0.020017Belgium 4.67 5.4575 -0.15436 0.2899 0.309464 -0.28904 0.020425Bolivia 2.915 1.8925 -0.31264 0.54372 0.694774 -0.40505 0.289721Canada 4.54 5.5675 -0.11264 0.3379 0.375886 -0.3413 0.034581Chile 4.58 3.76 -0.37886 0.51895 0.480421 -0.44007 0.040355Costa Rica 3.405 3.6525 -0.15921 0.4913 0.414648 -0.28238 0.132273Cyprus 3.31 4.535 -0.01414 0.312967 0.24868 -0.16463 0.084054Czech Republic 4.33 3.9125 -0.30707 0.26465 0.481861 -0.41729 0.064569Denmark 4.67 6.17 -0.05257 0.2777 0.376189 -0.35136 0.024828Finland 4.67 6.1975 -0.04864 0.27835 0.464347 -0.4337 0.030647France 4.67 5.89 -0.09257 0.31868 0.434165 -0.40551 0.028655Germany 4.67 6.1675 -0.05293 0.31824 0.384966 -0.35956 0.025408Iceland 3.78 5.82 0.075429 0.293783 0.725524 -0.5485 0.177028Israel 3.96 4.72 -0.11771 0.4194 0.45958 -0.36399 0.095593Italy 4.67 4.195 -0.33471 0.338883 0.4172 -0.38967 0.027535Jamaica 3.36 3.53 -0.16771 1 -0.672 0.328Japan 4.67 5.58 -0.13686 0.3211 0.482486 -0.45064 0.031844Jordan 3.2 4.52 0.005714 0.35439 -0.22681 0.12758Luxembourg 4.14 5.6675 -0.01836 0.313983 0.31514 -0.26094 0.054204Mauritius 2.57 4.0525 0.064929 0.3565 0.246437 -0.12667 0.119768Netherlands 4.67 5.97 -0.08114 0.296683 0.088169 -0.08235 0.005819New Zealand 3.68 5.8075 0.093643 0.542882 -0.39956 0.143321Norway 4.355 5.6775 -0.05993 0.278367 0.424119 -0.36941 0.054711Portugal 4.33 4.875 -0.16957 0.367767 0.329672 -0.2855 0.044176South Africa 3.815 5.205 -0.01943 0.639 0.161494 -0.12322 0.038274South Korea 4.33 4.7675 -0.18493 0.295967 -0.25631 0.03966Spain 4.33 4.6325 -0.20421 0.341683 0.469321 -0.40643 0.062889Sweden 4.54 5.99 -0.05229 0.2684 0.596942 -0.54202 0.054919Switzerland 4.28 6.23 0.034 0.335275 0.58598 -0.5016 0.084381Thailand 2.86 3.8375 -0.02379 0.40204 0.322829 -0.18466 0.138171Tunisia 3.25 4.3925 -0.0225 0.3677 0.430105 -0.27957 0.150537United Kingdom 4.54 5.7 -0.09371 0.348633 0.13037 -0.11838 0.011994Zambia 2.065 3.0475 0.022357 0.5512 0.385519 -0.15922 0.2263Brazil 3.43 3.2525 -0.22136 0.55208 0.228507 -0.15676 0.071751 -0.0646Bulgaria 3.88 2.7275 -0.38636 0.33382 0.109909 -0.08529 0.02462 -0.30107China 4.555 3.64 -0.391 0.4283 0.344922 -0.31422 0.030698 -0.07678Colombia 3.43 3.3825 -0.20279 0.55625 0.295333 -0.2026 0.092735 -0.00019El Salvador 3.56 3.13 -0.26486 0.45945 0.223142 -0.15888 0.064265 -0.10598Greece 4.47 4.1475 -0.3015 0.346067 0.202887 -0.18138 0.021506 -0.12012Honduras 2.995 3.1625 -0.14721 0.5563 0.22561 -0.13514 0.09047 -0.01207Hungary 4.33 4.1925 -0.26707 0.292183 0.290627 -0.25168 0.038944 -0.01539Indonesia 2.77 3.235 -0.09186 0.124874 -0.06918 0.055694 -0.02268Ireland 4.67 5.545 -0.14186 0.324167 0.110823 -0.10351 0.007314 -0.03835Kenya 3.22 3.0325 -0.21079 0.4851 0.320746 -0.20656 0.114185 -0.00423Lithuania 3.88 3.6825 -0.24993 0.352067 0.046887 -0.03638 0.010503 -0.21354Malta 3.58 4.27 -0.106 0 0 0 -0.106Morocco 3.45 3.45 -0.19714 0.4072 0.269077 -0.18566 0.083414 -0.01148Paraguay 2.89 2.1625 -0.26907 0.51605 0.411253 -0.2377 0.173549 -0.03137Peru 3.34 2.5925 -0.29764 0.495967 0.09103 -0.06081 0.030222 -0.23683Poland 3.94 3.51 -0.28657 0.338767 0.320622 -0.25265 0.067972 -0.03392Romania 4 3.3175 -0.32607 0.329933 0.111855 -0.08948 0.022371 -0.23659Russia 3.68 2.6625 -0.35564 0.41215 0.249613 -0.18371 0.065898 -0.17193Slovak Republic 4.305 3.78 -0.321 0.268667 0.108494 -0.09341 0.015081 -0.22759Turkey 4.355 3.09 -0.42957 0.3958 0.140869 -0.1227 0.018172 -0.30687Uganda 3.1 2.615 -0.24643 0.4357 0.03404 -0.0211 0.012935 -0.22532Ukraine 3.78 2.6725 -0.37421 0.271 0.440445 -0.33298 0.107468 -0.04124
99

Tab
leB
.8:
Sel
ecte
dJor
dan
ian
IPR
Pro
tect
ion
Dat
a
100
REFERENCES
Abdel-Latif, A. (2014a). Egypt and Tunisia Underscore the Importance of IP. World IntellectualProperty Organization. Accessed April 19, 2018: www.wipo.int/wipomagazine/en/2014/04/article 0008.html.
Abdel-Latif, A. (2014b). Egypt and Tunisia’s New Constitutions Recognize the Importance of theKnowledge Economy and Intellectual Property Rights. Accessed April 19, 2018:blogs.worldbank.org/arabvoices/egypt-and-tunisias-new-constitutions-recognize-importance-knowledge-economy.
Acemoglu, D., Aghion, P., and Zilibotti, F. (2006). Distance to Frontier, Selection, and EconomicGrowth. Journal of the European Economic Association, 4(1):37–74.
Acemoglu, D., Johnson, S., Robinson, J., and Yared, P. (2008). Income and Democracy.American Economic Review, 98(3).
Acemoglu, D., Johnson, S., and Robinson, J. A. (2001). The Colonial Origins of ComparativeDevelopment: An Empirical Investigation. American Economic Review, 91(5):1369–1401.
Al-Arashi, F. (2012). Study Focuses on Need of Intellectual Property Rights in Yemen. NationalYemen. Accessed April 23, 2018: nationalyemen.com/2012/06/16/study-focuses-on-need-of-intellectual-property-rights-in-yemen/.
Al-Dajani, E. M. (2007). Post-Saddam Restructuring of Intellectual Property Rights in Iraqthrough a Case Study of Current Intellectual Property Practices in Lebanon, Egypt, andJordan. The John Marshall Review of Intellectual Property Law, 6:250–271.
Alesina, A. and Rodrik, D. (1994). Distributive Politics and Economic Growth. Quarterly Journalof Economics, 109(2):465–490.
Aloui, O. (2009). Intellectual Property Rights. In Hufbauer, G. C. and Brunel, C., editors,Capitalizing on the Morocco-US Free Trade Agreement: A Road Map for Success, chapter 7,pages 146–161. Peterson Institute for International Economics.
The American Chamber of Commerce in Jordan and The Jordanian Intellectual PropertyAssociation (2009). Progress of Intellectual Property Rights Legislation and Enforcement inJordan vis-a-vis the Special 301 Report for 2009. US Agency for International Development.
Amwal Invest (2010). Pharmaceutical Sector.
Balloch, H., Murphy, P., and Maag, D. (2015). Protecting IP Rights in Sanctioned Countries:Iran and Syria. Accessed April 20, 2018:www.clydeco.com/insight/article/protecting-ip-rights-in-sanctioned-countries-iran-and-syria.
Bandourian, R., McDonald, J. B., and Turley, R. S. (2003). A Comparison of Parametric Modelsof Income Distribution cross Countries and over Time. Estadistica, 55:135–152.
Bell, J. (2010). Audit of USAID/Jordan’s Sustainable Achievement of Business Expansion andQuality Project. Technical report, Office of the Inspector General, USAID.
101

Besley, T. and Coate, S. (2003). Centralized versus Decentralized Provision of Local PublicGoods: A Political Economy Approach. Journal of Public Economics, 87:2611–2637.
Besley, T. and Persson, T. (2011). The Logic of Political Violence. Quarterly Journal ofEconomics.
Blanchard, O. and Shleifer, A. (2001). Federalism with and without Political Centralization:China versus Russia. IMF Staff Papers, 48:171–179.
Bonhomme, S. and Manresa, E. (2015). Grouped Patterns of Heterogeneity in Panel Data.Econometrica.
Braga, C. (1989). The Economics of Intellectual Property Rights and the GATT: A View fromthe South. Vanderbilt Journal of Transnational Law, 22:243–264.
Bureau of Economic, Energy, and Business Affairs, US Department of State (2011). 2011Investment Climate Statement - Syria. Accessed April 20, 2018:www.state.gov/e/eb/rls/othr/ics/2011/157366.htm.
Bureau of Economic and Business Affairs, US Department of State (2012). 2012 InvestmentClimate Statement - Yemen. Accessed April 23, 2018:https://www.state.gov/e/eb/rls/othr/ics/2012/191265.htm.
Central Intelligence Agency. The World Factbook: Jordan. Accessed April 19, 2018:www.cia.gov/library/publications/the-world-factbook/geos/jo.html.
Chen, T.-J., Chen, H., and Ku, Y.-H. (2004). Foreign Direct Investment and Local Linkages.Journal of International Business Studies, 35:320–333.
Chen, Y. and Puttitanun, T. (2005). Intellectual Property Rights and Innovation in DevelopingCountries. Journal of Development Economics, 78:474–493.
Coalition Provisional Authority of Iraq. Coalition Provisional Authority Order Number 81:Patent, Industrial Design, Undisclosed Information, Integrated Circuits and Plant VarietyLaw. Accessed October 10, 2014: www.iraqcoalition.org/regulations/ Orders.
Consultation and Research Institute for the Arab Center for the Development of the Rule of Lawand Integrity. MENA Commercial Law Strengthening Project: Intellectual Property Rightsin Lebanon. October 2009. Accessed April 18, 2018:www.arabruleoflaw.org/compendium/Files/LEB/MENA-CLS-SurveyLebanon En.pdf.
Cruz, C., Keefer, P., and Scartascini, C. (2016). ”Database of Political Institutions Codebook,2015 Update (DPI2015).” Inter-American Development Bank. Updated version of Beck, T.,Clarke, G., Groff, A., Keefer, P., and Walsh, P. (2001). ”New Tools in Comparative PoliticalEconomy: The Database of Political Institutions.” 15.1:165-176 (September). World BankEconomic Review.
Easterly, W. (2007). Inequality Does Cause Underdevelopment: Insights from a New Instrument.Journal of Development Economics, 84:755–776.
102

The European Commission (2016). The EU Proposal on Intellectual Property Rights - Factsheet.trade.ec.europa.eu/doclib/docs/2016/april/tradoc 154508.pdf.
Gabszewicz, J. J. and Thisse, J. (1979). Price Competition, Quality, and Income Disparities.Journal of Economic Theory, 20:340–359.
Ginarte, J. and Park, W. (1997). Determinants of Patent Rights: A Cross-National Study.Research Policy, 26:283–301.
Griffiths, W. E., Chotikapanich, D., and Rao, D. P. (2005). Averaging Income Distributions.Bulletin of Economic Research, 57:347–367.
Grossman, G. M. and Helpman, E. Protection for Sale. The American Economic Review,84(4):833–850.
Hellmann, T. and Thiele, V. (2011). Incentives and Innovation: A Multitasking Approach.American Economic Journal: Microeconomics, 3:78–128.
Helpman, E. (1992). Innovation, Imitation, and Intellectual Property Rights. Technical Report4081.
Hogstrom, J. (2013). Classification and Rating of Democracy: A Comparison. Taiwan Journal ofDemocracy, 9(2):33–54.
Hooghe, L. and Marks, G. (2012). Beyond Federalism: Estimating and Explaining the TerritorialStructure of Government. Publius: The Journal of Federalism.
International Monetary Fund. Government Finance Statistics. Retrieved from:http://data.imf.org.
Jawad, S. (2013). The Iraqi Constitution: Structural Flaws and Political Implications. LSEMiddle East Centre Paper Series.
Kuran, T. (2011). The Long Divergence. Princeton University Press.
Kwan, Y. and Lai, E. (2003). Intellectual Property Rights Protection and Endogenous EconomicGrowth. Journal of Economic Dynamics and Control, 27:853–873.
Lackert, C. W. (1995). Intellectual Property Rights in Jordan - Final Report. US Agency forInternational Development.
Lai, E. (1998). International Intellectual Property Rights Protection and the Rate of ProductInnovation. Journal of Development Economics, 55:133–153.
Lerner, J. (2009). The Empirical Impact of Intellectual Property Rights on Innovation: Puzzlesand Clues. American Economic Review: Papers and Proceedings, 99(2):343–348.
Lewis, J. A. (2008). Intellectual Property Protection: Promoting Innovation in a GlobalInformation Economy. CSIS Technology and Public Policy Program.
Markusen, J. (2001). Contracts, Intellectual Property Rights, and Multinational Investment in
103
Developing Countries. Journal of International Economics, 53:189–204.
Mitra, D., Thomakos, D. D., and Ulubasoglu, M. A. (2002). Protection for Sale in a DevelopingCountry: Democracy vs. Dictatorship. The Review of Economics and Statistics,84(3):497–508.
Mokyr, J. (2009). Intellectual Property Rights, the Industrial Revolution, and the Beginnings ofModern Economic Growth. American Economic Review: Papers and Proceedings, 99:349–355.
Moser, P. (2013). Patents and Innovations: Evidence from Economic History. Journal ofEconomic Perspectives, 27(1):23–44.
National Legislative Bodies. Jordanian National Charter of 1991. June 1991. Available at:http://www.unhcr.org/refworld/docid/3ae6b53b4.
Nesheiwat, F. K. (2010). The Adoption of Intellectual Property Standards beyond TRIPS - Is It aMisguided Legal and Economic Obsession by Developing Countries. Loyola of Los AngelesInternational and Comparative Law Review.
Nesheiwat, F. K. (2012). The Compliance with Intellectual Property Laws and Their Enforcementin Jordan - A Post-WTO Review and Analysis. PhD Thesis, Durham University.
Nesheiwat, F. K. and Adcock, M. (2014). A Socio-Legal Approach to Gauging Attitudes towardsIntellectual Property Rights. Wake Forest Journal of Business and Intellectual Property Law,14(2):290–313.
Nugent, J. and Sanchez, N. (1993). Tribes, Chiefs, and Transhumance: A ComparativeInstitutional Analysis. Economic Development and Cultural Change, pages 87–113.
Nugent, J. and Sanchez, N. (1999). The Local Variability of Rainfall and Tribal Institutions: TheCase of Sudan. Journal of Economic Behavior, 39:263–291.
Parello, C. (2008). A North-South Model of Intellectual Property Rights Protection and SkillAccumulation. Journal of Development Economics, 85:253–281.
Park, W. (2008). International Patent Protection: 1960 - 2005. Research Policy, 37:761–766.
Persson, T. and Tabellini, G. (1991). Is Inequality Harmful for Growth? Theory and Evidence.National Bureau of Economic Research Working Paper 3599.
Pinkovskiy, M. and Sala-i-Martin, X. (2009). Parametric Estimations of the World Distribution ofIncome. National Bureau of Economic Research Working Paper 15433.
Posner, E., Spier, K., and Vermeule, A. (2009). Divide and Conquer. The Harvard John M. OlinDiscussion Paper Series, Paper No. 639.
Rodrik, D. and Arvind Subramanian, F. T. (2004). Institutions Rule: The Primacy ofInstitutions over Geography and Integration in Economic Development. Journal of EconomicGrowth, 9:131–165.
Romer, P. (2002). When Should We Use Intellectual Property Rights? AEA Papers and
104

Proceedings, 92(2):213–216.
Schneider, A. (2003). Decentralization: Conceptualization and Measurement. Studies inComparative International Development, 38(3):32–56.
Schreurs, M. A. (2008). From the Bottom up: Local and Subnational Climate Change Politics.The Journal of Environment and Development, 17(4):343–355.
Seabright, P. (1996). Accountability and Decentralisation in Government: An IncompleteContracts Model. European Economic Review, 40:61–89.
Sonin, K. (2003). Why the Rich may Favor Poor Protection of Property Rights. Journal ofComparative Economics, 31:715–731.
Tabbaa, T. (2007). Update on Compliance with Intellectual Property Rights in Jordan.USAID/Jordan Economic Opportunities Office.
Teorell, J., Dahlberg, S., Holmberg, S., Rothstein, B., Khomenko, A., and Svensson, R. (2017).The Quality of Government Standard Dataset, version Jan17. University of Gothenburg: TheQuality of Government Institute. Retrieved from: http://www.qog.pol.gu.sedoi:10.18157/QoGStdJan17.
United Nations Development Programme, United Nations Children’s Fund, and HashemiteKingdon of Jordan (2015). Socio-Economic Inequality in Jordan. www.undp-jordan.org.
United Nations Interregional Crime and Justice Research Institute (2014). The Protection ofIntellectual Property Rights in the Euromediterranean Area: Focus on the Agro-Food Sector.
US Department of Commerce. Egypt - Protection of Property Rights. July 27, 2017:https://www.export.gov/article?id=Egypt-Protection-of-Property-Rights.
US Department of Commerce. Lebanon - IPR. August 17, 2017:www.export.gov/article?id=Lebanon-Protecting-Intellectual-Property.
US Department of Commerce (2017). Tunisia - Protection of Property Rights. Accessed April 19,2018: www.export.gov/apex/article2?id=Tunisia-Protection-of-Property-Rights.
US-Egypt Business Council (2011). Intellectual Property Rights in Egypt. Accessed April 19,2018: https://www.usegyptcouncil.org/wp-content/uploads/2010/08/USEBC-Intellectual-Property-White-Paper-Oct-15.pdf.
US International Trade Administration (2015). Legal Guide to Investing in Iraq. Accessed April19, 2018: www.trade.gov/iraq/tg iqtf 003438.asp.
US International Trade Commission. US-Morocco Free Trade Agreement: PotentialEconomy-Wide and Selected Sectoral Effects. June 2004.
Wolff, H., Chong, H., and Auffhammer, M. Classification, Detection, and Consequences of DataError: Evidence from the Human Development Index.scholarships.sha.cornell.edu/articles/338.
105

The World Bank (2018). World Development Indicators. Retrieved from: www.knoema.com.
World Economic Forum (2018). The Global Competitiveness Report. Retrieved from:www.knoema.com.
World Trade Organization. Agreement on Trade-Related Aspects of Intellectual Property Rights.Accessed October 10, 2014: www.wto.org/english/tratop e/trips e/t agm0 2.htm.
World Trade Organization (2015). Trade Policy Review. Accessed April 19, 2018:www.wto.org/english/tratop e/tpr e/g325 e.pdf.
World Trade Organization. Trade Policy Review Summary. 2008. Accessed April 19, 2018:www.wto.org/english/tratop e/tpr e/s325 sum e.pdf.
World Trade Organization. WTO Country Profile: Jordan. Accessed April 19, 2018:stat.wto.org/CountryProfiles/JO e.htm.
Wyatt, C. (2004). USAID/AMIR Orogram Success Stories - Final Report. US Agency forInternational Development.
Zhao, M. (2006). Conducting Research and Development in Countries with Weak IntellectualProperty Rights Protection. Management Science, 52(8):1185–1199.
106