inclusive value chains - world bank value chain... · chemical and bacterologic ... slides produced...
TRANSCRIPT
Inclusive Value Chains
Labor Market Policy Course
May 14, 2013
Kwang Kim
Senior Consultant, Finance and Private Sector
Development

Agenda
• Why Value-Chains?
• Elements of a Value-Chain Analysis
• Country Examples
• Implications to Policy and Operations
• Q&A
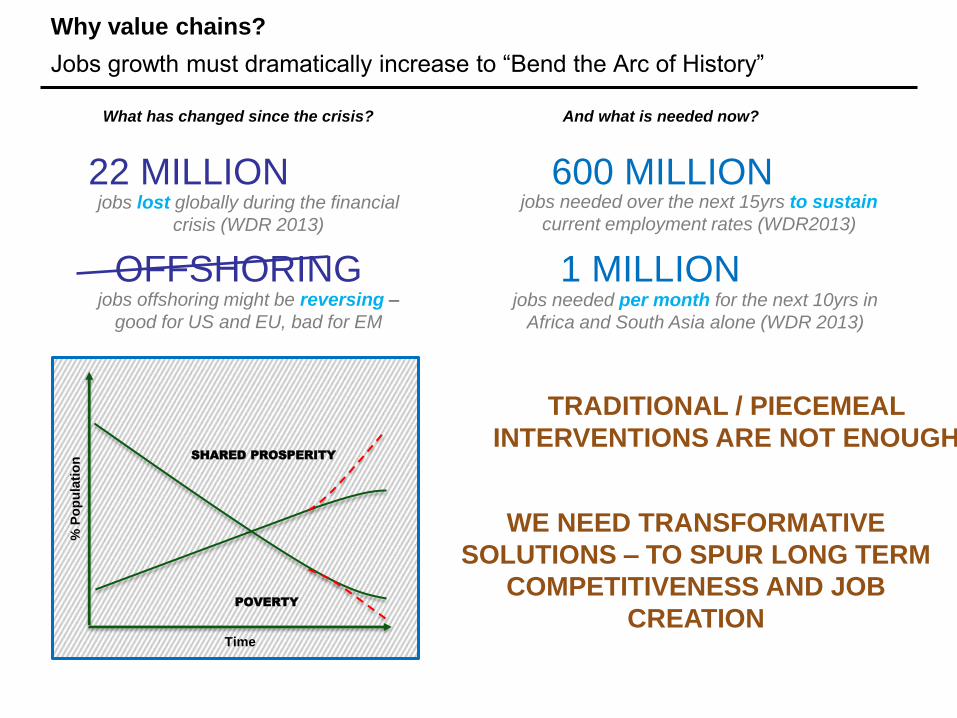
Why value chains?
Jobs growth must dramatically increase to “Bend the Arc of History”
600 MILLION jobs needed over the next 15yrs to sustain
current employment rates (WDR2013)
1 MILLION jobs needed per month for the next 10yrs in
Africa and South Asia alone (WDR 2013)
OFFSHORING jobs offshoring might be reversing –
good for US and EU, bad for EM
TRADITIONAL / PIECEMEAL
INTERVENTIONS ARE NOT ENOUGH
WE NEED TRANSFORMATIVE
SOLUTIONS – TO SPUR LONG TERM
COMPETITIVENESS AND JOB
CREATION
What has changed since the crisis? And what is needed now?
jobs lost globally during the financial
crisis (WDR 2013)
22 MILLION
% P
op
ula
tio
n
Time
SHARED PROSPERITY
POVERTY

Why value chains?
Value chains (and similar industry approaches) aims at filling a “missing middle”
Macro-stability, investment climate reforms and
innovation policies
Mentoring, networking and financing support to firms,
grass roots and entrepreneurs
INDUSTRY LEVEL
FIRM LEVEL
ECONOMY WIDE
Multi-sectoral interventions bringing together public
and private sectors to unlock value chains and clusters
“We found that we can deliver very fast when we concentrate on the sectors that count” (YB Senator Dato’ Sri Idris Jala, Minister in Prime Minister’s Office and CEO, PEMANDU, Government of Malaysia)

Why value chains?
Sector contribution to Kyrgyzstan’s GDP and Employment by Sector, 2000-2011
37.8% 32.3%
20.3%
27.0%
21.5%
28.3%
35.2% 46.3% 51.4%
0%
10%
20%
30%
40%
50%
60%
70%
80%
90%
100%
1 2 3
Services
Industry
Agriculture
49.6% 37.0% 34.0%
11.9%
18.7% 20.6%
38.4% 44.2% 45.3%
0%
10%
20%
30%
40%
50%
60%
70%
80%
90%
100%
1 2 3
Services
Industry
Agriculture
Sector
contribution to
value added (as
% of GDP)
Sector
contribution to
total
employment
2000-2003 2004-2007 2008-2011
2000-2003 2004-2007 2008 Source: World Bank WDI data
Employment has been
directed to sectors with lower
value added to growth.
Agriculture contributed to
20% of total growth in 2008-
2011, while employing 34%
of the total labor force in
2008.
Kyrgyzstan policy options:
(1) either shift jobs to other
growth sectors, or (2)
upgrade its agriculture sector
towards higher growth
activities (e.g. agribusiness)
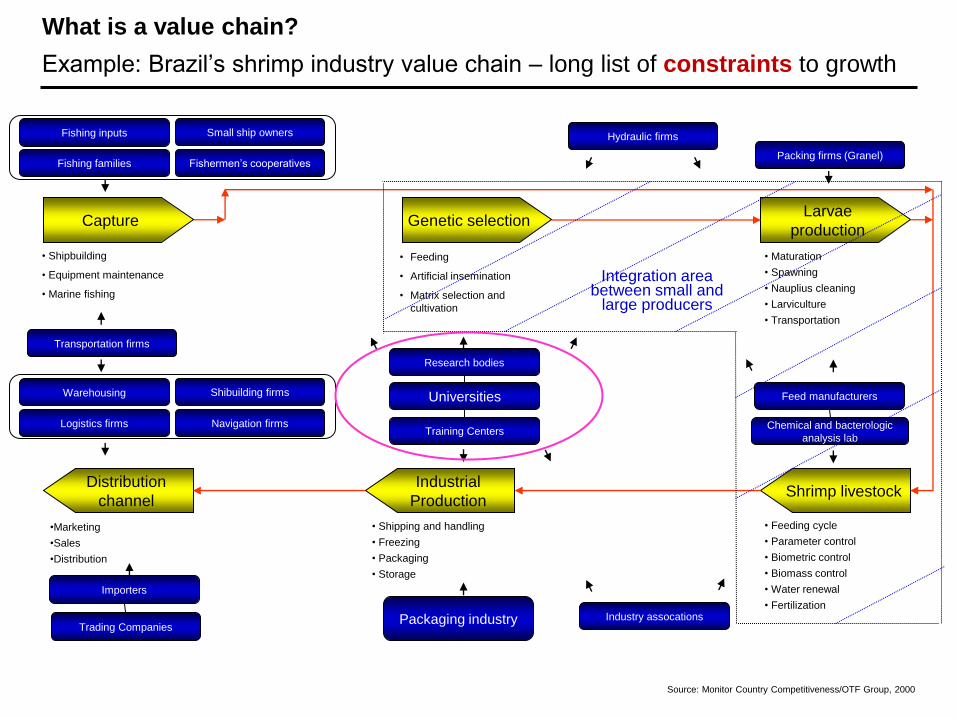
What is a value chain?
Example: Brazil’s shrimp industry value chain – long list of constraints to growth
Larvae
production
Fishing inputs Small ship owners Hydraulic firms
Feed manufacturers Universities
Distribution
channel
Shibuilding firms
Packaging industry
Industrial
Production Shrimp livestock
• Shipbuilding
• Equipment maintenance
• Marine fishing
• Feeding
• Artificial insemination
• Matrix selection and
cultivation
• Maturation
• Spawning
• Nauplius cleaning
• Larviculture
• Transportation
Industry assocations
Training Centers
Capture
Fishermen’s cooperatives Fishing families
Logistics firms Navigation firms
Warehousing
Genetic selection
Chemical and bacterologic
analysis lab
Packing firms (Granel)
Research bodies
Transportation firms
• Feeding cycle
• Parameter control
• Biometric control
• Biomass control
• Water renewal
• Fertilization
• Shipping and handling
• Freezing
• Packaging
• Storage
Trading Companies
•Marketing
•Sales
•Distribution
Importers
Integration area between small and
large producers
Source: Monitor Country Competitiveness/OTF Group, 2000
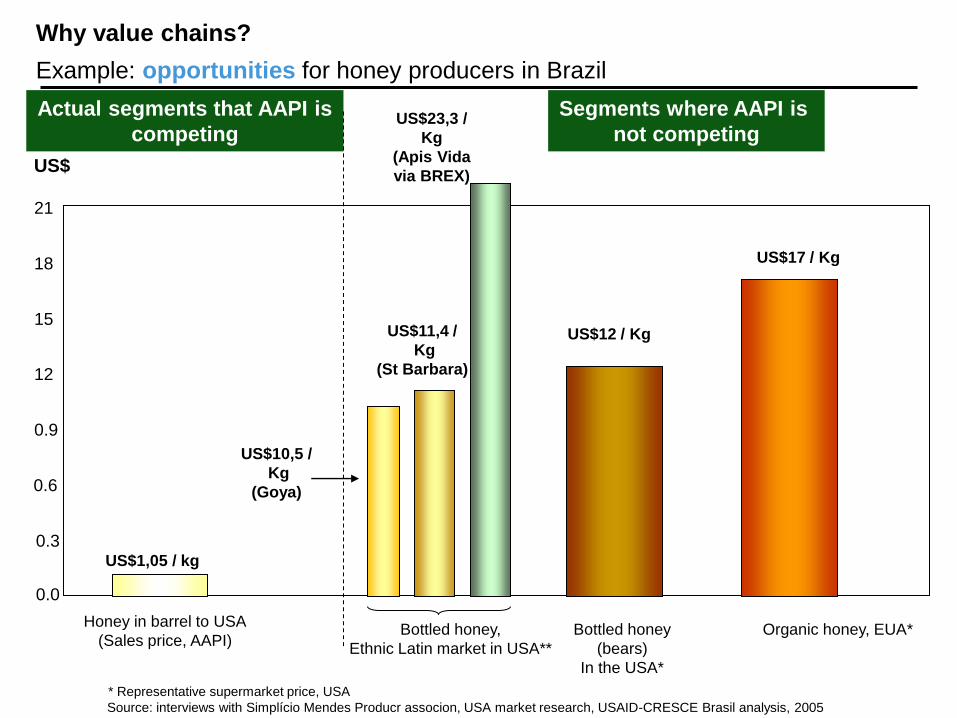
Why value chains?
Example: opportunities for honey producers in Brazil
0.0
0.3
0.6
0.9
12
15
18
21
Honey in barrel to USA
(Sales price, AAPI)
US$
Bottled honey,
Ethnic Latin market in USA**
Source: interviews with Simplício Mendes Producr associon, USA market research, USAID-CRESCE Brasil analysis, 2005
Organic honey, EUA*
US$1,05 / kg
US$17 / Kg
* Representative supermarket price, USA
Actual segments that AAPI is
competing
Segments where AAPI is
not competing
Bottled honey
(bears)
In the USA*
US$12 / Kg
US$10,5 /
Kg
(Goya)
US$23,3 /
Kg
(Apis Vida
via BREX)
US$11,4 /
Kg
(St Barbara)

Why value chains?
What is a value-chain?
Describes full range of activities required to bring a product or service
through the different phases of production, including physical
transformation, the inputs of various producer services, and response
to consumer demand (Kaplinsky, Raphael, and Morris (2000).
It is not…
The same as sectors
Just a transaction within the supply chain
Stand-alone Business Development Services (BDS)
A static description
Value-chain approaches look at the full range of issues facing the flow of
production to market
Agenda
• Why Value-Chains?
• Elements of a Value-Chain Analysis
• Country Examples
• Implications to Policy and Operations
• Q&A
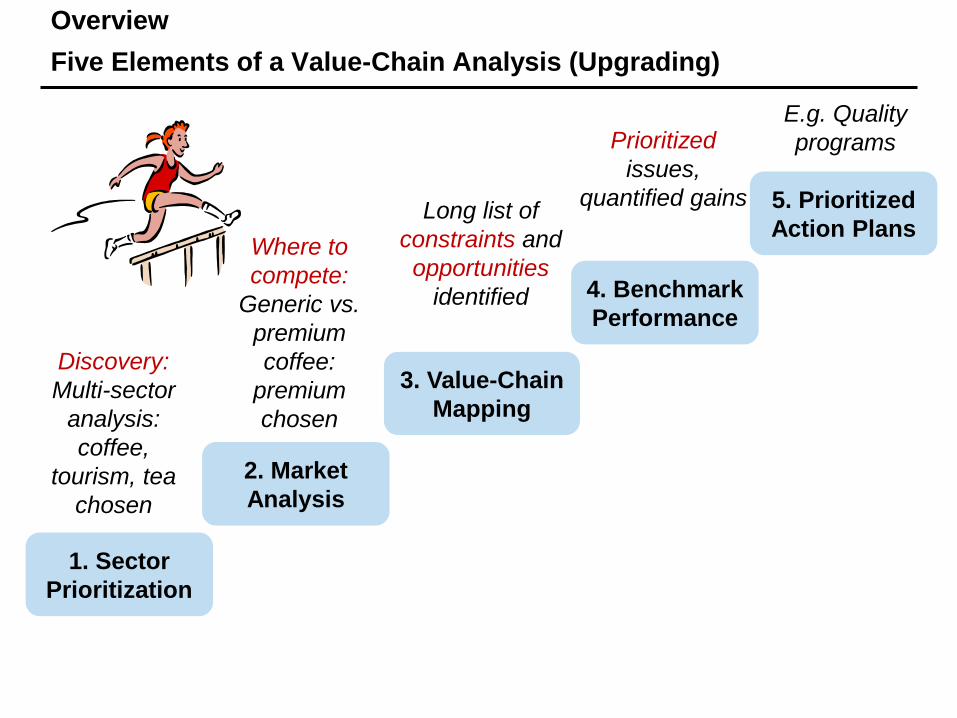
Overview
Five Elements of a Value-Chain Analysis (Upgrading)
1. Sector
Prioritization
2. Market
Analysis
3. Value-Chain
Mapping
4. Benchmark
Performance
5. Prioritized
Action Plans
Discovery:
Multi-sector
analysis:
coffee,
tourism, tea
chosen
Where to
compete:
Generic vs.
premium
coffee:
premium
chosen
Long list of
constraints and
opportunities
identified
Prioritized
issues,
quantified gains
E.g. Quality
programs

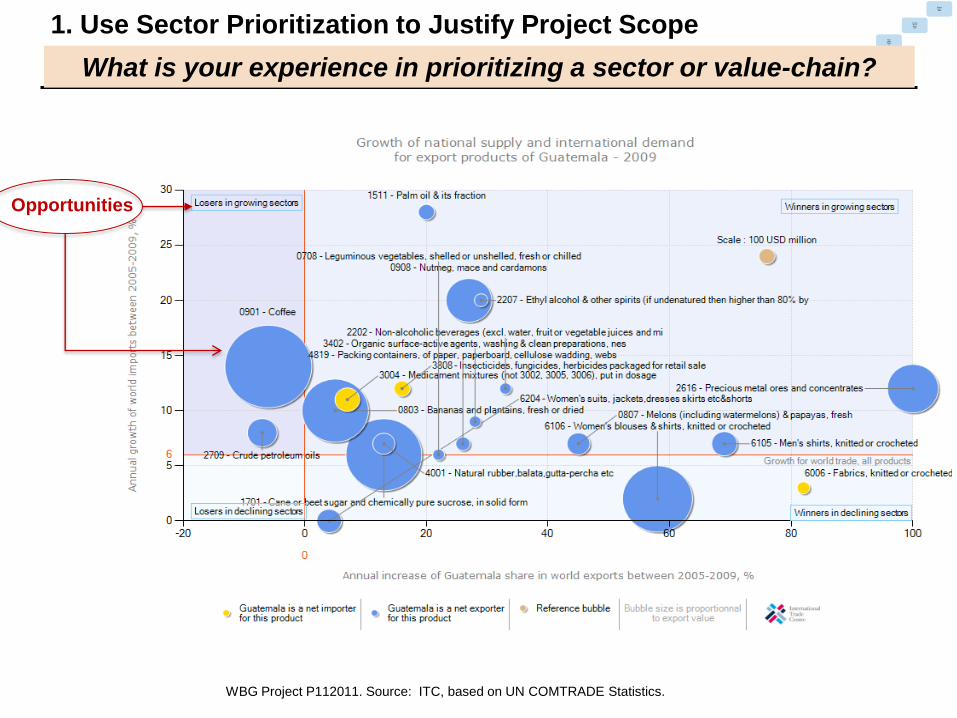
1. Use Sector Prioritization to Justify Project Scope
Prioritization Steps
“Funnel” Process
1. Long Listing Pre-selected from a preceding effort/factor or use
(10, 30, or 100+) technical criteria such as economic (e.g. export
levels), development impact (e.g. SME
concentration), and feasibility (e.g. presence of a
champion)
2. Short Listing Interviews, research, field visit, consultations,
industry workshops
(3, 10, or 20+)
3. Final Decision Approval by main stakeholder(s) / client
(1, 3, or 5+)
Sector
Selectio
n
Market
Analysi
s
Value-
Chain
Mappin
g
Perform
ance &
Bench
mark
Perform
ance &
Gaps
What does this figure reminds you of?
YOU ARE SELECTED!
Sector
Selectio
n
Market
Analysi
s
Value-
Chain
Mappin
g
Perform
ance &
Bench
mark
Perform
ance &
Gaps
1. Use Sector Prioritization to Justify Project Scope
What is your experience in prioritizing a sector or value-chain?
WBG Project P112011. Source: ITC, based on UN COMTRADE Statistics.
Opportunities
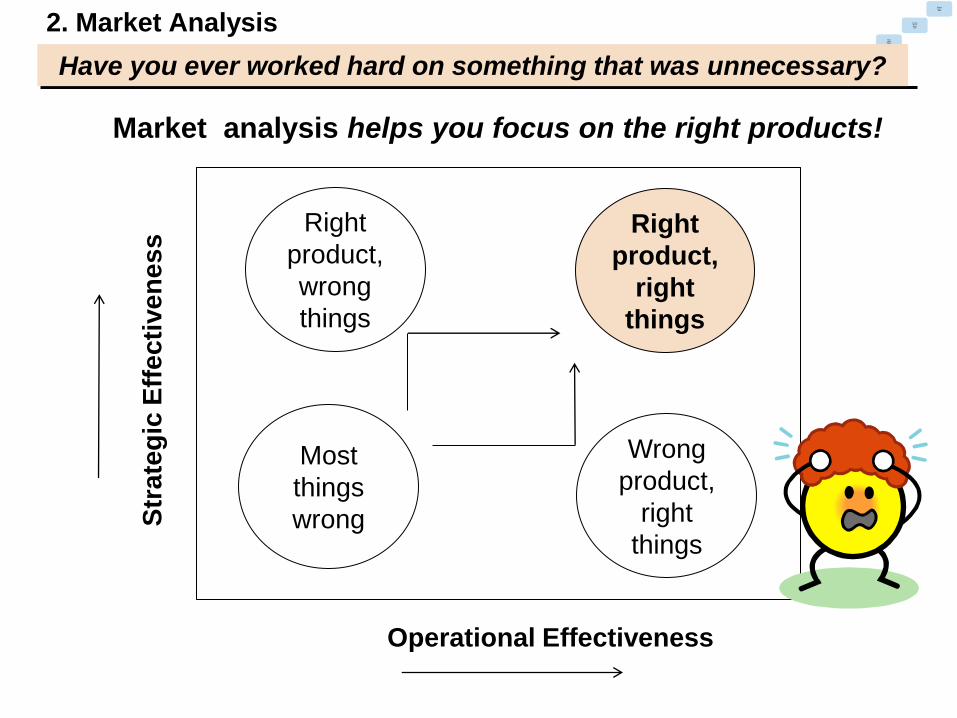
2. Market Analysis
Operational Effectiveness
Str
ate
gic
Eff
ec
tive
ne
ss
Wrong
product,
right
things
Right
product,
right
things
Most
things
wrong
Right
product,
wrong
things
Sector
Selectio
n
Market
Analysi
s
Value-
Chain
Mappin
g
Perform
ance &
Bench
mark
Perform
ance &
Gaps
Have you ever worked hard on something that was unnecessary?
Market analysis helps you focus on the right products!
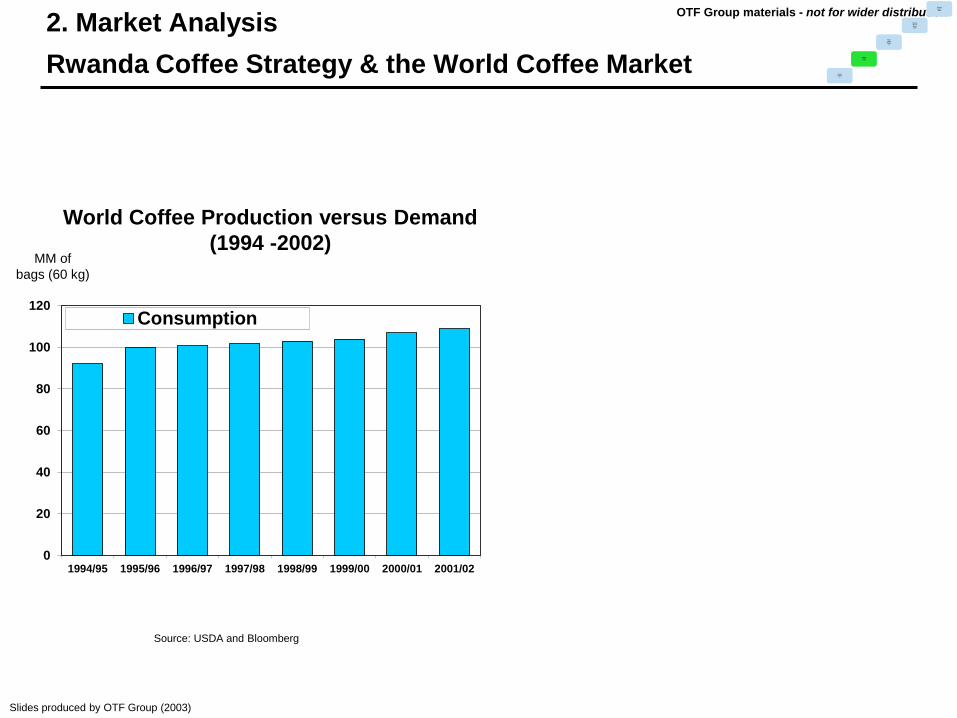
MM of
bags (60 kg)
Source: USDA and Bloomberg
0
20
40
60
80
100
120
1994/95 1995/96 1996/97 1997/98 1998/99 1999/00 2000/01 2001/02
Consumption
World Coffee Production versus Demand
(1994 -2002)
Slides produced by OTF Group (2003)
OTF Group materials - not for wider distribution
2. Market Analysis
Rwanda Coffee Strategy & the World Coffee Market Sector
Selectio
n
Market
Analysi
s
Value-
Chain
Mappin
g
Perform
ance &
Bench
mark
Perform
ance &
Gaps

2. Market Analysis
Rwanda Coffee Strategy & the World Coffee Market
MM of
bags (60 kg)
Source: USDA and Bloomberg
0
20
40
60
80
100
120
1994/95 1995/96 1996/97 1997/98 1998/99 1999/00 2000/01 2001/02
Production Consumption
0.00
0.20
0.40
0.60
0.80
1.00
1.20
1.40
1.60
1.80
2.00
1991 1992 1993 1994 1995 1996 1997 1998 1999 2000 2001
Source: International Coffee Organization
US$/lb
World Coffee Price Index
(Annual Average C-Price NY)
World Coffee Production versus Demand
(1994 -2002)
Slides produced by OTF Group (2003)
OTF Group materials - not for wider distribution
Sector
Selectio
n
Market
Analysi
s
Value-
Chain
Mappin
g
Perform
ance &
Bench
mark
Perform
ance &
Gaps

3. Value-Chain Mapping
Input to Markets – Rwanda tourism industry map
Sector
Selectio
n
Market
Analysi
s
Value-
Chain
Mappin
g
Perform
ance &
Bench
mark
Perform
ance &
Gaps
Have you ever tried to get somewhere without a roadmap?
Henning, et. al, USAID/OTF Group, 2008
Disorganized
High value
wildlife &
safety
Small firms,
variable
quality
Meeting
quality
standards Inadequate
Technical
Assistance
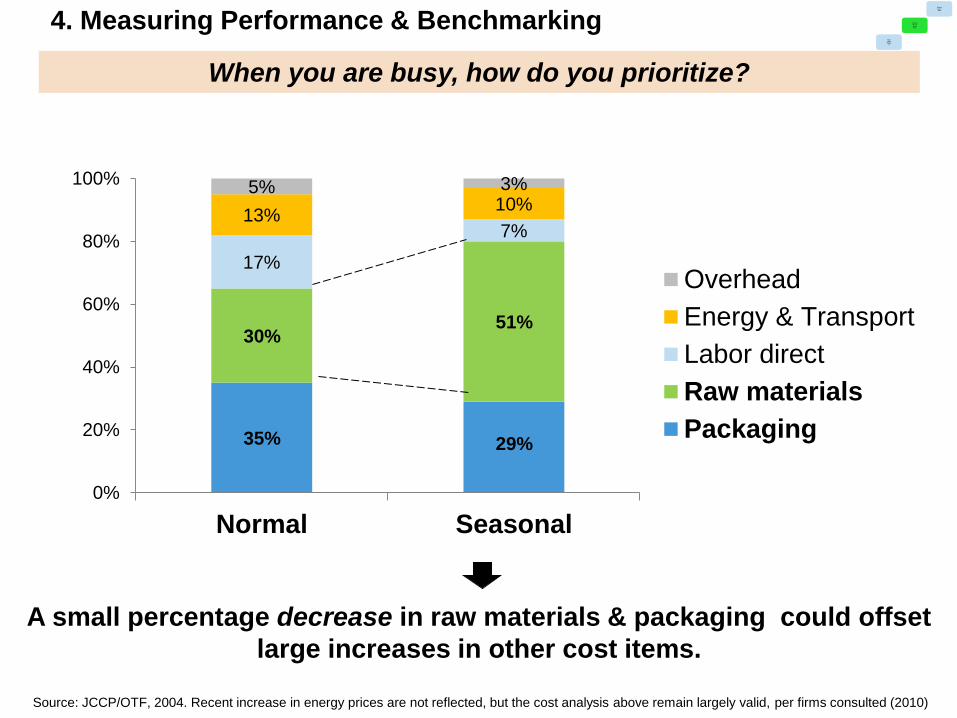
4. Measuring Performance & Benchmarking
Cost Analysis: Jamaica Food Processor
35% 29%
30% 51%
17%
7% 13%
10% 5% 3%
0%
20%
40%
60%
80%
100%
Normal Seasonal
Overhead
Energy & Transport
Labor direct
Raw materials
Packaging
Source: JCCP/OTF, 2004. Recent increase in energy prices are not reflected, but the cost analysis above remain largely valid, per firms consulted (2010)
A small percentage decrease in raw materials & packaging could offset
large increases in other cost items.
Sector
Selectio
n
Market
Analysi
s
Value-
Chain
Mappin
g
Perform
ance &
Bench
mark
Perform
ance &
Gaps
When you are busy, how do you prioritize?

5. Prioritized Action Plan
Joint Public-Private Action Plan - Illustrative Example
Source: Guatemala Enhancing MSME Productivity Project, 2011
Coffee Sector Study
Washing Stations
Sector
Selectio
n
Market
Analysi
s
Value-
Chain
Mappin
g
Perform
ance &
Bench
mark
Perform
ance &
Gaps
1 Public
2 Public-
Private
3 Private
1 2 3 4 5
Regulatory
and tax
environme
nt
Infrastruct
ure
Access to
finance
Skilled and
trained
labor
Access to
technologi
es and
R&D
Source: Kassim, S., “Using PPD to Build Competitive Industries,” 2011
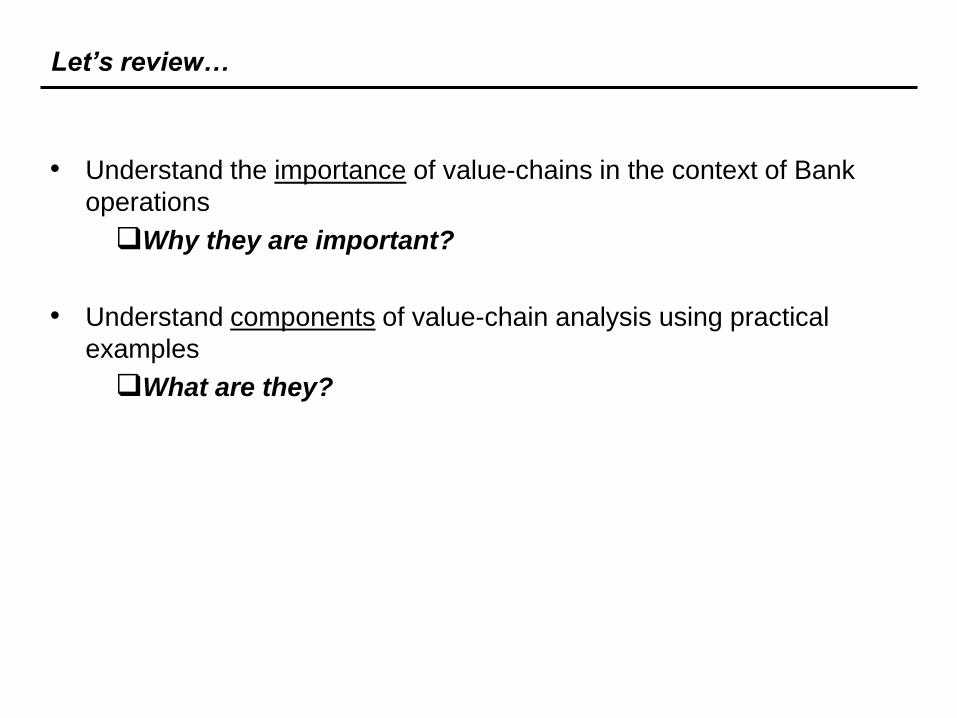
Let’s review…
• Understand the importance of value-chains in the context of Bank
operations
Why they are important?
• Understand components of value-chain analysis using practical
examples
What are they?
Agenda
• Why Value-Chains?
• Elements of a Value-Chain Analysis
• Country Examples
• Implications to Policy and Operations
• Q&A

Pakistan
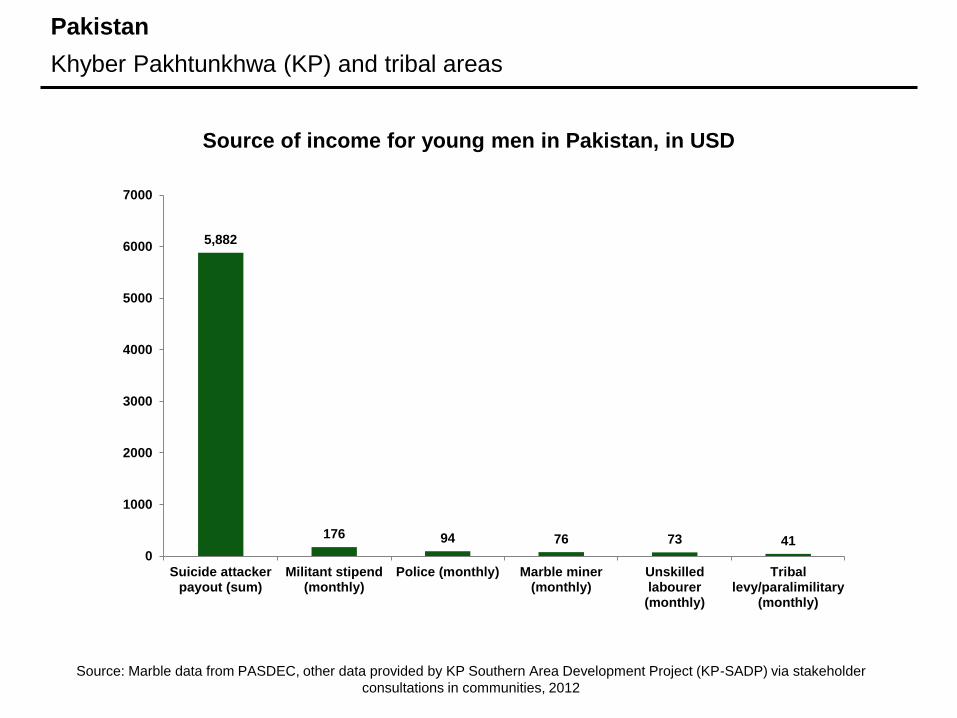
Pakistan
Khyber Pakhtunkhwa (KP) and tribal areas
5,882
176 94 76 73 41 0
1000
2000
3000
4000
5000
6000
7000
Suicide attackerpayout (sum)
Militant stipend(monthly)
Police (monthly) Marble miner(monthly)
Unskilledlabourer(monthly)
Triballevy/paralimilitary
(monthly)
Source of income for young men in Pakistan, in USD
Source: Marble data from PASDEC, other data provided by KP Southern Area Development Project (KP-SADP) via stakeholder
consultations in communities, 2012

Pakistan
FATA in 2008 – How to Generate Jobs?
Projected job creation in FATA Marble Industry (2005-2015)
0
10000
20000
30000
40000
50000
60000
2005 2006 2007 2008 2009 2010 2011 2012 2013 2014 2015
Total jobs
Source: Based on 10% national job growth rate used by SWOG Dimensional Stone Strategy, 2006.
Actual
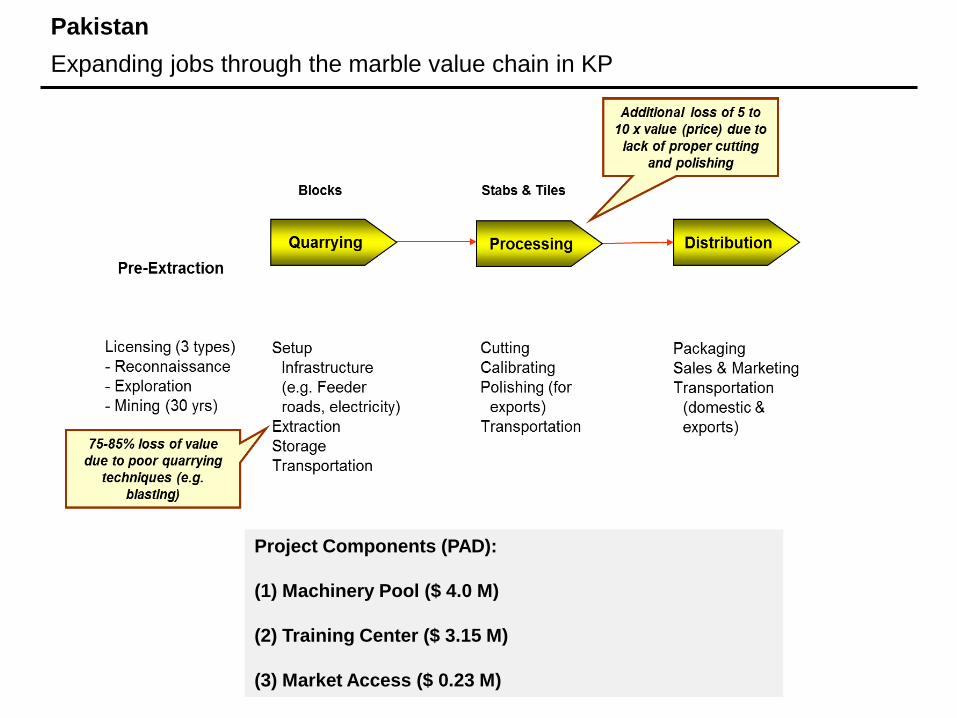
Pakistan
Expanding jobs through the marble value chain in KP
Project Components (PAD):
(1) Machinery Pool ($ 4.0 M)
(2) Training Center ($ 3.15 M)
(3) Market Access ($ 0.23 M)

Guatemala
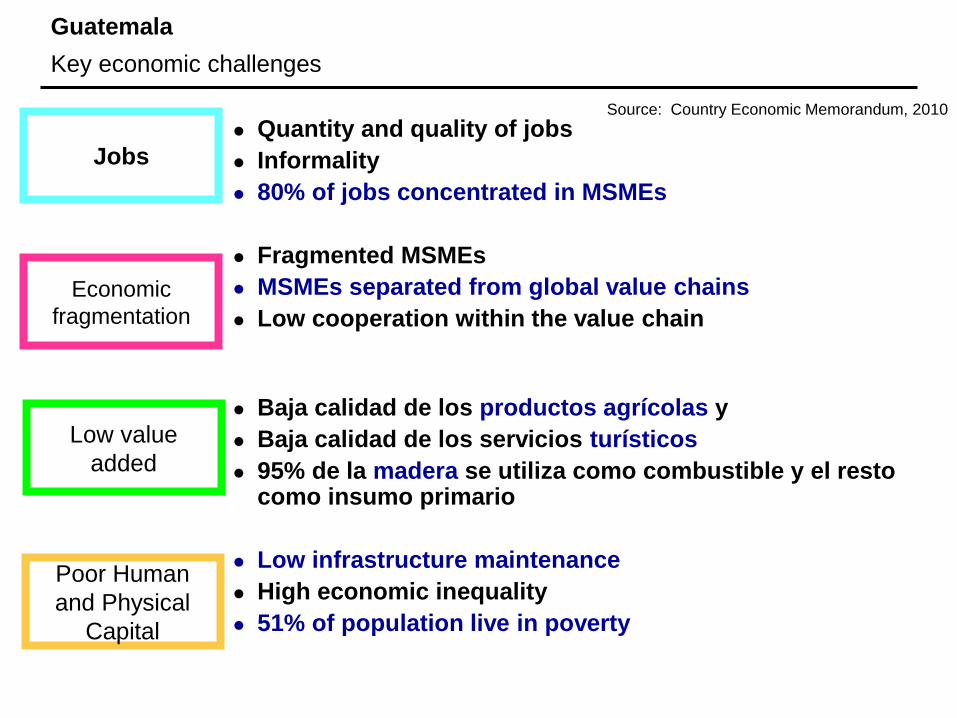
Guatemala
Key economic challenges
Quantity and quality of jobs
Informality
80% of jobs concentrated in MSMEs
Fragmented MSMEs
MSMEs separated from global value chains
Low cooperation within the value chain
Baja calidad de los productos agrícolas y
Baja calidad de los servicios turísticos
95% de la madera se utiliza como combustible y el resto como insumo primario
Low infrastructure maintenance
High economic inequality
51% of population live in poverty
Jobs
Economic
fragmentation
Low value
added
Poor Human
and Physical
Capital
Source: Country Economic Memorandum, 2010
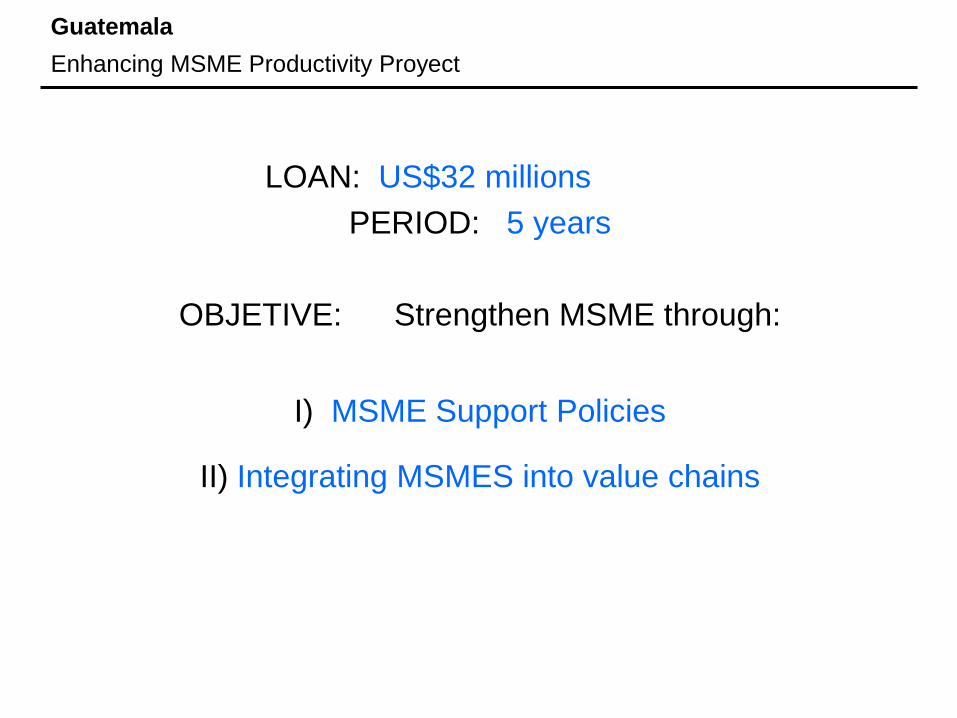
Guatemala
Enhancing MSME Productivity Proyect
LOAN: US$32 millions
PERIOD: 5 years
OBJETIVE: Strengthen MSME through:
I) MSME Support Policies
II) Integrating MSMES into value chains
Guatemala
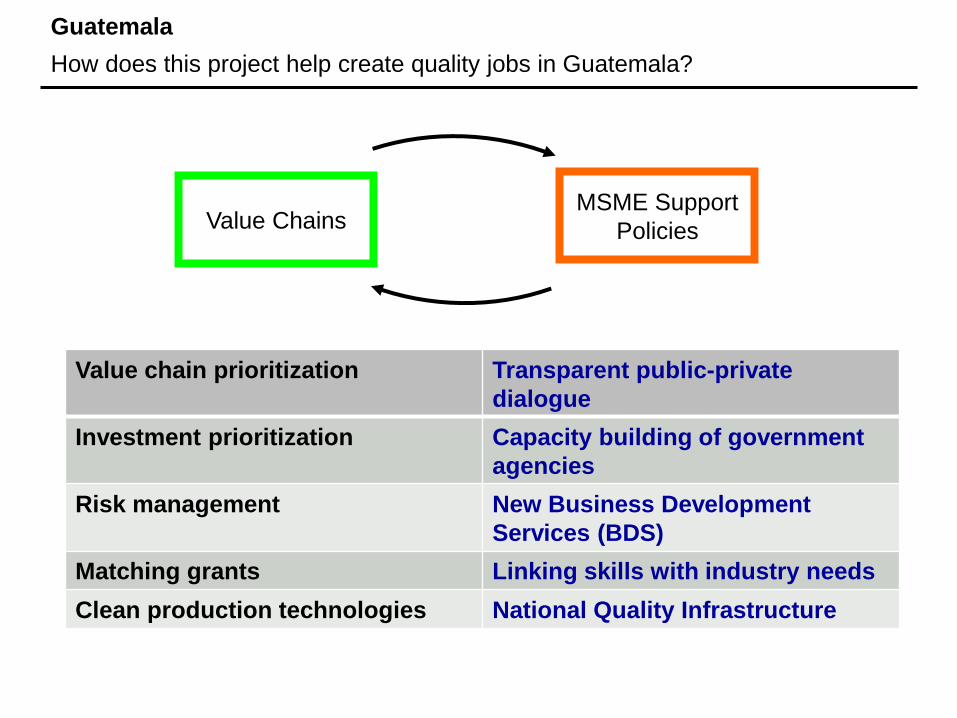
How does this project help create quality jobs in Guatemala?
Value chain prioritization Transparent public-private
dialogue
Investment prioritization Capacity building of government
agencies
Risk management New Business Development
Services (BDS)
Matching grants Linking skills with industry needs
Clean production technologies National Quality Infrastructure
Value Chains MSME Support
Policies

Guatemala
How is this approach different?
Old
Bank-led based on analysis
Individual transactions
Scattered efforts
The same beneficiaries, mainly
political criteria
Little technical assistance to MSMEs
Little accountability
New
Stakeholder-driven based on analysis
MSME value chain integration
Prioritization of efforts
Inclusion of MSME, use of technical
criteria
Technical and financial support
Measurable support
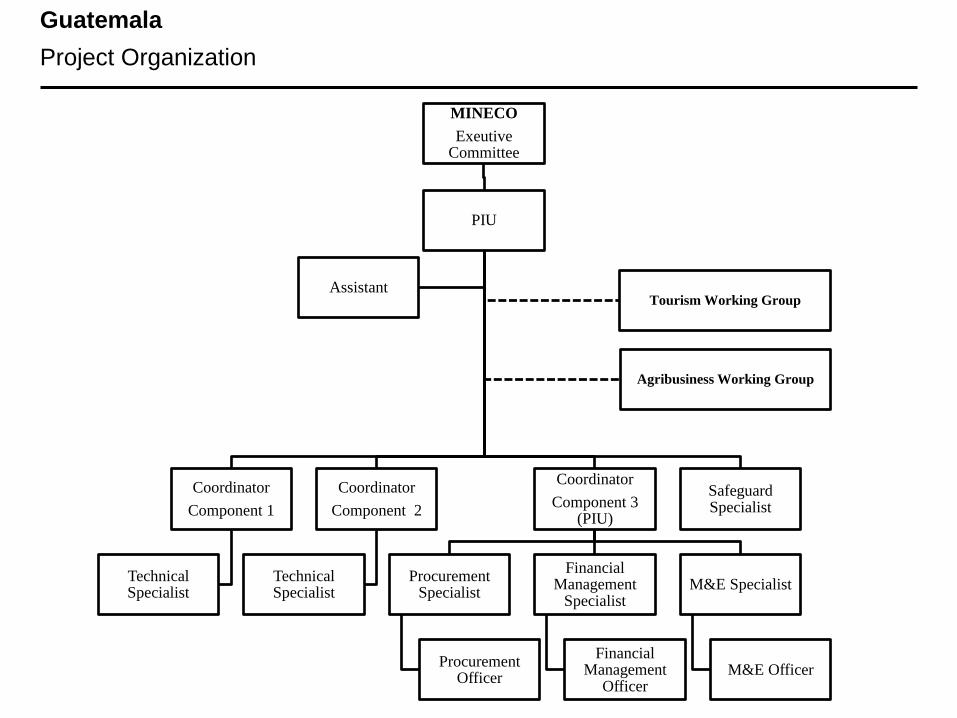
MINECO
Exeutive Committee
PIU
Coordinator
Component 1
Technical Specialist
Coordinator
Component 2
Technical Specialist
Coordinator
Component 3 (PIU)
Procurement Specialist
Procurement Officer
Financial Management
Specialist
Financial Management
Officer
M&E Specialist
M&E Officer
Safeguard Specialist
Agribusiness Working Group
Tourism Working Group Assistant
Guatemala
Project Organization
Agenda
• Why Value-Chains?
• Elements of a Value-Chain Analysis
• Country Examples
• Implications to Policy and Operations
• Q&A
Agenda
• Why Value-Chains?
• Elements of a Value-Chain Analysis
• Country Examples
• Implications to Policy and Operations
• Q&A
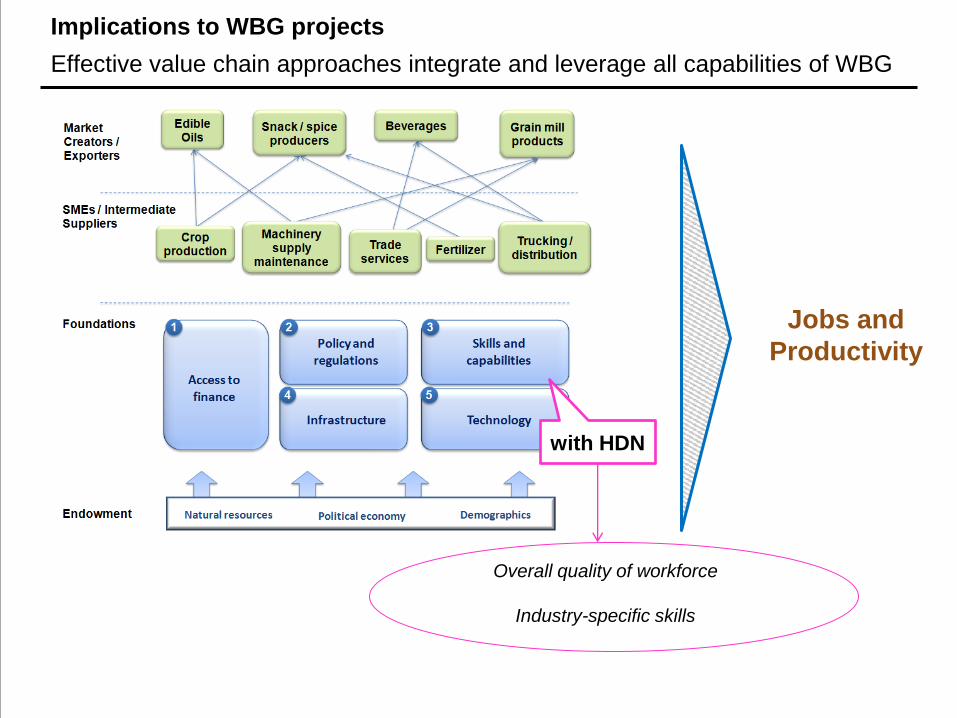
with HDN
Jobs and
Productivity
Implications to WBG projects
Effective value chain approaches integrate and leverage all capabilities of WBG
Overall quality of workforce
Industry-specific skills
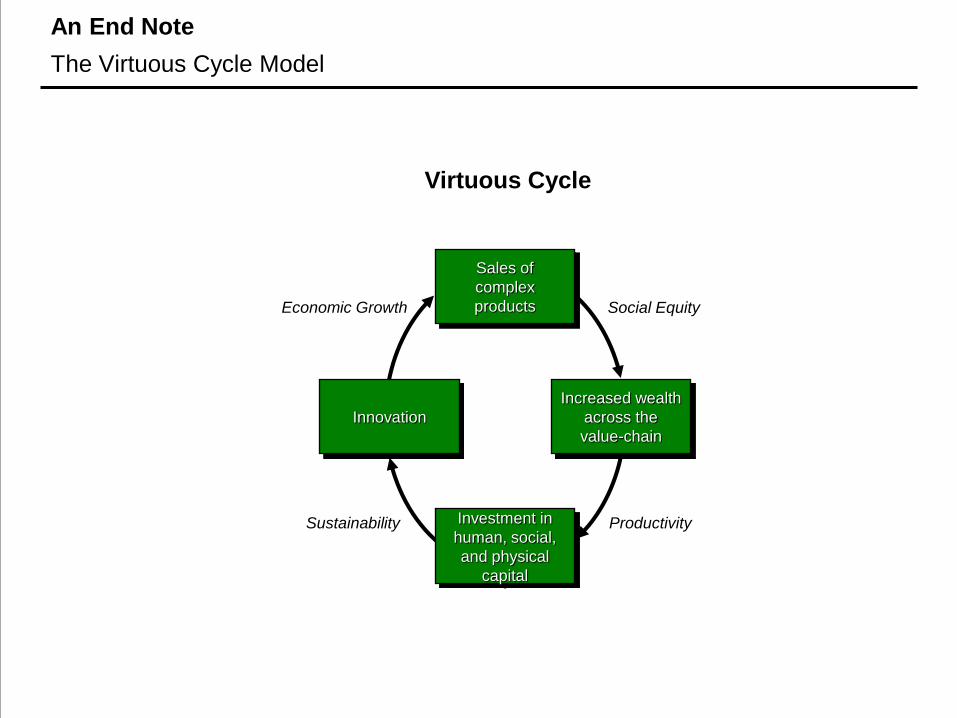
An End Note
The Virtuous Cycle Model
Economic Growth Social Equity
Sustainability Productivity
Increased wealth
across the
value-chain
Innovation
Sales of
complex
products
Investment in
human, social,
and physical
capital
Virtuous Cycle
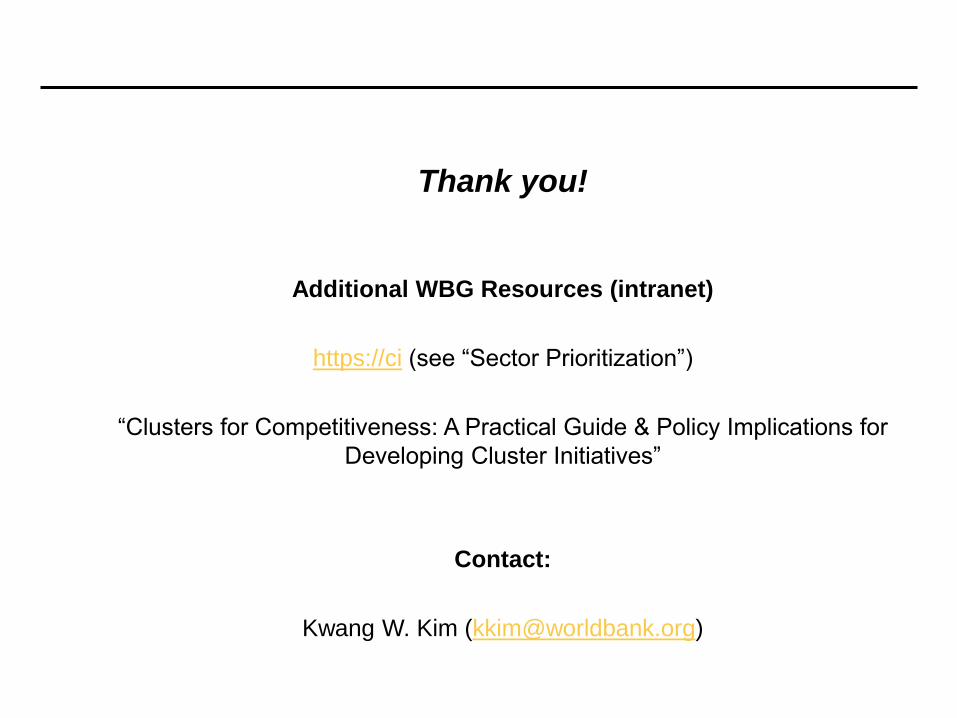
Thank you!
Additional WBG Resources (intranet)
https://ci (see “Sector Prioritization”)
“Clusters for Competitiveness: A Practical Guide & Policy Implications for
Developing Cluster Initiatives”
Contact:
Kwang W. Kim ([email protected])

Back-up

CI Sector Prioritization Discussion Framework
Equity
Dimensions Variables Criteria
e.g. up / downstream
demand
7 Forms of Capital*
3. Feasibility
e.g. share
Industry structure
Spillovers and linkages
Growth rates
Market Share (relative advantage)
Employment
Share of micro and SME firms
Productivity (TFP, Labor)
Sophistication (value added)
Workforce Displacement
Political
Growth
Capability
Technical Effort, cost, time for reforms
and infrastructure
Financial
e.g. share of exports
e.g. growth of exports
and investments
e.g. loss of jobs due
to high TFP
e.g. inequality
e.g. quality of life Income
Endowments
* Wolfensohn-Fairbanks Model
e.g. employability, skills
1. Economic
e.g. Project feasibility
e.g. Project costs and
benefits
e.g. Leadership
e.g. Institutional structure
e.g. Psychology and
mindsets
e.g. Winners and Losers
2. Social
Inequality (Gini)
(Direct and indirect impact)
e.g. Energy usage,
material usage, air
emissions, waste
Environmental impact

The four Elements of the Porter Diamond
National and industry competitiveness is created by upgrading the four elements
Demand Conditions
Factor Conditions
Context for Firm
Strategy and Rivalry
Related and Supporting Industries
Primary, secondary, tertiary education
Vocational schools
Consulting firms and expertise
Industry-academic collaboration
More competitive
Dynamic environment for competition and business strategy, e.g. predictable
business environment (e.g. competition, IP Policy), high variety and number of firms
Less competitive
Lack of fair competition, e.g. collusive practices, frequent policy changes, a few firms
dominate the industry, high entry and exit barriers, high informality
Public-private feedback mechanisms, including Industry-academic collaboration
Certification (e.g. HAACP)
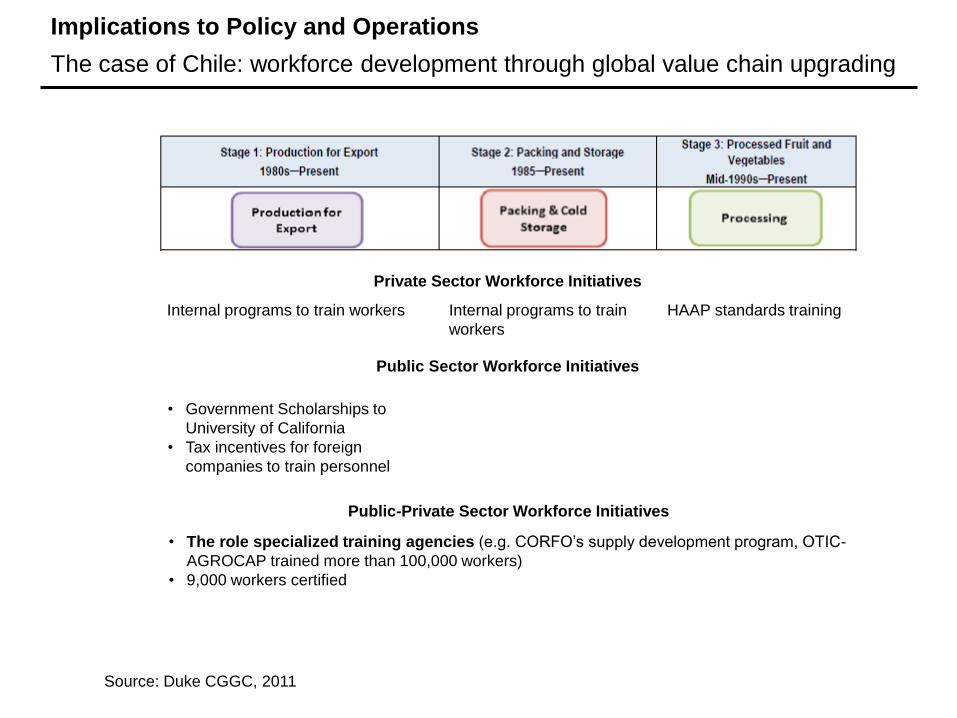
Implications to Policy and Operations
The case of Chile: workforce development through global value chain upgrading
Private Sector Workforce Initiatives
Public Sector Workforce Initiatives
Internal programs to train workers Internal programs to train
workers
HAAP standards training
• Government Scholarships to
University of California
• Tax incentives for foreign
companies to train personnel
Public-Private Sector Workforce Initiatives
• The role specialized training agencies (e.g. CORFO’s supply development program, OTIC-
AGROCAP trained more than 100,000 workers)
• 9,000 workers certified
Source: Duke CGGC, 2011