in-work poverty in the recession - briefing paper
TRANSCRIPT
8/8/2019 In-work Poverty in the Recession - briefing paper
http://slidepdf.com/reader/full/in-work-poverty-in-the-recession-briefing-paper 1/12
In-work poverty in
the recessionBrieng note
Glenn Gottfried and Kayte Lawton
September 2010© ippr 2010
Institute for Public Policy ResearchChallenging ideas – Changing policy
8/8/2019 In-work Poverty in the Recession - briefing paper
http://slidepdf.com/reader/full/in-work-poverty-in-the-recession-briefing-paper 2/12
8/8/2019 In-work Poverty in the Recession - briefing paper
http://slidepdf.com/reader/full/in-work-poverty-in-the-recession-briefing-paper 3/12
ippr | In-work poverty in the recession
Introduction
The share of poor households accounted for by working households (as opposed to workless
households) has been increasing in the UK over the last decade, with more than half of poor
children living in working households before the recession. This note presents new data explaining
what has happened to in-work poverty since the recession began, using newly released data
covering the period April 2008 to March 2009.1
Analysts had thought that the trend towards a greater proportion of poverty being found among
working households might be reversed by the recession, as low earners lost their jobs and swapped
in-work poverty for workless poverty. However, our analysis shows that this had not happened
by March 2009 and that in-work poverty continues to account for a rising share of poverty. This
creates a key challenge for the Coalition Government as it sets out its plans for welfare reform and
develops its child poverty strategy.
In-work poverty in the UK
This note updates ippr’s 2008 report Working Out of Poverty: A study of the low-paid and ‘working
poor’ (Cooke and Lawton 2008). Poor households are dened as those with an income of less than
60 per cent of median household income.2
The study used data from 2005/06 and preceding yearsand found that an increasing proportion of poor households contained at least one working adult.
Most importantly, it found that half of poor children lived in working households and that the
number of children in ‘working poor’ households had not changed since then-Prime Minister Tony
Blair made his pledge in 1999 to end child poverty by 2020. We established that all the progress
made in reducing child poverty had been achieved by bringing down poverty among workless
households, either by increasing benet and tax credit payments to these families or by helping
these families into work.
While we welcomed the fall in poverty among these households, we were concerned that some
families were simply swapping one kind of poverty for another when they moved into work.
This meant that the mantra that ‘work is the best route out of poverty’ was beginning to look
increasingly hollow for many families. Government studies have found that a third of families who
move into work do not manage to escape poverty, and a signicant proportion of those that dosubsequently end up back in poverty at some point in the next three years (Browne and Paull 2010).
The fact that the number of children in ‘working poor’ households had not changed in a decade
suggested that the government at that time lacked an effective strategy for tackling in-work
poverty. We argued that this risked undermining its anti-child poverty strategy and would make it
increasingly difcult to achieve its goal of ending child poverty by 2020. Since the publication of
our report in 2008, other studies have demonstrated that the proportion of poor children living in
working households has continued to increase and concerns about in-work poverty remain just as
important (Kenway 2008; Browne and Paull 2010).
In distinguishing between workless and working poverty, we are not prioritising one kind of poverty
over another or suggesting that one kind of poverty is more or less acceptable than the other.
Poverty in all its forms is unacceptable in a wealthy nation like the UK and tackling poverty in all its
forms should be the focus of government policy. By highlighting the problem of in-work poverty we
are seeking to demonstrate the complexity of poverty. Poverty is all too often associated primarily
with worklessness, leading to policies that assume getting someone into a job is the end of the
story. Our 2008 analysis has showed that this simplistic approach was awed and that responses to
poverty should be based on a more sophisticated understanding of the drivers of poverty.
In its rst term, the previous Labour government introduced a number of policies to ‘make work
pay’, most notably the national minimum wage and Working Tax Credits. Although these would be
of benet to the ‘working poor’, the explicit goal was to increase work incentives for workless adults
rather than to address in-work poverty directly. Later, the Labour government began to address
in-work poverty more explicitly, through the piloting of in-work advisory support and work-based
training for low-skilled workers.
ThisreportusestheHouseholdsBelowAverageIncome2008/09dataset,whichisderivedfromtheFamily
ResourcesSurvey.
Allguresinthisreportuseincomemeasuredbeforehousingcostsunlessotherwisestated.
8/8/2019 In-work Poverty in the Recession - briefing paper
http://slidepdf.com/reader/full/in-work-poverty-in-the-recession-briefing-paper 4/12
ippr | In-work poverty in the recession
The Coalition Government has yet to set out its detailed strategy for tackling child poverty and so
we do not yet have a clear sense of whether and how it plans to address the problem of in-work
poverty. The 2010 Child Poverty Act enshrines in law the goal of eradicating child poverty by 2020
and requires the Government to publish its child poverty strategy by 25 March 2011. Labour MP
Frank Field is currently chairing a Government review into child poverty that will report in autumn
2010 and is likely to include proposals for broadening the denition of poverty and taking a moreholistic approach to tackling poverty. This note is designed in part to feed into this review and to
highlight the ongoing challenge of in-work poverty among families with children.
Although we do not yet have a detailed anti-poverty strategy from the Coalition Government, there
are a number of reforms on the agenda that could have implications for in-work poverty, including
the welfare reform plans being developed by the Department for Work and Pensions. Secretary of
State Iain Duncan Smith is determined to radically redesign the benet system so that it provides
much stronger nancial work incentives to people out of work. While benet simplication and
‘making work pay’ is vital, the Secretary of State’s strategy paper 21st Century Welfare (Department
for Work and Pensions 2010) makes no mention of in-work poverty and places a great deal of
faith in the ability of work to lift families out of poverty. The gures presented in this note pose a
challenge to this approach and we hope that our analysis will be taken on board as the Department
nalises its welfare reform plans.
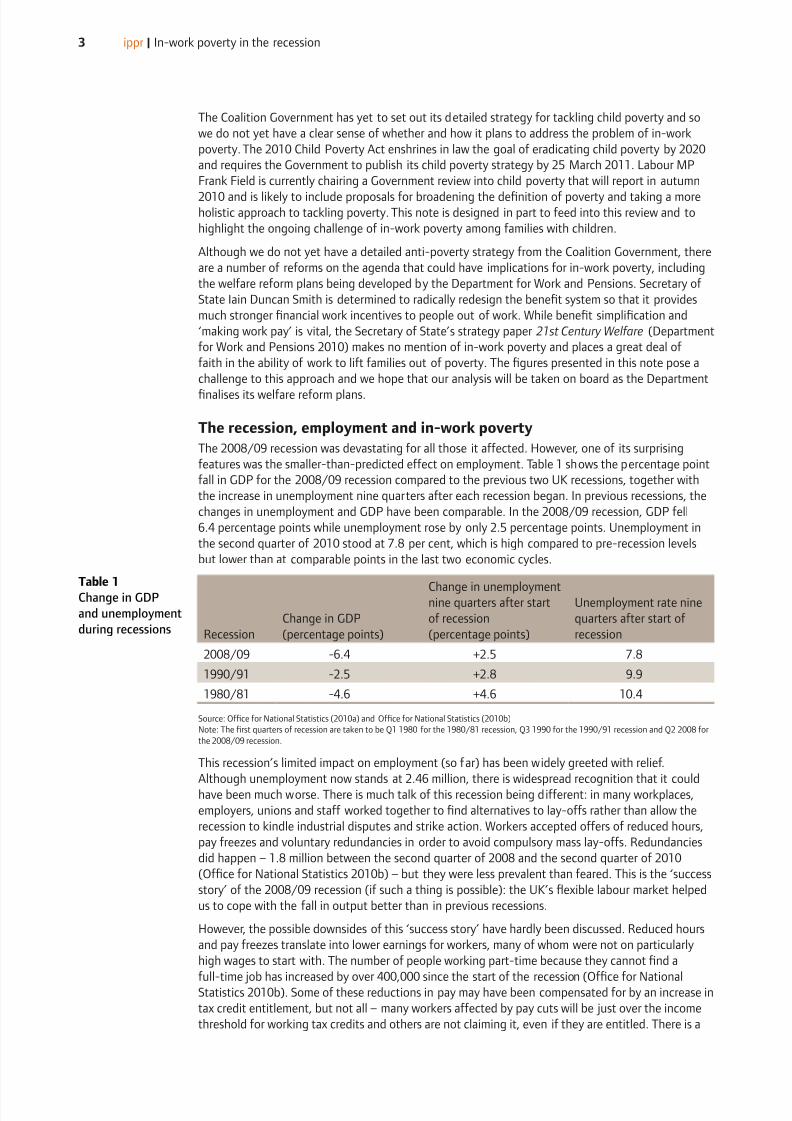
The recession, employment and in-work poverty
The 2008/09 recession was devastating for all those it affected. However, one of its surprising
features was the smaller-than-predicted effect on employment. Table 1 shows the percentage point
fall in GDP for the 2008/09 recession compared to the previous two UK recessions, together with
the increase in unemployment nine quarters after each recession began. In previous recessions, the
changes in unemployment and GDP have been comparable. In the 2008/09 recession, GDP fell
6.4 percentage points while unemployment rose by only 2.5 percentage points. Unemployment in
the second quarter of 2010 stood at 7.8 per cent, which is high compared to pre-recession levels
but lower than at comparable points in the last two economic cycles.
Recession
Change in GDP
(percentage points)
Change in unemploymentnine quarters after start
of recession
(percentage points)
Unemployment rate nine
quarters after start of
recession
2008/09 -6.4 +2.5 7.8
1990/91 -2.5 +2.8 9.9
1980/81 -4.6 +4.6 10.4
Source: Ofce for National Statistics (2010a) and Ofce for National Statistics (2010b)
Note: The rst quarters of recession are taken to be Q1 1980 for the 1980/81 recession, Q3 1990 for the 1990/91 recession and Q2 2008 for
the 2008/09 recession.
This recession’s limited impact on employment (so far) has been widely greeted with relief.
Although unemployment now stands at 2.46 million, there is widespread recognition that it could
have been much worse. There is much talk of this recession being different: in many workplaces,
employers, unions and staff worked together to nd alternatives to lay-offs rather than allow the
recession to kindle industrial disputes and strike action. Workers accepted offers of reduced hours,
pay freezes and voluntary redundancies in order to avoid compulsory mass lay-offs. Redundancies
did happen – 1.8 million between the second quarter of 2008 and the second quarter of 2010
(Ofce for National Statistics 2010b) – but they were less prevalent than feared. This is the ‘success
story’ of the 2008/09 recession (if such a thing is possible): the UK’s exible labour market helped
us to cope with the fall in output better than in previous recessions.
However, the possible downsides of this ‘success story’ have hardly been discussed. Reduced hours
and pay freezes translate into lower earnings for workers, many of whom were not on particularly
high wages to start with. The number of people working part-time because they cannot nd a
full-time job has increased by over 400,000 since the start of the recession (Ofce for NationalStatistics 2010b). Some of these reductions in pay may have been compensated for by an increase in
tax credit entitlement, but not all – many workers affected by pay cuts will be just over the income
threshold for working tax credits and others are not claiming it, even if they are entitled. There is a
Table
Change in GDP
and unemployment
during recessions
8/8/2019 In-work Poverty in the Recession - briefing paper
http://slidepdf.com/reader/full/in-work-poverty-in-the-recession-briefing-paper 5/12
ippr | In-work poverty in the recession
risk, therefore, that while unemployment did not rise as much as expected, some families could have
been placed at greater risk of poverty – specically, in-work poverty – as a result of the recession.
Trends in poverty in the UK
Across the UK, just under 11 million people – equivalent to 18 per cent of the population – were
identied as poor in 2008/09, based on their household income before housing costs. This total
was made up of 2.8 million children, 5.8 million working-age adults and 2.3 million pensioners.
Poverty among these three groups has shown different trends over the last decade, with falls in
child and pensioner poverty but a rise in poverty among working-age adults.
Over the last decade, child poverty has received the most policy attention, following the
government’s pledge to end child poverty by 2020. In 2008/09 child poverty fell for the rst time
in three years, by 100,000; since 1998/99, the number of poor children has fallen by a total of
600,000.
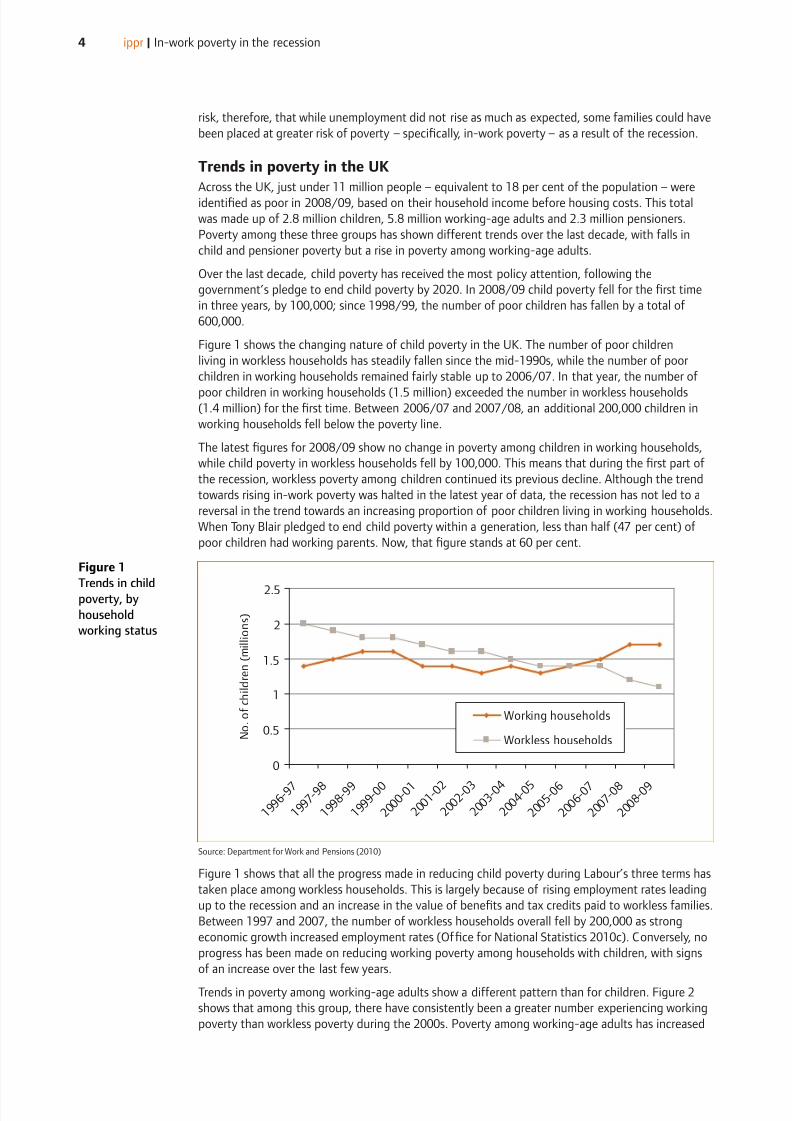
Figure 1 shows the changing nature of child poverty in the UK. The number of poor children
living in workless households has steadily fallen since the mid-1990s, while the number of poor
children in working households remained fairly stable up to 2006/07. In that year, the number of
poor children in working households (1.5 million) exceeded the number in workless households(1.4 million) for the rst time. Between 2006/07 and 2007/08, an additional 200,000 children in
working households fell below the poverty line.
The latest gures for 2008/09 show no change in poverty among children in working households,
while child poverty in workless households fell by 100,000. This means that during the rst part of
the recession, workless poverty among children continued its previous decline. Although the trend
towards rising in-work poverty was halted in the latest year of data, the recession has not led to a
reversal in the trend towards an increasing proportion of poor children living in working households.
When Tony Blair pledged to end child poverty within a generation, less than half (47 per cent) of
poor children had working parents. Now, that gure stands at 60 per cent.
0
0.5
1
1.5
2
2.5
1 9 9 6
- 9 7
1 9 9 7
- 9 8
1 9 9 8
- 9 9
1 9 9 9
- 0 0
2 0 0 0
- 0 1
2 0 0 1
- 0 2
2 0 0 2
- 0 3
2 0 0 3
- 0 4
2 0 0 4
- 0 5
2 0 0 5
- 0 6
2 0 0 6
- 0 7
2 0 0 7
- 0 8
2 0 0 8
- 0 9
N o . o f c h i l d r e n ( m i l l i o n s )
Working households
Workless households
Source: Department for Work and Pensions (2010)
Figure 1 shows that all the progress made in reducing child poverty during Labour’s three terms has
taken place among workless households. This is largely because of rising employment rates leading
up to the recession and an increase in the value of benets and tax credits paid to workless families.
Between 1997 and 2007, the number of workless households overall fell by 200,000 as strong
economic growth increased employment rates (Ofce for National Statistics 2010c). Conversely, no
progress has been made on reducing working poverty among households with children, with signs
of an increase over the last few years.
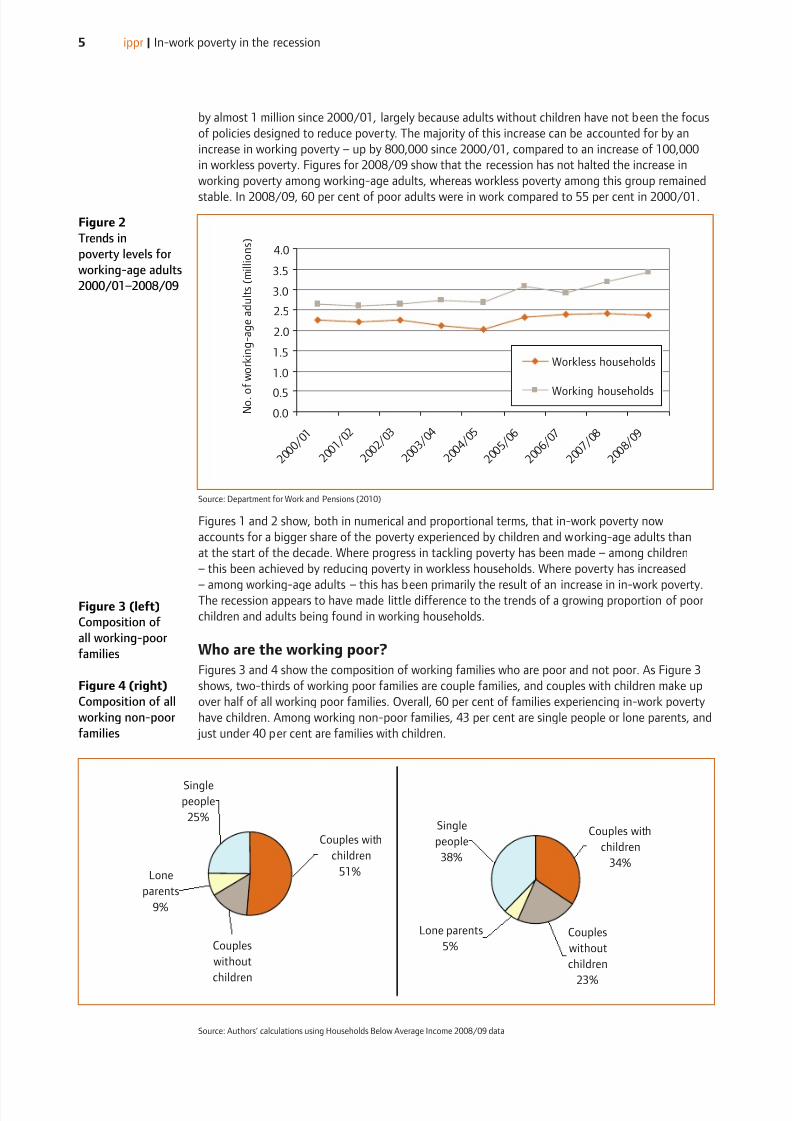
Trends in poverty among working-age adults show a different pattern than for children. Figure 2
shows that among this group, there have consistently been a greater number experiencing working
poverty than workless poverty during the 2000s. Poverty among working-age adults has increased
Figure
Trends in childpoverty, by
household
working status
8/8/2019 In-work Poverty in the Recession - briefing paper
http://slidepdf.com/reader/full/in-work-poverty-in-the-recession-briefing-paper 6/12
8/8/2019 In-work Poverty in the Recession - briefing paper
http://slidepdf.com/reader/full/in-work-poverty-in-the-recession-briefing-paper 7/12
ippr | In-work poverty in the recession
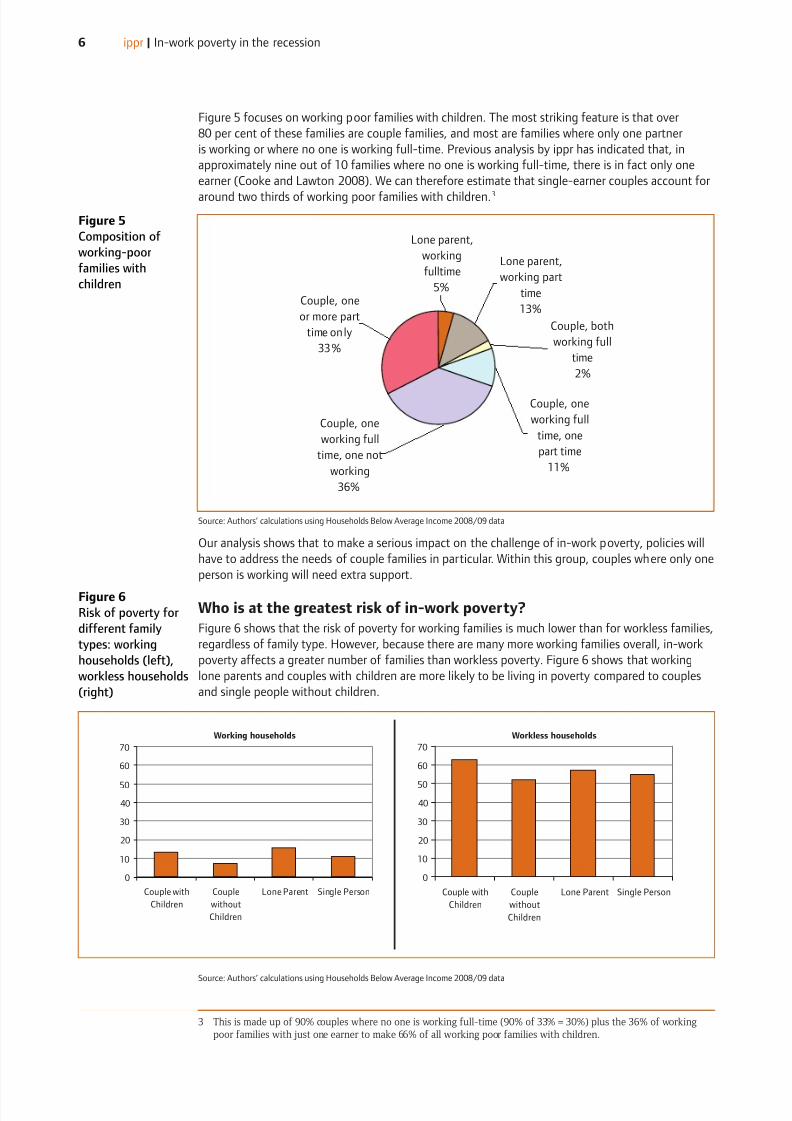
Figure 5 focuses on working poor families with children. The most striking feature is that over
80 per cent of these families are couple families, and most are families where only one partner
is working or where no one is working full-time. Previous analysis by ippr has indicated that, in
approximately nine out of 10 families where no one is working full-time, there is in fact only one
earner (Cooke and Lawton 2008). We can therefore estimate that single-earner couples account for
around two thirds of working poor families with children.3
Couple, one
or more part
time only
33%
Lone parent,
working
fulltime
5%
Lone parent,
working part
time
13%
Couple, one
working full
time, one
part time
11%
Couple, both
working full
time
2%
Couple, one
working full
time, one not
working
36%
Source: Authors’ calculations using Households Below Average Income 2008/09 data
Our analysis shows that to make a serious impact on the challenge of in-work poverty, policies will
have to address the needs of couple families in particular. Within this group, couples where only one
person is working will need extra support.
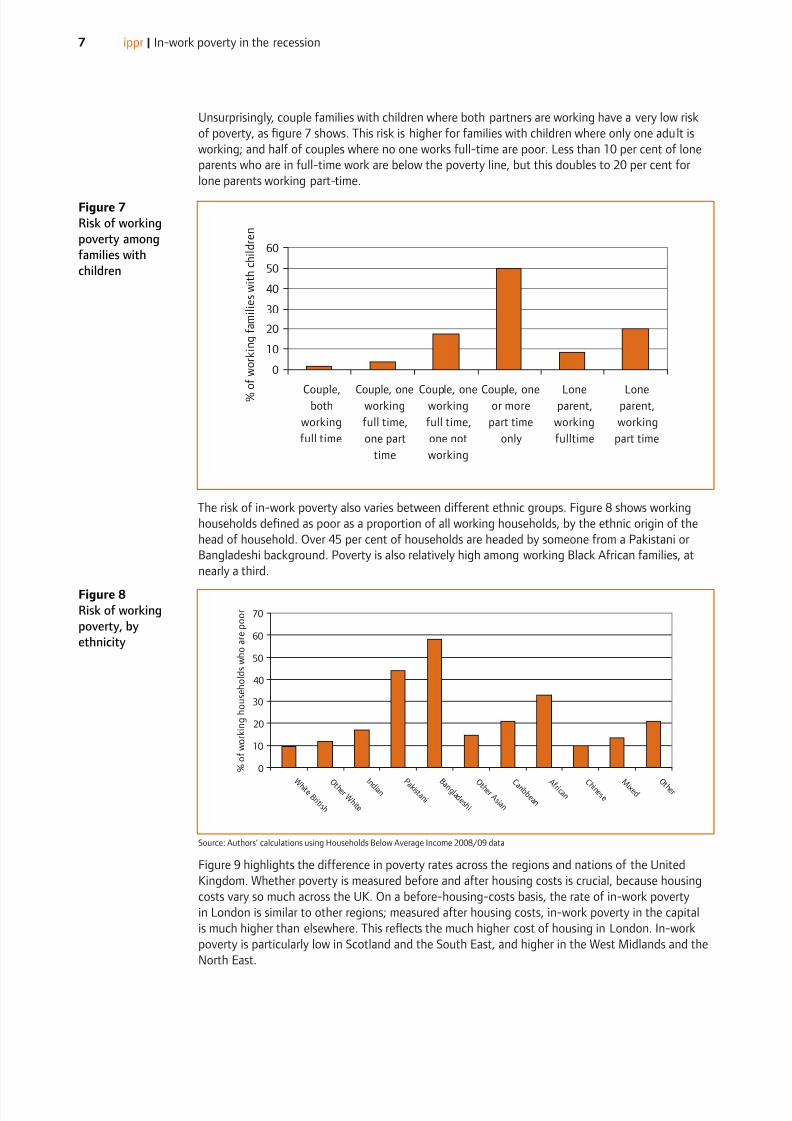
Who is at the greatest risk of in-work poverty?
Figure 6 shows that the risk of poverty for working families is much lower than for workless families,
regardless of family type. However, because there are many more working families overall, in-work
poverty affects a greater number of families than workless poverty. Figure 6 shows that working
lone parents and couples with children are more likely to be living in poverty compared to couples
and single people without children.
Source: Authors’ calculations using Households Below Average Income 2008/09 data
Thisismadeupof90%coupleswherenooneisworkingfull-time(90%of%=0%)plusthe6%ofworkingpoorfamilieswithjustoneearnertomake66%ofallworkingpoorfamilieswithchildren.
0
10
20
30
40
50
60
70
Couple with
Children
Couple
without
Children
Lone Parent Single Person
0
10
20
30
40
50
60
70
Couple with
Children
Couple
without
Children
Lone Parent Single Person
Figure
Composition of
working-poor
families with
children
Figure
Risk of poverty for
different family
types: working
households (left),
workless households
(right)
Working households Workless households
8/8/2019 In-work Poverty in the Recession - briefing paper
http://slidepdf.com/reader/full/in-work-poverty-in-the-recession-briefing-paper 8/12
ippr | In-work poverty in the recession
Unsurprisingly, couple families with children where both partners are working have a very low risk
of poverty, as gure 7 shows. This risk is higher for families with children where only one adult is
working; and half of couples where no one works full-time are poor. Less than 10 per cent of lone
parents who are in full-time work are below the poverty line, but this doubles to 20 per cent for
lone parents working part-time.
0
10
20
30
40
50
60
Couple,both
working
full time
Couple, oneworking
full time,
one part
time
Couple, oneworking
full time,
one not
working
Couple, oneor more
part time
only
Loneparent,
working
fulltime
Loneparent,
working
part time
%
o f w o r k i n g f a m i l i e s w i t h c h i l d r e n
The risk of in-work poverty also varies between different ethnic groups. Figure 8 shows working
households dened as poor as a proportion of all working households, by the ethnic origin of the
head of household. Over 45 per cent of households are headed by someone from a Pakistani or
Bangladeshi background. Poverty is also relatively high among working Black African families, at
nearly a third.
0
10
20
30
40
50
60
70
W h i t e B r i t i s h
O t h e r W h i t e
I n d i a n P a k i s t a n i
B a n g l a d e s h i
O t h e r A s i a n
C a r i b b e a n
A f r i c a n C h i n e s e
M i x e d O t h e r
%
o f w o r k i n g h o u s e h o l d s w h o a r e p o o r
Source: Authors’ calculations using Households Below Average Income 2008/09 data
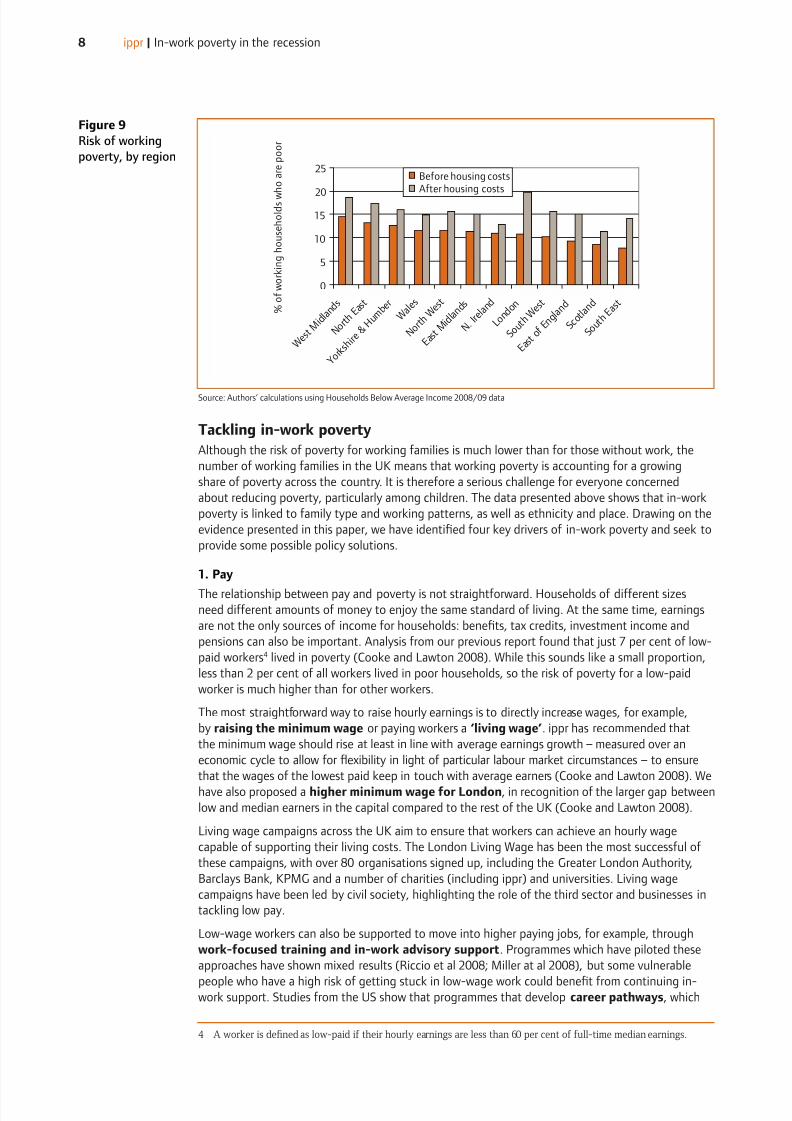
Figure 9 highlights the difference in poverty rates across the regions and nations of the United
Kingdom. Whether poverty is measured before and after housing costs is crucial, because housing
costs vary so much across the UK. On a before-housing-costs basis, the rate of in-work poverty
in London is similar to other regions; measured after housing costs, in-work poverty in the capital
is much higher than elsewhere. This reects the much higher cost of housing in London. In-work
poverty is particularly low in Scotland and the South East, and higher in the West Midlands and the
North East.
Figure 8
Risk of working
poverty, by
ethnicity
Figure
Risk of working
poverty among
families with
children
8/8/2019 In-work Poverty in the Recession - briefing paper
http://slidepdf.com/reader/full/in-work-poverty-in-the-recession-briefing-paper 9/12

8/8/2019 In-work Poverty in the Recession - briefing paper
http://slidepdf.com/reader/full/in-work-poverty-in-the-recession-briefing-paper 10/12
9 ippr | In-work poverty in the recession
link low-paid jobs to intermediate and higher level roles, can help low earners move up (Dresser
2007; Duke et al 2006). Providing advancement support can be complex and the results – in terms
of higher wages – may not be evident for many years.
Looking to the longer term, it seems there is unlikely to be a signicant reduction in employer
demand for low-wage, low-skill workers over the next two decades (Lawton 2009; UK Commission
for Employment and Skills 2010). We have argued for decisive action to address the balance
between low-wage and higher paying jobs in the UK, and particularly to tackle low pay in
sectors like retail, hospitality and care.
One way to do this would be to further integrate and decentralise employment, skills and
economic development. This would ensure that efforts to increase both employment and
workforce skills are joined up with strategies for enterprise and economic development, helping
to increase investment, innovation and skill utilisation alongside improvements in workforce skills
(Lawton 2009). The new Local Enterprise Partnerships would be an ideal vehicle for this work. The
UK could also benet from programmes that promote improvements in workplace performance
and productivity, drawing on successful programmes in the US and Europe (Lawton 2009).
. Working hours
Evidence presented above shows that in-work poverty is a higher risk among families where no
one is working full-time, so one way to address in-work poverty is to help low earners work longer
hours. Many low earners already do this; others nd it difcult because of other responsibilities, like
looking after children or elderly relatives. Some features of the Working Tax Credit (WTC), like the
30-hour credit, are designed to incentivise people on low wages to work longer hours.
Working more hours to compensate for low hourly earnings is not appropriate for everyone.
Some low earners have caring responsibilities that prevent them from working longer hours and
researchers have identied tensions between reducing income poverty at the expense of ‘time
poverty’ – meaning, for example, that parents could have less quality time with their children if
they are working longer (Burchardt 2008). Families have to make their own decisions about how
to achieve the right balance for them, but if low earners want to work more hours, they should be
provided with the right support.The provision of affordable and exible childcare has improved remarkably over the last decade,
yet many parents still nd it difcult to nd childcare that ts in with the hours they want to work.
Pilot programmes have shown that nancial assistance and in-work support can help lone
parents to increase their hours (Riccio et al 2008).
Some people’s working hours are limited by a health condition, and condition management
programmes and the entrenchment of exible working opportunities could help these workers
to raise their hours.
. Number of adults in work
Many low earners manage to avoid poverty by living with other people who work. For example,
young people starting out in their career in low-wage work can avoid poverty by living with their
working parents. Our analysis has found that the risk of in-work poverty falls signicantly for couple
families where both people work and is almost non-existent where both adults are working full-
time. However, this is not a realistic option for all families, for example, if one adult cannot work
full-time because of a disability or caring responsibilities.
Nevertheless, enabling other adults in a household to work would help couple families, who make
up the bulk of working poor families and have the greatest risk of poverty if they only have one
earner. This tactic has some of the same challenges as helping low earners increase their hours and
families may have to make trade-offs between extra income and time pressures. Again, exible,
affordable and accessible childcare and better exible working opportunities can be vital.
Another option would be to introduce an individual entitlement to the WTC so that partners have
a nancial incentive to move into work. Currently, tax credits are assessed on a household basis, so
that any extra earnings from a second earner are partially offset by the withdrawal of the WTC. Therst earner in a household can earn up to £123.46 a week before their entitlement to WTC starts to
be withdrawn, but no such ‘means-test free’ allowance exists for the second earner. This signicantly
lessens the nancial gain if the partner of a low earner moves into low-wage work themselves.
8/8/2019 In-work Poverty in the Recession - briefing paper
http://slidepdf.com/reader/full/in-work-poverty-in-the-recession-briefing-paper 11/12
0 ippr | In-work poverty in the recession
A Personalised Tax Credit Allowance (PCTA) would give all adults in eligible families their own
personal allowance, allowing them each to earn, for example, £123.46 before the family’s WTC
entitlement starts to be withdrawn. ippr’s calculations have shown that the introduction of a PCTA
would almost always benet the state as well as families, through higher tax receipts and lower
spending on other means-tested benets (Cooke and Lawton 2008). ippr has previously estimated
that around three-quarters of couples with children claiming WTC (about 560,000 families) haveonly one earner (Cooke and Lawton 2008).
The PCTA has the added benet of encouraging both partners to work, not necessarily both full-
time, rather than encouraging one partner to work longer hours. This makes it more likely that work
and care responsibilities would be spread across both partners rather than divided along gender
lines, as they often are currently. Improving work incentives always involves some ‘deadweight
costs’ where people are already doing what the incentive is trying to promote. Time-limiting the
PTCA or placing an upper family-earnings limit on eligibility would focus the incentive on the
lowest-income couples and reduce deadweight costs.
. Other sources of income
Low earners can avoid poverty by drawing on income from other sources. Usually, this involves
claiming benets and tax credits. People in work are entitled to universal benets like ChildBenet and some low earners can also claim means-tested benets like Housing Benets and WTC.
ippr has previously argued that the value of WTC should be increased by one-third to reect the
higher poverty line for couples (Cooke and Lawton 2008). Currently, couples and lone parents
are entitled to the same maximum amount of WTC. However, we recognise that this would be an
expensive change that would be difcult to prioritise at a time of very limited public expenditure
and likely cuts to welfare spending.
8/8/2019 In-work Poverty in the Recession - briefing paper
http://slidepdf.com/reader/full/in-work-poverty-in-the-recession-briefing-paper 12/12
ippr | In-work poverty in the recession
References
Browne J and Paull G (2010) Parents’ Work Entry, Progression and Retention, and Child Poverty,
DWP Research Report No 626 Norwich: HMSO
Cooke G and Lawton K (2008) Working Out of Poverty: A study of the low paid and ‘working poor’
London: ippr
Department for Work and Pensions (2010) 21st Century Welfare London: HMSO
Dresser L (2007) Stronger Ladders, Stronger Floors: The need for both supply and demand side
strategies to improve workers’ opportunities Wisconsin: Center on Wisconsin Strategy
Duke A-E, Martinson K and Strawn J (2006) Wising Up: How government can partner with business
to increase skills and advance low-wage workers Washington: Center for Law and Social Policy
Kenway P (2008) Addressing In-Work Poverty York: Joseph Rowntree Foundation
Lawton K (2009) Nice Work If You Can Get It: Achieving a sustainable solution to low pay and in-
work poverty London: ippr
Miller C, Bewley H, Campbell-Barr V, Dorsett R, Hamilton G, Hoggart L, Homonoff T, Marsh A, Ray
K, Riccio JA and Vegeris S (2008) Implementation and second-year impacts for New Deal 25Plus customers in the UK Employment Retention and Advancement (ERA) demonstration, DWP
Research Report No 520 Norwich: HMSO
Ofce for National Statistics (2010a) GDP and Unemployment: Current and previous recessions
compared www.statistics.gov.uk/cci/nugget.asp?id=2294, accessed 8 September 2010
Ofce for National Statistics (2010b) Labour Market Statistics http://www.statistics.gov.uk/
statbase/product.asp?vlnk=1944, accessed 8 September 2010
Ofce for National Statistics (2010c) Work and Worklessness Among Households 2010 – Statistical
Bulletin http://www.statistics.gov.uk/pdfdir/work0910.pdf , accesse/d 8 September 2010
Riccio JA, Bewley H, Campbell-Barr V, Dorsett R, Hamilton G, Hoggart L, Marsh A, Miller C, Ray
K and Vegeris S (2008) Implementation and Second-Year Impact for Lone Parents in the UK Employment Retention and Advancement (ERA) Demonstration, DWP Research Report No 489
Norwich: HMSO
UK Commission on Employment and Skills (2010) Skills for Jobs: Today and Tomorrow – The
National Strategic Skills Audit for England 2010 Wath-upon-Dearne: UK Commission for
Employment and Skills