poverty in the united states: 2001 - census.gov · poverty in the united states: 2001 demographic...
TRANSCRIPT
U S C E N S U S B U R E A UHelping You Make Informed Decisions •1902-2002
Issued September 2002
P60-219
Poverty in the United States: 2001
Demographic Programs
ByBernadette D. ProctorandJoseph Dalaker
A
U.S.Department of CommerceEconomics and Statistics Administration
U.S. CENSUS BUREAU
Current Population Reports
Consumer Income
P60
-21
9U
S C E N
S U S B
U R
E A U
Poverty
in th
e Un
ited States: 2
00
1 Cu
rren
t Pop
ula
tion
Rep
orts C
onsu
mer In
come
U.S. Department of CommerceEconomics and Statistics AdministrationU.S. CENSUS BUREAUWashington, DC 20233
OFFICIAL BUSINESS
Penalty for Private Use $300
FIRST-CLASS MAILPOSTAGE & FEES PAIDU.S. Census Bureau
Permit No. G-58

This report was prepared under the direction of John Iceland,Chief, Poverty and Health Statistics Branch. Katrina Wengert andAmanda Kohler provided statistical assistance. Charles T.Nelson, Assistant Division Chief for Income, Poverty, and HealthStatistics, Housing and Household Economic Statistics Division, pro-vided overall direction.
David Nguyen, Demographic Surveys Division, processed theCurrent Population Survey 2001 and 2002 Annual DemographicSupplement files. Caroline Carbaugh, Chief of the SurveyProcessing Branch, Jaime Hasiuk, Stacy Lyons, Mary ThriftBush, and Kirk Davis programmed the detailed tables and pro-duced the publication tables. Special thanks to Donna Benton forher assistance in programming the experimental poverty measures.
Tim J. Marshall, under the supervision of Greg Weyland,Demographic Surveys Division, prepared specifications for thecomputer-assisted interviewing instrument used to conduct theAnnual Demographic Supplement. Andrew M. Stevenson,Technologies Management Office, programmed the instrument.
Additional people within the Census Bureau also made significantcontributions to the preparation of this report. Kathleen S. Short,David Waddington, Elizabeth Gifford, Erika Steinmetz, QiWang, Shailesh Bhandari, and Larry Long reviewed the contents.
Sampling review was conducted by Jana Shepherd and Alfred G.Meier of Demographic Statistical Methods Division.
U.S. Census Bureau field representatives and telephone interviewerscollected the data. Without their dedication, the preparation of thisreport or any other report from the Current Population Survey wouldbe impossible.
Greg Carroll, Barbara M. Abbott, Jan Sweeney, Gloria Davis,and Mary Stinson of the Administrative and Customer ServicesDivision, Walter C. Odom, Chief, provided publications and print-ing management, graphics design and composition, and editorialreview for print and electronic media. General direction and produc-tion management were provided by Gary J. Lauffer, Chief,Publications Services Branch.
Acknowledgments

U.S. Department of CommerceDonald L. Evans,
Secretary
Samuel W. Bodman,Deputy Secretary
Economics and Statistics AdministrationKathleen B. Cooper,
Under Secretary for Economic Affairs
U.S. CENSUS BUREAUCharles Louis Kincannon,
Director
Poverty in theUnited States: 2001
P60-219
Issued September 2002
Suggested Citation
Proctor, Bernadette D. and Joseph Dalaker, U.S. Census Bureau,
Current Population Reports, P60-219,Poverty in the United States: 2001,
U.S. Government Printing Office,Washington, DC,
2002.
ECONOMICS
AND STATISTICS
ADMINISTRATION
Economics and StatisticsAdministration
Kathleen B. Cooper,Under Secretary for Economic Affairs
U.S. CENSUS BUREAU
Charles Louis Kincannon,Director
William G. Barron, Jr.Deputy Director
Vacant,Principal Associate Director for Programs
Nancy M. Gordon,Associate Director for Demographic Programs
Daniel H. Weinberg,Chief, Housing and Household EconomicStatistics Division
For sale by the Superintendent of Documents, U.S. Government Printing Office,
Internet: bookstore.gpo.gov Phone: toll free 866-512-1800; DC area 202-512-1800
Fax: 202-512-2250 Mail: Stop SSOP, Washington, DC 20402-0001.
U.S. Census Bureau Poverty in the United States: 2001 iii
TEXT
Poverty in the United States: 2001 . . . . . . . . . . . . . . . . . . . . . . . . . 1Introduction . . . . . . . . . . . . . . . . . . . . . . . . . . . . . . . . . . . . . . 1Highlights . . . . . . . . . . . . . . . . . . . . . . . . . . . . . . . . . . . . . . . . 1New Population Controls and Expanded Sample . . . . . . . . . . . . 1
Poverty in the United States . . . . . . . . . . . . . . . . . . . . . . . . . . . 2Age . . . . . . . . . . . . . . . . . . . . . . . . . . . . . . . . . . . . . . . . . 4Race and Hispanic Origin . . . . . . . . . . . . . . . . . . . . . . . . . . 4The Official Measure of Poverty . . . . . . . . . . . . . . . . . . . . . 5Nativity . . . . . . . . . . . . . . . . . . . . . . . . . . . . . . . . . . . . . . . 6Families and Unrelated Individuals . . . . . . . . . . . . . . . . . . . 6Work Experience . . . . . . . . . . . . . . . . . . . . . . . . . . . . . . . . 7Region . . . . . . . . . . . . . . . . . . . . . . . . . . . . . . . . . . . . . . . 8Residence . . . . . . . . . . . . . . . . . . . . . . . . . . . . . . . . . . . . . 8State Poverty Data . . . . . . . . . . . . . . . . . . . . . . . . . . . . . . . 9Interpreting State Poverty Data . . . . . . . . . . . . . . . . . . . . . . 9
Depth of Poverty Measures . . . . . . . . . . . . . . . . . . . . . . . . . . . 9Ratio of Income to Poverty Level . . . . . . . . . . . . . . . . . . . . 9Income Deficit . . . . . . . . . . . . . . . . . . . . . . . . . . . . . . . . . . 11Example: “Depth of Poverty” Measures . . . . . . . . . . . . . . . . 12
Experimental Poverty Measures . . . . . . . . . . . . . . . . . . . . . . . . 13Official and Experimental Poverty Measures:
How Do They Differ? . . . . . . . . . . . . . . . . . . . . . . . . . . . . 14
Notes, Additional Data, and Users’ Comments . . . . . . . . . . . . . . 19CPS Data Collection . . . . . . . . . . . . . . . . . . . . . . . . . . . . . . 19Small Area Income and Poverty Estimates . . . . . . . . . . . . . . 20Additional Data and Contacts . . . . . . . . . . . . . . . . . . . . . . . 20Comments . . . . . . . . . . . . . . . . . . . . . . . . . . . . . . . . . . . . 20
TEXT TABLES
1. People and Families in Poverty by SelectedCharacteristics: 2000 and 2001 . . . . . . . . . . . . . . . . . . . . . . 3
2. Number of Poor and Poverty Rate by Race and Hispanic Origin: 1999, 2000, and 2001 . . . . . . . . . . . . . . . . . . . . . . . 7
3. Work Experience During the Year for People 16 Years Old and Over: 2001 . . . . . . . . . . . . . . . . . . . . . . . . 8
4. Percent of People in Poverty by State: 1999,2000, and 2001 . . . . . . . . . . . . . . . . . . . . . . . . . . . . . . . . . . 10
5. Ratio of Family Income to Poverty Threshold for People by Selected Characteristics: 2001 . . . . . . . . . . . . . . . . 12
6. Income Deficit or Surplus of Families and Unrelated Individuals by Poverty Status: 2001 . . . . . . . . . . . . . . . . . . . . 13
7. Experimental Poverty Measures: 1999 to 2001 . . . . . . . . . . . . . 158. Experimental Poverty Measures by Selected
Characteristics: 2001 . . . . . . . . . . . . . . . . . . . . . . . . . . . . . . . 16
Contents
iv Poverty in the United States: 2001 U.S. Census Bureau
FIGURES
1. Number of Poor and Poverty Rate: 1959 to 2001 . . . . . . . . . . . . . . . . . . . . . . . . . . . . . 22. Poverty Rates by Age: 1959 to 2001 . . . . . . . . . . . . . . . . . . . . . . . . . . . . . . . . . . . . . . 43. Poverty Rates by Race and Hispanic Origin: 1959 to 2001 . . . . . . . . . . . . . . . . . . . . . . 64. Poverty Rates of People in Families by Family Type and Presence of Workers: 2001 . . . . 85. States With Significant Changes in 2-Year-Average
Poverty Rates: 1999-2000 to 2000-01 . . . . . . . . . . . . . . . . . . . . . . . . . . . . . . . . . . . 116. Experimental Poverty Rates for Individuals by Type of Family: 2001 . . . . . . . . . . . . . . . 177. Experimental Poverty Rates by Age: 2001 . . . . . . . . . . . . . . . . . . . . . . . . . . . . . . . . . . 188. Experimental Poverty Rates by Race and Hispanic Origin: 2001 . . . . . . . . . . . . . . . . . . 19
APPENDIXES
A. Time Series Poverty Estimates . . . . . . . . . . . . . . . . . . . . . . . . . . . . . . . . . . . . . . . . . . . 21A-1. Poverty Status of People by Family Relationship,
Race, and Hispanic Origin: 1959 to 2001 . . . . . . . . . . . . . . . . . . . . . . . . . . . . . 21A-2. Poverty Status of People by Age, Race, and Hispanic Origin: 1959 to 2001 . . . . . . 26A-3. Poverty Status of Families by Type of Family: 1959 to 2001 . . . . . . . . . . . . . . . . . 31
B. Sample Expansion and Introduction of Census 2000-Based Population Controls . . . . . . . 32Introduction . . . . . . . . . . . . . . . . . . . . . . . . . . . . . . . . . . . . . . . . . . . . . . . . . . . . . . . . 32CPS Sample Expansion: Effects on Poverty Data . . . . . . . . . . . . . . . . . . . . . . . . . . . . . . 32Census 2000 Population Controls: Effects on Poverty Data . . . . . . . . . . . . . . . . . . . . . . 32B-1. Effect of CPS Sample Expansion on Estimates of People and Families
in Poverty: 2000 . . . . . . . . . . . . . . . . . . . . . . . . . . . . . . . . . . . . . . . . . . . . . . . 33B-2. Number of Poor and Poverty Rate by State: 2000 . . . . . . . . . . . . . . . . . . . . . . . . 34B-3. People and Families in Poverty in 2000, Estimated With Census 2000-Based
and 1990-Based Population Controls . . . . . . . . . . . . . . . . . . . . . . . . . . . . . . . . 35

INTRODUCTION
Poverty data offer an importantway to evaluate the nation’s eco-nomic well-being. Because poorpeople in the United States are toodiverse to be characterized alongany one dimension, this reportillustrates how poverty rates varyby selected characteristics—age,race and Hispanic origin, nativity,family composition, work experi-ence, and geography. These datareveal how many people were poorand how the poverty populationhas changed. A description of theofficial measure of poverty may befound on page 5.
Whether one is in poverty or notprovides but one perspective oneconomic well-being. This reportdiscusses as well the extent ofpoverty (page 9) and more compre-hensive experimental measures of
poverty that account for noncashbenefits (such as food stamps) andtaxes (such as the Earned IncomeCredit) in income (page 13).
The estimates in this report arebased on interviewing a sample ofthe population. Respondents pro-vide answers to the best of theirability, but as with all surveys, theestimates may differ from the actu-al values.
HIGHLIGHTS
• The poverty rate in 2001 was11.7 percent, up from 11.3 per-cent in 2000.
• In 2001, people below thepoverty thresholds numbered32.9 million, a figure 1.3 millionhigher than the 31.6 millionpoor in 2000.
• At 16.3 percent, the povertyrate for children remained
higher than that of other agegroups, but did not changebetween 2000 and 2001.
• For people 18 to 64 years old,the poverty rate rose to 10.1 percent in 2001, up from9.6 percent in 2000.
• In 2001, there were 6.8 millionpoor families (9.2 percent), upfrom 6.4 million (8.7 percent) in2000.
• For non-Hispanic Whites, thepoverty rate rose between 2000and 2001 (from 7.4 percent to7.8 percent), as did the numberwho were poor (from 14.4 mil-lion to 15.3 million). Povertyrates for Blacks, Hispanics, andAsians and Pacific Islanders didnot change between 2000 and2001. However, the number ofpoor Hispanics rose to
U.S. Census Bureau Poverty in the United States: 2001 1
Poverty in the United States: 2001
The estimates in this report are based on the 2000,2001, and 2002 Current Population Survey AnnualDemographic Supplements (CPS ADS) and provideinformation for calendar years 1999, 2000, and 2001,respectively. These estimates use population esti-mates based on Census 2000. Earlier reports present-ing data for calendar years 1993 through 2000 usedpopulation estimates based on the 1990 census.
In 2001, the Census Bureau tested a sample expan-sion of 28,000 households to the CPS ADS. Thesample expansion was officially implemented in theestimates presented here. It is primarily designed toimprove the reliability of state estimates of children’shealth insurance coverage, but the larger samplesize also improves the reliability of national esti-mates of other topics.
Because results presented in this report from the 2001survey have been recalculated based on the expandedsample and the Census 2000-based weights, they maydiffer slightly from earlier estimates that did not incor-porate the sample expansion and were based on the1990 census. Appendix B presents more detail on theintroduction of the sample expansion and new popula-tion controls based on Census 2000.
All statements in this report have undergone statisticaltesting, and all comparisons are significant at the 90-percent confidence level. Further information onthe source and accuracy of the estimates is at www.census.gov/hhes/poverty/poverty01/pov01src.pdf.
NEW POPULATION CONTROLS AND EXPANDED SAMPLE
8.0 million in 2001, up from 7.7million in 2000.1
• The poverty rate in the Southincreased from 12.8 percent in2000 to 13.5 percent in 2001.The poverty rates in theNortheast, Midwest, and Westdid not change.
• The poverty rate for people liv-ing in the suburbs rose from 7.8 percent in 2000 to 8.2 per-cent in 2001; the poverty rate
did not change in central citiesor in nonmetropolitan areas.2
• How poverty is measured affectsone’s perception of who is poor.Six experimental measuresshowed lower poverty rates forchildren, Blacks, and people infemale-householder families thanunder the official measure, whilepoverty rates for those 65 andover varied greatly according tohow medical expenses weretaken into account.
• Four of six experimental povertymeasures showed an increase inthe poverty rate from 2000 to2001, while two showed nochange.
POVERTY IN THE UNITED STATES
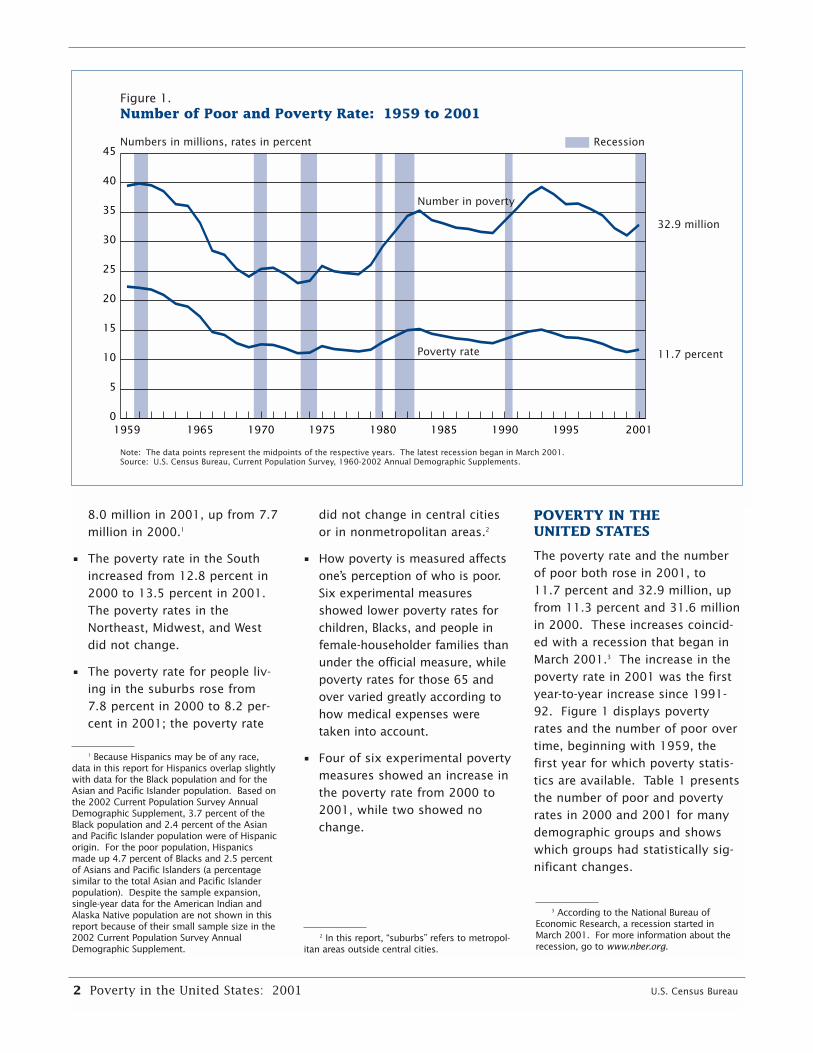
The poverty rate and the numberof poor both rose in 2001, to 11.7 percent and 32.9 million, upfrom 11.3 percent and 31.6 millionin 2000. These increases coincid-ed with a recession that began inMarch 2001.3 The increase in thepoverty rate in 2001 was the firstyear-to-year increase since 1991-92. Figure 1 displays povertyrates and the number of poor overtime, beginning with 1959, thefirst year for which poverty statis-tics are available. Table 1 presentsthe number of poor and povertyrates in 2000 and 2001 for manydemographic groups and showswhich groups had statistically sig-nificant changes.
2 Poverty in the United States: 2001 U.S. Census Bureau
Figure 1.Number of Poor and Poverty Rate: 1959 to 2001
Note: The data points represent the midpoints of the respective years. The latest recession began in March 2001. Source: U.S. Census Bureau, Current Population Survey, 1960-2002 Annual Demographic Supplements.
Numbers in millions, rates in percent
0
5
10
15
20
25
30
35
40
45
2001 19951990198519801975197019651959
Recession
32.9 million
11.7 percent
Number in poverty
Poverty rate
2 In this report, “suburbs” refers to metropol-itan areas outside central cities.
1 Because Hispanics may be of any race,data in this report for Hispanics overlap slightlywith data for the Black population and for theAsian and Pacific Islander population. Based onthe 2002 Current Population Survey AnnualDemographic Supplement, 3.7 percent of theBlack population and 2.4 percent of the Asianand Pacific Islander population were of Hispanicorigin. For the poor population, Hispanicsmade up 4.7 percent of Blacks and 2.5 percentof Asians and Pacific Islanders (a percentagesimilar to the total Asian and Pacific Islanderpopulation). Despite the sample expansion,single-year data for the American Indian andAlaska Native population are not shown in thisreport because of their small sample size in the2002 Current Population Survey AnnualDemographic Supplement.
3 According to the National Bureau ofEconomic Research, a recession started inMarch 2001. For more information about therecession, go to www.nber.org.

U.S. Census Bureau Poverty in the United States: 2001 3
Table 1.People and Families in Poverty by Selected Characteristics: 2000 and 2001(Numbers in thousands)
Characteristic
2001 below poverty 2000 below poverty1 Difference (2001 minus 2000)2
Number
90-percentC.I. (±) Percent
90-percentC.I. (±) Number
90-percentC.I. (±) Percent
90-percentC.I. (±) Number
90-percentC.I. (±) Percent
90-percentC.I. (±)
PEOPLE
Total . . . . . . . . . . . . . . . . . . 32,907 644 11.7 0.2 31,581 633 11.3 0.2 *1,325 669 *0.4 0.2
Family StatusIn families . . . . . . . . . . . . . . . . 23,215 551 9.9 0.2 22,347 542 9.6 0.2 *868 623 *0.3 0.3
Householder . . . . . . . . . . . . 6,813 172 9.2 0.2 6,400 165 8.7 0.2 *413 192 *0.5 0.3Related children under 18 . . 11,175 323 15.8 0.5 11,005 321 15.6 0.5 170 367 0.1 0.5
Related children under 6 . . 4,188 207 18.2 1.0 4,066 204 17.8 0.9 121 235 0.4 1.1In unrelated subfamilies . . . . . . 466 82 39.8 7.6 581 45 41.2 3.7 *-116 78 –1.4 7.2
Reference person . . . . . . . . 172 50 36.4 11.4 223 27 39.0 5.6 *-50 48 –2.7 10.8Children under 18 . . . . . . . . 292 57 44.6 9.8 348 62 43.7 8.8 –57 68 0.9 10.6
Unrelated individual . . . . . . . . . 9,226 207 19.9 0.5 8,653 199 19.0 0.5 *573 213 *0.9 0.5Male . . . . . . . . . . . . . . . . . . 3,833 122 17.3 0.6 3,426 115 15.7 0.6 *407 124 *1.6 0.6Female . . . . . . . . . . . . . . . . 5,393 149 22.3 0.7 5,227 146 22.0 0.7 *165 155 0.3 0.7
Race3 and Hispanic OriginWhite . . . . . . . . . . . . . . . . . . . 22,739 546 9.9 0.2 21,645 534 9.5 0.2 *1,094 616 *0.4 0.3
Non-Hispanic . . . . . . . . . . . . 15,271 454 7.8 0.2 14,366 441 7.4 0.2 *905 511 *0.4 0.3Black . . . . . . . . . . . . . . . . . . . 8,136 300 22.7 0.8 7,982 297 22.5 0.8 154 313 0.1 0.9Asian and Pacific Islander . . . . 1,275 129 10.2 1.0 1,258 129 9.9 1.0 17 135 0.3 1.1Hispanic4 . . . . . . . . . . . . . . . . 7,997 300 21.4 0.8 7,747 295 21.5 0.8 *250 249 –0.1 0.7
AgeUnder 18 years . . . . . . . . . . . . 11,733 329 16.3 0.5 11,587 328 16.2 0.5 146 344 0.1 0.518 to 64 years. . . . . . . . . . . . . 17,760 483 10.1 0.3 16,671 469 9.6 0.3 *1,089 500 *0.5 0.365 years and over . . . . . . . . . . 3,414 129 10.1 0.4 3,323 127 9.9 0.4 91 134 0.2 0.4
NativityNative. . . . . . . . . . . . . . . . . . . 27,698 597 11.1 0.2 26,680 587 10.8 0.2 *1,018 621 *0.3 0.3Foreign born . . . . . . . . . . . . . . 5,209 308 16.1 1.0 4,901 299 15.4 0.9 307 319 0.6 1.0
Naturalized citizen . . . . . . . . 1,186 148 9.9 1.2 1,060 140 9.0 1.2 126 151 0.9 1.3Not a citizen . . . . . . . . . . . . 4,023 271 19.7 1.3 3,841 265 19.2 1.3 181 281 0.5 1.4
RegionNortheast . . . . . . . . . . . . . . . . 5,687 266 10.7 0.5 5,474 261 10.3 0.5 212 277 0.4 0.5Midwest . . . . . . . . . . . . . . . . . 5,966 278 9.4 0.4 5,916 274 9.3 0.4 50 290 - 0.5South . . . . . . . . . . . . . . . . . . . 13,515 458 13.5 0.5 12,705 444 12.8 0.5 *810 473 *0.7 0.5West. . . . . . . . . . . . . . . . . . . . 7,739 364 12.1 0.6 7,485 358 11.8 0.6 254 379 0.2 0.6
ResidenceInside metropolitan areas. . . . . 25,446 575 11.1 0.3 24,603 566 10.8 0.3 *843 598 *0.3 0.3
Inside central cities . . . . . . . 13,394 427 16.5 0.5 13,257 425 16.3 0.5 137 447 0.2 0.6Outside central cities . . . . . . 12,052 406 8.2 0.3 11,346 394 7.8 0.3 *706 420 *0.4 0.3
Outside metropolitan areas . . . 7,460 394 14.2 0.8 6,978 382 13.4 0.7 *482 407 0.8 0.8
FAMILIES
Total . . . . . . . . . . . . . . . . . . 6,813 172 9.2 0.2 6,400 165 8.7 0.2 *413 192 *0.5 0.3White . . . . . . . . . . . . . . . . . . . 4,579 135 7.4 0.2 4,333 131 7.1 0.2 *246 158 *0.4 0.3
Non-Hispanic . . . . . . . . . . . . 3,051 108 5.7 0.2 2,896 105 5.4 0.2 *155 125 *0.3 0.2Black . . . . . . . . . . . . . . . . . . . 1,829 81 20.7 1.0 1,686 78 19.3 0.9 *144 91 *1.4 1.1Asian and Pacific Islander . . . . 234 28 7.8 1.0 233 28 7.8 1.0 - 32 - 1.1Hispanic4 . . . . . . . . . . . . . . . . 1,649 77 19.4 0.9 1,540 74 19.2 1.0 *109 72 0.2 0.9
Type of FamilyMarried-couple . . . . . . . . . . . . 2,760 102 4.9 0.2 2,637 99 4.7 0.2 *124 115 *0.2 0.2
White . . . . . . . . . . . . . . . . . 2,242 91 4.5 0.2 2,181 89 4.4 0.2 61 107 0.1 0.2Non-Hispanic.. . . . . . . . . . 1,477 73 3.3 0.2 1,435 72 3.2 0.2 42 85 0.1 0.2
Black. . . . . . . . . . . . . . . . . . 328 33 7.8 0.8 266 30 6.3 0.7 *62 36 *1.4 0.9Asian and Pacific Islander . . 156 23 6.6 1.0 142 22 5.9 0.9 13 26 0.7 1.1Hispanic4. . . . . . . . . . . . . . . 799 53 13.8 0.9 772 52 14.2 1.0 26 50 –0.4 0.9
Female householder, nohusband present . . . . . . . . . . 3,470 116 26.4 1.0 3,278 112 25.4 0.9 *191 130 1.0 1.1White . . . . . . . . . . . . . . . . . 1,939 84 22.4 1.1 1,820 81 21.2 1.0 *118 98 1.2 1.2
Non-Hispanic . . . . . . . . . . 1,305 68 19.0 1.1 1,226 66 17.8 1.0 *80 79 1.2 1.2Black. . . . . . . . . . . . . . . . . . 1,351 69 35.2 2.0 1,300 68 34.3 2.0 51 78 0.9 2.3Asian and Pacific Islander . . 61 14 14.6 3.6 81 16 22.2 5.0 *-20 18 *-7.6 5.1Hispanic4. . . . . . . . . . . . . . . 711 50 37.0 2.9 664 48 36.4 3.0 *47 46 0.6 2.8
Male householder, nowife present . . . . . . . . . . . . . 583 45 13.1 1.1 485 41 11.3 1.0 *98 49 *1.8 1.2White . . . . . . . . . . . . . . . . . 398 37 11.7 1.1 332 34 10.1 1.1 *66 42 *1.6 1.3
Non-Hispanic . . . . . . . . . . 270 30 10.3 1.2 236 28 9.2 1.2 34 35 1.1 1.4Black. . . . . . . . . . . . . . . . . . 150 23 19.4 3.1 120 20 16.3 3.0 *31 24 3.1 3.5Asian and Pacific Islander . . 17 8 9.1 4.2 10 6 5.4 3.1 7 8 3.7 4.2Hispanic4. . . . . . . . . . . . . . . 139 22 17.0 2.9 104 19 13.6 2.6 *35 19 *3.5 2.6
-Represents zero. *Statistically significant at the 90-percent confidence level.For explanation of confidence intervals (C.I.), see ‘‘Standard errors and their use’’ at www.census.gov/hhes/poverty/poverty01/pov01src.pdf.1Consistent with 2001 data through implementation of Census 2000-based population controls and a 28,000 household sample expansion.2As a result of rounding, some differences may appear to be slightly higher or lower than the differences of the reported rates.3Data for American Indians and Alaska Natives are not shown separately in this table because of the small sample of that population.4Hispanics may be of any race.
Source: U.S. Census Bureau, Current Population Survey, 2001 and 2002 Annual Demographic Supplements.

Age
In 2001, the poverty rate for allchildren under 18 years of age was16.3 percent, higher than the ratesfor people 18 to 64 years old and65 and over (10.1 percent for each).People 18 to 64 years old account-ed for most of the net changebetween 2000 and 2001; both theirnumber of poor and poverty rateincreased (17.8 million and 10.1 percent in 2001, up from 16.7 million and 9.6 percent in2000).
In 2001, 11.7 million children, or16.3 percent, were poor. Childrenrepresent a disproportionate shareof the poor (35.7 percent) as theyare only one-fourth (25.6 percent)of the total population. However,their poverty rate and number ofpoor were unchanged from 2000.
Children under 6 have been partic-ularly vulnerable to poverty. In2001, the poverty rate for related
children under 6 years of age was18.2 percent, unchanged from2000. Of children under 6 living infamilies with a female householder,no spouse present, 48.9 percentwere poor, over five times the rateof their counterparts in married-couple families (9.2 percent).
Race and Hispanic Origin
In 2001, the poverty rate was 7.8 percent for non-Hispanic Whites,22.7 percent for Blacks, and 10.2 percent for Asians and PacificIslanders. For Hispanics (who maybe of any race), the poverty rate was21.4 percent.4 Non-Hispanic Whitesshowed increases in both the
number of poor and poverty rate:15.3 million non-Hispanic Whites, or7.8 percent, were poor in 2001, upfrom 14.4 million and 7.4 percent in2000, respectively. Even though thepoverty rate for non-Hispanic Whiteswas lower than that for the otherracial and ethnic groups, 46.4 per-cent of the poor were non-HispanicWhite. Non-Hispanic Whites togetherwith Hispanic Whites made up abouttwo-thirds of the poor (69.1 percent).
The poverty rate for Blacks in 2001,22.7 percent, did not change from2000 and also was not differentfrom the lowest ever measured (in2000 and 1999); however, thepoverty rate for Blacks remainedhigher than the rates for people ofother racial and ethnic groups in2001.5
4 Poverty in the United States: 2001 U.S. Census Bureau
Figure 2.Poverty Rates by Age: 1959 to 2001
Note: The data points represent the midpoints of the respective years. The latest recession began in March 2001. Data for people 18 to 64 and 65 and older are not available from 1960 to 1965. Source: U.S. Census Bureau, Current Population Survey, 1960-2002 Annual Demographic Supplements.
Percent
0
5
10
15
20
25
30
35
40
45
2001 19951990198519801975197019651959
Recession
10.1 percent10.1 percent
16.3 percent
65 years and over
Under 18 years
18 to 64 years
4 Data users should exercise caution wheninterpreting aggregate results for both theHispanic population and Asian and PacificIslander (API) population because these popula-tions consist of many distinct groups that differin socio-economic characteristics, culture, andrecency of immigration. In addition, the CPSdoes not use separate population controls forweighting the API sample to national totals. Forfurther information, seewww.bls.census.gov/cps/ads/adsmain.htm.
5 Poverty data are available for Blacks begin-ning with 1959, for Hispanics in 1972, for non-Hispanic Whites in 1973, and Asians and PacificIslanders in 1987.
U.S. Census Bureau Poverty in the United States: 2001 5
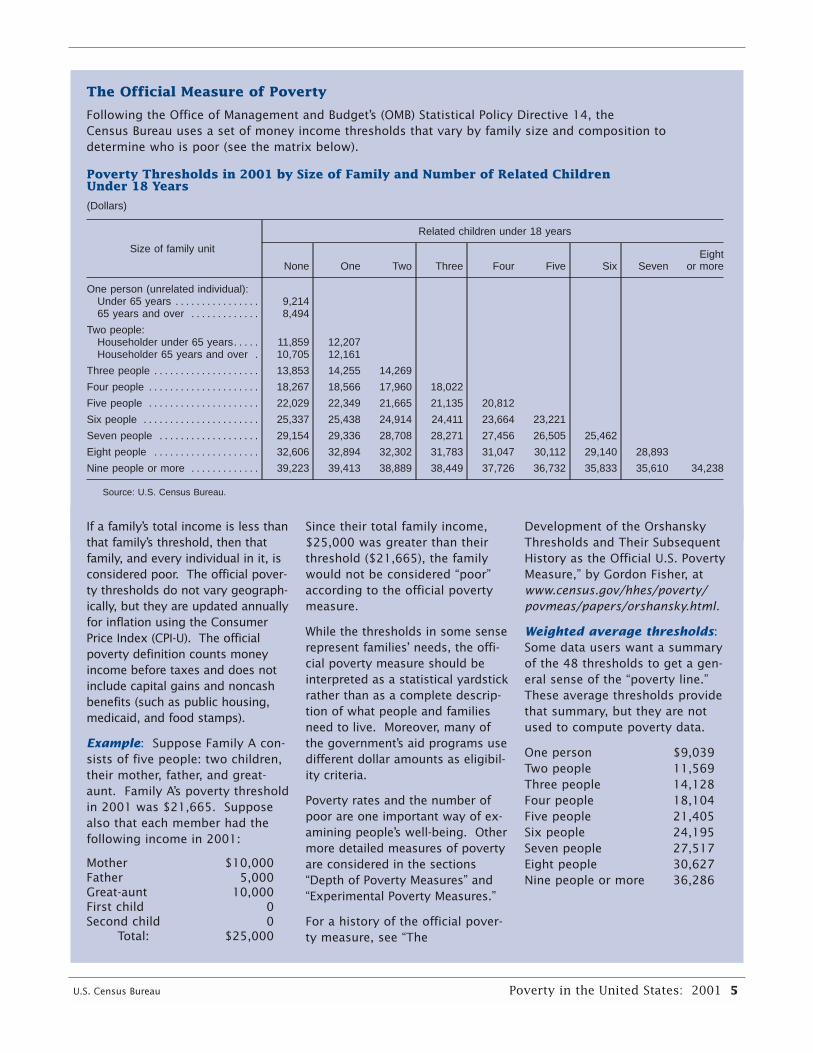
The Official Measure of Poverty
Following the Office of Management and Budget’s (OMB) Statistical Policy Directive 14, the Census Bureau uses a set of money income thresholds that vary by family size and composition to determine who is poor (see the matrix below).
Poverty Thresholds in 2001 by Size of Family and Number of Related ChildrenUnder 18 Years
(Dollars)
Size of family unit
Related children under 18 years
None One Two Three Four Five Six SevenEight
or more
One person (unrelated individual):Under 65 years . . . . . . . . . . . . . . . . 9,21465 years and over . . . . . . . . . . . . . 8,494
Two people:Householder under 65 years. . . . . 11,859 12,207Householder 65 years and over . 10,705 12,161
Three people . . . . . . . . . . . . . . . . . . . . 13,853 14,255 14,269
Four people . . . . . . . . . . . . . . . . . . . . . 18,267 18,566 17,960 18,022
Five people . . . . . . . . . . . . . . . . . . . . . 22,029 22,349 21,665 21,135 20,812
Six people . . . . . . . . . . . . . . . . . . . . . . 25,337 25,438 24,914 24,411 23,664 23,221
Seven people . . . . . . . . . . . . . . . . . . . 29,154 29,336 28,708 28,271 27,456 26,505 25,462
Eight people . . . . . . . . . . . . . . . . . . . . 32,606 32,894 32,302 31,783 31,047 30,112 29,140 28,893
Nine people or more . . . . . . . . . . . . . 39,223 39,413 38,889 38,449 37,726 36,732 35,833 35,610 34,238
Source: U.S. Census Bureau.
If a family’s total income is less thanthat family’s threshold, then thatfamily, and every individual in it, isconsidered poor. The official pover-ty thresholds do not vary geograph-ically, but they are updated annuallyfor inflation using the ConsumerPrice Index (CPI-U). The officialpoverty definition counts moneyincome before taxes and does notinclude capital gains and noncashbenefits (such as public housing,medicaid, and food stamps).
Example: Suppose Family A con-sists of five people: two children,their mother, father, and great-aunt. Family A’s poverty thresholdin 2001 was $21,665. Supposealso that each member had thefollowing income in 2001:
Mother $10,000Father 5,000Great-aunt 10,000First child 0Second child 0
Total: $25,000
Since their total family income,$25,000 was greater than theirthreshold ($21,665), the familywould not be considered “poor”according to the official povertymeasure.
While the thresholds in some senserepresent families’ needs, the offi-cial poverty measure should beinterpreted as a statistical yardstickrather than as a complete descrip-tion of what people and familiesneed to live. Moreover, many ofthe government’s aid programs usedifferent dollar amounts as eligibil-ity criteria.
Poverty rates and the number ofpoor are one important way of ex-amining people’s well-being. Othermore detailed measures of povertyare considered in the sections“Depth of Poverty Measures” and“Experimental Poverty Measures.”
For a history of the official pover-ty measure, see “The
Development of the OrshanskyThresholds and Their SubsequentHistory as the Official U.S. PovertyMeasure,” by Gordon Fisher, atwww.census.gov/hhes/poverty/povmeas/papers/orshansky.html.
Weighted average thresholds:Some data users want a summaryof the 48 thresholds to get a gen-eral sense of the “poverty line.”These average thresholds providethat summary, but they are notused to compute poverty data.
One person $9,039Two people 11,569Three people 14,128Four people 18,104Five people 21,405Six people 24,195Seven people 27,517Eight people 30,627Nine people or more 36,286

Despite its recent expansion to78,000 households nationwide, theAnnual Demographic Supplement tothe Current Population Survey is notlarge enough to produce reliableannual estimates for AmericanIndians and Alaska Natives. How-ever, Table 2 displays 3-year aver-ages of the number of poor Amer-ican Indians and Alaska Natives andtheir 3-year-average poverty rateand provides 3-year-average povertystatistics for the other groups forcomparison.6 For 1999-2001, thepoverty rate for American Indiansand Alaska Natives was 24.5 per-cent, with 0.8 million poor. Thispoverty rate was higher than thepoverty rates for non-Hispanic
Whites, Asians and Pacific Islanders,and Hispanics, but not differentfrom the rate for Blacks. AmericanIndians and Alaska Natives were theonly group to show a decline whenthe 2000-2001 average was com-pared with 1999-2000.
Nativity
The foreign born experienced nochange in their poverty rate or num-ber of poor between 2000 and2001 (16.1 percent, or 5.2 million,were poor in 2001). Of the foreign-born population, three in eight (36.9percent) were naturalized citizens,and the rest were non-citizens.7
While the poverty rate for the for-eign-born population as a wholewas higher than the rate for thenative population (11.1 percent), therate for foreign-born naturalized citi-zens (9.9 percent) was lower thanthe rate for natives.
Among naturalized citizens, boththe poverty rate (9.9 percent) andnumber of poor in 2001 (1.2 mil-lion) were unchanged from 2000.Among noncitizens, 4.0 million, or19.7 percent, were poor in 2001,also unchanged from 2000. Thenative population, however, hadincreases from 2000 to 2001 inboth their poverty rate (from 10.8 percent to 11.1 percent) andnumber of poor (from 26.7 millionto 27.7 million).
Families and UnrelatedIndividuals
The poverty rate for familiesincreased to 9.2 percent in 2001,up from the 26-year-low measured
6 Poverty in the United States: 2001 U.S. Census Bureau
Figure 3.Poverty Rates by Race and Hispanic Origin: 1959 to 2001
Note: The data points represent the midpoints of the respective years. The latest recession began in March 2001. Data for Blacks are not available from 1960 to 1965. Data for the other race and Hispanic origin groups are shown from the first year available. Hispanics may be of any race. Source: U.S. Census Bureau, Current Population Survey, 1960-2002 Annual Demographic Supplements.
Percent
0
5
10
15
20
25
30
35
40
45
50
55
60
2001 19951990198519801975197019651959
Recession
10.2 percent9.9 percent7.8 percent
22.7 percent21.4 percent
Black
Hispanic
White
Asian and Pacific Islander
Non-Hispanic White
6 Data users should exercise caution wheninterpreting aggregate results American Indiansand Alaska Natives (AIAN) because the AIANpopulation consist of groups that differ in eco-nomic characteristics. The CPS does not useseparate population controls for weighting theAIAN sample to national totals. For furtherinformation, see www.bls.census.gov/cps/ads/adsmain.htm.
7 Natives are defined as people born in theUnited States, Puerto Rico, or an outlying areasof the United States, and those born in a foreigncountry but who had at least one parent whowas a U.S. citizen. All others are foreign-bornregardless of date of entry into the UnitedStates or citizenship status. The CurrentPopulation Survey, the source of these data,does not extend to Puerto Rico or to the outly-ing areas of the United States, and thus thoseliving there are excluded from the officialpoverty statistics.

in 2000 (8.7 percent). In 2001, 6.8 million families were poor, upfrom 6.4 million in 2000. The num-ber and percent of non-HispanicWhite families (3.1 million and 5.7 percent, respectively) and Blackfamilies (1.8 million and 20.7 per-cent, respectively) who were poor in2001 were above the corresponding2000 levels. For Hispanic families,the number of poor rose from 1.5 million in 2000 to 1.6 million in2001, but their poverty rate did notchange (19.4 percent).
The number of poor and the pover-ty rate of married-couple familiesincreased from 2.6 million and 4.7 percent in 2000 to 2.8 millionand 4.9 percent in 2001. Blackmarried-couple families were theonly racial and ethnic group tohave an increase in both theirnumber of poor and poverty ratefrom 2000 to 2001.
Families with a female householderand no husband present experi-enced an increase in the number ofpoor (from 3.3 million in 2000 to3.5 million in 2001), but not theirpoverty rate (26.4 percent in 2001).Of those female-householder fami-lies, the number of poor non-Hispanic White and Hispanicfamilies increased, whereas Asianand Pacific Islander families experi-enced a decrease in their number ofpoor as well as their poverty rate.
In 2001, families with a malehouseholder, no spouse presenthad an increase in both the num-ber of poor and poverty rate (from0.5 million and 11.3 percent in2000 to 0.6 million and 13.1 per-cent in 2001). Of those male-householder families, Hispanicfamilies saw an increase in theirpoverty rate; however, the numberof poor increased for both Blackand Hispanic families.
For unrelated individuals, or peo-ple not living with any relatives,the number of poor increased (to9.2 million in 2001) as did thepoverty rate (19.9 percent in2001). Most of the 0.9 percentagepoint overall net increase occurredamong male unrelated individuals,whose poverty rate was 17.3 per-cent in 2001, up from 15.7 percentin 2000. The poverty rate forfemale unrelated individuals wasunchanged in 2001 (22.3 percent).Even though men accounted formost of the net increase in povertyamong unrelated individuals, mostpoor unrelated individuals werewomen (58.5 percent).
Work Experience
People who worked at any time dur-ing the year had a lower povertyrate than nonworkers (5.6 percentcompared with 20.6 percent), butamong poor people, many workedeither part-time or part-year (see
U.S. Census Bureau Poverty in the United States: 2001 7
Table 2.Number of Poor and Poverty Rate by Race and Hispanic Origin: 1999, 2000, and 2001(Numbers in thousands)
Characteristic
3-year average1999-2001
Average2000-01
Average1999-2000
Difference in 2-yearmoving averages1
Value90-percent
C.I. (±) Value90-percent
C.I. (±) Value90-percent
C.I. (±) Value90-percent
C.I. (±)
PERCENT
All races . . . . . . . . . . . . . . . . . . . . . . 11.6 0.2 11.5 0.2 11.6 0.2 –0.1 0.2White . . . . . . . . . . . . . . . . . . . . . . . . . . . . 9.7 0.2 9.7 0.2 9.7 0.2 - 0.2
Non-Hispanic. . . . . . . . . . . . . . . . . . . . 7.6 0.2 7.6 0.2 7.5 0.2 0.1 0.2Black. . . . . . . . . . . . . . . . . . . . . . . . . . . . . 22.9 0.7 22.6 0.7 23.1 0.8 –0.5 0.7American Indian and Alaska Native . . 24.5 2.3 22.5 2.4 26.0 2.8 *–3.5 2.5Asian and Pacific Islander . . . . . . . . . . 10.3 0.8 10.1 0.9 10.3 1.0 –0.2 0.9Hispanic2 . . . . . . . . . . . . . . . . . . . . . . . . . 21.9 0.7 21.5 0.7 22.1 0.9 –0.6 0.7
NUMBER
All races . . . . . . . . . . . . . . . . . . . . . . 32,426 508 32,244 543 32,186 621 58 553White . . . . . . . . . . . . . . . . . . . . . . . . . . . . 22,184 414 22,192 444 21,907 511 285 467
Non-Hispanic. . . . . . . . . . . . . . . . . . . . 14,791 343 14,819 368 14,551 422 268 387Black. . . . . . . . . . . . . . . . . . . . . . . . . . . . . 8,186 235 8,059 254 8,212 286 –153 260American Indian and Alaska Native . . 783 81 726 85 796 100 –70 92Asian and Pacific Islander . . . . . . . . . . 1,272 101 1,266 110 1,271 122 –5 112Hispanic2 . . . . . . . . . . . . . . . . . . . . . . . . . 7,873 256 7,872 270 7,811 310 61 255
-Represents zero. *Statistically significant at the 90-percent confidence level.For explanation of confidence intervals (C.I.), see ‘‘Standard errors and their use’’ at www.census.gov/hhes/poverty/poverty01/pov01src.pdf.1As a result of rounding, some differences may appear to be slightly higher or lower than the difference of the reported rates.2Hispanics may be of any race.Source: U.S. Census Bureau, Current Population Survey, 2000, 2001, and 2002 Annual Demographic Supplements.

Table 3). Of poor people 16 yearsof age and older, 38.3 percentworked, but only 11.5 percentworked full-time year-round. In contrast, 69.4 percent of all peo-ple 16 years old and over worked,and 46.1 percent worked full-time,year-round.
The poverty rates just discusseddescribed workers and nonworkersfrom the individual’s perspective.But the poverty status of a personwho lives with relatives is not justdetermined by personal income,but by the total income of all ofthe family members. Thus, onefamily member’s work experienceaffects the poverty status of all theother members of that family.Therefore, Figure 4 shows povertyrates of people by what type offamily they lived in and bywhether any of their family mem-bers worked.
Figure 4 shows lower poverty ratesfor family members living with atleast one worker than for familymembers living with no workers—7.6 percent compared with 30.5 percent. The same patternheld when families were classifiedby family type.
Region
The South had the highest povertyrate in 2001 (13.5 percent), whichwas higher than its rate of 12.8 percent in 2000. From 1995to 1999, poverty rates of the Southand West were statistically indistin-guishable from each other. Thepoverty rates for the Northeast,Midwest, and West remainedunchanged in 2001—9.4 percentfor the Midwest, 10.7 percent forthe Northeast, and 12.1 percent forthe West. The South also experi-enced an increase in the number ofpoor, to 13.5 million in 2001, upfrom 12.7 million in 2000. TheSouth had a disproportionatelylarge share of the nation’s poor:
41.1 percent of the poor lived inthe South in 2001, compared with35.7 percent of all people.
Residence
The poverty rate increased in metro-politan areas outside central cities(“suburbs”), from 7.8 percent in2000 to 8.2 percent in 2001. For
people living inside central cities,the poverty rate was 16.5 percent in2001, unchanged from 2000. A dis-proportionate share of poor peoplelived inside central cities: 40.7 per-cent compared with 28.9 percent ofall people. Taking suburbs and cen-tral cities together, the poverty ratefor people in metropolitan areas was
8 Poverty in the United States: 2001 U.S. Census Bureau
Table 3.Work Experience During the Year for People 16 Years Oldand Over: 2001(Numbers in thousands)
CharacteristicTotal
Belowpoverty
90-percentC.I. (±) Percent
90-percentC.I. (±)
All workers . . . . . . . . . . . . . . . . . . . . 151,042 8,530 342 5.6 0.2Worked full-timeyear-round . . . . . . . . . . . . . . . . . 100,357 2,567 190 2.6 0.2
Not full-time year-round . . . . . . . 50,685 5,964 288 11.8 0.5Did not work . . . . . . . . . . . . . . . . . . . 66,534 13,715 429 20.6 0.6
For explanation of confidence intervals (C.I.), see ‘‘Standard errors and their use’’ atwww.census.gov/hhes/poverty/poverty01/pov01src.pdf.
Source: U.S. Census Bureau, Current Population Survey, 2002 Annual Demographic Supplement.
Figure 4.Poverty Rates of People in Families by Family Type and Presence of Workers: 2001
Source: U.S. Census Bureau, Current Population Survey, 2002 Annual Demographic Supplement.
TotalWith no workersWith 1 or more workers
(Percent)
In malehouseholder
families
In femalehouseholder
families
In married-couplefamilies
In families
7.64.7
21.3
10.2
30.5
15.1
70.2
48.0
9.95.7
28.6
13.6

11.1 percent in 2001, up from 10.8 percent in 2000.
Among those living outside metro-politan areas, the number of poorrose to 7.5 million in 2001, upfrom 7.0 million in 2000. Thisincrease did not translate into ahigher poverty rate; 14.2 percentwere poor in 2001.
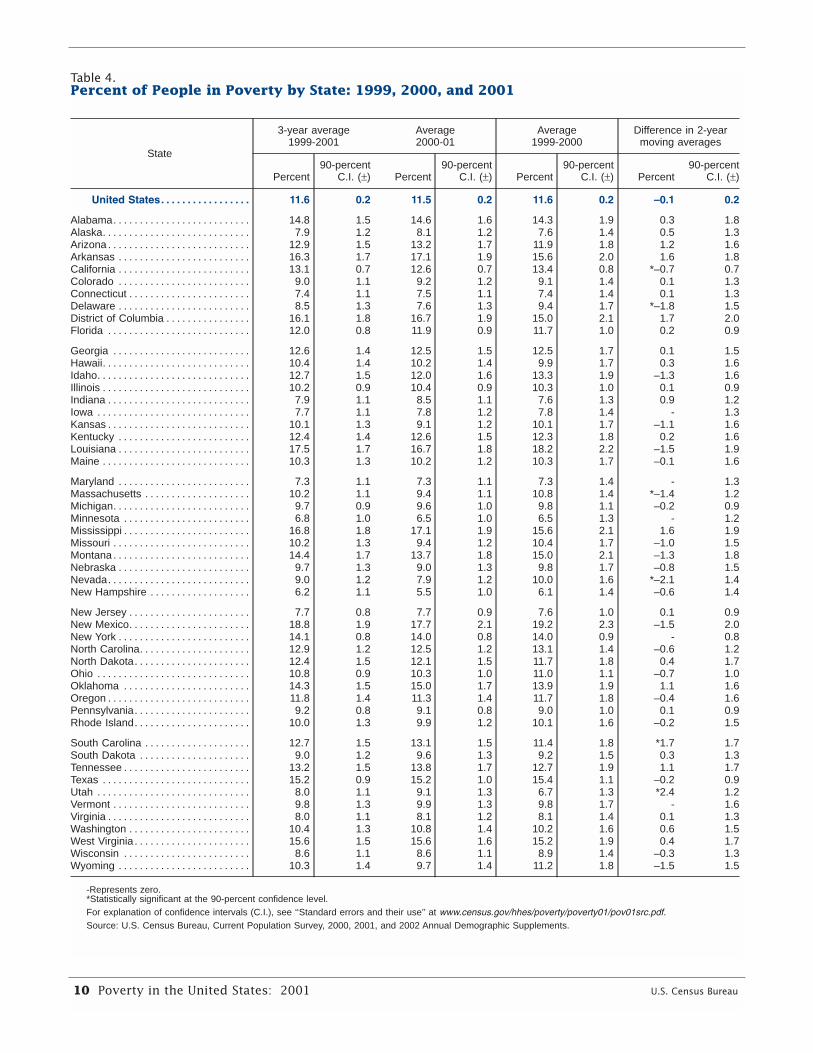
State Poverty Data
Table 4 contains poverty rates forthe 50 states, the District ofColumbia, and the United Statesusing 3-year averages covering1999 to 2001 to improve the sta-tistical reliability of the estimates.(See the text box “InterpretingState Poverty Data” on this page.)Readers should be aware thatalthough New Mexico appeared tohave the highest poverty rate inTable 4 (18.8 percent), it was notstatistically different from the ratesfor Arkansas, Mississippi, andLouisiana, though it was higherthan the rates for the other states.Similarly, the 3-year-average pover-ty rate for New Hampshire, eventhough it looked lowest (6.2 per-cent), was not statistically differentfrom that of four other states—Minnesota, Maryland, Connecticut,and Iowa though it was lower than
the rate in the other 45 states andthe District of Columbia.
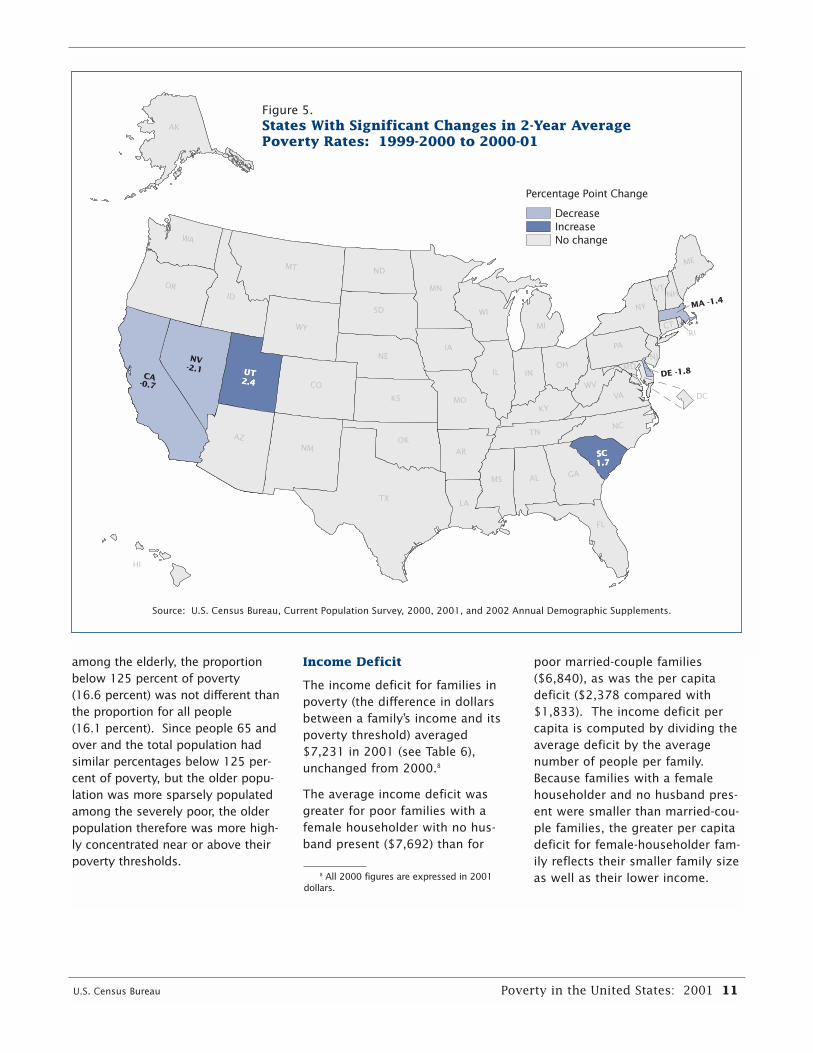
To compare changes in povertyrates at the state level, the CensusBureau recommends using 2-yearmoving averages (2000-2001 and1999-2000). Based on thisapproach, Figure 5 shows that twostates—South Carolina and Utah—showed increases while fourstates—California, Delaware,Massachusetts, and Nevada—showed declines in their povertyrates.
DEPTH OF POVERTYMEASURES
While categorizing people as “poor”and “nonpoor” is one summary ofeconomic position, in reality eco-nomic situations fall into a muchbroader spectrum. Two “depth ofpoverty” measures more fullyreflect the distribution of people’seconomic well-being. The ratio ofincome to poverty compares afamily’s income with its povertythreshold, and expresses that com-parison as a fraction. The incomedeficit tells how many dollars afamily’s income is below its pover-ty threshold. These measuresillustrate how the composition ofthe low-income population variesby the severity of poverty.
Ratio of Income to Poverty Level
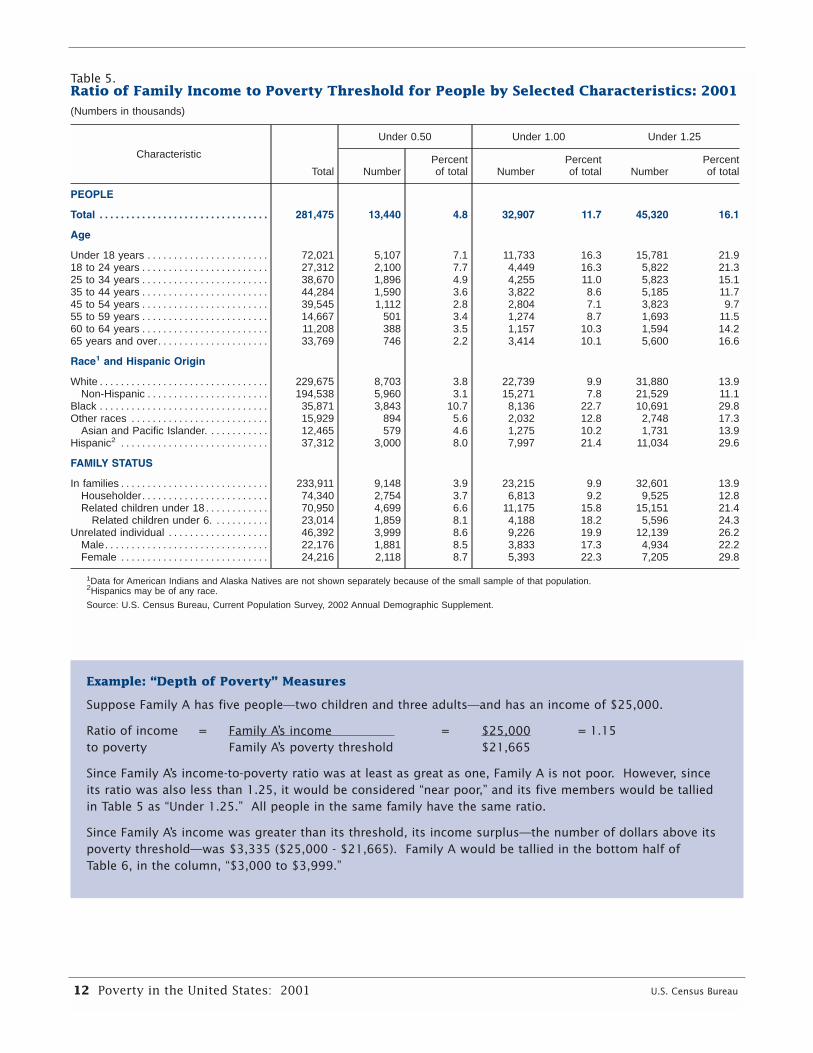
In 2001, the number of “severelypoor” people—defined as thosewith family incomes below one-half their poverty threshold—roseto 13.4 million (4.8 percent), from12.6 million (4.5 percent) in 2000(see Table 5). The severely poorrepresented 40.8 percent of thepoor population in 2001,unchanged from 2000.
The number and percent of “nearpoor” (people with incomes at orabove their threshold but below125 percent of their threshold)remained unchanged in 2001, at12.4 million and 4.4 percent,respectively.
While some demographic groupsmake up similar shares of the popu-lation at varying degrees of poverty,others are unevenly distributed.Table 5 presents the number of peo-ple and percentage below multiplesof their poverty threshold—thosebelow 50 percent of poverty (“Under0.50”), those in poverty (“Under1.00”) and those below 125 percentof poverty (“Under 1.25”). Amongpeople aged 65 and over, 2.2 per-cent were below 50 percent of theirpoverty threshold, compared with4.8 percent for all people. However,
U.S. Census Bureau Poverty in the United States: 2001 9
Poverty estimates for states are not as reliable asnational estimates. These state poverty rateestimates are intended to provide a sense of theranges within which the poverty rates probablyexist. We recommend using caution whencomparing poverty rate estimates across statesbecause their variability is high.
Why show averages? Why not show the latestyear alone?
Averaging poverty rates over several years improvesthe estimates’ reliability. An estimate’s reliability is
measured by a 90-percent confidence interval: thesmaller the confidence interval, the more reliable theestimate. For instance, using 2001 data alone,Alabama had a confidence interval of +/- 1.98 per-centage points around its poverty rate, but using a3-year average, the confidence interval decreased to+/- 1.55 percentage points. For more informationon confidence intervals, see the CPS Source andAccuracy Statement at www.census.gov/hhes/poverty/poverty01/pov01src.pdf.
Interpreting State Poverty Data
10 Poverty in the United States: 2001 U.S. Census Bureau
Table 4.Percent of People in Poverty by State: 1999, 2000, and 2001
State
3-year average1999-2001
Average2000-01
Average1999-2000
Difference in 2-yearmoving averages
Percent90-percent
C.I. (±) Percent90-percent
C.I. (±) Percent90-percent
C.I. (±) Percent90-percent
C.I. (±)
United States. . . . . . . . . . . . . . . . . 11.6 0.2 11.5 0.2 11.6 0.2 –0.1 0.2
Alabama. . . . . . . . . . . . . . . . . . . . . . . . . . 14.8 1.5 14.6 1.6 14.3 1.9 0.3 1.8Alaska. . . . . . . . . . . . . . . . . . . . . . . . . . . . 7.9 1.2 8.1 1.2 7.6 1.4 0.5 1.3Arizona . . . . . . . . . . . . . . . . . . . . . . . . . . . 12.9 1.5 13.2 1.7 11.9 1.8 1.2 1.6Arkansas . . . . . . . . . . . . . . . . . . . . . . . . . 16.3 1.7 17.1 1.9 15.6 2.0 1.6 1.8California . . . . . . . . . . . . . . . . . . . . . . . . . 13.1 0.7 12.6 0.7 13.4 0.8 *–0.7 0.7Colorado . . . . . . . . . . . . . . . . . . . . . . . . . 9.0 1.1 9.2 1.2 9.1 1.4 0.1 1.3Connecticut . . . . . . . . . . . . . . . . . . . . . . . 7.4 1.1 7.5 1.1 7.4 1.4 0.1 1.3Delaware . . . . . . . . . . . . . . . . . . . . . . . . . 8.5 1.3 7.6 1.3 9.4 1.7 *–1.8 1.5District of Columbia . . . . . . . . . . . . . . . . 16.1 1.8 16.7 1.9 15.0 2.1 1.7 2.0Florida . . . . . . . . . . . . . . . . . . . . . . . . . . . 12.0 0.8 11.9 0.9 11.7 1.0 0.2 0.9
Georgia . . . . . . . . . . . . . . . . . . . . . . . . . . 12.6 1.4 12.5 1.5 12.5 1.7 0.1 1.5Hawaii. . . . . . . . . . . . . . . . . . . . . . . . . . . . 10.4 1.4 10.2 1.4 9.9 1.7 0.3 1.6Idaho. . . . . . . . . . . . . . . . . . . . . . . . . . . . . 12.7 1.5 12.0 1.6 13.3 1.9 –1.3 1.6Illinois . . . . . . . . . . . . . . . . . . . . . . . . . . . . 10.2 0.9 10.4 0.9 10.3 1.0 0.1 0.9Indiana . . . . . . . . . . . . . . . . . . . . . . . . . . . 7.9 1.1 8.5 1.1 7.6 1.3 0.9 1.2Iowa . . . . . . . . . . . . . . . . . . . . . . . . . . . . . 7.7 1.1 7.8 1.2 7.8 1.4 - 1.3Kansas . . . . . . . . . . . . . . . . . . . . . . . . . . . 10.1 1.3 9.1 1.2 10.1 1.7 –1.1 1.6Kentucky . . . . . . . . . . . . . . . . . . . . . . . . . 12.4 1.4 12.6 1.5 12.3 1.8 0.2 1.6Louisiana . . . . . . . . . . . . . . . . . . . . . . . . . 17.5 1.7 16.7 1.8 18.2 2.2 –1.5 1.9Maine . . . . . . . . . . . . . . . . . . . . . . . . . . . . 10.3 1.3 10.2 1.2 10.3 1.7 –0.1 1.6
Maryland . . . . . . . . . . . . . . . . . . . . . . . . . 7.3 1.1 7.3 1.1 7.3 1.4 - 1.3Massachusetts . . . . . . . . . . . . . . . . . . . . 10.2 1.1 9.4 1.1 10.8 1.4 *–1.4 1.2Michigan. . . . . . . . . . . . . . . . . . . . . . . . . . 9.7 0.9 9.6 1.0 9.8 1.1 –0.2 0.9Minnesota . . . . . . . . . . . . . . . . . . . . . . . . 6.8 1.0 6.5 1.0 6.5 1.3 - 1.2Mississippi . . . . . . . . . . . . . . . . . . . . . . . . 16.8 1.8 17.1 1.9 15.6 2.1 1.6 1.9Missouri . . . . . . . . . . . . . . . . . . . . . . . . . . 10.2 1.3 9.4 1.2 10.4 1.7 –1.0 1.5Montana . . . . . . . . . . . . . . . . . . . . . . . . . . 14.4 1.7 13.7 1.8 15.0 2.1 –1.3 1.8Nebraska . . . . . . . . . . . . . . . . . . . . . . . . . 9.7 1.3 9.0 1.3 9.8 1.7 –0.8 1.5Nevada. . . . . . . . . . . . . . . . . . . . . . . . . . . 9.0 1.2 7.9 1.2 10.0 1.6 *–2.1 1.4New Hampshire . . . . . . . . . . . . . . . . . . . 6.2 1.1 5.5 1.0 6.1 1.4 –0.6 1.4
New Jersey . . . . . . . . . . . . . . . . . . . . . . . 7.7 0.8 7.7 0.9 7.6 1.0 0.1 0.9New Mexico. . . . . . . . . . . . . . . . . . . . . . . 18.8 1.9 17.7 2.1 19.2 2.3 –1.5 2.0New York . . . . . . . . . . . . . . . . . . . . . . . . . 14.1 0.8 14.0 0.8 14.0 0.9 - 0.8North Carolina. . . . . . . . . . . . . . . . . . . . . 12.9 1.2 12.5 1.2 13.1 1.4 –0.6 1.2North Dakota. . . . . . . . . . . . . . . . . . . . . . 12.4 1.5 12.1 1.5 11.7 1.8 0.4 1.7Ohio . . . . . . . . . . . . . . . . . . . . . . . . . . . . . 10.8 0.9 10.3 1.0 11.0 1.1 –0.7 1.0Oklahoma . . . . . . . . . . . . . . . . . . . . . . . . 14.3 1.5 15.0 1.7 13.9 1.9 1.1 1.6Oregon . . . . . . . . . . . . . . . . . . . . . . . . . . . 11.8 1.4 11.3 1.4 11.7 1.8 –0.4 1.6Pennsylvania. . . . . . . . . . . . . . . . . . . . . . 9.2 0.8 9.1 0.8 9.0 1.0 0.1 0.9Rhode Island. . . . . . . . . . . . . . . . . . . . . . 10.0 1.3 9.9 1.2 10.1 1.6 –0.2 1.5
South Carolina . . . . . . . . . . . . . . . . . . . . 12.7 1.5 13.1 1.5 11.4 1.8 *1.7 1.7South Dakota . . . . . . . . . . . . . . . . . . . . . 9.0 1.2 9.6 1.3 9.2 1.5 0.3 1.3Tennessee . . . . . . . . . . . . . . . . . . . . . . . . 13.2 1.5 13.8 1.7 12.7 1.9 1.1 1.7Texas . . . . . . . . . . . . . . . . . . . . . . . . . . . . 15.2 0.9 15.2 1.0 15.4 1.1 –0.2 0.9Utah . . . . . . . . . . . . . . . . . . . . . . . . . . . . . 8.0 1.1 9.1 1.3 6.7 1.3 *2.4 1.2Vermont . . . . . . . . . . . . . . . . . . . . . . . . . . 9.8 1.3 9.9 1.3 9.8 1.7 - 1.6Virginia . . . . . . . . . . . . . . . . . . . . . . . . . . . 8.0 1.1 8.1 1.2 8.1 1.4 0.1 1.3Washington . . . . . . . . . . . . . . . . . . . . . . . 10.4 1.3 10.8 1.4 10.2 1.6 0.6 1.5West Virginia . . . . . . . . . . . . . . . . . . . . . . 15.6 1.5 15.6 1.6 15.2 1.9 0.4 1.7Wisconsin . . . . . . . . . . . . . . . . . . . . . . . . 8.6 1.1 8.6 1.1 8.9 1.4 –0.3 1.3Wyoming . . . . . . . . . . . . . . . . . . . . . . . . . 10.3 1.4 9.7 1.4 11.2 1.8 –1.5 1.5
-Represents zero.*Statistically significant at the 90-percent confidence level.For explanation of confidence intervals (C.I.), see ‘‘Standard errors and their use’’ at www.census.gov/hhes/poverty/poverty01/pov01src.pdf.Source: U.S. Census Bureau, Current Population Survey, 2000, 2001, and 2002 Annual Demographic Supplements.
among the elderly, the proportionbelow 125 percent of poverty (16.6 percent) was not different thanthe proportion for all people (16.1 percent). Since people 65 andover and the total population hadsimilar percentages below 125 per-cent of poverty, but the older popu-lation was more sparsely populatedamong the severely poor, the olderpopulation therefore was more high-ly concentrated near or above theirpoverty thresholds.
Income Deficit
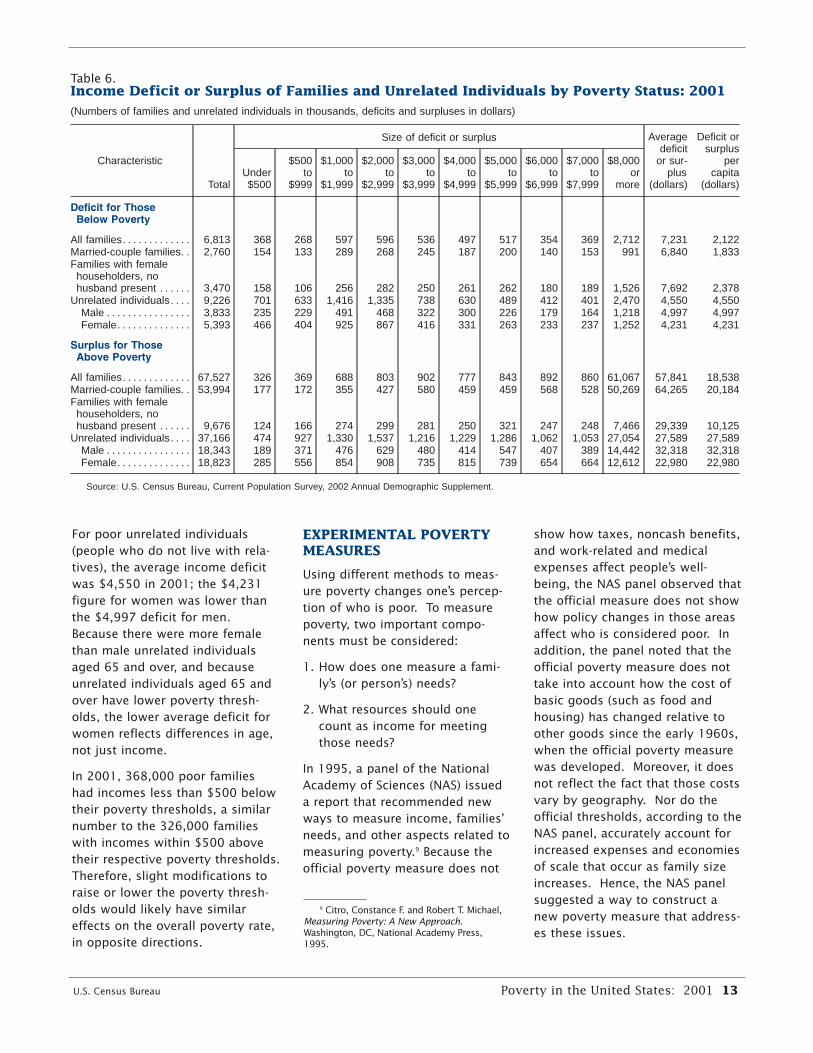
The income deficit for families inpoverty (the difference in dollarsbetween a family’s income and itspoverty threshold) averaged$7,231 in 2001 (see Table 6),unchanged from 2000.8
The average income deficit wasgreater for poor families with afemale householder with no hus-band present ($7,692) than for
poor married-couple families($6,840), as was the per capitadeficit ($2,378 compared with$1,833). The income deficit percapita is computed by dividing theaverage deficit by the averagenumber of people per family.Because families with a femalehouseholder and no husband pres-ent were smaller than married-cou-ple families, the greater per capitadeficit for female-householder fam-ily reflects their smaller family sizeas well as their lower income.
U.S. Census Bureau Poverty in the United States: 2001 11
TX
NM
WA
NV-2.1
MI
IL
MO
MT
WY
ID
UT2.4UT2.4 CO
HI
NE
AK
KS
OK
WI
IA
LA
ME
VT
IN
KY
TN
AL GA
OH
WV
NC
SC1.7SC1.7
NJMD
CTRI
MA -1.4
DE -1.8
SD
VA
-0.7CA
AZ
NY
DC
OR
PA
ND
MN
FL
NH
MS
AR
DecreaseIncreaseNo change
Percentage Point Change
Figure 5. States With Significant Changes in 2-Year Average Poverty Rates: 1999-2000 to 2000-01
Source: U.S. Census Bureau, Current Population Survey, 2000, 2001, and 2002 Annual Demographic Supplements.
8 All 2000 figures are expressed in 2001dollars.
12 Poverty in the United States: 2001 U.S. Census Bureau
Table 5.Ratio of Family Income to Poverty Threshold for People by Selected Characteristics: 2001(Numbers in thousands)
Characteristic
Total
Under 0.50 Under 1.00 Under 1.25
NumberPercentof total Number
Percentof total Number
Percentof total
PEOPLE
Total . . . . . . . . . . . . . . . . . . . . . . . . . . . . . . . . 281,475 13,440 4.8 32,907 11.7 45,320 16.1
Age
Under 18 years . . . . . . . . . . . . . . . . . . . . . . . 72,021 5,107 7.1 11,733 16.3 15,781 21.918 to 24 years . . . . . . . . . . . . . . . . . . . . . . . . 27,312 2,100 7.7 4,449 16.3 5,822 21.325 to 34 years . . . . . . . . . . . . . . . . . . . . . . . . 38,670 1,896 4.9 4,255 11.0 5,823 15.135 to 44 years . . . . . . . . . . . . . . . . . . . . . . . . 44,284 1,590 3.6 3,822 8.6 5,185 11.745 to 54 years . . . . . . . . . . . . . . . . . . . . . . . . 39,545 1,112 2.8 2,804 7.1 3,823 9.755 to 59 years . . . . . . . . . . . . . . . . . . . . . . . . 14,667 501 3.4 1,274 8.7 1,693 11.560 to 64 years . . . . . . . . . . . . . . . . . . . . . . . . 11,208 388 3.5 1,157 10.3 1,594 14.265 years and over. . . . . . . . . . . . . . . . . . . . . 33,769 746 2.2 3,414 10.1 5,600 16.6
Race1 and Hispanic Origin
White . . . . . . . . . . . . . . . . . . . . . . . . . . . . . . . . 229,675 8,703 3.8 22,739 9.9 31,880 13.9Non-Hispanic . . . . . . . . . . . . . . . . . . . . . . . 194,538 5,960 3.1 15,271 7.8 21,529 11.1
Black . . . . . . . . . . . . . . . . . . . . . . . . . . . . . . . . 35,871 3,843 10.7 8,136 22.7 10,691 29.8Other races . . . . . . . . . . . . . . . . . . . . . . . . . . 15,929 894 5.6 2,032 12.8 2,748 17.3
Asian and Pacific Islander. . . . . . . . . . . . 12,465 579 4.6 1,275 10.2 1,731 13.9Hispanic2 . . . . . . . . . . . . . . . . . . . . . . . . . . . . 37,312 3,000 8.0 7,997 21.4 11,034 29.6
FAMILY STATUS
In families . . . . . . . . . . . . . . . . . . . . . . . . . . . . 233,911 9,148 3.9 23,215 9.9 32,601 13.9Householder. . . . . . . . . . . . . . . . . . . . . . . . 74,340 2,754 3.7 6,813 9.2 9,525 12.8Related children under 18 . . . . . . . . . . . . 70,950 4,699 6.6 11,175 15.8 15,151 21.4
Related children under 6. . . . . . . . . . . 23,014 1,859 8.1 4,188 18.2 5,596 24.3Unrelated individual . . . . . . . . . . . . . . . . . . . 46,392 3,999 8.6 9,226 19.9 12,139 26.2
Male. . . . . . . . . . . . . . . . . . . . . . . . . . . . . . . 22,176 1,881 8.5 3,833 17.3 4,934 22.2Female . . . . . . . . . . . . . . . . . . . . . . . . . . . . 24,216 2,118 8.7 5,393 22.3 7,205 29.8
1Data for American Indians and Alaska Natives are not shown separately because of the small sample of that population.2Hispanics may be of any race.
Source: U.S. Census Bureau, Current Population Survey, 2002 Annual Demographic Supplement.
Example: “Depth of Poverty” Measures
Suppose Family A has five people—two children and three adults—and has an income of $25,000.
Ratio of income = Family A’s income = $25,000 = 1.15 to poverty Family A’s poverty threshold $21,665
Since Family A’s income-to-poverty ratio was at least as great as one, Family A is not poor. However, sinceits ratio was also less than 1.25, it would be considered “near poor,” and its five members would be talliedin Table 5 as “Under 1.25.” All people in the same family have the same ratio.
Since Family A’s income was greater than its threshold, its income surplus—the number of dollars above itspoverty threshold—was $3,335 ($25,000 - $21,665). Family A would be tallied in the bottom half of Table 6, in the column, “$3,000 to $3,999.”
U.S. Census Bureau Poverty in the United States: 2001 13
For poor unrelated individuals(people who do not live with rela-tives), the average income deficitwas $4,550 in 2001; the $4,231figure for women was lower thanthe $4,997 deficit for men.Because there were more femalethan male unrelated individualsaged 65 and over, and becauseunrelated individuals aged 65 andover have lower poverty thresh-olds, the lower average deficit forwomen reflects differences in age,not just income.
In 2001, 368,000 poor familieshad incomes less than $500 belowtheir poverty thresholds, a similarnumber to the 326,000 familieswith incomes within $500 abovetheir respective poverty thresholds.Therefore, slight modifications toraise or lower the poverty thresh-olds would likely have similareffects on the overall poverty rate,in opposite directions.
EXPERIMENTAL POVERTYMEASURES
Using different methods to meas-ure poverty changes one’s percep-tion of who is poor. To measurepoverty, two important compo-nents must be considered:
1. How does one measure a fami-ly’s (or person’s) needs?
2. What resources should onecount as income for meetingthose needs?
In 1995, a panel of the NationalAcademy of Sciences (NAS) issueda report that recommended newways to measure income, families’needs, and other aspects related tomeasuring poverty.9 Because theofficial poverty measure does not
show how taxes, noncash benefits,and work-related and medicalexpenses affect people’s well-being, the NAS panel observed thatthe official measure does not showhow policy changes in those areasaffect who is considered poor. Inaddition, the panel noted that theofficial poverty measure does nottake into account how the cost ofbasic goods (such as food andhousing) has changed relative toother goods since the early 1960s,when the official poverty measurewas developed. Moreover, it doesnot reflect the fact that those costsvary by geography. Nor do theofficial thresholds, according to theNAS panel, accurately account forincreased expenses and economiesof scale that occur as family sizeincreases. Hence, the NAS panelsuggested a way to construct anew poverty measure that address-es these issues.
Table 6.Income Deficit or Surplus of Families and Unrelated Individuals by Poverty Status: 2001(Numbers of families and unrelated individuals in thousands, deficits and surpluses in dollars)
Characteristic
Total
Size of deficit or surplus Averagedeficit
or sur-plus
(dollars)
Deficit orsurplus
percapita
(dollars)Under$500
$500to
$999
$1,000to
$1,999
$2,000to
$2,999
$3,000to
$3,999
$4,000to
$4,999
$5,000to
$5,999
$6,000to
$6,999
$7,000to
$7,999
$8,000or
more
Deficit for ThoseBelow Poverty
All families. . . . . . . . . . . . . 6,813 368 268 597 596 536 497 517 354 369 2,712 7,231 2,122Married-couple families. . 2,760 154 133 289 268 245 187 200 140 153 991 6,840 1,833Families with female
householders, nohusband present . . . . . . 3,470 158 106 256 282 250 261 262 180 189 1,526 7,692 2,378
Unrelated individuals. . . . 9,226 701 633 1,416 1,335 738 630 489 412 401 2,470 4,550 4,550Male . . . . . . . . . . . . . . . . 3,833 235 229 491 468 322 300 226 179 164 1,218 4,997 4,997Female. . . . . . . . . . . . . . 5,393 466 404 925 867 416 331 263 233 237 1,252 4,231 4,231
Surplus for ThoseAbove Poverty
All families. . . . . . . . . . . . . 67,527 326 369 688 803 902 777 843 892 860 61,067 57,841 18,538Married-couple families. . 53,994 177 172 355 427 580 459 459 568 528 50,269 64,265 20,184Families with female
householders, nohusband present . . . . . . 9,676 124 166 274 299 281 250 321 247 248 7,466 29,339 10,125
Unrelated individuals. . . . 37,166 474 927 1,330 1,537 1,216 1,229 1,286 1,062 1,053 27,054 27,589 27,589Male . . . . . . . . . . . . . . . . 18,343 189 371 476 629 480 414 547 407 389 14,442 32,318 32,318Female. . . . . . . . . . . . . . 18,823 285 556 854 908 735 815 739 654 664 12,612 22,980 22,980
Source: U.S. Census Bureau, Current Population Survey, 2002 Annual Demographic Supplement.
9 Citro, Constance F. and Robert T. Michael,Measuring Poverty: A New Approach.Washington, DC, National Academy Press,1995.

14 Poverty in the United States: 2001 U.S. Census Bureau
For further details about poverty measurement, see: “The Development of the Orshansky PovertyThresholds and Their Subsequent History as the Official U.S. Poverty Measure” by Gordon Fisher, available at www.census.gov/hhes/poverty/povmeas/papers/orshansky.html; Experimental Poverty Measures: 1999 by Kathleen Short, available at www.census.gov/prod/2001pubs/p60-216.pdf; and the National Academy of Sciences’s report, MeasuringPoverty: A New Approach, a summary of which is available at www.nap.edu/readingroom/books/poverty/.
Official and Experimental Poverty Measures: How Do They Differ?
Question Official measure Experimental measures
What counts as income? Gross money income (that is, before taxes) ofall family members living in the same housingunit, not counting capital gains.
Like the official measure, the experimentalmeasures add together the incomes of all fam-ily members who live together, except that theexperimental measures:
Use after-tax incomeInclude noncash benefits as income(such as food stamps and housingsubsidies)Deduct some work-related expenses(such as transportation and childcare) from incomeTake into account medical out-of-pocket expenses (each measure hasa different method for doing so)
What is used as a benchmarkfor need?
First computed in 1963-64, the thresholdswere originally based on U.S. Department ofAgriculture (USDA) food budgets, designedfor families under economic stress. SocialSecurity Administration analysts used 1955USDA data to find out what portion of theirincome families spent on food, then multipliedthe food budgets by the inverse of that factorto get the thresholds (with some adjustmentsfor two-person families and single people).Except when federal interagency committeesmade minor revisions, these thresholds haveonly been updated for inflation annually withthe Consumer Price Index (CPI-U), asdirected by the Office of Management andBudget’s Statistical Policy Directive 14.
Unlike the official thresholds, which have nofixed relationship between thresholds fordifferent-sized families (because they werederived with food budgets and spending data),the experimental measures start with expendi-tures for food, clothing, shelter, and utilities(and for some measures, medical expenses)for a family of four—two adults and twochildren—plus a small additional amount forother expenses. These dollar amounts areadjusted for larger and smaller families, basedon their relative need. The adjustments aremade using three parameters: the first reflectsthat children tend to consume less than adults,the second reflects that a doubling of familysize does not mean that every expensebecomes twice as high, and the third reflectsthat the first child in a single-adult family repre-sents a greater increase in expenses than thefirst child in a two-adult family.
What adjustments are made forgeographic differences in thecost of living?
None. The same thresholds apply to all partsof the country.
Some measures (labeled NGA) make noadjustment; others are adjusted using cost indi-ces by state and metropolitan/nonmetropolitanresidence, based on housing costs.

The Census Bureau has been con-ducting research to refine some ofthe panel’s measurement methodsand to examine how the NAS panel’srecommendations would affect thenumber of poor and the povertyrate.10 Six experimental measuresare discussed below. These meas-ures each account for work-relatedexpenses, noncash benefits (such asfood stamps and housing subsi-dies), and adjust thresholds by fami-ly size in similar ways, but themeasures differ among one anotherby how they account for health carecosts and whether they considergeographic differences in the cost ofliving.11 The first three measures(labeled NGA for “no geographicadjustment”) do not adjust thethresholds to account for geograph-ic differences in housing costs. Thelast three (labeled GA) do, but are
otherwise identical to their counter-parts that do not account for geo-graphic cost differences. (See Short,2001, for a full discussion of themeasures.)
The first measure most closelyreflects the NAS panel’s approachfor taking into account how med-ical out-of-pocket expenses (MOOP)affect poverty, but does notaccount for geographic cost-of-liv-ing differences as noted above.This measure is called “MOOP sub-tracted from income” (MSI-NGA).These medical expenses includehealth insurance premiums, copay-ments made at a doctor’s officethat are not covered by insurance,and other expenses paid out of thepatient’s pocket, such as over-the-counter medications.12 The MSI-NGA measure subtracts theseexpenses from family incomebefore comparing the income withthe family’s threshold, which inthis case excludes medical carefrom the family’s “needs” (thethreshold).
The second measure, “MOOP in thethreshold” (MIT-NGA), increases thepoverty thresholds to take MOOPexpenses into account, instead ofsubtracting these expenses fromincome. Using data from the 1997-1999 Consumer Expenditure Surveyand the 1996 Medical ExpendituresPanel Survey, the Census Bureaucomputed a threshold to allow forfood, clothing, shelter, utilities, andMOOP. How much money wasallowed for MOOP depended on thefamily’s size, the presence of elderlyfamily members, the self-reportedhealth status of the family mem-bers, and differences in healthinsurance coverage across families.Thus, for the MIT-NGA measure, thethresholds’ allowances for MOOPreflect expected—that is, average—medical expenses along thosedimensions.
The third measure, CMB-NGA (for“combined” methods), combinesattributes of both the MSI and MITmeasures. Like the MIT-NGA meas-ure, the CMB-NGA includes expect-ed MOOP expenditures in thethresholds. However, like the MSI-NGA measure, the CMB-NGA takesinto account variations in medical
U.S. Census Bureau Poverty in the United States: 2001 15
10 Short, Kathleen, U.S. Census Bureau,Current Population Reports, P60-216,Experimental Poverty Measures: 1999, U.S.Government Printing Office, Washington, DC,2001. See also the Census Bureau’s povertymeasurement Web site for additional studies:www.census.gov/hhes/poverty/povmeas.html.
11 The NAS panel did not advocate one par-ticular dollar amount upon which to basethreshold revisions; rather, they offered a rangeof thresholds. The analysis here uses the mid-point of the NAS panel’s range.
12 Since MOOP is not reported in the CPSAnnual Demographic Supplement, these valueswere imputed using statistical techniques. SeeShort (2001) for details.
Table 7.Experimental Poverty Measures: 1999 to 2001(Percentage poor)
Measure 1999 2000 2001
Official measure. . . . . . . . . . . . . . . . . . . . . . . . . . . . . . . . . . . . . . . . . . . . . . . . 11.9 *11.3 *11.7
No Geographic Adjustment of Thresholds
Medical costs alternative 1 (MSI-NGA) . . . . . . . . . . . . . . . . . . . . . . . . . . . . 12.2 12.1 *12.4Medical costs alternative 2 (MIT-NGA) . . . . . . . . . . . . . . . . . . . . . . . . . . . . 12.8 12.7 12.8Medical costs alternative 3 (CMB-NGA) . . . . . . . . . . . . . . . . . . . . . . . . . . . 12.9 12.8 13.0
Geographic Adjustment of Thresholds
Medical costs alternative 1 (MSI-GA) . . . . . . . . . . . . . . . . . . . . . . . . . . . . . 12.1 12.0 *12.3Medical costs alternative 2 (MIT-GA) . . . . . . . . . . . . . . . . . . . . . . . . . . . . . 12.7 12.5 *12.7Medical costs alternative 3 (CMB-GA) . . . . . . . . . . . . . . . . . . . . . . . . . . . . 12.8 12.6 *12.9
*Statistically significant change from the previous year.For an explanation of the measures, see text and Short (2001).All estimates use Census 2000-based weights and may differ from previously published estimates.All thresholds are updated for inflation with the Consumer Price Index (CPI-U).See www.census.gov/hhes/poverty/povmeas/report.htm for measures updated using growth in median expenditures.Source: U.S. Census Bureau, Current Population Survey, 2000, 2001, and 2002 Annual Demographic Supplements.

needs across families. The CMB-NGA measure calculates the differ-ence between the expected MOOPand the actual amounts each fami-ly spent out-of-pocket for medicalcare and subtracts the differencefrom family income. This way,families who had greater thanexpected medical expenses may beclassified as poor when they other-wise would not be, but those whowere unexpectedly healthy areclassified as better off than theywould be under both the officialand MIT-NGA measures.13
The last three measures (MSI-GA,MIT-GA, and CMB-GA) includeadjustments to the thresholds toaccount for geographic differencesin housing costs; hence, they arelabeled GA for “geographic adjust-ment.” They are otherwise identi-cal to their counterparts that donot account for geographic costdifferences.
All six measures use the ConsumerPrice Index for All UrbanConsumers to update the thresh-olds from 1999 for inflation. Sixadditional measures are presentedon the poverty Web site; these usegrowth in median expenditures forfood, clothing, shelter, and utilitiescalculated from the ConsumerExpenditure Survey, based on 1999
data, to update the measures (seewww.census.gov/hhes/poverty/povmeas/reports.htm).
Data for each of these measuresand the official measure are pre-sented in Table 7. All of the exper-imental measures yielded a higherpoverty rate in 2001 than the offi-cial measure. The MSI-GA measurehad the smallest difference fromthe official measure (12.3 percentcompared with 11.7 percent forthe official measure), followed byMSI-NGA (12.4 percent), MIT-GA(12.7 percent), and MIT-NGA (12.8 percent). The experimentalmeasures were more stable fromyear to year than the official meas-ure. While the official poverty ratechanged from 1999 to 2000 and
16 Poverty in the United States: 2001 U.S. Census Bureau
Table 8.Experimental Poverty Measures by Selected Characteristics: 2001
Characteristic Official MSI - NGA MIT - NGA CMB - NGA MSI - GA MIT - GA CMB - GA
Total . . . . . . . . . . . . . . . . . . . . . . . . . . . . 11.7 12.4 12.8 13.0 12.3 12.7 12.9
People in families . . . . . . . . . . . . . . . . . . . . 9.9 10.5 11.0 11.1 10.5 11.1 11.1People in married-couple families . . . . . 5.7 6.6 7.1 7.1 6.6 7.1 7.1People in families with a femalehouseholder, no husband present . . . . 28.6 26.7 27.9 28.1 27.0 28.1 28.3
People in families with a malehouseholder, no wife present . . . . . . . . 13.6 15.2 16.2 16.0 15.2 15.6 16.0
Age
Under 18 years . . . . . . . . . . . . . . . . . . . . . . . 16.3 14.5 15.7 15.3 14.6 15.8 15.418 to 64 years . . . . . . . . . . . . . . . . . . . . . . . . 10.1 10.7 11.4 11.3 10.8 11.5 11.365 years and over. . . . . . . . . . . . . . . . . . . . . 10.1 16.1 13.7 17.1 15.5 12.7 16.2
Race and Hispanic Origin
Non-Hispanic White . . . . . . . . . . . . . . . . . . . 7.8 8.9 9.1 9.4 8.4 8.5 8.8Black . . . . . . . . . . . . . . . . . . . . . . . . . . . . . . . . 22.7 21.3 22.1 22.2 20.8 21.7 21.8Hispanic1 . . . . . . . . . . . . . . . . . . . . . . . . . . . . 21.4 21.9 23.4 23.1 24.4 26.3 25.9
Region
Northeast . . . . . . . . . . . . . . . . . . . . . . . . . . . . 10.7 10.5 10.7 11.1 12.9 13.4 13.8Midwest. . . . . . . . . . . . . . . . . . . . . . . . . . . . . . 9.4 9.9 10.1 10.4 8.7 8.8 9.0South . . . . . . . . . . . . . . . . . . . . . . . . . . . . . . . . 13.5 14.7 15.3 15.4 12.5 12.8 13.0West . . . . . . . . . . . . . . . . . . . . . . . . . . . . . . . . 12.1 12.7 13.3 13.5 15.1 15.9 16.1
1Hispanics may be of any race.
Note: While the experimental measures differ among one another in their computation of medical expenses and geographic variations in costs, they aresimilar in their scaling of thresholds by family size and their treatment of noncash benefits and child care and work-related expenses. See text and footnotes foradditional information and references.
MSI = Medical out-of-pocket expenses (MOOP) subtracted from incomeMIT = MOOP included in the thresholdsCMB = Combined methodsNGA = No geographic adjustment for housing costsGA = Geographic adjustment for housing costs
Source: U.S. Census Bureau, Current Population Survey, 2002 Annual Demographic Supplement.
13 While conceptually similar, the povertystatus of an individual or family may differbetween the MSI and CMB measures because ofdifferences in the methods used to calculate thecorresponding poverty thresholds.

from 2000 to 2001, none of theexperimental poverty rateschanged from 1999 to 2000 andtwo measures’ poverty rates (forMIT-NGA and CMB-NGA) did notchange between 2000 to 2001.
All of the experimental measuresshowed a different profile of thepoor population than did the officialmeasure (see Table 8). Each of theexperimental measures yieldedlower poverty rates than the officialmeasure for people in families witha female householder and no hus-
band present, whereas the oppositewas true for people in married-couple families and male house-holder families (see Figure 6).
These patterns occurred becausethe official measure does not addnoncash benefits or deduct taxesand work-related expenses fromincome, while the experimentalmeasures do. Hence, the experi-mental measures show relativelylower poverty rates for femalehouseholder families becausethose families received more in-
kind benefits and paid less in taxesand work expenses than didmarried-couple families.
Similarly, poverty rates by age fromthe experimental measures differedfrom the official measure, as shownin Figure 7. People under 18 hadlower poverty rates than under theofficial measure, while those ages18 to 64 had higher rates thanunder the official measure, andthose 65 years and over had differ-ences that were higher still.Including medical expenses when
U.S. Census Bureau Poverty in the United States: 2001 17
Figure 6.Experimental Poverty Rates for Individuals by Type of Family: 2001
Note: While the experimental measures differ among one another in their computation of medical expenses and geographic variations in costs, they are similar in their scaling of thresholds by family size and their treatment of noncash benefits and child care and work-related expenses. See text and footnotes for additional information and references. MSI = Medical out-of-pocket expenses (MOOP) Subtracted from Income MIT = MOOP Included in the Thresholds CMB = "Combined" methods NGA = No Geographic Adjustment for housing costsGA = Geographic Adjustment for housing costs Source: U.S. Census Bureau, Current Population Survey, 2002 Annual Demographic Supplement.
Percent
CMB-GAMIT-GAMSI-GA
CMB - NGAMIT - NGAMSI - NGA
Official
CMB-GAMIT-GAMSI-GA
CMB - NGAMIT - NGAMSI - NGA
Official
0 5 10 15 20 25 30
CMB-GAMIT-GAMSI-GA
CMB - NGAMIT - NGAMSI - NGA
Official
People in married-couple families
People in families with a female householder, no husband present
People in families with a male householder, no wife present
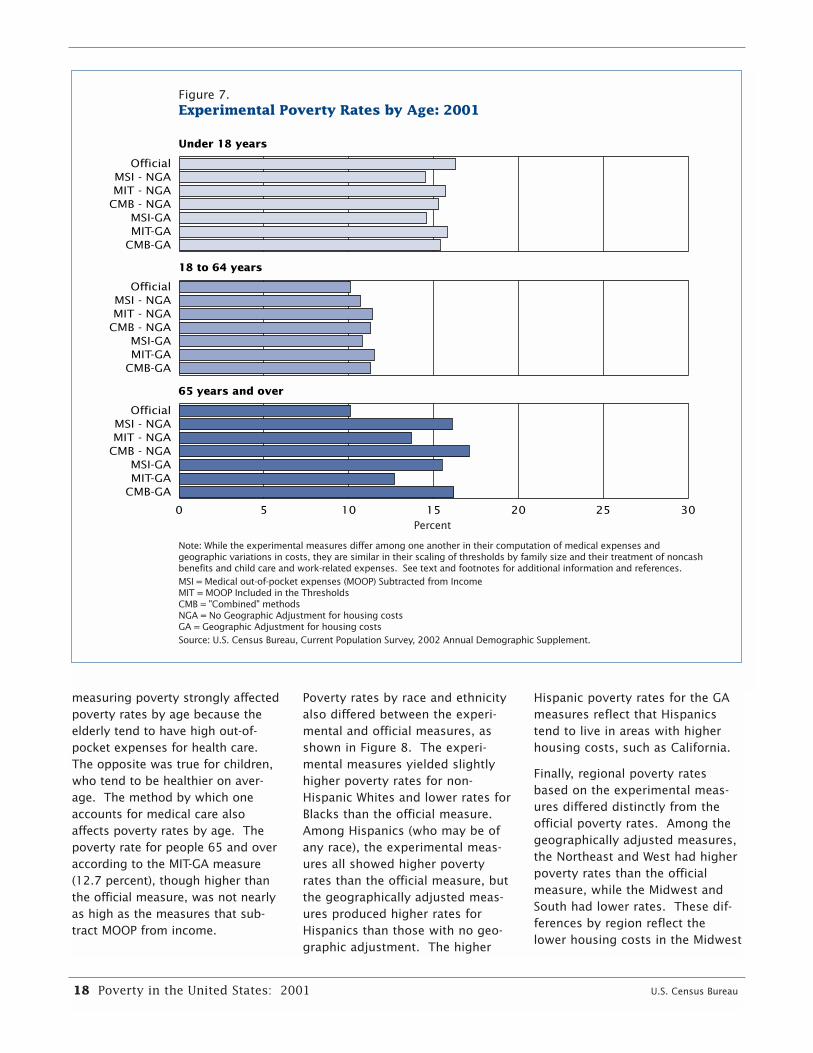
measuring poverty strongly affectedpoverty rates by age because theelderly tend to have high out-of-pocket expenses for health care.The opposite was true for children,who tend to be healthier on aver-age. The method by which oneaccounts for medical care alsoaffects poverty rates by age. Thepoverty rate for people 65 and overaccording to the MIT-GA measure(12.7 percent), though higher thanthe official measure, was not nearlyas high as the measures that sub-tract MOOP from income.
Poverty rates by race and ethnicityalso differed between the experi-mental and official measures, asshown in Figure 8. The experi-mental measures yielded slightlyhigher poverty rates for non-Hispanic Whites and lower rates forBlacks than the official measure.Among Hispanics (who may be ofany race), the experimental meas-ures all showed higher povertyrates than the official measure, butthe geographically adjusted meas-ures produced higher rates forHispanics than those with no geo-graphic adjustment. The higher
Hispanic poverty rates for the GAmeasures reflect that Hispanicstend to live in areas with higherhousing costs, such as California.
Finally, regional poverty ratesbased on the experimental meas-ures differed distinctly from theofficial poverty rates. Among thegeographically adjusted measures,the Northeast and West had higherpoverty rates than the officialmeasure, while the Midwest andSouth had lower rates. These dif-ferences by region reflect thelower housing costs in the Midwest
18 Poverty in the United States: 2001 U.S. Census Bureau
Figure 7.Experimental Poverty Rates by Age: 2001
Note: While the experimental measures differ among one another in their computation of medical expenses and geographic variations in costs, they are similar in their scaling of thresholds by family size and their treatment of noncash benefits and child care and work-related expenses. See text and footnotes for additional information and references. MSI = Medical out-of-pocket expenses (MOOP) Subtracted from Income MIT = MOOP Included in the Thresholds CMB = "Combined" methods NGA = No Geographic Adjustment for housing costsGA = Geographic Adjustment for housing costs Source: U.S. Census Bureau, Current Population Survey, 2002 Annual Demographic Supplement.
Percent
CMB-GAMIT-GAMSI-GA
CMB - NGAMIT - NGAMSI - NGA
Official
CMB-GAMIT-GAMSI-GA
CMB - NGAMIT - NGAMSI - NGA
Official
0 5 10 15 20 25 30
CMB-GAMIT-GAMSI-GA
CMB - NGAMIT - NGAMSI - NGA
Official
Under 18 years
18 to 64 years
65 years and over

and South compared with theNortheast and West.
More information on experimentalpoverty measures can be found onthe Census Bureau’s PovertyMeasurement Research Web site atwww.census.gov/hhes/www/povmeas.html. The Census Bureauplans to continue to issue reportson experimental poverty measuresin order to help policy makers,researchers, and the publicimprove their understanding ofhow measurement issues affect theperception of who is poor.
NOTES, ADDITIONAL DATA,AND USERS’ COMMENTS
CPS Data Collection
The information in this report wascollected in the 50 states and theDistrict of Columbia and does notinclude residents of Puerto Ricoand outlying areas. The populationcontrols used to prepare the esti-mates are based on results ofCensus 2000. Specifically, the esti-mates in this report are controlledto national population estimates byage, race, sex, and Hispanic origin,
and to state population estimatesby age, and are based on the newCPS sample expansion to about78,000 households nationwide.For more information on the CPSexpansion, see Appendix B.
Because the CPS is primarily ahousehold survey, people withunconventional housing who arenot living in shelters are excludedfrom these poverty statistics. TheCPS also excludes armed forcespersonnel living on military basesand people living in institutions.For further documentation about
U.S. Census Bureau Poverty in the United States: 2001 19
Figure 8.Experimental Poverty Rates by Race and Hispanic Origin: 2001
1 Hispanics may be of any race. Note: While the experimental measures differ among one another in their computation of medical expenses and geographic variations in costs, they are similar in their scaling of thresholds by family size and their treatment of noncash benefits and child care and work-related expenses. See text and footnotes for additional information and references. MSI = Medical out-of-pocket expenses (MOOP) Subtracted from Income MIT = MOOP Included in the Thresholds CMB = "Combined" methods NGA = No Geographic Adjustment for housing costs GA = Geographic Adjustment for housing costs Source: U.S. Census Bureau, Current Population Survey, 2002 Annual Demographic Supplement.
Percent
CMB-GAMIT-GAMSI-GA
CMB - NGAMIT - NGAMSI - NGA
Official
CMB-GAMIT-GAMSI-GA
CMB - NGAMIT - NGAMSI - NGA
Official
0 5 10 15 20 25 30
CMB-GAMIT-GAMSI-GA
CMB - NGAMIT - NGAMSI - NGA
Official
Non-Hispanic White
Black
Hispanic1

the CPS Annual DemographicSupplement, seewww.bls.census.gov/cps/ads/adsmain.htm.
Small Area Income andPoverty Estimates
The Census Bureau also computesimproved (in the sense of havinglower standard errors) annualpoverty data by states, as well asbiennial estimates for counties,based on models using data fromthe CPS, the 1990 decennial census,and administrative records. State-level estimates for 1998 are avail-able on the Internet at: www.cen-sus.gov/hhes/www/saipe.html.Estimates for income year 1999 willbe available later this fall.
Additional Data and Contacts
Detailed tables, historical tables,press releases and briefings, andunpublished data are availableelectronically on the U.S. CensusBureau’s poverty Web site. The Website may be accessed through theCensus Bureau’s home page atwww.census.gov or directly atwww.census.gov/hhes/www/poverty.html. CPS microdata areavailable for down-loading throughthe FERRET system. FERRET maybe accessed by clicking on “AccessTools” on the Census Bureau homepage or by clicking the FERRET linkon the poverty Web site. Technicaldisclosure avoidance methodshave been applied to these CPSmicrodata to prevent disclosure ofindividuals’ identities.
If you have trouble finding povertydata or have questions about
them, you may contact theHousing and Household EconomicStatistics Division statistical infor-mation staff by e-mail at [email protected] or by telephone at 301-763-3242.
Comments
The Census Bureau welcomes thecomments and advice of data andreport users. If you have sugges-tions or comments, please writeto:
John IcelandChief, Poverty and Health Statistics
BranchHousing and Household Economic
Statistics DivisionU.S. Census BureauWashington, DC 20233-8500
or by e-mail to [email protected]
20 Poverty in the United States: 2001 U.S. Census Bureau
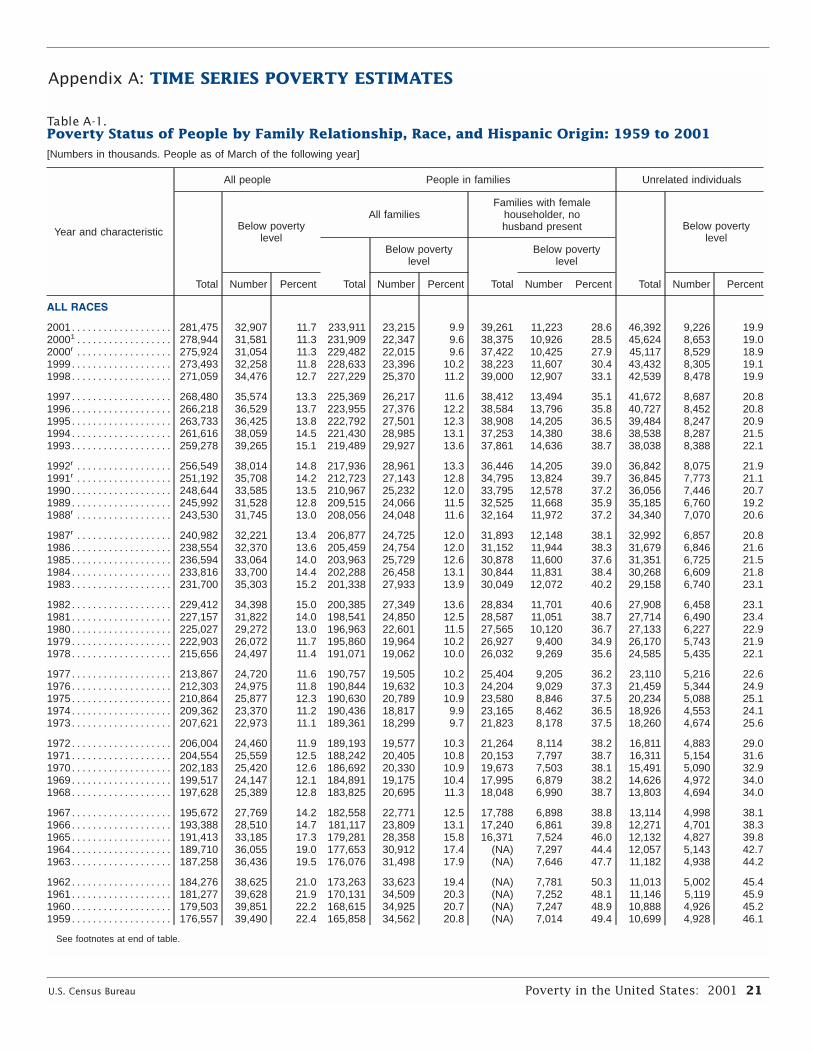
U.S. Census Bureau Poverty in the United States: 2001 21
Appendix A: TIME SERIES POVERTY ESTIMATES
Table A-1.Poverty Status of People by Family Relationship, Race, and Hispanic Origin: 1959 to 2001[Numbers in thousands. People as of March of the following year]
Year and characteristic
All people People in families Unrelated individuals
Total
Below povertylevel
All familiesFamilies with female
householder, nohusband present
Total
Below povertylevel
Total
Below povertylevel
Total
Below povertylevel
Number Percent Number Percent Number Percent Number Percent
ALL RACES
2001. . . . . . . . . . . . . . . . . . . 281,475 32,907 11.7 233,911 23,215 9.9 39,261 11,223 28.6 46,392 9,226 19.920001 . . . . . . . . . . . . . . . . . . 278,944 31,581 11.3 231,909 22,347 9.6 38,375 10,926 28.5 45,624 8,653 19.02000r . . . . . . . . . . . . . . . . . . 275,924 31,054 11.3 229,482 22,015 9.6 37,422 10,425 27.9 45,117 8,529 18.91999. . . . . . . . . . . . . . . . . . . 273,493 32,258 11.8 228,633 23,396 10.2 38,223 11,607 30.4 43,432 8,305 19.11998. . . . . . . . . . . . . . . . . . . 271,059 34,476 12.7 227,229 25,370 11.2 39,000 12,907 33.1 42,539 8,478 19.9
1997. . . . . . . . . . . . . . . . . . . 268,480 35,574 13.3 225,369 26,217 11.6 38,412 13,494 35.1 41,672 8,687 20.81996. . . . . . . . . . . . . . . . . . . 266,218 36,529 13.7 223,955 27,376 12.2 38,584 13,796 35.8 40,727 8,452 20.81995. . . . . . . . . . . . . . . . . . . 263,733 36,425 13.8 222,792 27,501 12.3 38,908 14,205 36.5 39,484 8,247 20.91994. . . . . . . . . . . . . . . . . . . 261,616 38,059 14.5 221,430 28,985 13.1 37,253 14,380 38.6 38,538 8,287 21.51993. . . . . . . . . . . . . . . . . . . 259,278 39,265 15.1 219,489 29,927 13.6 37,861 14,636 38.7 38,038 8,388 22.1
1992r . . . . . . . . . . . . . . . . . . 256,549 38,014 14.8 217,936 28,961 13.3 36,446 14,205 39.0 36,842 8,075 21.91991r . . . . . . . . . . . . . . . . . . 251,192 35,708 14.2 212,723 27,143 12.8 34,795 13,824 39.7 36,845 7,773 21.11990. . . . . . . . . . . . . . . . . . . 248,644 33,585 13.5 210,967 25,232 12.0 33,795 12,578 37.2 36,056 7,446 20.71989. . . . . . . . . . . . . . . . . . . 245,992 31,528 12.8 209,515 24,066 11.5 32,525 11,668 35.9 35,185 6,760 19.21988r . . . . . . . . . . . . . . . . . . 243,530 31,745 13.0 208,056 24,048 11.6 32,164 11,972 37.2 34,340 7,070 20.6
1987r . . . . . . . . . . . . . . . . . . 240,982 32,221 13.4 206,877 24,725 12.0 31,893 12,148 38.1 32,992 6,857 20.81986. . . . . . . . . . . . . . . . . . . 238,554 32,370 13.6 205,459 24,754 12.0 31,152 11,944 38.3 31,679 6,846 21.61985. . . . . . . . . . . . . . . . . . . 236,594 33,064 14.0 203,963 25,729 12.6 30,878 11,600 37.6 31,351 6,725 21.51984. . . . . . . . . . . . . . . . . . . 233,816 33,700 14.4 202,288 26,458 13.1 30,844 11,831 38.4 30,268 6,609 21.81983. . . . . . . . . . . . . . . . . . . 231,700 35,303 15.2 201,338 27,933 13.9 30,049 12,072 40.2 29,158 6,740 23.1
1982. . . . . . . . . . . . . . . . . . . 229,412 34,398 15.0 200,385 27,349 13.6 28,834 11,701 40.6 27,908 6,458 23.11981. . . . . . . . . . . . . . . . . . . 227,157 31,822 14.0 198,541 24,850 12.5 28,587 11,051 38.7 27,714 6,490 23.41980. . . . . . . . . . . . . . . . . . . 225,027 29,272 13.0 196,963 22,601 11.5 27,565 10,120 36.7 27,133 6,227 22.91979. . . . . . . . . . . . . . . . . . . 222,903 26,072 11.7 195,860 19,964 10.2 26,927 9,400 34.9 26,170 5,743 21.91978. . . . . . . . . . . . . . . . . . . 215,656 24,497 11.4 191,071 19,062 10.0 26,032 9,269 35.6 24,585 5,435 22.1
1977. . . . . . . . . . . . . . . . . . . 213,867 24,720 11.6 190,757 19,505 10.2 25,404 9,205 36.2 23,110 5,216 22.61976. . . . . . . . . . . . . . . . . . . 212,303 24,975 11.8 190,844 19,632 10.3 24,204 9,029 37.3 21,459 5,344 24.91975. . . . . . . . . . . . . . . . . . . 210,864 25,877 12.3 190,630 20,789 10.9 23,580 8,846 37.5 20,234 5,088 25.11974. . . . . . . . . . . . . . . . . . . 209,362 23,370 11.2 190,436 18,817 9.9 23,165 8,462 36.5 18,926 4,553 24.11973. . . . . . . . . . . . . . . . . . . 207,621 22,973 11.1 189,361 18,299 9.7 21,823 8,178 37.5 18,260 4,674 25.6
1972. . . . . . . . . . . . . . . . . . . 206,004 24,460 11.9 189,193 19,577 10.3 21,264 8,114 38.2 16,811 4,883 29.01971. . . . . . . . . . . . . . . . . . . 204,554 25,559 12.5 188,242 20,405 10.8 20,153 7,797 38.7 16,311 5,154 31.61970. . . . . . . . . . . . . . . . . . . 202,183 25,420 12.6 186,692 20,330 10.9 19,673 7,503 38.1 15,491 5,090 32.91969. . . . . . . . . . . . . . . . . . . 199,517 24,147 12.1 184,891 19,175 10.4 17,995 6,879 38.2 14,626 4,972 34.01968. . . . . . . . . . . . . . . . . . . 197,628 25,389 12.8 183,825 20,695 11.3 18,048 6,990 38.7 13,803 4,694 34.0
1967. . . . . . . . . . . . . . . . . . . 195,672 27,769 14.2 182,558 22,771 12.5 17,788 6,898 38.8 13,114 4,998 38.11966. . . . . . . . . . . . . . . . . . . 193,388 28,510 14.7 181,117 23,809 13.1 17,240 6,861 39.8 12,271 4,701 38.31965. . . . . . . . . . . . . . . . . . . 191,413 33,185 17.3 179,281 28,358 15.8 16,371 7,524 46.0 12,132 4,827 39.81964. . . . . . . . . . . . . . . . . . . 189,710 36,055 19.0 177,653 30,912 17.4 (NA) 7,297 44.4 12,057 5,143 42.71963. . . . . . . . . . . . . . . . . . . 187,258 36,436 19.5 176,076 31,498 17.9 (NA) 7,646 47.7 11,182 4,938 44.2
1962. . . . . . . . . . . . . . . . . . . 184,276 38,625 21.0 173,263 33,623 19.4 (NA) 7,781 50.3 11,013 5,002 45.41961. . . . . . . . . . . . . . . . . . . 181,277 39,628 21.9 170,131 34,509 20.3 (NA) 7,252 48.1 11,146 5,119 45.91960. . . . . . . . . . . . . . . . . . . 179,503 39,851 22.2 168,615 34,925 20.7 (NA) 7,247 48.9 10,888 4,926 45.21959. . . . . . . . . . . . . . . . . . . 176,557 39,490 22.4 165,858 34,562 20.8 (NA) 7,014 49.4 10,699 4,928 46.1
See footnotes at end of table.
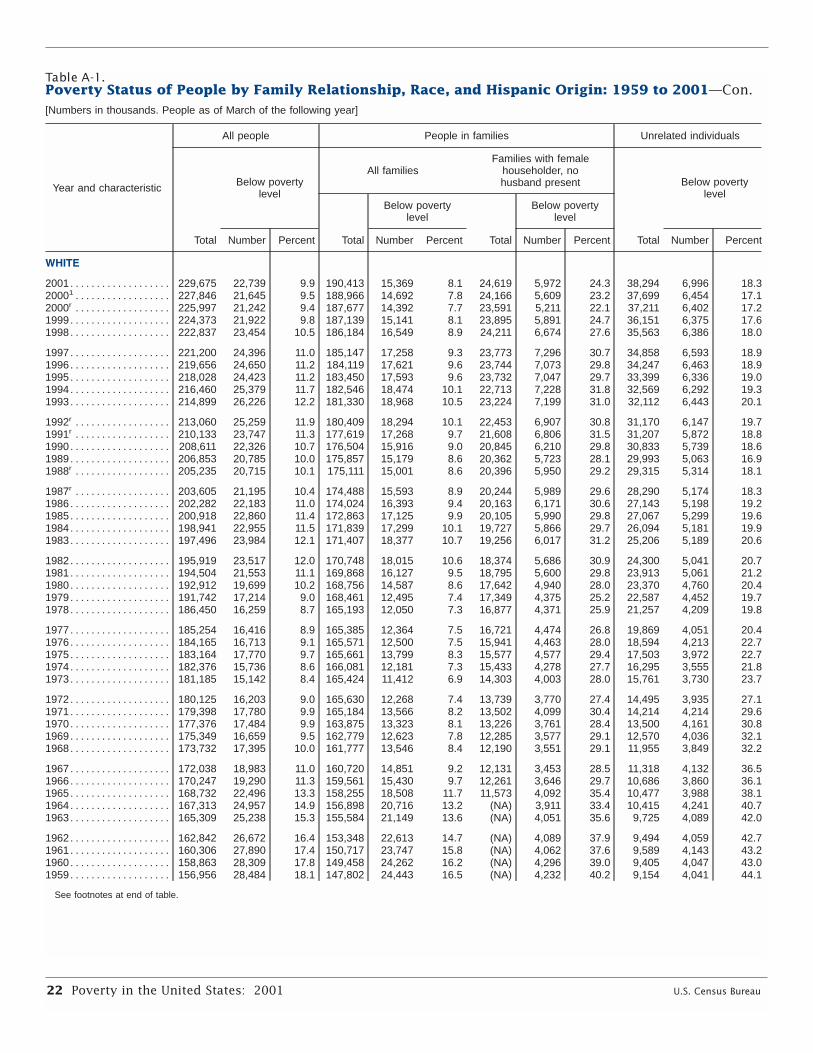
22 Poverty in the United States: 2001 U.S. Census Bureau
Table A-1.Poverty Status of People by Family Relationship, Race, and Hispanic Origin: 1959 to 2001—Con.[Numbers in thousands. People as of March of the following year]
Year and characteristic
All people People in families Unrelated individuals
Total
Below povertylevel
All familiesFamilies with female
householder, nohusband present
Total
Below povertylevel
Total
Below povertylevel
Total
Below povertylevel
Number Percent Number Percent Number Percent Number Percent
WHITE
2001. . . . . . . . . . . . . . . . . . . 229,675 22,739 9.9 190,413 15,369 8.1 24,619 5,972 24.3 38,294 6,996 18.320001 . . . . . . . . . . . . . . . . . . 227,846 21,645 9.5 188,966 14,692 7.8 24,166 5,609 23.2 37,699 6,454 17.12000r . . . . . . . . . . . . . . . . . . 225,997 21,242 9.4 187,677 14,392 7.7 23,591 5,211 22.1 37,211 6,402 17.21999. . . . . . . . . . . . . . . . . . . 224,373 21,922 9.8 187,139 15,141 8.1 23,895 5,891 24.7 36,151 6,375 17.61998. . . . . . . . . . . . . . . . . . . 222,837 23,454 10.5 186,184 16,549 8.9 24,211 6,674 27.6 35,563 6,386 18.0
1997. . . . . . . . . . . . . . . . . . . 221,200 24,396 11.0 185,147 17,258 9.3 23,773 7,296 30.7 34,858 6,593 18.91996. . . . . . . . . . . . . . . . . . . 219,656 24,650 11.2 184,119 17,621 9.6 23,744 7,073 29.8 34,247 6,463 18.91995. . . . . . . . . . . . . . . . . . . 218,028 24,423 11.2 183,450 17,593 9.6 23,732 7,047 29.7 33,399 6,336 19.01994. . . . . . . . . . . . . . . . . . . 216,460 25,379 11.7 182,546 18,474 10.1 22,713 7,228 31.8 32,569 6,292 19.31993. . . . . . . . . . . . . . . . . . . 214,899 26,226 12.2 181,330 18,968 10.5 23,224 7,199 31.0 32,112 6,443 20.1
1992r . . . . . . . . . . . . . . . . . . 213,060 25,259 11.9 180,409 18,294 10.1 22,453 6,907 30.8 31,170 6,147 19.71991r . . . . . . . . . . . . . . . . . . 210,133 23,747 11.3 177,619 17,268 9.7 21,608 6,806 31.5 31,207 5,872 18.81990. . . . . . . . . . . . . . . . . . . 208,611 22,326 10.7 176,504 15,916 9.0 20,845 6,210 29.8 30,833 5,739 18.61989. . . . . . . . . . . . . . . . . . . 206,853 20,785 10.0 175,857 15,179 8.6 20,362 5,723 28.1 29,993 5,063 16.91988r . . . . . . . . . . . . . . . . . . 205,235 20,715 10.1 175,111 15,001 8.6 20,396 5,950 29.2 29,315 5,314 18.1
1987r . . . . . . . . . . . . . . . . . . 203,605 21,195 10.4 174,488 15,593 8.9 20,244 5,989 29.6 28,290 5,174 18.31986. . . . . . . . . . . . . . . . . . . 202,282 22,183 11.0 174,024 16,393 9.4 20,163 6,171 30.6 27,143 5,198 19.21985. . . . . . . . . . . . . . . . . . . 200,918 22,860 11.4 172,863 17,125 9.9 20,105 5,990 29.8 27,067 5,299 19.61984. . . . . . . . . . . . . . . . . . . 198,941 22,955 11.5 171,839 17,299 10.1 19,727 5,866 29.7 26,094 5,181 19.91983. . . . . . . . . . . . . . . . . . . 197,496 23,984 12.1 171,407 18,377 10.7 19,256 6,017 31.2 25,206 5,189 20.6
1982. . . . . . . . . . . . . . . . . . . 195,919 23,517 12.0 170,748 18,015 10.6 18,374 5,686 30.9 24,300 5,041 20.71981. . . . . . . . . . . . . . . . . . . 194,504 21,553 11.1 169,868 16,127 9.5 18,795 5,600 29.8 23,913 5,061 21.21980. . . . . . . . . . . . . . . . . . . 192,912 19,699 10.2 168,756 14,587 8.6 17,642 4,940 28.0 23,370 4,760 20.41979. . . . . . . . . . . . . . . . . . . 191,742 17,214 9.0 168,461 12,495 7.4 17,349 4,375 25.2 22,587 4,452 19.71978. . . . . . . . . . . . . . . . . . . 186,450 16,259 8.7 165,193 12,050 7.3 16,877 4,371 25.9 21,257 4,209 19.8
1977. . . . . . . . . . . . . . . . . . . 185,254 16,416 8.9 165,385 12,364 7.5 16,721 4,474 26.8 19,869 4,051 20.41976. . . . . . . . . . . . . . . . . . . 184,165 16,713 9.1 165,571 12,500 7.5 15,941 4,463 28.0 18,594 4,213 22.71975. . . . . . . . . . . . . . . . . . . 183,164 17,770 9.7 165,661 13,799 8.3 15,577 4,577 29.4 17,503 3,972 22.71974. . . . . . . . . . . . . . . . . . . 182,376 15,736 8.6 166,081 12,181 7.3 15,433 4,278 27.7 16,295 3,555 21.81973. . . . . . . . . . . . . . . . . . . 181,185 15,142 8.4 165,424 11,412 6.9 14,303 4,003 28.0 15,761 3,730 23.7
1972. . . . . . . . . . . . . . . . . . . 180,125 16,203 9.0 165,630 12,268 7.4 13,739 3,770 27.4 14,495 3,935 27.11971. . . . . . . . . . . . . . . . . . . 179,398 17,780 9.9 165,184 13,566 8.2 13,502 4,099 30.4 14,214 4,214 29.61970. . . . . . . . . . . . . . . . . . . 177,376 17,484 9.9 163,875 13,323 8.1 13,226 3,761 28.4 13,500 4,161 30.81969. . . . . . . . . . . . . . . . . . . 175,349 16,659 9.5 162,779 12,623 7.8 12,285 3,577 29.1 12,570 4,036 32.11968. . . . . . . . . . . . . . . . . . . 173,732 17,395 10.0 161,777 13,546 8.4 12,190 3,551 29.1 11,955 3,849 32.2
1967. . . . . . . . . . . . . . . . . . . 172,038 18,983 11.0 160,720 14,851 9.2 12,131 3,453 28.5 11,318 4,132 36.51966. . . . . . . . . . . . . . . . . . . 170,247 19,290 11.3 159,561 15,430 9.7 12,261 3,646 29.7 10,686 3,860 36.11965. . . . . . . . . . . . . . . . . . . 168,732 22,496 13.3 158,255 18,508 11.7 11,573 4,092 35.4 10,477 3,988 38.11964. . . . . . . . . . . . . . . . . . . 167,313 24,957 14.9 156,898 20,716 13.2 (NA) 3,911 33.4 10,415 4,241 40.71963. . . . . . . . . . . . . . . . . . . 165,309 25,238 15.3 155,584 21,149 13.6 (NA) 4,051 35.6 9,725 4,089 42.0
1962. . . . . . . . . . . . . . . . . . . 162,842 26,672 16.4 153,348 22,613 14.7 (NA) 4,089 37.9 9,494 4,059 42.71961. . . . . . . . . . . . . . . . . . . 160,306 27,890 17.4 150,717 23,747 15.8 (NA) 4,062 37.6 9,589 4,143 43.21960. . . . . . . . . . . . . . . . . . . 158,863 28,309 17.8 149,458 24,262 16.2 (NA) 4,296 39.0 9,405 4,047 43.01959. . . . . . . . . . . . . . . . . . . 156,956 28,484 18.1 147,802 24,443 16.5 (NA) 4,232 40.2 9,154 4,041 44.1
See footnotes at end of table.

U.S. Census Bureau Poverty in the United States: 2001 23
Table A-1.Poverty Status of People by Family Relationship, Race, and Hispanic Origin: 1959 to 2001—Con.[Numbers in thousands. People as of March of the following year]
Year and characteristic
All people People in families Unrelated individuals
Total
Below povertylevel
All familiesFamilies with female
householder, nohusband present
Total
Below povertylevel
Total
Below povertylevel
Total
Below povertylevel
Number Percent Number Percent Number Percent Number Percent
WHITE NON-HISPANIC
2001. . . . . . . . . . . . . . . . . . . 194,538 15,271 7.8 159,178 9,122 5.7 18,365 3,661 19.9 34,603 5,882 17.020001 . . . . . . . . . . . . . . . . . . 193,691 14,366 7.4 158,838 8,664 5.5 18,196 3,412 18.8 33,943 5,356 15.82000r . . . . . . . . . . . . . . . . . . 193,917 14,532 7.5 159,143 8,753 5.5 18,011 3,252 18.1 33,881 5,445 16.11999. . . . . . . . . . . . . . . . . . . 193,334 14,875 7.7 159,362 9,118 5.7 18,233 3,618 19.8 33,136 5,440 16.41998. . . . . . . . . . . . . . . . . . . 192,754 15,799 8.2 159,301 10,061 6.3 18,547 4,074 22.0 32,573 5,352 16.4
1997 . . . . . . . . . . . . . . . . . . 191,859 16,491 8.6 158,796 10,401 6.5 18,474 4,604 24.9 32,049 5,632 17.61996 . . . . . . . . . . . . . . . . . . 191,459 16,462 8.6 159,044 10,553 6.6 18,597 4,339 23.3 31,410 5,455 17.41995 . . . . . . . . . . . . . . . . . . 190,951 16,267 8.5 159,402 10,599 6.6 18,340 4,183 22.8 30,586 5,303 17.31994 . . . . . . . . . . . . . . . . . . 192,543 18,110 9.4 161,254 12,118 7.5 18,186 4,743 26.1 30,157 5,500 18.21993 . . . . . . . . . . . . . . . . . . 190,843 18,882 9.9 160,062 12,756 8.0 18,508 4,724 25.5 29,681 5,570 18.8
1992r . . . . . . . . . . . . . . . . . . 189,001 18,202 9.6 159,102 12,277 7.7 18,016 4,640 25.8 28,775 5,350 18.61991r . . . . . . . . . . . . . . . . . . 189,116 17,741 9.4 158,850 11,998 7.6 17,609 4,710 26.7 29,215 5,261 18.01990 . . . . . . . . . . . . . . . . . . 188,129 16,622 8.8 158,394 11,086 7.0 17,160 4,284 25.0 28,688 5,002 17.41989 . . . . . . . . . . . . . . . . . . 186,979 15,599 8.3 158,127 10,723 6.8 16,827 3,922 23.3 28,055 4,466 15.91988r . . . . . . . . . . . . . . . . . . 185,961 15,565 8.4 157,687 10,467 6.6 16,828 3,988 23.7 27,552 4,746 17.2
1987r . . . . . . . . . . . . . . . . . . 184,936 16,029 8.7 157,785 11,051 7.0 16,787 4,075 24.3 26,439 4,613 17.41986 . . . . . . . . . . . . . . . . . . 184,119 17,244 9.4 157,665 12,078 7.7 16,739 4,350 26.0 25,525 4,668 18.31985 . . . . . . . . . . . . . . . . . . 183,455 17,839 9.7 157,106 12,706 8.1 16,749 4,136 24.7 25,544 4,789 18.71984 . . . . . . . . . . . . . . . . . . 182,469 18,300 10.0 156,930 13,234 8.4 16,742 4,193 25.0 24,671 4,659 18.91983 . . . . . . . . . . . . . . . . . . 181,393 19,538 10.8 156,719 14,437 9.2 16,369 4,448 27.2 23,894 4,746 19.9
1982 . . . . . . . . . . . . . . . . . . 181,903 19,362 10.6 157,818 14,271 9.0 15,830 4,161 26.3 23,329 4,701 20.21981 . . . . . . . . . . . . . . . . . . 180,909 17,987 9.9 157,330 12,903 8.2 16,323 4,222 25.9 22,950 4,769 20.81980 . . . . . . . . . . . . . . . . . . 179,798 16,365 9.1 156,633 11,568 7.4 15,358 3,699 24.1 22,455 4,474 19.91979 . . . . . . . . . . . . . . . . . . 178,814 14,419 8.1 156,567 10,009 6.4 15,410 3,371 21.9 21,638 4,179 19.31978 . . . . . . . . . . . . . . . . . . 174,731 13,755 7.9 154,321 9,798 6.3 15,132 3,390 22.4 20,410 3,957 19.4
1977 . . . . . . . . . . . . . . . . . . 173,563 13,802 8.0 154,449 9,977 6.5 14,888 3,429 23.0 19,114 3,825 20.01976 . . . . . . . . . . . . . . . . . . 173,235 14,025 8.1 155,324 10,066 6.5 14,261 3,516 24.7 17,912 3,959 22.11975 . . . . . . . . . . . . . . . . . . 172,417 14,883 8.6 155,539 11,137 7.2 13,809 3,570 25.9 16,879 3,746 22.21974 . . . . . . . . . . . . . . . . . . 171,463 13,217 7.7 155,764 9,854 6.3 13,763 3,379 24.6 15,699 3,364 21.41973 . . . . . . . . . . . . . . . . . . 170,488 12,864 7.5 155,330 9,262 6.0 12,731 3,185 25.0 15,158 3,602 23.8
BLACK
2001. . . . . . . . . . . . . . . . . . . 35,871 8,136 22.7 29,869 6,389 21.4 12,550 4,694 37.4 5,873 1,692 28.820001 . . . . . . . . . . . . . . . . . . 35,425 7,982 22.5 29,378 6,221 21.2 12,383 4,774 38.6 5,885 1,702 28.92000r . . . . . . . . . . . . . . . . . . 35,752 7,862 22.0 29,497 6,108 20.7 12,172 4,697 38.6 6,099 1,708 28.01999. . . . . . . . . . . . . . . . . . . 35,373 8,360 23.6 29,488 6,688 22.7 12,644 5,179 41.0 5,619 1,552 27.61998. . . . . . . . . . . . . . . . . . . 34,877 9,091 26.1 29,333 7,259 24.7 13,156 5,629 42.8 5,390 1,752 32.5
1997. . . . . . . . . . . . . . . . . . . 34,458 9,116 26.5 28,962 7,386 25.5 13,218 5,654 42.8 5,316 1,645 31.01996. . . . . . . . . . . . . . . . . . . 34,110 9,694 28.4 28,933 7,993 27.6 13,193 6,123 46.4 4,989 1,606 32.21995. . . . . . . . . . . . . . . . . . . 33,740 9,872 29.3 28,777 8,189 28.5 13,604 6,553 48.2 4,756 1,551 32.61994. . . . . . . . . . . . . . . . . . . 33,353 10,196 30.6 28,499 8,447 29.6 12,926 6,489 50.2 4,649 1,617 34.81993. . . . . . . . . . . . . . . . . . . 32,910 10,877 33.1 28,106 9,242 32.9 13,132 6,955 53.0 4,608 1,541 33.4
1992r . . . . . . . . . . . . . . . . . . 32,411 10,827 33.4 27,790 9,134 32.9 12,591 6,799 54.0 4,410 1,569 35.61991r . . . . . . . . . . . . . . . . . . 31,313 10,242 32.7 26,565 8,504 32.0 11,960 6,557 54.8 4,505 1,590 35.31990. . . . . . . . . . . . . . . . . . . 30,806 9,837 31.9 26,296 8,160 31.0 11,866 6,005 50.6 4,244 1,491 35.11989. . . . . . . . . . . . . . . . . . . 30,332 9,302 30.7 25,931 7,704 29.7 11,190 5,530 49.4 4,180 1,471 35.21988r . . . . . . . . . . . . . . . . . . 29,849 9,356 31.3 25,484 7,650 30.0 10,794 5,601 51.9 4,095 1,509 36.8
See footnotes at end of table.

24 Poverty in the United States: 2001 U.S. Census Bureau
Table A-1.Poverty Status of People by Family Relationship, Race, and Hispanic Origin: 1959 to 2001—Con.[Numbers in thousands. People as of March of the following year]
Year and characteristic
All people People in families Unrelated individuals
Total
Below povertylevel
All familiesFamilies with female
householder, nohusband present
Total
Below povertylevel
Total
Below povertylevel
Total
Below povertylevel
Number Percent Number Percent Number Percent Number Percent
BLACK—Con.
1987r . . . . . . . . . . . . . . . . . . 29,362 9,520 32.4 25,128 7,848 31.2 10,701 5,789 54.1 3,977 1,471 37.01986. . . . . . . . . . . . . . . . . . . 28,871 8,983 31.1 24,910 7,410 29.7 10,175 5,473 53.8 3,714 1,431 38.51985. . . . . . . . . . . . . . . . . . . 28,485 8,926 31.3 24,620 7,504 30.5 10,041 5,342 53.2 3,641 1,264 34.71984. . . . . . . . . . . . . . . . . . . 28,087 9,490 33.8 24,387 8,104 33.2 10,384 5,666 54.6 3,501 1,255 35.81983. . . . . . . . . . . . . . . . . . . 27,678 9,882 35.7 24,138 8,376 34.7 10,059 5,736 57.0 3,287 1,338 40.7
1982. . . . . . . . . . . . . . . . . . . 27,216 9,697 35.6 23,948 8,355 34.9 9,699 5,698 58.8 3,051 1,229 40.31981. . . . . . . . . . . . . . . . . . . 26,834 9,173 34.2 23,423 7,780 33.2 9,214 5,222 56.7 3,277 1,296 39.61980. . . . . . . . . . . . . . . . . . . 26,408 8,579 32.5 23,084 7,190 31.1 9,338 4,984 53.4 3,208 1,314 41.01979. . . . . . . . . . . . . . . . . . . 25,944 8,050 31.0 22,666 6,800 30.0 9,065 4,816 53.1 3,127 1,168 37.31978. . . . . . . . . . . . . . . . . . . 24,956 7,625 30.6 22,027 6,493 29.5 8,689 4,712 54.2 2,929 1,132 38.6
1977. . . . . . . . . . . . . . . . . . . 24,710 7,726 31.3 21,850 6,667 30.5 8,315 4,595 55.3 2,860 1,059 37.01976. . . . . . . . . . . . . . . . . . . 24,399 7,595 31.1 21,840 6,576 30.1 7,926 4,415 55.7 2,559 1,019 39.81975. . . . . . . . . . . . . . . . . . . 24,089 7,545 31.3 21,687 6,533 30.1 7,679 4,168 54.3 2,402 1,011 42.11974. . . . . . . . . . . . . . . . . . . 23,699 7,182 30.3 21,341 6,255 29.3 7,483 4,116 55.0 2,359 927 39.31973. . . . . . . . . . . . . . . . . . . 23,512 7,388 31.4 21,328 6,560 30.8 7,188 4,064 56.5 2,183 828 37.9
1972. . . . . . . . . . . . . . . . . . . 23,144 7,710 33.3 21,116 6,841 32.4 7,125 4,139 58.1 2,028 870 42.91971. . . . . . . . . . . . . . . . . . . 22,784 7,396 32.5 20,900 6,530 31.2 6,398 3,587 56.1 1,884 866 46.01970. . . . . . . . . . . . . . . . . . . 22,515 7,548 33.5 20,724 6,683 32.2 6,225 3,656 58.7 1,791 865 48.31969. . . . . . . . . . . . . . . . . . . 22,011 7,095 32.2 20,192 6,245 30.9 5,537 3,225 58.2 1,819 850 46.71968. . . . . . . . . . . . . . . . . . . 21,944 7,616 34.7 (NA) 6,839 33.7 (NA) 3,312 58.9 (NA) 777 46.3
1967. . . . . . . . . . . . . . . . . . . 21,590 8,486 39.3 (NA) 7,677 38.4 (NA) 3,362 61.6 (NA) 809 49.31966. . . . . . . . . . . . . . . . . . . 21,206 8,867 41.8 (NA) 8,090 40.9 (NA) 3,160 65.3 (NA) 777 54.41959. . . . . . . . . . . . . . . . . . . 18,013 9,927 55.1 (NA) 9,112 54.9 (NA) 2,416 70.6 1,430 815 57.0
HISPANIC2
2001. . . . . . . . . . . . . . . . . . . 37,312 7,997 21.4 33,110 6,674 20.2 6,830 2,585 37.8 3,981 1,211 30.420001 . . . . . . . . . . . . . . . . . . 35,955 7,747 21.5 31,700 6,430 20.3 6,469 2,444 37.8 3,978 1,163 29.22000r . . . . . . . . . . . . . . . . . . 33,716 7,153 21.2 29,976 6,025 20.1 6,048 2,210 36.5 3,521 1,013 28.81999. . . . . . . . . . . . . . . . . . . 32,669 7,439 22.8 29,198 6,349 21.7 6,113 2,488 40.7 3,207 991 30.91998. . . . . . . . . . . . . . . . . . . 31,515 8,070 25.6 28,055 6,814 24.3 6,074 2,837 46.7 3,218 1,097 34.1
1997. . . . . . . . . . . . . . . . . . . 30,637 8,308 27.1 27,467 7,198 26.2 5,718 2,911 50.9 2,976 1,017 34.21996. . . . . . . . . . . . . . . . . . . 29,614 8,697 29.4 26,340 7,515 28.5 5,641 3,020 53.5 2,985 1,066 35.71995. . . . . . . . . . . . . . . . . . . 28,344 8,574 30.3 25,165 7,341 29.2 5,785 3,053 52.8 2,947 1,092 37.01994. . . . . . . . . . . . . . . . . . . 27,442 8,416 30.7 24,390 7,357 30.2 5,328 2,920 54.8 2,798 926 33.11993. . . . . . . . . . . . . . . . . . . 26,559 8,126 30.6 23,439 6,876 29.3 5,333 2,837 53.2 2,717 972 35.8
1992r . . . . . . . . . . . . . . . . . . 25,646 7,592 29.6 22,695 6,455 28.4 4,806 2,474 51.5 2,577 881 34.21991r . . . . . . . . . . . . . . . . . . 22,070 6,339 28.7 19,658 5,541 28.2 4,326 2,282 52.7 2,146 667 31.11990. . . . . . . . . . . . . . . . . . . 21,405 6,006 28.1 18,912 5,091 26.9 3,993 2,115 53.0 2,254 774 34.31989. . . . . . . . . . . . . . . . . . . 20,746 5,430 26.2 18,488 4,659 25.2 3,763 1,902 50.6 2,045 634 31.01988r . . . . . . . . . . . . . . . . . . 20,064 5,357 26.7 18,102 4,700 26.0 3,734 2,052 55.0 1,864 597 32.0
1987r . . . . . . . . . . . . . . . . . . 19,395 5,422 28.0 17,342 4,761 27.5 3,678 2,045 55.6 1,933 598 31.01986. . . . . . . . . . . . . . . . . . . 18,758 5,117 27.3 16,880 4,469 26.5 3,631 1,921 52.9 1,685 553 32.81985. . . . . . . . . . . . . . . . . . . 18,075 5,236 29.0 16,276 4,605 28.3 3,561 1,983 55.7 1,602 532 33.21984. . . . . . . . . . . . . . . . . . . 16,916 4,806 28.4 15,293 4,192 27.4 3,139 1,764 56.2 1,481 545 36.81983. . . . . . . . . . . . . . . . . . . 16,544 4,633 28.0 15,075 4,113 27.3 3,032 1,670 55.1 1,364 457 33.5
See footnotes at end of table.
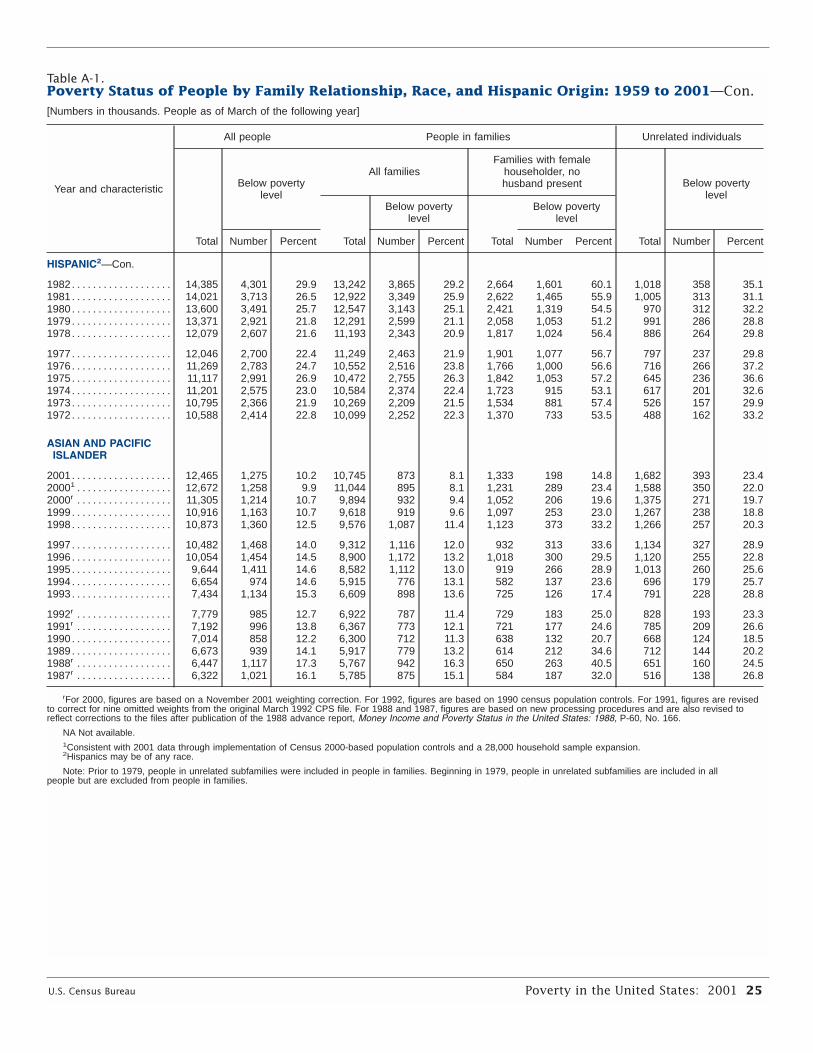
U.S. Census Bureau Poverty in the United States: 2001 25
Table A-1.Poverty Status of People by Family Relationship, Race, and Hispanic Origin: 1959 to 2001—Con.[Numbers in thousands. People as of March of the following year]
Year and characteristic
All people People in families Unrelated individuals
Total
Below povertylevel
All familiesFamilies with female
householder, nohusband present
Total
Below povertylevel
Total
Below povertylevel
Total
Below povertylevel
Number Percent Number Percent Number Percent Number Percent
HISPANIC2—Con.
1982. . . . . . . . . . . . . . . . . . . 14,385 4,301 29.9 13,242 3,865 29.2 2,664 1,601 60.1 1,018 358 35.11981. . . . . . . . . . . . . . . . . . . 14,021 3,713 26.5 12,922 3,349 25.9 2,622 1,465 55.9 1,005 313 31.11980. . . . . . . . . . . . . . . . . . . 13,600 3,491 25.7 12,547 3,143 25.1 2,421 1,319 54.5 970 312 32.21979. . . . . . . . . . . . . . . . . . . 13,371 2,921 21.8 12,291 2,599 21.1 2,058 1,053 51.2 991 286 28.81978. . . . . . . . . . . . . . . . . . . 12,079 2,607 21.6 11,193 2,343 20.9 1,817 1,024 56.4 886 264 29.8
1977. . . . . . . . . . . . . . . . . . . 12,046 2,700 22.4 11,249 2,463 21.9 1,901 1,077 56.7 797 237 29.81976. . . . . . . . . . . . . . . . . . . 11,269 2,783 24.7 10,552 2,516 23.8 1,766 1,000 56.6 716 266 37.21975. . . . . . . . . . . . . . . . . . . 11,117 2,991 26.9 10,472 2,755 26.3 1,842 1,053 57.2 645 236 36.61974. . . . . . . . . . . . . . . . . . . 11,201 2,575 23.0 10,584 2,374 22.4 1,723 915 53.1 617 201 32.61973. . . . . . . . . . . . . . . . . . . 10,795 2,366 21.9 10,269 2,209 21.5 1,534 881 57.4 526 157 29.91972. . . . . . . . . . . . . . . . . . . 10,588 2,414 22.8 10,099 2,252 22.3 1,370 733 53.5 488 162 33.2
ASIAN AND PACIFICISLANDER
2001. . . . . . . . . . . . . . . . . . . 12,465 1,275 10.2 10,745 873 8.1 1,333 198 14.8 1,682 393 23.420001 . . . . . . . . . . . . . . . . . . 12,672 1,258 9.9 11,044 895 8.1 1,231 289 23.4 1,588 350 22.02000r . . . . . . . . . . . . . . . . . . 11,305 1,214 10.7 9,894 932 9.4 1,052 206 19.6 1,375 271 19.71999. . . . . . . . . . . . . . . . . . . 10,916 1,163 10.7 9,618 919 9.6 1,097 253 23.0 1,267 238 18.81998. . . . . . . . . . . . . . . . . . . 10,873 1,360 12.5 9,576 1,087 11.4 1,123 373 33.2 1,266 257 20.3
1997. . . . . . . . . . . . . . . . . . . 10,482 1,468 14.0 9,312 1,116 12.0 932 313 33.6 1,134 327 28.91996. . . . . . . . . . . . . . . . . . . 10,054 1,454 14.5 8,900 1,172 13.2 1,018 300 29.5 1,120 255 22.81995. . . . . . . . . . . . . . . . . . . 9,644 1,411 14.6 8,582 1,112 13.0 919 266 28.9 1,013 260 25.61994. . . . . . . . . . . . . . . . . . . 6,654 974 14.6 5,915 776 13.1 582 137 23.6 696 179 25.71993. . . . . . . . . . . . . . . . . . . 7,434 1,134 15.3 6,609 898 13.6 725 126 17.4 791 228 28.8
1992r . . . . . . . . . . . . . . . . . . 7,779 985 12.7 6,922 787 11.4 729 183 25.0 828 193 23.31991r . . . . . . . . . . . . . . . . . . 7,192 996 13.8 6,367 773 12.1 721 177 24.6 785 209 26.61990. . . . . . . . . . . . . . . . . . . 7,014 858 12.2 6,300 712 11.3 638 132 20.7 668 124 18.51989. . . . . . . . . . . . . . . . . . . 6,673 939 14.1 5,917 779 13.2 614 212 34.6 712 144 20.21988r . . . . . . . . . . . . . . . . . . 6,447 1,117 17.3 5,767 942 16.3 650 263 40.5 651 160 24.51987r . . . . . . . . . . . . . . . . . . 6,322 1,021 16.1 5,785 875 15.1 584 187 32.0 516 138 26.8
rFor 2000, figures are based on a November 2001 weighting correction. For 1992, figures are based on 1990 census population controls. For 1991, figures are revisedto correct for nine omitted weights from the original March 1992 CPS file. For 1988 and 1987, figures are based on new processing procedures and are also revised toreflect corrections to the files after publication of the 1988 advance report, Money Income and Poverty Status in the United States: 1988, P-60, No. 166.
NA Not available.1Consistent with 2001 data through implementation of Census 2000-based population controls and a 28,000 household sample expansion.2Hispanics may be of any race.
Note: Prior to 1979, people in unrelated subfamilies were included in people in families. Beginning in 1979, people in unrelated subfamilies are included in allpeople but are excluded from people in families.

26 Poverty in the United States: 2001 U.S. Census Bureau
Table A-2.Poverty Status of People by Age, Race, and Hispanic Origin: 1959 to 2001[Numbers in thousands. People as of March of the following year]
Year and characteristic
Under 18 years 18 to 64 years 65 years and over
All people Related children in families
Total
Below povertylevel
Total
Below povertylevel
Total
Below povertylevel
Total
Below povertylevel
Number Percent Number Percent Number Percent Number Percent
ALL RACES
2001. . . . . . . . . . . . . . . . . . . 72,021 11,733 16.3 70,950 11,175 15.8 175,685 17,760 10.1 33,769 3,414 10.120001 . . . . . . . . . . . . . . . . . . 71,741 11,587 16.2 70,538 11,005 15.6 173,638 16,671 9.6 33,566 3,323 9.92000r . . . . . . . . . . . . . . . . . . 71,936 11,553 16.1 70,767 11,018 15.6 171,009 16,143 9.4 32,978 3,359 10.21999. . . . . . . . . . . . . . . . . . . 71,731 12,109 16.9 70,480 11,510 16.3 169,141 16,982 10.0 32,621 3,167 9.71998. . . . . . . . . . . . . . . . . . . 71,338 13,467 18.9 70,253 12,845 18.3 167,327 17,623 10.5 32,394 3,386 10.5
1997. . . . . . . . . . . . . . . . . . . 71,069 14,113 19.9 69,844 13,422 19.2 165,329 18,085 10.9 32,082 3,376 10.51996. . . . . . . . . . . . . . . . . . . 70,650 14,463 20.5 69,411 13,764 19.8 163,691 18,638 11.4 31,877 3,428 10.81995. . . . . . . . . . . . . . . . . . . 70,566 14,665 20.8 69,425 13,999 20.2 161,508 18,442 11.4 31,658 3,318 10.51994. . . . . . . . . . . . . . . . . . . 70,020 15,289 21.8 68,819 14,610 21.2 160,329 19,107 11.9 31,267 3,663 11.71993. . . . . . . . . . . . . . . . . . . 69,292 15,727 22.7 68,040 14,961 22.0 159,208 19,781 12.4 30,779 3,755 12.2
1992r . . . . . . . . . . . . . . . . . . 68,440 15,294 22.3 67,256 14,521 21.6 157,680 18,793 11.9 30,430 3,928 12.91991r . . . . . . . . . . . . . . . . . . 65,918 14,341 21.8 64,800 13,658 21.1 154,684 17,586 11.4 30,590 3,781 12.41990. . . . . . . . . . . . . . . . . . . 65,049 13,431 20.6 63,908 12,715 19.9 153,502 16,496 10.7 30,093 3,658 12.21989. . . . . . . . . . . . . . . . . . . 64,144 12,590 19.6 63,225 12,001 19.0 152,282 15,575 10.2 29,566 3,363 11.41988r . . . . . . . . . . . . . . . . . . 63,747 12,455 19.5 62,906 11,935 19.0 150,761 15,809 10.5 29,022 3,481 12.0
1987r . . . . . . . . . . . . . . . . . . 63,294 12,843 20.3 62,423 12,275 19.7 149,201 15,815 10.6 28,487 3,563 12.51986. . . . . . . . . . . . . . . . . . . 62,948 12,876 20.5 62,009 12,257 19.8 147,631 16,017 10.8 27,975 3,477 12.41985. . . . . . . . . . . . . . . . . . . 62,876 13,010 20.7 62,019 12,483 20.1 146,396 16,598 11.3 27,322 3,456 12.61984. . . . . . . . . . . . . . . . . . . 62,447 13,420 21.5 61,681 12,929 21.0 144,551 16,952 11.7 26,818 3,330 12.41983. . . . . . . . . . . . . . . . . . . 62,334 13,911 22.3 61,578 13,427 21.8 143,052 17,767 12.4 26,313 3,625 13.8
1982. . . . . . . . . . . . . . . . . . . 62,345 13,647 21.9 61,565 13,139 21.3 141,328 17,000 12.0 25,738 3,751 14.61981. . . . . . . . . . . . . . . . . . . 62,449 12,505 20.0 61,756 12,068 19.5 139,477 15,464 11.1 25,231 3,853 15.31980. . . . . . . . . . . . . . . . . . . 62,914 11,543 18.3 62,168 11,114 17.9 137,428 13,858 10.1 24,686 3,871 15.71979. . . . . . . . . . . . . . . . . . . 63,375 10,377 16.4 62,646 9,993 16.0 135,333 12,014 8.9 24,194 3,682 15.21978. . . . . . . . . . . . . . . . . . . 62,311 9,931 15.9 61,987 9,722 15.7 130,169 11,332 8.7 23,175 3,233 14.0
1977. . . . . . . . . . . . . . . . . . . 63,137 10,288 16.2 62,823 10,028 16.0 128,262 11,316 8.8 22,468 3,177 14.11976. . . . . . . . . . . . . . . . . . . 64,028 10,273 16.0 63,729 10,081 15.8 126,175 11,389 9.0 22,100 3,313 15.01975. . . . . . . . . . . . . . . . . . . 65,079 11,104 17.1 64,750 10,882 16.8 124,122 11,456 9.2 21,662 3,317 15.31974. . . . . . . . . . . . . . . . . . . 66,134 10,156 15.4 65,802 9,967 15.1 122,101 10,132 8.3 21,127 3,085 14.61973. . . . . . . . . . . . . . . . . . . 66,959 9,642 14.4 66,626 9,453 14.2 120,060 9,977 8.3 20,602 3,354 16.3
1972. . . . . . . . . . . . . . . . . . . 67,930 10,284 15.1 67,592 10,082 14.9 117,957 10,438 8.8 20,117 3,738 18.61971. . . . . . . . . . . . . . . . . . . 68,816 10,551 15.3 68,474 10,344 15.1 115,911 10,735 9.3 19,827 4,273 21.61970. . . . . . . . . . . . . . . . . . . 69,159 10,440 15.1 68,815 10,235 14.9 113,554 10,187 9.0 19,470 4,793 24.61969. . . . . . . . . . . . . . . . . . . 69,090 9,691 14.0 68,746 9,501 13.8 111,528 9,669 8.7 18,899 4,787 25.31968. . . . . . . . . . . . . . . . . . . 70,385 10,954 15.6 70,035 10,739 15.3 108,684 9,803 9.0 18,559 4,632 25.0
1967. . . . . . . . . . . . . . . . . . . 70,408 11,656 16.6 70,058 11,427 16.3 107,024 10,725 10.0 18,240 5,388 29.51966. . . . . . . . . . . . . . . . . . . 70,218 12,389 17.6 69,869 12,146 17.4 105,241 11,007 10.5 17,929 5,114 28.51965. . . . . . . . . . . . . . . . . . . 69,986 14,676 21.0 69,638 14,388 20.7 (NA) (NA) (NA) (NA) (NA) (NA)1964. . . . . . . . . . . . . . . . . . . 69,711 16,051 23.0 69,364 15,736 22.7 (NA) (NA) (NA) (NA) (NA) (NA)1963. . . . . . . . . . . . . . . . . . . 69,181 16,005 23.1 68,837 15,691 22.8 (NA) (NA) (NA) (NA) (NA) (NA)
1962. . . . . . . . . . . . . . . . . . . 67,722 16,963 25.0 67,385 16,630 24.7 (NA) (NA) (NA) (NA) (NA) (NA)1961. . . . . . . . . . . . . . . . . . . 66,121 16,909 25.6 65,792 16,577 25.2 (NA) (NA) (NA) (NA) (NA) (NA)1960. . . . . . . . . . . . . . . . . . . 65,601 17,634 26.9 65,275 17,288 26.5 (NA) (NA) (NA) (NA) (NA) (NA)1959. . . . . . . . . . . . . . . . . . . 64,315 17,552 27.3 63,995 17,208 26.9 96,685 16,457 17.0 15,557 5,481 35.2
See footnotes at end of table.

U.S. Census Bureau Poverty in the United States: 2001 27
Table A-2.Poverty Status of People by Age, Race, and Hispanic Origin: 1959 to 2001—Con.[Numbers in thousands. People as of March of the following year]
Year and characteristic
Under 18 years 18 to 64 years 65 years and over
All people Related children in families
Total
Below povertylevel
Total
Below povertylevel
Total
Below povertylevel
Total
Below povertylevel
Number Percent Number Percent Number Percent Number Percent
WHITE
2001. . . . . . . . . . . . . . . . . . . 56,089 7,527 13.4 55,238 7,086 12.8 143,796 12,555 8.7 29,790 2,656 8.920001 . . . . . . . . . . . . . . . . . . 55,980 7,307 13.1 55,021 6,834 12.4 142,164 11,754 8.3 29,703 2,584 8.72000r . . . . . . . . . . . . . . . . . . 56,412 7,283 12.9 55,463 6,838 12.3 140,463 11,359 8.1 29,122 2,601 8.91999. . . . . . . . . . . . . . . . . . . 56,232 7,568 13.5 55,274 7,123 12.9 139,261 11,945 8.6 28,880 2,409 8.31998. . . . . . . . . . . . . . . . . . . 56,016 8,443 15.1 55,126 7,935 14.4 138,061 12,456 9.0 28,759 2,555 8.9
1997. . . . . . . . . . . . . . . . . . . 55,863 8,990 16.1 54,870 8,441 15.4 136,784 12,838 9.4 28,553 2,569 9.01996. . . . . . . . . . . . . . . . . . . 55,606 9,044 16.3 54,599 8,488 15.5 135,586 12,940 9.5 28,464 2,667 9.41995. . . . . . . . . . . . . . . . . . . 55,444 8,981 16.2 54,532 8,474 15.5 134,149 12,869 9.6 28,436 2,572 9.01994. . . . . . . . . . . . . . . . . . . 55,186 9,346 16.9 54,221 8,826 16.3 133,289 13,187 9.9 27,985 2,846 10.21993. . . . . . . . . . . . . . . . . . . 54,639 9,752 17.8 53,614 9,123 17.0 132,680 13,535 10.2 27,580 2,939 10.7
1992r . . . . . . . . . . . . . . . . . . 54,110 9,399 17.4 53,110 8,752 16.5 131,694 12,871 9.8 27,256 2,989 11.01991r . . . . . . . . . . . . . . . . . . 52,523 8,848 16.8 51,627 8,316 16.1 130,312 12,097 9.3 27,297 2,802 10.31990. . . . . . . . . . . . . . . . . . . 51,929 8,232 15.9 51,028 7,696 15.1 129,784 11,387 8.8 26,898 2,707 10.11989. . . . . . . . . . . . . . . . . . . 51,400 7,599 14.8 50,704 7,164 14.1 128,974 10,647 8.3 26,479 2,539 9.61988r . . . . . . . . . . . . . . . . . . 51,203 7,435 14.5 50,590 7,095 14.0 128,031 10,687 8.3 26,001 2,593 10.0
1987r . . . . . . . . . . . . . . . . . . 51,012 7,788 15.3 50,360 7,398 14.7 126,991 10,703 8.4 25,602 2,704 10.61986. . . . . . . . . . . . . . . . . . . 51,111 8,209 16.1 50,356 7,714 15.3 125,998 11,285 9.0 25,173 2,689 10.71985. . . . . . . . . . . . . . . . . . . 51,031 8,253 16.2 50,358 7,838 15.6 125,258 11,909 9.5 24,629 2,698 11.01984. . . . . . . . . . . . . . . . . . . 50,814 8,472 16.7 50,192 8,086 16.1 123,922 11,904 9.6 24,206 2,579 10.71983. . . . . . . . . . . . . . . . . . . 50,726 8,862 17.5 50,183 8,534 17.0 123,014 12,347 10.0 23,754 2,776 11.7
1982. . . . . . . . . . . . . . . . . . . 50,920 8,678 17.0 50,305 8,282 16.5 121,766 11,971 9.8 23,234 2,870 12.41981. . . . . . . . . . . . . . . . . . . 51,140 7,785 15.2 50,553 7,429 14.7 120,574 10,790 8.9 22,791 2,978 13.11980. . . . . . . . . . . . . . . . . . . 51,653 7,181 13.9 51,002 6,817 13.4 118,935 9,478 8.0 22,325 3,042 13.61979. . . . . . . . . . . . . . . . . . . 52,262 6,193 11.8 51,687 5,909 11.4 117,583 8,110 6.9 21,898 2,911 13.31978. . . . . . . . . . . . . . . . . . . 51,669 5,831 11.3 51,409 5,674 11.0 113,832 7,897 6.9 20,950 2,530 12.1
1977. . . . . . . . . . . . . . . . . . . 52,563 6,097 11.6 52,299 5,943 11.4 112,374 7,893 7.0 20,316 2,426 11.91976. . . . . . . . . . . . . . . . . . . 53,428 6,189 11.6 53,167 6,034 11.3 110,717 7,890 7.1 20,020 2,633 13.21975. . . . . . . . . . . . . . . . . . . 54,405 6,927 12.7 54,126 6,748 12.5 109,105 8,210 7.5 19,654 2,634 13.41974. . . . . . . . . . . . . . . . . . . 55,590 6,223 11.2 55,320 6,079 11.0 107,579 7,053 6.6 19,206 2,460 12.81973. . . . . . . . . . . . . . . . . . . (NA) (NA) (NA) 56,211 5,462 9.7 (NA) (NA) (NA) (NA) 2,698 14.4
1972. . . . . . . . . . . . . . . . . . . (NA) (NA) (NA) 57,181 5,784 10.1 (NA) (NA) (NA) (NA) 3,072 16.81971. . . . . . . . . . . . . . . . . . . (NA) (NA) (NA) 58,119 6,341 10.9 (NA) (NA) (NA) (NA) 3,605 19.91970. . . . . . . . . . . . . . . . . . . (NA) (NA) (NA) 58,472 6,138 10.5 (NA) (NA) (NA) (NA) 4,011 22.61969. . . . . . . . . . . . . . . . . . . (NA) (NA) (NA) 58,578 5,667 9.7 (NA) (NA) (NA) (NA) 4,052 23.31968. . . . . . . . . . . . . . . . . . . (NA) (NA) (NA) (NA) 6,373 10.7 (NA) (NA) (NA) 17,062 3,939 23.1
1967. . . . . . . . . . . . . . . . . . . (NA) (NA) (NA) (NA) 6,729 11.3 (NA) (NA) (NA) 16,791 4,646 27.71966. . . . . . . . . . . . . . . . . . . (NA) (NA) (NA) (NA) 7,204 12.1 (NA) (NA) (NA) 16,514 4,357 26.41965. . . . . . . . . . . . . . . . . . . (NA) (NA) (NA) (NA) 8,595 14.4 (NA) (NA) (NA) (NA) (NA) (NA)1960. . . . . . . . . . . . . . . . . . . (NA) (NA) (NA) (NA) 11,229 20.0 (NA) (NA) (NA) (NA) (NA) (NA)1959. . . . . . . . . . . . . . . . . . . (NA) (NA) (NA) (NA) 11,386 20.6 (NA) (NA) (NA) (NA) 4,744 33.1
NON-HISPANIC WHITE
2001. . . . . . . . . . . . . . . . . . . 44,095 4,194 9.5 43,459 3,887 8.9 122,470 8,811 7.2 27,973 2,266 8.120001 . . . . . . . . . . . . . . . . . . 44,244 4,018 9.1 43,554 3,715 8.5 121,499 8,130 6.7 27,948 2,218 7.92000r . . . . . . . . . . . . . . . . . . 45,155 4,185 9.3 44,447 3,886 8.7 121,454 8,083 6.7 27,308 2,264 8.31999. . . . . . . . . . . . . . . . . . . 45,243 4,252 9.4 44,527 3,921 8.8 120,905 8,559 7.1 27,187 2,063 7.61998. . . . . . . . . . . . . . . . . . . 45,355 4,822 10.6 44,670 4,458 10.0 120,282 8,760 7.3 27,118 2,217 8.2
See footnotes at end of table.

28 Poverty in the United States: 2001 U.S. Census Bureau
Table A-2.Poverty Status of People by Age, Race, and Hispanic Origin: 1959 to 2001—Con.[Numbers in thousands. People as of March of the following year]
Year and characteristic
Under 18 years 18 to 64 years 65 years and over
All people Related children in families
Total
Below povertylevel
Total
Below povertylevel
Total
Below povertylevel
Total
Below povertylevel
Number Percent Number Percent Number Percent Number Percent
NON-HISPANICWHITE—Con.
1997 . . . . . . . . . . . . . . . . . . 45,491 5,204 11.4 44,665 4,759 10.7 119,373 9,088 7.6 26,995 2,200 8.11996 . . . . . . . . . . . . . . . . . . 45,605 5,072 11.1 44,844 4,656 10.4 118,822 9,074 7.6 27,033 2,316 8.61995 . . . . . . . . . . . . . . . . . . 45,689 5,115 11.2 44,973 4,745 10.6 118,228 8,908 7.5 27,034 2,243 8.31994 . . . . . . . . . . . . . . . . . . 46,668 5,823 12.5 45,874 5,404 11.8 119,192 9,732 8.2 26,684 2,556 9.61993 . . . . . . . . . . . . . . . . . . 46,096 6,255 13.6 45,322 5,819 12.8 118,475 9,964 8.4 26,272 2,663 10.1
1992r . . . . . . . . . . . . . . . . . . 45,590 6,017 13.2 44,833 5,558 12.4 117,386 9,461 8.1 26,025 2,724 10.51991r . . . . . . . . . . . . . . . . . . 45,236 5,918 13.1 44,506 5,497 12.4 117,672 9,244 7.9 26,208 2,580 9.81990 . . . . . . . . . . . . . . . . . . 44,797 5,532 12.3 44,045 5,106 11.6 117,477 8,619 7.3 25,854 2,471 9.61989 . . . . . . . . . . . . . . . . . . 44,492 5,110 11.5 43,938 4,779 10.9 116,983 8,154 7.0 25,504 2,335 9.21988r . . . . . . . . . . . . . . . . . . 44,438 4,888 11.0 43,910 4,594 10.5 116,479 8,293 7.1 25,044 2,384 9.5
1987r . . . . . . . . . . . . . . . . . . 44,461 5,230 11.8 43,907 4,902 11.2 115,721 8,327 7.2 24,754 2,472 10.01986 . . . . . . . . . . . . . . . . . . 44,664 5,789 13.0 44,041 5,388 12.2 115,157 8,963 7.8 24,298 2,492 10.31985 . . . . . . . . . . . . . . . . . . 44,752 5,745 12.8 44,199 5,421 12.3 114,969 9,608 8.4 23,734 2,486 10.51984 . . . . . . . . . . . . . . . . . . 44,886 6,156 13.7 44,349 5,828 13.1 114,180 9,734 8.5 23,402 2,410 10.31983 . . . . . . . . . . . . . . . . . . 44,830 6,649 14.8 44,374 6,381 14.4 113,570 10,279 9.1 22,992 2,610 11.4
1982 . . . . . . . . . . . . . . . . . . 45,531 6,566 14.4 45,001 6,229 13.8 113,717 10,082 8.9 22,655 2,714 12.01981 . . . . . . . . . . . . . . . . . . 45,950 5,946 12.9 45,440 5,639 12.4 112,722 9,207 8.2 22,237 2,834 12.71980 . . . . . . . . . . . . . . . . . . 46,578 5,510 11.8 45,989 5,174 11.3 111,460 7,990 7.2 21,760 2,865 13.21979 . . . . . . . . . . . . . . . . . . 46,967 4,730 10.1 46,448 4,476 9.6 110,509 6,930 6.3 21,339 2,759 12.91978 . . . . . . . . . . . . . . . . . . 46,819 4,506 9.6 46,606 4,383 9.4 107,481 6,837 6.4 20,431 2,412 11.8
1977 . . . . . . . . . . . . . . . . . . 47,689 4,714 9.9 47,459 4,582 9.7 106,063 6,772 6.4 19,812 2,316 11.71976 . . . . . . . . . . . . . . . . . . 48,824 4,799 9.8 48,601 4,664 9.6 104,846 6,720 6.4 19,565 2,506 12.81975 . . . . . . . . . . . . . . . . . . 49,670 5,342 10.8 49,421 5,185 10.5 103,496 7,039 6.8 19,251 2,503 13.01974 . . . . . . . . . . . . . . . . . . 50,759 4,820 9.5 50,520 4,697 9.3 101,894 6,051 5.9 18,810 2,346 12.5
BLACK
2001. . . . . . . . . . . . . . . . . . . 11,556 3,492 30.2 11,419 3,423 30.0 21,462 4,018 18.7 2,853 626 21.920001 . . . . . . . . . . . . . . . . . . 11,480 3,581 31.2 11,296 3,495 30.9 21,161 3,794 17.9 2,785 607 21.82000r . . . . . . . . . . . . . . . . . . 11,407 3,487 30.6 11,242 3,417 30.4 21,556 3,752 17.4 2,789 623 22.41999. . . . . . . . . . . . . . . . . . . 11,357 3,759 33.1 11,132 3,644 32.7 21,261 3,975 18.7 2,754 626 22.71998. . . . . . . . . . . . . . . . . . . 11,317 4,151 36.7 11,176 4,073 36.4 20,837 4,222 20.3 2,723 718 26.4
1997. . . . . . . . . . . . . . . . . . . 11,367 4,225 37.2 11,193 4,116 36.8 20,400 4,191 20.5 2,691 700 26.01996. . . . . . . . . . . . . . . . . . . 11,338 4,519 39.9 11,155 4,411 39.5 20,155 4,515 22.4 2,616 661 25.31995. . . . . . . . . . . . . . . . . . . 11,369 4,761 41.9 11,198 4,644 41.5 19,892 4,483 22.5 2,478 629 25.41994. . . . . . . . . . . . . . . . . . . 11,211 4,906 43.8 11,044 4,787 43.3 19,585 4,590 23.4 2,557 700 27.41993. . . . . . . . . . . . . . . . . . . 11,127 5,125 46.1 10,969 5,030 45.9 19,272 5,049 26.2 2,510 702 28.0
1992r . . . . . . . . . . . . . . . . . . 10,956 5,106 46.6 10,823 5,015 46.3 18,952 4,884 25.8 2,504 838 33.51991r . . . . . . . . . . . . . . . . . . 10,350 4,755 45.9 10,178 4,637 45.6 18,355 4,607 25.1 2,606 880 33.81990. . . . . . . . . . . . . . . . . . . 10,162 4,550 44.8 9,980 4,412 44.2 18,097 4,427 24.5 2,547 860 33.81989. . . . . . . . . . . . . . . . . . . 10,012 4,375 43.7 9,847 4,257 43.2 17,833 4,164 23.3 2,487 763 30.71988r . . . . . . . . . . . . . . . . . . 9,865 4,296 43.5 9,681 4,148 42.8 17,548 4,275 24.4 2,436 785 32.2
1987r . . . . . . . . . . . . . . . . . . 9,730 4,385 45.1 9,546 4,234 44.4 17,245 4,361 25.3 2,387 774 32.41986. . . . . . . . . . . . . . . . . . . 9,629 4,148 43.1 9,467 4,037 42.7 16,911 4,113 24.3 2,331 722 31.01985. . . . . . . . . . . . . . . . . . . 9,545 4,157 43.6 9,405 4,057 43.1 16,667 4,052 24.3 2,273 717 31.51984. . . . . . . . . . . . . . . . . . . 9,480 4,413 46.6 9,356 4,320 46.2 16,369 4,368 26.7 2,238 710 31.71983. . . . . . . . . . . . . . . . . . . 9,417 4,398 46.7 9,245 4,273 46.2 16,065 4,694 29.2 2,197 791 36.0
See footnotes at end of table.

U.S. Census Bureau Poverty in the United States: 2001 29
Table A-2.Poverty Status of People by Age, Race, and Hispanic Origin: 1959 to 2001—Con.[Numbers in thousands. People as of March of the following year]
Year and characteristic
Under 18 years 18 to 64 years 65 years and over
All people Related children in families
Total
Below povertylevel
Total
Below povertylevel
Total
Below povertylevel
Total
Below povertylevel
Number Percent Number Percent Number Percent Number Percent
BLACK—Con.
1982. . . . . . . . . . . . . . . . . . . 9,400 4,472 47.6 9,269 4,388 47.3 15,692 4,415 28.1 2,124 811 38.21981. . . . . . . . . . . . . . . . . . . 9,374 4,237 45.2 9,291 4,170 44.9 15,358 4,117 26.8 2,102 820 39.01980. . . . . . . . . . . . . . . . . . . 9,368 3,961 42.3 9,287 3,906 42.1 14,987 3,835 25.6 2,054 783 38.11979. . . . . . . . . . . . . . . . . . . 9,307 3,833 41.2 9,172 3,745 40.8 14,596 3,478 23.8 2,040 740 36.21978. . . . . . . . . . . . . . . . . . . 9,229 3,830 41.5 9,168 3,781 41.2 13,774 3,133 22.7 1,954 662 33.9
1977. . . . . . . . . . . . . . . . . . . 9,296 3,888 41.8 9,253 3,850 41.6 13,483 3,137 23.3 1,930 701 36.31976. . . . . . . . . . . . . . . . . . . 9,322 3,787 40.6 9,291 3,758 40.4 13,224 3,163 23.9 1,852 644 34.81975. . . . . . . . . . . . . . . . . . . 9,421 3,925 41.7 9,374 3,884 41.4 12,872 2,968 23.1 1,795 652 36.31974. . . . . . . . . . . . . . . . . . . 9,439 3,755 39.8 9,384 3,713 39.6 12,539 2,836 22.6 1,721 591 34.31973. . . . . . . . . . . . . . . . . . . (NA) (NA) (NA) 9,405 3,822 40.6 (NA) (NA) (NA) 1,672 620 37.1
1972. . . . . . . . . . . . . . . . . . . (NA) (NA) (NA) 9,426 4,025 42.7 (NA) (NA) (NA) 1,603 640 39.91971. . . . . . . . . . . . . . . . . . . (NA) (NA) (NA) 9,414 3,836 40.4 (NA) (NA) (NA) 1,584 623 39.31970. . . . . . . . . . . . . . . . . . . (NA) (NA) (NA) 9,448 3,922 41.5 (NA) (NA) (NA) 1,422 683 48.01969. . . . . . . . . . . . . . . . . . . (NA) (NA) (NA) 9,290 3,677 39.6 (NA) (NA) (NA) 1,373 689 50.21968. . . . . . . . . . . . . . . . . . . (NA) (NA) (NA) (NA) 4,188 43.1 (NA) (NA) (NA) 1,374 655 47.7
1967. . . . . . . . . . . . . . . . . . . (NA) (NA) (NA) (NA) 4,558 47.4 (NA) (NA) (NA) 1,341 715 53.31966. . . . . . . . . . . . . . . . . . . (NA) (NA) (NA) (NA) 4,774 50.6 (NA) (NA) (NA) 1,311 722 55.11959. . . . . . . . . . . . . . . . . . . (NA) (NA) (NA) (NA) 5,022 65.6 (NA) (NA) (NA) (NA) 711 62.5
HISPANIC2
2001. . . . . . . . . . . . . . . . . . . 12,763 3,570 28.0 12,539 3,433 27.4 22,653 4,014 17.7 1,896 413 21.820001 . . . . . . . . . . . . . . . . . . 12,399 3,522 28.4 12,115 3,342 27.6 21,734 3,844 17.7 1,822 381 20.92000r . . . . . . . . . . . . . . . . . . 11,884 3,328 28.0 11,627 3,173 27.3 19,951 3,472 17.4 1,882 353 18.81999. . . . . . . . . . . . . . . . . . . 11,560 3,506 30.3 11,300 3,382 29.9 19,356 3,575 18.5 1,752 358 20.41998. . . . . . . . . . . . . . . . . . . 11,152 3,837 34.4 10,921 3,670 33.6 18,668 3,877 20.8 1,696 356 21.0
1997. . . . . . . . . . . . . . . . . . . 10,802 3,972 36.8 10,625 3,865 36.4 18,217 3,951 21.7 1,617 384 23.81996. . . . . . . . . . . . . . . . . . . 10,511 4,237 40.3 10,255 4,090 39.9 17,587 4,089 23.3 1,516 370 24.41995. . . . . . . . . . . . . . . . . . . 10,213 4,080 40.0 10,011 3,938 39.3 16,673 4,153 24.9 1,458 342 23.51994. . . . . . . . . . . . . . . . . . . 9,822 4,075 41.5 9,621 3,956 41.1 16,192 4,018 24.8 1,428 323 22.61993. . . . . . . . . . . . . . . . . . . 9,462 3,873 40.9 9,188 3,666 39.9 15,708 3,956 25.2 1,390 297 21.4
1992r . . . . . . . . . . . . . . . . . . 9,081 3,637 40.0 8,829 3,440 39.0 15,268 3,668 24.0 1,298 287 22.11991r . . . . . . . . . . . . . . . . . . 7,648 3,094 40.4 7,473 2,977 39.8 13,279 3,008 22.7 1,143 237 20.81990. . . . . . . . . . . . . . . . . . . 7,457 2,865 38.4 7,300 2,750 37.7 12,857 2,896 22.5 1,091 245 22.51989. . . . . . . . . . . . . . . . . . . 7,186 2,603 36.2 7,040 2,496 35.5 12,536 2,616 20.9 1,024 211 20.61988r . . . . . . . . . . . . . . . . . . 7,003 2,631 37.6 6,908 2,576 37.3 12,056 2,501 20.7 1,005 225 22.4
1987r . . . . . . . . . . . . . . . . . . 6,792 2,670 39.3 6,692 2,606 38.9 11,718 2,509 21.4 885 243 27.51986. . . . . . . . . . . . . . . . . . . 6,646 2,507 37.7 6,511 2,413 37.1 11,206 2,406 21.5 906 204 22.51985. . . . . . . . . . . . . . . . . . . 6,475 2,606 40.3 6,346 2,512 39.6 10,685 2,411 22.6 915 219 23.91984. . . . . . . . . . . . . . . . . . . 6,068 2,376 39.2 5,982 2,317 38.7 10,029 2,254 22.5 819 176 21.51983. . . . . . . . . . . . . . . . . . . 6,066 2,312 38.1 5,977 2,251 37.7 9,697 2,148 22.5 782 173 22.1
1982. . . . . . . . . . . . . . . . . . . 5,527 2,181 39.5 5,436 2,117 38.9 8,262 1,963 23.8 596 159 26.61981. . . . . . . . . . . . . . . . . . . 5,369 1,925 35.9 5,291 1,874 35.4 8,084 1,642 20.3 568 146 25.71980. . . . . . . . . . . . . . . . . . . 5,276 1,749 33.2 5,211 1,718 33.0 7,740 1,563 20.2 582 179 30.81979. . . . . . . . . . . . . . . . . . . 5,483 1,535 28.0 5,426 1,505 27.7 7,314 1,232 16.8 574 154 26.81978. . . . . . . . . . . . . . . . . . . 5,012 1,384 27.6 4,972 1,354 27.2 6,527 1,098 16.8 539 125 23.2
1977. . . . . . . . . . . . . . . . . . . 5,028 1,422 28.3 5,000 1,402 28.0 6,500 1,164 17.9 518 113 21.91976. . . . . . . . . . . . . . . . . . . 4,771 1,443 30.2 4,736 1,424 30.1 6,034 1,212 20.1 464 128 27.71975. . . . . . . . . . . . . . . . . . . (NA) (NA) (NA) 4,896 1,619 33.1 (NA) (NA) (NA) (NA) 137 32.61974. . . . . . . . . . . . . . . . . . . (NA) (NA) (NA) 4,939 1,414 28.6 (NA) (NA) (NA) (NA) 117 28.91973. . . . . . . . . . . . . . . . . . . (NA) (NA) (NA) 4,910 1,364 27.8 (NA) (NA) (NA) (NA) 95 24.9
See footnotes at end of table.
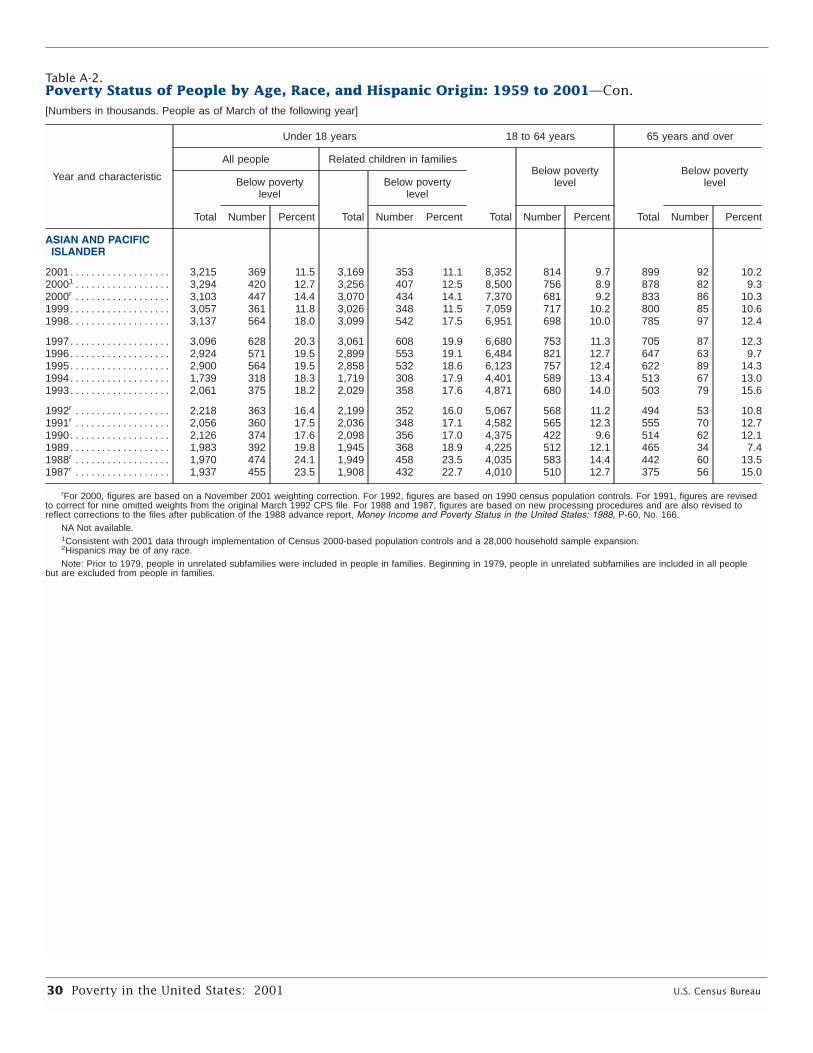
30 Poverty in the United States: 2001 U.S. Census Bureau
Table A-2.Poverty Status of People by Age, Race, and Hispanic Origin: 1959 to 2001—Con.[Numbers in thousands. People as of March of the following year]
Year and characteristic
Under 18 years 18 to 64 years 65 years and over
All people Related children in families
Total
Below povertylevel
Total
Below povertylevel
Total
Below povertylevel
Total
Below povertylevel
Number Percent Number Percent Number Percent Number Percent
ASIAN AND PACIFICISLANDER
2001. . . . . . . . . . . . . . . . . . . 3,215 369 11.5 3,169 353 11.1 8,352 814 9.7 899 92 10.220001 . . . . . . . . . . . . . . . . . . 3,294 420 12.7 3,256 407 12.5 8,500 756 8.9 878 82 9.32000r . . . . . . . . . . . . . . . . . . 3,103 447 14.4 3,070 434 14.1 7,370 681 9.2 833 86 10.31999. . . . . . . . . . . . . . . . . . . 3,057 361 11.8 3,026 348 11.5 7,059 717 10.2 800 85 10.61998. . . . . . . . . . . . . . . . . . . 3,137 564 18.0 3,099 542 17.5 6,951 698 10.0 785 97 12.4
1997. . . . . . . . . . . . . . . . . . . 3,096 628 20.3 3,061 608 19.9 6,680 753 11.3 705 87 12.31996. . . . . . . . . . . . . . . . . . . 2,924 571 19.5 2,899 553 19.1 6,484 821 12.7 647 63 9.71995. . . . . . . . . . . . . . . . . . . 2,900 564 19.5 2,858 532 18.6 6,123 757 12.4 622 89 14.31994. . . . . . . . . . . . . . . . . . . 1,739 318 18.3 1,719 308 17.9 4,401 589 13.4 513 67 13.01993. . . . . . . . . . . . . . . . . . . 2,061 375 18.2 2,029 358 17.6 4,871 680 14.0 503 79 15.6
1992r . . . . . . . . . . . . . . . . . . 2,218 363 16.4 2,199 352 16.0 5,067 568 11.2 494 53 10.81991r . . . . . . . . . . . . . . . . . . 2,056 360 17.5 2,036 348 17.1 4,582 565 12.3 555 70 12.71990. . . . . . . . . . . . . . . . . . . 2,126 374 17.6 2,098 356 17.0 4,375 422 9.6 514 62 12.11989. . . . . . . . . . . . . . . . . . . 1,983 392 19.8 1,945 368 18.9 4,225 512 12.1 465 34 7.41988r . . . . . . . . . . . . . . . . . . 1,970 474 24.1 1,949 458 23.5 4,035 583 14.4 442 60 13.51987r . . . . . . . . . . . . . . . . . . 1,937 455 23.5 1,908 432 22.7 4,010 510 12.7 375 56 15.0
rFor 2000, figures are based on a November 2001 weighting correction. For 1992, figures are based on 1990 census population controls. For 1991, figures are revisedto correct for nine omitted weights from the original March 1992 CPS file. For 1988 and 1987, figures are based on new processing procedures and are also revised toreflect corrections to the files after publication of the 1988 advance report, Money Income and Poverty Status in the United States: 1988, P-60, No. 166.
NA Not available.1Consistent with 2001 data through implementation of Census 2000-based population controls and a 28,000 household sample expansion.2Hispanics may be of any race.Note: Prior to 1979, people in unrelated subfamilies were included in people in families. Beginning in 1979, people in unrelated subfamilies are included in all people
but are excluded from people in families.

U.S. Census Bureau Poverty in the United States: 2001 31
Table A-3.Poverty Status of Families by Type of Family: 1959 to 2001[Numbers in thousands. Families as of March of the following year]
Year and characteristic
All families Married-couple families Male householder,no wife present
Female householder,no husband present
Total
Below povertylevel
Total
Below povertylevel
Total
Below povertylevel
Total
Below povertylevel
Number Percent Number Percent Number Percent Number Percent
ALL RACES
2001 . . . . . . . . . . . . . . . . . . . . 74,340 6,813 9.2 56,755 2,760 4.9 4,440 583 13.1 13,146 3,470 26.420001 . . . . . . . . . . . . . . . . . . . 73,778 6,400 8.7 56,598 2,636 4.7 4,277 485 11.3 12,903 3,278 25.42000r . . . . . . . . . . . . . . . . . . . . 72,388 6,222 8.6 55,611 2,638 4.7 4,252 488 11.5 12,525 3,096 24.71999 . . . . . . . . . . . . . . . . . . . . 72,031 6,676 9.3 55,315 2,673 4.8 4,028 472 11.7 12,687 3,531 27.81998 . . . . . . . . . . . . . . . . . . . . 71,551 7,186 10.0 54,778 2,879 5.3 3,977 476 12.0 12,796 3,831 29.9
1997 . . . . . . . . . . . . . . . . . . . . 70,884 7,324 10.3 54,321 2,821 5.2 3,911 508 13.0 12,652 3,995 31.61996 . . . . . . . . . . . . . . . . . . . . 70,241 7,708 11.0 53,604 3,010 5.6 3,847 531 13.8 12,790 4,167 32.61995 . . . . . . . . . . . . . . . . . . . . 69,597 7,532 10.8 53,570 2,982 5.6 3,513 493 14.0 12,514 4,057 32.41994 . . . . . . . . . . . . . . . . . . . . 69,313 8,053 11.6 53,865 3,272 6.1 3,228 549 17.0 12,220 4,232 34.61993 . . . . . . . . . . . . . . . . . . . . 68,506 8,393 12.3 53,181 3,481 6.5 2,914 488 16.8 12,411 4,424 35.6
1992r . . . . . . . . . . . . . . . . . . . . 68,216 8,144 11.9 53,090 3,385 6.4 3,065 484 15.8 12,061 4,275 35.41991r . . . . . . . . . . . . . . . . . . . . 67,175 7,712 11.5 52,457 3,158 6.0 3,025 392 13.0 11,693 4,161 35.61990 . . . . . . . . . . . . . . . . . . . . 66,322 7,098 10.7 52,147 2,981 5.7 2,907 349 12.0 11,268 3,768 33.41989 . . . . . . . . . . . . . . . . . . . . 66,090 6,784 10.3 52,137 2,931 5.6 2,884 348 12.1 10,890 3,504 32.21988r . . . . . . . . . . . . . . . . . . . . 65,837 6,874 10.4 52,100 2,897 5.6 2,847 336 11.8 10,890 3,642 33.4
1987r . . . . . . . . . . . . . . . . . . . . 65,204 7,005 10.7 51,675 3,011 5.8 2,833 340 12.0 10,696 3,654 34.21986 . . . . . . . . . . . . . . . . . . . . 64,491 7,023 10.9 51,537 3,123 6.1 2,510 287 11.4 10,445 3,613 34.61985 . . . . . . . . . . . . . . . . . . . . 63,558 7,223 11.4 50,933 3,438 6.7 2,414 311 12.9 10,211 3,474 34.01984 . . . . . . . . . . . . . . . . . . . . 62,706 7,277 11.6 50,350 3,488 6.9 2,228 292 13.1 10,129 3,498 34.51983 . . . . . . . . . . . . . . . . . . . . 62,015 7,647 12.3 50,081 3,815 7.6 2,038 268 13.2 9,896 3,564 36.0
1982 . . . . . . . . . . . . . . . . . . . . 61,393 7,512 12.2 49,908 3,789 7.6 2,016 290 14.4 9,469 3,434 36.31981 . . . . . . . . . . . . . . . . . . . . 61,019 6,851 11.2 49,630 3,394 6.8 1,986 205 10.3 9,403 3,252 34.61980 . . . . . . . . . . . . . . . . . . . . 60,309 6,217 10.3 49,294 3,032 6.2 1,933 213 11.0 9,082 2,972 32.71979 . . . . . . . . . . . . . . . . . . . . 59,550 5,461 9.2 49,112 2,640 5.4 1,733 176 10.2 8,705 2,645 30.41978 . . . . . . . . . . . . . . . . . . . . 57,804 5,280 9.1 47,692 2,474 5.2 1,654 152 9.2 8,458 2,654 31.4
1977 . . . . . . . . . . . . . . . . . . . . 57,215 5,311 9.3 47,385 2,524 5.3 1,594 177 11.1 8,236 2,610 31.71976 . . . . . . . . . . . . . . . . . . . . 56,710 5,311 9.4 47,497 2,606 5.5 1,500 162 10.8 7,713 2,543 33.01975 . . . . . . . . . . . . . . . . . . . . 56,245 5,450 9.7 47,318 2,904 6.1 1,445 116 8.0 7,482 2,430 32.51974 . . . . . . . . . . . . . . . . . . . . 55,698 4,922 8.8 47,069 2,474 5.3 1,399 125 8.9 7,230 2,324 32.11973 . . . . . . . . . . . . . . . . . . . . 55,053 4,828 8.8 46,812 2,482 5.3 1,438 154 10.7 6,804 2,193 32.2
1972 . . . . . . . . . . . . . . . . . . . . 54,373 5,075 9.3 46,314 (NA) (NA) 1,452 (NA) (NA) 6,607 2,158 32.71971 . . . . . . . . . . . . . . . . . . . . 53,296 5,303 10.0 45,752 (NA) (NA) 1,353 (NA) (NA) 6,191 2,100 33.91970 . . . . . . . . . . . . . . . . . . . . 52,227 5,260 10.1 44,739 (NA) (NA) 1,487 (NA) (NA) 6,001 1,952 32.51969 . . . . . . . . . . . . . . . . . . . . 51,586 5,008 9.7 44,436 (NA) (NA) 1,559 (NA) (NA) 5,591 1,827 32.71968 . . . . . . . . . . . . . . . . . . . . 50,511 5,047 10.0 43,842 (NA) (NA) 1,228 (NA) (NA) 5,441 1,755 32.3
1967 . . . . . . . . . . . . . . . . . . . . 49,835 5,667 11.4 43,292 (NA) (NA) 1,210 (NA) (NA) 5,333 1,774 33.31966 . . . . . . . . . . . . . . . . . . . . 48,921 5,784 11.8 42,553 (NA) (NA) 1,197 (NA) (NA) 5,171 1,721 33.11965 . . . . . . . . . . . . . . . . . . . . 48,278 6,721 13.9 42,107 (NA) (NA) 1,179 (NA) (NA) 4,992 1,916 38.41964 . . . . . . . . . . . . . . . . . . . . 47,836 7,160 15.0 41,648 (NA) (NA) 1,182 (NA) (NA) 5,006 1,822 36.41963 . . . . . . . . . . . . . . . . . . . . 47,436 7,554 15.9 41,311 (NA) (NA) 1,243 (NA) (NA) 4,882 1,972 40.4
1962 . . . . . . . . . . . . . . . . . . . . 46,998 8,077 17.2 40,923 (NA) (NA) 1,334 (NA) (NA) 4,741 2,034 42.91961 . . . . . . . . . . . . . . . . . . . . 46,341 8,391 18.1 40,405 (NA) (NA) 1,293 (NA) (NA) 4,643 1,954 42.11960 . . . . . . . . . . . . . . . . . . . . 45,435 8,243 18.1 39,624 (NA) (NA) 1,202 (NA) (NA) 4,609 1,955 42.41959 . . . . . . . . . . . . . . . . . . . . 45,054 8,320 18.5 39,335 (NA) (NA) 1,226 (NA) (NA) 4,493 1,916 42.6
rFor 2000, figures are based on a November 2001 weighting correction. For 1992, figures are based on 1990 census population controls. For 1991, figures are revisedto correct for nine omitted weights from the original March 1992 CPS file. For 1988 and 1987, figures are based on new processing procedures and are also revised toreflect corrections to the files after publication of the 1988 advance report, Money Income and Poverty Status in the United States: 1988, P-60, No. 166.
NA Not available.1Consistent with 2001 data through implementation of Census 2000-based population controls and a 28,000 household sample expansion.Note: Before 1979, unrelated subfamilies were included in all families. Beginning in 1979, unrelated subfamilies are excluded from all families.

32 Poverty in the United States: 2001 U.S. Census Bureau
INTRODUCTION
The 2001 Current Population Survey(CPS) served as a tool for testing twomethodological changes: (1) a sampleexpansion of the Annual DemographicSupplement (informally called theMarch Supplement) and (2) the intro-duction of new Census 2000-basedpopulation controls. The following sec-tion first describes how the methodolo-gy changed, then discusses how thechanges affected poverty estimates.
Description of CPS SampleExpansion: The Census Bureau testeda 28,000 household expansion in theinterviewed sample for the CPS AnnualDemographic Supplement in 2001.The original sample size of approxi-mately 50,000 interviewed householdsfor the 2001 CPS Annual DemographicSupplement was increased to approxi-mately 78,000. The primary goal ofthe sample expansion was to producemore reliable estimates of low-incomechildren without health insurance forthe State Children’s Health InsuranceProgram (SCHIP) through reduced vari-ances. Although the SCHIP sampleexpansion was specifically targetedtoward producing better children’shealth insurance estimates at the statelevel, other state estimates, as well asnational estimates, improved.
Description of Change inPopulation Controls: In order toproduce estimates for the entire civil-ian noninstitutional population,Census Bureau analysts must weightthe CPS sample results to independ-ent estimates of the population by
sex, age, race, and Hispanic/non-Hispanic categories. These independ-ent estimates are developed by usingcivilian noninstitutional populationcounts from the decennial censusesand projecting them forward to cur-rent years using data on births,deaths, and net migration. Beginningwith the 2002 CPS AnnualDemographic Supplement, the inde-pendent estimates used as controltotals for the CPS are based on civil-ian noninstitutional population bench-marks established by Census 2000.
CPS SAMPLE EXPANSION:EFFECTS ON POVERTY DATA
Table B-1 displays national-levelpoverty data from the original andexpanded CPS samples, weightedwith 1990 census population con-trols. Both samples yielded the samepoverty rate for the United States in2000: 11.3 percent. Poverty rates fordemographic groups were raised orlowered by the expansion with aboutequal frequency, and usually theextent of the change was small inrelation to the change’s standarderror. Statistically significant differ-ences were few and were not concen-trated among any single demographicgroup.1 National-level poverty
estimates from the expanded sample,therefore, look reasonable. At thestate level, the sample expansionraised and lowered poverty rates withroughly equal frequency (see Table B-2). For further analysis aboutthe CPS sample expansion and itseffect on income and poverty esti-mates, see www.bls.census.gov/cps/ads/adsmain.htm.
CENSUS 2000 POPULATIONCONTROLS: EFFECTS ON POVERTY DATA
Weighting the estimates with Census2000 population controls, instead ofthe 1990 census controls used in pre-vious reports, affected poverty rateestimates only minimally—see TableB-3. The poverty rate for the UnitedStates remained at 11.3 percent in2000, after reweighting with the newpopulation controls. Among demo-graphic groups, however, thereweighting tended to raise povertyrates more often than it loweredthem. Most differences between thetwo sets of estimates were 0.2 per-centage points or less, and occurredapparently randomly across demo-graphic groups. For further informa-tion about CPS weighting procedures,see Technical Paper 63RV, available atwww.bls.census.gov/cps/tp/tp63.htm.
Appendix B: SAMPLE EXPANSION AND INTRODUCTION OF CENSUS 2000-BASED POPULATION CONTROLS
1 Usually when two estimates are “significantlydifferent” it means that the difference was largeenough, in relation to the difference’s own standarderror, for us to infer that the difference is “real,” ormore accurately, that there was a less than 10 per-cent chance that the difference merely came fromsampling variation. In Table B-1, however, both setsof data estimate the same populations in the sameperiod. Therefore, “significant” here means that wewould have inferred that the estimates came fromdifferent populations, if we did not already knowthey were the same.
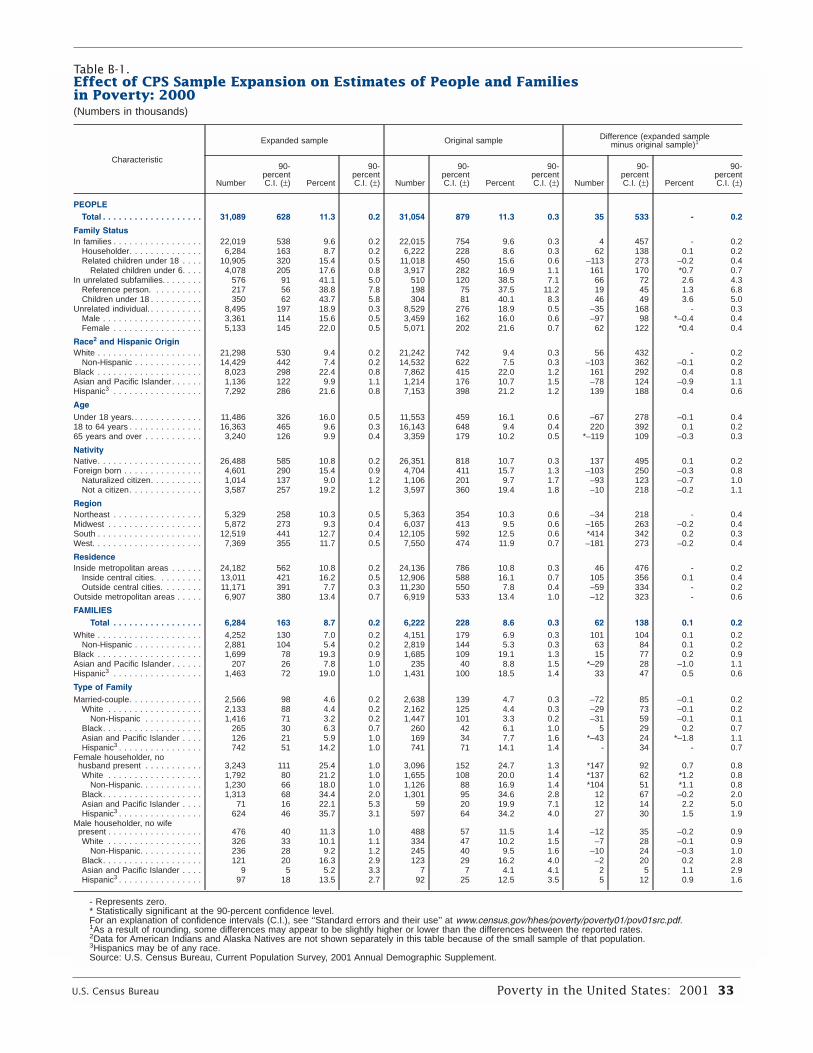
U.S. Census Bureau Poverty in the United States: 2001 33
Table B-1.Effect of CPS Sample Expansion on Estimates of People and Familiesin Poverty: 2000(Numbers in thousands)
Characteristic
Expanded sample Original sample Difference (expanded sampleminus original sample)1
Number
90-percentC.I. (±) Percent
90-percentC.I. (±) Number
90-percentC.I. (±) Percent
90-percentC.I. (±) Number
90-percentC.I. (±) Percent
90-percentC.I. (±)
PEOPLETotal . . . . . . . . . . . . . . . . . . . 31,089 628 11.3 0.2 31,054 879 11.3 0.3 35 533 - 0.2
Family StatusIn families . . . . . . . . . . . . . . . . . 22,019 538 9.6 0.2 22,015 754 9.6 0.3 4 457 - 0.2
Householder. . . . . . . . . . . . . . 6,284 163 8.7 0.2 6,222 228 8.6 0.3 62 138 0.1 0.2Related children under 18 . . . . 10,905 320 15.4 0.5 11,018 450 15.6 0.6 –113 273 –0.2 0.4
Related children under 6. . . . 4,078 205 17.6 0.8 3,917 282 16.9 1.1 161 170 *0.7 0.7In unrelated subfamilies. . . . . . . . 576 91 41.1 5.0 510 120 38.5 7.1 66 72 2.6 4.3
Reference person. . . . . . . . . . 217 56 38.8 7.8 198 75 37.5 11.2 19 45 1.3 6.8Children under 18 . . . . . . . . . . 350 62 43.7 5.8 304 81 40.1 8.3 46 49 3.6 5.0
Unrelated individual. . . . . . . . . . . 8,495 197 18.9 0.3 8,529 276 18.9 0.5 –35 168 - 0.3Male . . . . . . . . . . . . . . . . . . . 3,361 114 15.6 0.5 3,459 162 16.0 0.6 –97 98 *–0.4 0.4Female . . . . . . . . . . . . . . . . . 5,133 145 22.0 0.5 5,071 202 21.6 0.7 62 122 *0.4 0.4
Race2 and Hispanic OriginWhite . . . . . . . . . . . . . . . . . . . . 21,298 530 9.4 0.2 21,242 742 9.4 0.3 56 432 - 0.2
Non-Hispanic . . . . . . . . . . . . . 14,429 442 7.4 0.2 14,532 622 7.5 0.3 –103 362 –0.1 0.2Black . . . . . . . . . . . . . . . . . . . . 8,023 298 22.4 0.8 7,862 415 22.0 1.2 161 292 0.4 0.8Asian and Pacific Islander . . . . . . 1,136 122 9.9 1.1 1,214 176 10.7 1.5 –78 124 –0.9 1.1Hispanic3 . . . . . . . . . . . . . . . . . 7,292 286 21.6 0.8 7,153 398 21.2 1.2 139 188 0.4 0.6
AgeUnder 18 years. . . . . . . . . . . . . . 11,486 326 16.0 0.5 11,553 459 16.1 0.6 –67 278 –0.1 0.418 to 64 years . . . . . . . . . . . . . . 16,363 465 9.6 0.3 16,143 648 9.4 0.4 220 392 0.1 0.265 years and over . . . . . . . . . . . 3,240 126 9.9 0.4 3,359 179 10.2 0.5 *–119 109 –0.3 0.3
NativityNative. . . . . . . . . . . . . . . . . . . . 26,488 585 10.8 0.2 26,351 818 10.7 0.3 137 495 0.1 0.2Foreign born . . . . . . . . . . . . . . . 4,601 290 15.4 0.9 4,704 411 15.7 1.3 –103 250 –0.3 0.8
Naturalized citizen. . . . . . . . . . 1,014 137 9.0 1.2 1,106 201 9.7 1.7 –93 123 –0.7 1.0Not a citizen. . . . . . . . . . . . . . 3,587 257 19.2 1.2 3,597 360 19.4 1.8 –10 218 –0.2 1.1
RegionNortheast . . . . . . . . . . . . . . . . . 5,329 258 10.3 0.5 5,363 354 10.3 0.6 –34 218 - 0.4Midwest . . . . . . . . . . . . . . . . . . 5,872 273 9.3 0.4 6,037 413 9.5 0.6 –165 263 –0.2 0.4South . . . . . . . . . . . . . . . . . . . . 12,519 441 12.7 0.4 12,105 592 12.5 0.6 *414 342 0.2 0.3West. . . . . . . . . . . . . . . . . . . . . 7,369 355 11.7 0.5 7,550 474 11.9 0.7 –181 273 –0.2 0.4
ResidenceInside metropolitan areas . . . . . . 24,182 562 10.8 0.2 24,136 786 10.8 0.3 46 476 - 0.2
Inside central cities. . . . . . . . . 13,011 421 16.2 0.5 12,906 588 16.1 0.7 105 356 0.1 0.4Outside central cities. . . . . . . . 11,171 391 7.7 0.3 11,230 550 7.8 0.4 –59 334 - 0.2
Outside metropolitan areas . . . . . 6,907 380 13.4 0.7 6,919 533 13.4 1.0 –12 323 - 0.6
FAMILIESTotal . . . . . . . . . . . . . . . . . 6,284 163 8.7 0.2 6,222 228 8.6 0.3 62 138 0.1 0.2
White . . . . . . . . . . . . . . . . . . . . 4,252 130 7.0 0.2 4,151 179 6.9 0.3 101 104 0.1 0.2Non-Hispanic . . . . . . . . . . . . . 2,881 104 5.4 0.2 2,819 144 5.3 0.3 63 84 0.1 0.2
Black . . . . . . . . . . . . . . . . . . . . 1,699 78 19.3 0.9 1,685 109 19.1 1.3 15 77 0.2 0.9Asian and Pacific Islander . . . . . . 207 26 7.8 1.0 235 40 8.8 1.5 *–29 28 –1.0 1.1Hispanic3 . . . . . . . . . . . . . . . . . 1,463 72 19.0 1.0 1,431 100 18.5 1.4 33 47 0.5 0.6
Type of FamilyMarried-couple. . . . . . . . . . . . . . 2,566 98 4.6 0.2 2,638 139 4.7 0.3 –72 85 –0.1 0.2
White . . . . . . . . . . . . . . . . . . 2,133 88 4.4 0.2 2,162 125 4.4 0.3 –29 73 –0.1 0.2Non-Hispanic . . . . . . . . . . . 1,416 71 3.2 0.2 1,447 101 3.3 0.2 –31 59 –0.1 0.1
Black. . . . . . . . . . . . . . . . . . . 265 30 6.3 0.7 260 42 6.1 1.0 5 29 0.2 0.7Asian and Pacific Islander . . . . 126 21 5.9 1.0 169 34 7.7 1.6 *–43 24 *–1.8 1.1Hispanic3 . . . . . . . . . . . . . . . . 742 51 14.2 1.0 741 71 14.1 1.4 - 34 - 0.7
Female householder, nohusband present . . . . . . . . . . . 3,243 111 25.4 1.0 3,096 152 24.7 1.3 *147 92 0.7 0.8White . . . . . . . . . . . . . . . . . . 1,792 80 21.2 1.0 1,655 108 20.0 1.4 *137 62 *1.2 0.8
Non-Hispanic. . . . . . . . . . . . 1,230 66 18.0 1.0 1,126 88 16.9 1.4 *104 51 *1.1 0.8Black. . . . . . . . . . . . . . . . . . . 1,313 68 34.4 2.0 1,301 95 34.6 2.8 12 67 –0.2 2.0Asian and Pacific Islander . . . . 71 16 22.1 5.3 59 20 19.9 7.1 12 14 2.2 5.0Hispanic3 . . . . . . . . . . . . . . . . 624 46 35.7 3.1 597 64 34.2 4.0 27 30 1.5 1.9
Male householder, no wifepresent . . . . . . . . . . . . . . . . . . 476 40 11.3 1.0 488 57 11.5 1.4 –12 35 –0.2 0.9White . . . . . . . . . . . . . . . . . . 326 33 10.1 1.1 334 47 10.2 1.5 –7 28 –0.1 0.9
Non-Hispanic. . . . . . . . . . . . 236 28 9.2 1.2 245 40 9.5 1.6 –10 24 –0.3 1.0Black. . . . . . . . . . . . . . . . . . . 121 20 16.3 2.9 123 29 16.2 4.0 –2 20 0.2 2.8Asian and Pacific Islander . . . . 9 5 5.2 3.3 7 7 4.1 4.1 2 5 1.1 2.9Hispanic3 . . . . . . . . . . . . . . . . 97 18 13.5 2.7 92 25 12.5 3.5 5 12 0.9 1.6
- Represents zero.* Statistically significant at the 90-percent confidence level.For an explanation of confidence intervals (C.I.), see ‘‘Standard errors and their use’’ at www.census.gov/hhes/poverty/poverty01/pov01src.pdf.1As a result of rounding, some differences may appear to be slightly higher or lower than the differences between the reported rates.2Data for American Indians and Alaska Natives are not shown separately in this table because of the small sample of that population.3Hispanics may be of any race.Source: U.S. Census Bureau, Current Population Survey, 2001 Annual Demographic Supplement.

34 Poverty in the United States: 2001 U.S. Census Bureau
Table B-2.Number of Poor and Poverty Rate by State: 2000(Numbers in thousands)
State
Expanded sample Original sample Difference (expanded sampleminus original sample)1
Number
90-percentC.I. (±) Percent
90-percentC.I. (±) Number
90-percentC.I. (±) Percent
90-percentC.I. (±) Number
90-percentC.I. (±) Percent
90-percentC.I. (±)
United States . . . 31,089 628 11.3 0.2 31,054 879 11.3 0.3 35 533 - 0.2
Alabama . . . . . . . . . . . . 582 86 13.3 1.8 642 135 14.4 2.8 –59 92 –1.2 1.9Alaska . . . . . . . . . . . . . . 47 9 7.5 1.4 53 15 8.2 2.2 –6 11 –0.7 1.6Arizona . . . . . . . . . . . . . 582 101 11.7 1.9 590 127 12.0 2.4 –8 57 –0.3 1.1Arkansas . . . . . . . . . . . . 428 62 16.5 2.2 467 88 17.8 3.0 –39 46 –1.3 1.6California . . . . . . . . . . . . 4,260 313 12.4 0.9 4,441 398 12.8 1.1 –181 193 –0.4 0.5Colorado . . . . . . . . . . . . 405 63 9.6 1.4 343 95 8.1 2.2 62 69 1.5 1.6Connecticut. . . . . . . . . . 250 44 7.6 1.3 219 78 6.6 2.3 31 61 1.0 1.8Delaware . . . . . . . . . . . . 64 12 8.3 1.6 72 21 9.1 2.6 –8 14 –0.8 1.8District of Columbia. . . 78 12 15.2 2.2 75 18 14.9 3.4 3 13 0.3 2.3Florida . . . . . . . . . . . . . . 1,696 167 11.0 1.0 1,604 208 10.6 1.3 93 97 0.4 0.6
Georgia . . . . . . . . . . . . . 966 151 12.1 1.8 869 185 11.2 2.2 97 103 0.9 1.3Hawaii . . . . . . . . . . . . . . 105 19 8.9 1.6 115 34 9.9 2.8 –10 26 –1.0 2.1Idaho . . . . . . . . . . . . . . . 160 26 12.4 1.9 161 35 12.9 2.6 –1 18 –0.4 1.3Illinois. . . . . . . . . . . . . . . 1,288 141 10.6 1.1 1,406 198 11.5 1.5 *–118 103 *–0.9 0.8Indiana. . . . . . . . . . . . . . 506 81 8.5 1.3 504 140 8.7 2.3 3 103 –0.1 1.7Iowa . . . . . . . . . . . . . . . . 234 41 8.3 1.4 206 64 7.2 2.2 28 44 1.1 1.5Kansas. . . . . . . . . . . . . . 213 38 8.1 1.4 251 68 9.6 2.5 –38 49 –1.6 1.8Kentucky . . . . . . . . . . . . 503 76 12.6 1.8 471 110 11.9 2.6 32 70 0.7 1.7Louisiana. . . . . . . . . . . . 755 104 17.3 2.2 730 139 17.3 3.0 25 77 - 1.7Maine . . . . . . . . . . . . . . . 127 19 10.1 1.4 106 33 8.4 2.5 21 26 1.7 1.9
Maryland . . . . . . . . . . . . 377 70 7.2 1.3 387 122 7.6 2.3 –10 92 –0.4 1.7Massachusetts . . . . . . . 598 88 9.7 1.4 629 120 10.1 1.8 –31 59 –0.4 0.9Michigan . . . . . . . . . . . . 968 117 9.8 1.1 993 161 10.0 1.5 –25 85 –0.2 0.8Minnesota . . . . . . . . . . . 269 56 5.6 1.1 285 94 6.0 1.9 –16 68 –0.4 1.4Mississippi. . . . . . . . . . . 421 65 15.0 2.1 358 80 12.9 2.7 *62 44 *2.1 1.5Missouri . . . . . . . . . . . . . 502 83 9.2 1.5 440 130 8.0 2.3 62 93 1.2 1.6Montana . . . . . . . . . . . . 127 20 14.2 2.1 136 28 15.7 2.9 –10 14 –1.5 1.5Nebraska. . . . . . . . . . . . 142 26 8.7 1.5 148 42 9.0 2.4 –6 28 –0.3 1.6Nevada . . . . . . . . . . . . . 169 30 8.7 1.5 170 46 8.5 2.2 –1 33 0.2 1.6New Hampshire . . . . . . 55 13 4.6 1.0 64 26 5.2 2.1 –8 21 –0.6 1.6
New Jersey. . . . . . . . . . 596 88 7.3 1.0 666 124 8.0 1.4 *–70 66 –0.7 0.8New Mexico . . . . . . . . . 307 48 17.4 2.5 299 58 16.8 3.0 8 26 0.6 1.3New York. . . . . . . . . . . . 2,530 191 13.8 1.0 2,460 247 13.4 1.3 71 124 0.4 0.6North Carolina . . . . . . . 962 122 12.4 1.5 911 155 12.1 1.9 51 80 0.2 1.0North Dakota . . . . . . . . 63 10 10.2 1.6 61 17 10.1 2.6 1 11 0.1 1.8Ohio . . . . . . . . . . . . . . . . 1,119 131 10.0 1.1 1,157 182 10.0 1.5 –38 94 - 0.8Oklahoma . . . . . . . . . . . 498 71 14.8 1.9 504 102 15.4 2.9 –6 61 –0.6 1.7Oregon. . . . . . . . . . . . . . 361 59 10.7 1.7 382 96 11.2 2.7 –21 69 –0.5 1.9Pennsylvania . . . . . . . . 1,013 120 8.6 1.0 1,062 169 8.9 1.4 –50 88 –0.3 0.7Rhode Island . . . . . . . . 99 15 10.1 1.5 85 27 9.1 2.7 13 21 1.0 2.2
South Carolina . . . . . . . 435 70 11.0 1.7 400 106 10.6 2.7 34 76 0.4 1.9South Dakota . . . . . . . . 77 12 10.6 1.6 67 18 9.6 2.4 10 12 1.0 1.7Tennessee. . . . . . . . . . . 752 117 13.5 2.0 820 175 14.7 2.9 –68 106 –1.2 1.8Texas . . . . . . . . . . . . . . . 3,166 259 15.3 1.2 3,013 318 14.7 1.4 *153 147 *0.7 0.7Utah . . . . . . . . . . . . . . . . 167 33 7.6 1.4 212 51 9.6 2.2 *–45 31 *–2.0 1.3Vermont . . . . . . . . . . . . . 60 10 10.1 1.6 71 19 11.3 2.8 –11 15 –1.2 2.2Virginia. . . . . . . . . . . . . . 572 103 8.2 1.4 534 149 7.7 2.1 38 97 0.5 1.3Washington. . . . . . . . . . 628 102 10.8 1.7 593 156 10.1 2.5 34 115 0.6 1.9West Virginia . . . . . . . . 265 35 14.7 1.8 248 52 14.0 2.7 17 33 0.7 1.7Wisconsin . . . . . . . . . . . 490 76 9.3 1.4 518 134 9.6 2.4 –28 97 –0.3 1.7Wyoming . . . . . . . . . . . . 52 9 10.9 1.7 54 13 11.0 2.6 –1 9 –0.1 1.7
-Represents zero.*Statistically significant at the 90-percent confidence level. For explanation of confidence intervals (C.I.), see ‘‘Standard errors and their use’’ at
www.census.gov/hhes/poverty/poverty01/pov01src.pdf.1As a result of rounding, some differences may appear to be higher or lower than the differences between the reported rates.
Source: U.S. Census Bureau, Current Population Survey, 2001 Annual Demographic Supplement.
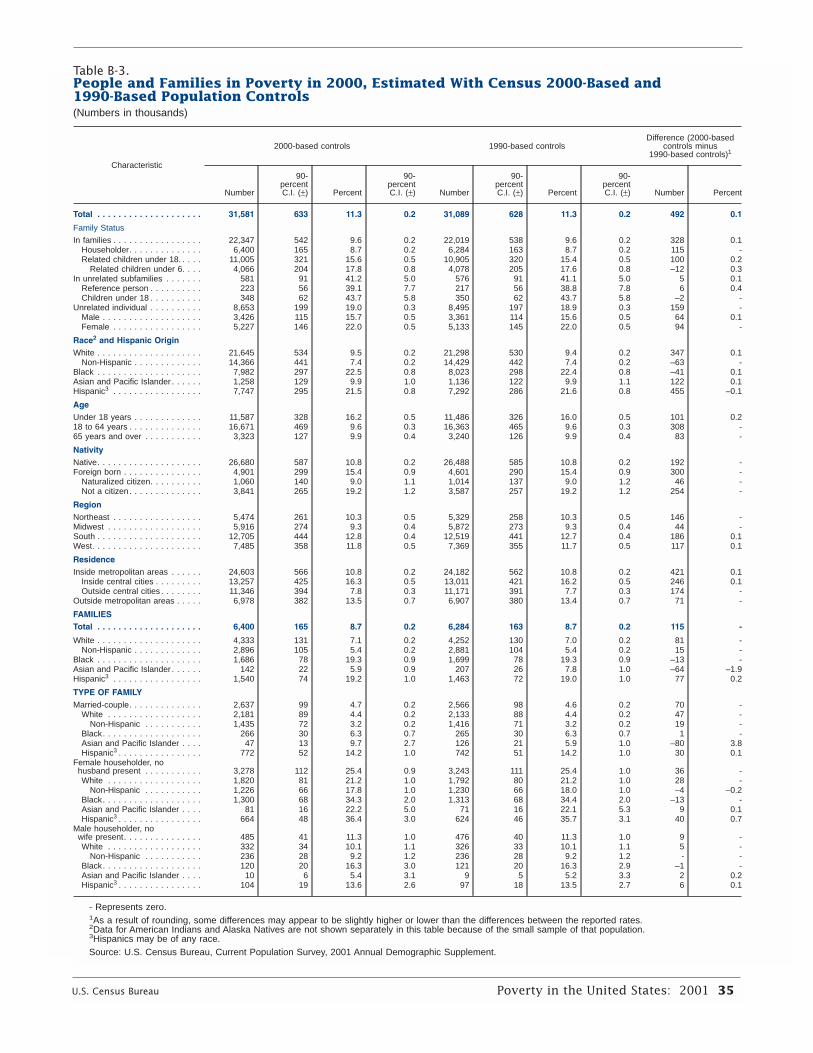
U.S. Census Bureau Poverty in the United States: 2001 35
Table B-3.People and Families in Poverty in 2000, Estimated With Census 2000-Based and1990-Based Population Controls(Numbers in thousands)
Characteristic
2000-based controls 1990-based controlsDifference (2000-based
controls minus1990-based controls)1
Number
90-percentC.I. (±) Percent
90-percentC.I. (±) Number
90-percentC.I. (±) Percent
90-percentC.I. (±) Number Percent
Total . . . . . . . . . . . . . . . . . . . . 31,581 633 11.3 0.2 31,089 628 11.3 0.2 492 0.1
Family Status
In families . . . . . . . . . . . . . . . . . 22,347 542 9.6 0.2 22,019 538 9.6 0.2 328 0.1Householder. . . . . . . . . . . . . . 6,400 165 8.7 0.2 6,284 163 8.7 0.2 115 -Related children under 18. . . . . 11,005 321 15.6 0.5 10,905 320 15.4 0.5 100 0.2
Related children under 6. . . . 4,066 204 17.8 0.8 4,078 205 17.6 0.8 –12 0.3In unrelated subfamilies . . . . . . . 581 91 41.2 5.0 576 91 41.1 5.0 5 0.1
Reference person . . . . . . . . . . 223 56 39.1 7.7 217 56 38.8 7.8 6 0.4Children under 18 . . . . . . . . . . 348 62 43.7 5.8 350 62 43.7 5.8 –2 -
Unrelated individual . . . . . . . . . . 8,653 199 19.0 0.3 8,495 197 18.9 0.3 159 -Male . . . . . . . . . . . . . . . . . . . 3,426 115 15.7 0.5 3,361 114 15.6 0.5 64 0.1Female . . . . . . . . . . . . . . . . . 5,227 146 22.0 0.5 5,133 145 22.0 0.5 94 -
Race2 and Hispanic OriginWhite . . . . . . . . . . . . . . . . . . . . 21,645 534 9.5 0.2 21,298 530 9.4 0.2 347 0.1
Non-Hispanic . . . . . . . . . . . . . 14,366 441 7.4 0.2 14,429 442 7.4 0.2 –63 -Black . . . . . . . . . . . . . . . . . . . . 7,982 297 22.5 0.8 8,023 298 22.4 0.8 –41 0.1Asian and Pacific Islander . . . . . . 1,258 129 9.9 1.0 1,136 122 9.9 1.1 122 0.1Hispanic3 . . . . . . . . . . . . . . . . . 7,747 295 21.5 0.8 7,292 286 21.6 0.8 455 –0.1
AgeUnder 18 years . . . . . . . . . . . . . 11,587 328 16.2 0.5 11,486 326 16.0 0.5 101 0.218 to 64 years . . . . . . . . . . . . . . 16,671 469 9.6 0.3 16,363 465 9.6 0.3 308 -65 years and over . . . . . . . . . . . 3,323 127 9.9 0.4 3,240 126 9.9 0.4 83 -
NativityNative. . . . . . . . . . . . . . . . . . . . 26,680 587 10.8 0.2 26,488 585 10.8 0.2 192 -Foreign born . . . . . . . . . . . . . . . 4,901 299 15.4 0.9 4,601 290 15.4 0.9 300 -
Naturalized citizen. . . . . . . . . . 1,060 140 9.0 1.1 1,014 137 9.0 1.2 46 -Not a citizen. . . . . . . . . . . . . . 3,841 265 19.2 1.2 3,587 257 19.2 1.2 254 -
RegionNortheast . . . . . . . . . . . . . . . . . 5,474 261 10.3 0.5 5,329 258 10.3 0.5 146 -Midwest . . . . . . . . . . . . . . . . . . 5,916 274 9.3 0.4 5,872 273 9.3 0.4 44 -South . . . . . . . . . . . . . . . . . . . . 12,705 444 12.8 0.4 12,519 441 12.7 0.4 186 0.1West. . . . . . . . . . . . . . . . . . . . . 7,485 358 11.8 0.5 7,369 355 11.7 0.5 117 0.1
ResidenceInside metropolitan areas . . . . . . 24,603 566 10.8 0.2 24,182 562 10.8 0.2 421 0.1
Inside central cities . . . . . . . . . 13,257 425 16.3 0.5 13,011 421 16.2 0.5 246 0.1Outside central cities . . . . . . . . 11,346 394 7.8 0.3 11,171 391 7.7 0.3 174 -
Outside metropolitan areas . . . . . 6,978 382 13.5 0.7 6,907 380 13.4 0.7 71 -
FAMILIESTotal . . . . . . . . . . . . . . . . . . . . 6,400 165 8.7 0.2 6,284 163 8.7 0.2 115 -
White . . . . . . . . . . . . . . . . . . . . 4,333 131 7.1 0.2 4,252 130 7.0 0.2 81 -Non-Hispanic . . . . . . . . . . . . . 2,896 105 5.4 0.2 2,881 104 5.4 0.2 15 -
Black . . . . . . . . . . . . . . . . . . . . 1,686 78 19.3 0.9 1,699 78 19.3 0.9 –13 -Asian and Pacific Islander . . . . . . 142 22 5.9 0.9 207 26 7.8 1.0 –64 –1.9Hispanic3 . . . . . . . . . . . . . . . . . 1,540 74 19.2 1.0 1,463 72 19.0 1.0 77 0.2
TYPE OF FAMILYMarried-couple. . . . . . . . . . . . . . 2,637 99 4.7 0.2 2,566 98 4.6 0.2 70 -
White . . . . . . . . . . . . . . . . . . 2,181 89 4.4 0.2 2,133 88 4.4 0.2 47 -Non-Hispanic . . . . . . . . . . . 1,435 72 3.2 0.2 1,416 71 3.2 0.2 19 -
Black. . . . . . . . . . . . . . . . . . . 266 30 6.3 0.7 265 30 6.3 0.7 1 -Asian and Pacific Islander . . . . 47 13 9.7 2.7 126 21 5.9 1.0 –80 3.8Hispanic3 . . . . . . . . . . . . . . . . 772 52 14.2 1.0 742 51 14.2 1.0 30 0.1
Female householder, nohusband present . . . . . . . . . . . 3,278 112 25.4 0.9 3,243 111 25.4 1.0 36 -White . . . . . . . . . . . . . . . . . . 1,820 81 21.2 1.0 1,792 80 21.2 1.0 28 -
Non-Hispanic . . . . . . . . . . . 1,226 66 17.8 1.0 1,230 66 18.0 1.0 –4 –0.2Black. . . . . . . . . . . . . . . . . . . 1,300 68 34.3 2.0 1,313 68 34.4 2.0 –13 -Asian and Pacific Islander . . . . 81 16 22.2 5.0 71 16 22.1 5.3 9 0.1Hispanic3 . . . . . . . . . . . . . . . . 664 48 36.4 3.0 624 46 35.7 3.1 40 0.7
Male householder, nowife present. . . . . . . . . . . . . . . 485 41 11.3 1.0 476 40 11.3 1.0 9 -White . . . . . . . . . . . . . . . . . . 332 34 10.1 1.1 326 33 10.1 1.1 5 -
Non-Hispanic . . . . . . . . . . . 236 28 9.2 1.2 236 28 9.2 1.2 - -Black. . . . . . . . . . . . . . . . . . . 120 20 16.3 3.0 121 20 16.3 2.9 –1 -Asian and Pacific Islander . . . . 10 6 5.4 3.1 9 5 5.2 3.3 2 0.2Hispanic3 . . . . . . . . . . . . . . . . 104 19 13.6 2.6 97 18 13.5 2.7 6 0.1
- Represents zero.1As a result of rounding, some differences may appear to be slightly higher or lower than the differences between the reported rates.2Data for American Indians and Alaska Natives are not shown separately in this table because of the small sample of that population.3Hispanics may be of any race.Source: U.S. Census Bureau, Current Population Survey, 2001 Annual Demographic Supplement.