in the “strong” or “very strong”
TRANSCRIPT
5

6
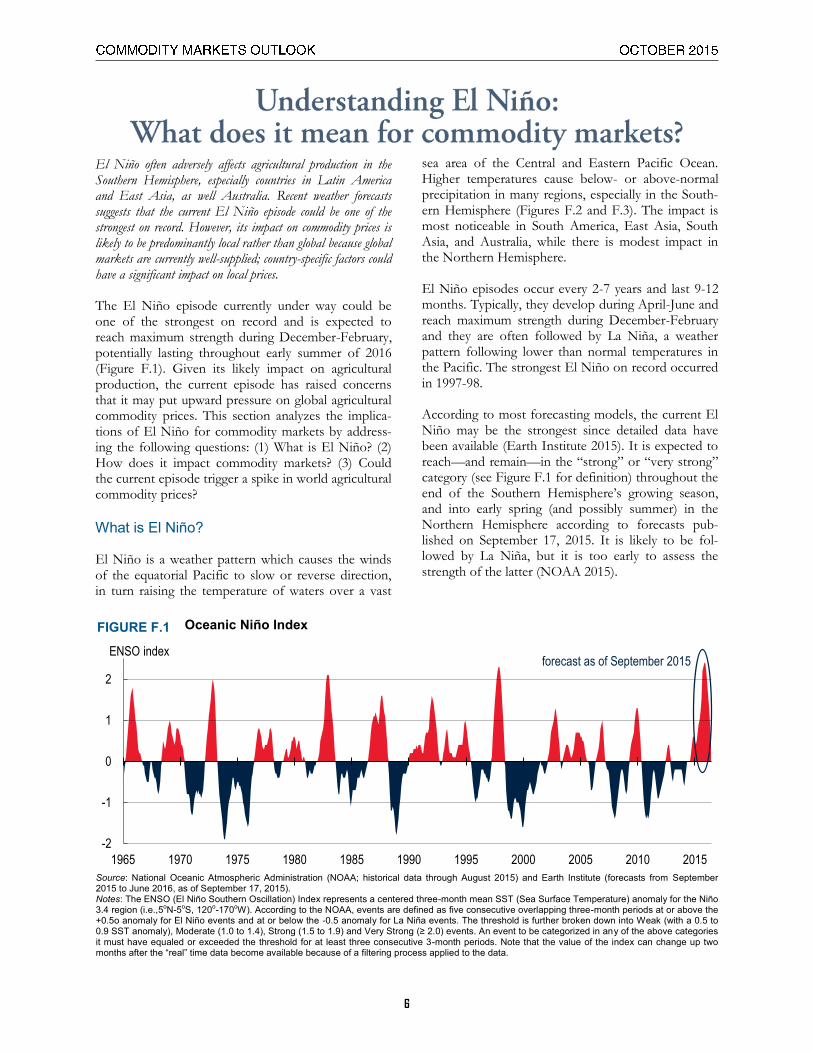
El Niño often adversely affects agricultural production in the Southern Hemisphere, especially countries in Latin America and East Asia, as well Australia. Recent weather forecasts suggests that the current El Niño episode could be one of the strongest on record. However, its impact on commodity prices is likely to be predominantly local rather than global because global markets are currently well-supplied; country-specific factors could have a significant impact on local prices. The El Niño episode currently under way could be one of the strongest on record and is expected to reach maximum strength during December-February, potentially lasting throughout early summer of 2016 (Figure F.1). Given its likely impact on agricultural production, the current episode has raised concerns that it may put upward pressure on global agricultural commodity prices. This section analyzes the implica-tions of El Niño for commodity markets by address-ing the following questions: (1) What is El Niño? (2) How does it impact commodity markets? (3) Could the current episode trigger a spike in world agricultural commodity prices?
What is El Niño? El Niño is a weather pattern which causes the winds of the equatorial Pacific to slow or reverse direction, in turn raising the temperature of waters over a vast
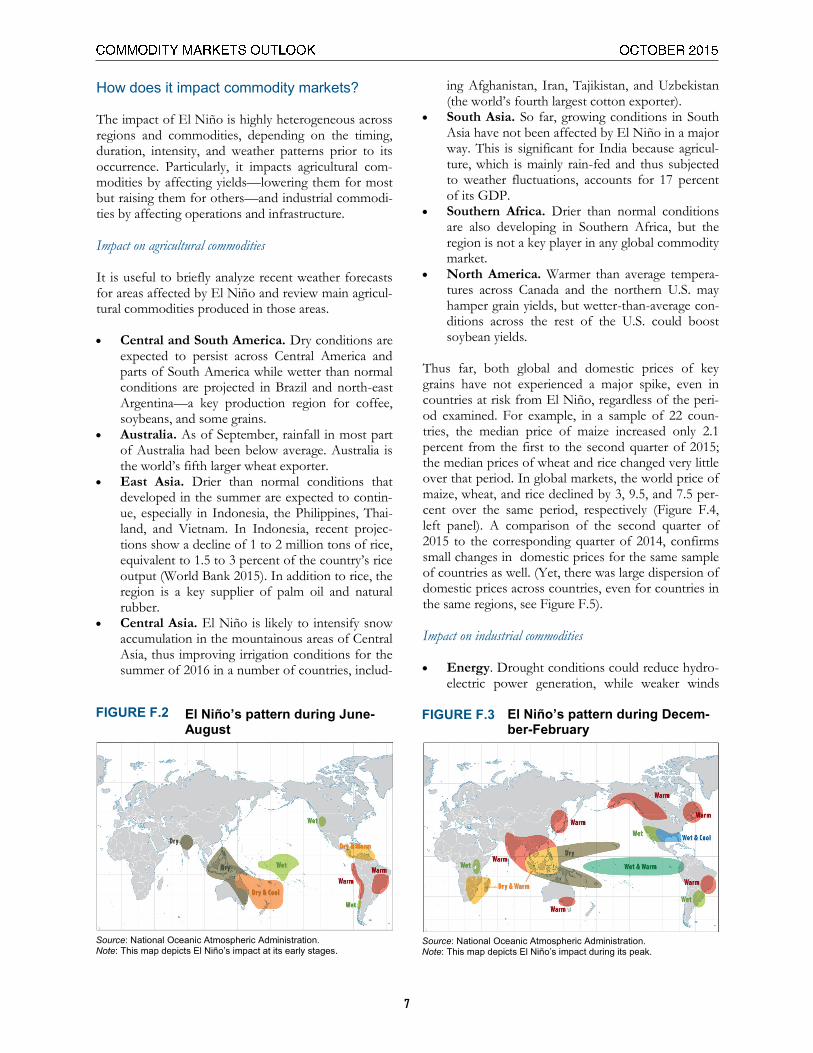
sea area of the Central and Eastern Pacific Ocean. Higher temperatures cause below- or above-normal precipitation in many regions, especially in the South-ern Hemisphere (Figures F.2 and F.3). The impact is most noticeable in South America, East Asia, South Asia, and Australia, while there is modest impact in the Northern Hemisphere. El Niño episodes occur every 2-7 years and last 9-12 months. Typically, they develop during April-June and reach maximum strength during December-February and they are often followed by La Niña, a weather pattern following lower than normal temperatures in the Pacific. The strongest El Niño on record occurred in 1997-98. According to most forecasting models, the current El Niño may be the strongest since detailed data have been available (Earth Institute 2015). It is expected to reach—and remain—in the “strong” or “very strong” category (see Figure F.1 for definition) throughout the end of the Southern Hemisphere’s growing season, and into early spring (and possibly summer) in the Northern Hemisphere according to forecasts pub-lished on September 17, 2015. It is likely to be fol-lowed by La Niña, but it is too early to assess the strength of the latter (NOAA 2015).
Oceanic Niño Index FIGURE F.1
Source: National Oceanic Atmospheric Administration (NOAA; historical data through August 2015) and Earth Institute (forecasts from September 2015 to June 2016, as of September 17, 2015). Notes: The ENSO (El Niño Southern Oscillation) Index represents a centered three-month mean SST (Sea Surface Temperature) anomaly for the Niño 3.4 region (i.e.,5oN-5oS, 120o-170oW). According to the NOAA, events are defined as five consecutive overlapping three-month periods at or above the +0.5o anomaly for El Niño events and at or below the -0.5 anomaly for La Niña events. The threshold is further broken down into Weak (with a 0.5 to 0.9 SST anomaly), Moderate (1.0 to 1.4), Strong (1.5 to 1.9) and Very Strong (≥ 2.0) events. An event to be categorized in any of the above categories it must have equaled or exceeded the threshold for at least three consecutive 3-month periods. Note that the value of the index can change up two months after the “real” time data become available because of a filtering process applied to the data.
-2
-1
0
1
2
1965 1970 1975 1980 1985 1990 1995 2000 2005 2010 2015
ENSO indexforecast as of September 2015
7
How does it impact commodity markets? The impact of El Niño is highly heterogeneous across regions and commodities, depending on the timing, duration, intensity, and weather patterns prior to its occurrence. Particularly, it impacts agricultural com-modities by affecting yields—lowering them for most but raising them for others—and industrial commodi-ties by affecting operations and infrastructure.
Impact on agricultural commodities It is useful to briefly analyze recent weather forecasts for areas affected by El Niño and review main agricul-tural commodities produced in those areas. Central and South America. Dry conditions are
expected to persist across Central America and parts of South America while wetter than normal conditions are projected in Brazil and north-east Argentina—a key production region for coffee, soybeans, and some grains.
Australia. As of September, rainfall in most part of Australia had been below average. Australia is the world’s fifth larger wheat exporter.
East Asia. Drier than normal conditions that developed in the summer are expected to contin-ue, especially in Indonesia, the Philippines, Thai-land, and Vietnam. In Indonesia, recent projec-tions show a decline of 1 to 2 million tons of rice, equivalent to 1.5 to 3 percent of the country’s rice output (World Bank 2015). In addition to rice, the region is a key supplier of palm oil and natural rubber.
Central Asia. El Niño is likely to intensify snow accumulation in the mountainous areas of Central Asia, thus improving irrigation conditions for the summer of 2016 in a number of countries, includ-
ing Afghanistan, Iran, Tajikistan, and Uzbekistan (the world’s fourth largest cotton exporter).
South Asia. So far, growing conditions in South Asia have not been affected by El Niño in a major way. This is significant for India because agricul-ture, which is mainly rain-fed and thus subjected to weather fluctuations, accounts for 17 percent of its GDP.
Southern Africa. Drier than normal conditions are also developing in Southern Africa, but the region is not a key player in any global commodity market.
North America. Warmer than average tempera-tures across Canada and the northern U.S. may hamper grain yields, but wetter-than-average con-ditions across the rest of the U.S. could boost soybean yields.
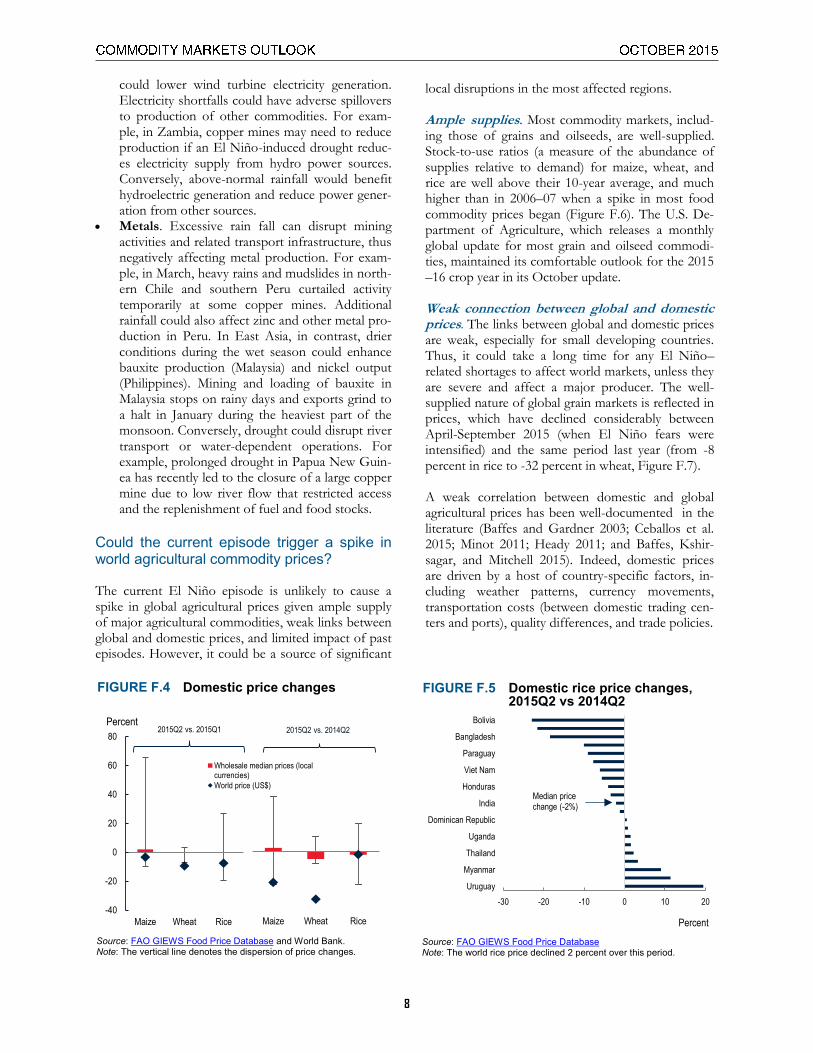
Thus far, both global and domestic prices of key grains have not experienced a major spike, even in countries at risk from El Niño, regardless of the peri-od examined. For example, in a sample of 22 coun-tries, the median price of maize increased only 2.1 percent from the first to the second quarter of 2015; the median prices of wheat and rice changed very little over that period. In global markets, the world price of maize, wheat, and rice declined by 3, 9.5, and 7.5 per-cent over the same period, respectively (Figure F.4, left panel). A comparison of the second quarter of 2015 to the corresponding quarter of 2014, confirms small changes in domestic prices for the same sample of countries as well. (Yet, there was large dispersion of domestic prices across countries, even for countries in the same regions, see Figure F.5).
Impact on industrial commodities Energy. Drought conditions could reduce hydro-
electric power generation, while weaker winds
El Niño’s pattern during June-August
FIGURE F.2
Source: National Oceanic Atmospheric Administration. Note: This map depicts El Niño’s impact at its early stages.
El Niño’s pattern during Decem-ber-February
FIGURE F.3
Source: National Oceanic Atmospheric Administration. Note: This map depicts El Niño’s impact during its peak.
8
could lower wind turbine electricity generation. Electricity shortfalls could have adverse spillovers to production of other commodities. For exam-ple, in Zambia, copper mines may need to reduce production if an El Niño-induced drought reduc-es electricity supply from hydro power sources. Conversely, above-normal rainfall would benefit hydroelectric generation and reduce power gener-ation from other sources.
Metals. Excessive rain fall can disrupt mining activities and related transport infrastructure, thus negatively affecting metal production. For exam-ple, in March, heavy rains and mudslides in north-ern Chile and southern Peru curtailed activity temporarily at some copper mines. Additional rainfall could also affect zinc and other metal pro-duction in Peru. In East Asia, in contrast, drier conditions during the wet season could enhance bauxite production (Malaysia) and nickel output (Philippines). Mining and loading of bauxite in Malaysia stops on rainy days and exports grind to a halt in January during the heaviest part of the monsoon. Conversely, drought could disrupt river transport or water-dependent operations. For example, prolonged drought in Papua New Guin-ea has recently led to the closure of a large copper mine due to low river flow that restricted access and the replenishment of fuel and food stocks.
Could the current episode trigger a spike in world agricultural commodity prices? The current El Niño episode is unlikely to cause a spike in global agricultural prices given ample supply of major agricultural commodities, weak links between global and domestic prices, and limited impact of past episodes. However, it could be a source of significant
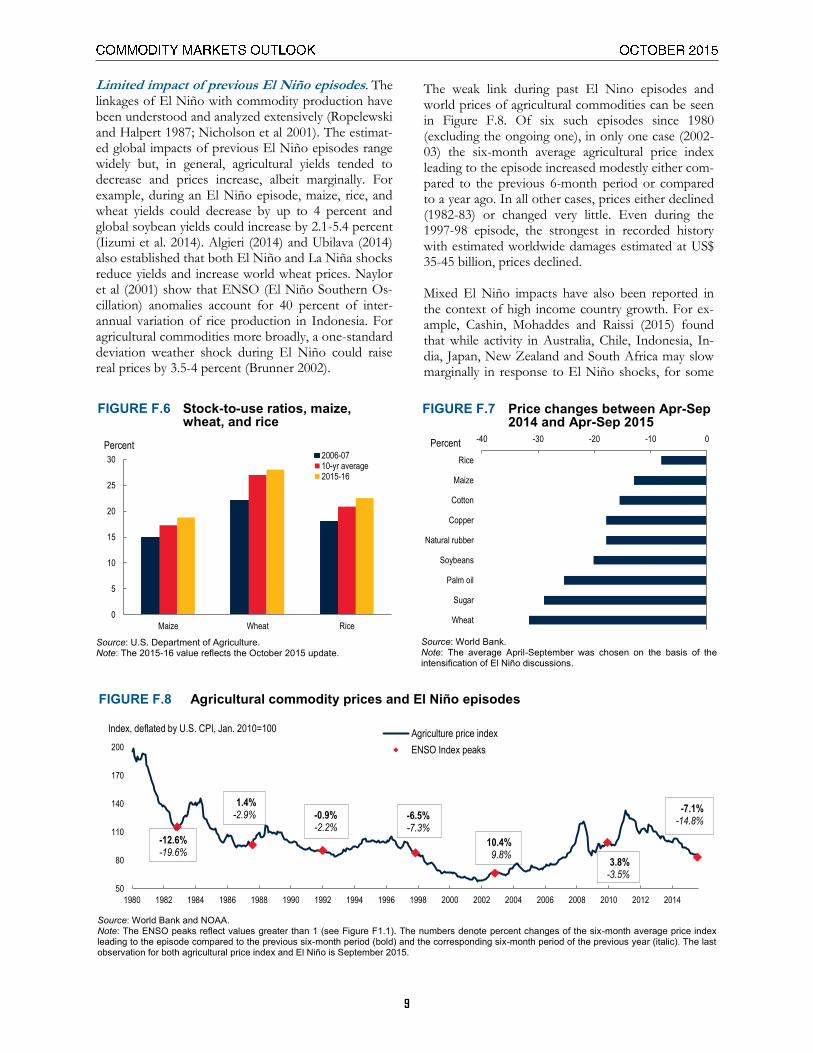
local disruptions in the most affected regions. Ample supplies. Most commodity markets, includ-ing those of grains and oilseeds, are well-supplied. Stock-to-use ratios (a measure of the abundance of supplies relative to demand) for maize, wheat, and rice are well above their 10-year average, and much higher than in 2006–07 when a spike in most food commodity prices began (Figure F.6). The U.S. De-partment of Agriculture, which releases a monthly global update for most grain and oilseed commodi-ties, maintained its comfortable outlook for the 2015–16 crop year in its October update. Weak connection between global and domestic prices. The links between global and domestic prices are weak, especially for small developing countries. Thus, it could take a long time for any El Niño–related shortages to affect world markets, unless they are severe and affect a major producer. The well-supplied nature of global grain markets is reflected in prices, which have declined considerably between April-September 2015 (when El Niño fears were intensified) and the same period last year (from -8 percent in rice to -32 percent in wheat, Figure F.7). A weak correlation between domestic and global agricultural prices has been well-documented in the literature (Baffes and Gardner 2003; Ceballos et al. 2015; Minot 2011; Heady 2011; and Baffes, Kshir-sagar, and Mitchell 2015). Indeed, domestic prices are driven by a host of country-specific factors, in-cluding weather patterns, currency movements, transportation costs (between domestic trading cen-ters and ports), quality differences, and trade policies.
Domestic rice price changes, 2015Q2 vs 2014Q2
FIGURE F.5
Source: FAO GIEWS Food Price Database Note: The world rice price declined 2 percent over this period.
Domestic price changes FIGURE F.4
Source: FAO GIEWS Food Price Database and World Bank. Note: The vertical line denotes the dispersion of price changes.
Maize Wheat Rice
-40
-20
0
20
40
60
80
Wholesale median prices (localcurrencies)
World price (US$)
2015Q2 vs. 2015Q1Percent
Maize Wheat Rice
2015Q2 vs. 2014Q2
-30 -20 -10 0 10 20
Uruguay
Myanmar
Thailand
Uganda
Dominican Republic
India
Honduras
Viet Nam
Paraguay
Bangladesh
Bolivia
Percent
Median price change (-2%)
9
Limited impact of previous El Niño episodes. The linkages of El Niño with commodity production have been understood and analyzed extensively (Ropelewski and Halpert 1987; Nicholson et al 2001). The estimat-ed global impacts of previous El Niño episodes range widely but, in general, agricultural yields tended to decrease and prices increase, albeit marginally. For example, during an El Niño episode, maize, rice, and wheat yields could decrease by up to 4 percent and global soybean yields could increase by 2.1-5.4 percent (Iizumi et al. 2014). Algieri (2014) and Ubilava (2014) also established that both El Niño and La Niña shocks reduce yields and increase world wheat prices. Naylor et al (2001) show that ENSO (El Niño Southern Os-cillation) anomalies account for 40 percent of inter-annual variation of rice production in Indonesia. For agricultural commodities more broadly, a one-standard deviation weather shock during El Niño could raise real prices by 3.5-4 percent (Brunner 2002).
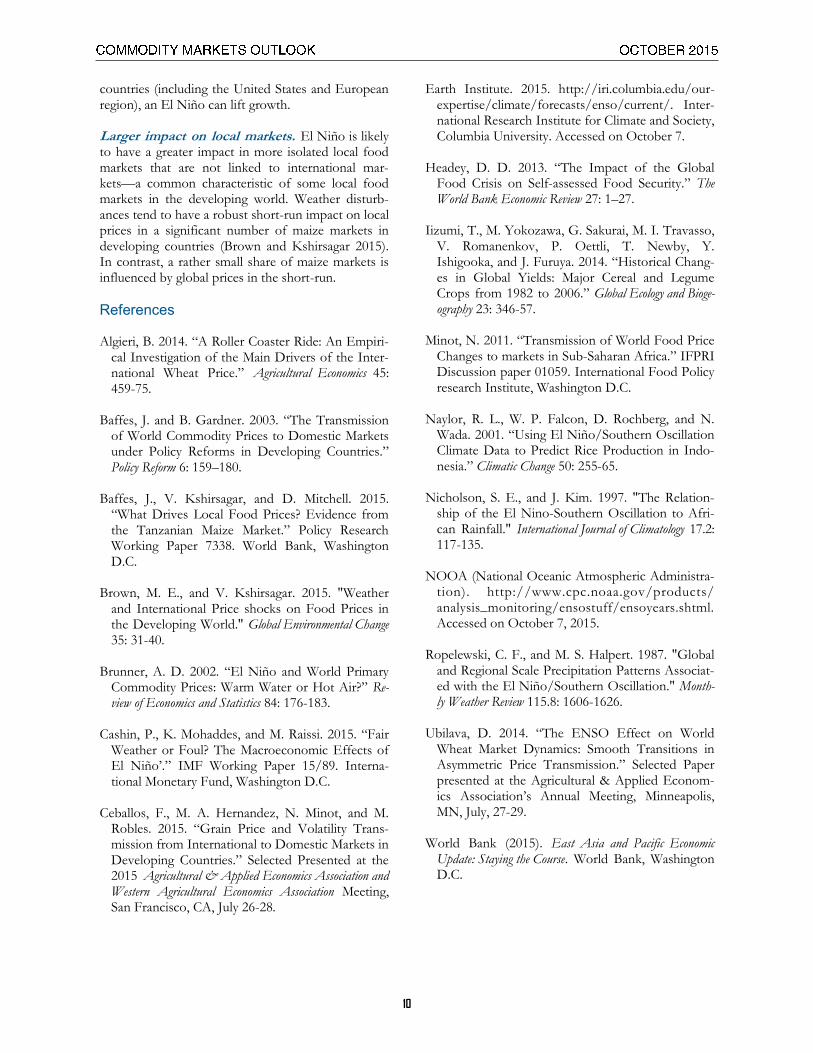
The weak link during past El Nino episodes and world prices of agricultural commodities can be seen in Figure F.8. Of six such episodes since 1980 (excluding the ongoing one), in only one case (2002-03) the six-month average agricultural price index leading to the episode increased modestly either com-pared to the previous 6-month period or compared to a year ago. In all other cases, prices either declined (1982-83) or changed very little. Even during the 1997-98 episode, the strongest in recorded history with estimated worldwide damages estimated at US$ 35-45 billion, prices declined. Mixed El Niño impacts have also been reported in the context of high income country growth. For ex-ample, Cashin, Mohaddes and Raissi (2015) found that while activity in Australia, Chile, Indonesia, In-dia, Japan, New Zealand and South Africa may slow marginally in response to El Niño shocks, for some
Agricultural commodity prices and El Niño episodes FIGURE F.8
Source: World Bank and NOAA. Note: The ENSO peaks reflect values greater than 1 (see Figure F1.1). The numbers denote percent changes of the six-month average price index leading to the episode compared to the previous six-month period (bold) and the corresponding six-month period of the previous year (italic). The last observation for both agricultural price index and El Niño is September 2015.
50
80
110
140
170
200
1980 1982 1984 1986 1988 1990 1992 1994 1996 1998 2000 2002 2004 2006 2008 2010 2012 2014
Agriculture price index
ENSO Index peaks
Index, deflated by U.S. CPI, Jan. 2010=100
-12.6%-19.6%
1.4%-2.9% -0.9%
-2.2%-6.5%-7.3%
10.4%9.8%
3.8%-3.5%
-7.1%-14.8%
Stock-to-use ratios, maize, wheat, and rice
FIGURE F.6
Source: U.S. Department of Agriculture. Note: The 2015-16 value reflects the October 2015 update.
0
5
10
15
20
25
30
Maize Wheat Rice
2006-0710-yr average2015-16
Percent
Price changes between Apr-Sep 2014 and Apr-Sep 2015
FIGURE F.7
Source: World Bank. Note: The average April-September was chosen on the basis of the intensification of El Niño discussions.
-40 -30 -20 -10 0
Wheat
Sugar
Palm oil
Soybeans
Natural rubber
Copper
Cotton
Maize
Rice
Percent
10
countries (including the United States and European region), an El Niño can lift growth. Larger impact on local markets. El Niño is likely to have a greater impact in more isolated local food markets that are not linked to international mar-kets—a common characteristic of some local food markets in the developing world. Weather disturb-ances tend to have a robust short-run impact on local prices in a significant number of maize markets in developing countries (Brown and Kshirsagar 2015). In contrast, a rather small share of maize markets is influenced by global prices in the short-run.
References Algieri, B. 2014. “A Roller Coaster Ride: An Empiri-
cal Investigation of the Main Drivers of the Inter-national Wheat Price.” Agricultural Economics 45: 459-75.
Baffes, J. and B. Gardner. 2003. “The Transmission
of World Commodity Prices to Domestic Markets under Policy Reforms in Developing Countries.” Policy Reform 6: 159–180.
Baffes, J., V. Kshirsagar, and D. Mitchell. 2015.
“What Drives Local Food Prices? Evidence from the Tanzanian Maize Market.” Policy Research Working Paper 7338. World Bank, Washington D.C.
Brown, M. E., and V. Kshirsagar. 2015. "Weather
and International Price shocks on Food Prices in the Developing World." Global Environmental Change 35: 31-40.
Brunner, A. D. 2002. “El Niño and World Primary
Commodity Prices: Warm Water or Hot Air?” Re-view of Economics and Statistics 84: 176-183.
Cashin, P., K. Mohaddes, and M. Raissi. 2015. “Fair
Weather or Foul? The Macroeconomic Effects of El Niño’.” IMF Working Paper 15/89. Interna-tional Monetary Fund, Washington D.C.
Ceballos, F., M. A. Hernandez, N. Minot, and M.
Robles. 2015. “Grain Price and Volatility Trans-mission from International to Domestic Markets in Developing Countries.” Selected Presented at the 2015 Agricultural & Applied Economics Association and Western Agricultural Economics Association Meeting, San Francisco, CA, July 26-28.
Earth Institute. 2015. http://iri.columbia.edu/our-expertise/climate/forecasts/enso/current/. Inter-national Research Institute for Climate and Society, Columbia University. Accessed on October 7.
Headey, D. D. 2013. “The Impact of the Global
Food Crisis on Self-assessed Food Security.” The World Bank Economic Review 27: 1–27.
Iizumi, T., M. Yokozawa, G. Sakurai, M. I. Travasso,
V. Romanenkov, P. Oettli, T. Newby, Y. Ishigooka, and J. Furuya. 2014. “Historical Chang-es in Global Yields: Major Cereal and Legume Crops from 1982 to 2006.” Global Ecology and Bioge-ography 23: 346-57.
Minot, N. 2011. “Transmission of World Food Price
Changes to markets in Sub-Saharan Africa.” IFPRI Discussion paper 01059. International Food Policy research Institute, Washington D.C.
Naylor, R. L., W. P. Falcon, D. Rochberg, and N.
Wada. 2001. “Using El Niño/Southern Oscillation Climate Data to Predict Rice Production in Indo-nesia.” Climatic Change 50: 255-65.
Nicholson, S. E., and J. Kim. 1997. "The Relation-
ship of the El Nino-Southern Oscillation to Afri-can Rainfall." International Journal of Climatology 17.2: 117-135.
NOOA (National Oceanic Atmospheric Administra-
tion). http://www.cpc.noaa.gov/products/analysis_monitoring/ensostuff/ensoyears.shtml. Accessed on October 7, 2015.
Ropelewski, C. F., and M. S. Halpert. 1987. "Global
and Regional Scale Precipitation Patterns Associat-ed with the El Niño/Southern Oscillation." Month-ly Weather Review 115.8: 1606-1626.
Ubilava, D. 2014. “The ENSO Effect on World
Wheat Market Dynamics: Smooth Transitions in Asymmetric Price Transmission.” Selected Paper presented at the Agricultural & Applied Econom-ics Association’s Annual Meeting, Minneapolis, MN, July, 27-29.
World Bank (2015). East Asia and Pacific Economic
Update: Staying the Course. World Bank, Washington D.C.